
Eco-Hydrological Response of Water Conveyance in the Mainstream of the Tarim River, China


1
College of Water Conservancy & Architectural Engineering, Shihezi University, Shihezi 832003, China
2
Xinjiang Institute of Ecology and Geography, Chinese Academy of Sciences, Urumqi 830011, China
3
China Institute of Water Resources and Hydropower Research, Beijing 100044, China
*
Author to whom correspondence should be addressed.
Water 2022, 14(17), 2622; https://doi.org/10.3390/w14172622
Submission received: 22 June 2022
/
Revised: 3 August 2022
/
Accepted: 19 August 2022
/
Published: 25 August 2022
(This article belongs to the Special Issue Advances in Assessing Water Ecosystem Services for Water Resource Management)
Abstract
:Desert riparian vegetation forms an ecological corridor in extremely arid environments, and ecological water conveyance is an important measure of vegetation restoration and biodiversity conservation in desert riparian zones. Studying the responses of vegetation to ecological water conveyance and changes in this process in arid desert riparian zones and assessing the comprehensive benefits of ecological water conveyance are highly significant for ecological conservation and restoration in addition to the formulation of water transfer policies. Previous studies mainly used a single indicator to evaluate the ecological restoration of the mainstream Tarim River in Northwest China; thus, systematic and comprehensive assessments based on multiple indicators have not been conducted. In the present study, remote sensing data and field surveys were used to analyze the ecological restoration status of the Tarim River during 2015–2021 in terms of hydrological responses, vegetation responses, and ecological water conveyance benefits. The results showed that groundwater levels and soil moisture in the mainstream area of the Tarim River increased significantly from 2015 to 2021. The amount of groundwater storage also increased. Ecological water conveyance has created good hydrological conditions for groundwater recharge and ecological restoration on both sides of the mainstream area of the Tarim River. Desert forest ecosystems, mainly comprising Populus euphratica and Tamarix ramosissima, have been saved and rejuvenated in water conveyance areas. After ecological water conveyance, the Simpson and Shannon–Wiener indices increased significantly, but the diversity level began to decline and then stabilize with the increase in water conveyance frequency. The overall habitat status improved and the quality of the ecological environment below the Wusiman section of the middle reaches of the Tarim River improved significantly.
1. Introduction
Drought has become one of the most severe natural disasters under global warming. Extreme drought has huge and even irreversible impacts on the structure and function of ecosystems, and the frequency or intensity of extreme drought events may increase in the future in some regions of the world [1,2,3,4]. Due to the combined effects of human activities and climatic factors, the maintenance and restoration of desert riparian vegetation in arid areas has become highly challenging. In particular, Lop Nur in northwestern China, the Aral Sea in Central Asia, and Urmia Lake in Iran have shrunk or even dried up. Ecological water transfer is an important measure for preventing the degradation of natural vegetation and ecological restoration [5,6,7,8]. Developing suitable methods for scientifically evaluating the degree of ecological environment restoration and the comprehensive benefits of ecological water transfer is the focus of many ecologists, hydrologists, and geologists around the world [9,10].
In 2001, the Chinese government invested CNY 10.7 billion to implement a comprehensive management system for the Tarim River basin to fundamentally restore the ecosystem. Many studies have aimed to understand the ecological changes in desert riparian vegetation in the context of artificial ecological water conveyance in this river basin system. The climate in the Tarim River basin is hot and dry, with scarce precipitation. The groundwater level is the key factor that limits the growth of vegetation in the Tarim River basin. The suitable groundwater depth in different regions for plants varies significantly due to factors such as the climate, topography, soil, and vegetation conditions [11,12]. Ecological water conveyance projects can provide suitable groundwater depths for different plants, and they are important for maintaining ecosystem stability and biodiversity [13,14]. Ecological water conveyance is applied using traditional flooding irrigation. Compared with drip irrigation and sprinkler irrigation, ecological water conveyance is advantageous for greatly replenishing the groundwater and reducing soil salinization [15,16,17]. Ecological water conveyance has been applied 22 times to enhance the degree of ecological environment restoration and the comprehensive benefits of ecological water conveyance in Tarim River. Studies have investigated the relationships between vegetation restoration and ecological water conveyance in terms of temporal changes in the vegetation area, growth, and vegetation coverage before and after ecological water conveyance application, as well as by studying the radial growth of Populus euphratica tree trunks and changes in aboveground biomass and carbon storage [18,19,20]. Relationships between vegetation restoration and groundwater have also been investigated in terms of temporal and spatial changes in groundwater depth, horizontal and vertical groundwater changes, and the dynamic responses of vegetation to the groundwater levels in arid desert regions [21,22].
Previous studies have determined the extent of ecological environment restoration and the comprehensive benefits of ecological water conveyance based on the physiological growth of Populus euphratica, remote sensing of vegetation, and groundwater monitoring, which are of great scientific significance. However, the ecological status of the Tarim River was mainly evaluated using a single indicator; thus, systematic and comprehensive evaluations of the Tarim River have not been conducted based on multiple indicators. Therefore, in the present study, we used remote sensing and field survey data to construct a multi-index system for evaluating the effects of ecological water conveyance on the mainstream of the Tarim River. We analyzed spatiotemporal changes in the ecological environment in the mainstream of the Tarim River from 2015 to 2021 in terms hydrological responses [23,24], vegetation responses [25,26], and ecological water conveyance benefits [27,28]. The results obtained in this study may facilitate decision making regarding ecological conservation and the sustainable development of this inland river basin in an arid area.
2. Overview and Research Methods
2.1. Overview of the Study Area
The Tarim River is the longest inland river in China with a total length of 1321 km. The Tarim River basin is formed of rivers such as the Aksu River, Hotan River, and Yarkand River, where it starts at Xiaojiake and finally flows into Taitema Lake (Figure 1). The study area has a hot, dry climate, and water resources are scarce. The climate is classified as warm temperate extreme arid. The annual average precipitation is less than 50 mm and the annual average evaporation is more than 2500 mm. The Tarim River basin is one of the most fragile regions in China and even the world [29,30]. The mainstream of the Tarim River is divided into three sections comprising the upper reaches from Xiaojiake to Yingbaza, the middle reaches from Yingbaza to Qiala, and the lower reaches from Qiala to Taitema Lake. Arbor–shrub–grass vegetation belts mainly comprising Populus euphratica, Tamarix ramosissima, Lycium ruthenicum, Phragmites communis, and Apocynum venetum are present on both sides of the river. Since the 1960s, due to the large-scale development and utilization of water and soil resources in the Tarim River basin, the inflow of mainstream water decreased sharply, and the groundwater level dropped. The structure of the desert forest ecosystem with Populus euphratica as the main component species changed with severe damage. In particular, after the completion of the Daxihaizi Reservoir in 1972, the water from the middle and upper reaches was fully intercepted, thereby resulting in the complete closure of the lower reaches of the Tarim River and the drying up of the Taitema Lake. Large areas of natural vegetation have been degraded and groundwater levels decreased; thus, the ecological environment has been severely damaged. In order to save the ecosystem in the lower reaches from the verge of collapse, the Tarim River Basin Administration was established in 1990 to implement ecological protection and improve the ecological water supply to the Tarim River. In 2001, the Chinese government invested CNY 10.7 billion to implement the comprehensive management of the Tarim River basin with the fundamental aim of restoring downstream ecosystems. In order to further enhance ecological water use in the Tarim River, the four streams were assigned to the Tarim River Basin Authority for unified management in 2011, and water resource management increasingly enhanced. In order to further improve the effectiveness of the comprehensive management system, the autonomous regional government launched a special action for the ecological protection of the Populus euphratica forest in the Tarim River basin in 2016 by focusing on work for “returning land, increasing water, management and protection, and the rule of law,” and by comprehensively implementing ecological restoration measures in multiple Populus euphratica forest areas with “four sources and one stem” [31].
The lower reaches of the Tarim River have undergone ecological water conveyance application measures 22 times with a cumulative ecological water conveyance of 8.793 billion m3 and average annual water conveyance of 400 million m3. The degradation of the ecological environment in the Tarim River basin has been effectively halted. The groundwater level of the basin has risen significantly and the water flow has reached Taitema Lake. The long-term disconnection of the downstream river improved, and the green vegetation in the riparian zone is characterized by positive physiological and ecological responses (Figure 1a,b). Therefore, the Tarim River is no longer the most severe area for ecological environmental damage caused by artificial interference, and it is also considered the most successful example of the effects of human intervention on promoting ecological restoration.
2.2. Research Program
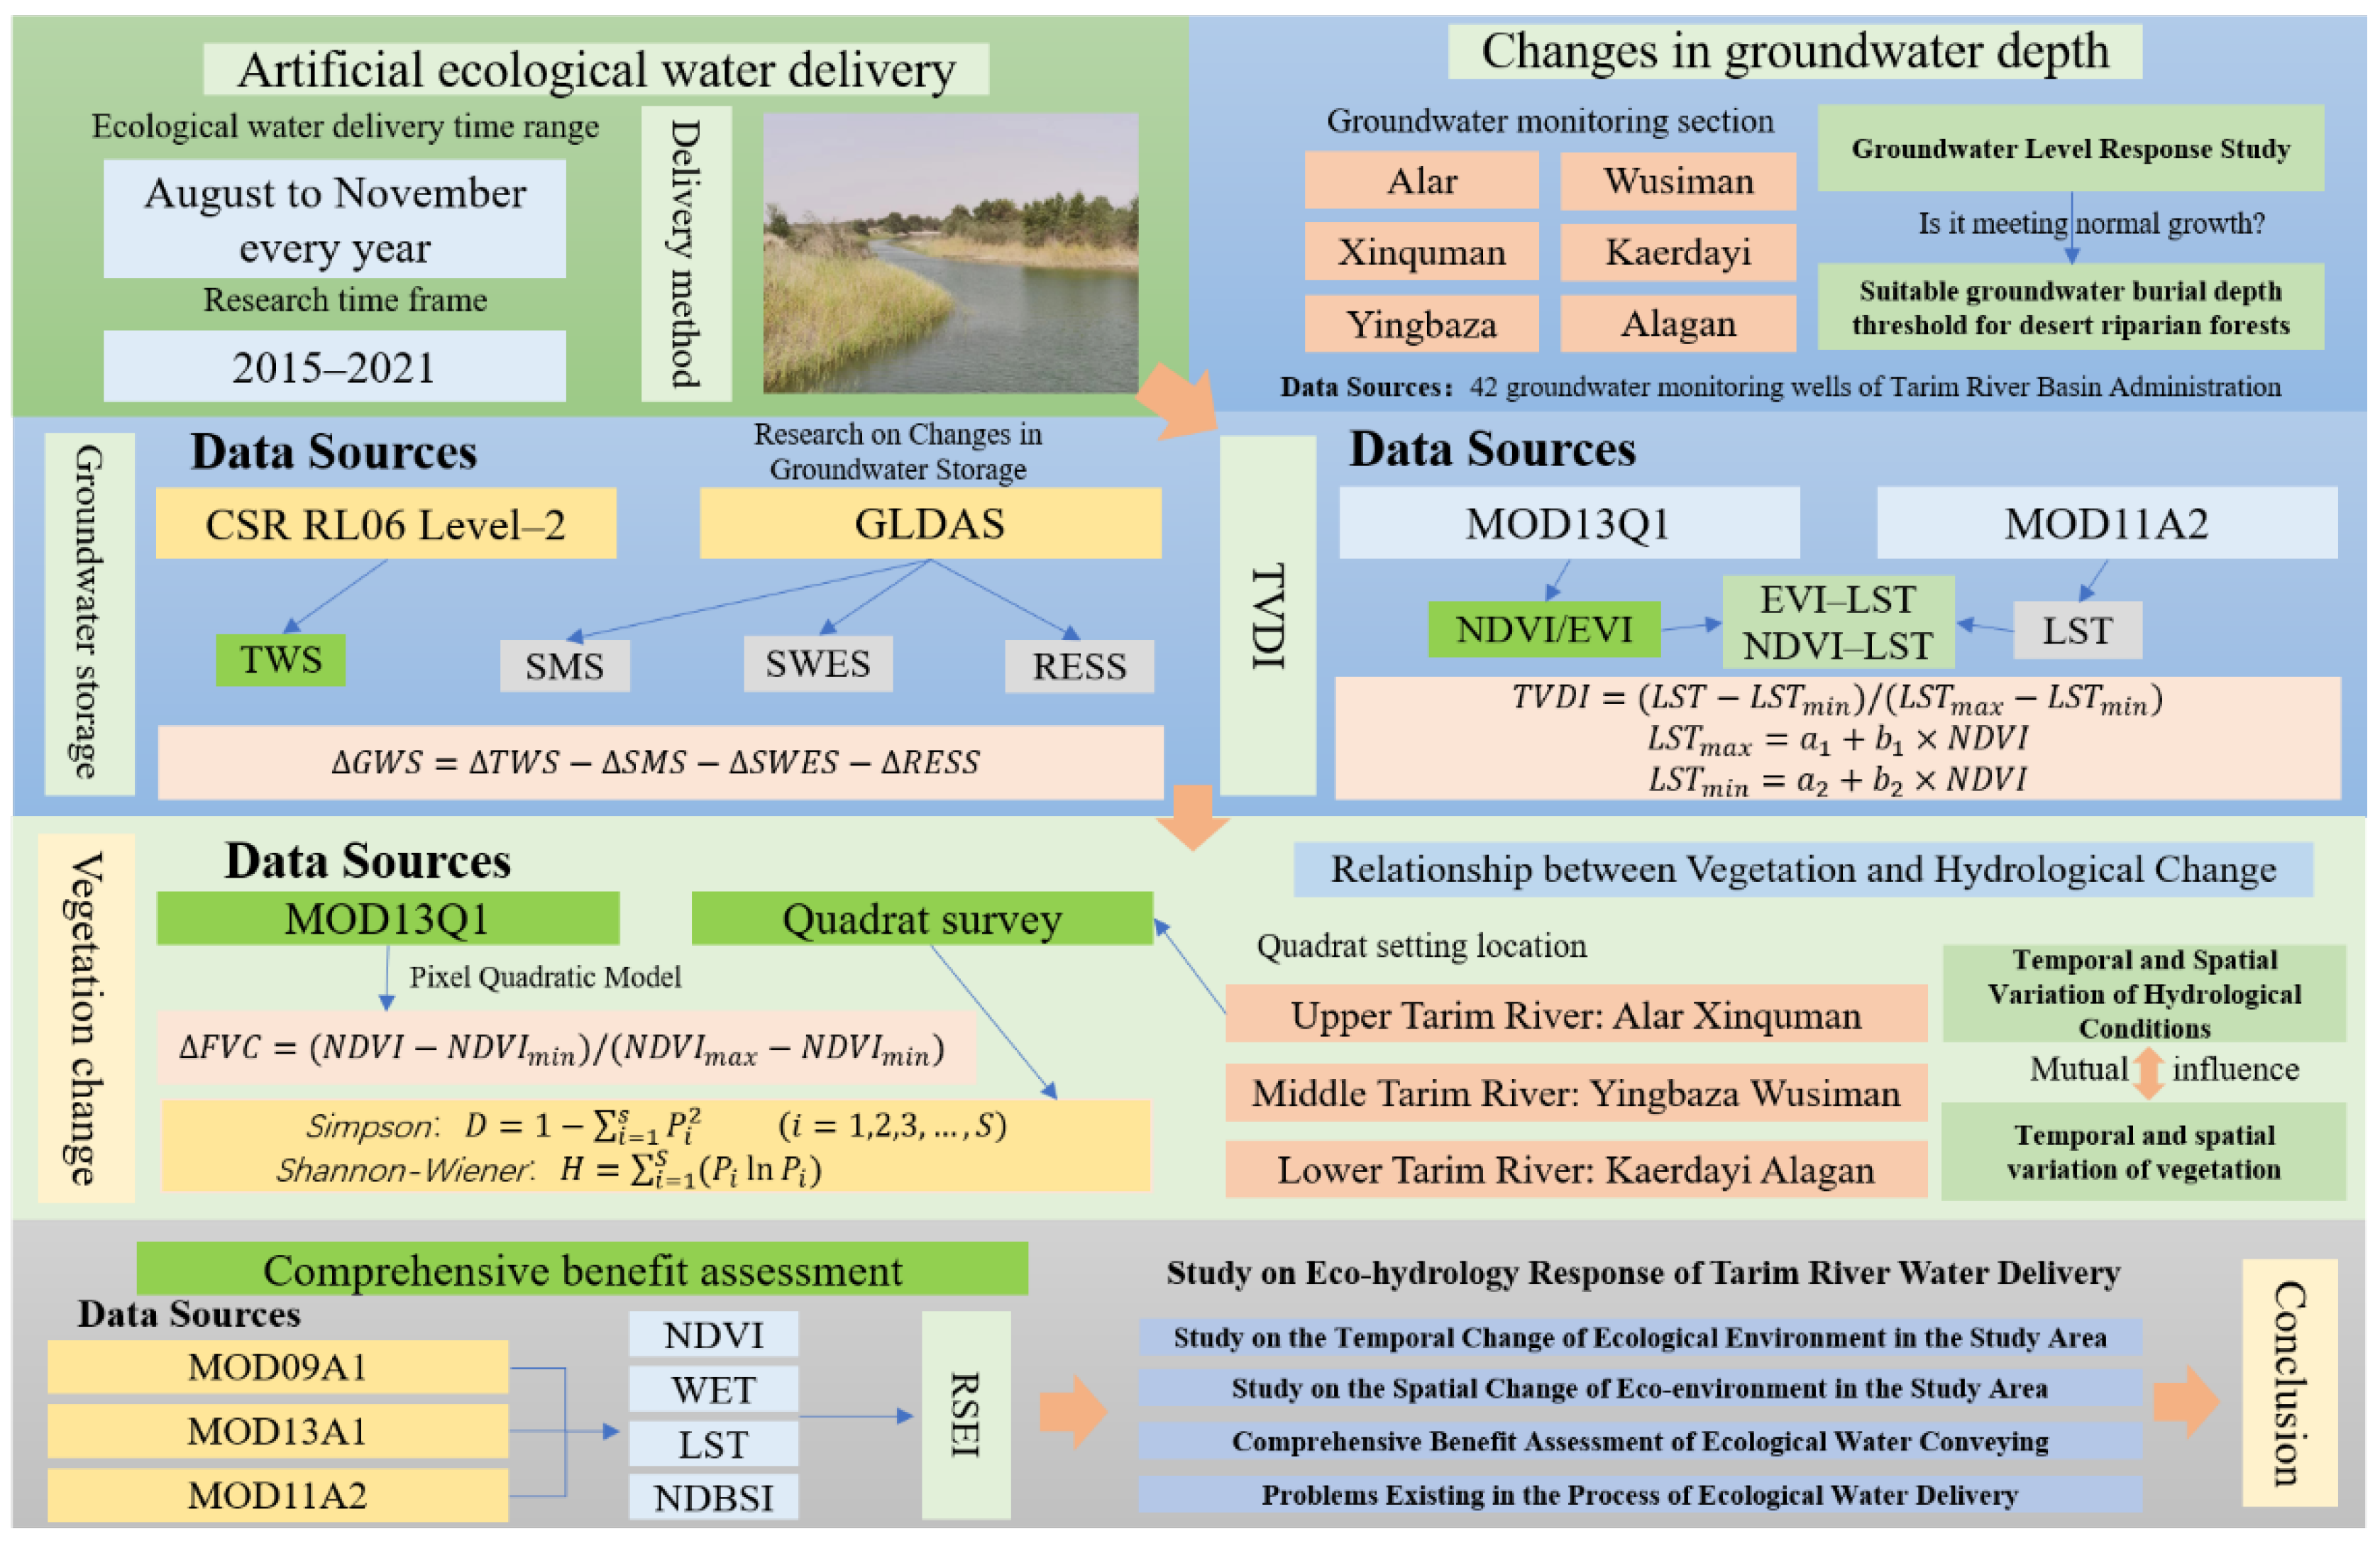
Remote sensing and field surveys were used to analyze the temporal and spatial variations in the Tarim River from 2015 to 2021 in terms of the hydrological response, vegetation response, and ecological water conveyance benefits (Figure 2).
The hydrological status was assessed after ecological water conveyance by quantifying changes in groundwater storage, temperature vegetation dryness index (TVDI), and groundwater depth in the mainstream of the Tarim River basin. Vegetation restoration was evaluated by comparing changes in vegetation coverage and species diversity in the Tarim River basin after ecological water conveyance. Finally, from a regional perspective, a remote sensing-based ecological index (RSEI) model was constructed for the mainstream area of the Tarim River basin from 2015 to 2021 in order to comprehensively evaluate the effects of ecological water conveyance on the mainstream of the Tarim River and to monitor changes in the quality of the ecological environment in the ecological water conveyance area.
2.3. Data Sources
Table 1 shows the data sets used in our study. The Gravity Recovery and Climate Experiment (GRACE) Mascon data released by the Center for Space Research and the Global Land Data Assimilation System (GLDAS) of NASA’s Gotha Space Flight Center were used to produce the monthly groundwater storage data set.
Images of the normalized difference vegetation index (NDVI) were used to calculate the fractional vegetation coverage (FVC) and TVDI. Over 100 vegetation indices are currently available, where the NDVI, ratio vegetation index (RVI), enhanced vegetation index (EVI), and soil adjusted vegetation index (SAVI) are most widely used. Each vegetation index has strengths and weaknesses, and the RVI does not perform well when FVC <50% [32]; thus, the RVI is not suitable for quantifying the vegetation in desert ecosystems. The NDVI is disadvantageous because it saturates when measuring dense vegetation. The SAVI and EVI are both modified forms of the NDVI with adjustments based on the effects of soil brightness in the background, with improved sensitivity relative to dense vegetation [33,34]. However, despite the adjustments and improvements of the SAVI and EVI, the NDVI is still the most widely used index, and it is also generally agreed that NDVI is sensitive in low to moderately dense vegetation areas, such as arid and semi-arid areas [35,36,37]. In addition, high-quality NDVI time series are readily available in the MODIS NDVI, SPOT NDVI, and GIMMS NDVI data sets. Thus, the NDVI was selected for use in the present study. Savitzky–Golay filtering was performed for 16-day composited time series of NDVI images derived from the MODIS MOD13Q1 product to smooth out the noise caused by poor atmospheric conditions [38]. Maximum-value composite images [39] were used to obtain the yearly NDVI, thereby further improving the quality of the NDVI images by reducing the noise due to poor atmospheric conditions [40].
The TVDI was calculated using 16-day composited land surface temperature (LST) images in the daytime and the NDVI images. The LST image time series were derived from the MODIS MOD11A2 product. LST images were averaged to obtain yearly LST images.
The groundwater depth data were provided by the Tarim River Basin Administration Bureau. The data set was assembled from six typical monitoring sections along the main stream of the Tarim River, i.e., Alar, Xinquman, Yingbaza, Wusiman, Kardayi, and Alagan (Figure 1).
Quadrat sampling was used to collect data for the number of vegetation species and plants. Sampling was conducted each year during 2015–2021 at the six typical monitoring sections mentioned above, with three quadrats measuring 25 m × 25 m in each of the monitoring transects.
2.4. Calculation Methods
2.4.1. Method for Calculating the Hydrological Response
The changes in the water storage extracted from GRACE represented the overall variations in water storage comprising changes in total terrestrial water storage [41], including the soil moisture storage (SMS), snow water equivalent storage (SWES), surface water reservoir storage (RESS), and groundwater storage [42]. The SMS, SWES, and RESS must be subtracted in order to obtain the groundwater storage (Formula (1)). The Daxihaizi Reservoir is the only reservoir located in the study area; thus, most of the inflow in the upper and middle reaches was discharged to restore the ecological environment in the lower reaches of the Tarim River. Thus, the Daxihaizi Reservoir was empty all year round with little water storage, and its effects on the changes in land surface water treatment were ignored. The SMS and SWES data used in this study were derived from GLDAS [43], including the SWES during 2015–2021 and moisture in four soil layers (0–10 cm, 10–40 cm, 40–100 cm, and 100–200 cm) with a spatial resolution of 0.25° and monthly temporal resolution. The growth season data were obtained based on the average value.
The TVDI was used to characterize the soil moisture, and it was calculated based on the NDVI and LST with the following Formula:
where LST is the surface temperature of any pixel, LSTmin is the minimum surface temperature corresponding to a certain NDVI value, which is called the wet edge, LSTmax is the maximum surface temperature corresponding to a certain NDVI value, which is called the dry edge, and a1, a2, b1, and b2 are the coefficients in the dry–wet boundary equation. The value of TVDI ranges among (0, 1). A pixel is more arid when the value is closer to 1 and more humid when the value is closer to 0. According to previous drought monitoring studies conducted in Tarim River basin [44,45], the TVDI values were classified as follows: TVDI < 0.6 representing light drought, 0.6 < TVDI < 0.75 for medium drought, 0.75 < TVDI < 0.9 for severe drought, and TVDI > 0.9 for severe drought.
2.4.2. Method for Calculating the Vegetation Response
The vegetation coverage (FVC) is an important indicator for measuring the surface vegetation coverage in a region, and it has a strong positive correlation with NDVI. Based on the pixel dichotomy model and NDVI data, the vegetation coverage was calculated using the inversion model with the following Formula:
where FVC is the vegetation coverage, and NDVImin and NDVImax are the minimum and maximum NDVI values of all pixels in the area, respectively. NDVImin and NDVImax were optimized with 5–95% as the confidence interval for the NDVI values. According to the vegetation distribution characteristics, the vegetation coverage values were classified as follows: FVC <5% for extremely low vegetation coverage, 5% < FVC < 10% for low vegetation coverage, 10% < FVC < 20% for medium vegetation coverage, and FVC > 20% for high vegetation coverage.
In order to analyze the changes in the diversity indices for riparian vegetation in the mainstream of the Tarim River basin after ecological water conveyance, the Simpson and Shannon–Wiener indices were calculated for vegetation in the samples as follows:
where Pi is the frequency of occurrence for the i-th species, Pi = Ni/N, N is the total number of individuals in the quadrat, and Ni is the number of individuals for the i-th species.
2.4.3. Comprehensive Benefit Evaluation
The Google Earth Engine platform can rapidly screen out images with the best quality by directly accessing the data set and using the cloud mask algorithm, thereby avoiding the inefficiency of local download, storage, and preprocessing. In this study, based on the Google Earth Engine platform, MOD09A1, MOD13A1, and MOD11A2 data were used to calculate the humidity, greenness, dryness, and heat indices for each year. Principal component analysis was then conducted to construct the remote sensing ecological index. It should be noted that each index has different units and numerical ranges; thus, the four indices were normalized with the following Formula [46,47]:
where is the index normalization result, is the i-th pixel value, is the minimum value, and is the maximum value.
Principal component analysis was performed with ENVI software, where the four normalized index bands were combined into new images to obtain relevant statistical results. After positive and negative values for principal component 1 (PC1) were transferred and normalized, the RSEI was obtained as follows:
where RSEI is the remote sensing ecological index value, and the ecological quality is better when the value is closer to 1, and and denote the minimum and maximum values, respectively. According to the ecological environment quality status in the study area and the ecological environment classification standard in “Technical Criterion for Ecosystem Status Evaluation” (HJ192-2015), the RSEI indices were classified into four habitat conditions as follows: RSEI <0.2 for poor, 0.2 < RSEI < 0.4 for moderate, 0.4 < RSEI < 0.6 for good, and RSEI >0.6 for excellent.
3. Results
3.1. Hydrological Responses
3.1.1. Analysis of Temporal and Spatial Variations in Groundwater Storage
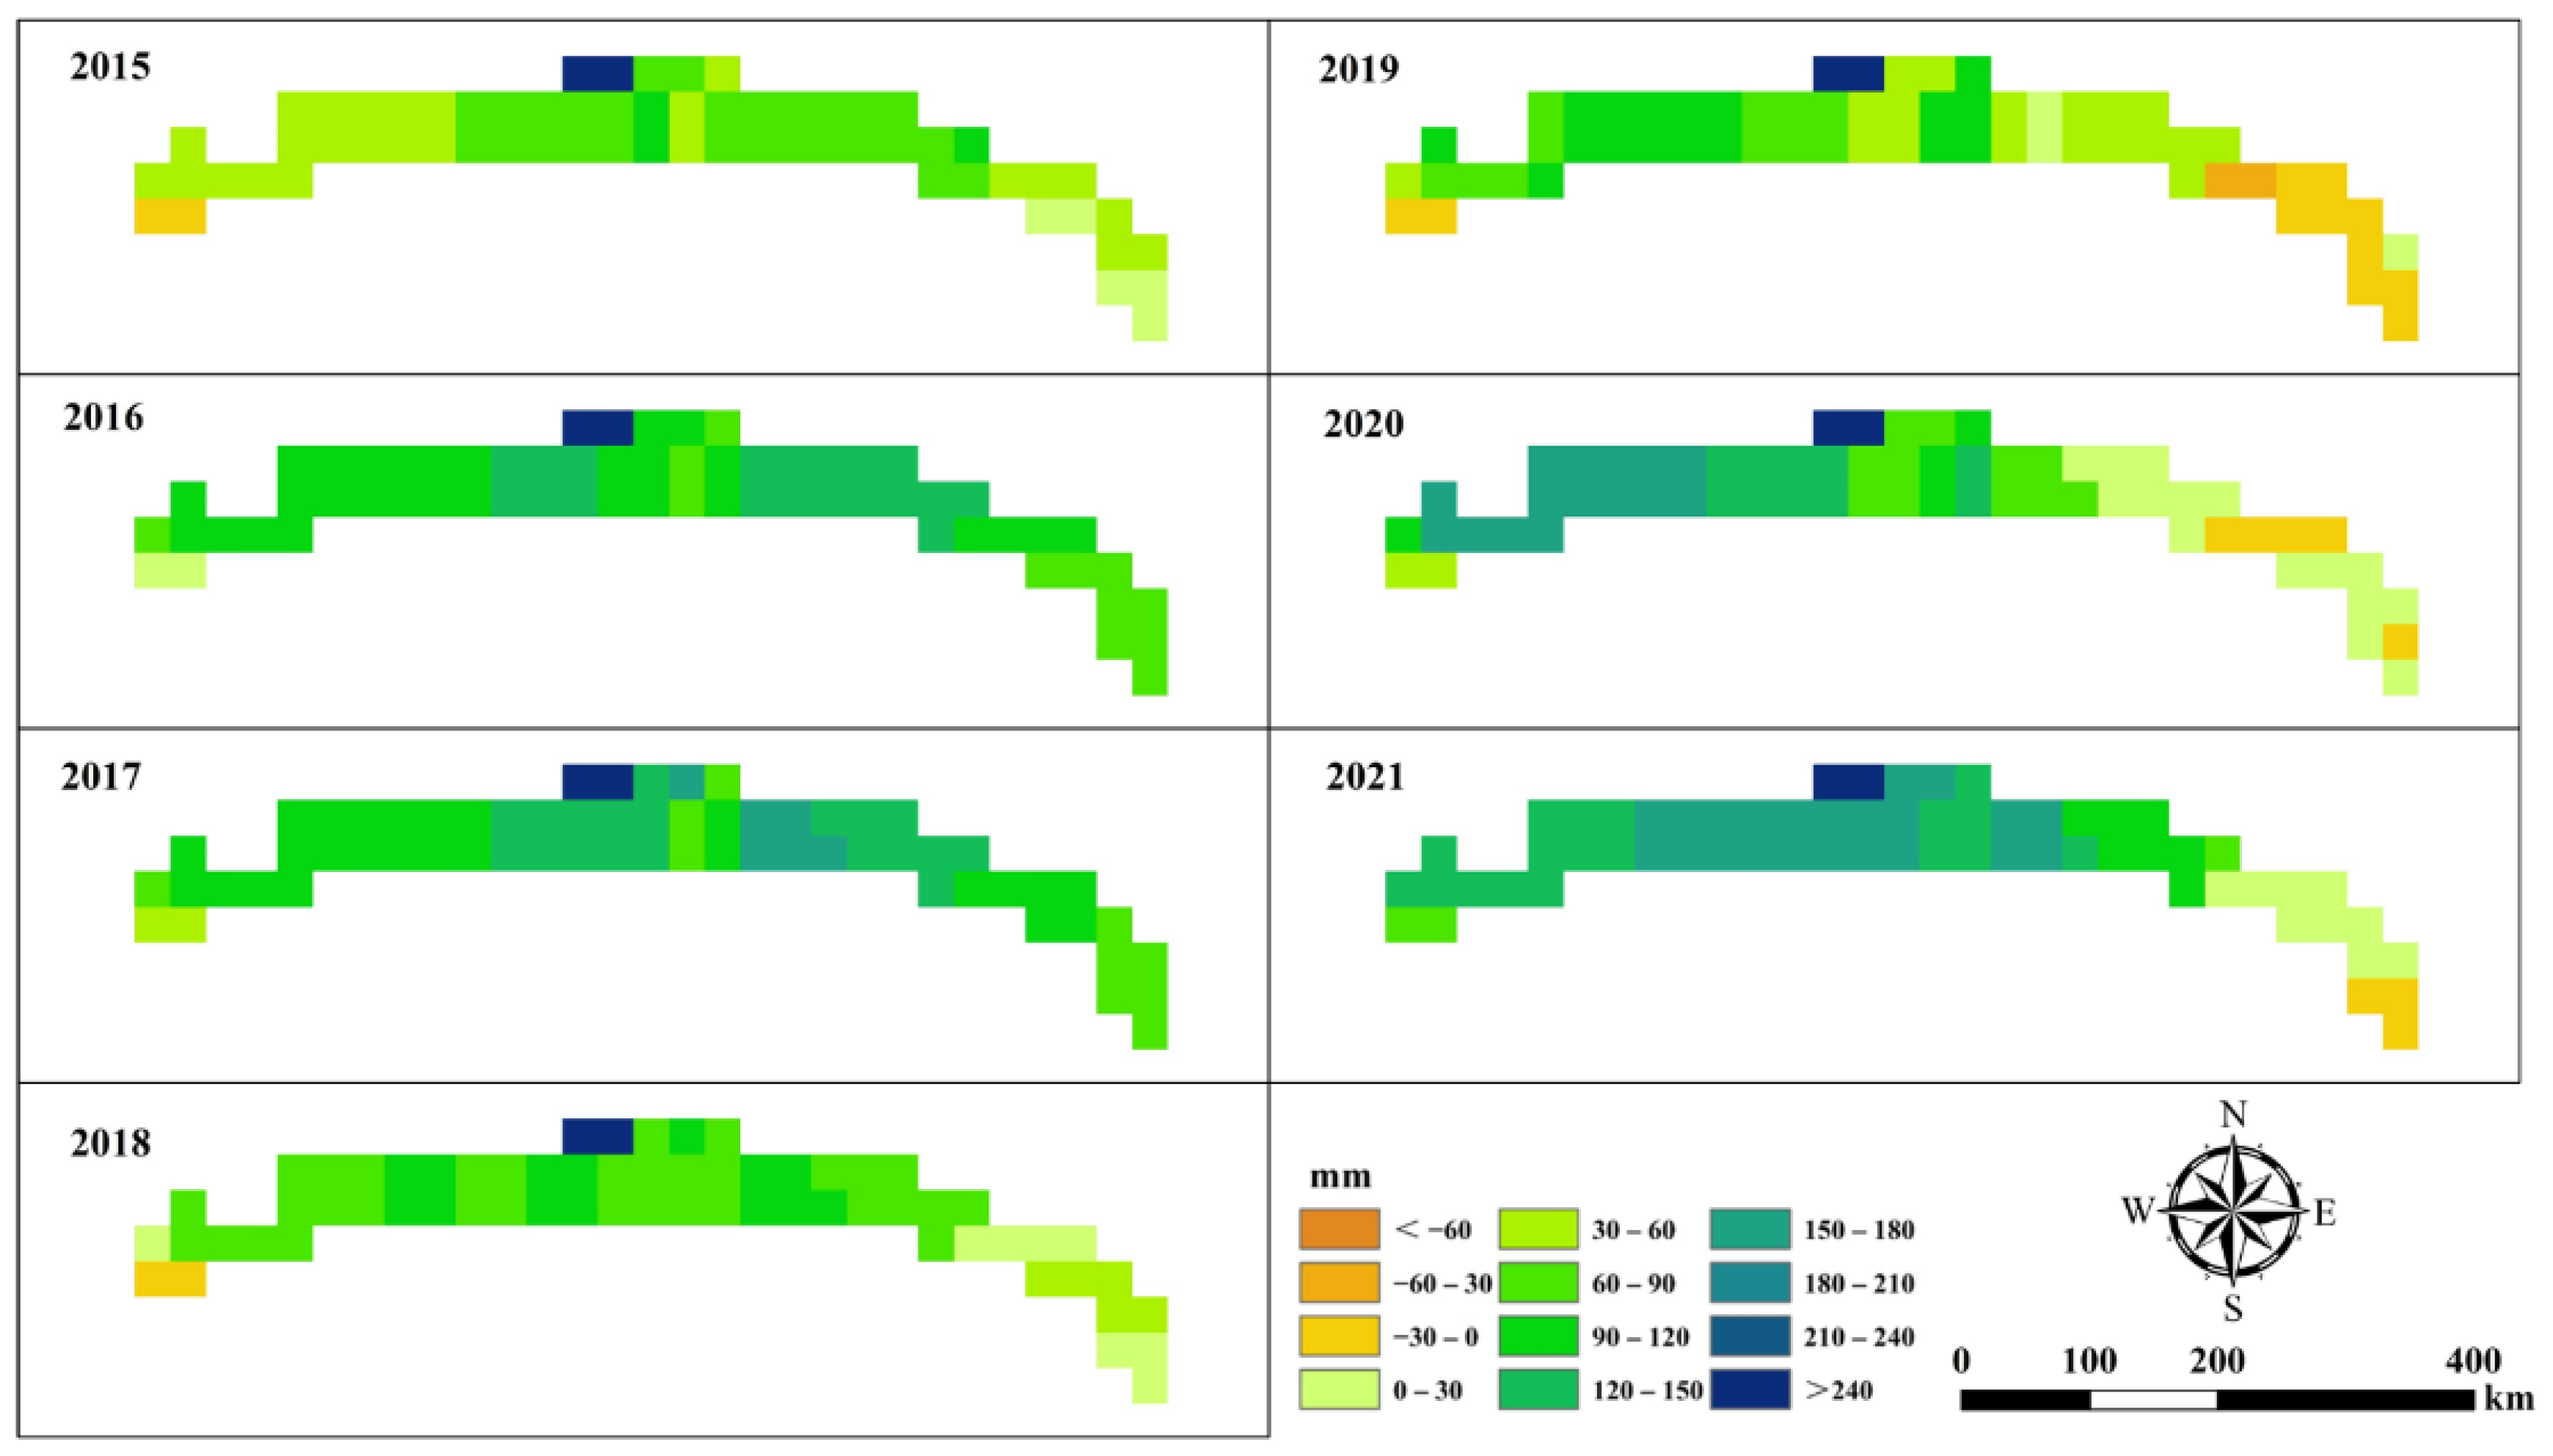
The equivalent water column height was converted based on the average value in January 2004 to December 2009; i.e., the change in groundwater storage was converted into the height of the water column in the hypothetical plane (Table 2). Analyses of the change in the groundwater storage in 2021 showed that the average groundwater volume in the mainstream of the Tarim River increased by 123.1 mm, where the change in the middle reaches was between 90 mm and 210 mm, and the highest increase was more than 240 mm mainly near the Populus euphratica Forest Park in Luntai (Figure 3). The average groundwater storage in the lower reaches of the Tarim River varied from 0 mm to 30 mm, and the average groundwater storage in the upper reaches varied from 60 mm to 150 mm; these values were lower than those in the middle reaches of the Tarim River. In general, the groundwater storage in the mainstream of the Tarim River increased after ecological water conveyance and the change in groundwater storage was the largest in the middle reaches.
Analyses of the changes in the annual groundwater storage from 2015 to 2021 showed that the annual groundwater storage in the mainstream of the Tarim River increased initially, before then decreasing and increasing. The groundwater storage tended to increase by 26.89 mm/year from 2015 to 2017, whereas it decreased by 29.98 mm/year from 2017 to 2019. The groundwater storage increased by 33.01 mm/year from 2019 to 2021. The groundwater storage increased by more than 90 mm in the mainstream of the Tarim River during 2015 to 2021, with an increase of only 4.7% in 2015 but 73.4% in 2021, and the highest increase of 78.2% occurred in 2017. The increases were mainly concentrated in the middle reaches of the mainstream area of the Tarim River. In general, annual variations in the groundwater storage fluctuated, in which the change in the groundwater volume was the largest in the middle reaches with an increase of more than 90 mm.
3.1.2. Spatial and Temporal Variations in TVDI
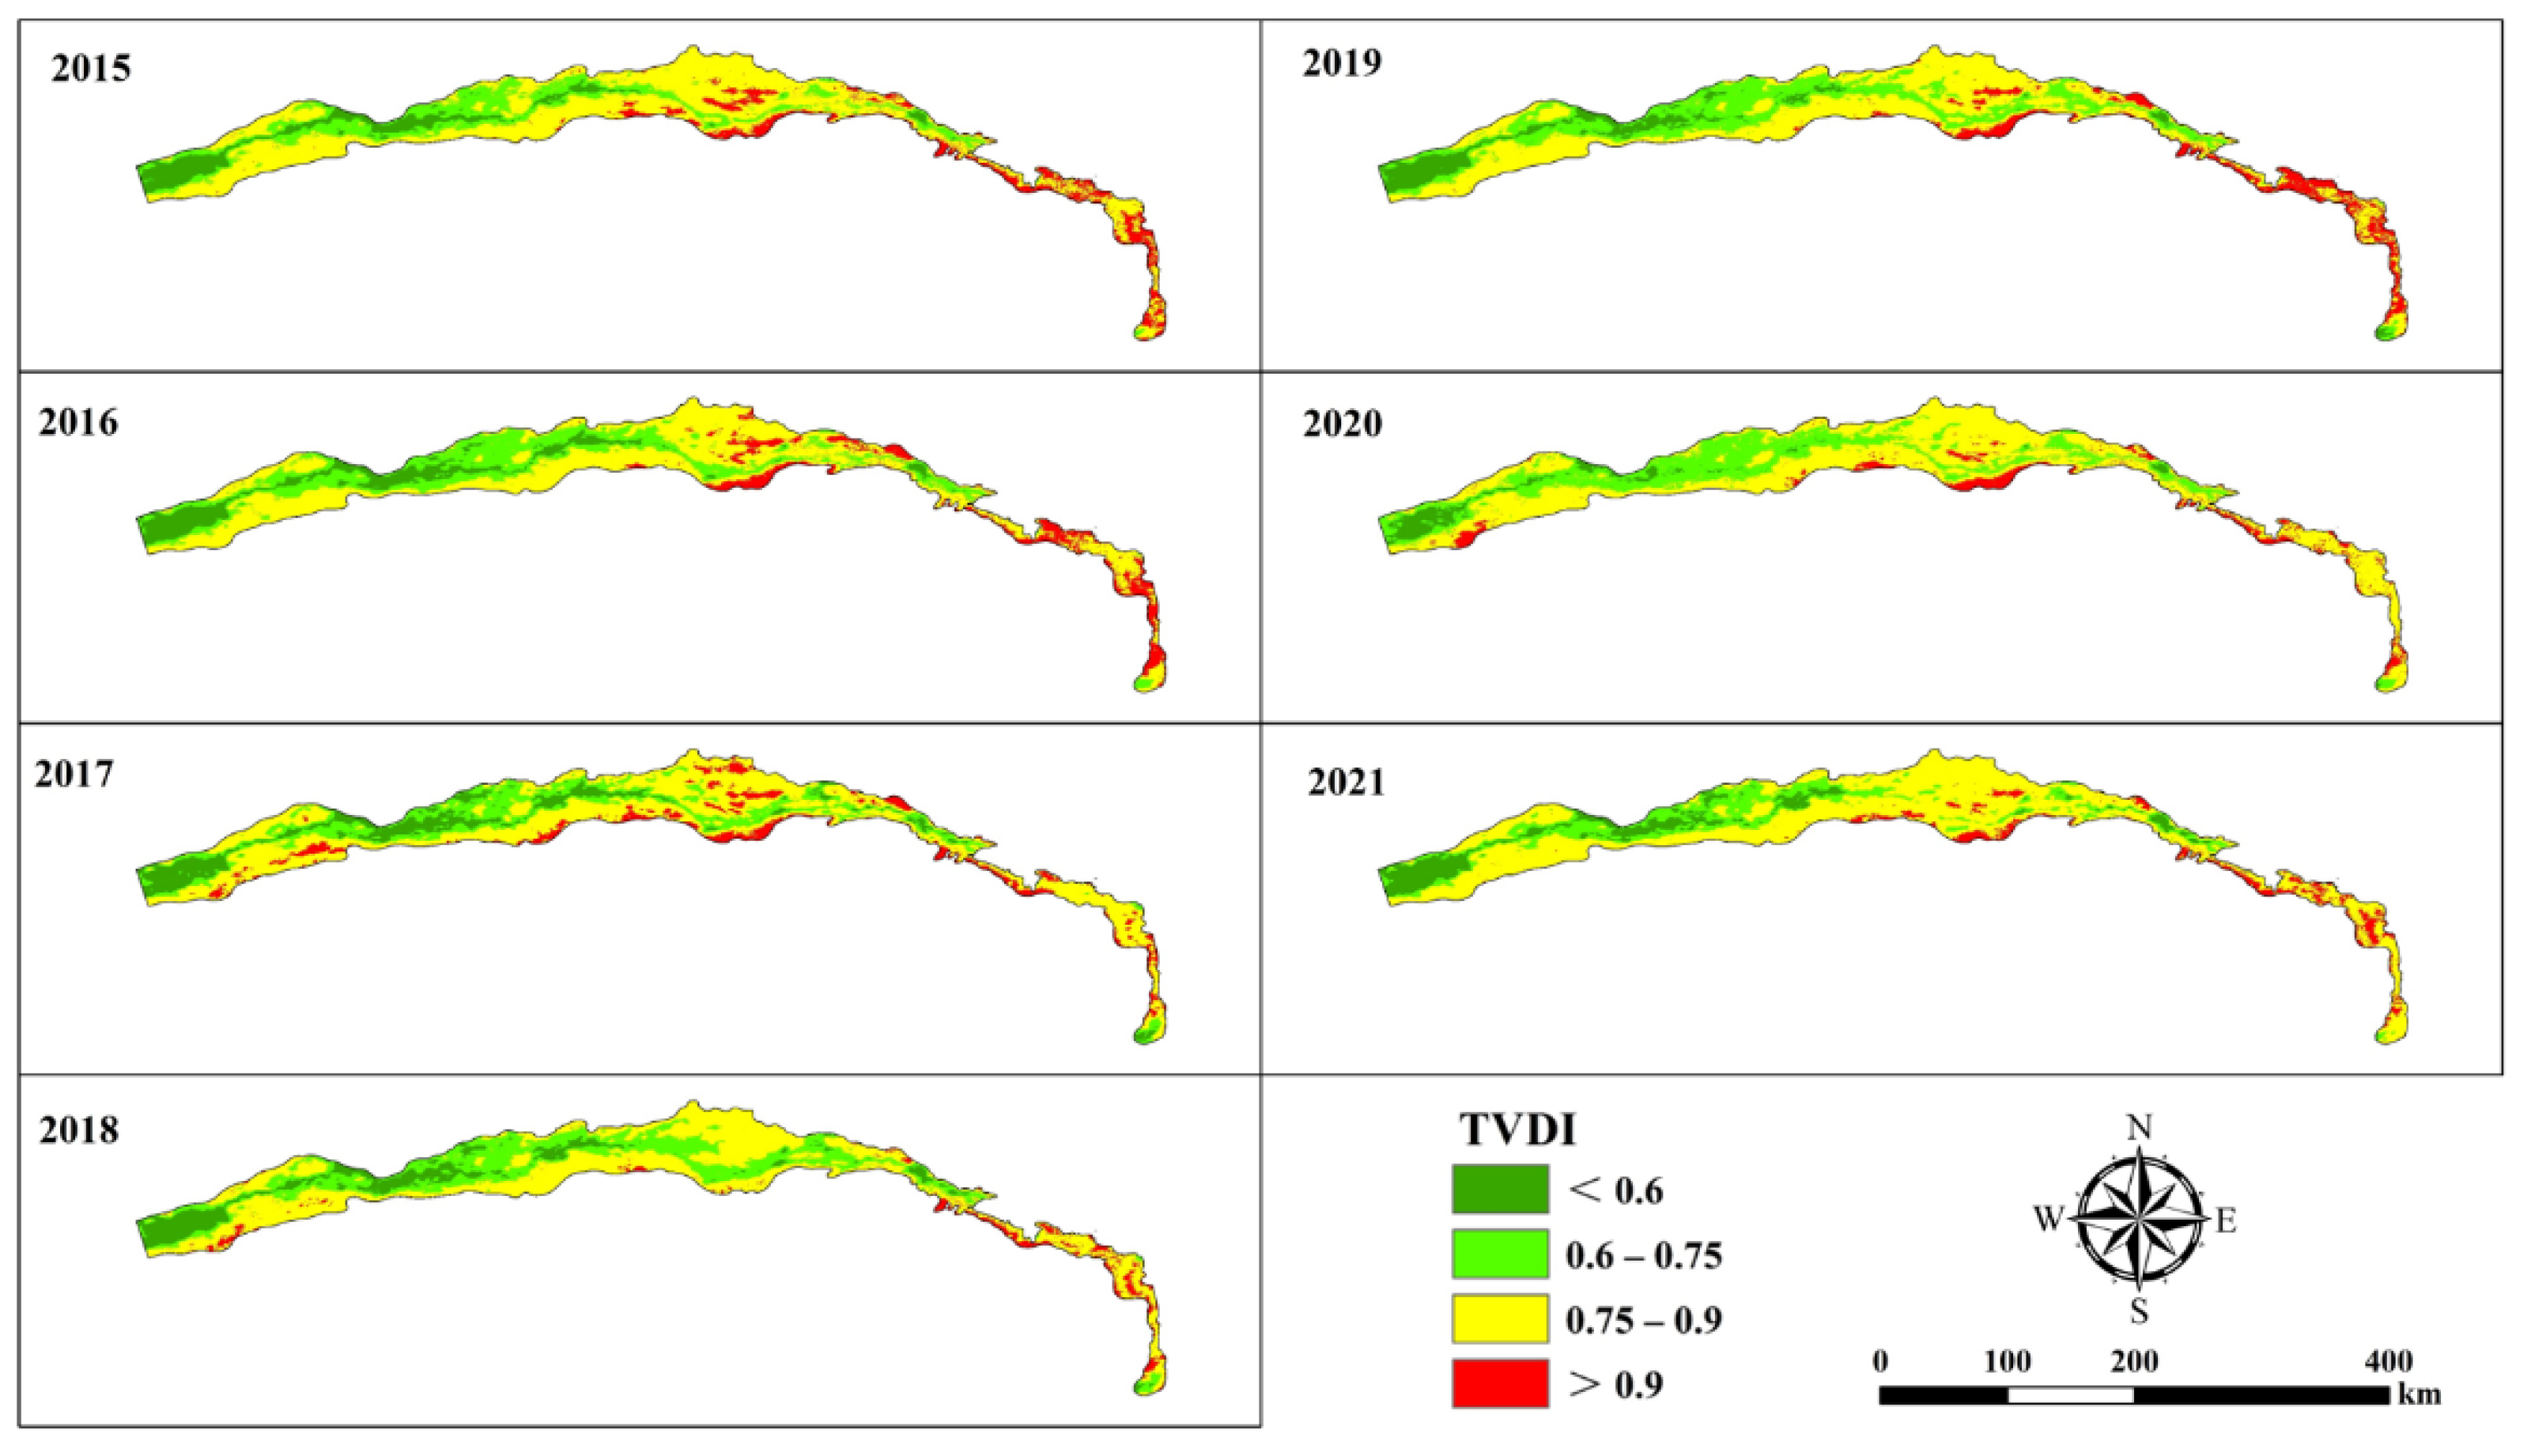
The spatial distribution of the TVDI in 2021 was used to analyze the drought status (Table 2). In 2021, the average TVDI in the study area was 0.78, which was at a severe drought level. Light drought (TVDI <0.6) was present in 11.0% of the study area and mainly in the upper reaches of the Tarim River from Alar to Xinquman. Moderate drought (0.6 < TVDI < 0.75) was present in 22.3% of the area and mainly in the upstream reaches of the Tarim River from Xinquman to Yingbaza. Severe drought (0.75 < TVDI < 0.9) was present in 54.9% of the study area and mainly in the middle reaches of the Tarim River from Shajilik to Qiala. Extreme drought (TVDI >0.9) was present in 11.0% of the area and mainly in the lower reaches of the Tarim River from Daxihaizi to Taitema Lake. Overall, the extent of the drought conditions increased from the upstream to downstream reaches in the mainstream of the Tarim River (Figure 4).
The TVDI results showed (Figure 4, Table 3) that in the mainstream of the Tarim River from 2015 to 2021, severe drought was present in most areas, i.e., more than 50%, followed by moderate drought in 20–30%, and light drought and extreme drought in about 10%. Thus, the mainstream of the Tarim River was characterized by extreme drought.
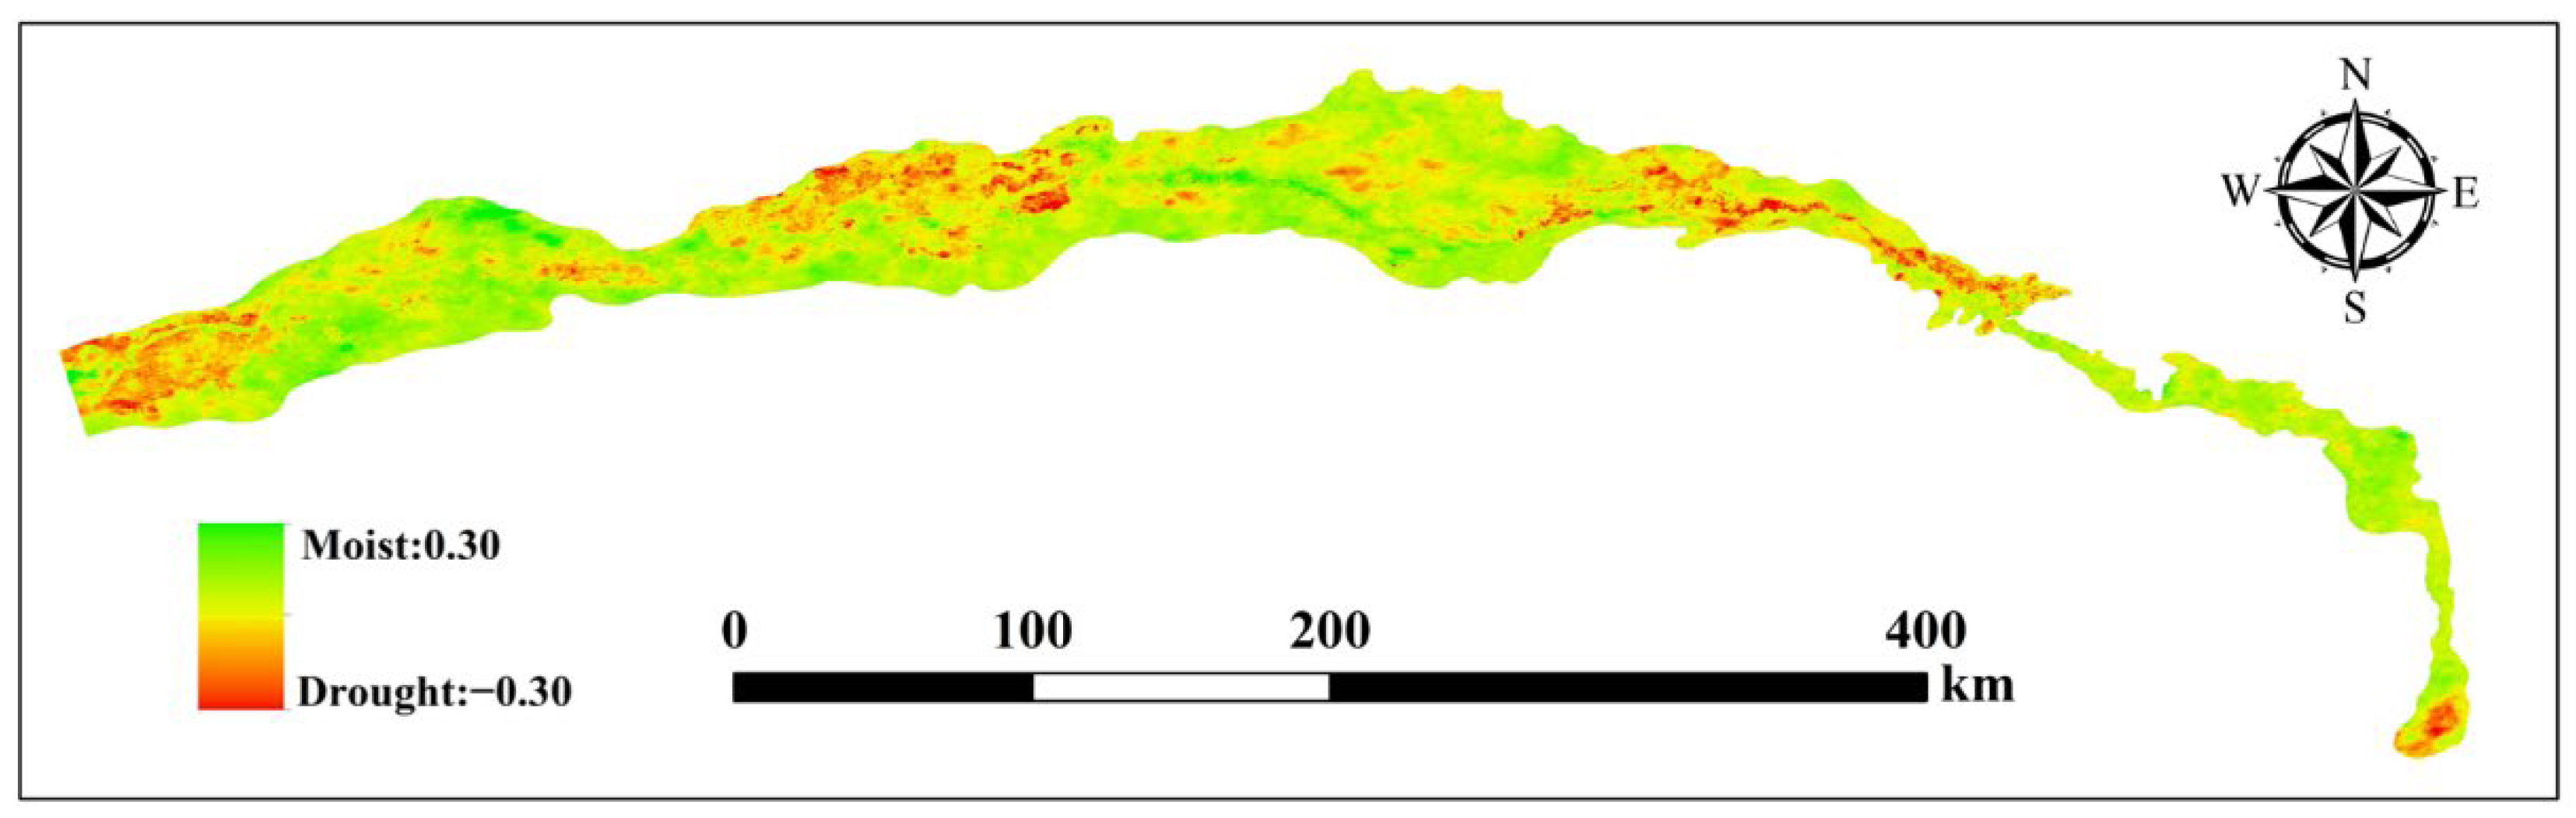
The average TVDI values in the mainstream of the Tarim River tended to decrease from 2015 to 2021, with 0.78 in 2015 and 0.75 in 2021. Figure 5 shows that after ecological water conveyance, the area from Shajilike to Aqike in the middle reaches of the Tarim River and from Daxihaizi Reservoir to Kurgan in the lower reaches of the Tarim River accounted for most areas where the drought was relieved, and there was a trend toward humidification. In the entire study area, the proportion with extreme drought (TVDI >0.9) decreased from 11.2% in 2015 to 11.0% in 2021, and the proportion of the area with extreme drought was the lowest in 2018, at only 5.1%. The proportion with light drought increased from 10.4% in 2015 to 13.9% in 2017, and the proportion with moderate drought increased from 21.4% in 2015 to 29.7% in 2018. The areas affected by extreme drought gradually transformed into areas with light drought and moderate drought.
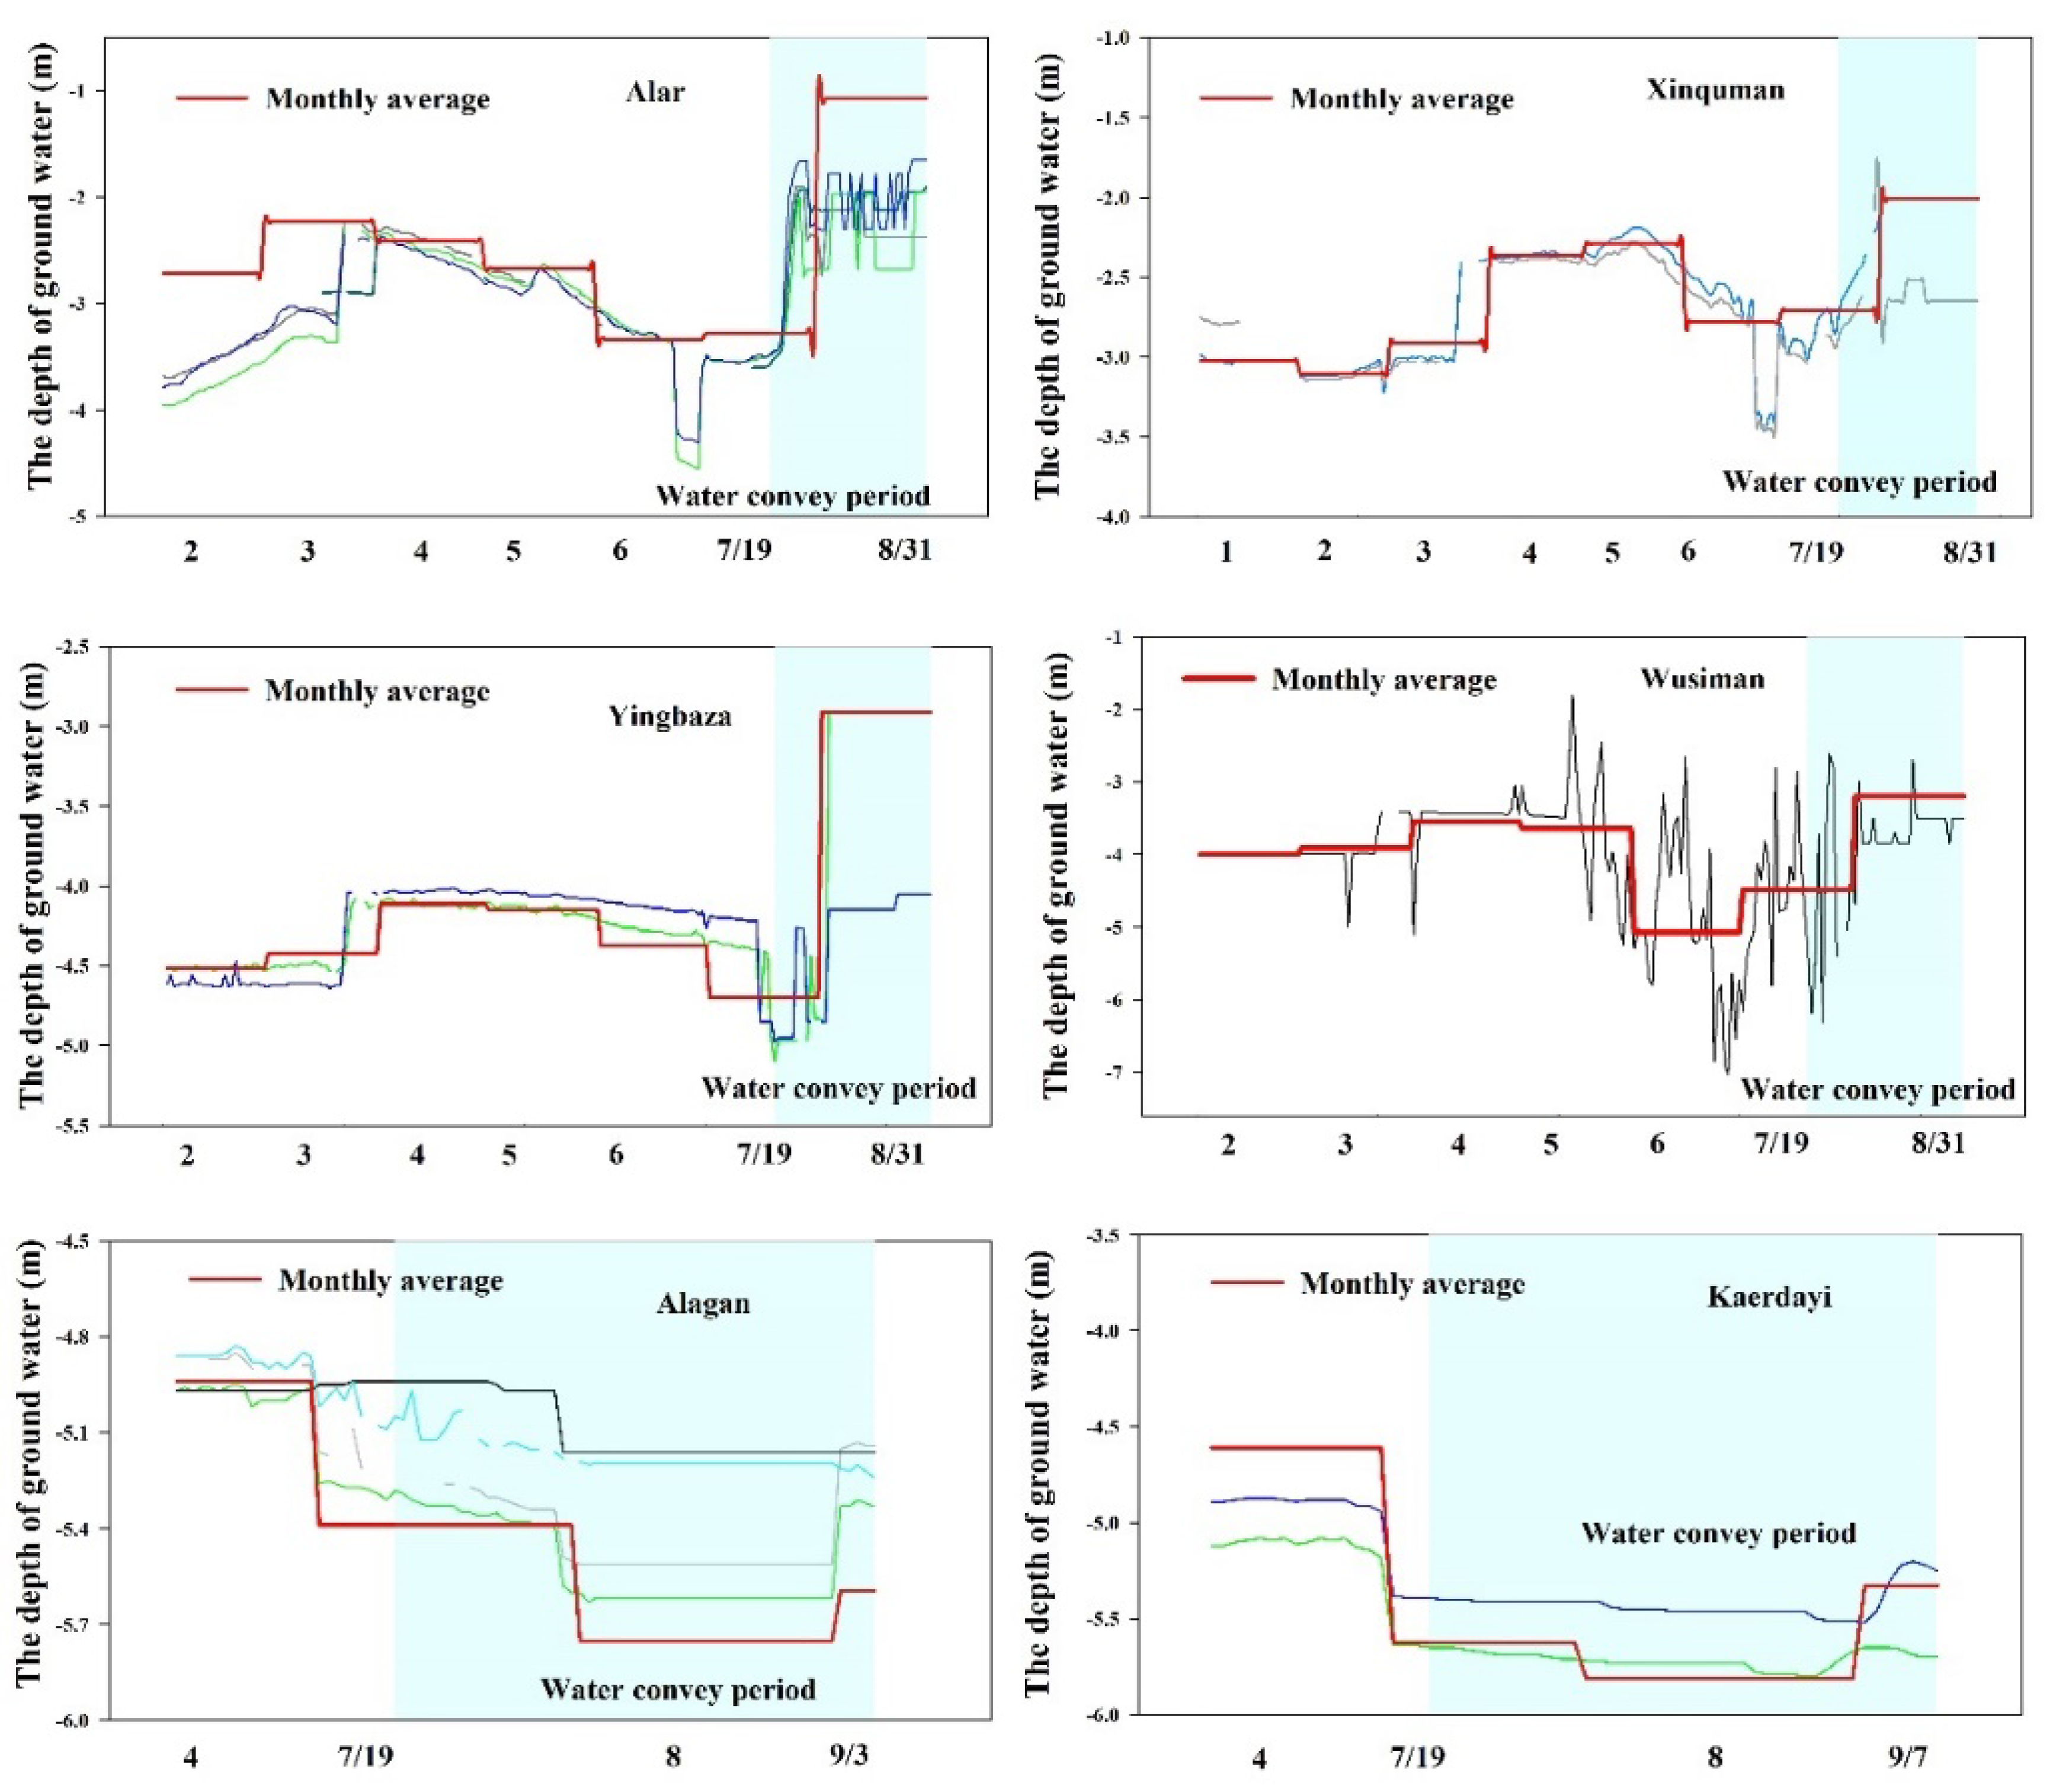
According to the data obtained from six groundwater dynamic monitoring sections to determine the main environmental geographical characteristics and importance of the mainstream of the Tarim River (Figure 6), the groundwater depth in the Alar groundwater monitoring section increased rapidly after ecological water conveyance from the monthly average value of −3.33 m in July to −1.07 m. At the full groundwater monitoring section in Xinquman, the groundwater depth increased rapidly from the monthly average of −2.78 m in July to −2.01 m after ecological water conveyance, and groundwater depths in the groundwater monitoring sections in Yingbaza and Wusiman also increased by 1–2 m. Groundwater depths in the monitoring sections in Alagan and Kaerdayi increased slightly until the beginning of September. Thus, ecological water conveyance greatly affected the groundwater recharge and ecological restoration on both sides of the Tarim River and created favorable hydrological conditions for vegetation growth.
3.2. Vegetation Response
3.2.1. Temporal and Spatial Variations in Vegetation Coverage
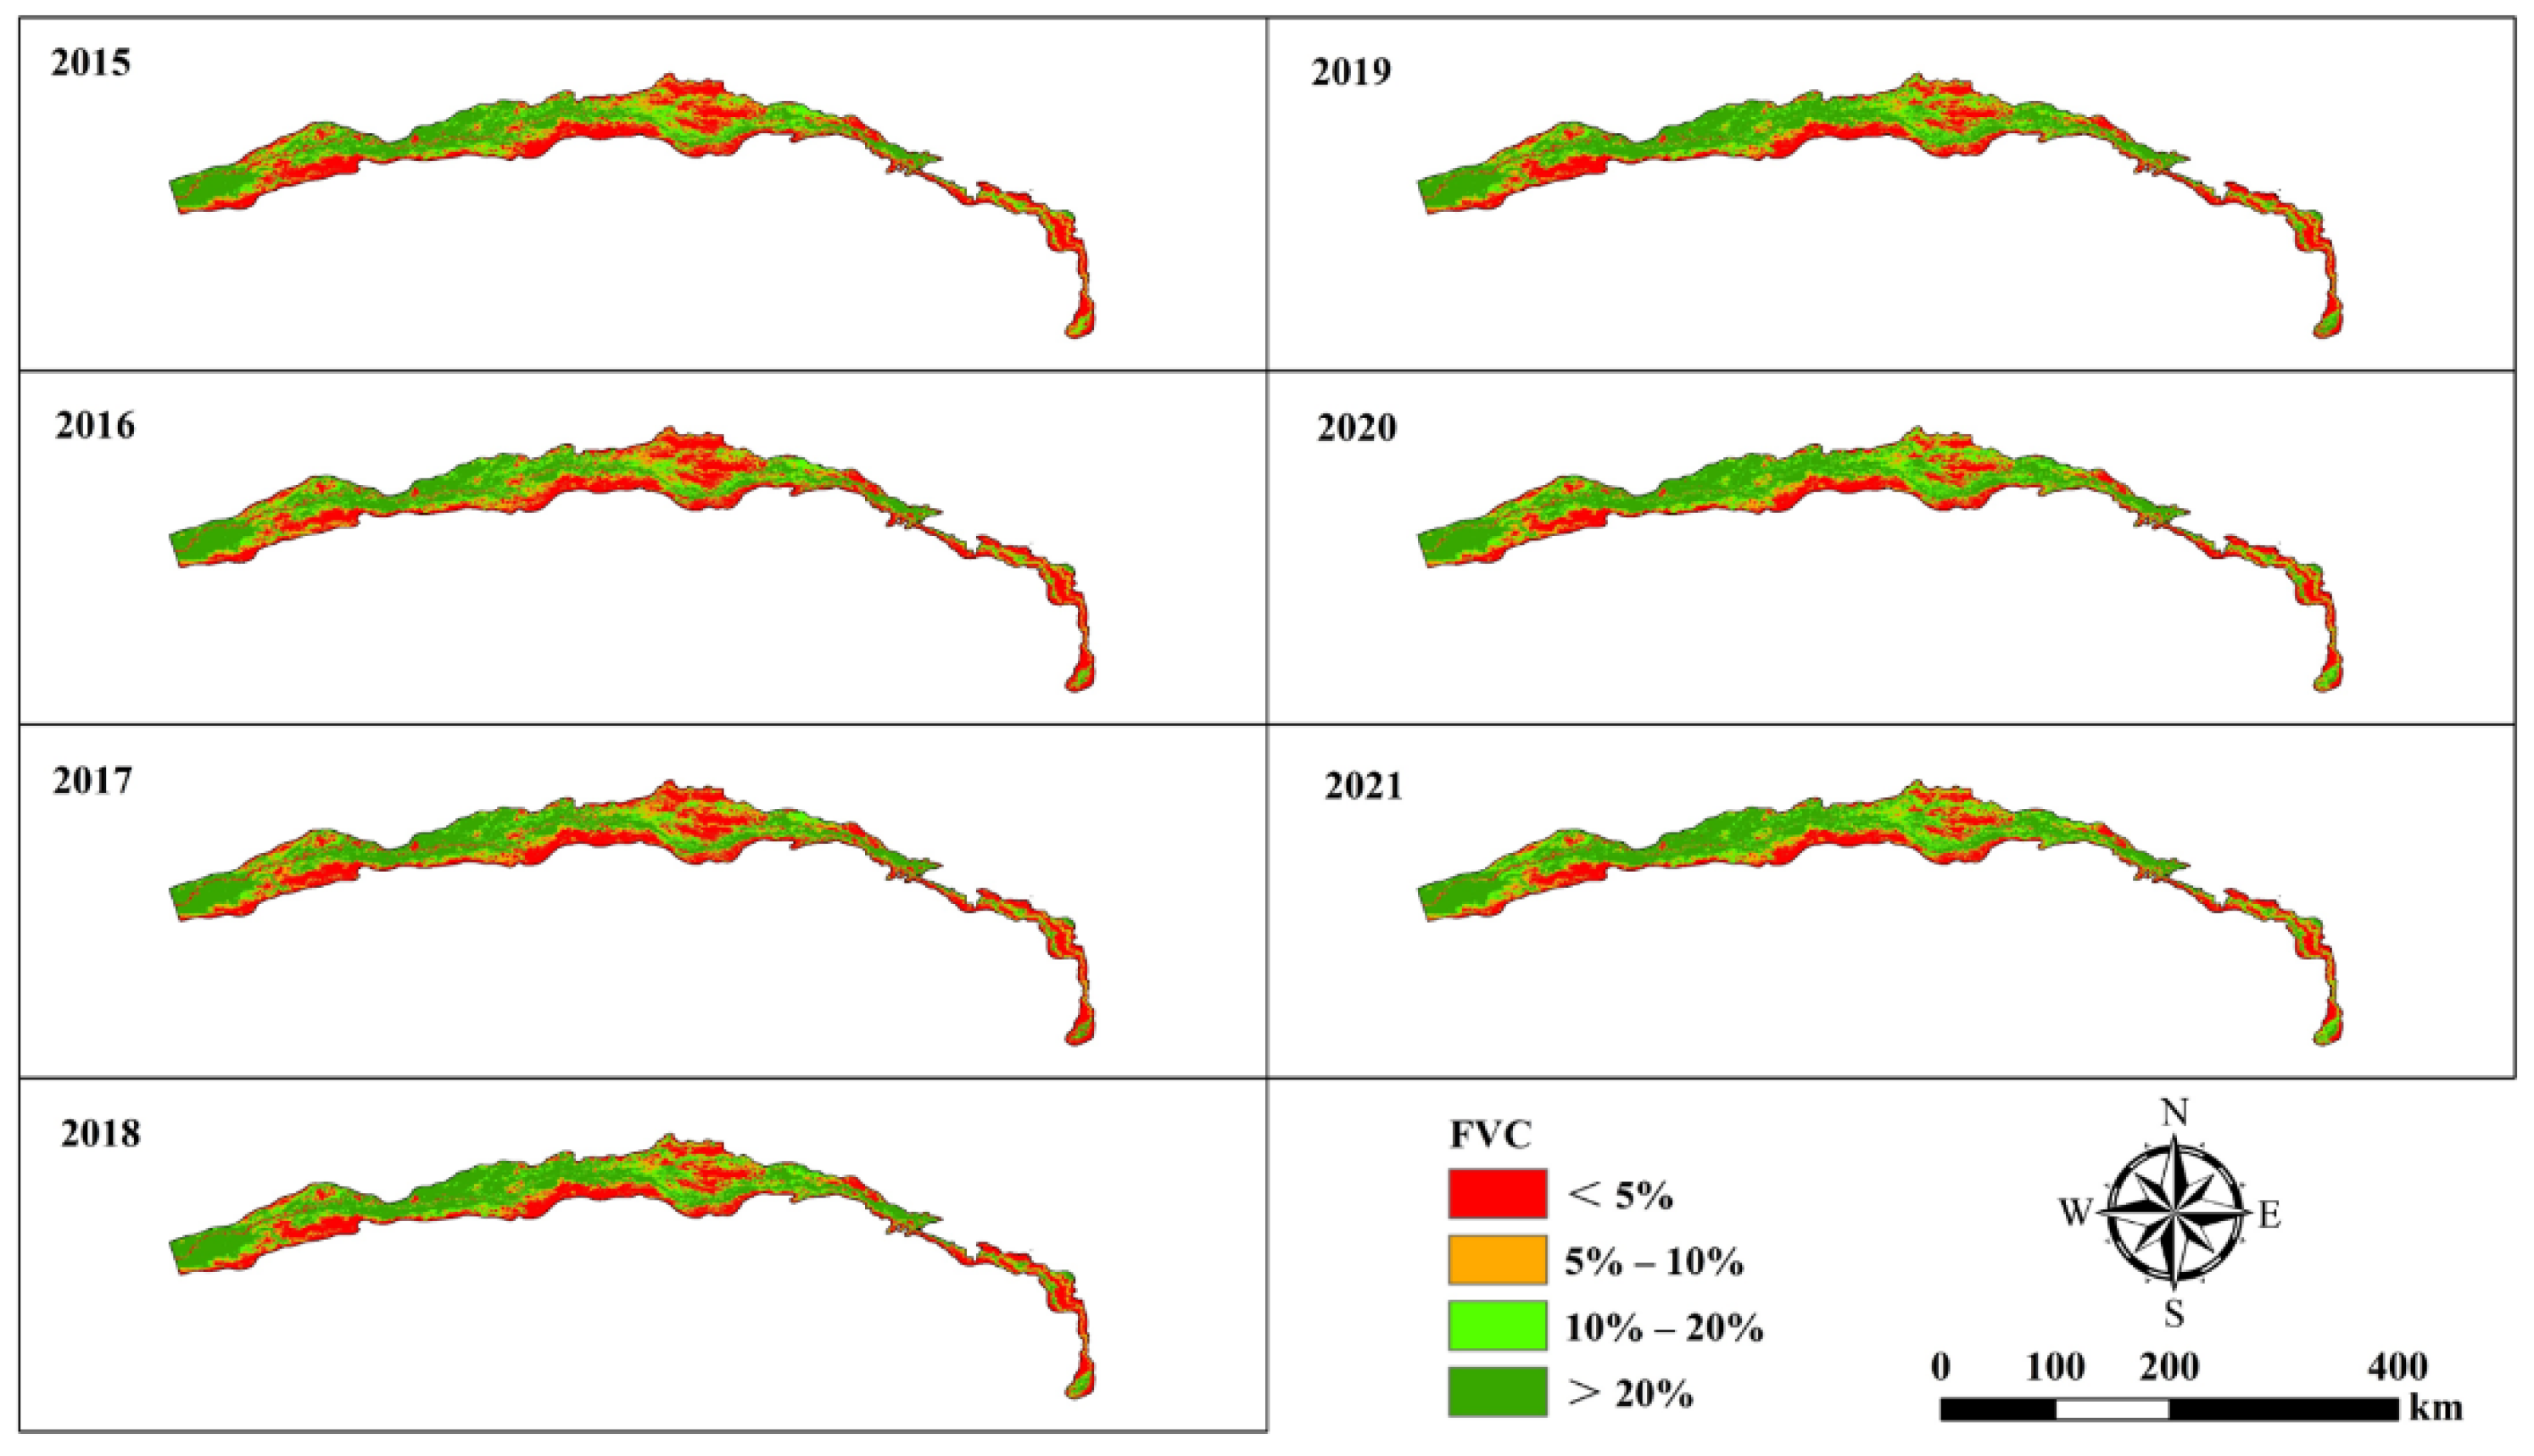
The spatial distribution of the vegetation coverage in 2021 was analyzed to assess the vegetation status (Table 4). Most of the area had high vegetation coverage (>20%) with 38.2%, mainly in the upper reaches of the Tarim River from Alar to Yingbaza (Figure 7), whereas 19.8% had medium vegetation coverage (10% < FVC < 20%), mainly in Xinquman to Aqik. Low vegetation coverage (5% < FVC < 10%) and extreme low vegetation coverage (FVC <5%) were found in 15.4% and 26.7% of the area, respectively, mainly in the middle reaches of the Tarim River to Taitema Lake. In general, the vegetation coverage in the Tarim River Basin decreased from the upstream to downstream reaches.
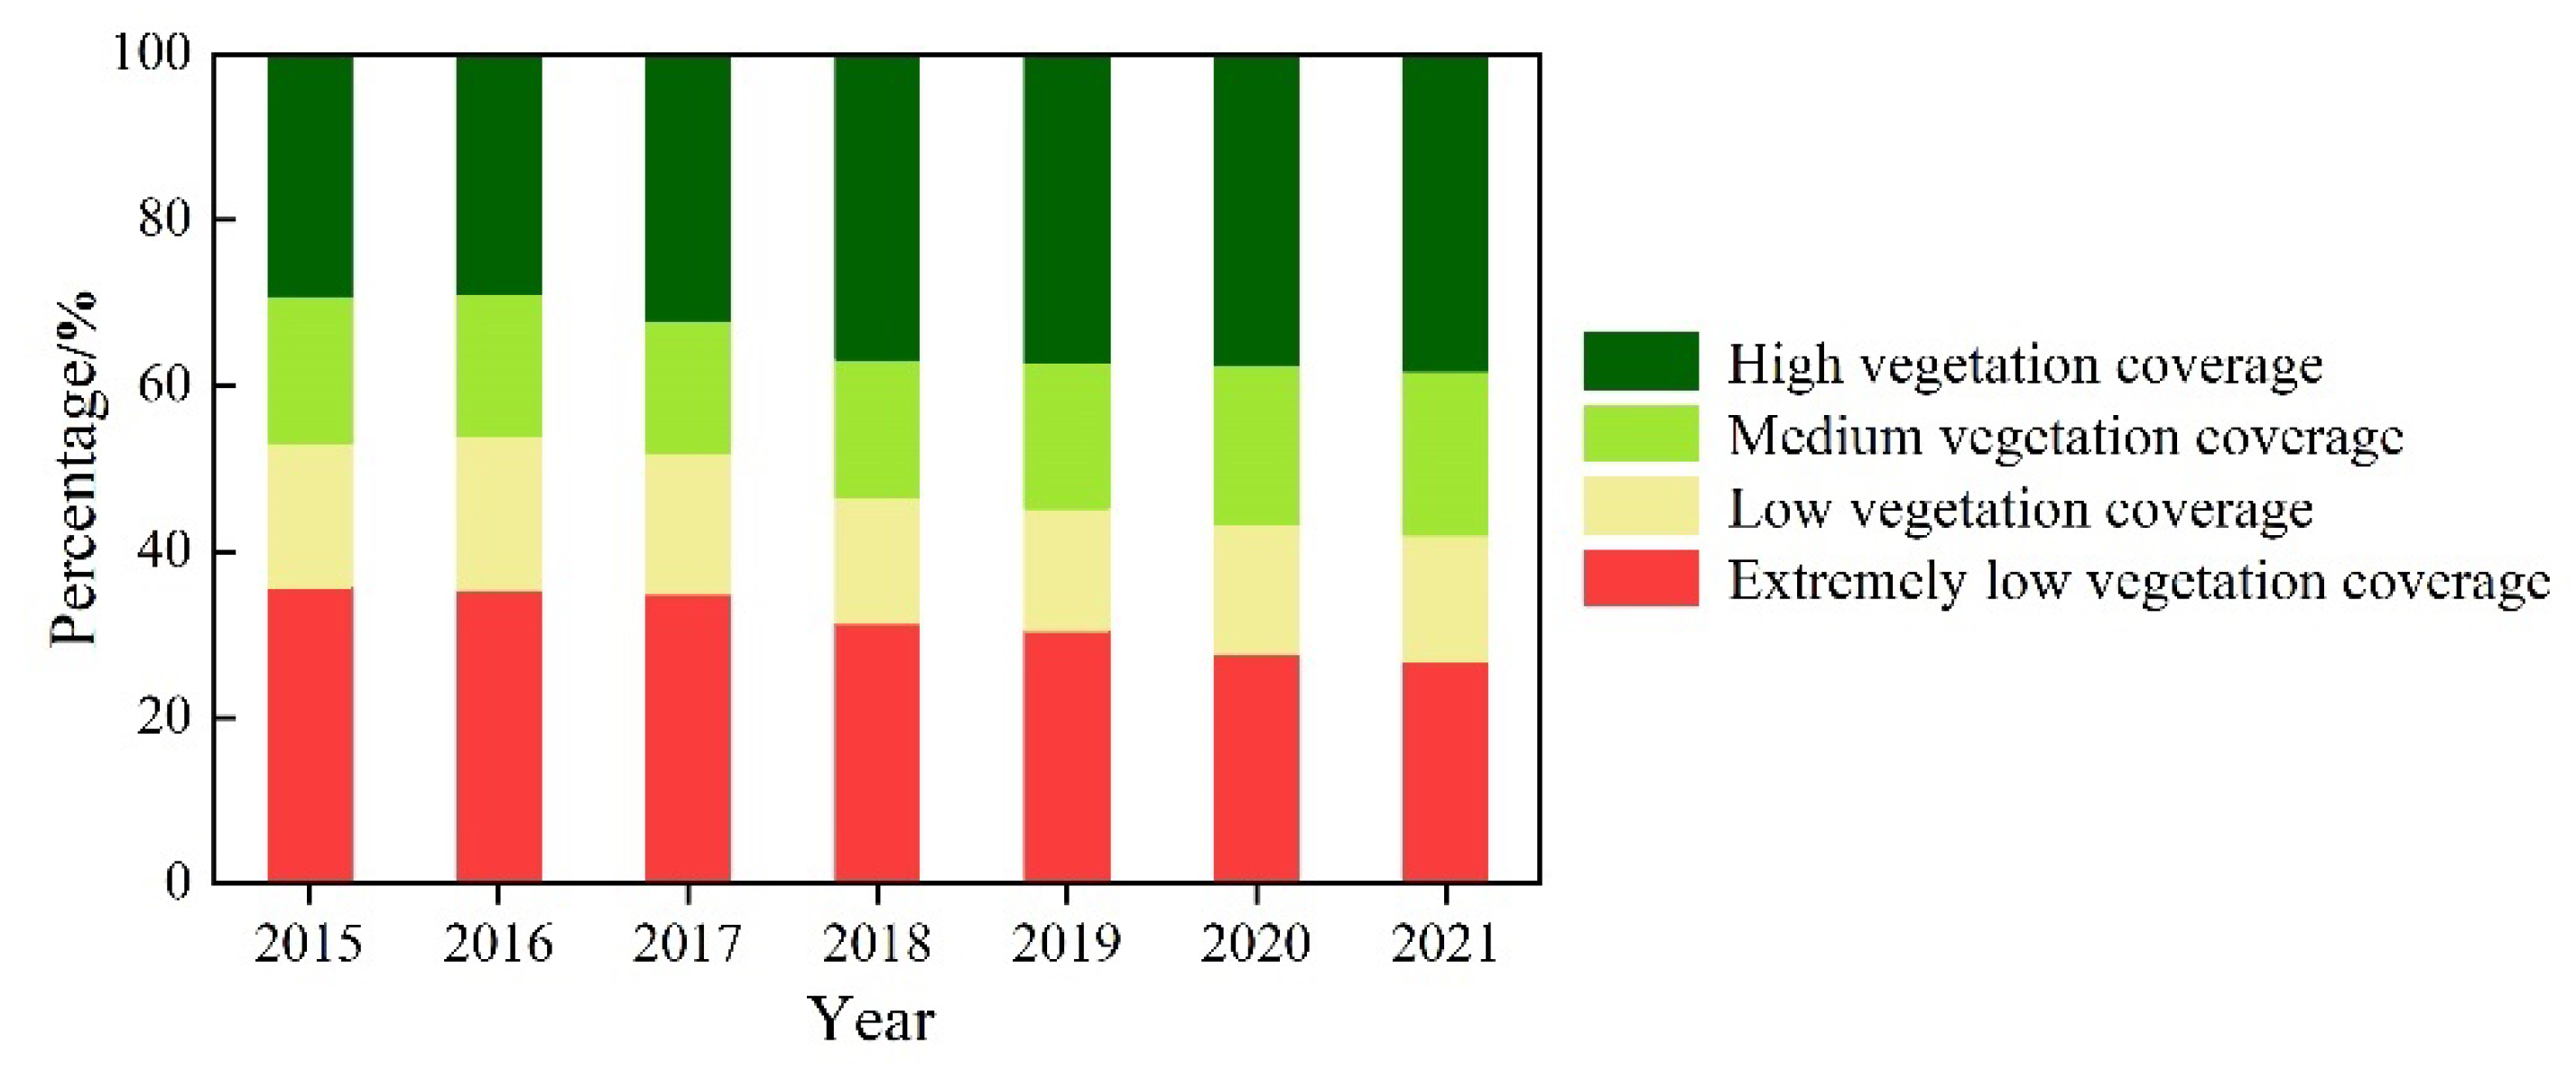
Figure 8 shows that the vegetation coverage increased in the mainstream area of the Tarim River from 2015 to 2021. In particular, the area with high vegetation coverage increased from 29.2% in 2015 to 38.2% in 2021, while the area with medium vegetation coverage increased slightly from 17.9% in 2015 to 19.8% in 2021, the area with low vegetation coverage decreased slightly from 17.2% in 2015 to 15.4% in 2021, and the area with extremely low vegetation coverage decreased to reach a minimum of 26.7% in 2021. The results showed that the areas with low and extremely low vegetation coverage gradually transformed into areas with medium and high vegetation coverage. Thus, the vegetation coverage in the mainstream of the Tarim River tended to improve after ecological water conveyance.
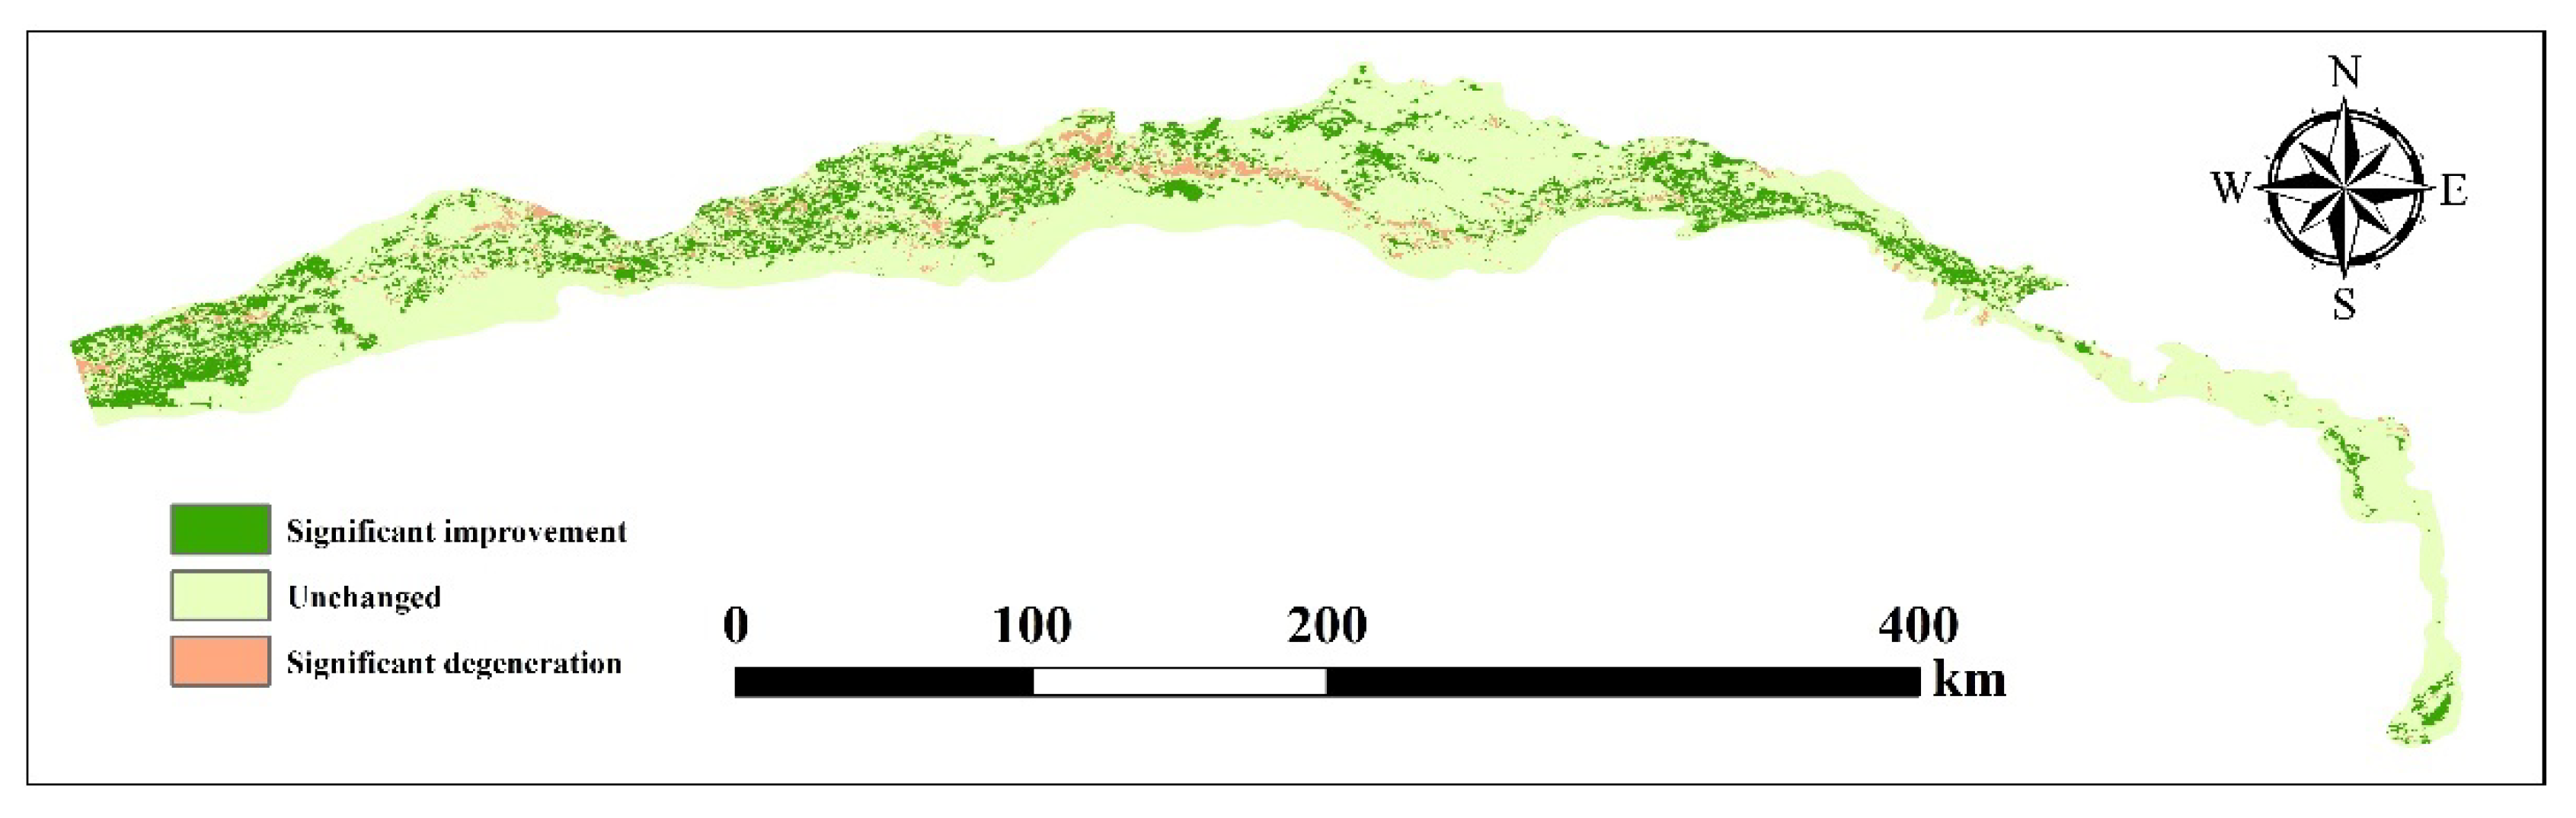
Based on the vegetation coverage images from 2015 to 2021, a transfer map was prepared using the raster calculator in ArcGIS 10.7. The images were then reclassified as significantly improved, unchanged, and significantly degraded (Figure 9). The area with unchanged vegetation coverage comprised up to 76.8% of the total area. The area with significantly improved vegetation coverage comprised 19.0%, which was mainly distributed throughout the mainstream area of the Tarim River. The area with significantly degraded vegetation coverage comprised the lowest proportion with 4.2%. In general, most of the area had unchanged vegetation coverage, followed by some with significant improvements, and significant degradation was found in the smallest area.
3.2.2. Temporal and Spatial Variations in Species Diversity in the Tarim River
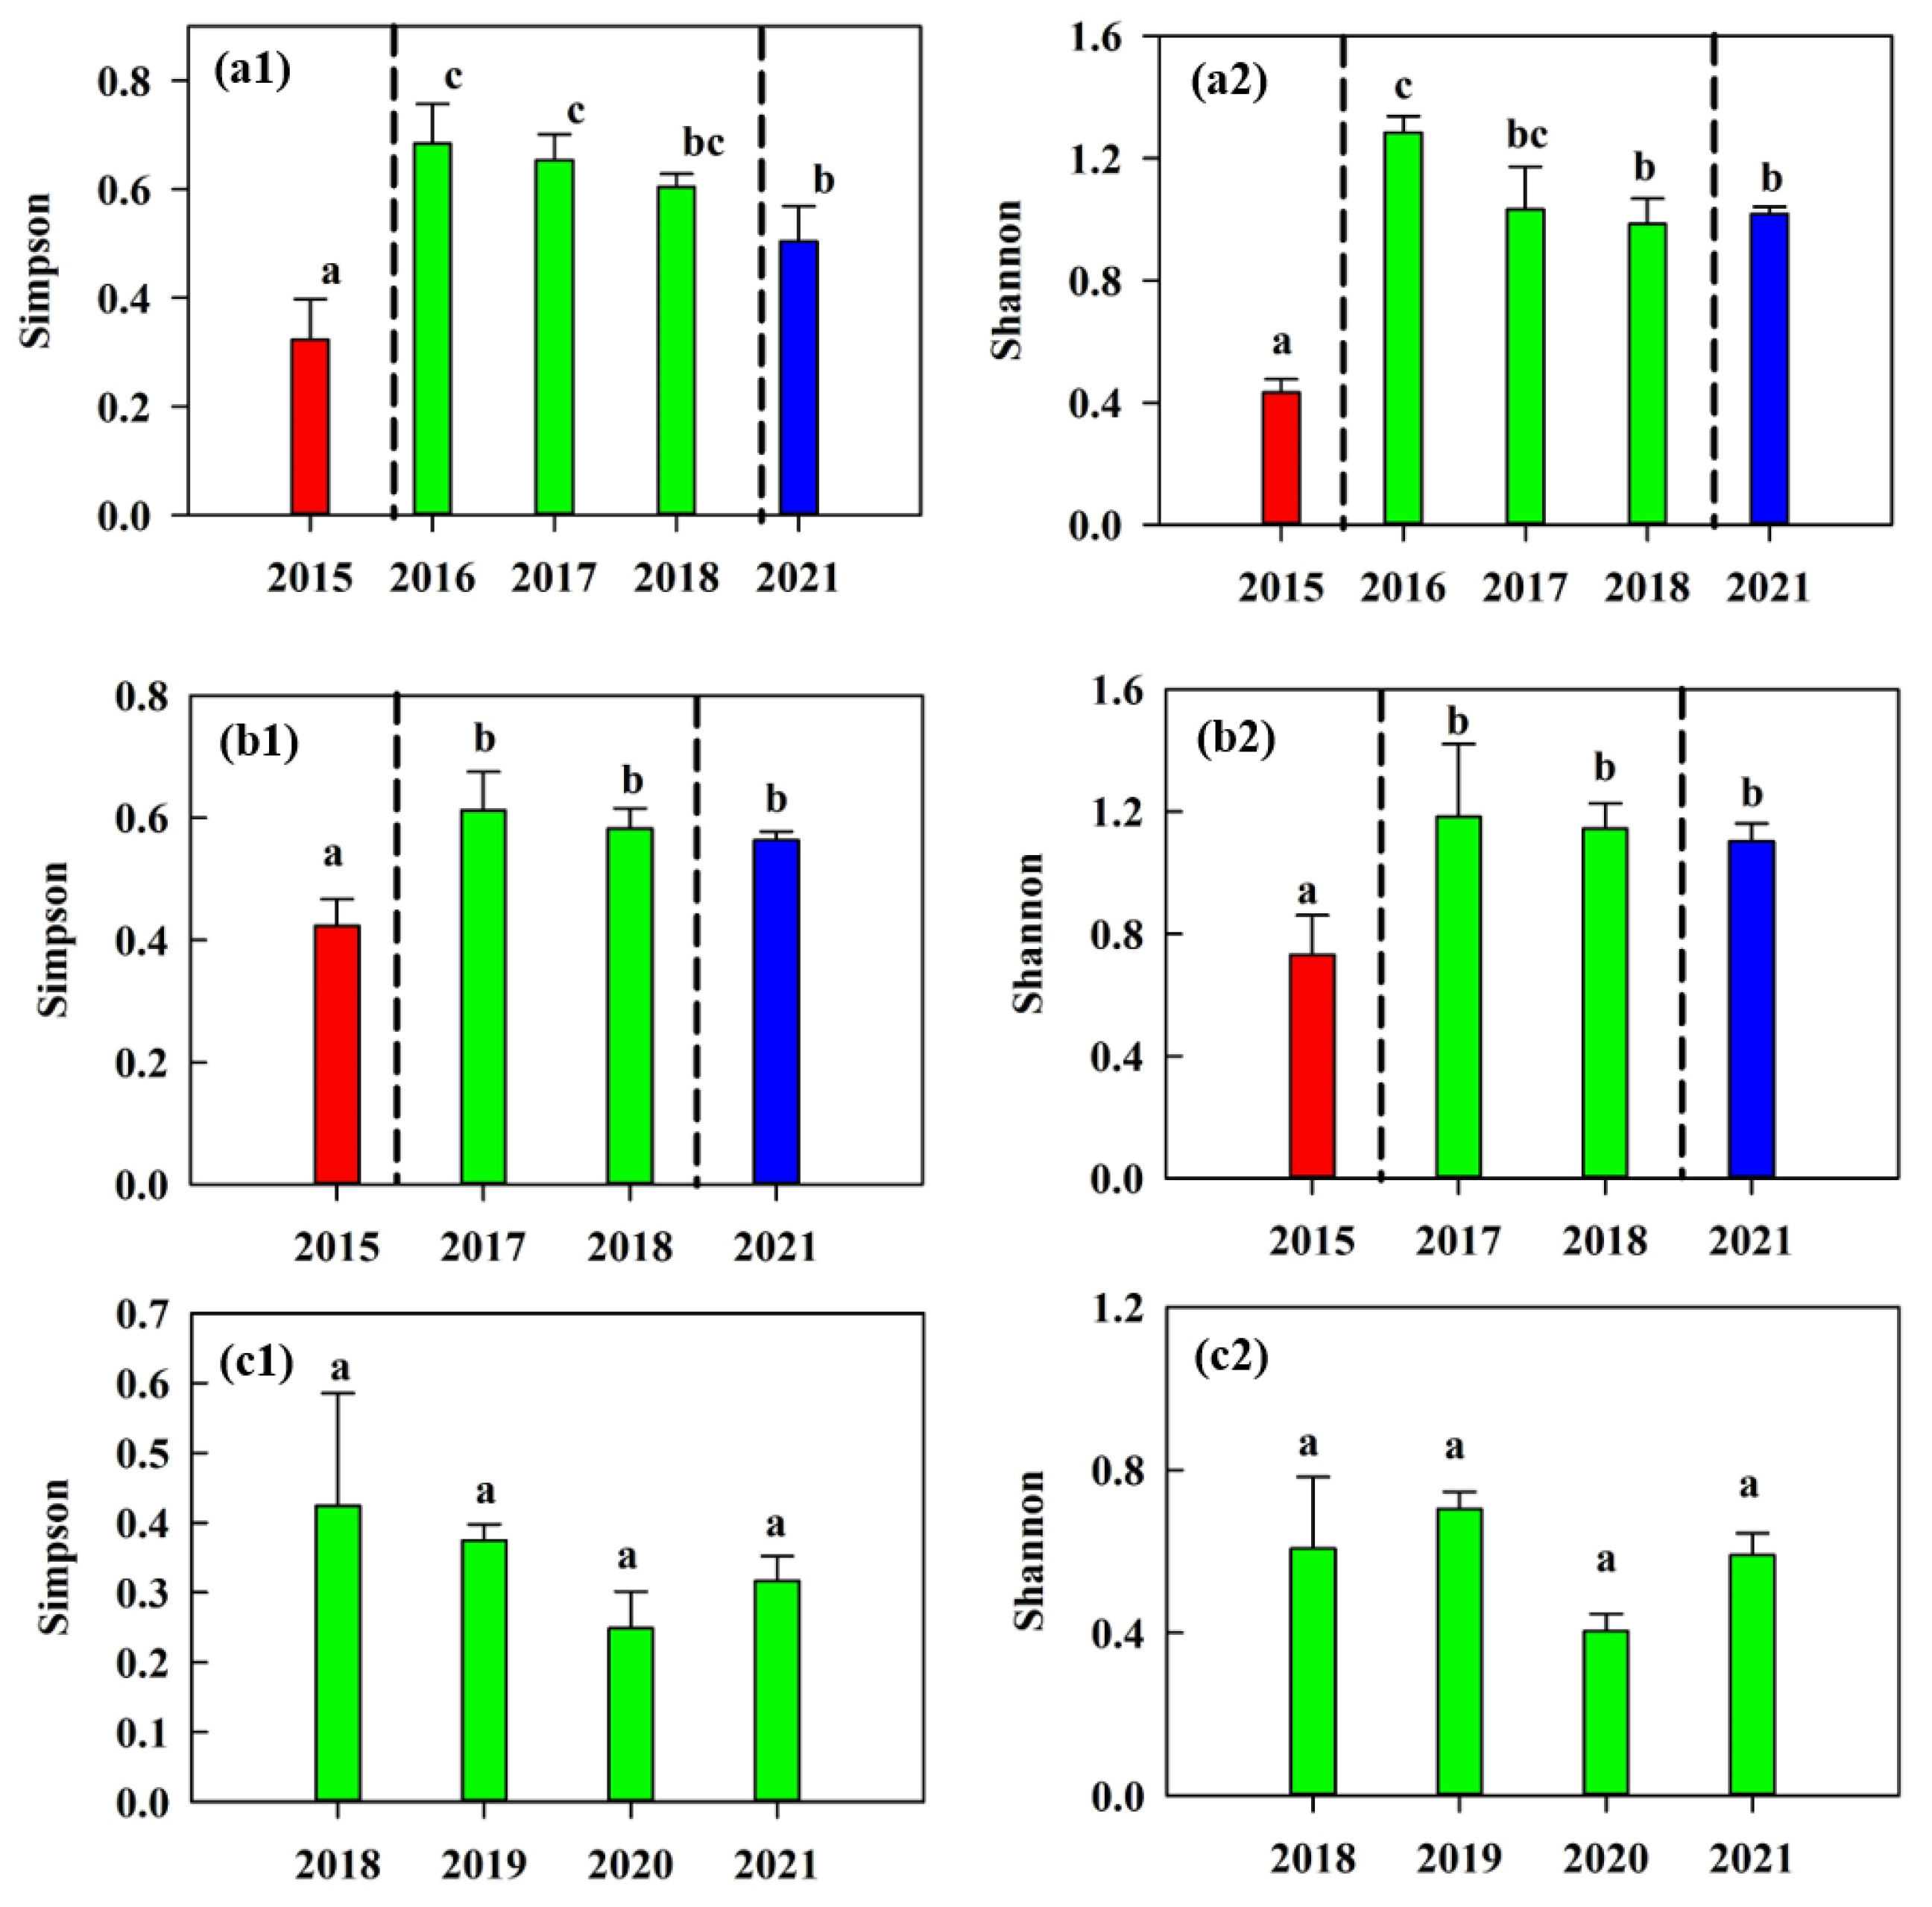
According to the monitoring results of the sample plot, average diversity index values in the vegetation survey plots in each section were used to measure species diversity (Figure 10). The following results were obtained by analyzing diversity indices for the six monitoring sections from Alar to Alagan. The Simpson and Shannon–Wiener indices obtained for the upstream to downstream sections of the Tarim River tended to decrease, and they reflected a gradual decrease in the groundwater level in the mainstream of the Tarim River with the extension of the water conveyance channel, and the species diversity tended to decrease in a corresponding manner. In the upper and middle reaches of the Tarim River, the Simpson index and Shannon–Wiener index (Shannon index) values were significantly lower in 2015 than 2017, 2018, and 2021; thus, the riparian vegetation was gradually restored after ecological water conveyance. It should be noted that the Simpson index and Shannon–Wiener index values in 2021 were lower compared with those in 2017 and 2018, thereby indicating that the community’s species diversity increased significantly after more than two years of water conveyance. However, the diversity began to decline before and then stabilized as the frequency of water conveyance increased. In the lower reaches of the Tarim River, the Simpson and Shannon–Wiener indices did not differ significantly between years, where the average indices from 2018 to 2021 were 0.34 and 0.58, respectively. The vegetation degradation was particularly severe in the lower reaches of the Tarim River, but the ecological environment improved under the normalized water conveyance mode and species diversity tended to stabilize.
3.3. Evaluation of Comprehensive Effects
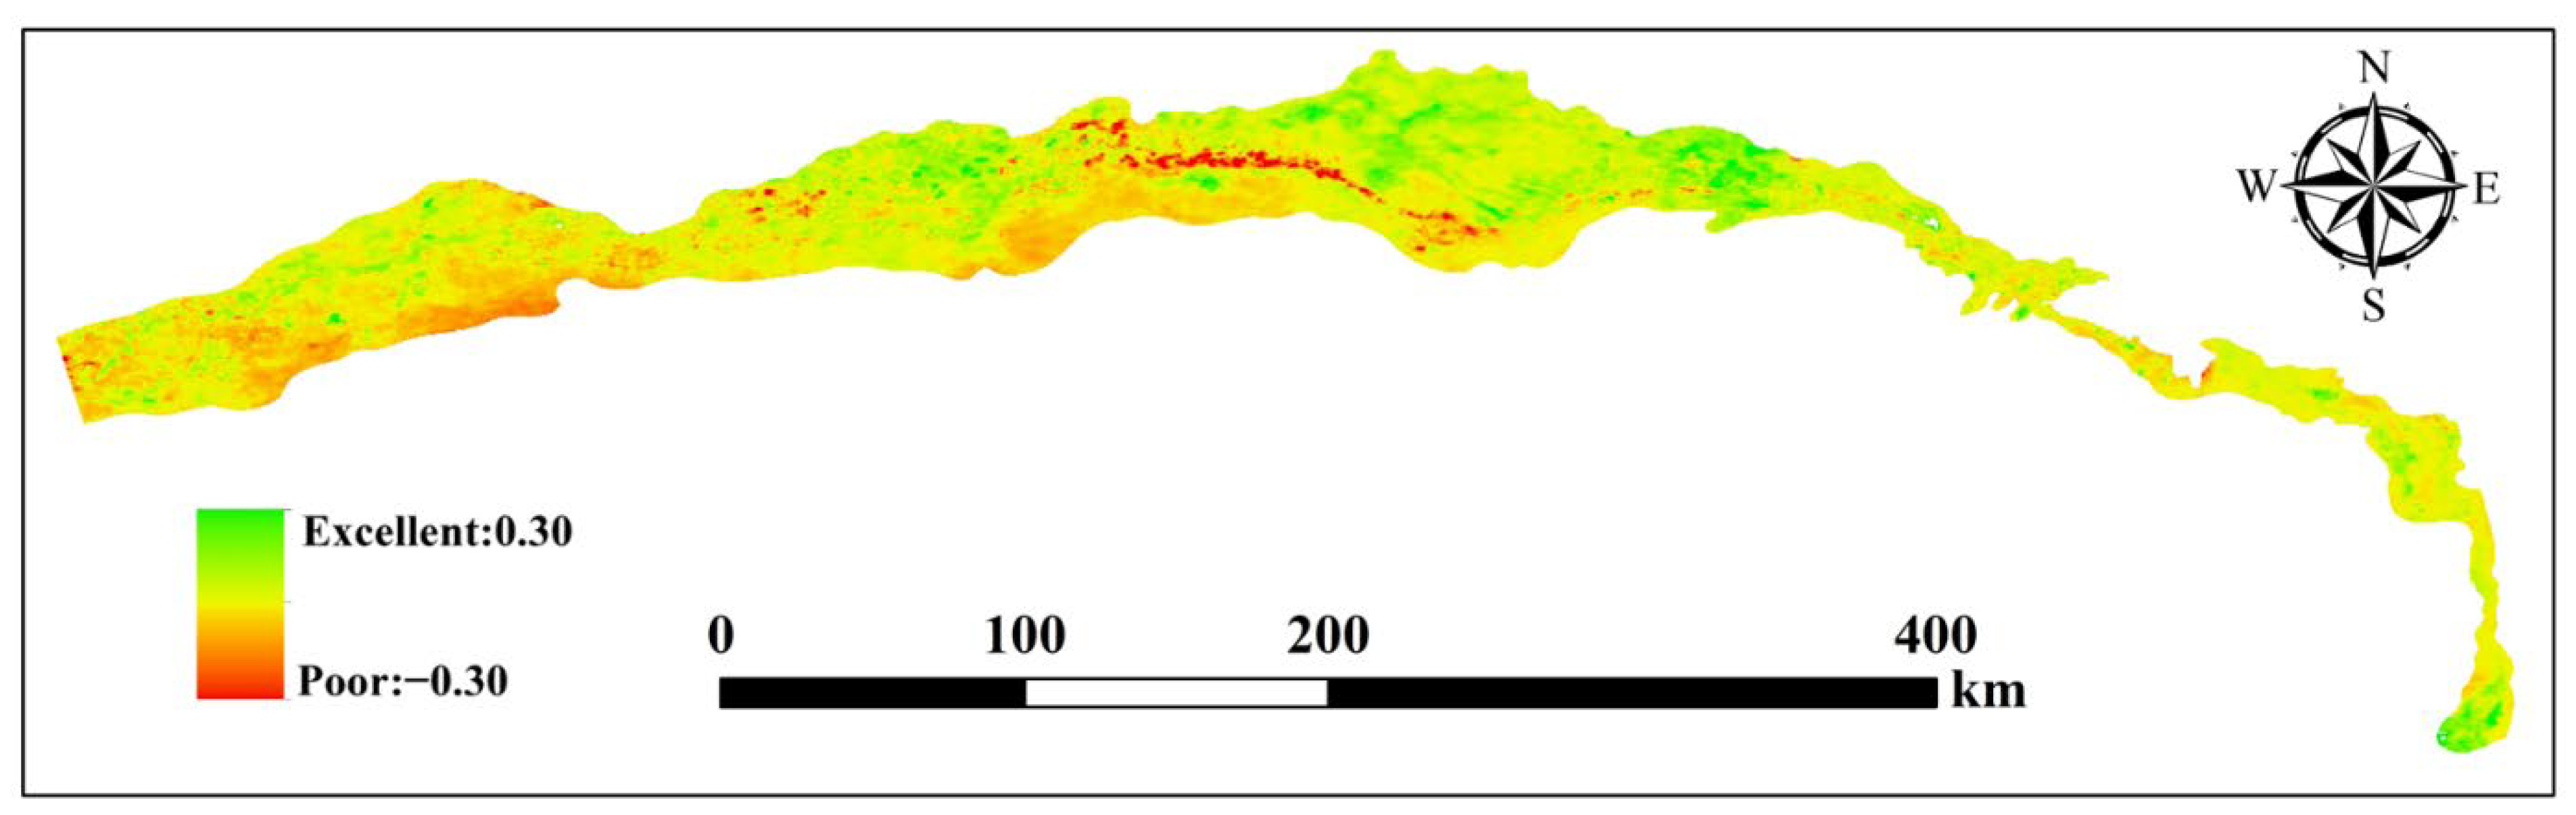
The ecological quality status in the study area was analyzed using the RSEI spatial distribution data for 2021 (Table 5). The habitat’s status was mainly moderate in the study area, i.e., in 49.8% of the area, and the areas with excellent habitat conditions only comrpised 2.7% of the total area, mainly in the section from Alar to Xinquman where the hydrological conditions were good and the vegetation coverage was high compared with the middle and lower reaches of the Tarim River (Figure 11). The area with medium and good ecological quality status comprised 47.5% of the total area, mainly in the section from Xinquman to Wusiman. The habitat conditions were mainly poor and moderate in the lower reaches of the Tarim River, where the natural vegetation types were relatively poor and the vegetation coverage was low. After ecological water conveyance, the overall habitat condition improved but it was still inferior compared with the upper and middle reaches of the Tarim River.
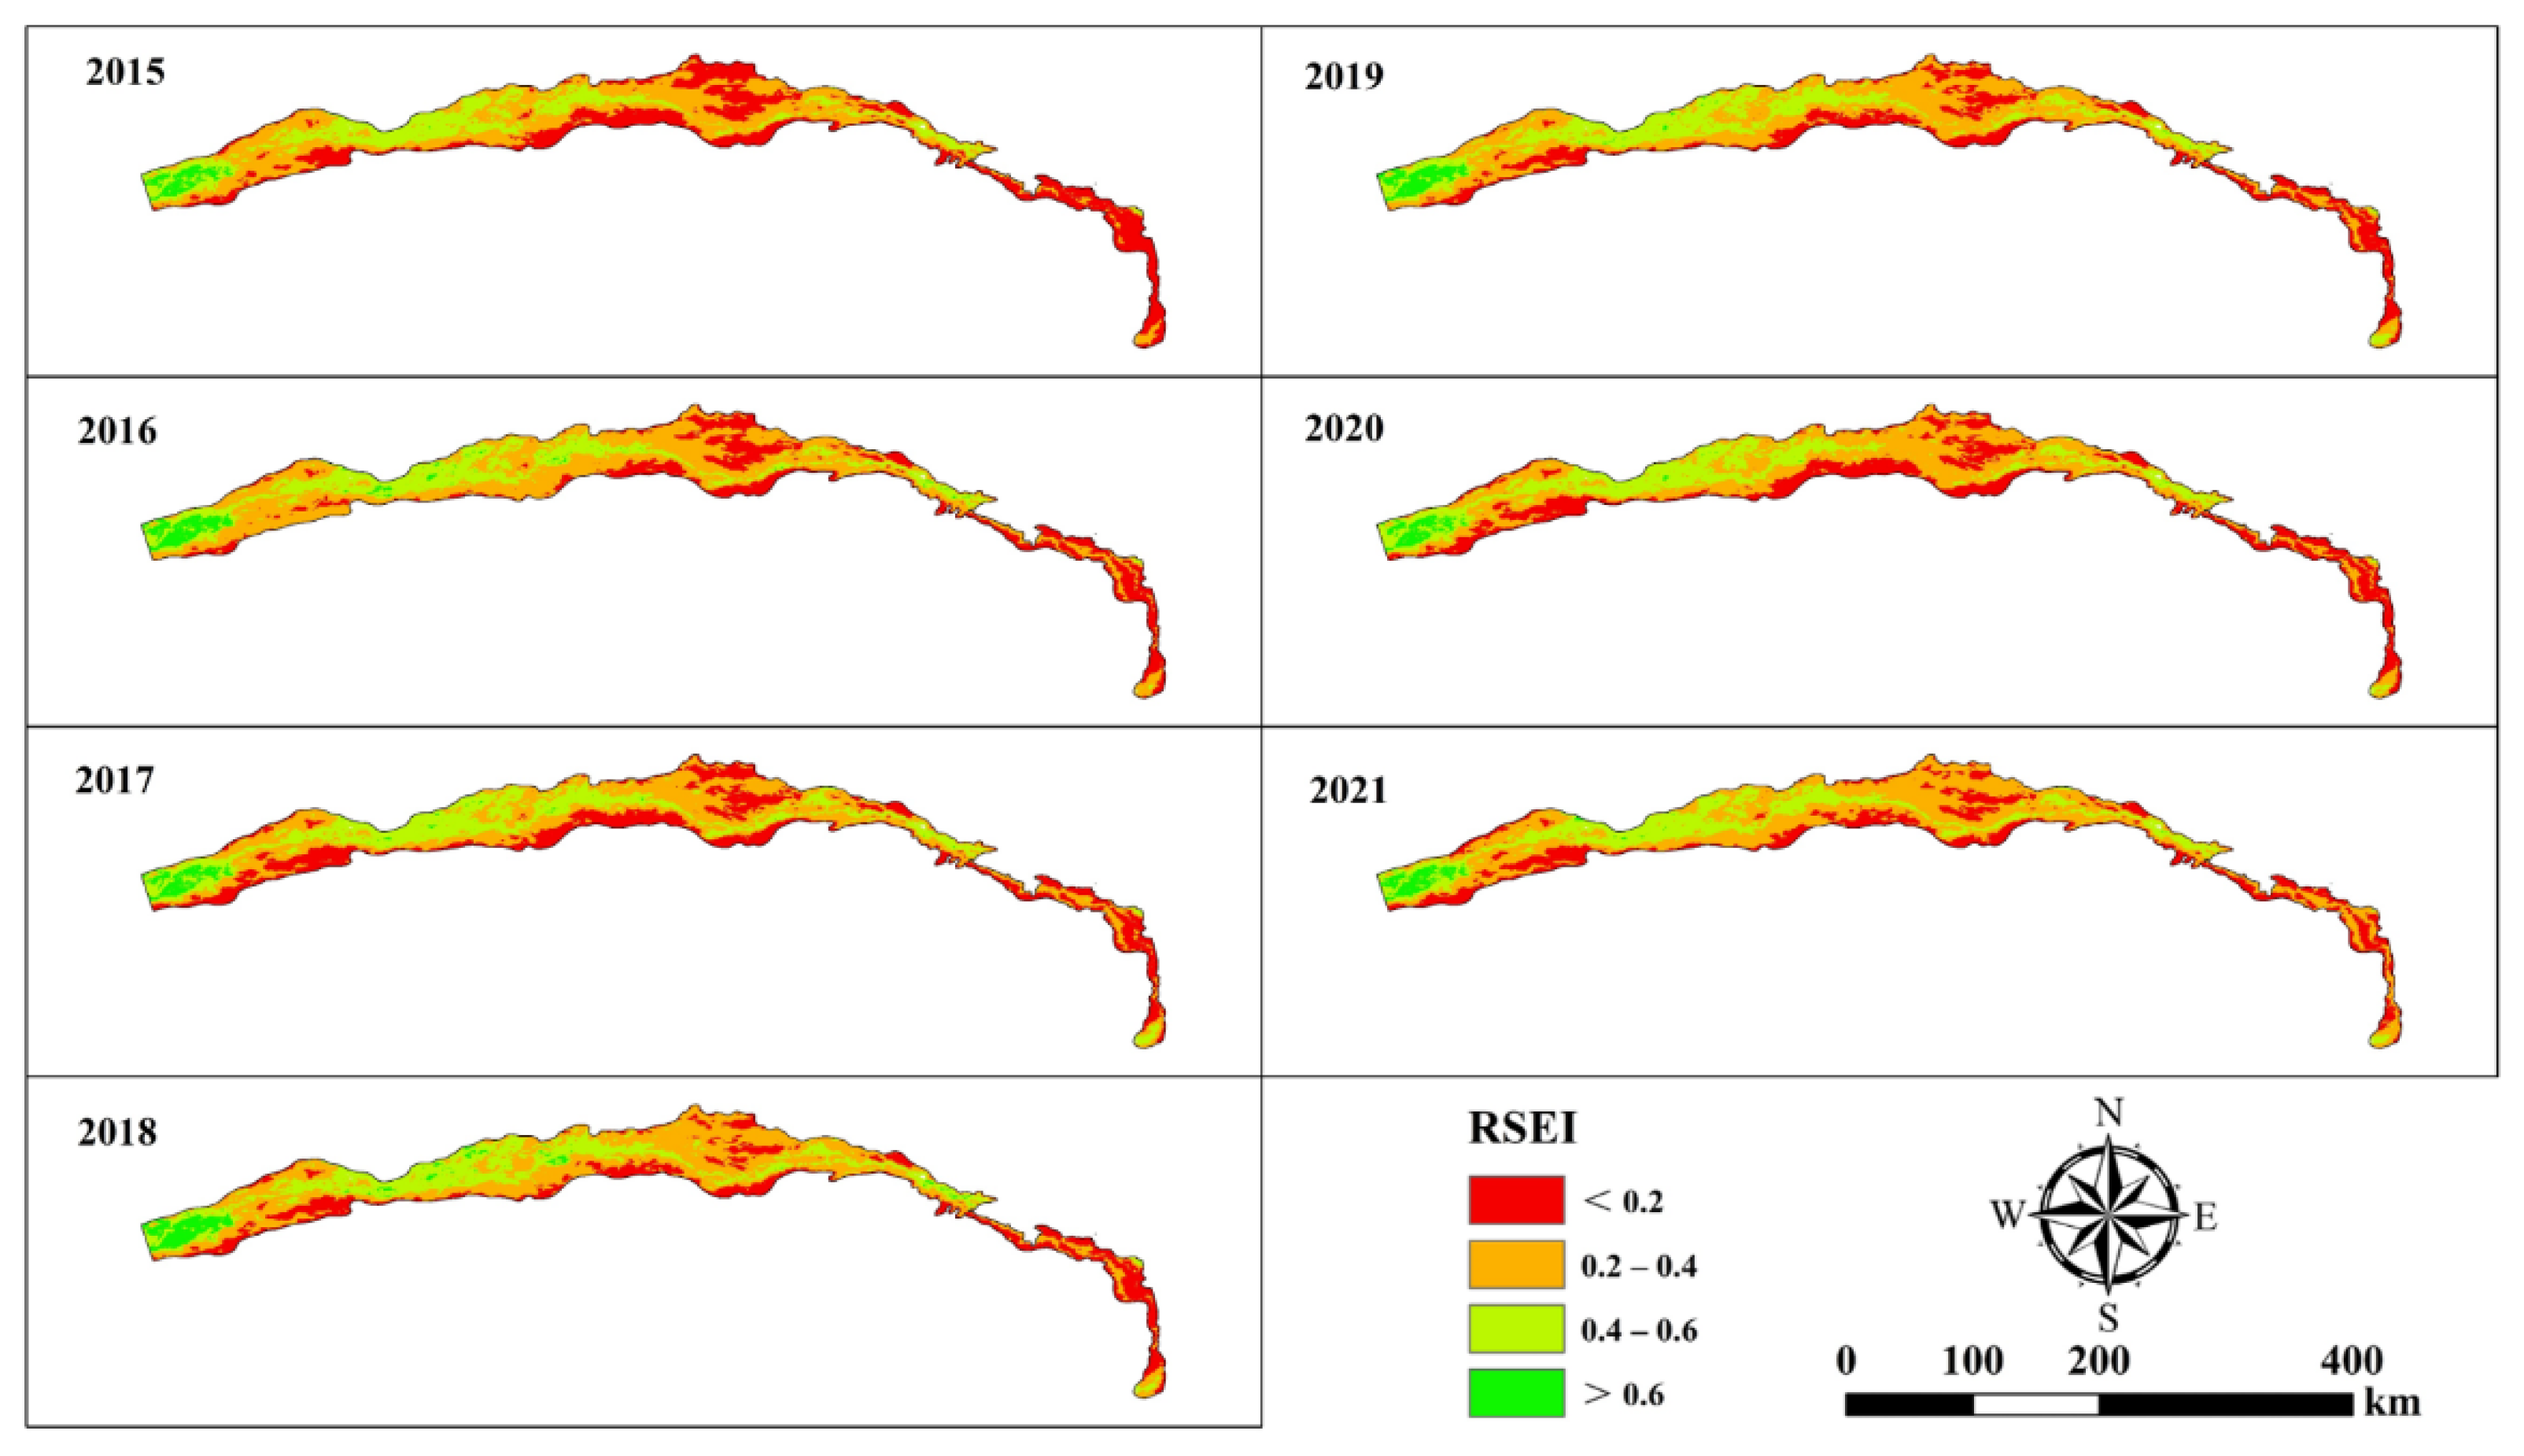
Analyses based on remote sensing ecological index values for the mainstream of Tarim River from 2015 to 2021 showed that the average remote sensing ecological index increased by 6.9% from 0.29 in 2015 to 0.31 in 2021, thereby indicating that the ecological quality of the study area tended to improve. The results showed (Figure 12, Table 5) that most of the region had a medium habitat status, with 42.6% of the area in 2015, which increased to 49.8% in 2021. The area with a poor habitat status decreased from 33.1% in 2015 to 23.9% in 2021, and the minimum was 22.5% in 2018. The area with a good habitat status increased from 22.0% in 2015 to 23.6% in 2021, and the maximum was 27.0% in 2017. Thus, the areas with poor ecological environments were gradually been replaced by medium and good ecological environments. Figure 12 shows that the quality of the ecological environment below Wusiman in the middle reaches of the Tarim River improved to some extent after ecological water conveyance for nearly 7 years, and the overall habitat condition improved.
4. Discussion
4.1. Relationship between Changes in Vegetation and Hydrological Status in the Tarim River Basin
The desert forest ecosystem in the Tarim River Basin contains Populus euphratica, Tamarix chinensis, Alhagi sparsifolia, and Phragmites australis as the main species, with appropriate groundwater depth thresholds of 3.0–4.7 m, 3.5–4.0 m, 3.0–4.0 m, and <2.5 m, respectively [48,49]. In the Tarim River basin, some of the seeds produced by vegetation are characterized by dormancy and strong resistance to drought and high temperatures; thus, they can survive for a long period of time. In addition, most seeds have unique morphological characteristics that allow them to spread among sites under the action of wind, water, and other vectors [50,51]. After ecological water conveyance, the groundwater level and soil water content were higher in the study area, and many seeds with germination potential were collected in the water conveyance area under the action of the wind or overflow processes. Due to the long-term continuation of the overflow process, other new species were brought into the ecological water conveyance area and seeds from some other areas spread along the water conveyance channel to other areas. Under suitable environmental conditions, the seeds could grow rapidly and reproduce. The surface runoff due to ecological water transfer activated the soil’s seed bank, thereby allowing numerous annual herb and perennial herb seeds to germinate; thus, the number of vegetation species increased significantly in the ecological water transfer area [52,53]. After ecological water transfer, the low and extreme vegetation coverage in the mainstream area of the Tarim River gradually transformed into medium and high vegetation coverage, thereby indicating that the vegetation coverage improved after ecological water transfer.
The groundwater level is a key factor that limits the growth of vegetation in the Tarim River basin. The groundwater depth changed from shallow to deep from the upstream to the downstream reaches of the Tarim River; thus, the water limitation for the vegetation community also followed a similar gradient [54]. The degree of vegetation degradation was more severe in the lower reaches of the Tarim River compared with the upper and middle reaches. Only some perennial herbs and shrubs with deep roots could survive in this area before the implementation of ecological water conveyance. The overall vegetation diversity in the Tarim River basin tended to decrease with the degree of degradation. The number of species and density of the soil seed bank also tended to decrease with a degree of degradation. After ecological water conveyance, the groundwater level near the river channel increased significantly and the number of vegetation species in the water conveyance area also increased significantly; thus, the growth of vegetation and diversity was restored to some extent. Under the normalized water conveyance mode, ecological environments improved and species diversity tended to stabilize.
4.2. Strategies for Increasing the Benefits of Ecological Water Conveyance
The ecological water conveyance project ended the 30-year history of river closure in the lower reaches of the Tarim River, saved endangered desert communities, and effectively restored the ecosystem. However, we still need to address the following two questions. First, the overall ecological quality status is still poor further from the river channel because the current ecological water supply project has difficulty supplying water to the Populus euphratica forest located far away from the river channel. The water supply project is mainly distributed in the upper reaches from Alar to the southern desert and oasis transition zone in Xinquman, from Xinquman to the southern desert and oasis transition zone in Yingbaza, and the middle reaches of Yingbaza to the north of Aqike within 20 km of the river and near Qiala within 20 km of the river. Second, vegetation coverage degraded in areas close to the river, such as Alar, Xinquman, and Yingbaza in the upper reaches of the Tarim River. According to field investigations, the Populus euphratica forests in these areas received large amounts of ecological water conveyance for a long period of time. Excessive ecological water conveyance can accelerate the accumulation of sodium and chloride ions in the soil around the root of plants due to the high soil salinity on both sides of the Tarim River, thereby damaging the effective functioning of the roots in Populus euphratica to endanger the stability of the Populus euphratica forest community.
To address these problems, the ecological water supply channels and supporting facilities should be improved to ensure that the ecological water can reach the degraded area. In addition, the ecological water conveyance in the degraded Populus euphratica forest area should be applied in an appropriate and moderate manner at the correct time. Excessive overflow frequencies and long overflow durations are not suitable for restoring plant diversity, but instead, a moderate flood disturbance is most beneficial for the ecological restoration of the Tarim River basin [55,56]. Long-term and large volume ecological water conveyance will lead to the gradual succession of Populus euphratica forest community into reeds or other herb communities with poor drought resistance and instability; thus, the species’s diversity will decrease. If the ecological water conveyance cannot be sustained, the reed community will rapidly disappear, thereby greatly decreasing the effectiveness of ecological water conveyance. The desert riparian forest community dominated by Populus euphratica and Tamarix chinensis can stabilize the ecological balance of the desert river zone, prevent wind damage, and fix sand to adapt to the arid environment in the Tarim River basin, and these should be used as the main plant community members for vegetation restoration.
4.3. Uncertainty and Limitations Regarding Variations in Vegetation and Ecological Quality
The coarse spatial resolution of the MODIS images was the major source of uncertainty in our analysis of the variations in vegetation and ecological quality. Vegetation was sparse in the mainstream of the Tarim River, but spatial variations in the vegetation density were obvious. The vegetation density decreased gradually with the distance from the river, and the areas with higher vegetation density were mainly distributed in the range located 1–2 km on both sides of the river or even narrower. However, each pixel in a MODIS image covers an area up to 250 m × 250 m, and the value for each pixel represent the mixed vegetation information value within the area covered by each pixel. Therefore, the spatial differentiation of vegetation could not be expressed in detail, especially at the end of the lower reaches of the Tarim River far from the source of ecological water conveyance with a lower water supply. The width of the area with obvious vegetation restoration was clearly narrow and mostly <1 km after the implementation of ecological water conveyance. Therefore, the results obtained based on the MODIS images indicated low vegetation coverage and poor ecological quality because of the coarse spatial resolution of the MODIS images; thus, the effectiveness of ecological water conveyance was underestimated. Using Landsat, SPOT, or Sentinel images might improve the precision and provide more detail, but it would be difficult to collect sufficient qualified (with low cloud cover) Landsat, SPOT, or Sentinel images. However, the results obtained based on MODIS images still captured the spatial variability in the vegetation and ecological quality for the entire mainstream area of the Tarim River despite the lack of details.
5. Conclusions
In this study, field survey and remote sensing data were used to analyze the ecological restoration status of the Tarim River from 2015 to 2021 in terms of hydrological responses, vegetation responses, and ecological water conveyance benefits. Our main conclusions are as follows:
- (1)
- After ecological water conveyance, the groundwater storage in the mainstream of the Tarim River tended to increase, where the greatest change in the groundwater storage occurred in the middle reaches of the Tarim River from 2015 to 2021, i.e., between 90 and 210 mm. Normalized ecological water conveyance humidified the soil, where the relief was greatest in the middle reaches of the river, and the extreme drought area gradually transformed into a light and moderate drought area. Ecological water conveyance created good hydrological conditions for groundwater recharge and ecological restoration on both sides of the Tarim River.
- (2)
- Ecological water conveyance improved the hydrological conditions in the study area. The desert forest ecosystem mainly comprising Populus euphratica and Tamarix chinensis was rescued and restored in the areas with suitable groundwater depths in the water conveyance area. The Simpson index and Shannon–Wiener index increased significantly initially and then decreased slightly from 2015 to 2021, thereby indicating that as the frequency of water conveyance increased, the diversity decreased and then stabilized. The proportion of the area with high vegetation coverage increased from 29.2% in 2015 to 38.2% in 2021, and the proportion with extremely low vegetation coverage decreased, with a minimum of 26.7% in 2021. Vegetation coverage tended to improve.
- (3)
- From 2015 to 2021, the average RSEI value increased by 6.9% and the tendency toward ecological environment degradation halted. The proportion of the area with medium habitat status was the highest at 42.6% in 2015 and it increased to 49.8% in 2021. The proportion of the area with a poor grade habitat status decreased from 33.1% in 2015 to 23.9% in 2021. After nearly seven years of ecological water conveyance, the ecological environment quality improved to some extent below Wusiman in the middle reaches of the Tarim River, and the overall habitat conditions improved.
Author Contributions
The authors undertook different tasks for this paper. A.J. performed data processing and wrote the paper. A.J. and Z.W. analyzed the data. H.L. and F.C. and X.D. provided direction for the research work. H.L. designed the research and revised the paper. All authors have read and agreed to the published version of the manuscript.
Funding
This research was funded by the National Natural Science Foundation of China (52179028), the West Light Foundation of Chinese Academy of Sciences (2019-XBQNXZ-A-001), and the Xinjiang Water Conservancy Science and Technology Special Fund Project (XSKJ-2022-10).
Institutional Review Board Statement
Not applicable.
Informed Consent Statement
Not applicable.
Data Availability Statement
All data included in this study are available upon request by contacting the corresponding author.
Acknowledgments
We thank International Science Editing (http://www.internationalscienceediting.com (accessed on 22 July 2022)) for editing this manuscript.
Conflicts of Interest
The authors declare no conflict of interest.
References
- Adam, J.C.; Hamlet, A.F.; Lettenmaier, D.P. Implications of global climate change for snowmelt hydrology in the twenty-first century. Hydrol. Process. 2009, 23, 962–972. [Google Scholar] [CrossRef]
- Allen, M.R.; Ingram, W.J. Constraints on future changes in climate and the hydrologic cycle. Nature 2002, 419, 228–232. [Google Scholar] [CrossRef] [PubMed]
- Wang, Y.J.; Qin, D.H. Influence of climate change and human activity on water resources in arid region of Northwest China: An overview. Adv. Clim. Chang. Res. 2017, 8, 268–278. [Google Scholar] [CrossRef]
- Ni, Z.Y.; Zhang, E.L.; Sun, W.W.; Meng, X.Q.; Ning, D.L.; Jiang, Q.F.; Zheng, W.X. Response of the chironomid community to late Holocene climate change and anthropogenic impacts at Lake Ulungur, arid Central Asia. Quat. Int. 2022, 613, 91–100. [Google Scholar] [CrossRef]
- Ding, J.Y.; Zhao, W.W.; Daryanto, S.; Wang, L.X.; Fan, H.; Feng, Q.; Wang, Y. The spatial distribution and temporal variation of desert riparian forests and their influencing factors in the downstream Heihe River basin, China. Hydrol. Earth Syst. Sci. 2017, 21, 2405–2419. [Google Scholar] [CrossRef]
- Zhang, M.M.; Wang, S.; Fu, B.J.; Gao, G.Y.; Shen, Q. Ecological effects and potential risks of the water diversion project in the Heihe River Basin. Sci. Total Environ. 2018, 619, 794–803. [Google Scholar] [CrossRef]
- Chen, Y.N.; Chen, Y.P.; Xu, C.C.; Ye, Z.X.; Li, Z.Q.; Zhu, C.G.; Ma, X.D. Effects of ecological water conveyance on groundwater dynamics and riparian vegetation in the lower reaches of Tarim River, China. Hydrol. Process. 2010, 24, 170–177. [Google Scholar] [CrossRef]
- Zeng, Y.J.; Xie, Z.H.; Yu, Y.; Liu, S.; Wang, L.Y.; Jia, B.H.; Qin, P.H.; Chen, Y.N. Ecohydrological effects of stream-aquifer water interaction: A case study of the Heihe River basin, northwestern China. Hydrol. Earth Syst. Sci. 2016, 20, 2333–2352. [Google Scholar] [CrossRef]
- Zhao, W.W.; Ding, J.Y.; Wang, Y.P.; Jia, L.Z.; Cao, W.F.; Tarolli, P. Ecological water conveyance drives human-water system evolution in the Heihe watershed, China. Environ. Res. 2020, 182, 109009. [Google Scholar] [CrossRef]
- Huang, F.; Ochoa, C.G.; Chen, X.; Cheng, Q.B.; Zhang, D.R. An entropy-based investigation into the impact of ecological water diversion on land cover complexity of restored oasis in arid inland river basins. Ecol. Eng. 2020, 151, 105865. [Google Scholar] [CrossRef]
- Kopeé, D.; Michalska-Hejduk, D.; Krogulec, E. The relationship between vegetation and groundwater levels as an indicator of spontaneous wetland restoration. Ecol. Eng. 2013, 57, 242–251. [Google Scholar] [CrossRef]
- Jia, L.M.; Guo, Z.X.; Long, Y.H. Research advances in ecological groundwater level in arid areas. Ecol. Sci. 2015, 34, 187–193. [Google Scholar]
- Deng, M.J.; Zhou, H.Y.; Xu, H.L. Research on the ecological operation in the lower reaches of Tarim River based on water conveyance. Sci. Sin. Technol. 2016, 46, 864–876. [Google Scholar]
- Keram, A.; Halik, U.; Keyimu, M.; Aishan, T.; Mamat, Z.; Rouzi, A. Gap dynamics of natural Populus euphratica floodplain forests affected by hydrological alteration along the Tarim River: Implications for restoration of the riparian forests. Forest. Ecol. Manag. 2019, 438, 103–113. [Google Scholar] [CrossRef]
- Runyan, C.W.; D’odorico, P. Ecohydrological feedbacks between salt accumulation and vegetation dynamics: Role of vegetation groundwater interactions. Water Resour. Res. 2010, 46, W11561.1–W11561.11. [Google Scholar] [CrossRef]
- Yang, P.N.; Wu, B.; Wang, S.X.; Dong, X.G.; Liu, L. Research on irrigation schedule of cotton drip irrigation under plastic film based on the different ground water table in arid areas. Agric. Res. Arid Areas 2014, 32, 76–82. [Google Scholar]
- Hao, Y.Y.; Xu, X.; Huang, Q.Z.; Huang, G.H. Modeling soil water -salt dynamics and maize yield responses to groundwater depths and irrigations. Trans. Chin. Soc. Agric. Eng. 2014, 30, 128–136. [Google Scholar]
- Deng, M.J. An appraisal of remote-sensing monitoring on vegetation restoration and ecological water-conveying in the lower reaches of Tarim River. J. Glaciol. Geocryol. 2007, 29, 380–386. [Google Scholar]
- Chen, Y.J.; Li, W.H.; Liu, J.Z.; Li, J.Q. Analysis on the effects of water conveyance embankments on the ecological conservation in the middle reaches of the Tarim River. Arid Zone Res. 2008, 25, 550–555. [Google Scholar]
- Aishan, T.; Halik, Ü.; Betz, F.; Gärtner, P.; Cyffka, B. Modeling height–diameter relationship for Populus euphratica in the Tarim riparian forest ecosystem, Northwest China. J. For. Res. 2016, 27, 889–900. [Google Scholar] [CrossRef]
- Zhang, J.F.; Li, G.M.; Zhang, Y.; Bao, A.M.; Chen, X. Responses of groundwater levels to intermittent water transfer in the lower Tarim River. Chin. J. Geophys. 2012, 55, 622–630. [Google Scholar]
- Chen, Y.J.; Aikeremu, A.; Zhang, T.J.; Chen, Y.P.; Zhu, C.G.; Cheng, Y.; Liu, L.; Li, X.Y.; Zhang, Q.F. Effects of ecological water conveyance on groundwater depth in the lower reaches of Tarim River. Arid Land Geogr. 2021, 44, 651–658. [Google Scholar]
- Chui, T.F.M.; Low, S.Y.; Liong, S.Y. An ecohydrological model for studying groundwater-vegetation interactions in wetlands. J. Hydrol. 2011, 409, 291–304. [Google Scholar] [CrossRef]
- Danierhan, S.; Abudu, S.; Donghai, G. Coupled GSI-SVAT model with groundwater-surface water interaction in the riparian zone of Tarim River. J. Hydrol. Eng. 2013, 18, 1211–1218. [Google Scholar] [CrossRef]
- Lin, J.L.; Xiao, H.; Shen, Z.F.; Bai, J. Vegetation changes during the 2013–2018 period and its response to ecological water transport in the lower reaches of the Tarim River. Arid Zone Res. 2020, 37, 985–992. [Google Scholar]
- Bai, Y.F.; Xu, H.L.; Zhang, P.; Zhang, G.P.; Ling, H.B. Relation of Desert Vegetation Species Diversity and Aboveground Biomass to Groundwater Depth in the Lower Reaches of Tarim River. J. Desert Res. 2017, 37, 724–732. [Google Scholar]
- Xu, H.Q. A remote sensing urban ecological index and its application. J. Acta Ecol. Sin. 2013, 33, 7853–7862. [Google Scholar]
- Chen, Y.N.; Wubuli, W.; Abula, A.; Cheng, Y.; Chen, Y.P.; Hao, X.M.; Zhu, C.G.; Wang, Y. Monitoring and analysis of ecological benefits of water conveyance in the lower reaches of Tarim River in recent 20 years. Arid Land Geogr. 2021, 44, 605–611. [Google Scholar]
- Bai, J.; Li, J.L.; Bao, A.M.; Chang, C. Spatial-temporal variations of ecological vulnerability in the Tarim River Basin, Northwest China. J. Arid Land 2021, 13, 814–834. [Google Scholar] [CrossRef]
- Garssen, A.G.; Baattrup-Pedersen, A.; Voesenek, L.; Verhoeven, J.T.A.; Soons, M.B. Riparian plant community responses to increased flooding: A meta-analysis. Global Chang. Biol. 2015, 21, 2881–2890. [Google Scholar] [CrossRef]
- Deng, H.J.; Chen, Y.N. Influences of recent climate change and human activities on water storage variations in Central Asia. J. Hydrol. 2017, 544, 46–57. [Google Scholar] [CrossRef]
- Jackson, R.D. Spectral indices in N-Space. Remote Sens. Environ. 1983, 13, 409–421. [Google Scholar] [CrossRef]
- Matsushita, B.; Yang, W.; Chen, J.; Onda, Y.; Qiu, G.Y. Sensitivity of the Enhanced Vegetation Index (EVI) and Normalized Difference Vegetation Index (NDVI) to topographic effects: A case study in high-density cypress forest. Sensors 2007, 7, 2636–2651. [Google Scholar] [CrossRef] [PubMed]
- Huete, A.R. A soil-adjusted vegetation index (SAVI). Remote Sens. Environ. 1988, 25, 295–309. [Google Scholar] [CrossRef]
- Diallo, O.; Diouf, A.; Hanan, N.P.; Ndiaye, A.; Prevost, Y. AVHRR monitoring of savanna primary production in Senegal, West Africa: 1987–1988. Int. J. Remote Sens. 1991, 12, 1259–1279. [Google Scholar] [CrossRef]
- Tucker, C.J. Cover Maximum normalized difference vegetation index images for sub-Saharan Africa for 1983–1985. Int. J. Remote Sensing 1986, 7, 1383–1384. [Google Scholar] [CrossRef]
- Tucker, C.J. Soil spectral contribution to grass canopy spectral reflectance. Photogramm. Eng. Remote Sens. 1977, 43, 721–726. [Google Scholar]
- Didan, K. MOD13Q1 MODIS/Terra Vegetation Indices 16-Day L3 Global 250m SIN Grid V006. 2015, Distributed by NASA EOSDIS Land Processes DAAC. Available online: https://lpdaac.usgs.gov/products/mod13q1v006/ (accessed on 10 May 2022).
- Chen, J.; Jonsson, P.; Tamura, M.; Gu, Z.H.; Matsushita, B.; Eklundh, L. A simple method for reconstructing a high-quality NDVI time-series data set based on the Savitzky–Golay filter. Remote Sens. Environ. 2004, 91, 332–344. [Google Scholar] [CrossRef]
- Holben, B.N. Characteristics of maximum-value composite images from temporal AVHRR data. Int. J. Remote Sens. 1986, 7, 1417–1434. [Google Scholar] [CrossRef]
- Felix Landerer. TELLUS_GRAC_L3_CSR_RL06_LND_v04. Ver. RL06 v04. PO.DAAC, CA, USA. 2021. Available online: https://podaac.jpl.nasa.gov/dataset/TELLUS_GRAC_L3_CSR_RL06_LND_v04 (accessed on 10 May 2022).
- Yeh, P.J.F.; Swenson, S.C.; Famiglietti, J.S.; Rodell, M. Remote sensing of groundwater storage changes in Illinois using the gravity recovery and climate experiment (GRACE). Water Resour. Res. 2006, 42, 1–7. [Google Scholar] [CrossRef]
- Beaudoing, H.; Rodell, M. NASA/GSFC/HSL (2020), GLDAS Noah Land Surface Model L4 monthly 0.25 × 0.25 degree V2.1, Greenbelt, MD, USA, Goddard Earth Sciences Data and Information Services Center (GES DISC). Available online: https://disc.gsfc.nasa.gov/datasets/GLDAS_NOAH025_M_2.1/summary (accessed on 15 April 2022).
- Qin, D.H.; Yang, L.; Chen, L.C.; Duan, Y.F.; Jia, H.L.; Li, Z.P.; Ma, J.Q. A study on the characteristics and model of drought in Xinjiang based on multi-source data. Remote Sens. Nat. Resour. 2022, 34, 151–157. [Google Scholar]
- Huang, J.; Zhang, Y.; Wang, M.X.; Wang, F.; Tang, Z.; He, H. Spatial and temporal distribution characteristics of drought and its relationship with meteorological factors in Xinjiang in last 17 years. Acta Ecol. Sin. 2020, 40, 1077–1088. [Google Scholar]
- Zhang, H.; Song, J.Y.; Li, M.; Han, W.H. Eco-environmental quality assessment and cause analysis of Qilian Mountain National Park based on GEE. Chin. J. Ecol. 2021, 40, 1883–1894. [Google Scholar]
- Chen, W.; Huang, H.P.; Tian, Y.C.; Du, Y.Y. Monitoring and Assessment of the Eco-Environment Quality in the Sanjiangyuan Region based on Google Earth Engine. J. Geo-Inf. Sci. 2019, 21, 1382–1391. [Google Scholar]
- Zhai, J.Q.; Dong, Y.Y.; Qi, S.L.; Zhao, Y.; Liu, K.; Zhu, Y.N. Advances in Ecological Groundwater Level Threshold in Arid Oasis Regions. J. China Hydrol. 2021, 41, 7–14. [Google Scholar]
- Doble, R.; Simmons, C.; Jolly, I.; Walker, G. Spatial relationships between vegetation cover and irrigation-induced groundwater discharge on a semi-arid floodplain, australia. J. Hydrol. 2006, 329, 75–97. [Google Scholar] [CrossRef]
- Fu, J.Y.; Xu, H.L.; Zhao, X.F.; Bai, Y.; Wang, X.Y. Influences of Flooding on Degraded Riparian Vegetation along the Lower Tarim River. J. Desert Res. 2014, 34, 60–66. [Google Scholar]
- Zhang, P.; Xu, H.L.; Ling, H.B.; Zhao, X.F.; Zhang, P. Variation of Vegetation Communities under Different Flooding Frequency in the Lower Reaches of the Tarim River. Arid Zone Res. 2016, 33, 1242–1248. [Google Scholar]
- Ling, H.B.; Xu, H.L.; Guo, B.; Deng, X.Y.; Zhang, P.; Wang, X.Y. Regulating water disturbance for mitigating drought stress to conserve and restore a desert riparian forest ecosystem. J. Hydrol. 2019, 572, 659–670. [Google Scholar] [CrossRef]
- Bai, Y.; Xu, H.L.; Liu, X.H.; Ling, H.B. Spatial Distribution Characteristics and Ecological Protection of the Desert Riparian Forest in the Mainstream of the Tarim River. J. Nat. Resour. 2013, 28, 776–785. [Google Scholar]
- Keyimu, M.; Halik, Ü.; Betz, F.; Dulamsuren, C. Vitality variation and population structure of a riparian forest in the lower reaches of the Tarim River, NW China. J. For. Res. 2018, 29, 749–760. [Google Scholar] [CrossRef]
- Zhou, B.; Yang, H.M.; Hu, S.J.; Xiong, H.G. Effect of river-flooding on soil physical chemical properties and vegetation. Arid Land Geogr. 2010, 33, 442–448. [Google Scholar]
- Chen, H.Y.; Chen, Y.N. Changes of desert riparian vegetation along the main stream of Tarim River, Xinjiang. Chin. J. Ecol. 2015, 34, 3166–3173. [Google Scholar]
Figure 1.
Overview of the study area. (a) is the ecological water conveyance in the Populus euphratica forest area, and (b) is the ecological water conveyance in the sparse vegetation area.
Figure 1.
Overview of the study area. (a) is the ecological water conveyance in the Populus euphratica forest area, and (b) is the ecological water conveyance in the sparse vegetation area.

Figure 2.
Technical roadmap.

Figure 3.
Overview of the study area spatial distribution of groundwater reserves in the mainstream of Tarim River from 2015 to 2021.
Figure 3.
Overview of the study area spatial distribution of groundwater reserves in the mainstream of Tarim River from 2015 to 2021.

Figure 4.
Spatial distribution of TVDI grades in the mainstream area of the Tarim River from 2015 to 2021.
Figure 4.
Spatial distribution of TVDI grades in the mainstream area of the Tarim River from 2015 to 2021.

Figure 5.
Spatial variation distribution of TVDI in the mainstream area of the Tarim River from 2015 to 2021.
Figure 5.
Spatial variation distribution of TVDI in the mainstream area of the Tarim River from 2015 to 2021.

Figure 6.
Variation of groundwater depth in the mainstream area of the Tarim River in 2021.

Figure 7.
Spatial distribution of vegetation coverage grades in the mainstream area of the Tarim River from 2015 to 2021.
Figure 7.
Spatial distribution of vegetation coverage grades in the mainstream area of the Tarim River from 2015 to 2021.

Figure 8.
Changes in the proportion of vegetation coverage grades in the mainstream area of the Tarim River from 2015 to 2021.
Figure 8.
Changes in the proportion of vegetation coverage grades in the mainstream area of the Tarim River from 2015 to 2021.

Figure 9.
Spatial variation distribution of vegetation coverage in the mainstream area of the Tarim River from 2015 to 2021.
Figure 9.
Spatial variation distribution of vegetation coverage in the mainstream area of the Tarim River from 2015 to 2021.

Figure 10.
Temporal and spatial variation characteristics of species diversity in the mainstream area of the Tarim River. (a1,a2) are the upper reaches of the mainstream area of the Tarim River, (b1,b2) are the middle reaches of the mainstream area of the Tarim River, and (c1,c2) are the lower reaches of the mainstream area of the Tarim River.

Figure 11.
Spatial distribution of RSEI in the mainstream area of the Tarim River.

Figure 12.
Spatial variations in RSEI values in the mainstream area of the Tarim River from 2015 to 2021.
Figure 12.
Spatial variations in RSEI values in the mainstream area of the Tarim River from 2015 to 2021.


Table 1.
Data and sources used by the Institute.
| Ecological Indicators | Time Period | Time Resolution | Spatial Resolution | Data Source |
|---|---|---|---|---|
| Groundwater reserves | 2015–2021 | 1 month | 0.25° | GRACE Level-2 (RL06)/GLDAS |
| TVDI | 2015–2021 | 16 days/8 days | 250 m/1000 m | MOD13Q1/MOD11A2 |
| NDVI | 2015–2021 | 16 days | 250 m | MOD13Q1 |
| Measured groundwater level | June 2021–September 2021 | — | — | 42 groundwater monitoring wells |
| RSEI | 2015–2021 | 8 days/8 days/16 days | 500 m/1000 m/500 m | MOD09A1/MOD11A2/MOD13A1 |
Table 2.
Monitoring statistics of groundwater storage changes in the mainstream of Tarim River from 2015 to 2021 (unit: %).
Table 2.
Monitoring statistics of groundwater storage changes in the mainstream of Tarim River from 2015 to 2021 (unit: %).
| Changes in Groundwater Reserves | 2015 | 2016 | 2017 | 2018 | 2019 | 2020 | 2021 |
|---|---|---|---|---|---|---|---|
| mm | |||||||
| <−60 | |||||||
| −60~−30 | 3 | ||||||
| −30~0 | 3.1 | 3.1 | 17.2 | 7.8 | 4.7 | ||
| 0~30 | 7.8 | 3.1 | 12.5 | 4.7 | 23.4 | 14.1 | |
| 30~60 | 39.1 | 3.1 | 7.8 | 28.1 | 3.1 | ||
| 60~90 | 42.2 | 18.8 | 15.6 | 51.6 | 17.2 | 17.2 | 4.7 |
| 90~120 | 4.7 | 45.3 | 39.1 | 21.9 | 26.6 | 6.3 | 10.9 |
| 120~150 | 29.7 | 29.7 | 15.6 | 28.1 | |||
| 150~180 | 9.4 | 23.4 | 34.4 | ||||
| 180~210 | |||||||
| 210~240 | |||||||
| >240 | 3.1 | 3.1 | 3.1 | 3.1 | 3.1 | 3.1 | 3.1 |
Table 3.
Drought monitoring statistics of the mainstream of the Tarim River from 2015 to 2021 (unit: %).
Table 3.
Drought monitoring statistics of the mainstream of the Tarim River from 2015 to 2021 (unit: %).
| Date | Light Drought | Moderate Drought | Severe Drought | Extreme Drought |
|---|---|---|---|---|
| 2015 | 10.4 | 21.4 | 57 | 11.2 |
| 2016 | 12.3 | 26.7 | 50.8 | 10.3 |
| 2017 | 13.9 | 22.9 | 55.4 | 7.8 |
| 2018 | 12.7 | 29.7 | 52.6 | 5.1 |
| 2019 | 10.3 | 29 | 50.1 | 10.6 |
| 2020 | 5.3 | 28.8 | 58.5 | 7.4 |
| 2021 | 11.8 | 22.3 | 54.9 | 11 |
Table 4.
Monitoring statistics of vegetation coverage in the mainstream area of the Tarim River from 2015 to 2021 (Unit: %).
Table 4.
Monitoring statistics of vegetation coverage in the mainstream area of the Tarim River from 2015 to 2021 (Unit: %).
| Date | Extremely Low Vegetation Coverage | Low Vegetation Coverage | Medium Vegetation Coverage | High Vegetation Coverage |
|---|---|---|---|---|
| 2015 | 35.8 | 17.2 | 17.9 | 29.2 |
| 2016 | 35.4 | 18.5 | 17.1 | 28.9 |
| 2017 | 35 | 17.1 | 15.9 | 32.1 |
| 2018 | 31.4 | 15.1 | 16.7 | 36.8 |
| 2019 | 30.5 | 14.8 | 17.5 | 37.2 |
| 2020 | 27.6 | 15.7 | 19.3 | 37.4 |
| 2021 | 26.7 | 15.4 | 19.8 | 38.2 |
Table 5.
Proportion of RSEI area at different levels in the mainstream area of the Tarim River from 2015 to 2021 (unit: %).
Table 5.
Proportion of RSEI area at different levels in the mainstream area of the Tarim River from 2015 to 2021 (unit: %).
| Date | Poor | Moderate | Good | Excellent |
|---|---|---|---|---|
| 2015 | 33.1 | 42.6 | 22.0 | 2.2 |
| 2016 | 22.6 | 49.8 | 23.8 | 3.8 |
| 2017 | 29.3 | 41.0 | 27.0 | 2.6 |
| 2018 | 22.5 | 46.7 | 26.3 | 4.5 |
| 2019 | 25.0 | 46.6 | 25.1 | 3.3 |
| 2020 | 29.0 | 44.1 | 24.5 | 2.3 |
| 2021 | 23.9 | 49.8 | 23.6 | 2.7 |
Publisher’s Note: MDPI stays neutral with regard to jurisdictional claims in published maps and institutional affiliations. |
© 2022 by the authors. Licensee MDPI, Basel, Switzerland. This article is an open access article distributed under the terms and conditions of the Creative Commons Attribution (CC BY) license (https://creativecommons.org/licenses/by/4.0/).
Share and Cite
MDPI and ACS Style
Jiao, A.; Wang, Z.; Deng, X.; Ling, H.; Chen, F. Eco-Hydrological Response of Water Conveyance in the Mainstream of the Tarim River, China. Water 2022, 14, 2622. https://doi.org/10.3390/w14172622
AMA Style
Jiao A, Wang Z, Deng X, Ling H, Chen F. Eco-Hydrological Response of Water Conveyance in the Mainstream of the Tarim River, China. Water. 2022; 14(17):2622. https://doi.org/10.3390/w14172622
Chicago/Turabian StyleJiao, Ayong, Zikang Wang, Xiaoya Deng, Hongbo Ling, and Fulong Chen. 2022. "Eco-Hydrological Response of Water Conveyance in the Mainstream of the Tarim River, China" Water 14, no. 17: 2622. https://doi.org/10.3390/w14172622
Note that from the first issue of 2016, this journal uses article numbers instead of page numbers. See further details here.