
Modelling Infiltration Systems’ Performance for Efficient, Sustainable or Circular Urban Water Drainage

Department of Civil, Environmental and Architectural Engineering (ICEA), University of Padua, I-35131 Padua, Italy
*
Author to whom correspondence should be addressed.
Water 2022, 14(17), 2620; https://doi.org/10.3390/w14172620
Submission received: 2 August 2022
/
Revised: 22 August 2022
/
Accepted: 23 August 2022
/
Published: 25 August 2022
(This article belongs to the Section Urban Water Management)
Abstract
:A typical infiltration system (IS) consists of an urban sub-catchment that works in synergy with an engineered pervious sub-catchment (e.g., a trench). ISs for sustainable urban drainage meet multiple design objectives: returning water resources to the environment (circularity) and reducing hydraulic risk. ISs, by necessity, are realized in the public spaces which belong to historical city centers, industrial zones, densely populated urban areas or areas of recent urbanization. Available space conditions the shape of impervious drainage sub-basins and downstream trenches that hold and release runoff volume to the subsoil. Catchment shape and rainfall intensity have received relatively less attention in the designing and decision-making processes than rainfall volume. A hydrodynamic model (HM) offers the opportunity to systematically investigate the efficiency of ISs as shape and rain intensity change, overcomes the limits of the widespread bucket modelling approach, which is narrowly focused on rain volume, trench storage capacity and exfiltration capacity, and links the shape of IS to its efficiency and to the residual risk that occurs when events of intensity greater than the design event occur. The results of a systematic sensitivity analysis, conducted by the use of HM, suggest new criteria for evaluating whether ISs are suitable for achieving the design objectives, within the constraints of the available urban public space.
1. Introduction
Cities represent one of the greatest planetary challenges for the 21st century, where opportunities and critical issues emerge as the population becomes increasingly concentrated in urban areas [1]. Climate, urban development, engineering practices and other socio-economic factors increase water infrastructures’ vulnerability to natural hazards [2]. Urban water management should be based on the urban water cycle, to design sustainable and resilient infrastructure [3]. Urban growth in Italy is characterized by non-linear dynamics [4]. Between 1960 and 1970, densely populated municipalities located in the hinterland of many historic centers sprung up as a result of economic growth [5] and only recently have urban drainage systems begun to slowly shift from combined to separate sewers [6], although the environmental risk of uncontrolled spills is still widely spread across the territory.
Right at the beginning of the 2000s, with changes in patterns of rainfall variability [7] and the increasing risk of flood [8,9], awareness of sustainable urban growth [10] and resources management [11] translated into the principles of circular economy [12].
Nature Based Solution (NBS) [13] have been largely promoted as instruments to mitigate the negative anthropogenic footprint on the environment [14,15] and to achieve a range of co-benefits that are less easily quantified at the socioeconomic level [16,17]. NBSs improve urban drainage system performance [18] by meeting one or more of the following objectives: water quality volume treatment, channel protection, extreme flow protection [19]. The design objective dictates the return time of the design rainfall [20].
Among NBS for sustainable urban drainage, Infiltration Systems (ISs) [21] are defined here as the combination of an impervious sub-catchment and a pervious infiltration sub-catchment (e.g., an infiltration trench), following the approach of the LID (Low Impact Development) module of the United States Environmental Protection Agency’s Storm Water Management Model (SWMM) [22].
Static design of ISs focuses on a single rain event with predefined duration and depth [23]. Probabilistic analysis [24,25] focusses on multiple rain events considering the probability that storage capacity may be only partially available when two rainfall events occur without fully restoring storage capacity by exfiltration in the interval between the two.
Static [23] and probabilistic [25] design focus on trench storage capacity, exfiltration capacity and rain volume, and therefore are insensitive to any change in rainfall duration that is expected to shorten and challenge drainage systems with high intensity rain events as the climate changes [26,27]. The focus of design and modelling ISs cannot be restricted to the size of the infiltration sub-catchment (a trench in the examples discussed here) and of the storage capacity of the underlying engineered soil, as runoff production influences the depth of water above the pervious and the impervious sub-catchments [28], and therefore, the dynamics of the infiltration process and the capacity of the IS to reduce runoff water volume and hydraulic risk [18,29]. There is a gap related to the response of the drainage catchment to intense rainfall events and the synergy with the trench.
Circularity is often invoked to curb the reduction of natural capital scarcity. ISs help to close the hydrological cycle in the urban environment by restoring the connection between surface and groundwater bodies, therefore restoring environmental water resources. The definition of IS efficiency proposed here is based on the principles of circular economy and considers the ratio of infiltration volume to runoff volume [30].
Limited space can be an obstacle to the implementation of NBSs in urban areas, especially in the inner city where land is a scarce and expensive resource [31]. Available urban surfaces constrain the shape of the IS to be placed there. Long and narrow infiltration trenches are often built along highways or major roads [32], while in urban areas the shape can be of various types [33]. Whether the public space available in an urban area is suitable for the implementation of efficient IS is still a question that deserves an answer not yet found in the literature.
To evaluate shape-dependent efficiency of ISs (environmental objective) and residual risk resulting from non-design rainfall events (socio-economic objective), a simple hydrodynamic model (HM) based on three water balance equations was implemented: the first balance equation concerns the volume of water standing on the impervious surface, the second the volume of water on the trench surface, and the third the volume of water infiltrating within the engineered porous medium below the trench surface. The HM approach is here counterposed to the widespread bucket modeling approach that is based on available storage volume and rainfall volume. The HM was implemented by using Matlab (2010) [34] and allowed the code to simulate the behavior of the IS for a large number of shape factors and rainfall intensity values (it was precisely to do this that Matlab programming was deemed appropriate). Conceptually, the HM resembles the hydrodynamic approach of SWMM’s LID module [35], but it can easily be used to perform sensitivity analysis on shape and rain intensity that SWMM is not intended for. The HM for rectangular ISs and uniform rain intensities has allowed us to systematically investigate the relationship between shape, rainfall intensity, and efficiency and, in doing so, it fills the gap related to the response of the drainage basin to intense rainfall events and the synergy with the trench.
2. Material and Methods
In this section, static and dynamic modeling approaches are juxtaposed. The two modeling approaches are based on bucket modelling (the former) and hydrodynamic modeling (the latter). These are two established and well-known approaches, which are compared in the context of a sensitivity analysis to changes in IS’s shape and rain intensity. The schematic representation of the IS adopted here is shown in Figure 1. The IS comprises an impervious sub-catchment with surface which transforms precipitation into runoff and a pervious sub-catchment with surface where infiltration occurs. Two definitions of efficiency in the circular economy framework applied to urban water drainage are provided, one for each modeling approach.
2.1. Static Design
The detention volume provided by an infiltration trench is evaluated by considering a maximum ponding depth over the trench surface, and assuming that during rainfall water exfiltrates from the trench to the surrounding soil according to the effective infiltration rate accounting for flow occurring at the bottom and laterally. The rainfall water volume is where is design rainfall depth, is the impervious surface of the drainage catchment and is the trench surface. Based on the design objective, the return time () is assigned to the design rain depth .
Infiltration trenches should be designed to empty within a maximum draw down time [23]. Therefore, the maximum allowable trench depth is:
and the minimum allowable surface area of the trench is:
If the rainfall is uniform, is its duration and trench depth is , by placing the rainfall volume equal to the retention volume, the trench surface area results:
In Equation (3), is the porosity of the engineered soil.
This widespread static design method does not discriminate among ISs with different shapes, which means with diverse shape factors .
2.2. Hydrodynamic Model
Below the pervious sub-catchment, the engineered soil layer has storage capacity , where is the porosity of the engineered soil. Exfiltration to the surrounding natural soil occurs with rate . A spillway diverts excess flow to the drainage system or to a water body. The design rainfall is uniform with intensity and duration . The scaling factor of lengths is the water depth . The rainfall duration is used as time scale and the product is used to scale flow.
The hydrodynamic model (HM) implemented here consists of three water balance equations, which describe the temporal variations of the volumes over the impervious sub-catchment, over the infiltration surface and within the engineered soil; , are the water depths over the impervious sub-catchment and over the trench, respectively; is the depth of the wetting front during infiltration and the water depth within the trench during exfiltration, after rainfall is the trench depth.
The dimensionless water balance over the impervious sub-catchment is
The dimensionless outgoing flow is evaluated according to the Manning flow equation
where is the slope of the impervious sub-catchment and is the Manning coefficient.
In the case studies presented below, . Ponding over the trench surface can occur up to a maximum water depth . When ponding depth is overflow begins.
The dimensionless water balance equation over the NBS is
where
where is the discharge coefficient.
Within the trench, the dimensionless water balance equation during filling time is
or else
where dimensionless
is the dimensionless flow infiltrating the engineered soil. is estimated according to the Green-Ampt model (see e.g., [35]). Conservatively, the initial suction head inside the engineered soil was set as atmospheric (zero value); is the saturated conductivity of the engineered soil.
During exfiltration, the mass balance within the trench is reduced to:
2.3. Efficiency
Efficiency according to a static approach can be evaluated as the ratio of the storage capacity of the trench to rainfall volume
Efficiency is evaluated, according to the principle of HM, as the ratio of infiltration volume to precipitation volume as follows
where is the simulation time (the sum of infiltration and dry-out time).
3. Results
3.1. Case Study 1
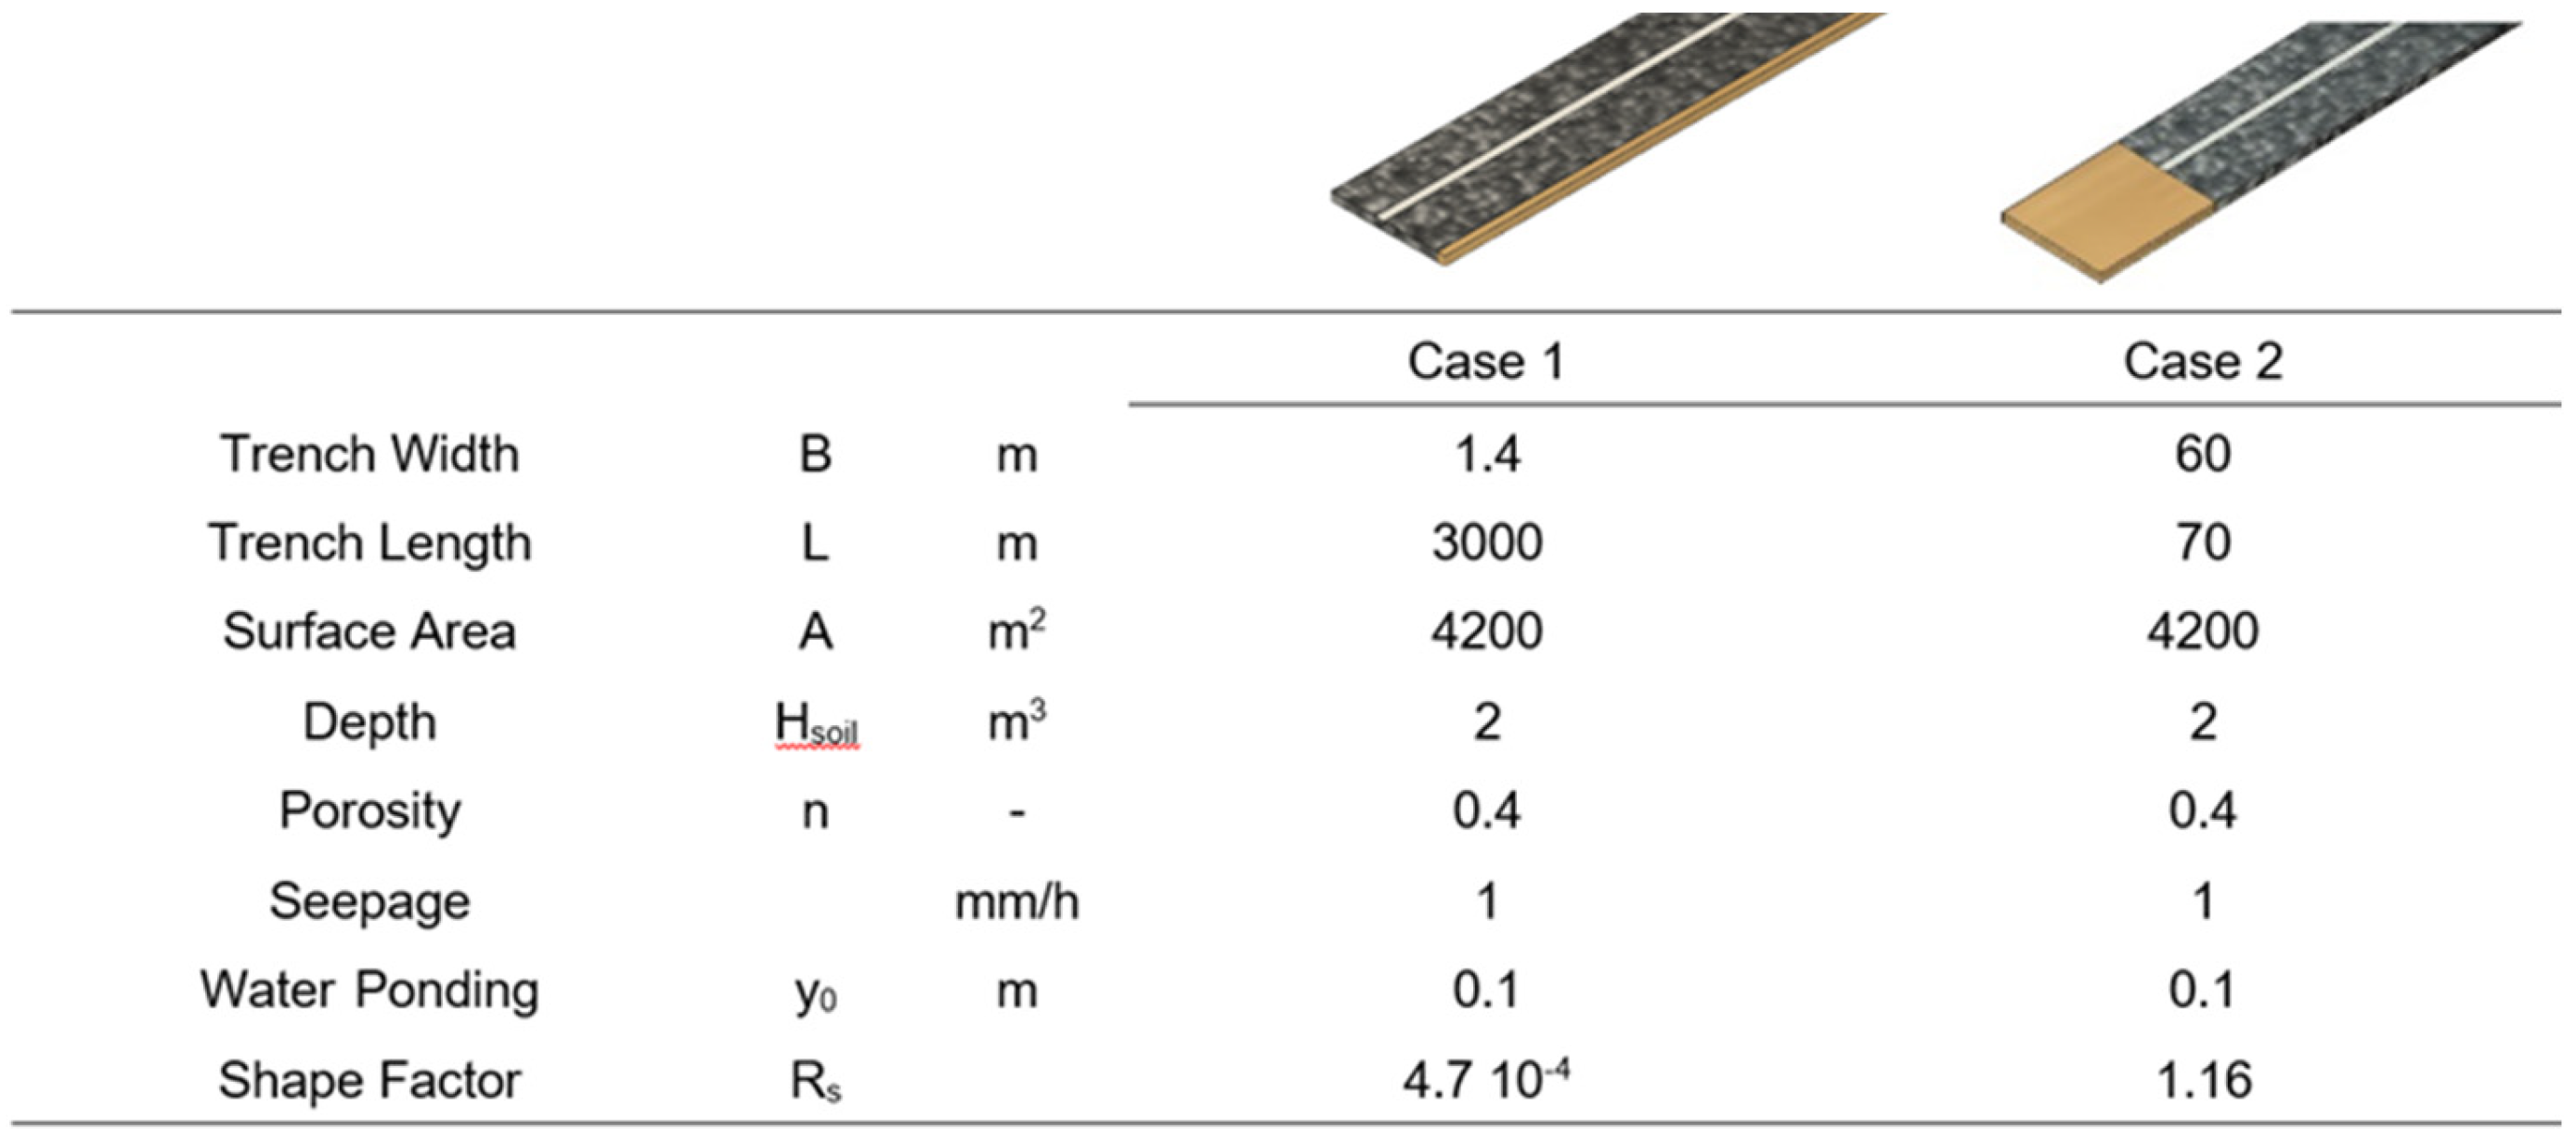
An infiltration trench is designed to retain runoff produced on the runway of Verona Catullo Airport. The impervious sub-catchment is rectangular, 3000 m long and 60 m wide, with slope toward the trench.
Maximum annual rainfall depths recorded at the rain gauge located in San Pietro in Cariano (VR) (45.505435, 10.898913) from 2 December 1991 to 14 December 2021 were statistically processed [36] to obtain Depth Duration Frequency (DDF) curves for different return times:
where is the maximum annual rainfall depth with return time and duration ; and are fitting parameters, reported in Table 1. Rain intensity was derived from (18) as , assuming that and have the same .
The exfiltration rate is . The saturated conductivity of the engineered part is . Maximum allowed ponding depth over the trench is: .1.
The design rainfall is with duration and . Based on the static design criteria (3), for in (Equation (3)), was evaluated and set conservatively at with area ratio . The infiltration trench fulfills the condition on the draw down time and empties within (Equations (1) and (2)).
Below, two IS-type technical solutions (Figure 2) are proposed for comparison. The first corresponds to a long trench with shape factor , while the second consists of a nearly square area made downstream of the runaway, with shape factor .
For rainfall durations min the efficiency of the proposed solutions (Equation (17)) is shown in Table 1.
The volume and intensity of rainfall both influence E, therefore the static approach is only partially valid. From a circular economy perspective, where the purpose is to maximize the amount of runoff water that infiltrates, long, narrow trenches are less efficient than square trenches, demonstrating the relevance of the IS’s form, to which the static model is insensitive.
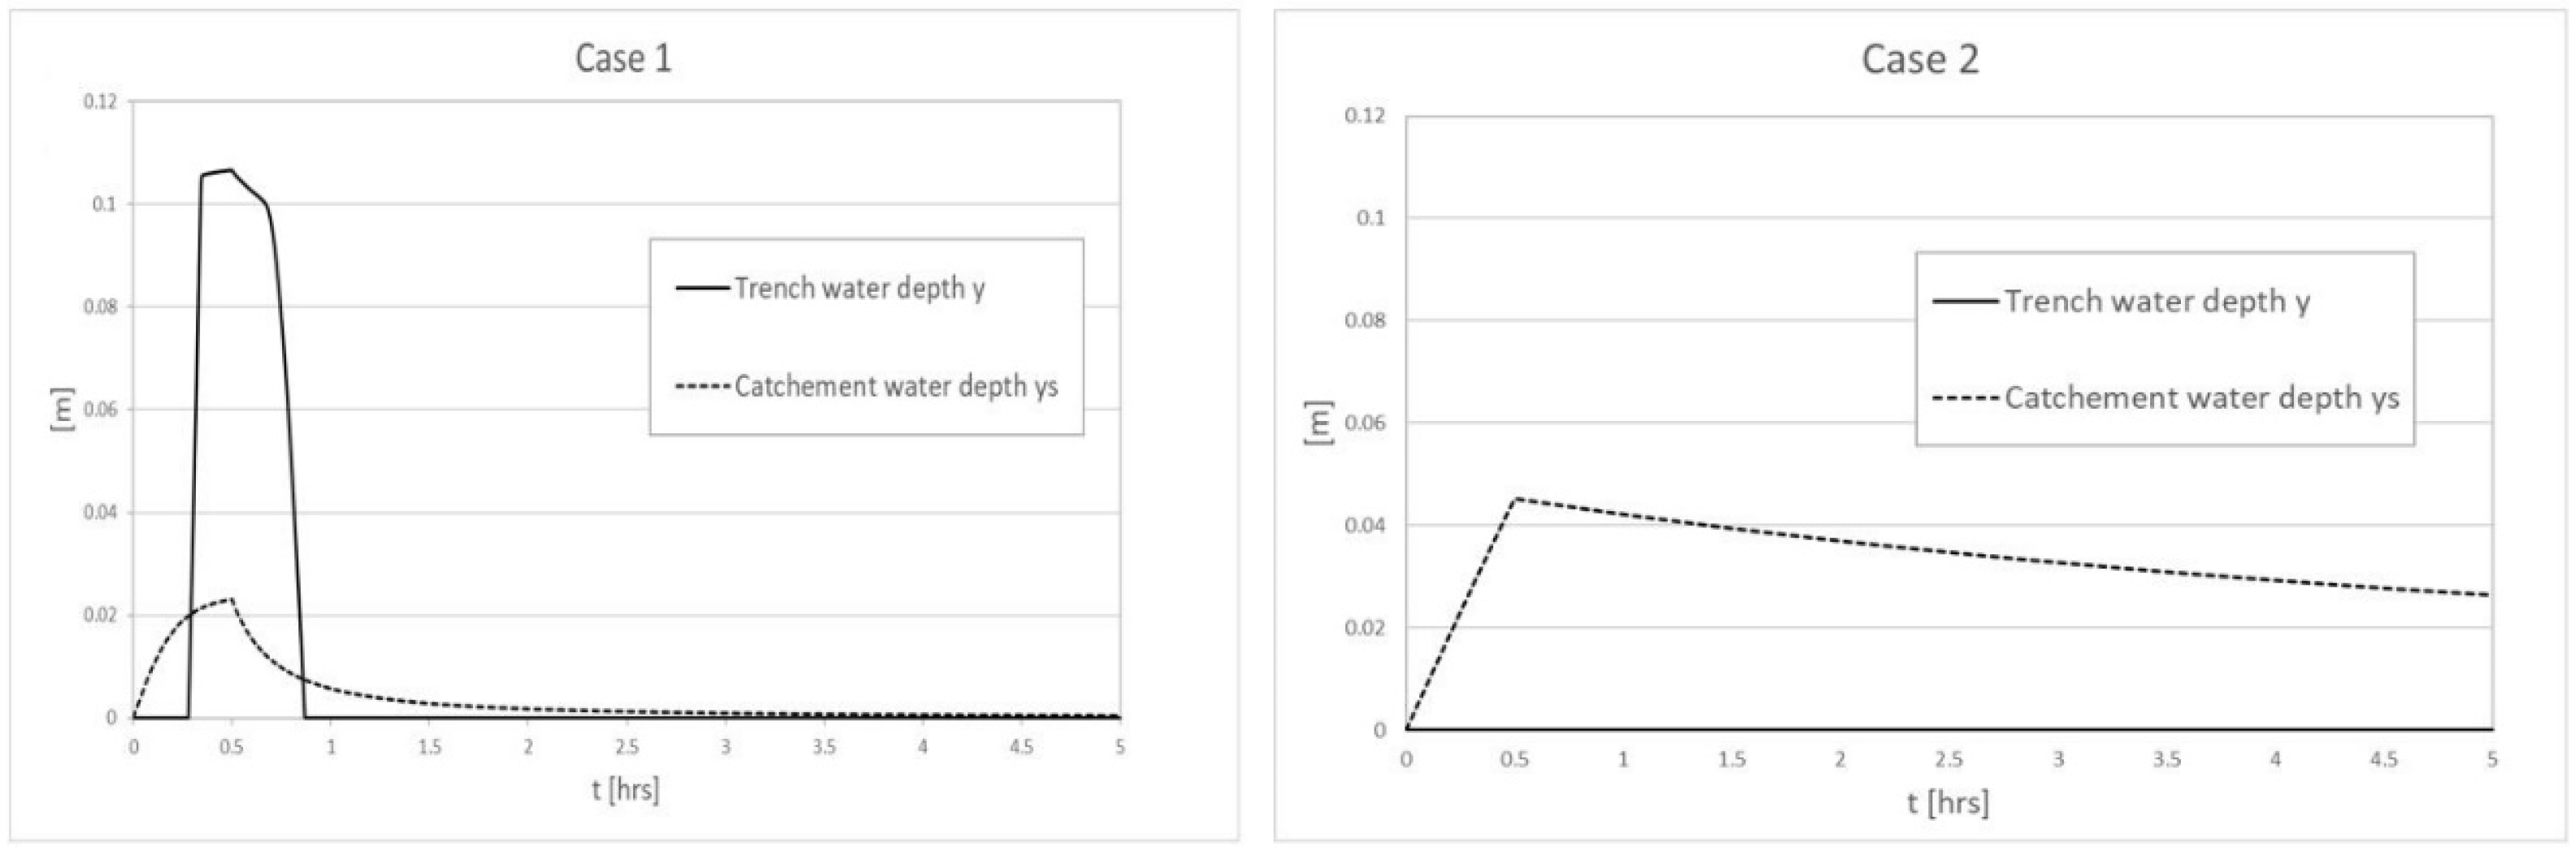
For and yrs, the depth of water on the runoff and infiltration trench was estimated numerically by integrating the HM. The results are shown in Figure 3.
The time dependent water depth over the runaway and the trench () are shown in Figure 3 for (left) and (right) corresponding to (see Table 1), which means that the volume of runoff infiltrating is much larger in the nearly square infiltration trench, at the expense of a long lasting ponding depth (Figure 3) which facilitates the infiltration process but turns the IS system into a hybrid IS and detention system. Obviously, ponding should be avoided near a drainage area where drainage is expected to occur as quickly as possible.
3.2. Case Study 2
An IS is designed to treat the water quality volume produced by a rain event with . The design rain depth is and the duration is . The IS is consistent with the schematic representation shown in Figure 1 with , , and . According to the static design criterion (Equation (3)), the trench area must be .
In the following examples, the shape of the IS is changed in the range . As increases, decreases and both the drainage catchment and the trench become more elongated, since the length of the drainage basin is evaluated as . The ratio assumes the significance of the shape factor of the entire IS.
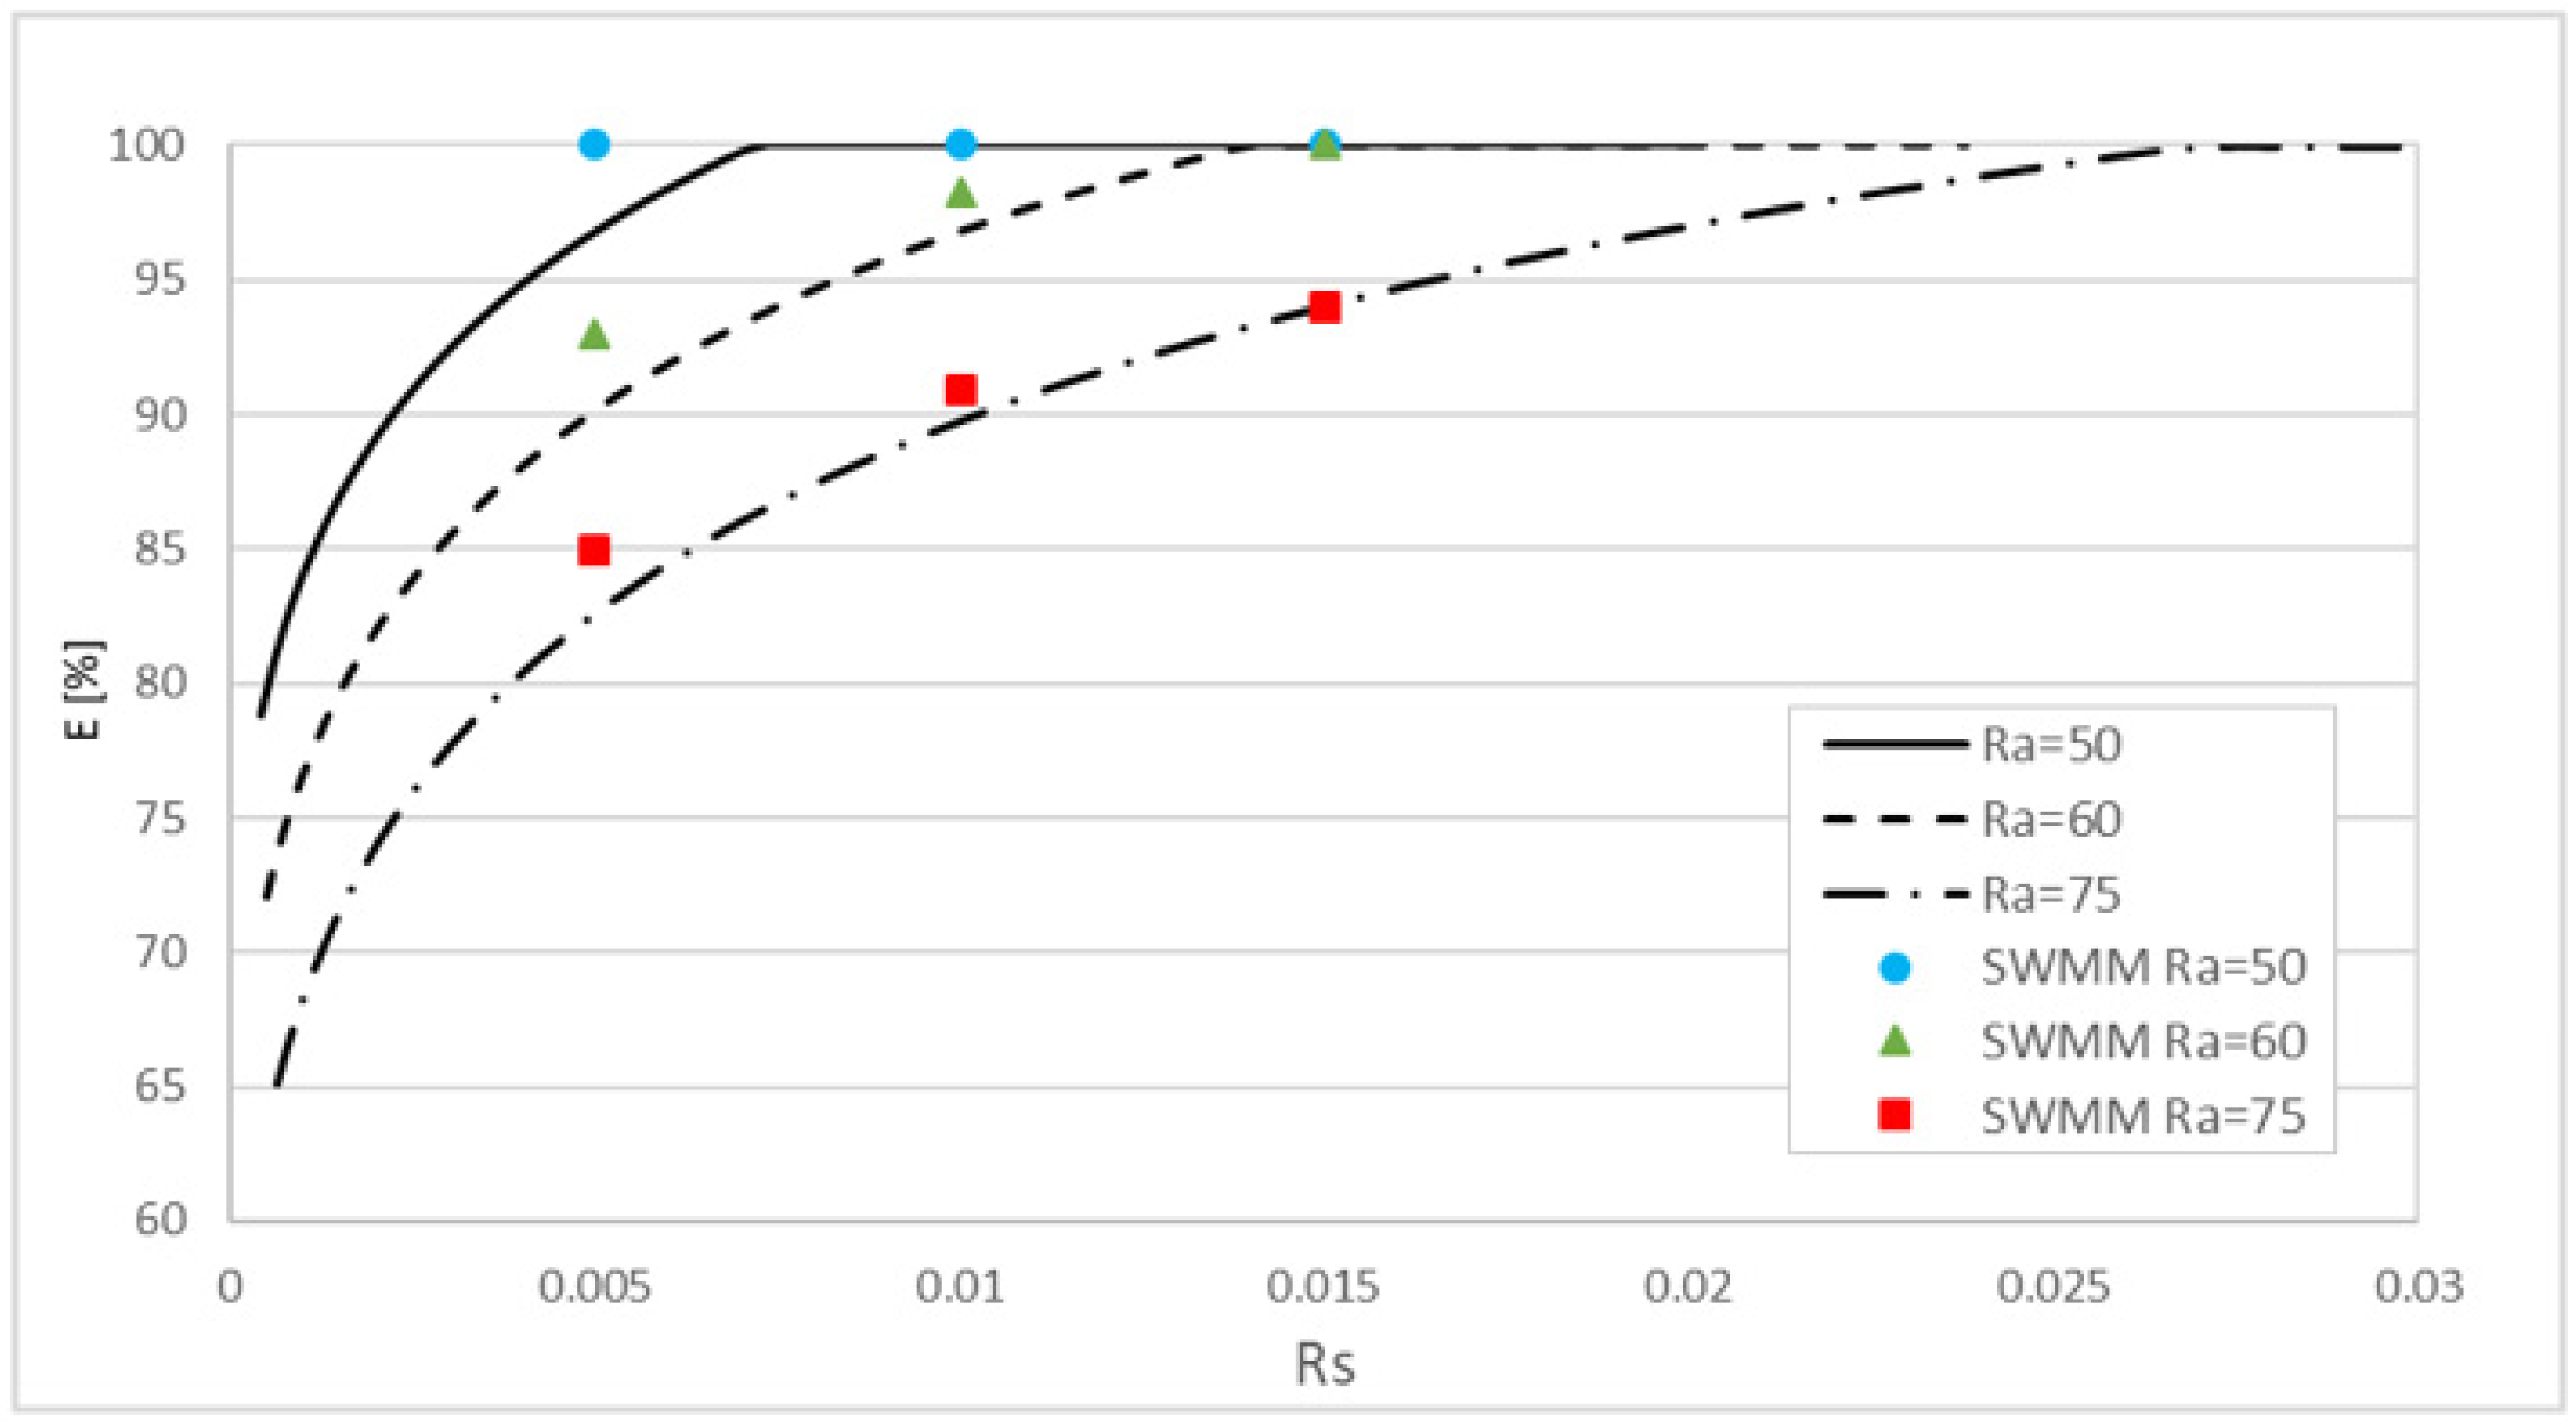
In Figure 4 efficiency (Equation (17)) is evaluated as a function of for three different area ratios: , corresponding to and , while the surface of the impervious drainage sub-catchment is kept constant: .
Efficiency increases with up to a maximum which is achieved for a threshold . Less efficient trenches with higher (lower ) reach maximum efficiency for a higher threshold , suggesting that shape may compensate for the lack of available infiltrating surface area.
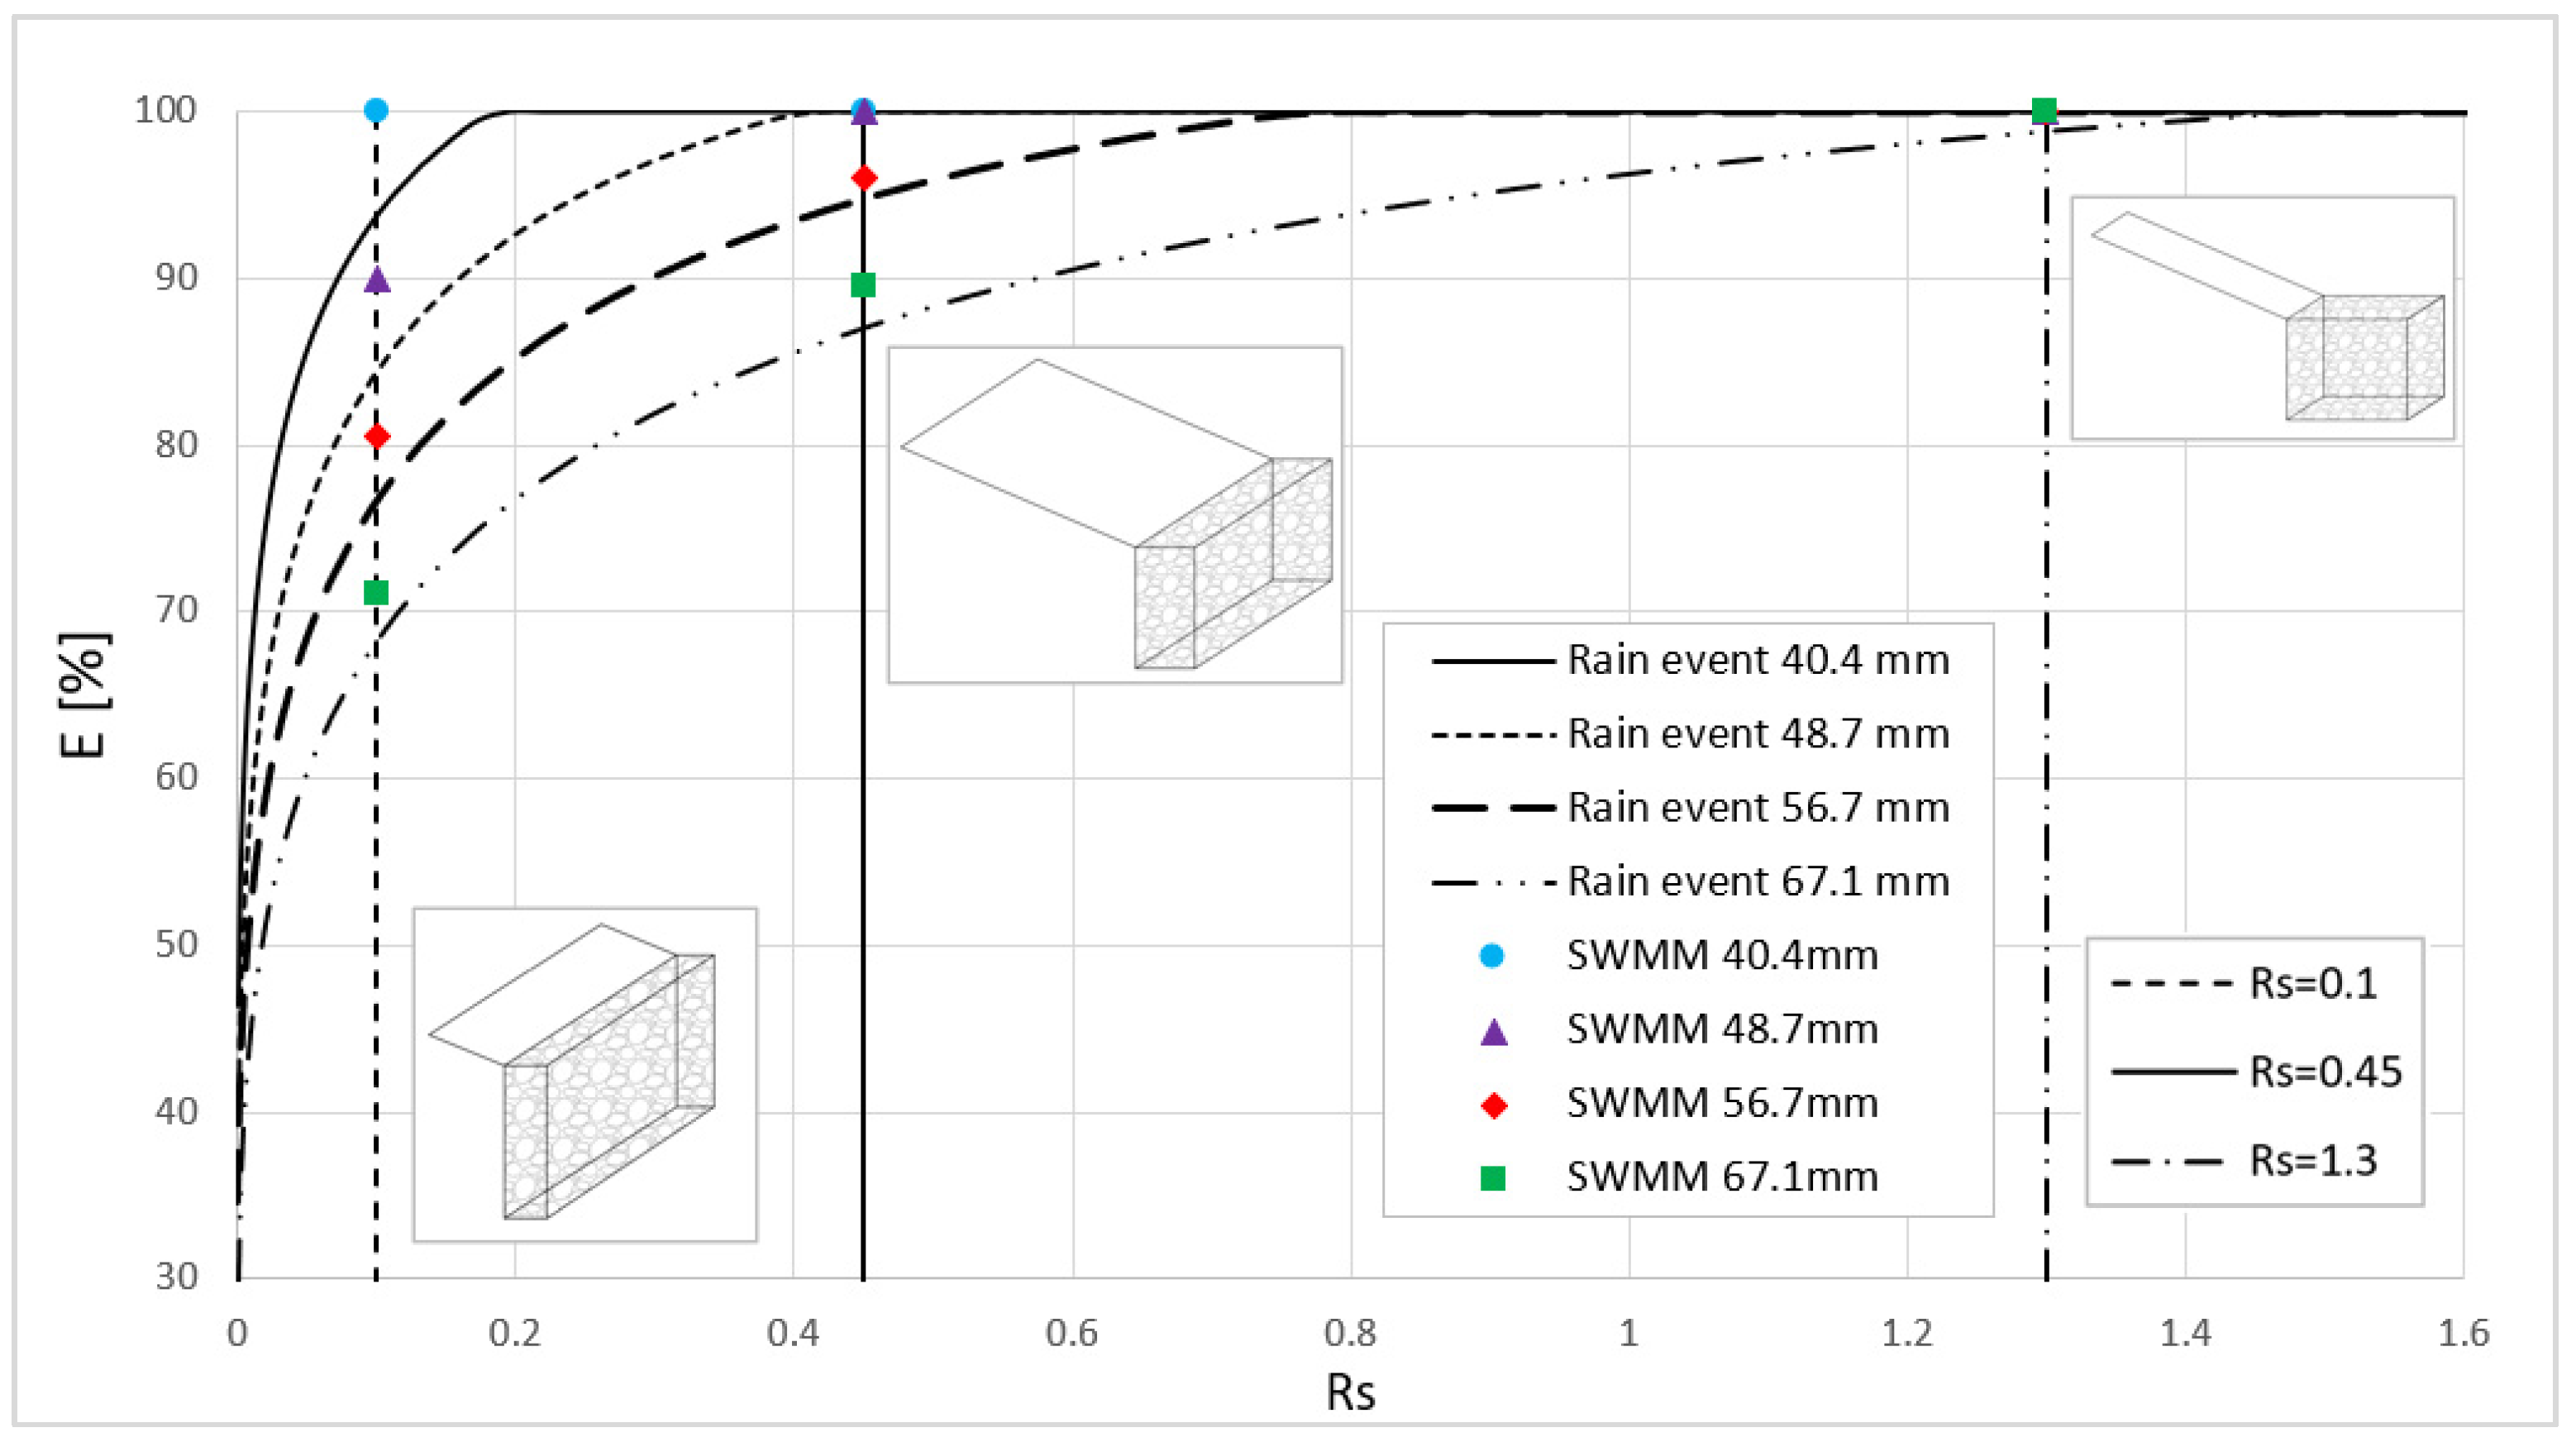
IS designed to treat water quality volumes may provide co-benefits in terms of reduction of hydraulic risk that are evaluated by estimating as a function of shape factor , for rain events with , namely: and , based on DDF curve (Equation (18) with parameters in Table 1). Results are shown in Figure 5.
The threshold which separates solutions with shape-dependent efficiency from those with maximum efficiency increases with . When , maximum efficiency is achived by trenches with threshold .
For comparison purposes, of a limited number of solutions was also evaluated with the LID module of SWMM [35] (Figure 4 and Figure 6, symbols). There is good agreement between the results of SWMM and those of our model. Both show that the efficiency is strongly influenced by the form factor and rainfall intensity.
3.3. Case Study 3
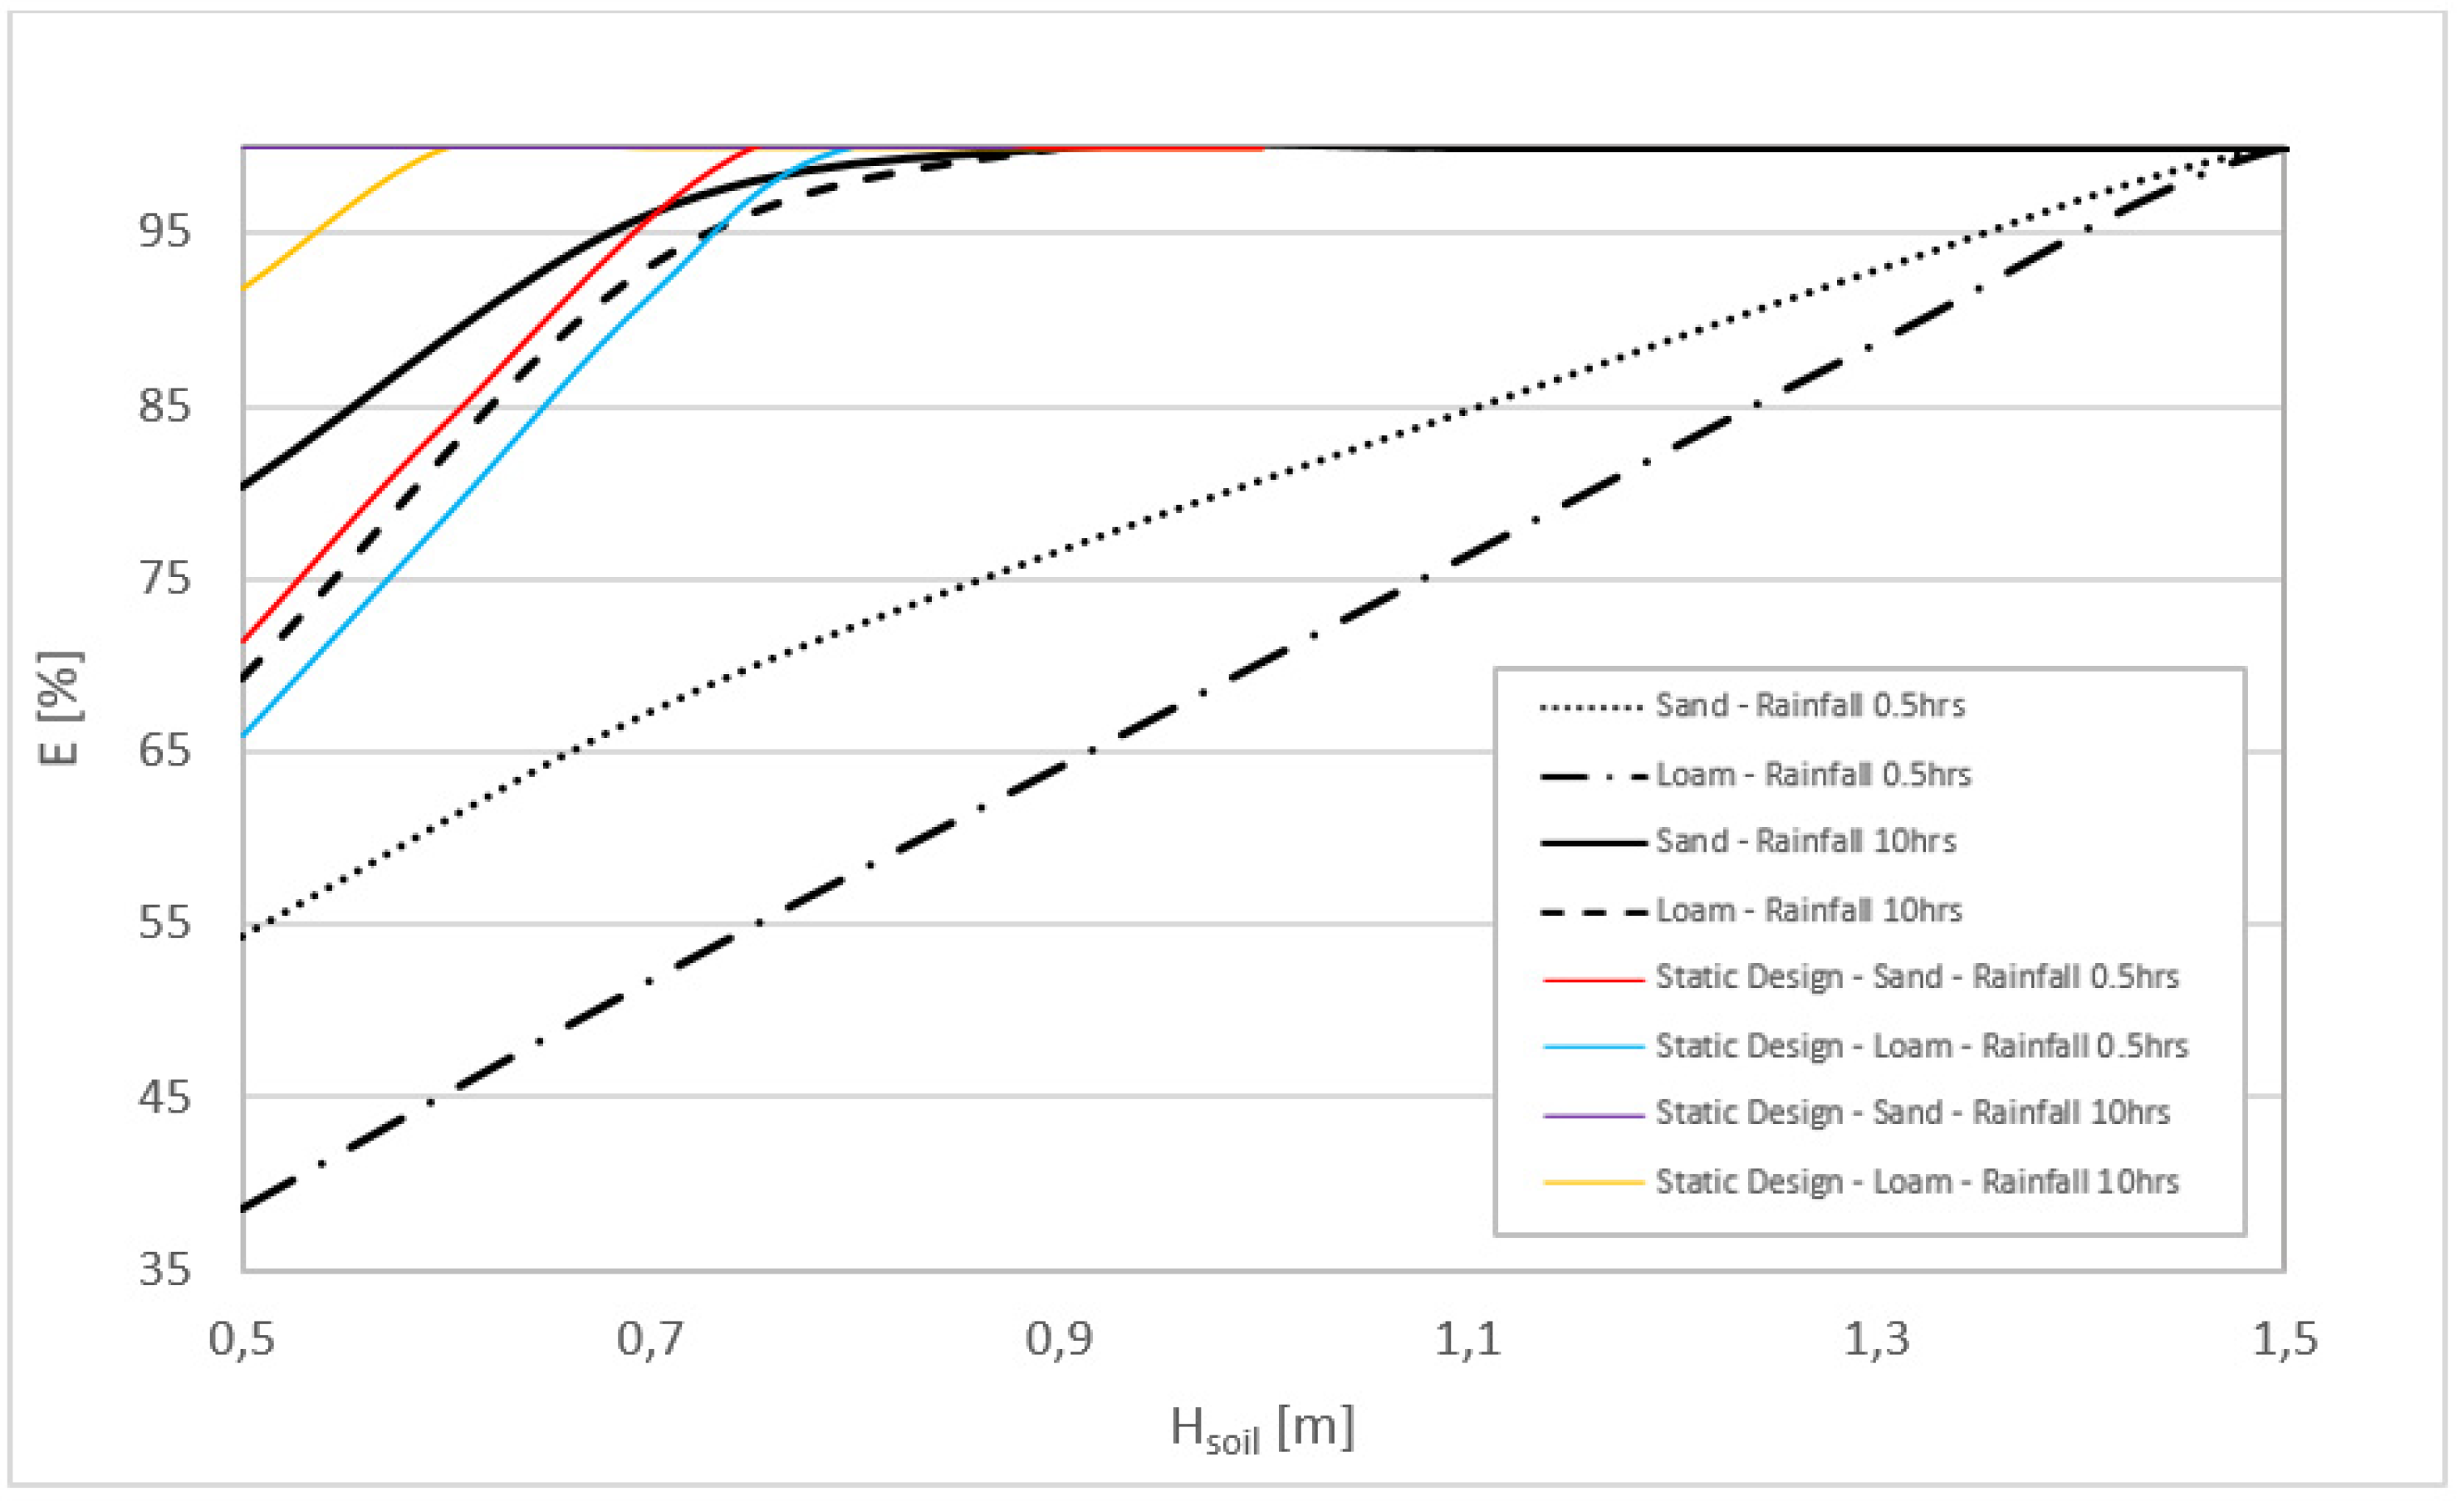
The last case study involves two trenches documented in the literature by Wang and Guo [25], designed for drizzle rain with and ; , , and [25]. Following the static design approach, (16) is evaluated as a function of shape factor for two different exfiltration rates: and to simulate a sandy and a loamy surrounding soil respectively. Duration of rainfall is also set equal to , to simulate moderate rainfall with the same depth, and therefore invariant .
Efficiency evaluated with the static design approach (16) and with HM, (18) are shown in Figure 6. As rainfall duration is reduced to , rain intensity increases by a factor 20 and drops to values that are between 25% and 75% in loamy soils and between 40% and 80% in sandy soils, for between 0.5 m and 1.6 m. The static design criterion always overestimates efficiency.
4. Discussion
The HM-based approach demonstrates that the shape of IS, influences its efficiency. Fast drainage of runoff is a design goal that belongs to traditional drainage systems; infiltration achievement is the circular economy design principle applied to urban drainage systems [12]. Fast drainage and circularity are complementary objectives. The efficiency of IS, according to the circular economy perspective, increases when the fast drainage of runoff declines and water tends to pond on permeable and impermeable surfaces (Figure 3). From a circular economy perspective, where the purpose is to maximize the amount of runoff water that infiltrates, long, narrow trenches are less efficient than square trenches; in contrast, from a traditional design perspective, long, narrow trenches drain water promptly.
Two conceptual approaches (bucket and hydrodynamic modelling) were discussed here and the interrelation between efficiency and shape was explored by implementing a HM in Matlab programming language [33] which fits the scope of sensitivity analysis more than SWMM [35]. The results match the solutions obtained with SWMM in a sample of cases (Figure 4 and Figure 5) and definitely overcome the limitation of a bucket approach as rain intensity increases (Figure 6). The volume and intensity of rainfall both influence efficiency, but the bucket modelling approach, just focusing on rain volume, neglects IS’s shape. The iterated application of the HM for a large number of shape factors allowed us to define thresholds’ shape factors and delimit the range of shape factors that lead to efficient drainage in terms of circular economy. Low shape factors are associated with shape-dependent efficiency and fast drainage, and high shape factors with solutions where circularity is achieved, allowing ponding (Figure 4 and Figure 5).
5. Conclusions
IS shape, along with design rainfall intensity, has not received the same attention as area ratio and rainfall volume in IS design [19]. “Bucket” models that reduce ISs to retention structures with storage and exfiltration capacity [37] are insensitive to variation in rainfall intensity [18] and shape. The HM emphasizes the relevance of rainfall intensity for proper design, with the awareness that, under climate change scenarios, the frequency of intense rainfall events is expected to increase [26] and that urbanization restricts available urban space. A systematic HM sensitivity analysis defines the range of shape factors associated with low and shape dependent efficiency and the shape factors leading to maximum efficiency from a circular economy perspective.
By HM, long and narrow ISs placed along impervious surfaces with predominant development in the direction transverse to runoff flow resulted in less efficiency from a circular economy perspective [38] but are effective in fast linear drainage and disposal. They are generally implemented along highways or major roads [39]. Drainage efficiency and effectiveness (limiting ponding on drainage surfaces and accelerating runoff times after rainfall events) are opposite goals, as are circular and linear economies [13], both of which may become priorities in different socio-economic contexts.
The shape of IS is often dictated by the shape of the available public space [40]. The concept of efficiency as a function of form facilitates the decisions of urban policymakers planning the implementation of IS in constrained public spaces, according to the goal to be achieved in any socio-economic context.
Author Contributions
Conceptualization, N.U.; methodology, N.U.; validation, P.P.; formal analysis, P.P.; investigation, P.P.; data curation, P.P.; writing—original draft preparation, N.U.; supervision, N.U.; funding acquisition, N.U. All authors have read and agreed to the published version of the manuscript.
Funding
This research received no external funding.
Conflicts of Interest
The authors declare no conflict of interest.
References
- Acuto, M.; Parnell, S.; Seto, K.S.; Contestable, M. Science and the Future of Cities, Report of the International Expert Panel on Science and the Future of Cities; The University of Melbourne: Melbourne, Australia, 2018. [Google Scholar]
- Bakker, K. Water security: Research challenges and opportunities. Science 2012, 337, 914–915. [Google Scholar] [CrossRef] [PubMed]
- Marsalek, J. Urban Water Cycle Processes and Interactions; CRC Press: London, UK, 2008. [Google Scholar] [CrossRef]
- ISTAT. Forme, Livelli e Dinamiche Dell’urbanizzazione in Italia; ISTAT: Rome, Italy, 2017. [Google Scholar]
- Allen, J.; Barlow, J.; Leal, J.; Maloutas, T.; Padovani, L. Housing and Welfare in Southern Europe; Wiley: London, UK, 2004. [Google Scholar]
- Decreto Legislativo del 3 Aprile 2006, n. 152—Norme in Materia Ambientale. Available online: https://www.gazzettaufficiale.it/dettaglio/codici/materiaAmbientale (accessed on 1 August 2022).
- Pendergrass, A.G.; Hartmann, D.L. Changes in the distribution of rain frequency and intensity in response to global warming. J. Clim. 2014, 27, 8372–8383. [Google Scholar] [CrossRef]
- De Moel, H.; Aerts, J.C.J.H. Effect of uncertainty in land use, damage models and inundation depth on flood damage estimates. Nat. Hazards 2011, 58, 407–425. [Google Scholar] [CrossRef]
- Merz, B.; Kreibich, H.; Schwarze, R.; Thieken, A. Review article “Assessment of economic flood damage”. Nat. Hazards Earth Syst. Sci. 2010, 10, 1697–1724. [Google Scholar] [CrossRef]
- Bertilsson, L.; Wiklund, K.; Tebaldi, I.D.M.; Rezende, O.M.; Veról, A.P.; Miguez, M.G. Urban flood resilience—A multi-criteria index to integrate flood resilience into urban planning. J. Hydrol. 2019, 573, 970–982. [Google Scholar] [CrossRef]
- Jalilov, S.-M.; Kefi, M.; Kumar, P.; Masago, Y.; Mishra, B.K. Sustainable Urban Water Management: Application for Integrated Assessment in Southeast Asia. Sustainability 2018, 10, 122. [Google Scholar] [CrossRef]
- Williams, J. Circular Cities: What Are the Benefits of Circular Development? Sustainability 2021, 13, 5725. [Google Scholar] [CrossRef]
- UN-WWAP (United Nations World Water Assessment Programme)/UN-Water The United Nations World Water Development Report 2018: Nature-based Solutions for Water UNESCO, Paris (2018). Available online: https://www.unwater.org/publications/world-water-development-report-2018/ (accessed on 1 August 2022).
- European Commission (EC). Towards an EU Research and Innovation Policy Agenda for Nature-Based Solutions & Re-Naturing Cities; Final Report of the Horizon 2020 Expert Group on ‘Nature-Based Solutions and Re-Naturing Cities’; Directorate-General for Research and Innovation European Union: Luxembourg, 2015. [Google Scholar]
- Hasan, S.S.; Zhen, L.; Miah, M.G.; Ahamed, T.; Samie, A. Impact of land use change on ecosystem services: A review. Environ. Dev. 2020, 34, 100527. [Google Scholar] [CrossRef]
- EEA. Urban Adaptation to Climate Change in Europe: Challenges and Opportunities for Cities Together with Supportive National and European Policies; EEA Report No. 2/2012: Agency European Environment; Office for Official Publications of the European Union: Luxembourg, 2012. [Google Scholar] [CrossRef]
- Raymond, C.M.; Frantzeskaki, N.; Kabisch, N.; Berry, P.; Breil, M.; Nita, M.R.; Geneletti, D.; Calfapietra, C. A framework for assessing and implementing the co-benefits of nature-based solutions in urban areas. Environ. Sci. Policy 2017, 77, 15–24. [Google Scholar] [CrossRef]
- Zeng, S.; Guo, H.; Dong, X. Understanding the synergistic effect between LID facility and drainage network: With a comprehensive perspective. J. Environ. Manag. 2019, 246, 849–859. [Google Scholar] [CrossRef]
- AECOM. Georgia Stormwater Management Manual—Volume 2: Technical Handbook; Atlanta Regional Commission: Atlanta, GA, USA, 2016.
- Blecken, G.-T.; Hunt, W.F.; Al-Rubaei, A.M.; Viklander, M.; Lord, W.G. Stormwater control measure (SCM) maintenance considerations to ensure designed functionality. Urban Water J. 2017, 14, 278–290. [Google Scholar] [CrossRef]
- Bonneau, J.; Fletcher, T.D.; Costelloe, J.F.; Burns, M.J. Stormwater infiltration and the ‘urban karst’—A review. J. Hydrol. 2017, 552, 141–150. [Google Scholar] [CrossRef]
- Rossman, L. Storm Water Management Model Reference Manual Volume I—Hydrology (Revised); EPA/600/R-15/162A; United States Environmental Protection Agency: Cincinnati, OH, USA, 2010.
- VDOT. B BMP Design Manual of Practice; Virginia Department of Transportation: Richmond, VA, USA, 2013. [Google Scholar]
- Adams, B.; Papa, F. Urban Stormwater Management Planning with Analytical Probabilistic Models; Willy: New York, NY, USA, 2000; Available online: https://scholar.google.com/scholar_lookup?title=Urban%20stormwater%20management%20planning%20with%20analytical%20probabilistic%20models&author=B.J.%20Adams&publication_year=2000 (accessed on 1 August 2022).
- Wang, J.; Guo, Y. Dynamic water balance of infiltration-based stormwater best management practices. J. Hydrol. 2020, 589, 125174. [Google Scholar] [CrossRef]
- IPCC. Climate Change 2014: Synthesis Report; Contribution of Working Groups I, II and III to the Fifth Assessment Report of the Intergovernmental Panel on Climate Change; IPCC: Geneva, Switzerland, 2014; p. 151. [Google Scholar]
- Wasko, C.; Sharma, A. Steeper temporal distribution of rain intensity at higher temperatures within Australian storms. Nat. Geosci. 2015, 8, 527–529. [Google Scholar] [CrossRef]
- Endreny, T.A. 126: Land Use and Land Cover Effects on Runoff Processes: Urban and Suburban Development. 2005. Available online: https://www.researchgate.net/profile/Theodore-Endreny/publication/229749876_Land_Use_and_Land_Cover_Effects_on_Runoff_Processes_Urban_and_Suburban_Development/links/59e7eb520f7e9bc89b509578/Land-Use-and-Land-Cover-Effects-on-Runoff-Processes-Urban-and-Suburban-Development.pdf (accessed on 1 August 2022).
- Wang, M.; Zhang, D.Q.; Su, J.; Dong, J.W.; Tan, S.K. Assessing hydrological effects and performance of low impact development practices based on future scenarios modeling. J. Clean. Prod. 2018, 179, 12–23. [Google Scholar] [CrossRef]
- Nika, C.-E.; Expósito, A.; Kisser, J.; Bertino, G.; Oral, H.V.; Dehghanian, K.; Vasilaki, V.; Iacovidou, E.; Fatone, F.; Atanasova, N.; et al. Validating Circular Performance Indicators: The Interface between Circular Economy and Stakeholders. Water 2021, 13, 2198. [Google Scholar] [CrossRef]
- Krauze, K.; Wagner, I. From classical water-ecosystem theories to nature-based solutions—Contextualizing nature-based solutions for sustainable city. Sci. Total Environ. 2018, 655, 697–706. [Google Scholar] [CrossRef]
- Ebrahimian, A.; Sokolovskaya, N.; Wadzuk, B. Modeling dynamic performance of urban infiltration trench systems: Methodology and a case study in Philadelphia. J. Hydrol. 2020, 594, 125938. [Google Scholar] [CrossRef]
- Duchene, M.; McBean, E.A.; Thomson, N.R. Modeling of Infiltration from Trenches for Storm-Water Control. J. Water Resour. Plan. Manag. 1994, 120, 276–293. [Google Scholar] [CrossRef]
- MATLAB, version 7.10.0 (R2010a); The MathWorks Inc.: Natick, MA, USA, 2010.
- Huber, W.C. Storm Water Management Model (SWMM) Bibliography; U.S. Environmental Protection Agency: Athens, GA, USA, 1985. Available online: https://www.epa.gov/water-research/storm-water-management-model-swmm (accessed on 1 August 2022).
- Chow, V.T.; Maidment, D.R.; Mays, L.W. Applied Hydrology; McGrawl-Hill Book Company: New York, NY, USA, 1988. [Google Scholar]
- Kumar, P.; Debele, S.E.; Sahani, J.; Rawat, N.; Marti-Cardona, B.; Alfieri, S.M.; Basu, B.; Basu, A.S.; Bowyer, P.; Charizopoulos, N.; et al. Nature-based solutions efficiency evaluation against natural hazards: Modelling methods, advantages and limitations. Sci. Total Environ. 2021, 784, 147058. [Google Scholar] [CrossRef]
- Oral, H.V.; Radinja, M.; Rizzo, A.; Kearney, K.; Andersen, T.R.; Krzeminski, P.; Buttiglieri, G.; Ayral-Cinar, D.; Comas, J.; Gajewska, M.; et al. Management of Urban Waters with Nature-Based Solutions in Circular Cities—Exemplified through Seven Urban Circularity Challenges. Water 2021, 13, 3334. [Google Scholar] [CrossRef]
- Peng, Y.-H.; Li, Z.; Ding, Y.-S. Research on the schemes formulation and optimization method of sponge reconstruction in a highway service area. Water Sci. Technol. 2020, 82, 2889–2901. [Google Scholar] [CrossRef]
- Pacetti, T.; Cioli, S.; Castelli, G.; Bresci, E.; Pampaloni, M.; Pileggi, T.; Caporali, E. Planning Nature Based Solutions against urban pluvial flooding in heritage cities: A spatial multi criteria approach for the city of Florence (Italy). J. Hydrol. Reg. Stud. 2022, 41, 101081. [Google Scholar] [CrossRef]
Figure 1.
Schematic representation of the infiltration system.

Figure 2.
Two realizable ISs with same area ratio and different shape factors (left) and (right).

Figure 3.
Estimated water depth on the runaway and over the infiltration trench as a function of time, generated by the design rainfall intensity with duration and return time yrs, for the two proposed technical solutions.
Figure 3.
Estimated water depth on the runaway and over the infiltration trench as a function of time, generated by the design rainfall intensity with duration and return time yrs, for the two proposed technical solutions.

Figure 4.
Efficiency as a function of shape factor for three different trench surfaces Ra: 50, 60 and 75. Symbols represent efficiency evaluated with the LID module of SWMM.
Figure 4.
Efficiency as a function of shape factor for three different trench surfaces Ra: 50, 60 and 75. Symbols represent efficiency evaluated with the LID module of SWMM.

Figure 5.
Efficiency as a function of shape of IS and frequency of rain event. Rainfall duration is kept constant at . Symbols represent efficiency evaluated with the LID module of SWMM.
Figure 5.
Efficiency as a function of shape of IS and frequency of rain event. Rainfall duration is kept constant at . Symbols represent efficiency evaluated with the LID module of SWMM.

Figure 6.
Efficiency as a function of trench’s depth for sandy and loamy surrounding soils after two rain events with same rain volume and different duration (low and high intensity of rainfall).
Figure 6.
Efficiency as a function of trench’s depth for sandy and loamy surrounding soils after two rain events with same rain volume and different duration (low and high intensity of rainfall).


Table 1.
Efficiency (Equation (17)) of the two technical solutions proposed in Figure 2, evaluated for different rainfall intensity and duration with return time RT = 20.
Table 1.
Efficiency (Equation (17)) of the two technical solutions proposed in Figure 2, evaluated for different rainfall intensity and duration with return time RT = 20.
[min] | Case 1 | Case 2 | [mm/h] | [mm] |
|---|---|---|---|---|
| 10 | 100 | 100 | 150 | 25.3 |
| 30 | 75.96 | 100 | 93 | 46.5 |
| 60 | 81.31 | 100 | 55.9 | 55.9 |
Publisher’s Note: MDPI stays neutral with regard to jurisdictional claims in published maps and institutional affiliations. |
© 2022 by the authors. Licensee MDPI, Basel, Switzerland. This article is an open access article distributed under the terms and conditions of the Creative Commons Attribution (CC BY) license (https://creativecommons.org/licenses/by/4.0/).
Share and Cite
MDPI and ACS Style
Piazza, P.; Ursino, N. Modelling Infiltration Systems’ Performance for Efficient, Sustainable or Circular Urban Water Drainage. Water 2022, 14, 2620. https://doi.org/10.3390/w14172620
AMA Style
Piazza P, Ursino N. Modelling Infiltration Systems’ Performance for Efficient, Sustainable or Circular Urban Water Drainage. Water. 2022; 14(17):2620. https://doi.org/10.3390/w14172620
Chicago/Turabian StylePiazza, Paola, and Nadia Ursino. 2022. "Modelling Infiltration Systems’ Performance for Efficient, Sustainable or Circular Urban Water Drainage" Water 14, no. 17: 2620. https://doi.org/10.3390/w14172620
Note that from the first issue of 2016, this journal uses article numbers instead of page numbers. See further details here.