
Evaluation of Regional Water-Saving Level Based on Support Vector Machine Optimized by Genetic Algorithm


1
Water Resources Institute of Yellow River Hydraulic Research Academy, Zhengzhou 450003, China
2
School of Water Conservancy Engineering, Zhengzhou University, Zhengzhou 450001, China
*
Author to whom correspondence should be addressed.
Water 2022, 14(17), 2615; https://doi.org/10.3390/w14172615
Submission received: 13 June 2022
/
Revised: 19 August 2022
/
Accepted: 22 August 2022
/
Published: 25 August 2022
(This article belongs to the Special Issue China Water Forum 2022)
Abstract
:The evaluation of regional water-saving level can provide scientific theoretical support for steadily promoting the implementation of a national water-saving priority strategy. Referring to the water consumption statistics of 31 provinces (except Hong Kong, Macao and Taiwan) in China in 2018, 14 easily accessible and comprehensive indexes were selected to establish an index system of regional water-saving level and a water-saving level evaluation model based on support vector machine optimized by genetic algorithm (GA-SVM) was constructed to analyze the national regional water-saving level from different perspectives. The results showed that the water-saving level in China presented a spatial distribution characteristic with Beijing City, Henan Province and Zhejiang Province as the center and gradually decreased outward. From the perspective of regionalization, the water-saving level in North China, Central China and Southeast China was higher, while the water-saving level in Northwest China, Southwest China and Northeast China need to be improved. Therefore, the national water-saving level is generally at a medium level and effective water-saving work and water-saving schemes should be carried out according to different regions and industries.
1. Introduction
Water, as a resource, is an indispensable and irreplaceable natural resource for individuals, society and even the whole earth. However, with the development and progress of human society and science and technology economy, available water resources are decreasing. Since the 1980s, China’s urbanization construction and social economic development process have been restricted by the shortage of water resources. Water saving and emission reduction are the only ways to reduce the consumption of limited water resources and maximize the benefits of available water resources [1]. In 2014, General Secretary Xi Jinping proposed “water saving priority” as the primary theoretical content in the 16-character new period water control work idea [2]. The evaluation of water-saving level is a basic link in the national priority water-saving strategy. Carrying out research on regional water-saving level evaluation can provide a theoretical basis and technical support for the scientific guidance of water-saving priorities and steady promotion of water-saving measures [3].
In foreign countries, initial studies on water-saving evaluation did not carry out comprehensive evaluations, but evaluated water-saving level from different fields, including efficient farmland irrigation, total water consumption control for industrial production, urban domestic water and water-saving management. American scholars Ben and Sammis [4] evaluated agricultural water-saving potential and regional evapotranspiration under a drip irrigation system through comparative experiments in 1975. In 1988, Thompson et al. [5] studied and analyzed the level of industrial water saving by using the industrial water consumption index and concluded that increasing the reuse rate of industrial wastewater could improve the reuse rate of industrial water. In 2016, French scholar Rinaudo [6] proposed the tradable water-saving certificate system to improve the efficiency of water resource allocation among drinking-water enterprises in the basin. Although this model still has some improvements, it has a certain promotion effect on the development of urban water saving.
The evaluation of water-saving level in China began at the end of the 20th century. Some scholars carried out research on urban water saving in terms of water consumption index, water-saving efficiency and water shortage [7]. Meanwhile, some achievements have also been made in efficient farmland irrigation, total water control for industrial production and water-saving management [8,9,10]. There are not only regional water-saving level evaluations for provincial, municipal and county administrative regions [11], but industry (product) water-saving level evaluation for enterprises, communities, schools, products and other specific water users [12]. The evaluation method evolved from the original single index evaluation method, including mean multi-variable index evaluation, single variable index evaluation and subjective index evaluation to multi-index comprehensive evaluation method, including “pressure state response” (PSR) model, analytic hierarchy process, order relation analysis, fuzzy comprehensive evaluation and technique for order preference by similarity to ideal solution (TOPSIS) method [13,14]. Traditional evaluation methods have certain subjectivity and cumbersome calculations and the evaluation factors are relatively limited. When the data are too complicated, it is difficult to reflect the comprehensive characteristics of high-dimensional data, while machine learning theory, such as support vector machine, has good learning ability and generalization in dealing with nonlinear, nonlocal and nonconvex high-dimensional problems by constructing scientific and objective general function [15]. At present, the evaluation research on water-saving level mainly focuses on the analysis of water-saving level of a single industry or a single region. On the contrary, there are few studies on the water-saving level of a national region as well as water-saving level research models.
On the basis of the existing research, a representative, independent, comparable and operable evaluation index system was constructed in this paper. Taking the machine learning model and intelligent algorithm as a theoretical basis, a national regional water-saving level evaluation method based on a genetic algorithm optimized by support vector machine is proposed, and the water-saving level is analyzed from different regions, different indexes and factors affecting the water-saving level. The research results are expected to provide new theoretical ideas for the scientific research and development of regional water-saving level evaluation.
2. Methods
2.1. Establishment of Evaluation Index System
China’s water-saving problems can be mainly divided into five categories, including comprehensive problems, industrial water-saving problems, agricultural water-saving problems, domestic water-saving problems and water-saving management problems [16]. In accordance with the requirements of total amount control, efficiency control and emission reduction control, the library of alternative indexes for water-saving evaluation was established based on scientific and systematic principles.
To screen the water-saving level evaluation indexes suitable for this paper from the library of alternative indexes, we first consulted the relevant national, industry, and collective standards and regulations, including “The 13th Five-Year Plan for Building a Water-saving Society” [17], “National Festival Water Action Plan” [18] and “Water-saving Society Evaluation Index System and Evaluation Method” [19] to ensure the authority and reliability of the indexes. Secondly, quantitative indexes are adopted as far as possible to make qualitative evaluation on water-saving problems that cannot be easily quantified. Finally, combined with the requirements of representativeness, independence, comparability and operability, the evaluation indexes of water-saving level were sorted out and simplified from the five perspectives of comprehensive water saving, industrial water saving, agricultural water saving, urban water saving and water-saving management. Fourteen evaluation indexes that have great influence on regional water-saving level are obtained and the constructed water-saving level evaluation index system is shown in Table 1.
2.2. Evaluation Method of Water-Saving Level Based on Genetic-Algorithm-Optimized Support Vector Machine
In 1995, support vector machine (SVM) was proposed by Vapnik and other scholars to analyze nonlinear regression and classification problems [20] and was later widely used in industrial production, health care, urban development and other fields. The core of support vector machine is support vector and its basic principle is to construct an optimal hyperplane in the high-dimensional space as the boundary of sample classification to ensure the distance from each sample to this boundary can be maximized and then the global optimal solution can be obtained [21].
In this paper, the 68 data samples collected were randomly divided into 37 training set samples and 31 test set samples. The input of the SVM model is the sample set of each water-saving index and the output of the model is the water-saving classification level . The two-dimensional sample set is converted into the high-dimensional space for processing and the classification function is constructed as follows:
where is the weight vector and is the classification threshold.
Considering the maximization of the interval between the sample set and the classification hyperplane and the fitting error, the problem of maximization for the interval is transformed into the problem of minimizing objective functions and by introducing penalty factor , relaxation factor and relaxation factor .
By adopting Lagrange multiplier method, the dual form of the objective function is obtained:
where and are Lagrange multiplier factors ad is the RBF kernel functions.
where is the kernel function parameter and is the Euclidean norm.
The value of the model parameters will affect the results and accuracy of the model and the penalty factor and the kernel parameter are important parameters in SVM classifier. Since the learning function of SVM does not have a clear functional relationship with model parameters, traditional support vector machines adopt cross-validation or reliance on experience to determine relevant parameters, but the effect is not ideal and there is a certain degree of subjectivity and blindness. To make SVM achieve the highest mathematical analysis accuracy, genetic algorithm is applied to optimize the important parameters to improve the accuracy of SVM classifier. Genetic algorithm was first proposed by Professor Holland in 1975. It is an intelligent algorithm based on Darwinian evolution theory to obtain the optimal solution of the problem by simulating the biological evolution process [22]. The main process is to transform the mathematical solution process into an artificial evolution model, including individual selection, crossover, mutation and other operations [23]. Through continuous iterative calculation, the goal is comprehensively searched and then the optimal solution for the model is obtained.
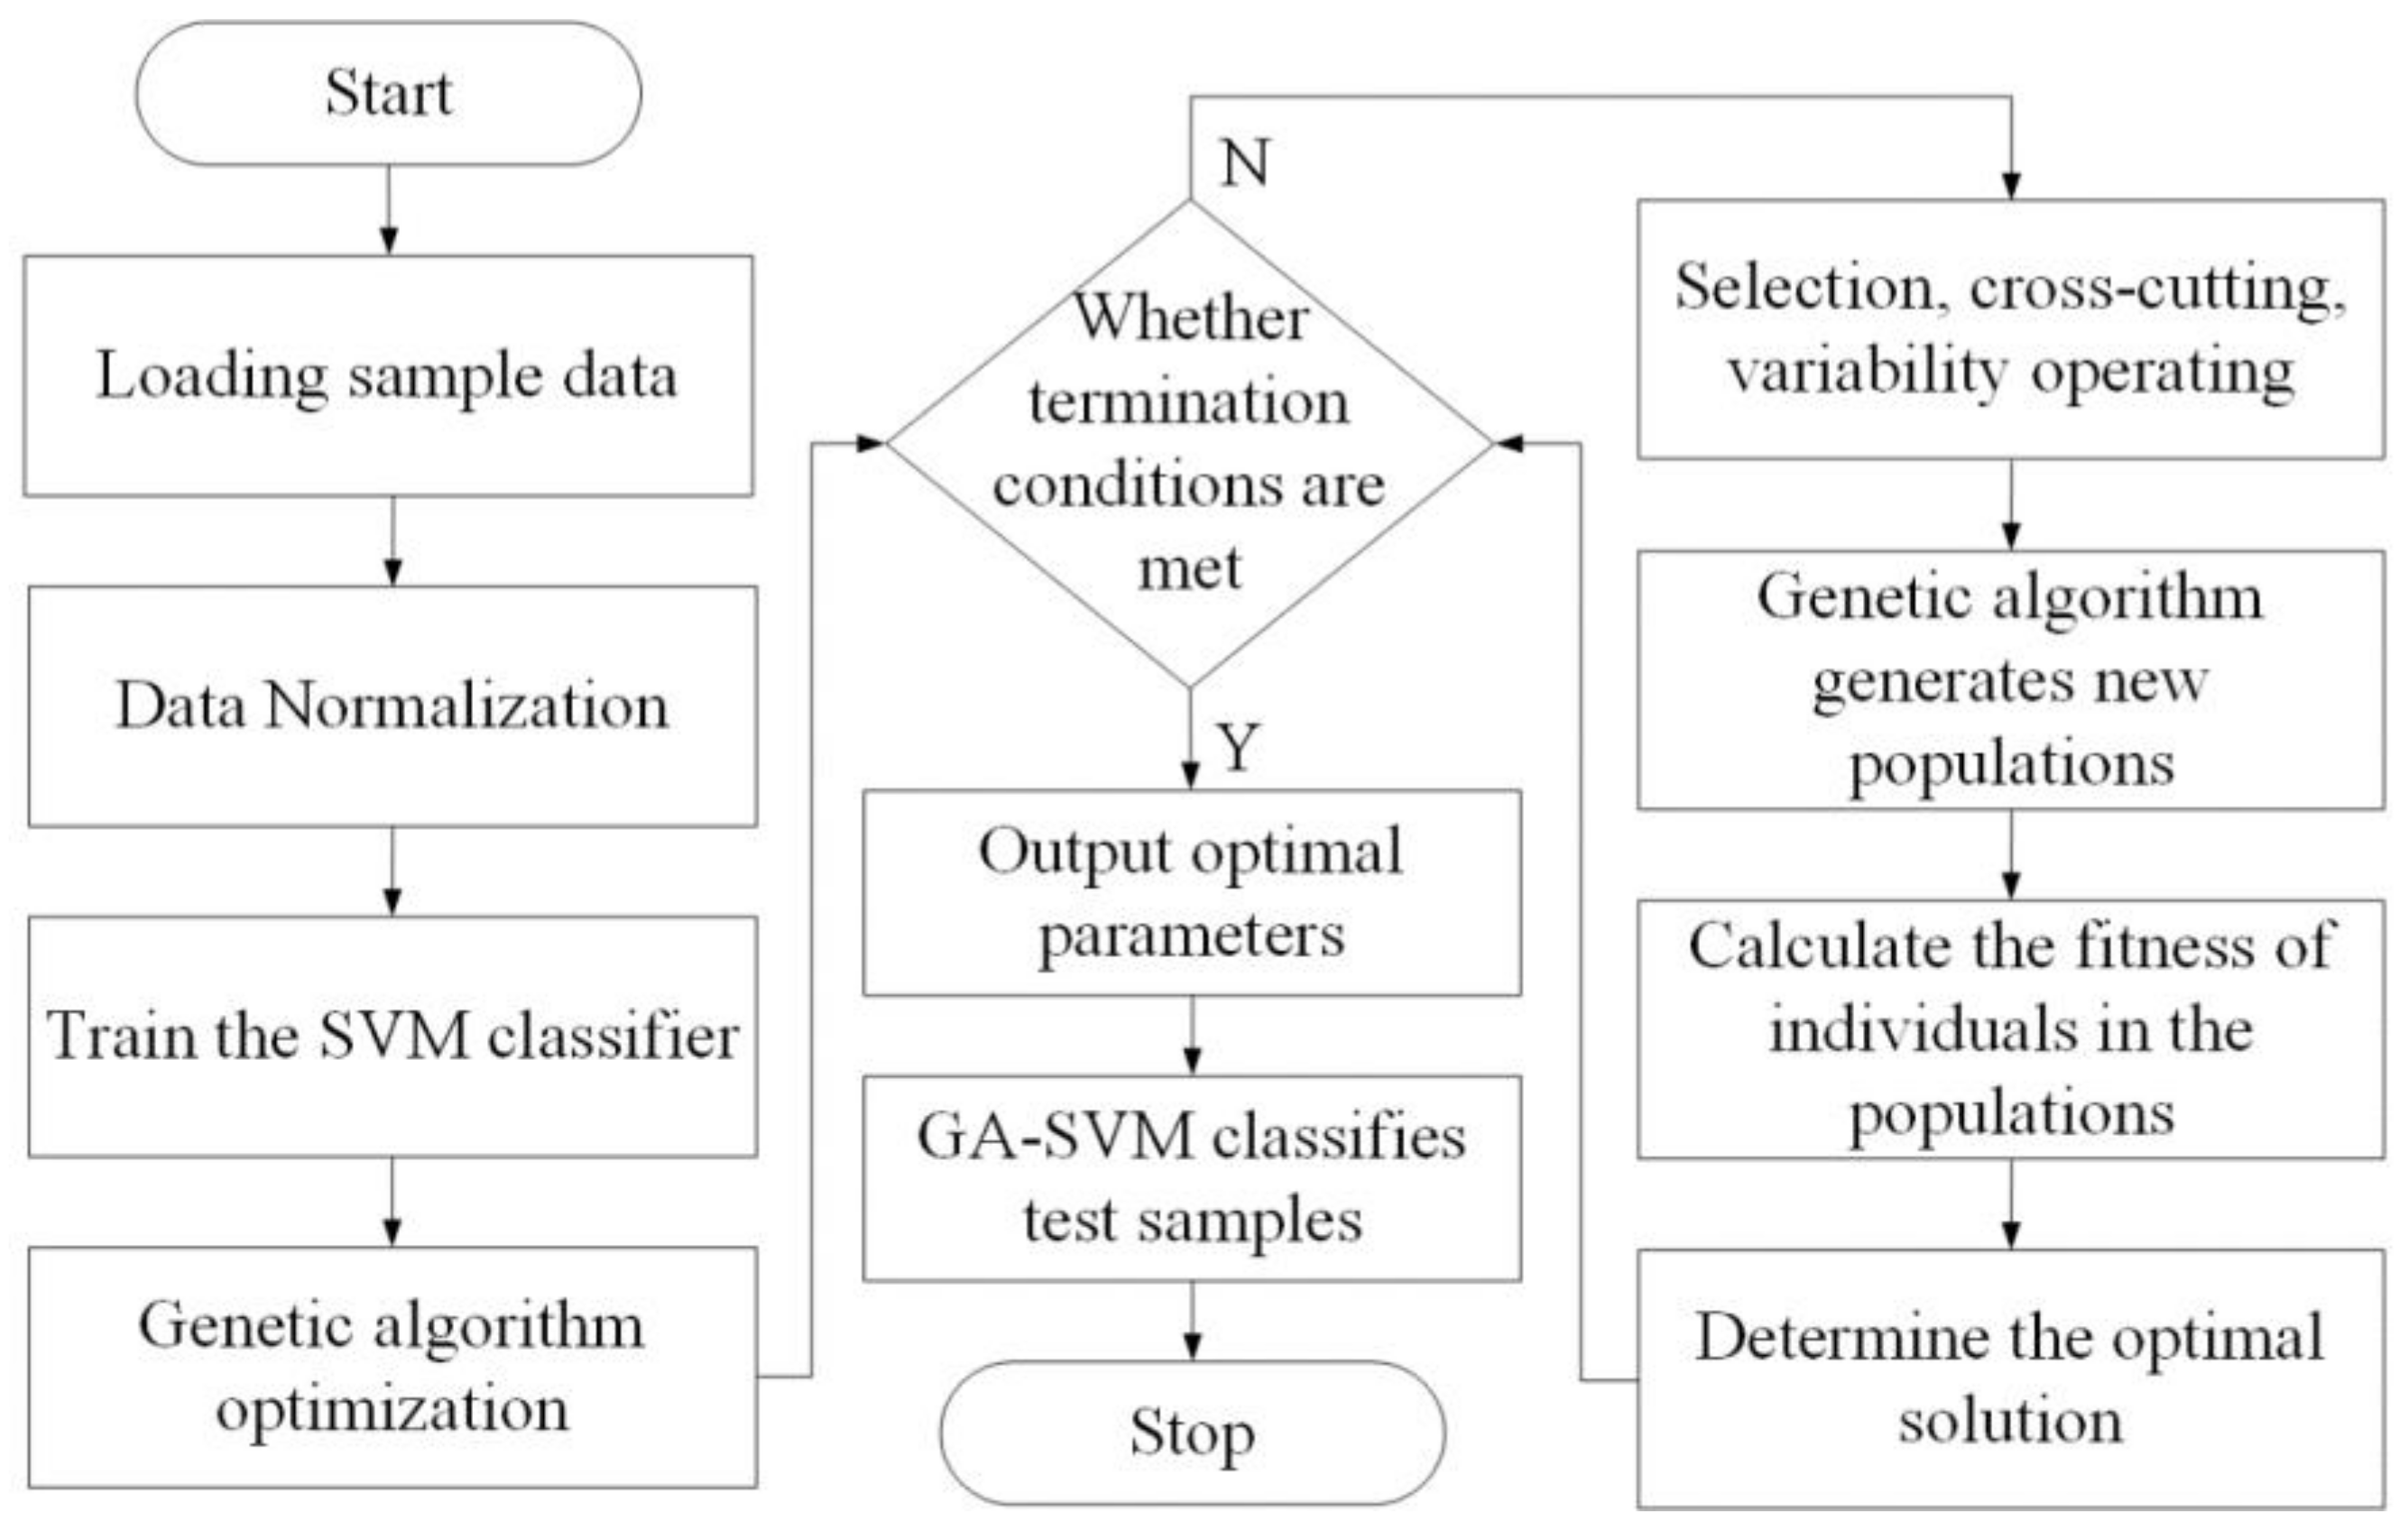
The steps of water-saving level classification based on genetic-algorithm-optimized support vector machine are as follows and a flow chart is shown in Figure 1:
- (1)
- Extraction of sample data.
The data for 14 indexes from 68 groups of the samples were extracted to obtain the distribution of the same index from different samples and the samples of training set and test set were selected.
- (2)
- Data preprocessing.
Different indexes have different dimensions. To achieve the standardization and practicability of the sample data, normalized calculations were made on the original data.
where is the measured value and is the processed value.
- (3)
- Genetic algorithm optimization.
In the training process of water-saving level classification based on support vector machine, genetic algorithm was introduced to obtain the optimal parameters. The new population group is obtained by selecting, crossover, mutation and other operations for each individual population. When the fitness of the new population group or the classification accuracy meets the stop condition, the iteration process is stopped and retreated and the optimal penalty factor and the kernel parameters with the highest fitness are obtained.
- (4)
- Classification of the test set based on optimal parameters.
The optimal parameter was substituted into RBF kernel function and GA-SVM water-saving level classification model. The output classification results included the actual classification of test set and the optimal classification based on GA-SVM and the classification accuracy was calculated.
3. Case Analysis
3.1. Data Sources
The data in the paper are extracted from the “China Water Resources Bulletin”, “China Statistical Yearbook”, “China Urban and Rural Construction Statistical Yearbook” and “China Water Statistics Yearbook” and the most stringent water resource management system assessment and publication statistics of each province (region, city) in 2018, from which the relevant data of 14 indexes in 31 provinces (autonomous regions and municipalities) in 2018 are obtained to carry out the example application of regional water-saving level evaluation.
3.2. Evaluation Index Analysis
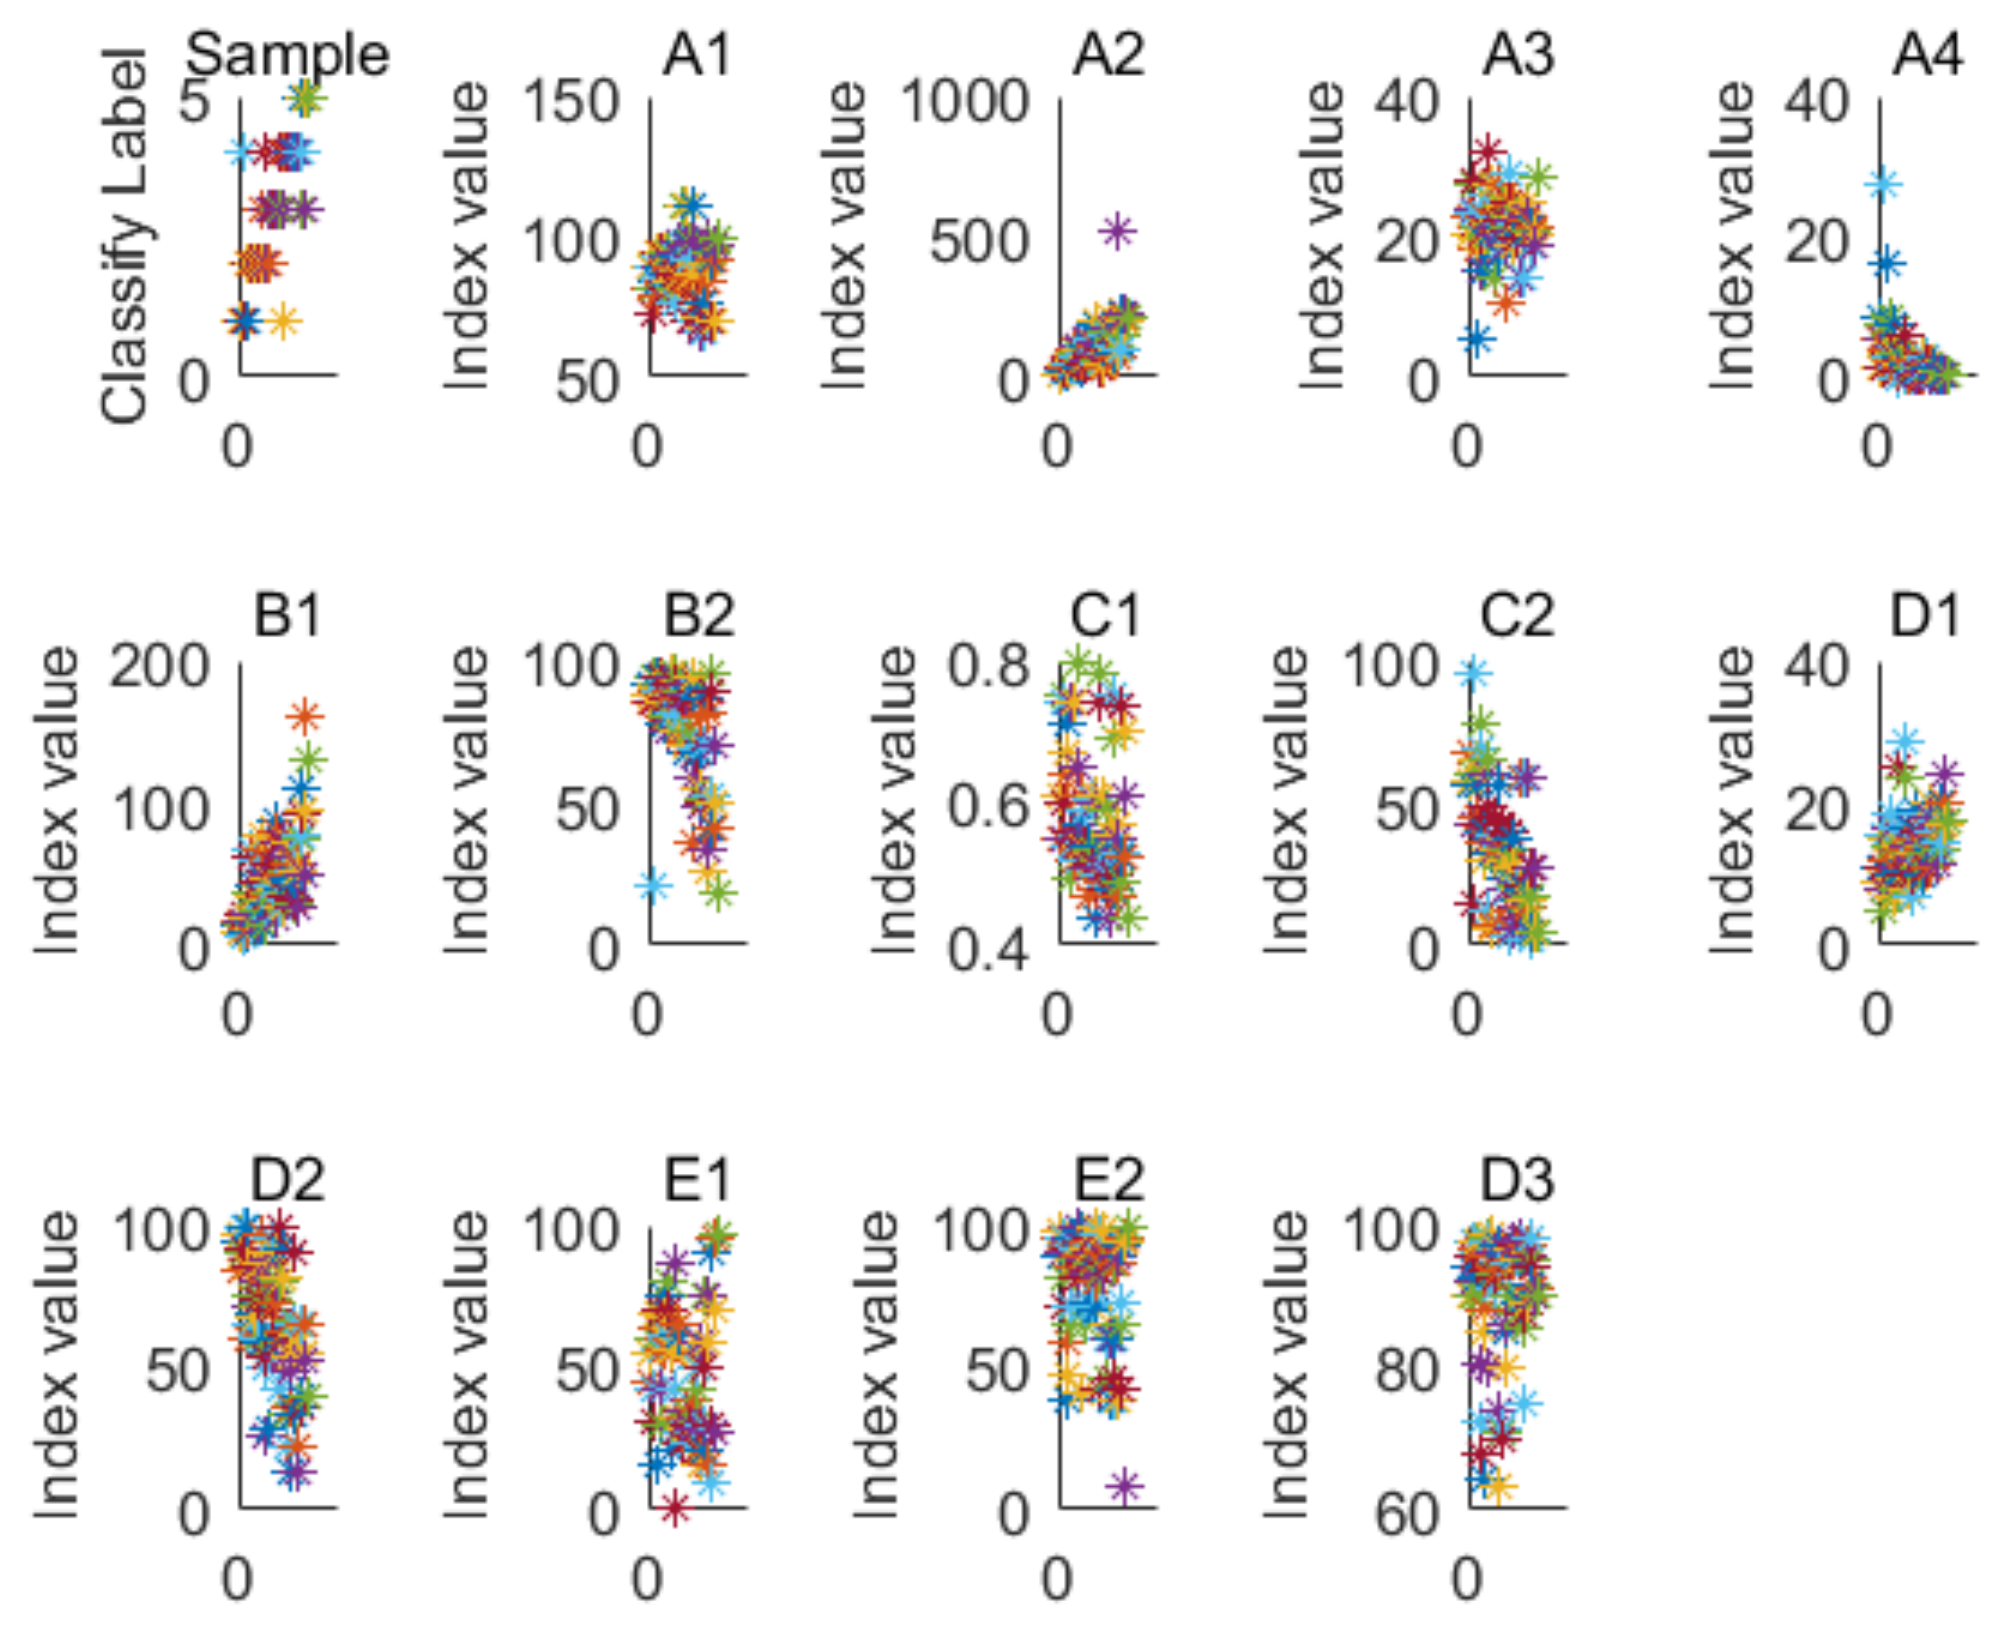
To intuitively analyze the commonality and difference in indexes in different provinces, a scatter distribution diagram of each indicator data is drawn in Figure 2.
As can be seen from Figure 2, the distribution of the five indexes, including total water consumption control degree (A1), the decline rate of water consumption per 10,000 yuan of GDP (A3), water consumption per 10,000 yuan of industrial added value (B1), water consumption per 10,000 yuan of GDP (A2) and leakage rate of urban public water supply pipe network (D1), is relatively concentrated, with average values of 87.3%, 22.3%, 43.4 (m3/10,000 CNY), 94.9 (m3/10,000 CNY) and 14.9%, respectively. The five indexes of most provinces (autonomous regions, municipalities) are at a better level. The distribution of the proportion of high-efficiency water-saving irrigation area (C2), the reuse rate of industrial water (B2), the penetration rate of water-saving appliances (D2), the installation rate of metering facilities (E2), the planned water consumption rate (E1) and the centralized treatment rate of urban sewage (D3) are scattered. The differences in the indexes between the maximum value and the minimum value are large. For example, the maximum value of industrial water reuse rate is 95.8%, the minimum value is 18.3%, the maximum value of efficient water-saving irrigation area is 95.54%, the minimum value is 2.51%, the maximum value of planned water use rate is 97.26%, the minimum value is 1.2%, indicating that there are great differences in water-saving work in industry, agriculture and urban life among provinces (regions, cities). It is worth noting that the utilization ratio of unconventional water (A4) and the effective utilization coefficient of farmland irrigation water (C1) are relatively concentrated, with an average value of 2.7% and 0.54, respectively, but both of them are at a low level.
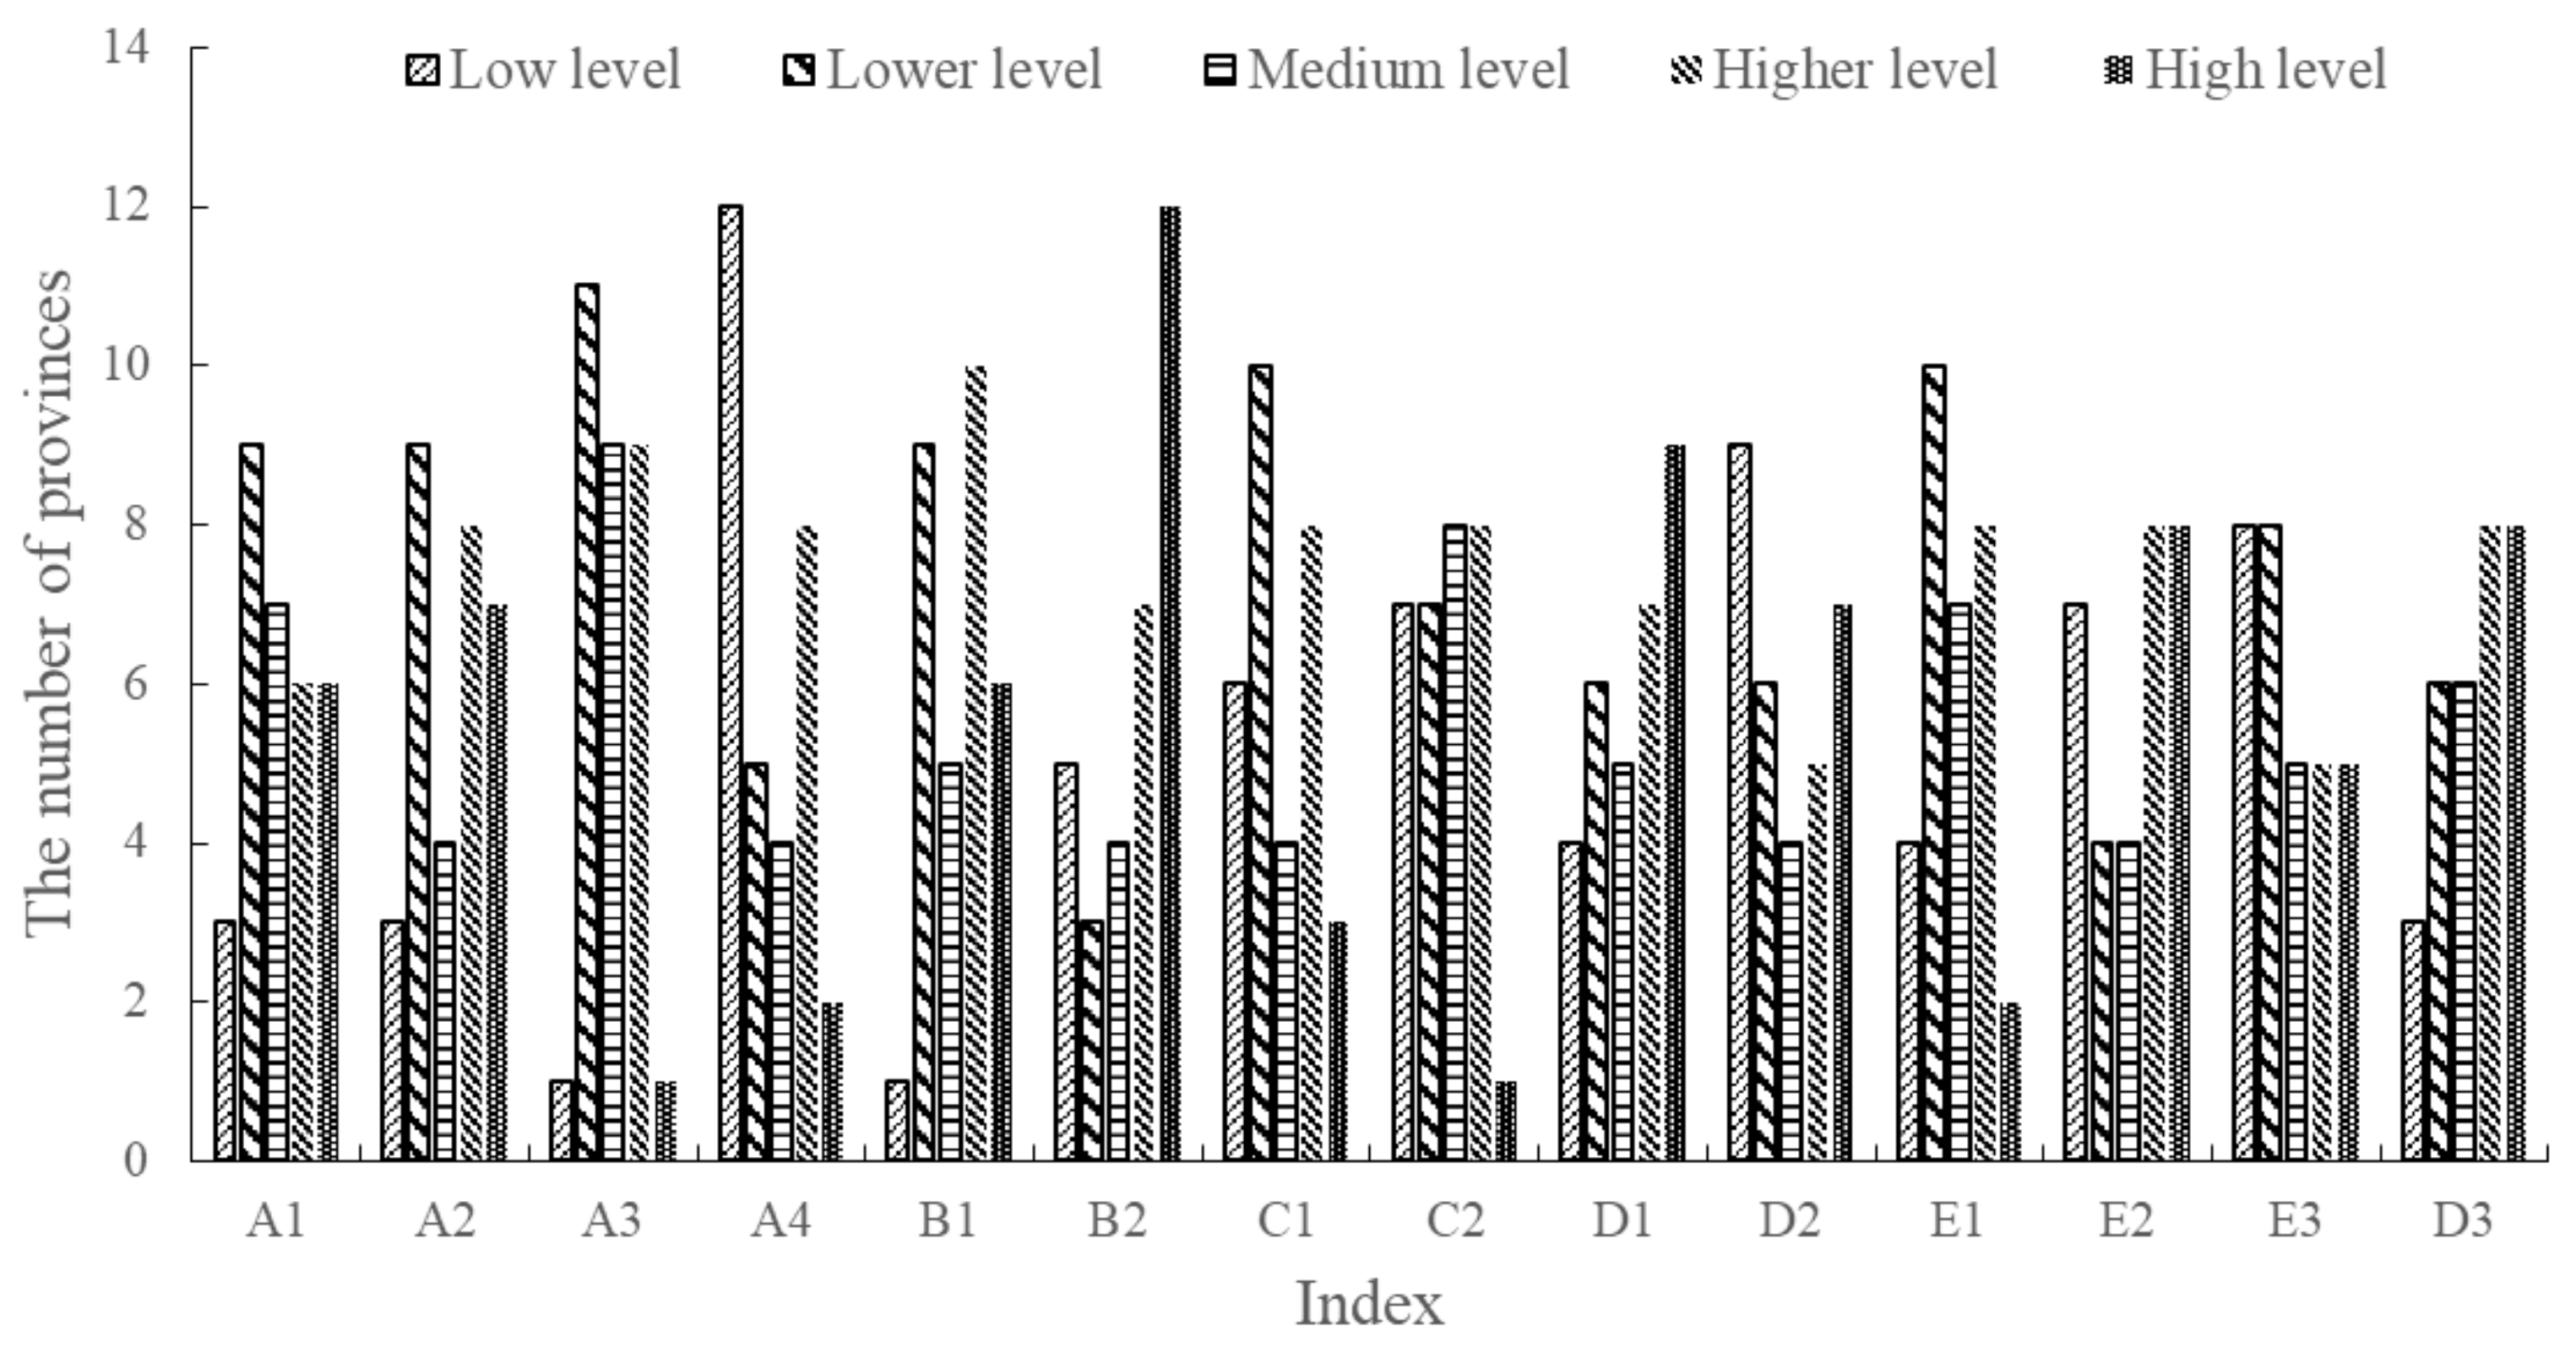
Referring to the standards for building water-saving societies in counties (Water Resources [2017] No. 184), “Technical Guidelines for Evaluation of Water-saving Communities” and “Urban Water-saving Evaluation Standards” [24], the threshold division of the indexes at each level is determined (Table 2) and then a quantitative distribution diagram of provinces (autonomous regions and municipalities) at different levels of each index is obtained (Figure 3).
The results show that most of the provinces (autonomous regions and cities) are at the medium or above level in terms of the eight indexes, including total water consumption control degree (A1), the decline rate of water consumption per CNY 10,000 of GDP (A3), water consumption per CNY 10,000 of industrial added value (B1), water consumption per CNY 10,000 of GDP (A2), centralized rate of urban sewage treatment (D3), leakage rate of urban public water supply pipe network (D1) and the installation rate of metering facilities (E2). More than half of the provinces (autonomous regions and municipalities directly under the central government) are at or below the primary level in terms of the proportion of high-efficiency water-saving irrigation area (C2), the penetration rate of water-saving appliances (D2) and the timeliness of standard quotas (E3). However, the effective utilization coefficient of farmland irrigation water (C1) and the utilization ratio of unconventional water sources (A4) are at a low level in most provinces (autonomous regions and municipalities).
3.3. Evaluation Model Parameter Optimization Results
By searching, collecting and sorting out the relevant database information, a total of 25 papers was queried and 22 groups of index data were sorted out. The relevant research results covered six typical water-saving cities (region, city), which can be used as an effective supplement to the water-saving-level evaluation data. Taking the collected 22 groups of index data and 15 groups of provincial (region, city) index data, a total of 37 sets of samples as the training set samples province (region, city) index data and 31 groups of provincial (autonomous regions, municipalities) index data as the test set samples, the relevant research in this paper was carried out.
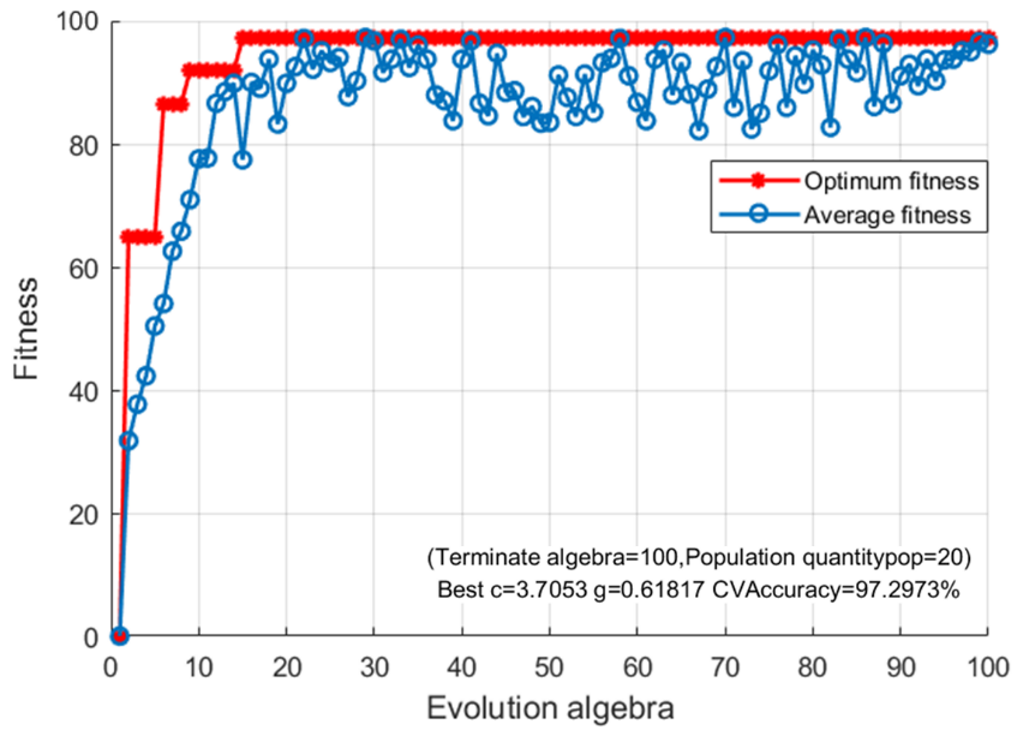
The input of the model is water-saving index and the output of the model is water-saving classification level , so the training sample set of 37 groups is . In the water-saving-level evaluation model of GA-SVM, the maximum genetic times of the population were set as 100, the population size was set as 20 and the variation range of parameters and was between 0 and 100. In the iterative process of genetic algorithm, the fitness of individual population is the classification accuracy [25]. When the classification accuracy is the highest, 1 and 2 are the optimal parameters. As can be seen from Figure 4 for the genetic algorithm iteration, the optimal accuracy rate has been improved four-times and finally stabilized at 97.2973%. In this case, the optimal parameter value is obtained, = 3.7053, = 0.61817.
3.4. Results Discussion
3.4.1. Analysis of Water-Saving Level in Various Provinces
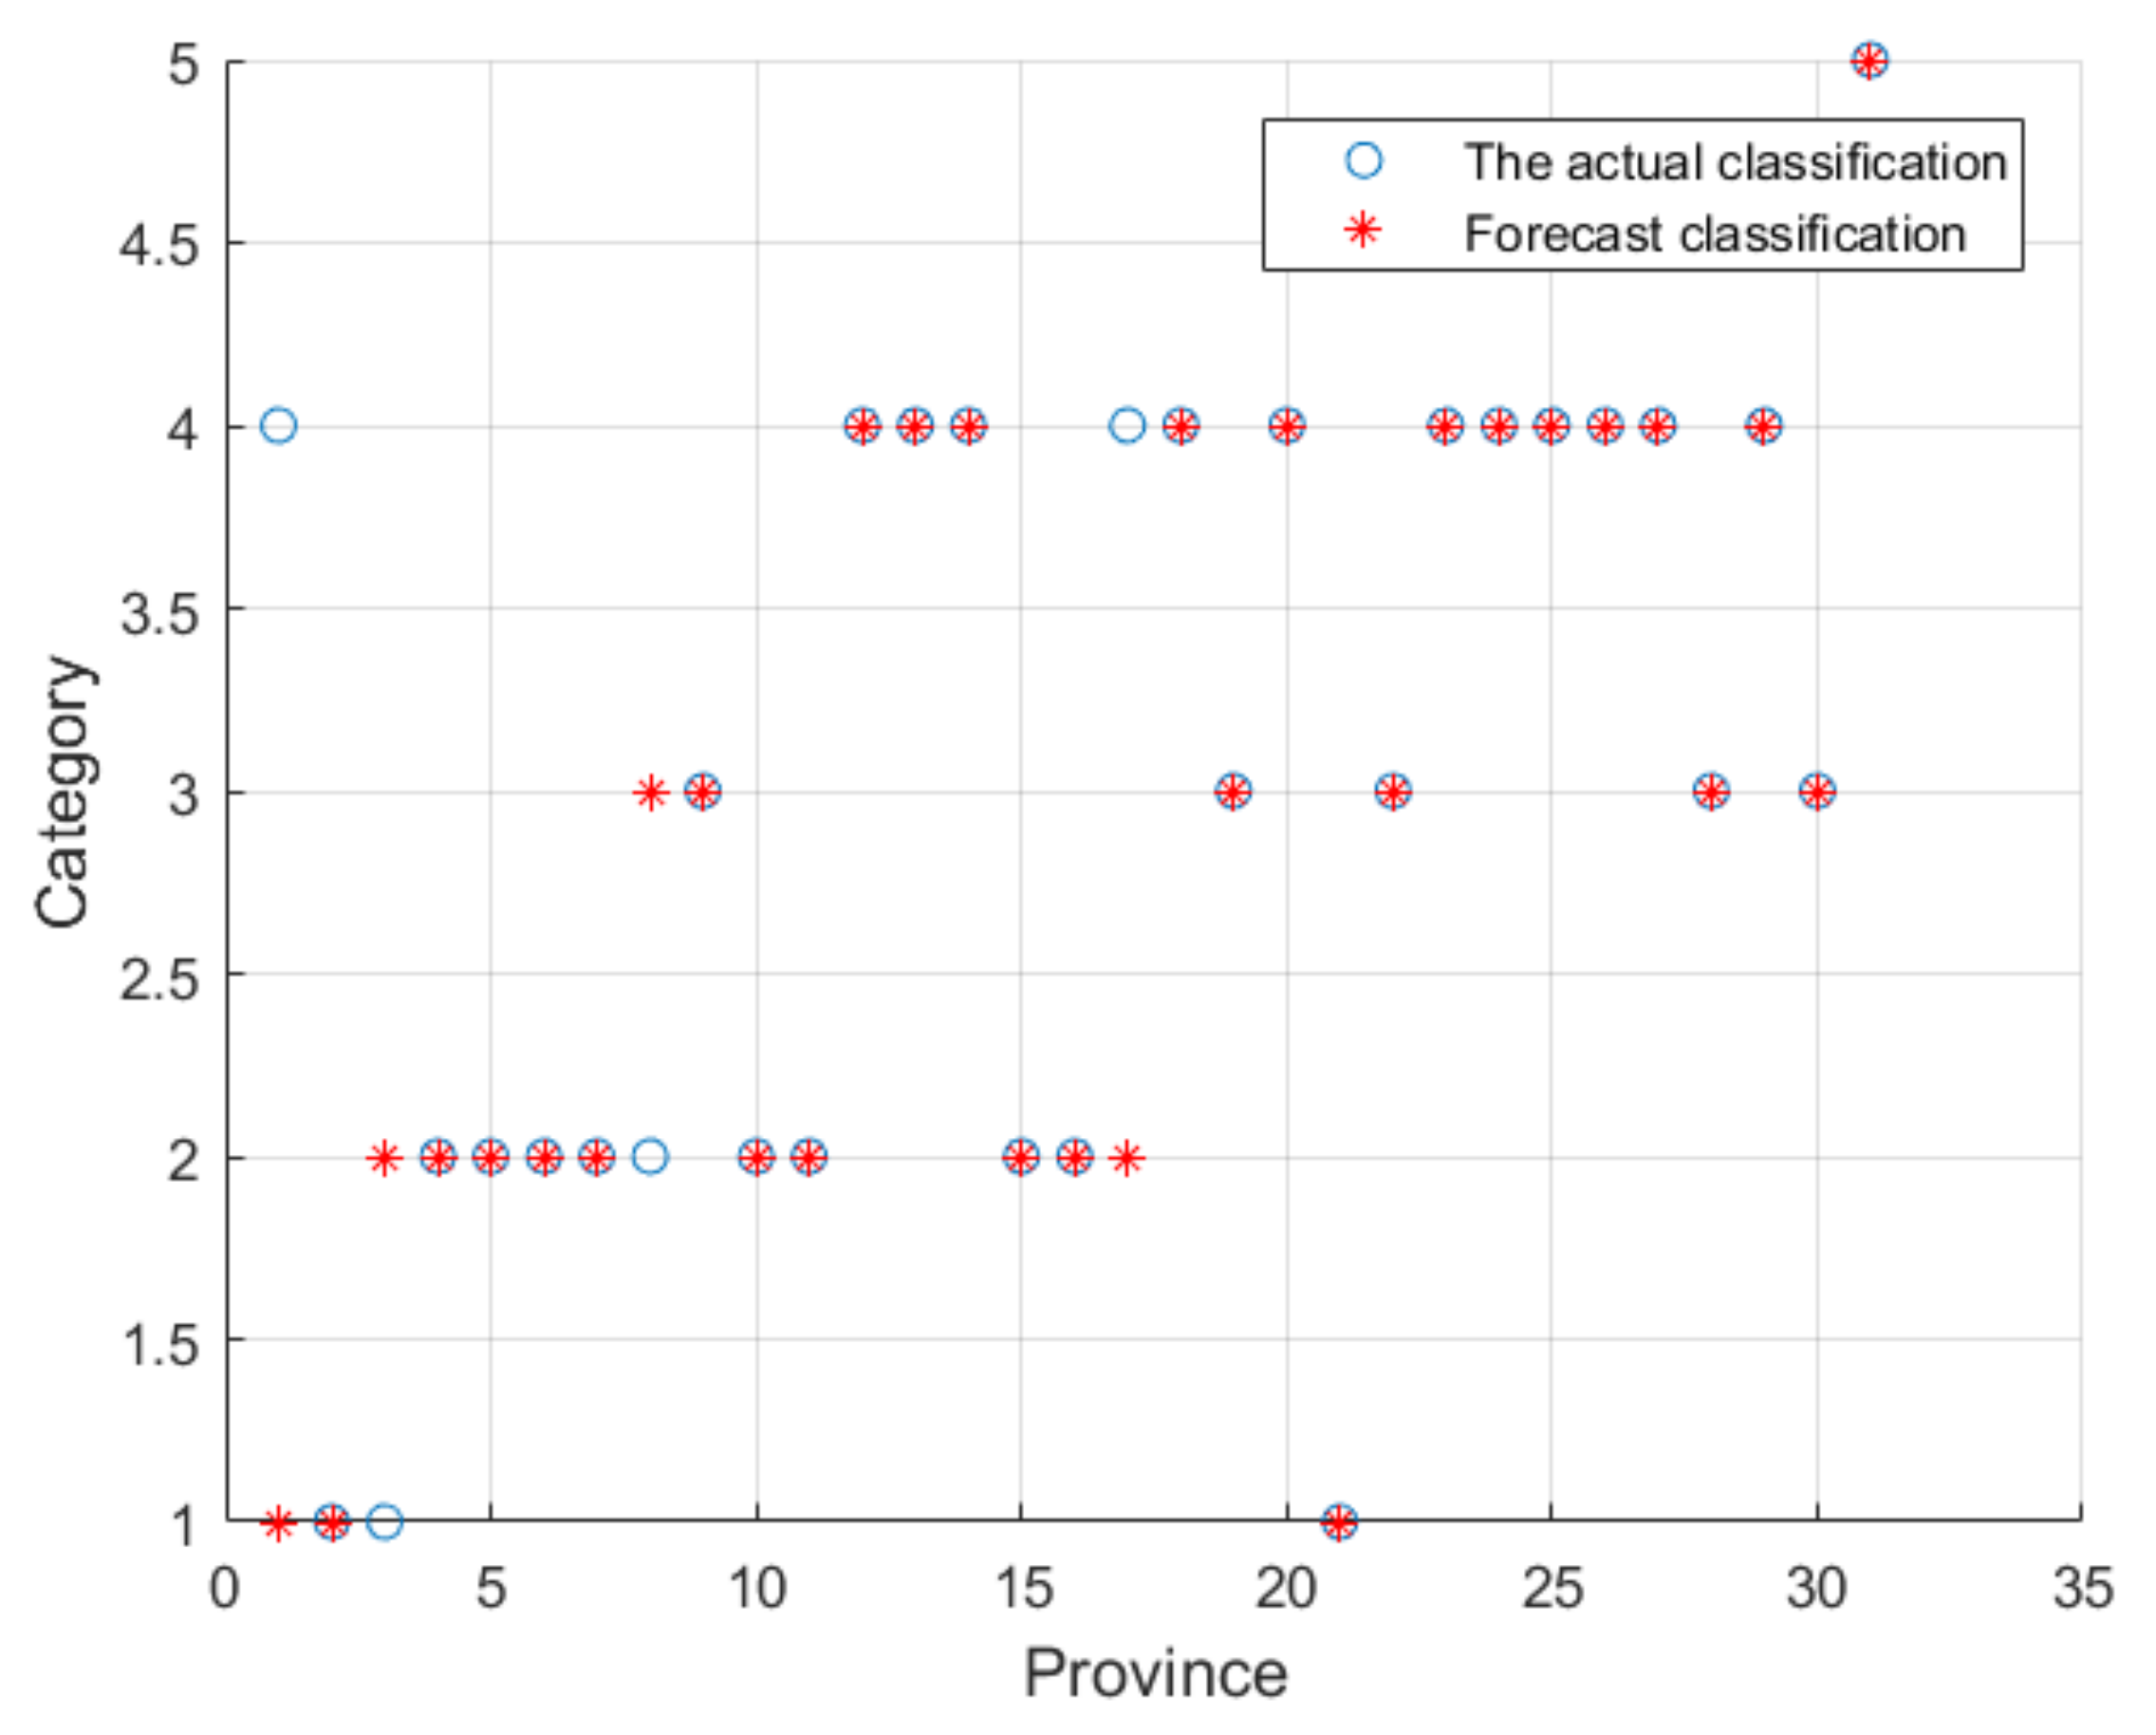
The normalized data for 31 test sets were substituted into the algorithm program of GA-SVM to complete the classification and evaluation of water-saving level in provinces (regions, cities), as shown in Figure 5.
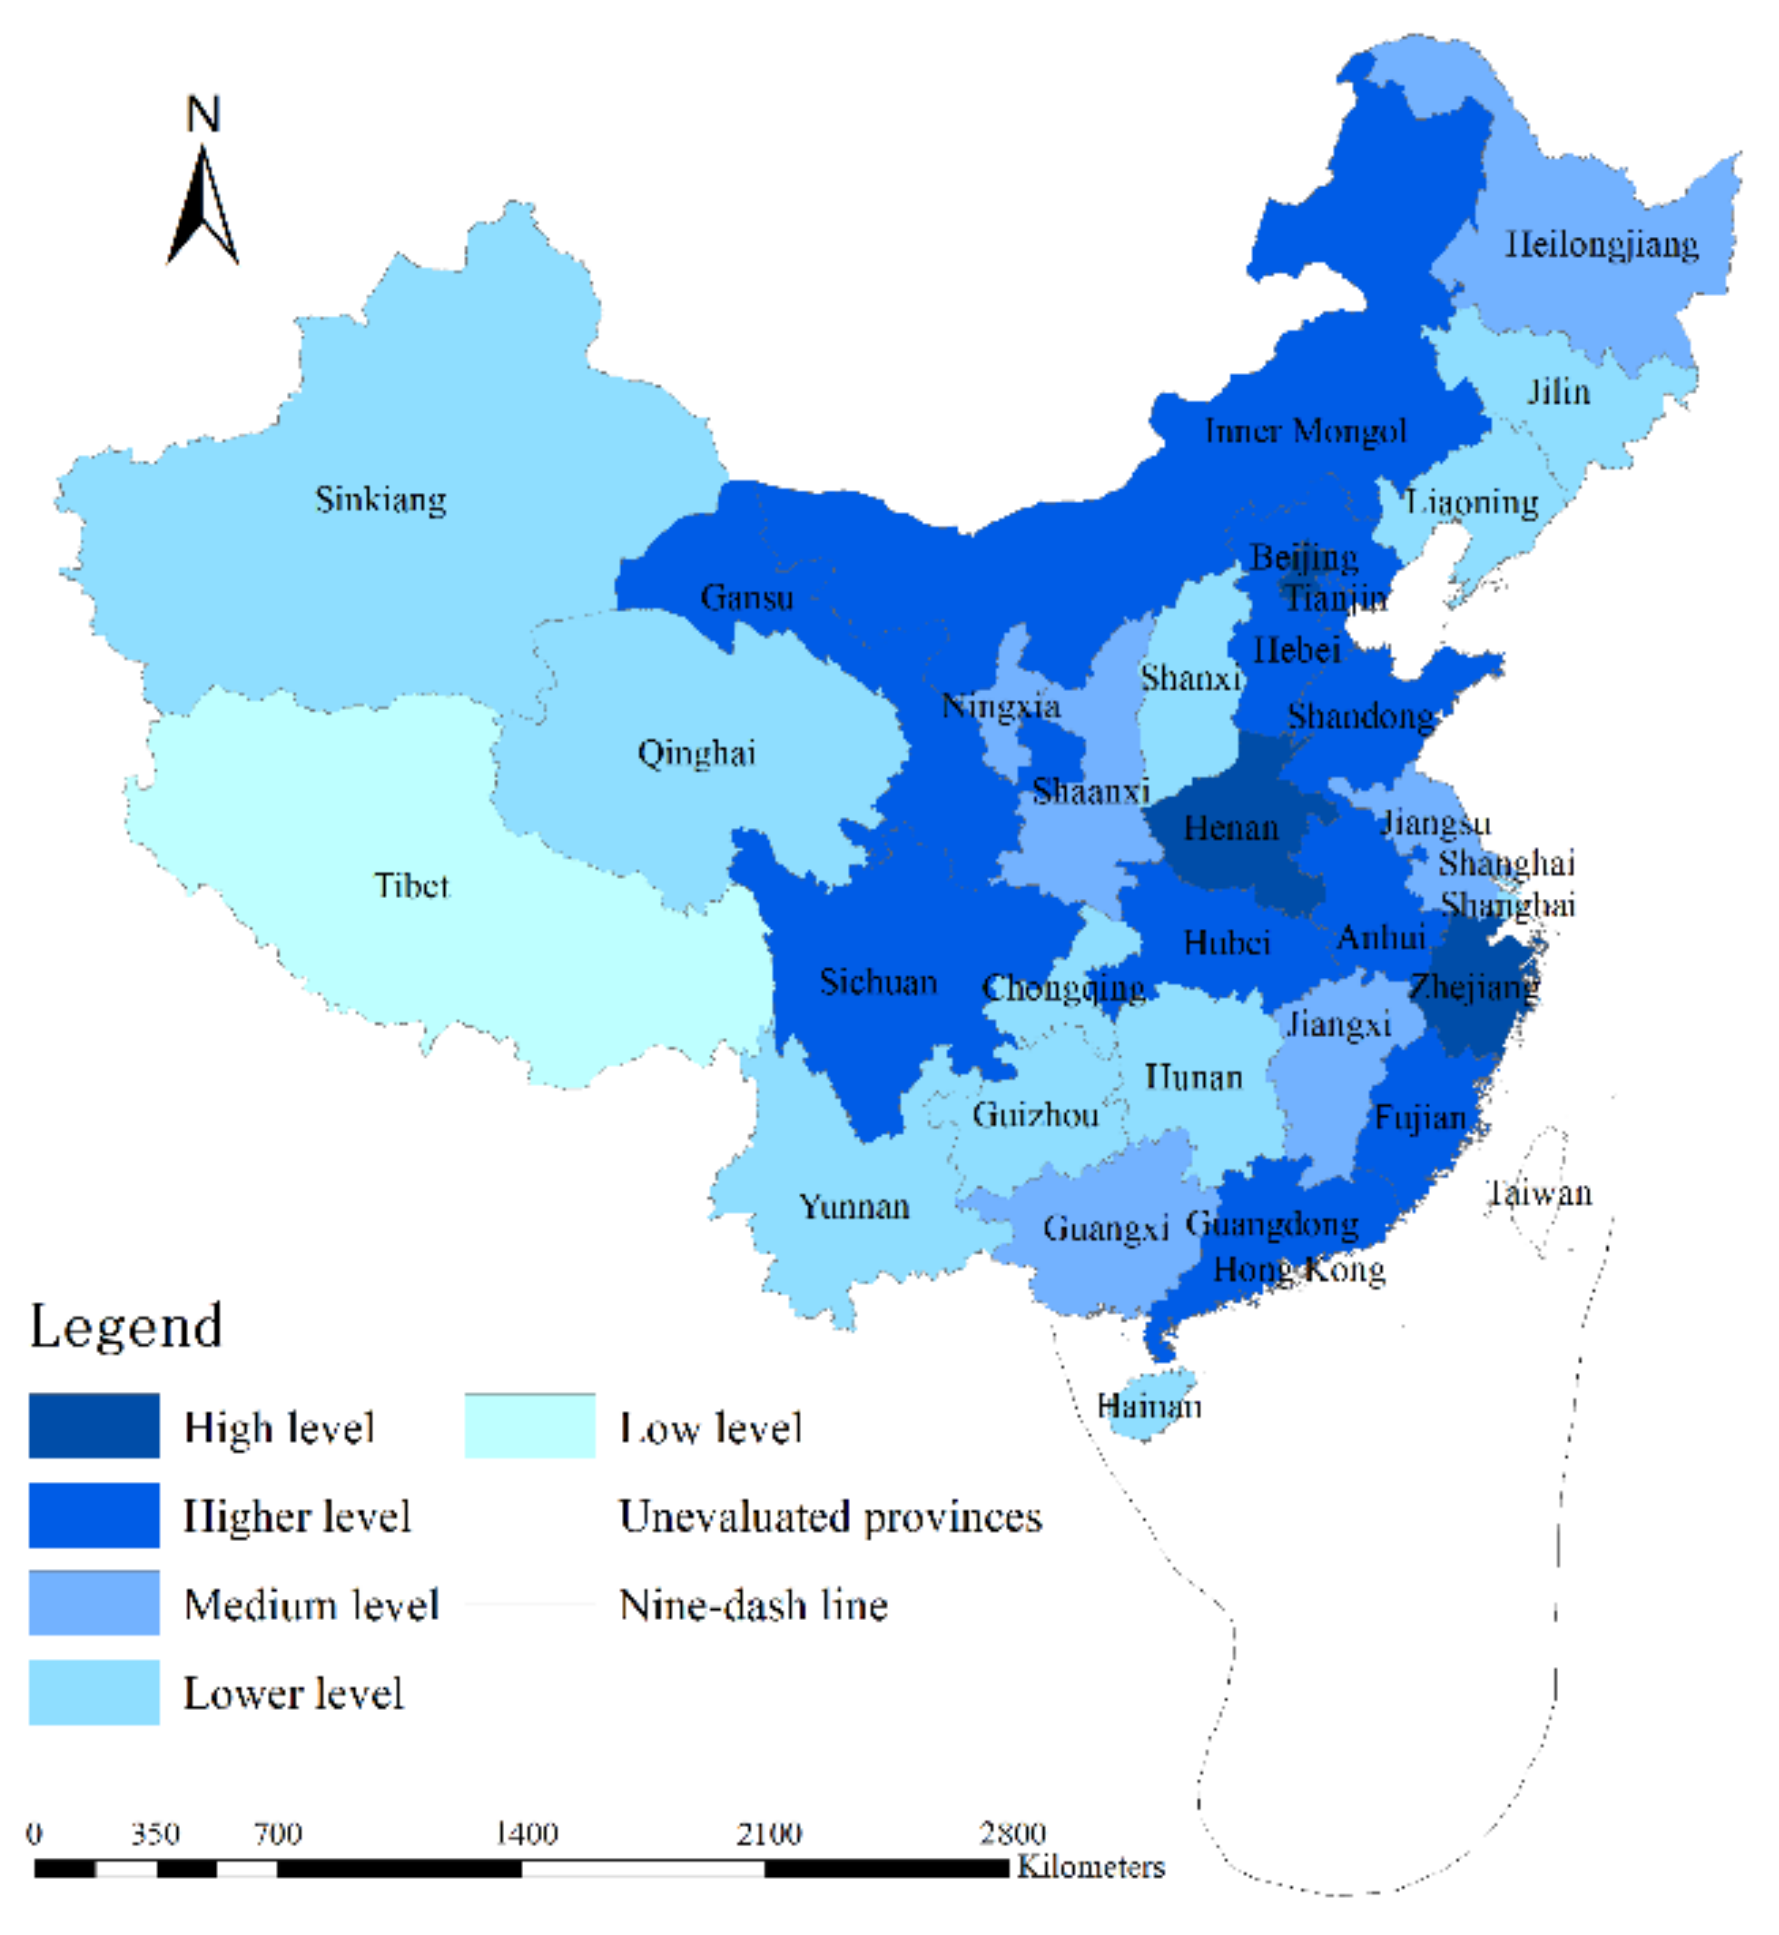
According to Figure 5, the classification results for water-saving levels in provinces (autonomous regions and municipalities) can be obtained. In China, there are 3 higher-level provinces (autonomous regions and municipalities), 10 high-level provinces, 6 medium-level provinces, 11 lower-level provinces and 1 low-level province. The spatial distribution characteristics of water-saving levels in all provinces (regions and cities) are shown in Figure 6.
From Figure 6, more than half of China’s provinces (autonomous regions and cities) are above the medium level, accounting for 61.3% of the total, and few provinces (autonomous regions and cities) reach the low level or high level. Generally speaking, the water-saving level in China presents the spatial distribution characteristics with Beijing, Henan and Zhejiang Province as the center and gradually decreases outward. Beijing, as a super-large city with a high economic level, and Henan Province, as a province with a large population in China [26], have made great progress in water saving by further strengthening water-saving management, implementing the national priority policy of water saving, promoting the development of water saving and vigorously achieving the sustainable utilization of water resources [27]. Zhejiang Province, located in the southeast coastal area, with abundant rainfall and sufficient water resources per capita, attaches great importance to water saving and pollution control and develops non-traditional water resources to improve water-saving level. There are many rivers in Tibet, but most of the rivers are intermittent [28]. The utilization rate of water resources in Tibet is extremely low and the waste phenomenon is extremely serious; the area is vast but the population is sparse and water-saving technologies and funds are scarce, making it the only low-level water-saving area.
3.4.2. Analysis of Water-Saving Level by District
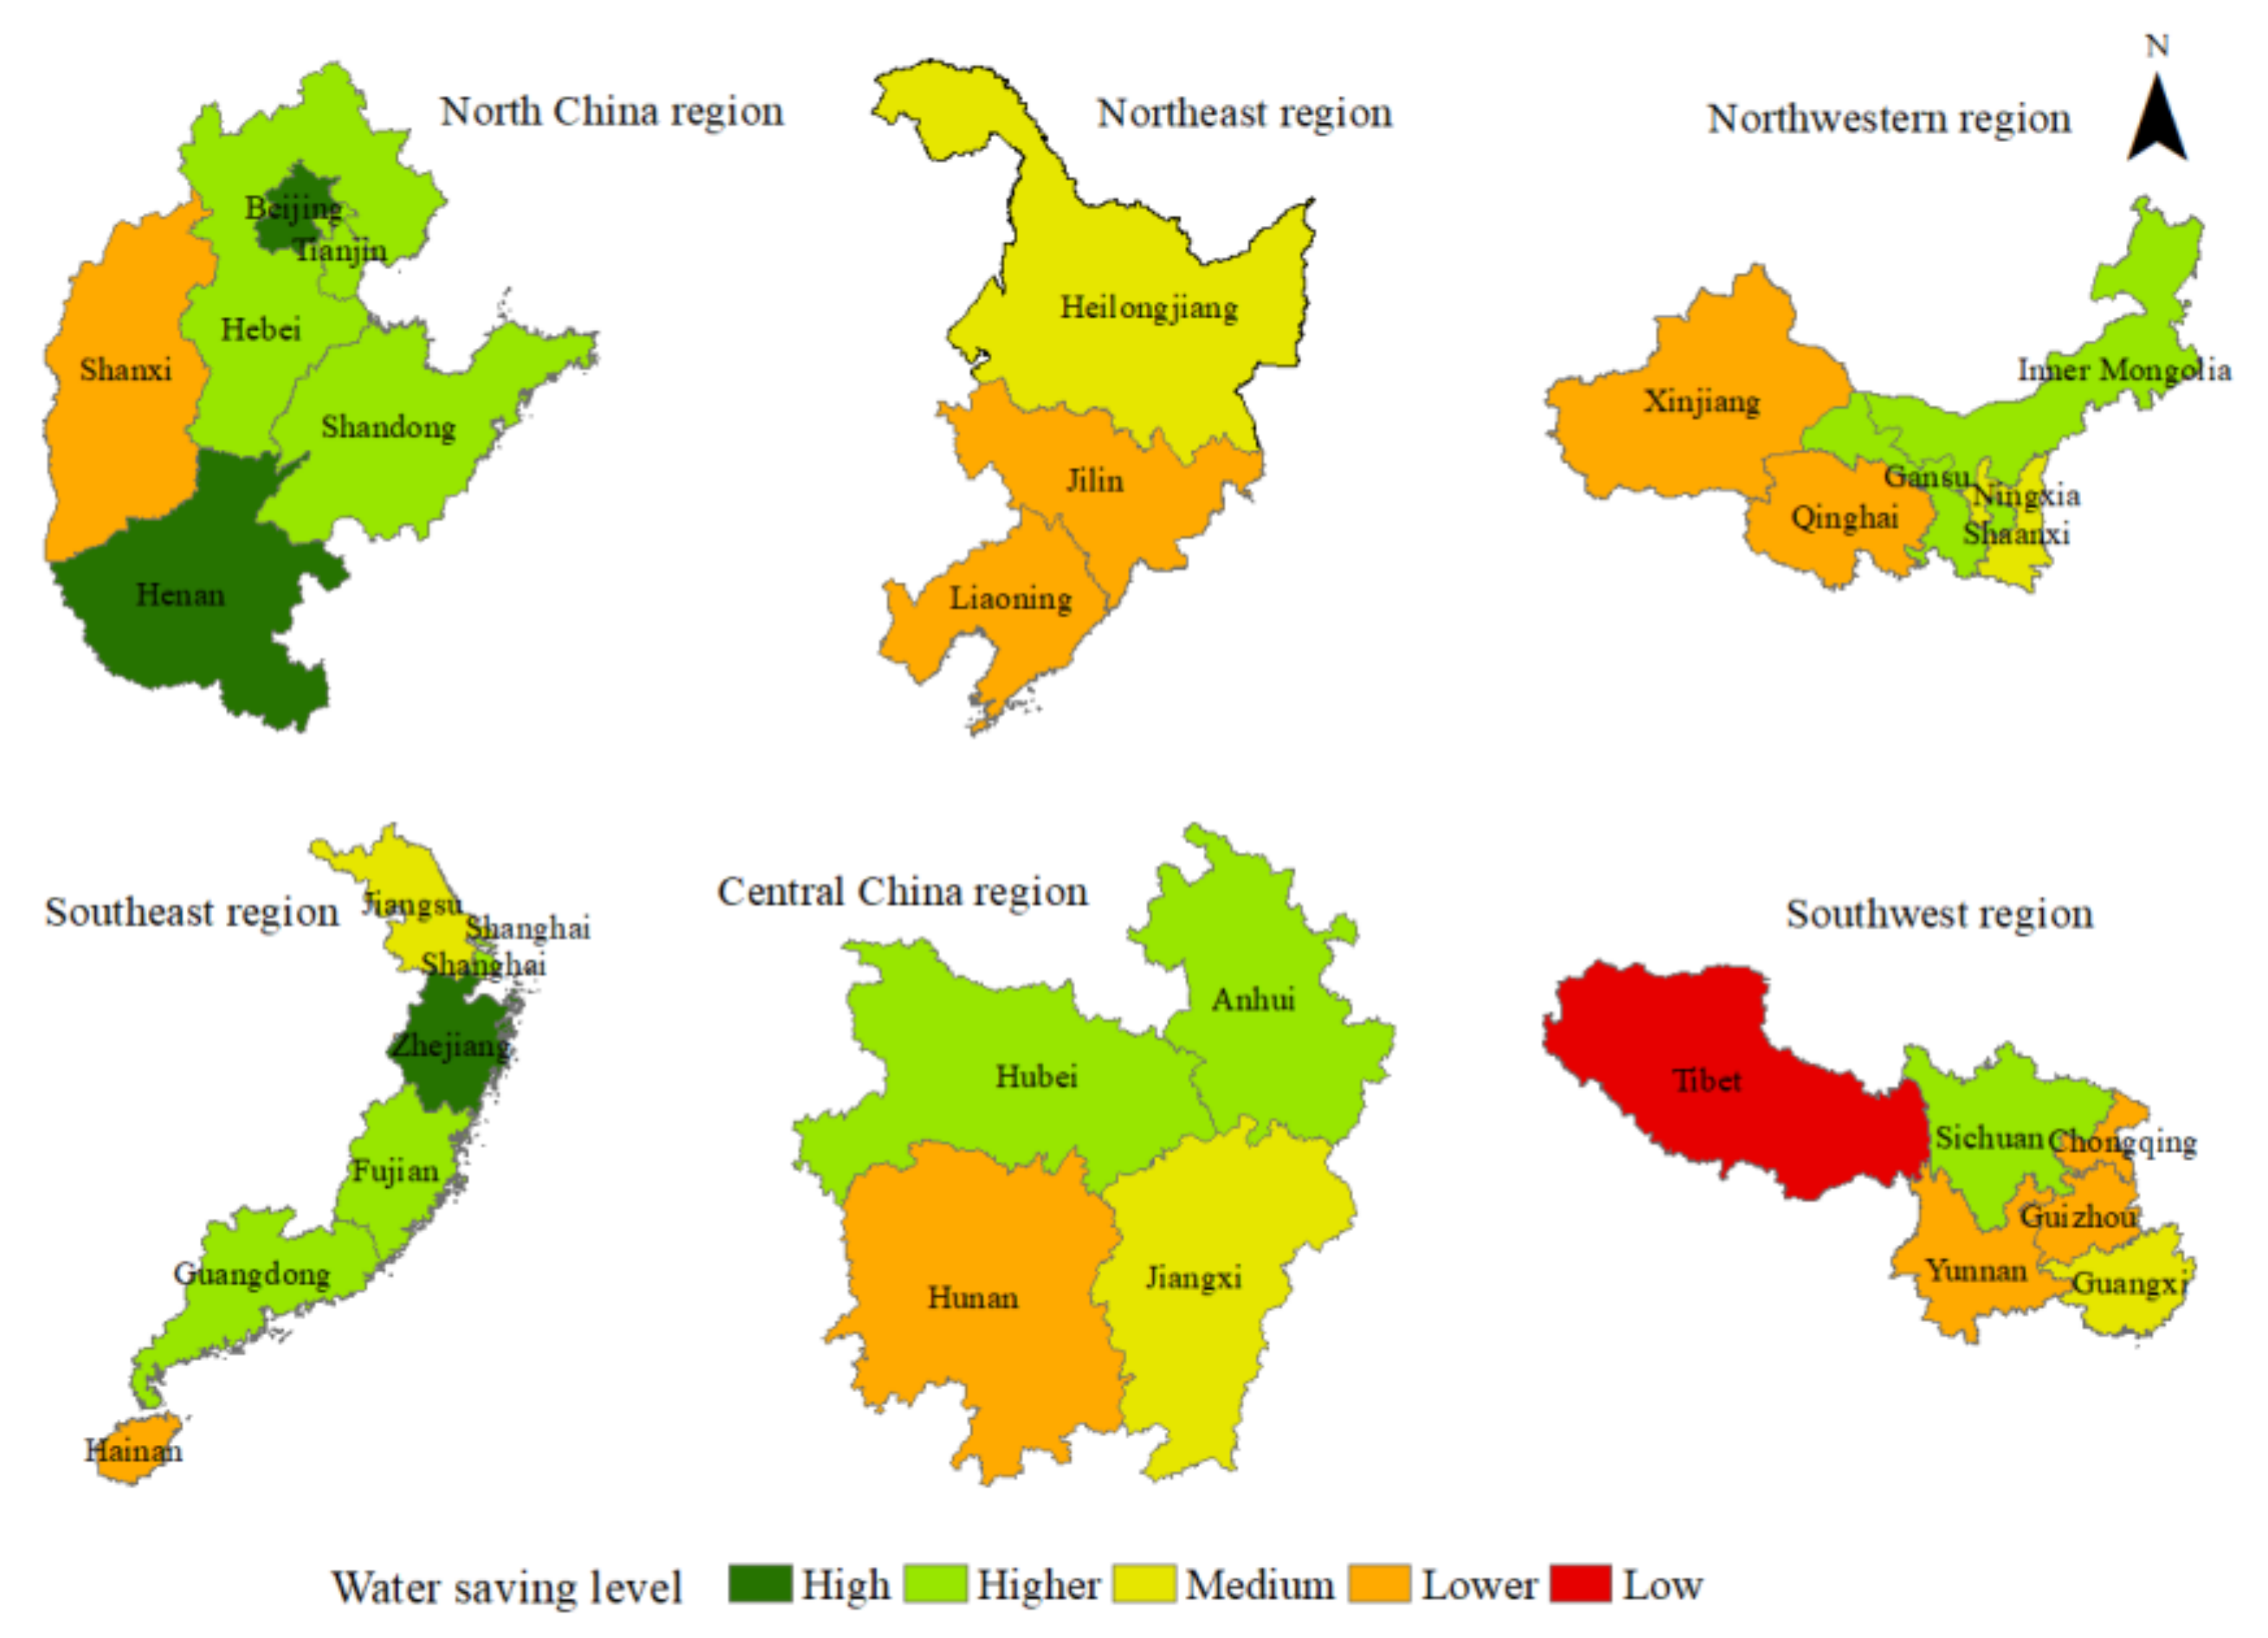
According to the “13th Five-Year Plan” for the construction of water-saving society [29], the national water-saving work is divided into six regions, including Northeast, Southwest, North China, Central China, Northwest and Southeast. Based on this, the water-saving level in the six regions is determined (Figure 7).
As a whole, North China, Central China and Southeast China have high economic levels, dense population and a large amount of water resources. Therefore, all provinces and autonomous regions should insist on giving priority to conservation [30], aiming at promoting water saving through structural adjustment to improve water-saving efficiency and keep the water-saving level at medium or above. In Southwest China, Guangxi, Chongqing and Yunnan provinces have complex terrain structure and abundant regional water resources [31]. However, the economic and social development is relatively backward and the water-saving level is low, so there is great potential for water saving. In view of the characteristics of regional resources and the disadvantages of water-saving work, it is necessary to strengthen the promotion of water-saving work to promote the sustainable development of water resources. Due to the impact of geographical environment, Northwest China is faced with the problems of water shortage and ecosystem imbalance [32] and the backward economy also restricts water-saving management. Compared with the Northwest regions, Jiangsu, Jiangxi and Hunan provinces in the Southern region have abundant water resources, but the regional and seasonal drought and water pollution problems are serious. Therefore, there is a lot of room for improvement in the construction of water-saving society in the south. Different regions have different priorities for promoting water-saving work, so each region should summarize the restrictive factors in the process of promoting water-saving work and formulate water-saving work implementation plans in combination with natural geographical conditions and socio-economic development characteristics.
3.4.3. Analysis of Factors Affecting Water-Saving Level
According to the analysis of evaluation indexes, it can be seen that the utilization ratio of unconventional water sources and the effective utilization coefficient of farmland irrigation water have a great impact on regional water-saving level, as illustrated in Figure 8. From the perspective of the proportion of unconventional water sources, only North China has a high water-saving level, while the water-saving level in the rest of the regions is at a lower level. In case of a shortage of conventional water resources, most provinces (autonomous regions and municipalities) must pay attention to the theoretical research and engineering construction of unconventional water resources to increase the total utilization of unconventional water resources. In terms of effective utilization coefficient of farmland irrigation water, the vast majority of regions are at a low level, which indicates that most regions in China have high water-saving potential for agricultural water use. Due to the low cost of farmland irrigation at present, farmers’ awareness of water conservation is weak and agricultural water-saving irrigation projects have not covered the whole country [33], so water-saving benefits are always at a low level. Therefore, it is necessary to develop a perfect legal system and implement high-efficiency water-saving irrigation technology to promote the development of agriculture.
4. Conclusions
Evaluation of the water-saving level is basic work in water resource planning, development, utilization, protection and management. Scientific and objective evaluation results can provide a decision-making basis for the sustainable utilization of resources and provide technical support to steadily promote the implementation of water conservation. This paper takes 31 provinces (region, city) in China (except Hong Kong, Macao and Taiwan) as the research object, establishes an evaluation index system of water saving, constructs an evaluation model of water-saving level based on the support vector machine optimized by genetic algorithm and discusses the water-saving level in provinces (region, city) and the factors affecting the water-saving level. The following preliminary conclusions are obtained: in 2018, the water-saving level in China presented spatial distribution characteristics with Beijing, Henan and Zhejiang Province as the center and gradually decreases outward; in terms of regions, the water-saving level in North China, Central China and Southeast China is relatively high, while the water-saving level in Northwest China, Southwest China and Northeast China needs to be improved. However, the effective utilization coefficient of farmland irrigation water and the proportion of unconventional water use have a relatively high impact on regional water-saving level, so each province (autonomous regions and municipalities) still needs to strengthen the water-saving level of unconventional water use and high-efficiency agricultural irrigation. Considering natural resource conditions and economic development, different regions should formulate water-saving construction plans suitable for their own regions and strengthen the construction of water-saving supervision systems and mechanisms to achieve the improvement in the level of water-saving in the whole region.
In terms of methods, the evaluation method of genetic algorithm optimization support vector machine has good performance in water-saving level evaluation and it is applied in China, a country with large regional differences in water-saving level, with high precision, which can be used as a reference for water-saving level evaluation in other countries. In this paper, only 14 evaluation indexes for 31 provinces (regions and cities) in 2018 are selected for analysis. They are greatly influenced by sample time series and spatial sequence. In the follow-up study, index data of different levels of multiple time series can be selected and the regions refined to make the evaluation results more specific and effective.
Author Contributions
All authors contributed to the study conception and design. Material preparation was performed by L.L. The data collection was performed by and H.Y., S.H. was responsible for data analysis. K.W. reviewed and modified the manuscript. The first draft of the manuscript was written by W.Z. and all authors commented on previous versions of the manuscript. All authors have read and agreed to the published version of the manuscript.
Funding
This study was funded by the National Natural Science Foundation of China (No. 51979119) and Basic R&D Special Fund of Central Government for Non-profit Research Institutes (HKY-JBYW-2020-17). The funders are Zhang Wenge.
Institutional Review Board Statement
Not applicable.
Informed Consent Statement
Not applicable.
Data Availability Statement
The original data used during the study were provided by a third party. The data that support the findings of this study are available in “China Water Resources Bulletin”, “China Statistical Yearbook”, “China Urban and Rural Construction Statistical Yearbook” and “China Water Statistics Yearbook”. These data were derived from the following resources available in the public domain: China Water Resources Bulletin: http://www.mwr.gov.cn/sj/tjgb/szygb/201907/t20190712_1349118.html (accessed on 1 May 2020), China Statistical Yearbook: http://www.stats.gov.cn/tjsj/ndsj/2018/indexch.htm(accessed on 1 May 2020), China Urban and Rural Construction Statistical Yearbook: http://www.mohurd.gov.cn/xytj/tjzljsxytjgb/jstjnj/ (accessed on 1 June 2020), China Water Statistics Yearbook: https://www.yearbookchina.com/navibooklist-n3020041501-1.html (accessed on 1 June 2020). The authors have made sure that all data and materials as well as software application or custom code comply with field standards.
Acknowledgments
The authors thank the National Natural Science Foundation of China (No. 51979119) and Basic R&D Special Fund of Central Government for Non-profit Research Institutes (HKY-JBYW-2020-17) for their partial financial support that made this project possible. The authors would also like to thank the support of Water Resources Institute of Yellow River Hydraulic Research Academy and School of Water Conservancy Engineering in Zhengzhou University.
Conflicts of Interest
The authors have no conflict of interest to declare that are relevant to the content of this article.
References
- Hopwood, J.L. The contribution of roadside grassland restorations to native bee conservation. Biol. Conserv. 2008, 141, 2632–2640. [Google Scholar] [CrossRef]
- Li, G. Thoughts on the implementation of the water saving priority water control policy-Do not forget the original heart, keep in mind the mission theme education research report. Hebei Water Resour. 2019, 8, 10–11. (In Chinese) [Google Scholar]
- Fang, H.; Gan, S.; Yu, Y. Comprehensive analysis of drought duration characteristics of regional water supply system. Adv. Water Sci. 2007, 1, 95–101. (In Chinese) [Google Scholar]
- Ben, A.J.; Sammis, T.W. Radiation and energy balance of a trickle-irrigated lemon grove. Agron. J. 1978, 70, 568. [Google Scholar]
- Thompson, R.L.; Lee, S.; Geib, S.J.; Cooper, N.J. Intramolecular bridge/terminal oxo exchange within oxomolybdenum [MoV2O3] 4+ complexes containing linear oxo bridges. Inorg. Chem. 1993, 32, 6067–6075. [Google Scholar] [CrossRef]
- Rinaudo, J.D.; Javier, C.; Marine, V.B. Tradable water saving certificates to improve urban water use efficiency: An ex-ante evaluation in a French case study. Aust. J. Agric. Resour. Econ. 2016, 60, 422–441. [Google Scholar] [CrossRef]
- Fidar, A.M.; Memon, F.A.; Butler, D. Performance evaluation of conventional and water saving taps. Sci. Total Environ. 2016, 541, 815–824. [Google Scholar] [CrossRef]
- Bryla, D.R.; Gartung, J.L.; Strik, B.C. Evaluation of Irrigation Methods for Highbush Blueberry—I. Growth and Water Requirements of Young Plants. HortScience 2011, 46, 95–101. [Google Scholar] [CrossRef]
- Fontenot, B.E.; Hildenbrand, Z.L.; Carlton, D.D.; Walton, J.L.; Schug, K.A. Response to comment on An evaluation of water quality in private drinking water wells near natural gas extraction sites in the barnett shale formation. Environ. Sci. Technol. 2014, 48, 3597–3599. [Google Scholar] [CrossRef]
- Mendelsohn, R.; Bennett, L.L. Global Warming and Water Management: Water Allocation and Project Evaluation. Clim. Chang. 1997, 37, 271–290. [Google Scholar] [CrossRef]
- Dong, H.; Geng, Y.; Sarkis, J.; Fujita, T.; Okadera, T.; Xue, B. Regional water footprint evaluation in China: A case of Liaoning. Sci. Total Environ. 2013, 442, 215–224. [Google Scholar] [CrossRef]
- Sušnik, J.; Vamvakeridou-Lyroudia, L.S.; Savić, D.A.; Kapelan, Z. Integrated System Dynamics Modelling for water scarcity assessment: Case study of the Kairouan region. Sci. Total Environ. 2012, 440, 290–306. [Google Scholar] [CrossRef]
- Sener, E.; Davraz, A. Assessment of groundwater vulnerability based on a modified DRASTIC model, GIS and an analytic hierarchy process (AHP) method: The case of Egirdir Lake basin (Isparta, Turkey). Hydrogeol. J. 2013, 21, 701–714. [Google Scholar] [CrossRef]
- Han, L.; Song, Y.; Duan, L.; Yuan, P. Risk assessment methodology for Shenyang Chemical Industrial Park based on fuzzy comprehensive evaluation. Environ. Earth Sci. 2015, 73, 5185–5192. [Google Scholar] [CrossRef]
- Uwe, T.; Bülent, U.; Melssen, W.J.; Buydens, L.M. Multivariate calibration with least-squares support vector machines. Anal. Chem. 2004, 76, 3099–3105. [Google Scholar]
- Zhang, Y.; Liu, W.; Cai, Y.; Khan, S.U.; Zhao, M. Decoupling analysis of water use and economic development in arid region of Chin—Based on quantity and quality of water use. Sci. Total Environ. 2020, 761, 143275. [Google Scholar] [CrossRef]
- Mei, J.; Li, J.; Ding, Y. Play the leading role of planning to implement the water saving priority policy—Reflections on the preparation of the 13th Five-Year water-saving society construction plan. China Water Resour. 2015, 7, 11–13. (In Chinese) [Google Scholar]
- Kang, S. Implementing the national water-saving action plan to promote the development of suitable agricultural water and green and efficient water saving. China Water Resour. 2019, 13, 1–6. (In Chinese) [Google Scholar]
- Qin, F. Interpretation of Water-saving Society Evaluation Index System and Evaluation Method. Public Stand. 2012, 06, 10–12. (In Chinese) [Google Scholar]
- Zeng, J.; Zou, B.; Qin, Y.; Chen, Q.; Xu, J.; Yin, L.; Jiang, H. Generalization ability of online pairwise support vector machine. J. Math. Anal. Appl. 2021, 497, 124914. [Google Scholar] [CrossRef]
- Hu, L.; Lu, S.; Wang, X. A new and informative active learning approach for support vector machine. Inf. Sci. 2013, 244, 142–160. [Google Scholar] [CrossRef]
- Sadeghi, M.; Roghanian, E. Reliability optimization for non-repairable series-parallel systems with a choice of redundancy strategies: Erlang time-to-failure distribution. Proc. Inst. Mech. Eng. 2017, 231, 587–604. [Google Scholar] [CrossRef]
- Zou, D.; Li, S.; Kong, X.; Ouyang, H.; Li, Z. Solving the combined heat and power economic dispatch problems by an improved genetic algorithm and a new constraint handling strategy. Appl. Energy 2019, 237, 646–670. [Google Scholar] [CrossRef]
- Yu, Q.; Sun, S.; Liu, J. Practice and exploration of the construction of water-saving society in counties in my country. China Water Resour. 2020, 7, 14–19. (In Chinese) [Google Scholar]
- Pendharkar, P. Misclassification Cost Minimizing Fitness Functions for Genetic Algorithm-Based Artificial Neural Network Classifiers. J. Oper. Res. Soc. 2009, 60, 1123–1134. [Google Scholar] [CrossRef]
- Li, Y.; Chen, B.; Chen, G.; Meng, J.; Hayat, T. An embodied energy perspective of urban economy: A three-scale analysis for Beijing 2002–2012 with headquarter effect. Sci. Total Environ. 2020, 732, 139097. [Google Scholar] [CrossRef]
- Ndagijimana, M.; Kessler, A.; Asseldonk, M.V. Understanding farmers’ investments in sustainable land management in Burundi: A case-study in the provinces of Gitega and Muyinga. Land Degrad. Dev. 2019, 30, 417–425. [Google Scholar] [CrossRef]
- Feng, S.; Lu, H.; Yao, T.; Liu, Y.; Tian, P.; Lu, J. Microplastic footprints in the Qinghai-Tibet Plateau and their implications to the Yangtze River Basin. J. Hazard. Mater. 2021, 407, 124776. [Google Scholar] [CrossRef]
- Li, W. Thirteenth Five-Year Plan for the Construction of a Water-saving Society is issued and requires the improvement of the water-saving standard system. Eng. Constr. Stand. 2017, 2, 7. (In Chinese) [Google Scholar]
- Du, M.; Liao, L.; Wang, B.; Chen, Z. Evaluating the effectiveness of the water-saving society construction in China: A quasi-natural experiment. J. Environ. Manag. 2021, 277, 111394. [Google Scholar] [CrossRef]
- Lu, H.; Wu, Y.; Li, Y.; Liu, Y. Effects of meteorological droughts on agricultural water resources in southern China. J. Hydrol. 2017, 548, 419–435. [Google Scholar] [CrossRef]
- Alvarez, V.M.; Leyva, J.C.; Valero, J.F.M.; Górriz, B.M. Economic assessment of shade-cloth covers for agricultural irrigation reservoirs in a semi-arid climate. Agric. Water Manag. 2009, 96, 1351–1359. [Google Scholar] [CrossRef]
- Belder, P.; Bouman, B.A.M.; Cabangon, R.; Guoan, L.; Quilang, E.J.P.; Yuanhua, L.; Spiertz, J.H.J.; Tuong, T.P. Effect of water-saving irrigation on rice yield and water use in typical lowland conditions in Asia. Agric. Water Manag. 2003, 65, 193–210. [Google Scholar] [CrossRef]
Figure 1.
Genetic-algorithm-optimized support vector machine water-saving level classification flowchart.
Figure 1.
Genetic-algorithm-optimized support vector machine water-saving level classification flowchart.

Figure 2.
Scattered distribution chart of each indicator (The explanation of A1–D3 is shown in Table 1).
Figure 2.
Scattered distribution chart of each indicator (The explanation of A1–D3 is shown in Table 1).

Figure 3.
The number of provinces (regions, cities) at different levels of each index.

Figure 4.
Genetic algorithm iteration graph.

Figure 5.
GA-SVM algorithm program result graph.

Figure 6.
Spatial distribution characteristics of regional water-saving levels in China.

Figure 7.
Spatial distribution of regional water-saving levels by district.

Figure 8.
Low-level indicators district statistics chart.


Table 1.
Comprehensive evaluation index system of regional water-saving level.
| Index Type | Index | Unit | Evaluation Direction | |
|---|---|---|---|---|
| Comprehensive evaluation index of regional water-saving level | Comprehensive water-saving indicators | Total water consumption control degree (A1) | % | The smaller the better |
| Water consumption per ten thousand yuan GDP (A2) | m3/ten thousand yuan | The smaller the better | ||
| Decline rate of water consumption per ten thousand yuan of GDP (A3) | % | The bigger the better | ||
| Ratio of unconventional water resource consumption (A4) | % | The bigger the better | ||
| Industrial water-saving indicators | Water consumption per ten thousand yuan of industrial added value (B1) | m3/ten thousand yuan | The smaller the better | |
| Utilization rate of water for irrigation (B2) | % | The bigger the better | ||
| Agricultural water-saving indicators | Efficient utilization coefficient of irrigation water (C1) | Dimensionless | The bigger the better | |
| Proportion of high-efficiency water-saving irrigation area (C2) | % | The bigger the better | ||
| Water-saving indicators for urban life | Leakage rate of urban public water supply pipe network (D1) | % | The smaller the better | |
| Penetration rate of water-saving appliances (D2) | % | The bigger the better | ||
| Centralized rate of urban sewage treatment (D3) | % | The bigger the better | ||
| Water-saving management indicators | Plan water rate (E1) | % | The bigger the better | |
| Installation rate of metering facilities (E2) | % | The bigger the better | ||
| Standard quota timeliness (E3) | Dimensionless | The bigger the better | ||
Table 2.
Threshold division of each indicator at each level.
| Index | Value Distribution of Each Level | ||||
|---|---|---|---|---|---|
| High Level | Higher Level | Medium Level | Lower Level | Low Level | |
| Total water consumption control degree (%) | 60~80 | 80~85 | 85~90 | 90~100 | 100~120 |
| Water consumption per ten thousand yuan GDP (m3/ten thousand yuan) | 10~40 | 40~70 | 70~90 | 90~200 | 200~520 |
| Decline rate of water consumption per ten thousand yuan of GDP (%) | 30~35 | 25~30 | 20~25 | 10~20 | 0~10 |
| Ratio of unconventional water resource consumption (%) | 10~30 | 2.0~10 | 1.0~2.0 | 0.6~1.0 | 0~0.6 |
| Water consumption per ten thousand yuan of industrial added value (m3/ten thousand yuan) | 7~20 | 20~40 | 40~50 | 50~100 | 100~120 |
| Utilization rate of water for irrigation (%) | 90~100 | 80~90 | 60~80 | 40~60 | 15~40 |
| Efficient utilization coefficient of irrigation water | 0.7~0.8 | 0.6~0.7 | 0.55~0.6 | 0.5~0.55 | 0.4~0.5 |
| Proportion of high-efficiency water-saving irrigation area (%) | 70~100 | 40~70 | 20~40 | 10~20 | 0~10 |
| Leakage rate of urban public water supply pipe network (%) | 0~13 | 13~14 | 14~15 | 15~20 | 20~30 |
| Penetration rate of water-saving appliances (%) | 90~100 | 70~90 | 60~70 | 50~60 | 0~50 |
| Plan water rate (%) | 80~100 | 60~80 | 40~60 | 20~40 | 0~20 |
| Installation rate of metering facilities (%) | 90~100 | 80~90 | 70~80 | 50~70 | 0~50 |
| Standard quota timeliness | 2020 | 2019 | 2018 | 2016~2017 | 2014~2015 |
| Centralized rate of urban sewage treatment (%) | 97~100 | 95~97 | 93~95 | 90~93 | 80~90 |
Publisher’s Note: MDPI stays neutral with regard to jurisdictional claims in published maps and institutional affiliations. |
© 2022 by the authors. Licensee MDPI, Basel, Switzerland. This article is an open access article distributed under the terms and conditions of the Creative Commons Attribution (CC BY) license (https://creativecommons.org/licenses/by/4.0/).
Share and Cite
MDPI and ACS Style
Zhang, W.; Hou, S.; Yin, H.; Li, L.; Wu, K. Evaluation of Regional Water-Saving Level Based on Support Vector Machine Optimized by Genetic Algorithm. Water 2022, 14, 2615. https://doi.org/10.3390/w14172615
AMA Style
Zhang W, Hou S, Yin H, Li L, Wu K. Evaluation of Regional Water-Saving Level Based on Support Vector Machine Optimized by Genetic Algorithm. Water. 2022; 14(17):2615. https://doi.org/10.3390/w14172615
Chicago/Turabian StyleZhang, Wenge, Shengling Hou, Huijuan Yin, Lingqi Li, and Kai Wu. 2022. "Evaluation of Regional Water-Saving Level Based on Support Vector Machine Optimized by Genetic Algorithm" Water 14, no. 17: 2615. https://doi.org/10.3390/w14172615
Note that from the first issue of 2016, this journal uses article numbers instead of page numbers. See further details here.