
Differences in Mercury Concentrations in Water and Hydrobionts of the Crimean Saline Lakes: Does Only Salinity Matter?


A.O. Kovalevsky Institute of Biology of the Southern Seas of RAS, 2 Nakhimov Ave., 299011 Sevastopol, Russia
*
Author to whom correspondence should be addressed.
Water 2022, 14(17), 2613; https://doi.org/10.3390/w14172613
Submission received: 17 July 2022
/
Revised: 22 August 2022
/
Accepted: 23 August 2022
/
Published: 25 August 2022
(This article belongs to the Special Issue Ecosystems of Inland Saline Waters)
Abstract
:Of significant scientific and public concern is the high toxicity, significant bioaccumulation, and magnified concentration within the food web of mercury (Hg). Hg content both dissolved and in suspended forms in water as well as in biomass of different hydrobiont taxa was studied in 18 saline lakes in Crimea from 2012 to 2021. The impact of different factors (salinity, seasonality, anthropogenic activities, geological background, etc.) was analyzed. The generalization of data for all lakes showed that the average concentration of Hg in dissolved form was 129 ng L−1, varying over a wide range. The content of Hg in total suspended substrates was an average of 151 ng L−1, and the total content of Hg in lake water averaged 291 ng L−1. Geological background and anthropogenic activities can determine the total Hg content in lakes. In most lakes, a significant positive correlation was noted between the concentration of one, two, or all three indicators of Hg content and the month of the year, with indicators increasing from winter through to autumn. When analyzing the entire data array, a significant positive correlation was found between the concentration of the suspended form of Hg and salinity; such correlation between the concentration of the dissolved form of Hg and salinity was absent. The highest average Hg concentrations in biomasses were noted in Artemia and were the lowest in plants. Geological background and human activity contribute to high Hg content in lakes. Hydrobionts can significantly influence the distribution and behavior of Hg, being an important factor of its cycle in the lakes.
1. Introduction
Hg concentration has been increasing in the atmosphere, water bodies, and soil since the middle of the nineteenth century [1,2,3,4]. Today, various natural sources, such as volcanoes, are responsible for approximately half of the Hg emissions in the atmosphere, and the other half is human-generated [5]. Currently, human activities have produced Hg emissions at a rate 3 to 5 times higher than before the Industrial Revolution in the 1800s [4,6]. There is scientific and public concern regarding Hg due to its high toxicity, significant bioaccumulation, and magnification of concentrations during up the food web [7,8]. Organisms at higher trophic levels accumulate larger concentrations of Hg than lower ones [7,9]. Among different land ecosystems, lakes act as integrators of their watersheds and airsheds and accumulators of contaminants including Hg [9,10,11]. Direct atmospheric deposition and watershed runoff are the main sources of input Hg in lakes [11,12]. As an example, atmospheric deposition was the dominant Hg input source in Great Salt Lake (84% of a year’s total input), and cumulative riverine Hg load was only 16% [12].
Lakes represent important habitats for fish and other valuable hydrobionts, which can accumulate Hg to risk levels for humans and birds [8,9]. Consequently, scientific attention is increasing on all issues of Hg distribution and accumulation in the lake ecosystem components as well as factors influencing these. Even though the total volume of saline lakes on the planet is close to that of fresh lakes, much less attention is paid to different issues of their study than in fresh lakes, including Hg behavior.
Saline lakes play an important natural role and provide people with a wide range of ecosystem services [13,14]. Among other things, they are important areas for nesting, foraging, wintering, and resting during migrations of a wide variety of birds [15,16]. In the hypersaline Great Salt Lake, there is a high Hg concentration, which creates risks for many birds [9]. As an example, Goldeneye ducks accumulate high Hg concentration due to a magnification of 270 times that found in food organisms [9]. The need for more economical use of freshwater leads to the fact that in recent years, the use of various saline and hypersaline lakes for the development of aquaculture has been expanding [17]. This dictates the need to intensify the study of the behavior of Hg in salt lakes with different salinity, both for the development of the ecosystem and biogeochemical concepts and for topical issues of the social and economic development of society, especially in arid regions.
In Crimea, the largest peninsula in the Black Sea, 50 relatively large lakes and many small saline lakes exist [14,18,19]. Lake Sasyk-Sivash has the largest surface area of 75 km2. All lakes are shallow with a maximum depth of no more than 2 m. Salinity fluctuates in a wide range; the annual average salinity varies from 3 to 300 g L−1; interannual differences are also considerable. The Crimea peninsula lies in the flight paths of important bird migration routes between Western and Eastern Palearctic, Africa, and Asia [15]. The Crimean saline lakes provide homes and food for many bird species nesting here or having a seasonal settlement of many thousands of migrating birds. Artemia and other crustaceans are among the main food items for many of them. Due to its diversity of lakes, Crimea is a good area to look for general patterns in Hg behavior within them. The distribution of Hg within the lakes has been studied since 2012, but only a small portion of obtained data was previously published [20,21].
The objectives of this study are: 1. to present new long-term study data; 2. to analyze a coupling of different factors in the determination of Hg behavior in saline lakes, and 3. to prove or disprove the assumptions that: (a) salinity is an important factor in Hg cycling but no one general pattern of this exists, and (b) the crustacean Artemia may be the most important factor of Hg cycling in Crimean saline lakes.
2. Materials and Methods
2.1. Study Area
Due to climate aridity, there are more than sixty saline and hypersaline lakes in Crimea, the largest peninsula in the Black Sea (the area is about 27,000 km2 [18,19,22]. All lakes are shallow polymictic (depth < 2 m) and differ in area, depth, total salinity, geochemical peculiarities, biotic composition, and productivity [18,19,22,23,24,25,26,27]. Of them, 18 were studied in the period from 2013 to 2021 (Figure 1, Table 1).
2.2. Field Studies
In total, 88 samples of water, 25 samples of hydrobiont biomass, and 12 quantitative zooplankton samples were collected by wading. All methods used have been previously described in more detail [25,28], and they are given below. In total, 1 L water samples were taken by bathometer during every survey. At sampling sites, temperature, salinity, and pH were determined by a PHH-830 electronic thermometer (OMEGA Engineering, INC., Norwalk, CT, USA), a WZ212 refractometer (Kelilong Electron Co., Ltd., Fuan, Fujian, China), and a PHH-830 pH meter (METTLER TOLEDO, Greifensee, Switzerland), respectively. The concentration of total suspended solids (TSS) was assessed by the biophysical complex “Condor” (produced by Akvastandart-Yug, Sevastopol, Russia), which was applied in “point” mode [25]. Zooplankton quantitative samples were taken by filtration of 50–100 L of water through a plankton net (a mesh size of 110 microns). Zooplankton samples were fixed with 4% formalin to identify animal species and to calculate their abundance.
2.3. Laboratory Studies
For separation of the forms of Hg, water samples were filtered through nuclear 0.45-μmpore size filters, which were pre-weighed by an analytical balance VIBRA HT 224RCE (Shinko Denshi Co., Itabashi, Tokyo, Japan), and water was fixed by concentrated nitric acid (10 mL of HNO3 per 1 L of water) [21,25]. The dissolved Hg form was evaluated in the filtered solution, and the Hg suspended form was determined on the filters. Potassium permanganate solution was added to the filtered water for oxidation in a volume of 15–20 mL and then 5 mL ½ sulfuric acid, reducing all dissolved Hg forms to ions. Solids on the filters were acid burned (10 mL ½H2SO4 and 5 mL HNO3 per sample). When analyzing wet biomass of hydrobionts, two drops of H2O2 were added instead of HNO3. In the next stage, the samples were reduced at no more than 60 °C and then cooled. A potassium permanganate solution was added into the samples in an amount ensuring complete oxidation of the analyzed sample (from 15 to 20 mL), and the samples were filtered after 10–15 min. Before chemical analyses on a device, 5 mL sulfuric acid (1:1) was added to 100 mL of the filtered sample. A hydroxylamine solution of up to 5 mL was put into all samples to remove excess potassium permanganate. For chemical analyses, 10 mL of a reducing agent (SnCl2) was added. After these manipulations, prepared samples were analyzed by flameless atomic absorption on a Hiranuma-1 mercury analyzer (Hiranuma Sangyo Co., Ltd., Mito, Ibaraki, Japan). The Hg concentration was determined at a wavelength of 253.7 nm. For calibration of the Hiranuma-1 mercury analyzer, a standard solution of mercury (II) ions was used. At the first stage, a ‘blank calibration’ was done (100 mL of distilled water + 5 mL of H2SO4 (1:1)), and then calibration with a series of calibration solutions: 0.2; 0.4; 0.6; 0.8; 1 μg dm−3 (10 replicates for each concentration). The Hiranuma-1 sensitivity was 0.01 with the detection limit of 0.5 ng L−1 of Hg. To determine Hg in hydrobionts, their wet biomass samples were processed in the same way as described above for suspended matter. All obtained values were re-calculated for dry biomass with known coefficients (% dry mass in wet biomass): for Artemia—11%, Artemia cysts—40%; Cladophora and Polysiphonia—16%, Ruppia—15%, Potamogeton, Stuckenia and Myriophyllum—11%. The zooplankton samples were processed using Olympus SZ-ST (Olympus, Tokyo, Japan) and LOMO MBS-9 (LOMO, St. Petersburg, Russia) stereo microscopes.
Coefficients of Hg accumulation by total suspended solids (TSS), also known as distribution coefficient, or by hydrobiont biomass (bioconcentration factor) may be calculated [29,30]:
where Ksus(biom) is a coefficient of Hg accumulation by TSS (or biomass), L kg−1; Hgsus(biom) is the Hg concentration in TSS (or biomass), ng kg−1 (dry weight); Hgdis is the concentration of Hg in the dissolved phase, ng L−1.
Ksus(biom) = Hgsus(biom)/Hgdis
All results were subjected to statistical processing in MS Excel 2007 and Statistica 6.0. Mean values, standard deviations (SD), and coefficients of variability (CV) were calculated as well as parameters of regression equations, coefficients of correlation ®, and determination (R2). After normality tests [31], the significance of differences between mean values of the data subsets was assessed by Student’s t-test. The confidence levels (p) for the correlation coefficients were evaluated [32].
3. Results
3.1. Mercury in Water
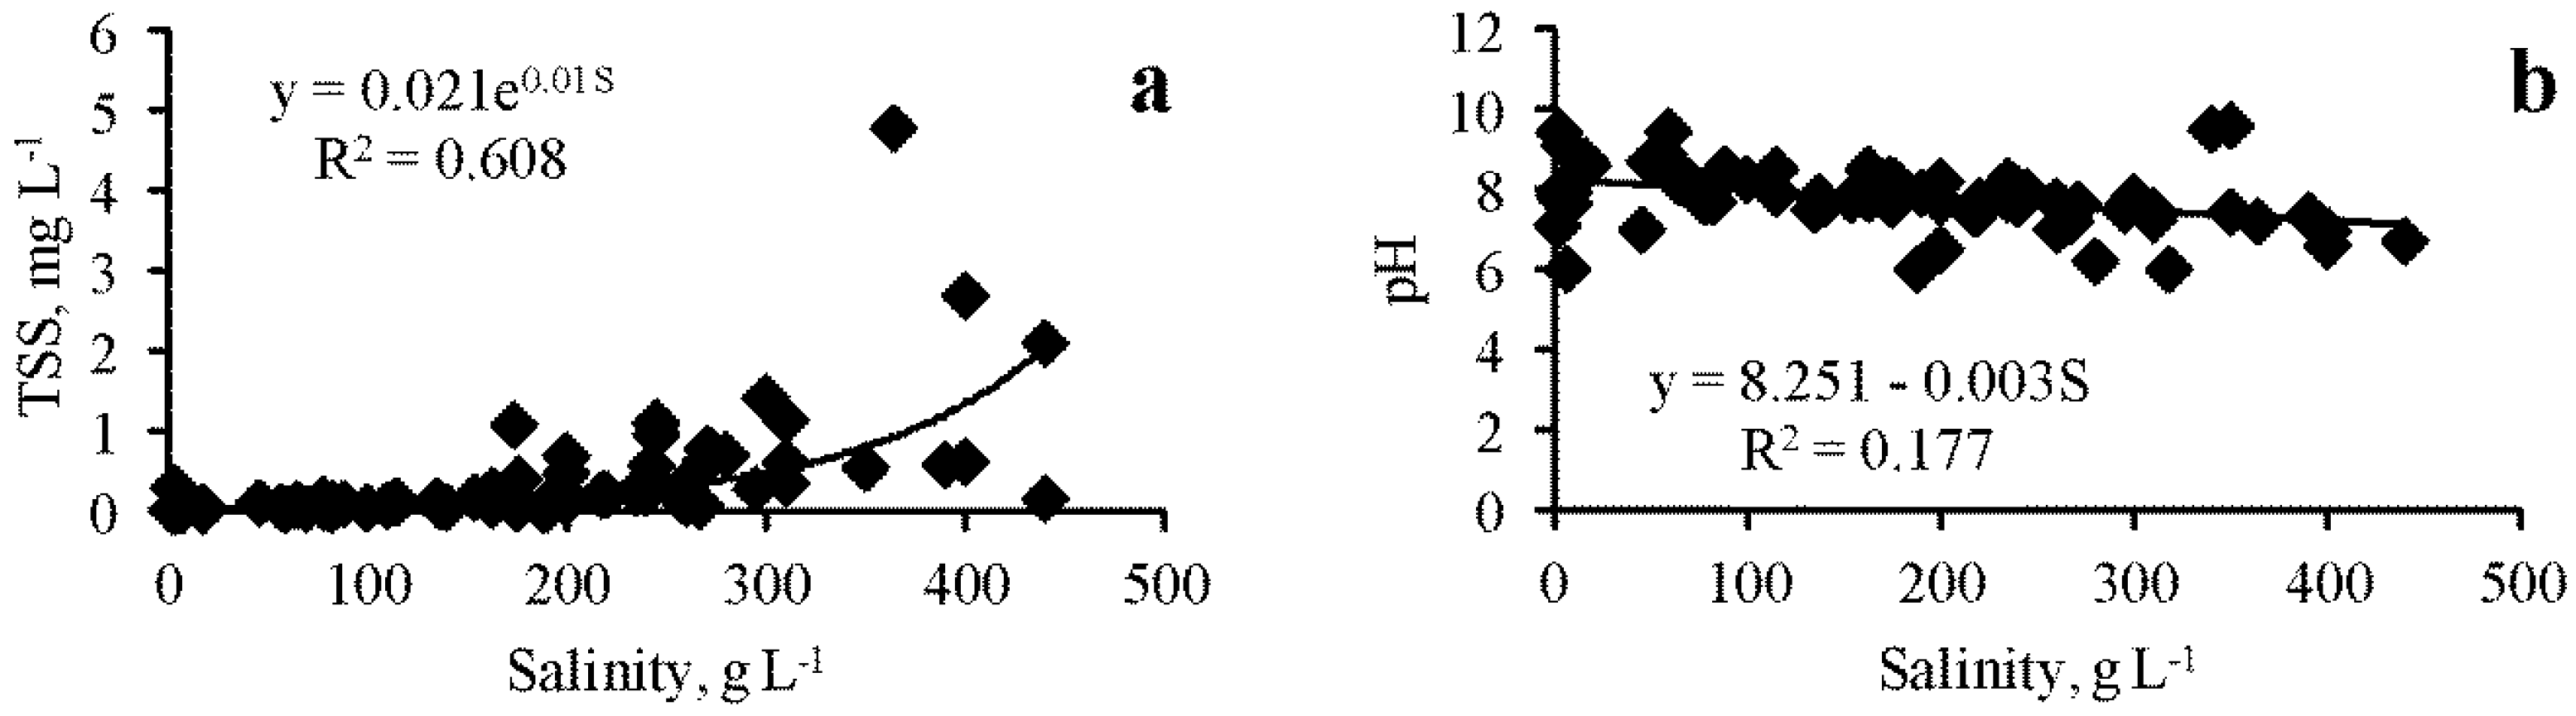
As can be seen from Table 1, the physicochemical parameters of the lakes varied within a very wide range: the total range of salinity in the studied lakes was from 2.5 to 420 g L−1, temperatures varied from 4 to 41 °C, pH from 6 to 9.5, and the concentration of TSS in the water from 0.001 to 4.78 g L−1. When analyzing the entire array of data obtained (Figure 2a), a significant positive correlation was found between salinity and total suspended solids concentration (R = 0.780, p = 0.0001), and the dependence is approximated by an exponential equation:
where TSS is total suspended solids, mg L−1; S is salinity, g L−1.
TSS = 0.021e0.01S
When analyzing the relationship between the temporal variability of these two parameters in individual lakes, their correlation as a rule, is even stronger, as in Lake Kiyatskoe (R = 0.872, p = 0.001),for example, although in some other lakes, the relationship between these values was unreliable. When analyzing the entire data array (Figure 2b), a significant negative dependence of pH on salinity was noted (R = 0.420, p = 0.0005):
pH = 8.251 − 0.003S
Table 2 shows rather high spatial and temporal variability of Hg forms in Crimean saline lakes. If the one outlier with a very high value (3635 ng L−1, Lake Kyzyl-Yar, 11/18/2014) is excluded, then generalization for all lakes shows that the average concentration of Hg in dissolved form was 129 ng L−1, varying over a wide range (coefficient of variation, CV = 0.983). The content of Hg in TSS (excluding the value of 3150 ng L−1, Lake Chokrak, 08/17/2017) was an average of 151 ng L−1 (CV = 1.020), and the total content of Hg in lake water, excluding the above cases, averaged 323 ng L−1 (CV = 1.230). Of these three indicators, the concentration of dissolved Hg was the least variable, and that of total Hg was the most variable.
The coefficients of variation (CV) of the concentration of the dissolved form of Hg, as well as others, in one lake are indicators of the range of temporal variability of the parameters under consideration, and all other CVs characterize spatial variability. Based on the comparison of CV values (Table 2), it can be concluded that the spatial and temporal variability for all indicators is close. Comparison of variability between lakes within a group and between groups shows that they are approximately of the same order (Table 2). At the same time, the average indicators differ for lakes of different groups. According to the average concentration, lake groups are divided into two clusters (Table 2). The average concentration of dissolved forms of Hg does not differ significantly between the Perekop, Tarkhankut, and Kerch lake groups, averaging 135 ng L−1 (CV = 0.201), and in the Evpatoria and Feodosia groups, on average 76 ng L−1 (CV = 0.164). In terms of suspended and total Hg, the differences between all lake groups are more pronounced (Table 2). On average, the lowest concentration of suspended forms of Hg was noted in the Tarkhankut lake group, and in the Evpatoria group, it is slightly higher (Table 2), but the differences are not statistically significant. In the Perekop and Feodosiya groups of lakes, it is significantly higher (p = 0.01) by two times (Table 2). The highest concentration of suspended forms of Hg was noted in the lakes of the Kerch group (Table 2), on average 554 ng L−1 (CV = 0.752). The total average content of Hg in the water of different groups of lakes varied from 177 ng L−1 (CV = 0.554) in the Evpatoria lake group to 583 ng L−1 (CV = 0.544) in the Kerch group (Table 2). The average proportion of dissolved forms in the total Hg content in water differed little in lakes of different groups, from 27% (CV = 0.161) and 29% (CV = 0.752) in the Feodosia and Kerch lake groups, respectively, to 45% (CV = 0.401) in the Perekop group (Table 2). The coefficient of Hg accumulation in suspension averaged 24,523 (CV = 2.053), ranging from 9341 (CV = 0.291) in the Perekop group of lakes to 44,321 (CV = 1.042) in the Evpatoria group (Table 2). The Kerch and Perekop groups of lakes do not differ significantly in this parameter, as do the Evpatoria and Tarkhankut groups of lakes, but these two pairs of groups differ significantly from each other (p = 0.005).
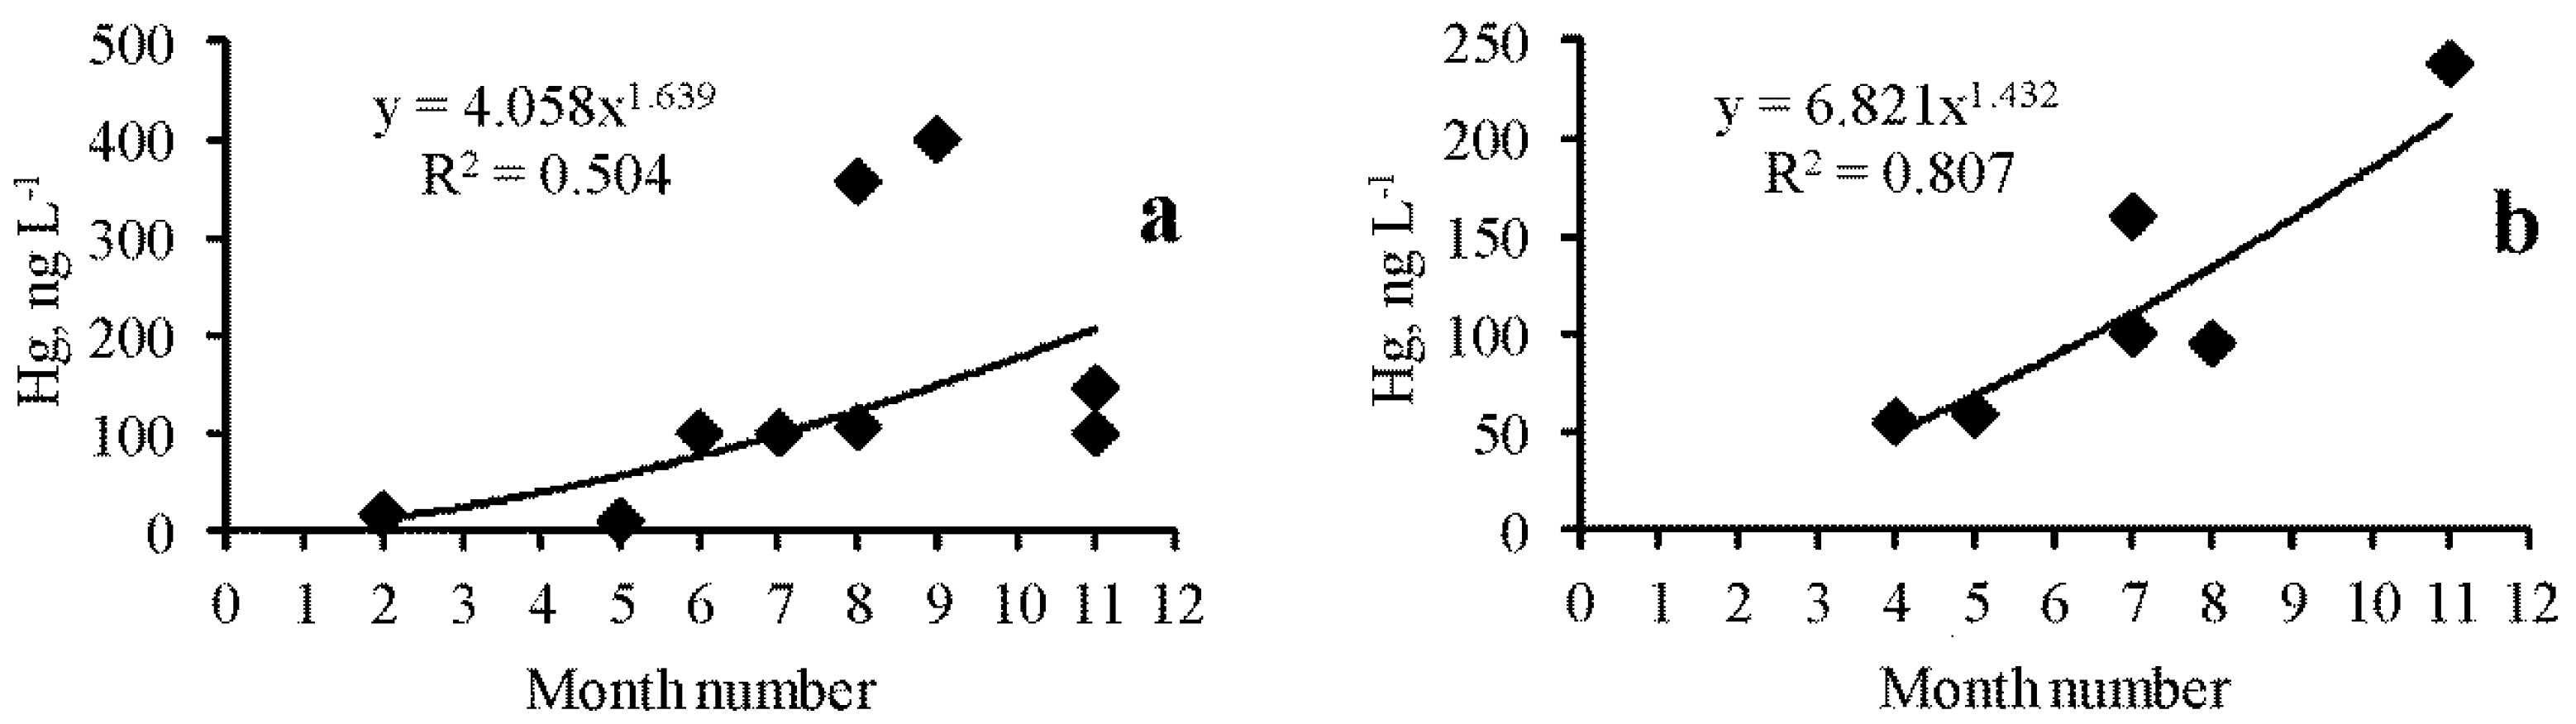
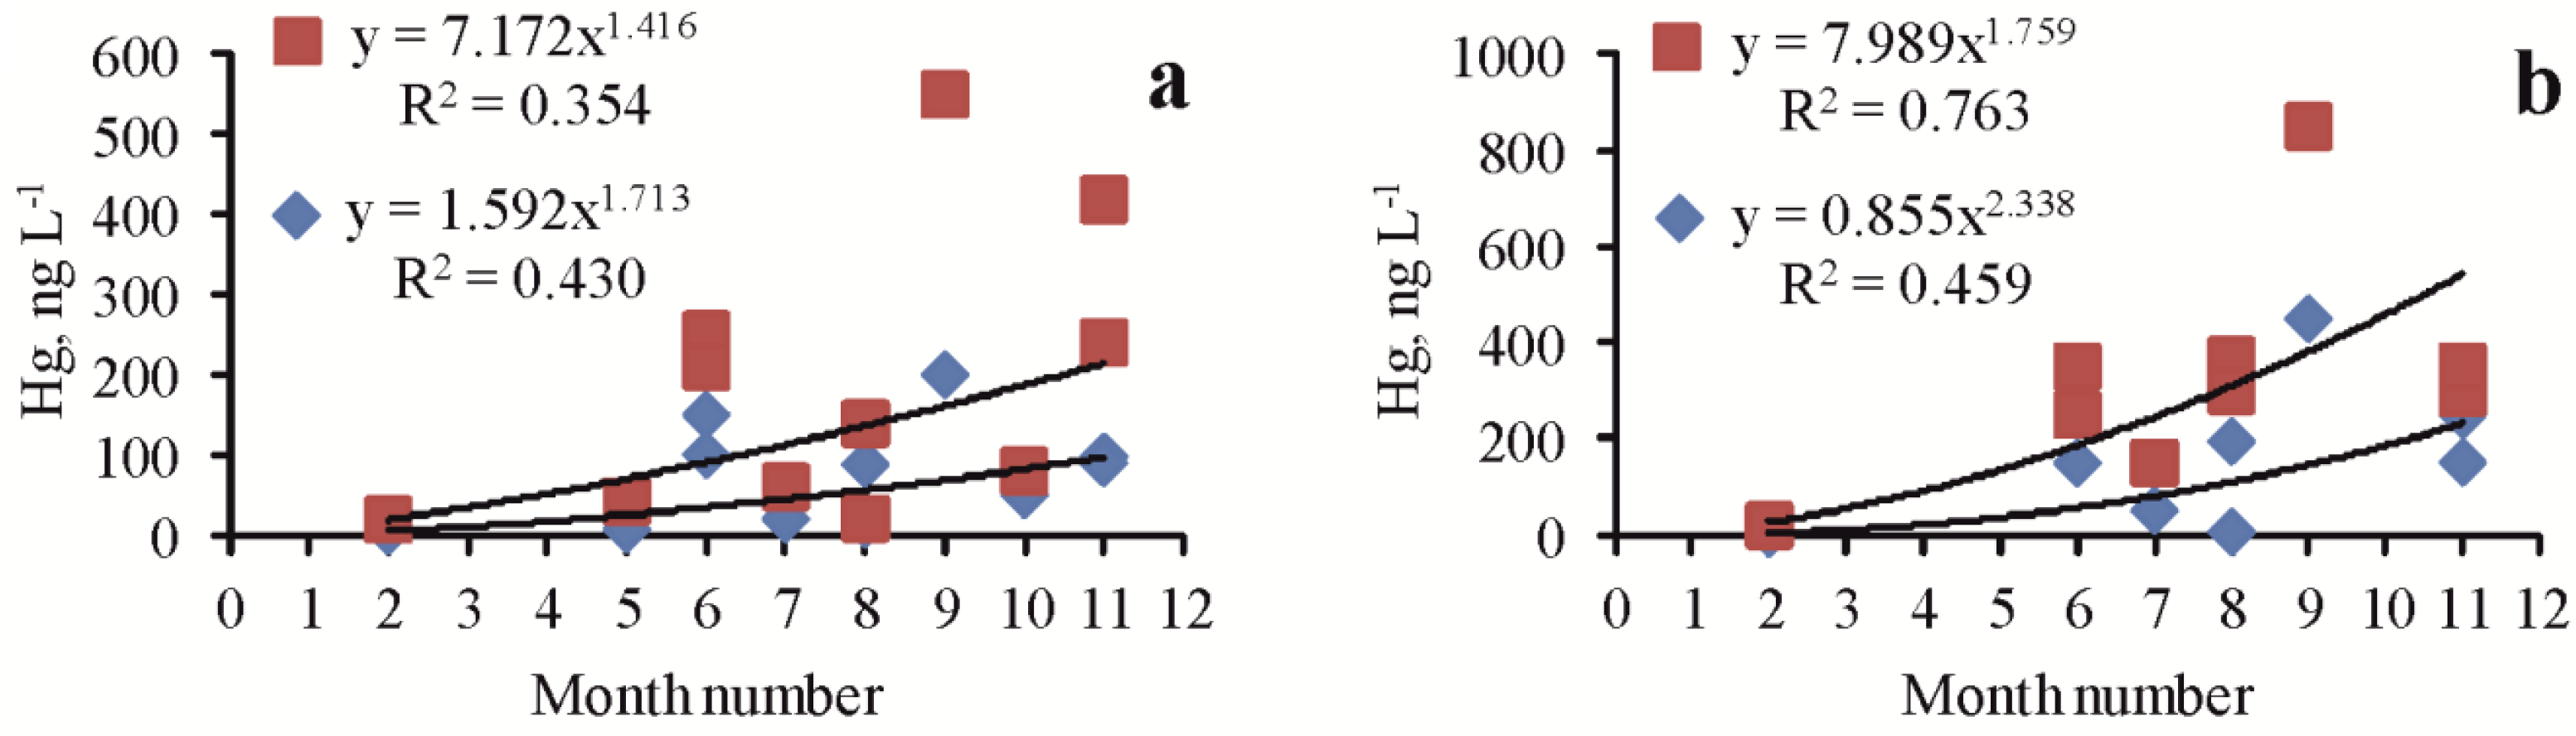
The data series obtained for several lakes (Table 1) made it possible to analyze seasonal changes in various forms of Hg in these lakes. In most lakes, a significant positive correlation was noted between the concentration of one, two, or all three indicators of Hg content and the season of the month, i.e., indicators increased from winter to autumn. In particular, for dissolved forms, this was noted for lakes Kiyatskoe (R = 0.710, p = 0.008) (Figure 3a) and Bakalskoe (R = 0.896, p = 0.007) (Figure 3b), as well as Sasyk-Sivash (R = 0.736, p = 0.05) and Tobechikskoe (R = 0.996, p = 0.005). There was no dependence in lakes Dzharylgach and Kyzyl-Yar. There were significant seasonal changes in the Hg total content and in suspended form in the lakes Kiyatskoe and Kirleutskoe (Figure 4).
The concentrations of Hg dissolved and in suspended forms do not significantly correlate with each other in the total data set; however, in some lakes, a significant positive correlation was observed, as, for example, in Lake Bakalskoe (R = 0.840, p = 0.01), Lake Kirleutskoe (R = 0.805, p = 0.01), Kyzyl-Yar (R = 0.755, p = 0.02), Sasyk-Sivash (R = 0.831, p = 0.01), and others. In some lakes, for example, Dzharylgach or Akhtashskoe, this dependence did not exist.
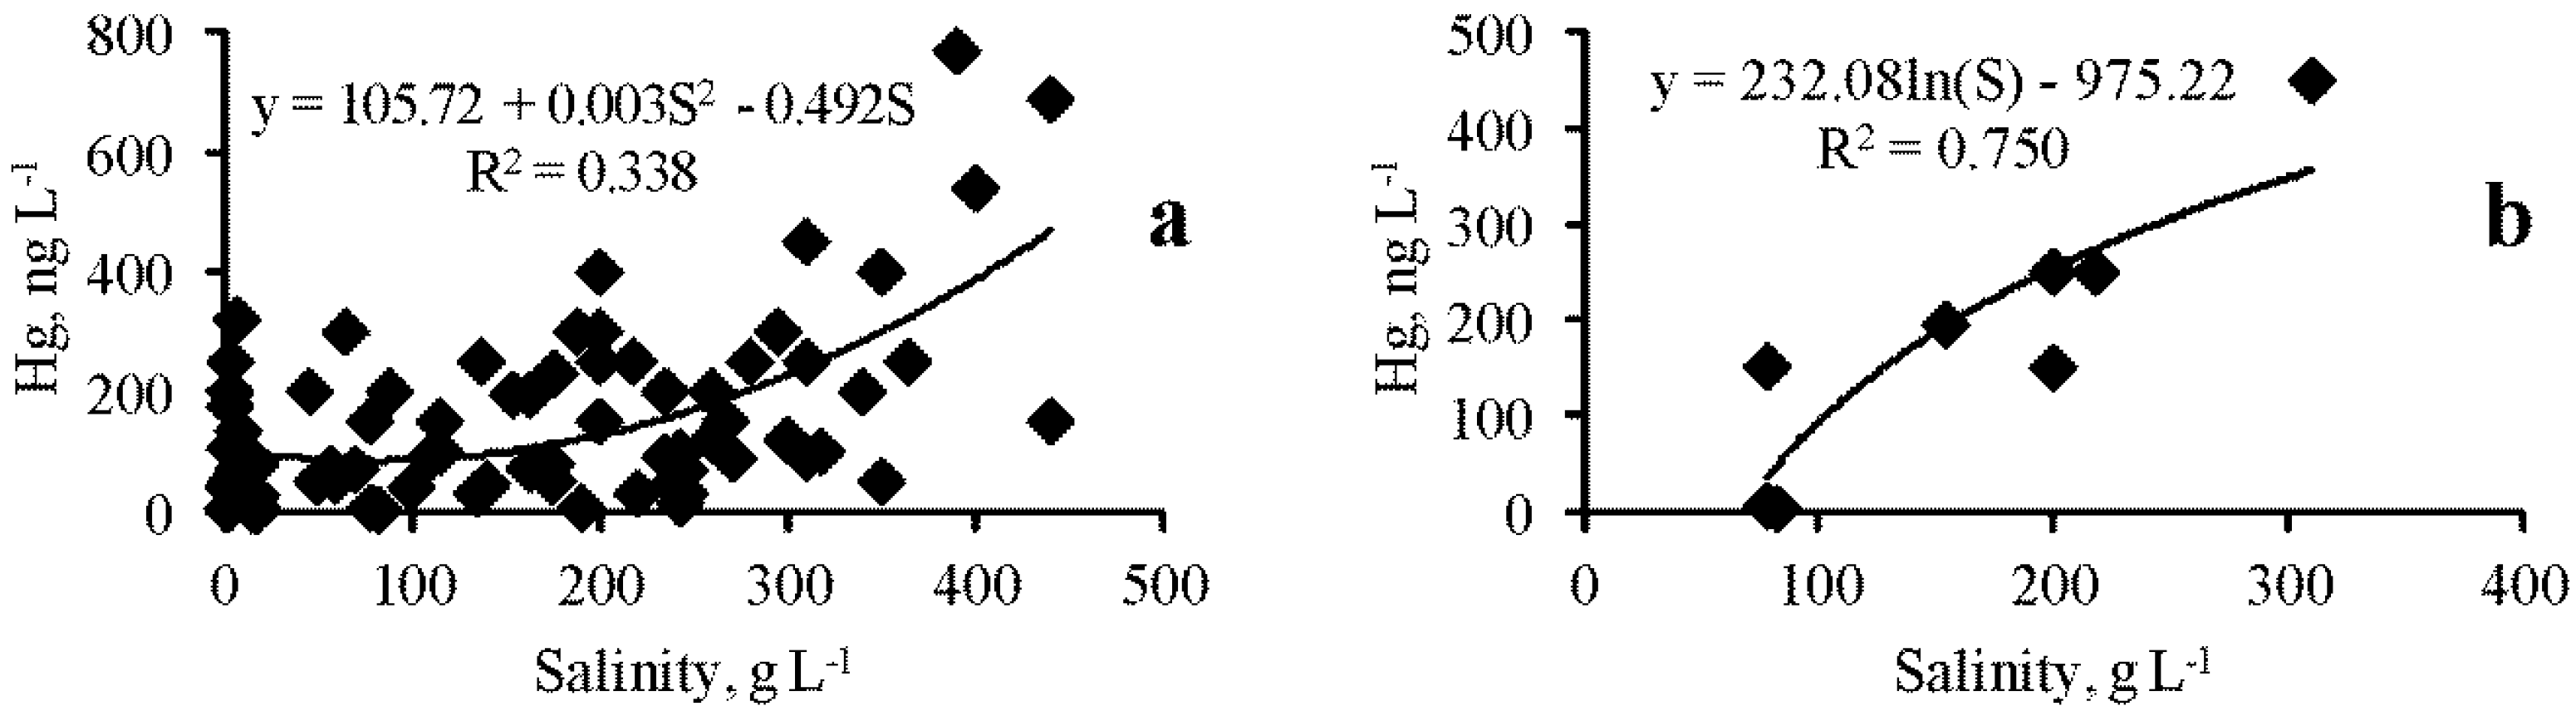
When analyzing the entire data array, no correlation was found between the concentration of the dissolved form of Hg and salinity. However, for some lakes, such a significant positive relationship was found, for example, in Lake Bakalskoe (R = 0.839, p = 0.01), but in most lakes there was no such relationship. When analyzing the entire data array (Figure 5a), a significant positive correlation was found between the concentration of the suspended form of Hg and salinity (R = 0.581, p = 0.0005):
where Hgsus is Hg content in TSS, ng L−1.
Hgsus = 105.72 + 0.003S2 − 0.492S
In some lakes, this dependence was more pronounced than in the total data set (Figure 5b), for example, in lakes Kiyatskoe (R = 0.866, p = 0.0001), Bakalskoe (R = 0.839, p = 0.005), Kirleutskoe (R = 0.723, p = 0.01). In other lakes, for example, Dzharylgach, Sasyk-Sivash, Tobechikskoe, and Akhtashskoe, there was no such significant dependence. There was no correlation between the concentration of the dissolved form of Hg in water and TSS. Between the concentration of the suspended form of Hg and TSS, a positive significant correlation was noted when analyzing the entire data set (R = 0.450, p = 0.0005), which can be approximated by the equation:
Hgsus = 182.47 TSS0.361
When analyzing this dependence in individual lakes, it was not found in several lakes; in others, only a similar trend was noted. A significant correlation was noted only in Lake Bakalskoe (R = 0.821, p = 0.004):
Hgsus = 2785.8 TSS − 20.9
There was no significant correlation between the proportion of the dissolved form of Hg in its total content and salinity in the analysis of the total data set, but it was significantly manifested in most lakes. A significant negative dependence was noted, for example, in lakes Kiyatskoe (R = −0.715, p = 0.04), Kirleutskoe (R = −0.715, p = 0.04), Bakalskoe (R = −0.869, p = 0.007), and Akhtashskoe (R = −0.867, p = 0.008). In Lake Sasyk-Sivash, a significant positive correlation was noted between these parameters (R = 0.883, p = 0.005), whereas in Lake Dzharylgach, there was no correlation at all. The parameters of the approximating equations for different lakes differ significantly. There was no correlation between the proportion of the dissolved form of Hg in its total content and TSS in the analysis of all data and individual lakes, except for Lake Bakalskoe, where a significant negative relationship was noted (R = 0.798, p = 0.007):
where Hgt is a total Hg, ng L−1.
Hgdis/Hgt = 0.963e−11.75TSS
When analyzing the total sample, a significant negative correlation was found between the coefficient of Hg accumulation in suspended matter and TSS (R = −0.483, p = 0.0005):
where Ksus is the coefficient of Hg accumulation by TSS, L kg−1.
Ksus = 3134 TSS − 1451
A similar dependence as (8), expressed to varying degrees, was also noted in individual lakes. When analyzing the total data set, a weak but significant negative correlation was found between the coefficient of Hg accumulation in TSS and salinity (R = −0.425, p = 0.0005):
Ksus = 61,300 − 8710 ln (S)
In some lakes, in the relationship of these parameters, both a positive and a negative trend and its absence were noted, but it was not significant. A significant positive dependence was noted only in Lake Bakalskoe (R = 0.961, p = 0.0005):
Ksus = 65,301 − 8710 ln (S)
The concentration of Hg in suspended matter was variable, ranging from 343 to 7269.6 ng g−1 (dry weight) (Table 2), excluding the anomalous highest value (400,000 ng g−1, Lake Kuchuk-Adzhigol, 04/26/2018). Graphical analysis showed that this value varies from month to month (Figure 3). However, the average concentration for all lakes does not change significantly, but the maximum values change significantly (p < 0.005) (except for two anomalously low values in September and October, when there were only 2–3 points) (Figure 3, Table 3).
3.2. Hg in Hydrobionts
The obtained data on the content of Hg in the biomass of filamentous green algae, vascular plants, and Artemia (Crustacea, Anostraca) are presented in Table 4. The highest average concentrations of Hg in the biomass were noted in Artemia (average 111 ng g−1 (dry weight), CV = 1.074), and the lowest in plants (average 22 ng g−1, CV = 0.641). In plants, the average concentration of Hg in the salinity range from 2.4 to 17.0 g L−1 was 33.2 ng g−1 (CV = 0.432), and in the salinity range from 64 to 89 g L−1, it was 11.3 ng g−1 (CV = 0.720). The differences are statistically significant (p = 0.01). At the same time, at low salinities (from 64 to 89 g L−1), a significant positive correlation of Hg concentration with salinity was found (R = 0.906, p = 0.01):
where Hgplant is Hg content in plant biomass, ng g−1 (dry weight).
Hgplant = 17.014 + 1.815 S
In general, the dependence of Hg concentration in biomasses on salinity was most likely dome-shaped. The average concentration of Hg in green filamentous algae was significantly different in Cladophora and Polysiphonia (p = 0.01); in Cladophora, it was about six times higher. However, the algae existed in different salinity ranges. When the data for both genera of filamentous green algae were analyzed together, a significant positive correlation was found between the content of Hg in biomass and salinity (Figure 6). Among all the studied organisms, the highest Hg accumulation coefficients in biomass were also noted in plants (average 1.80, CV = 0.462), and the lowest in filamentous green algae (average 0.45, CV = 1.933).
There was no significant correlation between the Hg concentration in the Polysiphonia biomass and salinity; a negative significant correlation was found in Cladophora (R = −0.972, p = 0.001):
where Hgclad is Hg content in Cladophora biomass, ng g−1 (dry weight).
Hgclad = 422.6e−0.889S
For Potamogetonaceae (Potamogeton + Stuckenia), a significant negative correlation was also found between the concentration of Hg in the biomass and salinity (R = −0.824, p = 0.05):
where Hgpot is Hg content in Potamogetonaceae plant biomass, ng g−1 (dry weight).
Hgpot = 38.12e−0.032S
A significant correlation between the concentration of Hg in the plant and algal biomass and the Hg content of the dissolved form in water was not found.
In the salinity range from 88 to 188 g L−1 in adult Artemia, a significant positive dependence of Hg body concentration with salinity was found (R = 0.996, p = 0.01):
where Hgart is Hg content in brine shrimp biomass, ng g−1 (dry weight).
Hgart = 0.357e0.024S
At higher salinity, judging by the data in Table 4, there was a sharp decrease in the Hg concentration in the body, but the conclusion is preliminary as there is little data. The concentration of Hg in Artemia cysts is higher than in the adult Artemia (Table 4). The Hg accumulation coefficient did not show a significant correlation with salinity. There was a significant positive correlation between the Hg concentration in Artemia and the concentration of its dissolved form in water (R = 0.849, p = 0.03):
Hgart = 0.350 + 0.074 Hgdis
A similar correlation between the Hg concentration in biomass of adult brine shrimp with the total content of Hg in water and the concentration of its suspended form was not found.
The concentration of Hg in the biomass of Artemia was lower than its concentration in the suspended matter by an average of 188.7 times (CV = 0.844). The concentration of Hg in Artemia biomass with its concentration in the particulate matter was positive and significant (R = 0.970, p = 0.003):
Hgart = 3.178 + 0.002 Hgsus/TSS
A significant negative correlation was also found between the coefficients of Hg accumulation by suspended matter and Artemia biomass (R = −0.915, p = 0.001):
where Kart is the coefficient of Hg accumulation by Artemia biomass, L kg−1.
Kart = 1963e−0.022Ksus
4. Discussion
Comparison of the obtained values with data on other water bodies [11,33] shows that the new data obtained do not go beyond the general limits of previously determined values. At the same time, they are quite high. For example, Great Salt Lake, being the lake with the highest concentrations of total Hg in water in the USA, has an average Hg concentration of about 45 ng L−1 with maximum values < 100 ng L−1 [34,35], which is significantly lower than the average concentration for all saline lakes in Crimea and each separately (Table 2). Thus, it can be assumed that the saline lakes in Crimea have a large amount of Hg in the water. As in our studies, the absence of a significant correlation between the concentrations of dissolved and suspended Hg fractions was previously noted, and this may indicate that the suspended form of Hg is not in chemical equilibrium with dissolved one [36].
The Hg concentration in particulate matter increased from spring to autumn (Table 3), which is probably associated with an increase in the proportion of organic matter in TSS due to primary productivity. This is consistent with the fact, as previously shown in the Crimean saline lakes [21], that the concentration of Hg in the suspended matter (ng g−1) significantly directly correlates with the level of primary production in the lake (R = 0.907, p = 0.0001). Based on the value of the coefficient of determination (R2 = 0.822), it can be concluded that the variability of the Hg concentration in TSS was determined at 82% by primary productivity in the lakes.
Differences in Hg content in different lake groups are determined first of all by the geological features of their drainage basins, as was also noted in other regions [1,11,37]. First of all, one must take into account the rocks and products of their weathering composition as well as the chemical composition of soils and underground waters. The highest total Hg content in the lakes of the Kerch Peninsula, as previously shown for other trace elements [24,38], is determined by several geological factors. The geological background of the Kerch Peninsula includes the massive deposits of Fe-Mn ore as well as a lot of sulfates in groundwater and soils [24,38,39] that can significantly impact Hg behavior. Many mud volcanoes exist in the Kerch peninsula around saline lakes and even on their bottom [40,41]. They can significantly affect the geochemical background of saline lakes, due to the liquid phase from the volcanoes’ vents containing high concentrations of different elements including Hg [24,40,41]. In clay from mud volcanoes, Hg is 10–100 times more concentrated than in the upper part of the continental crust [42].
Anthropogenic local and/or global factors can also play a big role in this [34,43]. This, in particular, in the opinion of the authors, is especially significant when considering the lakes of the spatially closely situated Perekop and Tarkhankut lake groups. There is a large chemical industry center in the North part of Crimea, and three lakes of the Perekop lake group are situated from 5 to 15 km from the biggest plant of the center. Possibly due to this, the highest Hg concentrations were observed in those lakes. Lake Krasnoe is used as a reservoir for the toxic effluents of this plant; because of this, it contains not only high concentrations of Hg but several other trace elements [24]. Lake Kiyatskoe is connected with Lake Krasnoe by a narrow channel and by filtration. It is less impacted by the chemical plant, and the total Hg concentration within it is 1.4 times lower than in the brine of Lake Krasnoe (Table 2). The distance between Lake Kiyatskoe and the nearest Lake Kirleutskoe is not more than 2 km and showed a total Hg concentration lower by 1.8 times than in Lake Kiyatskoe. The lakes of the Tarkhankut group are located at a distance of 50 km (Bakalskoe) to 86 km (Yarylgach) from the chemical industry center. It can be assumed that atmospheric emissions from the center still reach them, but with a lower concentration of Hg. Differences in the content of Hg between the lakes of the group may be determined by local anthropogenic impacts (agricultural, villages, and tourism). The impact of people on lakes is minimal in the case of Lake Yarylgach, where the minimum total amount of Hg in water was noted for this lake group. Significantly higher than the background for the region, indicators of Hg content in water are determined, as can be seen from the example of the Crimean saline lakes, by the interaction of geological and intra-water factors (salinity, biotic factors, etc.), as well as the character and power of anthropogenic impacts. The proportions in the contribution of different causes the deviation from the background values of Hg content in different regions and lakes are not the same, and it is very difficult to estimate them. Great Salt Lake (USA), with average salinity near 150 g L−1, has high Hg content, and the different Hg issues of this have been extensively studied over many years [1,3,34,44,45,46]. However, even in this most studied case, many questions remain unanswered.
A positive correlation between the content of total and suspended Hg and salinity was also noted for lakes of other regions [11,12,34,47,48] and Lagoon Sivash [25]. There is the same positive correlation between TSS and salinity (Figure 2), which also was noted in other cases [11,24,25,39], which can help to partly explain the general trend of the increased suspended Hg form with increasing salinity in a water body. The atmospheric Hg deposition is one of the major Hg sources to different aquatic environments, and high salinity can also enhance Hg input to the lake surface [34,49]. Higher salinity may increase Hg turnover with lowering of Hg sedimentation on the bottom [47] as well as determine a rate of Hg methylation and other processes regulating Hg behavior in the lakes [34,45]. Consequently, Hg concentrations in water may be impacted by many direct and indirect effects of salinity on the ecosystem.
The Hg concentrations ound in the green algae and vascular plant biomass are much lower than the maximum values found earlier in other regions [30,50]. For example, the concentration of Hg in Potamogeton crispus L. increased with growth, with the natural Hg content reaching up to 132 ng g−1 and exceeding 30,000 ng g−1 (dry weight) in experiments [51]. Filamentous green algae Cladophora create bottom and floating mats in the Crimean saline and hypersaline lakes, the mass of which can exceed 500 g L−1 (dry weight) [52,53]. Calculated with this in mind, data in Table 4 values show that the total Hg content in Cladophora biomass in 1 L of water can exceed 5000 ng L−1, which can significantly exceed the total amount of dissolved and suspended forms of Hg in lake water (Table 2). At the end of autumn, filamentous algae and plants begin to die off, and bacteria intensively develop and absorb oxygen, making the environment acidic [54]. This may explain the anomalous increase in the dissolved form of Hg in Lake Kyzyl-Yar from an average of 80 ng L−1 (CV = 0.861) in the summer months to a value of 3635 ng L−1 in November, where filamentous algae and aquatic plants intensively develop in summer [23]. Based on data in Table 2, Table 3 and Table 4, we suggest that that plants and filamentous algae play a significant role in the Hg cycle in saline lakes, but experiments are needed to test this hypothesis.
The Hg content in the Artemia biomass in the Crimean lakes (Table 4) was significantly lower than in the Great Salt Lake, where it reached 1400 ng g−1 (dry weight), averaging about 500 ng g−1 [46]. At first glance, this may seem strange, because Hg concentration in Crimean lakes is higher (Table 2) than in Great Salt Lake [34,35,46]. An analysis of our data (see above) led to the conclusion that the dependence of the accumulation factor on salinity has a dome shape, which could partially explain this paradox. In addition, it was found that the accumulation coefficient/bioaccumulation factor for Hg decreases with increasing Hg content in water [46]. A similar inverse relationship between Hg concentration and a rate of Hg uptake has been observed also in other hydrobionts [55]. At the same time in Great Salt Lake, Hg concentration in brine fly (Ephydra gracilis Packard, 1871) larvae was on average slightly higher than in Artemia, averaging 659 ng g−1 (dry weight) [44]. These differences can probably be explained by differences in the diet of Artemia and Ephydra, the former filtering phytoplankton, whereas the latter consume periphyton [44,46].
Hg in Artemia biomass averages 0.6% (CV = 1.270) of its total amount in water (Table 2 and Table 4). The mass dying off of Artemia, whose average lifespan is 10–30 days, leads to the removal of Hg from the water column, but this does not determine the main role of Artemia in the Hg cycle in hypersaline lakes. Artemia is an obligate filter feeder and can effectively consume both organic and inorganic particles [56]. Assuming that the daily filtration rate of a brine shrimp averages at least 40% of its body weight [57], the authors determined what minimum percentage of the available suspension (Table 2) it filtered per day. On average, for all cases with Artemia (Table 3), it was 4.1% (CV = 0.969). According to our and literary [44,46] data, the Hg concentration in the Artemia body did not correlate with the amount of Hg suspended in water, and it can be assumed that the suspended Hg as Artemia faecal pellets mainly settles to the bottom. It is known that in water bodies with high Artemia abundance and the process of their formation of fecal pellets significantly accelerates the process of sedimentation of suspended matter, and their pellets make up the bulk of bottom sediments [58,59,60]. Taking into account observed Artemia abundance (Table 4), the calculation showed that in this way all suspended Hg can be removed by Artemia from the water column to bottom sediments in 5–15 days. In faecal pellets of planktonic crustaceans, including Artemia, concentrations of Hg, lead, and other heavy metals can be significantly higher than the average content in the suspended matter [61,62]. Consequently, the turnover of suspended Hg is very fast, and brine shrimp are important factors in Hg cycling in hypersaline water bodies, which, however, was noted earlier [60].
5. Conclusions
The available data show that Hg behavior and variability of its concentration in lakes is determined by a large set of factors, both intra-lake (salinity, composition, functioning of biota, etc.) and external (geological, climatic, anthropogenic). Quantitatively, the role of each does not remain constant; it varies both in space and in time. Biological factors play an important role in the spatial and temporal distribution and behavior of Hg. The presence of large populations of Artemia in hypersaline lakes, as well as filamentous algae, can accelerate Hg cycling, but this important issue requires more detailed study.
Author Contributions
Conceptualization, N.S.; methodology, N.S., A.S., and E.A.; formal analysis, N.S., A.S., and E.A.; investigation, A.S.; writing—original draft preparation, N.S.; writing—review and editing, N.S., A.S., and E.A.; supervision, E.A.; project administration, E.A.; funding acquisition, E.A. All authors have read and agreed to the published version of the manuscript.
Funding
Long-term water sampling and Hg determination were conducted in the framework of the state assignment of A.O. Kovalevsky Institute of Biology of the Southern Seas of RAS (No. 121031500515-8). The part concerning the long-term study of the saline lake environment was conducted in the framework by the state assignment of A.O. Kovalevsky Institute of Biology of the Southern Seas of RAS (No. 121041500203-3). The study of Hg accumulation by biota, data analysis, and the writing of this manuscript were supported by the Russian Science Foundation (grant 18-16-00001 for Nickolai Shadrin and Elena Anufriieva).
Institutional Review Board Statement
Not applicable.
Informed Consent Statement
Not applicable.
Data Availability Statement
All data used in this study are available upon request from the corresponding author.
Acknowledgments
The authors are grateful to all the staff of the Department of Radiation and Chemical Biology of the IBSS who helped in this study, and to Bindy Datson (Australia) for her selfless work in improving the English of the manuscript.
Conflicts of Interest
The authors declare no conflict of interest.
References
- Peterson, C.; Gustin, M. Mercury in the air, water and biota at the Great Salt Lake (Utah, USA). Sci. Total Environ. 2008, 405, 255–268. [Google Scholar] [CrossRef]
- Díaz-Asencio, M.; Alonso-Hernández, C.; Bolanos-Álvarez, Y.; Batista, M.G.; Pinto, V.; Morabito, R.; Hernández-Albernas, J.; Eriksson, M.; Sanchez-Cabeza, J.-A. One century sedimentary record of Hg and Pb pollution in the Sagua estuary (Cuba) derived from 210Pb and 137Cs chronology. Mar. Pollut. Bull. 2009, 59, 108–115. [Google Scholar] [CrossRef] [PubMed]
- Scott, A.F.; Black, F.J. Mercury Bioaccumulation and Biomagnification in Great Salt Lake Ecosystems. In Great Salt Lake Biology; Springer: Cham, Switzerland, 2020; pp. 435–461. [Google Scholar] [CrossRef]
- Sun, R.; Sun, G.; Kwon, S.Y.; Feng, X.; Kang, S.; Zhang, Q.; Huang, J.; Yin, R. Mercury biogeochemistry over the Tibetan Plateau: An overview. Crit. Rev. Environ. Sci. Technol. 2020, 51, 577–602. [Google Scholar] [CrossRef]
- Pacyna, E.G.; Pacyna, J.M.; Steenhuisen, F.; Wilson, S. Global anthropogenic mercury emission inventory for 2000. Atmospheric Environ. 2006, 40, 4048–4063. [Google Scholar] [CrossRef]
- Drevnick, P.E.; Cooke, C.A.; Barraza, D.; Blais, J.M.; Coale, K.H.; Cumming, B.F.; Curtis, C.J.; Das, B.; Donahue, W.F.; Eagles-Smith, C.A.; et al. Spatiotemporal patterns of mercury accumulation in lake sediments of western North America. Sci. Total Environ. 2016, 568, 1157–1170. [Google Scholar] [CrossRef] [PubMed]
- Wiener, J.G.; Krabbenhoft, D.P.; Heinz, G.H.; Scheuhammer, A.M. Ecotoxicology of mercury. In Handbook of Ecotoxicology, 2nd ed.; Hoffman, D.J., Rattner, B.A., Burton, G.A., Jr., Cairns, J., Eds.; CRC Press: Boca Raton, MA, USA, 2003; pp. 409–463. [Google Scholar]
- Mergler, D.; Anderson, H.A.; Chan, L.H.M.; Mahaffey, K.R.; Murray, M.; Sakamoto, M.; Stern, A.H. Methylmercury Exposure and Health Effects in Humans: A Worldwide Concern. Ambio 2007, 36, 3–11. [Google Scholar] [CrossRef]
- Wurtsbaugh, W.A.; Leavitt, P.R.; Moser, K.A. Effects of a century of mining and industrial production on metal contamination of a model saline ecosystem, Great Salt Lake, Utah. Environ. Pollut. 2020, 266, 115072. [Google Scholar] [CrossRef]
- Schindler, D.W. Lakes as sentinels and integrators for the effects of climate change on watersheds, airsheds, and landscapes. Limnol. Oceanogr. 2009, 54, 2349–2358. [Google Scholar] [CrossRef]
- Li, C.; Zhang, Q.; Kang, S.; Liu, Y.; Huang, J.; Liu, X.; Guo, J.; Wang, K.; Cong, Z. Distribution and enrichment of mercury in Tibetan lake waters and their relations with the natural environment. Environ. Sci. Pollut. Res. 2015, 22, 12490–12500. [Google Scholar] [CrossRef]
- Naftz, D.; Fuller, C.; Cederberg, J.; Krabbenhoft, D.; Whitehead, J.; Garberg, J.; Beisner, K. Mercury inputs to Great Salt Lake, Utah: Reconnaissance-Phase results. Nat. Resour. Environ. Issues 2009, 15, 5. [Google Scholar]
- Anufriieva, E.V.; Goher, M.E.; Hussian, A.E.M.; El-Sayed, S.M.; Hegab, M.H.; Tahoun, U.M.; Shadrin, N.V. Ecosystems of artificial saline lakes. A case of Lake Magic in Wadi El-Rayan depression (Egypt). Knowl. Manag. Aquat. Ecosyst. 2020, 31, 13. [Google Scholar] [CrossRef]
- Saccò, M.; White, N.E.; Harrod, C.; Salazar, G.; Aguilar, P.; Cubillos, C.F.; Meredith, K.; Baxter, B.K.; Oren, A.; Anufriieva, E.; et al. Salt to conserve: A review on the ecology and preserva-tion of hypersaline ecosystems. Biol. Rev. 2021, 96, 2828–2850. [Google Scholar] [CrossRef]
- Khomenko, S.V.; Shadrin, N.V. Iranian endemic Artemia urmiana in hypersaline Lake Koyashskoye (Crimea, Ukraine): A pre-liminary discussion of introduction by birds. Branta Trans. Azov-Black Sea Ornithol. Stn. 2009, 12, 81–91. (In Russian) [Google Scholar]
- Conover, M.R.; Bell, M.E. Importance of Great Salt Lake to Pelagic Birds: Eared Grebes, Phalaropes, Gulls, Ducks, and White Pelicans. In Great Salt Lake Biology; Springer: Cham, Switzerland, 2020; pp. 239–262. [Google Scholar] [CrossRef]
- Anufriieva, E.V. How can saline and hypersaline lakes contribute to aquaculture development? A review. J. Oceanol. Limnol. 2018, 36, 2002–2009. [Google Scholar] [CrossRef]
- Balushkina, E.V.; Golubkov, S.M.; Golubkov, M.S.; Litvinchuk, L.F.; Shadrin, N. Effect of abiotic and biotic factors on the structural and functional organization of the saline lake ecosystems in Crimea. Zhurnal Obs. Biol. 2010, 70, 504–514. [Google Scholar]
- Shadrin, N.V.; Anufriieva, E.V.; Belyakov, V.P.; Bazhora, A.I. Chironomidae larvae in hypersaline waters of the Crimea: Diversity, distribution, abundance and production. Eur. Zool. J. 2017, 84, 61–72. [Google Scholar] [CrossRef]
- Mirzoyeva, N.; Gulina, L.; Gulin, S.; Plotitsina, O.; Stetsuk, A.; Arkhipova, S.; Korkishko, N.; Eremin, O. Radionuclides and mercury in the salt lakes of the Crimea. Chin. J. Oceanol. Limnol. 2015, 33, 1413–1425. [Google Scholar] [CrossRef]
- Stetsiuk, A.P.; Popovichev, V.N.; Mirzoyeva, N.Y.; Rodionova, N.Y.; Bogdanova, T.A. Mercury in abiotic and biotic compo-nents of the ecosystem of the salt lakes of the Crimea. Ekosistemy 2018, 16, 47–57. (In Russian) [Google Scholar]
- Kurnakov, N.S.; Kuznetsov, V.G.; Dzens-Lytovsky, A.I.; Ravich, M.I. The Crimean Salt Lakes; AN USSR Publisher: Moscow, Russia, 1936; 278p. (In Russian) [Google Scholar]
- Shadrin, N.V.; Simonov, V.G.; Anufriieva, E.V.; Popovichev, V.N.; Sirotina, N.O. Anthropogenic Transformation of Kyzyl-Yar Lake in Crimea: Multiyear Research Findings. Arid Ecosyst. 2018, 8, 299–306. [Google Scholar] [CrossRef]
- Shadrin, N.; Mirzoeva, N.; Kravchenko, N.; Miroshnichenko, O.; Tereshchenko, N.; Anufriieva, E. Trace elements in the bottom sediments of the Crimean saline lakes. Is it possible to explain their concentration variability? Water 2020, 12, 2364. [Google Scholar] [CrossRef]
- Shadrin, N.; Stetsiuk, A.; Latushkin, A.; Anufriieva, E. Mercury in the world’s largest hypersaline lagoon Bay Sivash, the Sea of Azov. Environ. Sci. Pollut. Res. 2021, 28, 28704–28712. [Google Scholar] [CrossRef] [PubMed]
- Golubkov, S.M.; Shadrin, N.V.; Golubkov, M.S.; Balushkina, E.V.; Litvinchuk, L.F. Food chains and their dynamics in ecosys-tems of shallow lakes with different water salinities. Russ. J. Ecol. 2018, 49, 442–448. [Google Scholar] [CrossRef]
- Mirzoeva, N.; Shadrin, N.; Arkhipova, S.; Miroshnichenko, O.; Kravchenko, N.; Anufriieva, E. Does salinity affect the dis-tribution of the artificial radionuclides 90Sr and 137Cs in water of the saline lakes? A case of the Crimean Peninsula. Water 2020, 12, 349. [Google Scholar] [CrossRef]
- Anufriieva, E.; Shadrin, N. The long-term changes in plankton composition: Is Bay Sivash transforming back into one of the world’s largest habitats of Artemia sp. (Crustacea, Anostraca)? Aquac. Res. 2020, 51, 341–350. [Google Scholar] [CrossRef]
- Polikarpov, G.G.; Egorov, V.N. Marine Dynamic Radiochemoecology; Energoatomizdat: Moscow, Russia, 1986; 176p. (In Russian) [Google Scholar]
- Bełdowska, M.; Jędruch, A.; Słupkowska, J.; Saniewska, D.; Saniewski, M. Macrophyta as a vector of contemporary and his-torical mercury from the marine environment to the trophic web. Environ. Sci. Pollut. Res. 2015, 22, 5228–5240. [Google Scholar] [CrossRef]
- Thode, H.C. Testing for Normality; Marcel Dekker Inc.: New York, NY, USA, 2002; 368p. [Google Scholar]
- Müller, P.H.; Neuman, P.; Storm, R. Tafeln der Mathematischen Statistic; VEB Fachbuchverlag: Leipzig, Germany, 1979; 276p. [Google Scholar]
- Gworek, B.; Bemowska-Kałabun, O.; Kijeńska, M.; Wrzosek-Jakubowska, J. Mercury in marine and oceanic waters—A review. Water Air Soil Pollut. 2016, 227, 371. [Google Scholar] [CrossRef]
- Naftz, D.; Angeroth, C.; Kenney, T.; Waddell, B.; Darnall, N.; Silva, S.; Perschon, C.; Whitehead, J. Anthropogenic influences on the input and biogeochemical cycling of nutrients and mercury in Great Salt Lake, Utah, USA. Appl. Geochem. 2008, 23, 1731–1744. [Google Scholar] [CrossRef]
- Valdes, C.; Black, F.J.; Stringham, B.; Collins, J.N.; Goodman, J.R.; Saxton, H.J.; Mansfield, C.R.; Schmidt, J.N.; Yang, S.; Johnson, W.P. Total Mercury and Methylmercury Response in Water, Sediment, and Biota to Destratification of the Great Salt Lake, Utah, United States. Environ. Sci. Technol. 2017, 51, 4887–4896. [Google Scholar] [CrossRef]
- Johnson, W.P.; Swanson, N.; Black, B.; Rudd, A.; Carling, G.; Fernandez, D.P.; Luft, J.; Van Leeuwen, J.; Marvin-DiPasquale, M. Total- and methyl-mercury concentrations and methylation rates across the freshwater to hypersaline continuum of the Great Salt Lake, Utah, USA. Sci. Total Environ. 2015, 511, 489–500. [Google Scholar] [CrossRef]
- Naftz, D.L.; Cederberg, J.R.; Krabbenhoft, D.P.; Beisner, K.R.; Whitehead, J.; Gardberg, J. Diurnal trends in methylmercury concentration in a wetland adjacent to Great Salt Lake, Utah, USA. Chem. Geol. 2011, 283, 78–86. [Google Scholar] [CrossRef]
- Kotova, I.R.; Kayukova, E.P.; Mordukhai-Boltovskaya, L.V.; Platonova, H.B.; Kotov, S.R. Pattern of the composition formation of oozy mud from the Dead Sea and salt lakes of Crimea. Vestnik of Saint Petersburg University. Earth Sci. 2015, 2, 85–106. (In Russian) [Google Scholar]
- Shadrin, N.; Mirzoeva, N.; Sidorov, I.; Korotkov, A.; Anufriieva, E. Natural radionuclides in bottom sediments of the saline lakes. What factors determine their concentration? Environ. Earth Sci. 2020, 79, 1–12. [Google Scholar] [CrossRef]
- Shnyukov, E.F.; Deyak, M.A.; Ivanchenko, V.V.; Maslakov, N.A.; Permyakov, V.V. Superimposed mineralization of mud volcanoes of the Kerch Peninsula. Geol. Miner. World Ocean. 2015, 4, 5–18. (In Russian) [Google Scholar]
- Maslov, A.V.; Shevchenko, V.P.; Bychkov, A.Y. Distribution of rare and trace elements in mud volcano silts: In search of traces of the impact of the juvenile component. Bull. Mosc. Univ. Ser. 4 Geol. 2021, 3, 89–98. (In Russian) [Google Scholar]
- Kozarenko, A.E.; Melchakov, Y.L.; Surikov, V.T. Geochemical specificity of Crimean mud volcanoes. Bull. Mosc. City Pedagog. Univ. Ser. Nat. Sci. 2020, 1, 84–95. (In Russian) [Google Scholar]
- Kang, S.; Huang, J.; Wang, F.; Zhang, Q.; Zhang, Y.; Li, C.; Wang, L.; Chen, P.; Sharma, C.M.; Li, Q.; et al. Atmospheric mercury depositional chronology reconstructed from lake sediments and ice core in the Himalayas and Tibetan Plateau. Environ. Sci. Technol. 2016, 50, 2859–2869. [Google Scholar] [CrossRef]
- Wurtsbaugh, W.A.; Gardberg, J.; Izdepski, C. Biostrome communities and mercury and selenium bioaccumulation in the Great Salt Lake (Utah, USA). Sci. Total Environ. 2011, 409, 4425–4434. [Google Scholar] [CrossRef]
- Boyd, E.S.; Yu, R.-Q.; Barkay, T.; Hamilton, T.L.; Baxter, B.K.; Naftz, D.L.; Marvin-DiPasquale, M. Effect of salinity on mercury methylating benthic microbes and their activities in Great Salt Lake, Utah. Sci. Total Environ. 2017, 581–582, 495–506. [Google Scholar] [CrossRef]
- Wright, J.; Yang, S.; Johnson, W.P.; Black, F.J.; McVey, J.; Epler, A.; Scott, A.F.; Trentman, M.P.; Martin, A.R.; Pandey, G.; et al. Temporal correspondence of selenium and mercury, among brine shrimp and water in Great Salt Lake, Utah, USA. Sci. Total Environ. 2020, 749, 141273. [Google Scholar] [CrossRef]
- Windisch, J.; Plessl, C.; Christian, C.; Zechmeister, T.; Jirsa, F. Unexpected pathways of mercury in an alkaline, biologically productive, saline lake: A mesocosm approach. J. Hazard. Mater. 2021, 427, 128163. [Google Scholar] [CrossRef]
- Amiri, V.; Li, P.; Bhattacharya, P.; Nakhaei, M. Mercury pollution in the coastal Urmia aquifer in northwestern Iran: Potential sources, mobility, and toxicity. Environ. Sci. Pollut. Res. 2021, 28, 17546–17562. [Google Scholar] [CrossRef] [PubMed]
- Mason, R.P.; Gill, G.A. Mercury in the marine environment. In Mercury: Sources, Measurements, Cycles, and Effects; Parsons, M.B., Percival, J.B., Eds.; Mineralogical Association of Canada: Ottawa, ON, Canada, 2005; pp. 79–216. [Google Scholar]
- ܝižek, S.; Horvat, M.; Gibičar, D.; Fajon, V.; Toman, M.J. Bioaccumulation of mercury in benthic communities of a river eco-system affected by mercury mining. Sci. Total Environ. 2007, 377, 407–415. [Google Scholar]
- Ali, M.B.; Vajpayee, P.; Tripathi, R.D.; Rai, U.N.; Kumar, A.; Singh, N.; Behl, H.M.; Singh, S.P. Mercury Bioaccumulation Induces Oxidative Stress and Toxicity to Submerged Macrophyte Potamogeton crispus L. Bull. Environ. Contam. Toxicol. 2000, 65, 573–582. [Google Scholar] [CrossRef] [PubMed]
- Shadrin, N.; Kolesnikova, E.; Revkova, T.; Latushkin, A.; Chepyzhenko, A.; Drapun, I.; Dyakov, N.; Anufriieva, E. Do sepa-rated taxa react differently to a long-term salinity increase? The meiobenthos changes in Bay Sivash, largest hypersaline lagoon worldwide. Knowl. Manag. Aquat. Ecosyst. 2019, 420, 36. [Google Scholar] [CrossRef]
- Prazukin, A.; Shadrin, N.; Balycheva, D.; Firsov, Y.; Lee, R.; Anufriieva, E. Cladophora spp. (Chlorophyta) modulate envi-ronment and create a habitat for microalgae in hypersaline waters. Eur. J. Phycol. 2021, 56, 231–243. [Google Scholar] [CrossRef]
- Prazukin, A.V.; Anufriieva, E.V.; Shadrin, N.V. Cladophora mats in a Crimean hypersaline lake: Structure, dynamics, and inhabiting animals. J. Oceanol. Limnol. 2018, 36, 1930–1940. [Google Scholar] [CrossRef]
- Painter, K.J.; Janz, D.M.; Jardine, T.D. Bioaccumulation of mercury in invertebrate food webs of Canadian Rocky Mountain streams. Freshw. Sci. 2016, 35, 1248–1262. [Google Scholar] [CrossRef] [Green Version]
- Reeve, M.R. The filter-feeding of Artemia. J. Exp. Biol. 1963, 40, 207. [Google Scholar] [CrossRef]
- Khmeleva, N.N. Conversion of energy in Artemia salina (L.). Dokl. Akad. Nauk. SSSR 1967, 175, 934–937. (In Russian) [Google Scholar]
- Ivanova, M.B. Quantitative estimation of zooplankton contribution to the processes of mud formation in hypersaline lakes in the Crimea. Russ. J. Aquat. Ecol. 1994, 3, 63–74. [Google Scholar]
- Djamali, M.; Ponel, P.; Delille, T.; Thiéry, A.; Asem, A.; Andrieu-Ponel, V.; de Beaulieu, J.L.; Lahijani, H.; Shah-Hosseini, M.; Amini, A.; et al. A 200,000-year record of the brine shrimp Artemia (Crustacea: Anostraca) remains in Lake Urmia, NW Iran. Int. J. Aquat. Sci. 2010, 1, 148. [Google Scholar]
- Maszczyk, P.; Wurtsbaugh, W.A. Brine shrimp grazing and fecal production increase sedimentation to the deep brine layer (monimolimnion) of Great Salt Lake, Utah. Hydrobiologia 2017, 802, 7–22. [Google Scholar] [CrossRef]
- Fowler, S.W.; Heyraud, M.; LaRosa, J. Mercury Kinetics in Marine Zooplankton; Activities of the International Laboratory of Marine Radioactivity Report; IAEA-187; IAEA: Vienna, Austria, 1976; pp. 20–33. [Google Scholar]
- Soto-Jiménez, M.F.; Arellano-Fiore, C.; Rocha-Velarde, R.; Jara-Marini, M.E.; Ruelas-Inzunza, J.; Páez-Osuna, F. Trophic Transfer of Lead Through a Model Marine Four-Level Food Chain: Tetraselmis suecica, Artemia franciscana, Litopenaeus vannamei, and Haemulon scudderi. Arch. Environ. Contam. Toxicol. 2010, 61, 280–291. [Google Scholar] [CrossRef] [PubMed]
Figure 1.
Distribution of the studied saline lakes in Crimea (1—Novofedorovskoe, 2—Kyzyl-Yar, 3—Sasyk-Sivash, 4—Moynaki, 5—Donuzlav, 6—Yarylgach, 7—Dzharylgach, 8—Bakalskoe, 9—Krasnoe, 10—Kirleutskoe, 11—Kiyatskoe, 12—Kuchuk-Adzhigol, 13—Adzhigol, 14—Aktashskoe, 15—Chokrakskoe, 16—Tobechikskoe, 17—Koyashskoe, 18—Uzunlarskoe).

Figure 2.
Dependence of the total suspended solids (TSS) and pH on salinity in the Crimean saline lakes ((a)—TSS dependence, (b)—pH dependence).
Figure 2.
Dependence of the total suspended solids (TSS) and pH on salinity in the Crimean saline lakes ((a)—TSS dependence, (b)—pH dependence).

Figure 3.
Seasonal changes in the concentration of the Hg dissolved forms of mercury in the lakes Kiyatskoe (a) and Bakalskoe (b).
Figure 3.
Seasonal changes in the concentration of the Hg dissolved forms of mercury in the lakes Kiyatskoe (a) and Bakalskoe (b).

Figure 4.
Seasonal changes in the Hg total content (red squares) and suspended form (blue rhombus) in the lakes Kiyatskoe (a) and Kirleutskoe (b).
Figure 4.
Seasonal changes in the Hg total content (red squares) and suspended form (blue rhombus) in the lakes Kiyatskoe (a) and Kirleutskoe (b).

Figure 5.
Dependence of the Hg suspended form concentration on salinity ((a)—for the entire collection of lakes in general, (b)—Lake Kiyatskoye).
Figure 5.
Dependence of the Hg suspended form concentration on salinity ((a)—for the entire collection of lakes in general, (b)—Lake Kiyatskoye).

Figure 6.
Dependence of Hg concentration in the biomass of filamentous green algae on salinity in Crimean saline lakes.
Figure 6.
Dependence of Hg concentration in the biomass of filamentous green algae on salinity in Crimean saline lakes.


Table 1.
The studied Crimean saline lakes and their characteristics.
| Lake | Coordinates of the Sampling Sites | Area, km2 | The Total Period of Study, and the Number of Sampling Times | Ranges of Changes in the Environmental Characteristics during the Study Period | |||
|---|---|---|---|---|---|---|---|
| Salinity, g L−1 | Temperature, °C | pH | TSS, g L−1 | ||||
| Perekop lake group | |||||||
| Kiyatskoe | 4,600,107 N 3,394,477 E | 12.5 | 2012–2021, 10 times | 78–310 | 4–41 | 7.2–8.2 | 0.02–2.77 |
| Kirleutskoe | 4,595,895 N 3,402,173 E | 21.0 | 2012–2021, 11 times | 190–318 | 5–38 | 6.0–8.2 | 0.02–0.77 |
| Krasnoe | 4,598,811 N 3,388,328 E | 23.4 | 2017–2018, 2 times | 340–350 | 30–31 | 9.5–9.6 | 0.14–0.22 |
| Tarkhankut lake group | |||||||
| Bakalskoe | 4,573,171 N 3,318,016 E | 8.0 | 2013–2021, 7 times | 18–65 | 6–26 | 7.0–9.5 | 0.002–0.01 |
| Donuzlav | 4,544,084 N 3,319,460 E | 48.2 | 2013–2014, 4 times | 16–17 | 5–29 | 8.6–8.7 | 0.002–0.01 |
| Dzharylgach | 4,557,029 N 3,285,658 E | 8.0 | 2014–2021, 9 times | 110–188 | 15–30 | 6.0–8.5 | 0.02–0.25 |
| Yarylgach | 4,556,690 N 3,285,635 E | 1.6 | 2019–2021, 4 times | 70–135 | 15–32 | 7.5–8.3 | 0.03–0.11 |
| Evpatoria lake group | |||||||
| Kyzyl-Yar | 4,505,731 N 3,363,034 E | 8.0 | 2014–2021, 9 times | 2.5–9 | 12–30 | 6.0–9.1 | 0.005–0.29 |
| Moynaki | 4,518,052 N 3,331,621 E | 1.8 | 2020, 1 time | 62 | 28 | 8.0 | 0.12 |
| Sasyk-Sivash | 4,515,406 N 3,351,261 E | 75.3 | 2016–2021, 7 times | 260–350 | 13–35 | 6.2–7.8 | 0.27–1.41 |
| Novofedorovskoe | 4,508,797 N 3,356,268 E | 0.2 | 2021, 1 time | 4 | 15 | 8.0 | 0.03 |
| Kerch lake group | |||||||
| Uzunlarskoe | 4,504,601 N 3,611,014 E | 20.0 | 2014, 1 time | 390 | 31 | 7.4 | 0.58 |
| Koyashskoe | 4,505,137 N 3,619,191 E | 5.5 | 2014–2021, 4 times | 245–370 | 19–39 | 7.0–8.6 | 0.04–1.10 |
| Tobechikskoe | 4,518,943 N 3,638,163 E | 19.0 | 2016–2021, 4 times | 174–364 | 24–32 | 7.2–8.3 | 0.35–4.78 |
| Aktashskoe | 4,538,562 N 3,583,383 E | 25.0 | 2016–2021, 5 times | 88–220 | 18–29 | 6.5–8.5 | 0.08–0.69 |
| Chokrakskoe | 4,546,408 N 3,630,907 E | 8.5 | 2014–2021, 5 times | 245–420 | 22–32 | 6.6–7.9 | 0.15–2.68 |
| Feodosia lake group | |||||||
| Adzhigol | 4,510,577 N 3,546,112 E | 0.8 | 2018–2021, 3 times | 50–120 | 25–32 | 7.0–8.7 | 0.06–0.34 |
| Kuchuk-Adzhigol | 4,509,982 N 3,544,860 E | 0.6 | 2018–2021, 3 times | 3–5 | 17–31 | 8.4–9.4 | 0.001–0.03 |
Note: The data for 2012–2018 were obtained by the staff of the Department of Radiation and Chemical Biology of the IBSS with the support of the RFBR grant 16-05-00134 A (Mirzoyeva et al., 2015; Stetsiuk et al., 2018); TSS is the total suspended solids.
Table 2.
The dissolved and suspended Hg content in the Crimean saline lakes.
| Lake | Dissolved Mercury Content (Hgdis), ng L−1 | Suspended Mercury Content (Hgsus), ng L−1 | Total Mercury Content in Water (Hgt), ng L−1 | Proportion Hgdis/Hgtss | Hg Concentration in TSS, ng g−1 | Coefficient of Hg Accumulation by TSS (Ksus), 103 L kg−1 | ||||||
|---|---|---|---|---|---|---|---|---|---|---|---|---|
| Average | min/ max | CV | Average | min/ max | CV | Average | min/ max | CV | Average/ CV | Average/ CV | Average/ CV | |
| Perekop lake group | ||||||||||||
| Kiyatskoe | 143.7 | 11/400 | 0.911 | 167.2 | 3/450 | 0.850 | 325.7 | 20/850 | 0.694 | 0.441/0.489 | 655.0/0.721 | 6.3/0.733 |
| Kirleutskoe | 109.8 | 7/350 | 1.093 | 74.7 | 5/200 | 0.844 | 184.5 | 19/550 | 0.938 | 0.595/0.370 | 987.1/1.259 | 10.3/0.938 |
| Krasnoe | 145.0 | 140/150 | 0.049 | 300.0 | 200/400 | 0.471 | 445 | 350/540 | 0.302 | 0.326/0.401 | 1629.6/0.157 | 11.3/0.204 |
| Group average | 132.8 | 52.7/300 | 0.150 | 180.6 | 69/350 | 0.627 | 318.4 | 129.7/646.75 | 0.410 | 0.454/0.297 | 1090.6/0.454 | 9.3/0.288 |
| Tarkhankut lake group | ||||||||||||
| Bakalskoe | 117.8 | 55/238 | 0.594 | 93.5 | 3/300 | 1.213 | 226.4 | 63/460 | 0.639 | 0.520/0.511 | 1944.7/0.657 | 19.7/0.640 |
| Donuzlav | 195.3 | 70/373 | 0.810 | 23.4 | 2/79 | 1.584 | 225.9 | 76/380 | 0.673 | 0.085/0.322 | 3064.4/0.819 | 27.8/0.678 |
| Dzharylgach | 180.4 | 20/550 | 1.014 | 139.0 | 45/300 | 0.656 | 319.5 | 70/700 | 0.702 | 0.565/0.399 | 2960.9/1.276 | 29.2/0.925 |
| Yarylgach | 40.0 | 20/50 | 0.433 | 46.7 | 30/70 | 0.446 | 86.7 | 80/90 | 0.067 | 0.461/0.449 | 1372.4/0.894 | 54.4/1.289 |
| Group average | 133.4 | 40/195 | 0.530 | 75.7 | 23/139 | 0.678 | 214.6 | 75/390 | 0.447 | 0.408/0.538 | 2335.6/0.350 | 32.8/0.458 |
| Evpatoria lake group | ||||||||||||
| Kyzyl-Yar | 518.6 * (129.1 **) | 10/500 | 2.271 * (1.230 **) | 144.5 | 4/320 | 0.726 | 663.1 * (278.4 **) | 50/3740 * (700 **) | 1.770 * (0.815 **) | 0.464/0.725 | 5224.6/0.910 | 92.4/1.355 |
| Moynaki | 70.0 | - | - | 50.0 | - | - | 120.0 | - | - | 0.583 | 431.0 | 6.2 |
| Sasyk-Sivash | 82.5 | 50/150 | 0.478 | 155.0 | 50/300 | 0.630 | 237.5 | 105/450 | 0.557 | 0.347/0.299 | 345.31.145 | 3.7/0.763 |
| Novofedorovskoe | 20.0 | - | - | 50.0 | - | - | 70.0 | - | - | 0.286 | 1470.6 | 73.5 |
| Group average | 75.4 | 30/325 | 0.413 | 99.9 | 27/310 | 0.548 | 176.5 | 77/575 | 0.554 | 0.420/0.313 | 1868/1.229 | 44.0/1.040 |
| Kerch lake group | ||||||||||||
| Uzunlarskoe | 83.0 | 769.0 | 852 | 0.097 | 1332.8 | 16.1 | ||||||
| Koyashskoe | 41.0 | 20/63 | 0.525 | 202.5 | 30/540 | 1.472 | 241.0 | 50/603 | 1.301 | 0.170.664 | 722.2/0.284 | 19.5/0.271 |
| Tobechikskoe | 265.0 | 70/450 | 0.710 | 202.5 | 80/250 | 0.410 | 467.5 | 150/680 | 0.532 | 0.567/0.324 | 358.7/0.963 | 1.9/1.160 |
| Aktashskoe | 174.0 | 20/500 | 1.119 | 202.0 | 30/400 | 0.756 | 376.0 | 50/700 | 0.731 | 0.463/0.521 | 1478.1/1.091 | 12.6/1.174 |
| Chokrakskoe | 126.0 | 55/200 | 0.474 | 851.6 | 70/3150 | 1.535 | 977.6 | 220/3300 | 1.344 | 0.129/0.775 | 917.9/0.835 | 9.2/1.110 |
| Group average | 137.8 | 41/296 | 0.629 | 446.4 | 52/1085 | 0.752 | 583.0 | 117.5/1321 | 0.544 | 0.285/0.752 | 961.9/0.473 | 11.9/0.057 |
| Feodosia lake group | ||||||||||||
| Adzhigol | 87.5 | 50/125 | 0.606 | 275.0 | 50/500 | 1.157 | 362.5 | 100/625 | 1.024 | 0.241/0.601 | 1130.0/0.405 | 13.9/0.229 |
| Kuchuk-Adzhigol | 66.7 | 50/100 | 0.433 | 153.3 | 20/400 | 1.395 | 220.0 | 70/450 | 0.919 | 0.303/0.659 | 1254.9 ***/ 0.089 | 19.2 ***/ 1.720 |
| Group average | 77.1 | 50/112.5 | 0.191 | 214.2 | 153/275 | 0.402 | 292.6 | 220/365 | 0.351 | 0.272/0.161 | 1192.4 ***/ 0.236 | 16.6 **/ 0.548 |
| Total average | 119.2 ** | 10.5/500 ** | 0.983 | 151.2 | 2/688 ** | 1.020 | 322.7 | 19.1/850 ** | 1.231 | 0.369/0.470 | 1592.5 ***/ 1.615 | 22.9 ***/ 2.032 |
Note: TSS is the total suspended solids; *—with the highest value (3634.6 ng L−1, Lake Kyzyl-Yar, 11/18/2014); **—without the highest value (3634.6 ng L−1, Lake Kyzyl-Yar, 11/18/2014); ***—with excluding the anomaly highest value (400,000 ng g−1, Lake Kuchuk-Adzhigol, 04/26/2018).
Table 3.
The concentration of Hg in the suspended matter of the Crimean saline lakes in different months of the year.
Table 3.
The concentration of Hg in the suspended matter of the Crimean saline lakes in different months of the year.
| Month | Hg Concentration in TSS, ng g−1 | ||||
|---|---|---|---|---|---|
| Minimum | Maximum | Average | CV | The Number of Measurings | |
| January | - | - | - | - | - |
| February | 166 | 1238 | 563 | 0.880 | 4 |
| March | - | - | - | - | - |
| April | 723 | 3846 | 2004 | 0.504 | 7 |
| May | 80 | 6136 | 1472 | 1.282 | 9 |
| June | 73 | 4000 | 1239 | 0.846 | 19 |
| July | 18 | 12,500 | 3289 | 1.369 | 10 |
| August | 24 | 12,500 | 2302 | 1.433 | 13 |
| September | 3390 | 739 | 2064 | 0.908 | 2 |
| October | 211 | 1786 | 754 | 1.185 | 3 |
| November | 85 | 23,622 | 2636 | 2.410 | 13 |
| December | - | - | - | - | - |
Note: TSS is the total suspended solids.
Table 4.
The concentration of Hg in hydrobiont biomass in the Crimean saline lakes *.
| Taxon | Lake | Date | Hg Content in Dry Biomass, ng g−1 | The Coefficient of Hg Accumulation by Biomass, L g−1 | Total ** Artemia Population Abundance Ind. L−1/ Wet Biomass mg L−1 | Salinity, g L−1 |
|---|---|---|---|---|---|---|
| Vascular plants (Embryophytes) | ||||||
| Stuckenia pectinata (L.) Böerner (Potamogeton pectinatus L.) | Kiyatskoe | 19.02.2013 | 2.5 | 0.14 | 83 | |
| Donuzlav | 19.02.2013 | 51.3 | - | 16 | ||
| Donuzlav | 10.08.2014 | 42.7 | 0.30 | 15 | ||
| Kuchuk- Adzhigol | 01.07.2021 | 14.6 | 9.10 | 3 | ||
| Potamogeton crispus L. | Kyzyl-Yar | 13.05.2014 | 26.4 | 0.42 | 3 | |
| Average/CV for Potamogeton | 27.5/0.725 | 2.49/1.770 | ||||
| Ruppia maritime L. | Moynaki | 26.06.2020 | 12.7 | 0.18 | 64 | |
| Sivash | 16.09.2020 | 18.7 | 0.93 | 89 | ||
| Average/CV for Ruppia | 15.7/0.270 | 0.56/0.956 | ||||
| Myriophyllum verticillatum L. | Kyzyl-Yar | 13.06.2019 | 30.9 | 3.10 | 6 | |
| Average/CV for vascular plants | 22.0/0.744 | 2.02/6.25 | ||||
| Green filamentous algae (Chlorophyceae) | ||||||
| Cladophora spp. | Kiyatskoe | 19.02.2013 | 10.0 | 0.10 | 83 | |
| Kiyatskoe | 13.05.2014 | 7.2 | 0.68 | 83 | ||
| Bakalskoe | 22.08.2018 | 137.5 | 1.38 | 46 | ||
| Dzharylgach | 17.06.2020 | 38.1 | 0.54 | 140 | ||
| Sivash | 17.09.2020 | 20.0 | 1.00 | 86 | ||
| Average/CV for Cladophora | 42.6/1.279 | 0.74/0.652 | ||||
| Polysiphonia spp. | Bakalskoe | 13.05.2014 | 6.2 | 0.10 | 18 | |
| The Black Sea | 13.05.2014 | 3.7 | 0.04 | 18 | ||
| Bakalskoe | 10.08.2014 | 14.7 | 0.15 | 19 | ||
| Bakalskoe | 18.11.2014 | 13.8 | 0.14 | 45 | ||
| Bakalskoe | 14.07.2017 | 50.7 | 0.32 | 26 | ||
| Donuzlav | 10.08.2014 | 5.1 | 0.05 | 17 | ||
| Average/CV for Polysiphonia | 7.2/0.628 | 0.08/0.547 | ||||
| Average/CV for green filamentous algae | 4.13/1.680 | 0.45/1.151 | ||||
| Animals (Artemia) | ||||||
| Artemia spp., cysts | Kirleutskoe | 22.06.2017 | 96.7 | 1.16 | 12.6/24.0 | 235 |
| Artemia spp., adults | Aktashskoe | 29.08.2017 | 29.1 | 1.45 | 179.5/18.5 | 89 |
| Dzharylgach | 14.07.2017 | 83.6 | 0.76 | 240.0/14.6 | 137 | |
| Dzharylgach | 22.08.2018 | 318.2 | 0.80 | 6.3/2.5 | 188 | |
| Aktashskoe | 06.11.2019 | 38.6 | 1.93 | 20.7/0.6 | 220 | |
| Dzharylgach | 17.06.2020 | 85.5 | 1.22 | 33.0/25.9 | 140 | |
| Average for Artemia/CV | 111.0/1.069 | 1.22/0.357 | 82.0/14.4 | |||
Note: * The data for 2012–2018 were obtained by the staff of the Department of Radiation and Chemical Biology of the IBSS with the support of the RFBR grant 16-05-00134 A (Mirzoyeva et al., 2015; Stetsiuk et al., 2018); ** including all stages (with cysts); CV—coefficient of variation.
Publisher’s Note: MDPI stays neutral with regard to jurisdictional claims in published maps and institutional affiliations. |
© 2022 by the authors. Licensee MDPI, Basel, Switzerland. This article is an open access article distributed under the terms and conditions of the Creative Commons Attribution (CC BY) license (https://creativecommons.org/licenses/by/4.0/).
Share and Cite
MDPI and ACS Style
Shadrin, N.; Stetsiuk, A.; Anufriieva, E. Differences in Mercury Concentrations in Water and Hydrobionts of the Crimean Saline Lakes: Does Only Salinity Matter? Water 2022, 14, 2613. https://doi.org/10.3390/w14172613
AMA Style
Shadrin N, Stetsiuk A, Anufriieva E. Differences in Mercury Concentrations in Water and Hydrobionts of the Crimean Saline Lakes: Does Only Salinity Matter? Water. 2022; 14(17):2613. https://doi.org/10.3390/w14172613
Chicago/Turabian StyleShadrin, Nickolai, Aleksandra Stetsiuk, and Elena Anufriieva. 2022. "Differences in Mercury Concentrations in Water and Hydrobionts of the Crimean Saline Lakes: Does Only Salinity Matter?" Water 14, no. 17: 2613. https://doi.org/10.3390/w14172613
Note that from the first issue of 2016, this journal uses article numbers instead of page numbers. See further details here.