
Are Pluvial and Fluvial Floods on the Rise?


1
Meteorology Laboratory, Department of Construction and Geoengineering, Faculty of Environmental Engineering and Mechanical Engineering, Poznan University of Life Sciences, Piątkowska 94, 60-649 Poznań, Poland
2
Department of Land Improvement, Environmental Development and Spatial Management, Faculty of Environmental Engineering and Mechanical Engineering, Poznan University of Life Sciences, Piątkowska 94E, 60-649 Poznań, Poland
*
Author to whom correspondence should be addressed.
Water 2022, 14(17), 2612; https://doi.org/10.3390/w14172612
Submission received: 11 June 2022
/
Revised: 18 August 2022
/
Accepted: 22 August 2022
/
Published: 25 August 2022
(This article belongs to the Section Hydrology)
Abstract
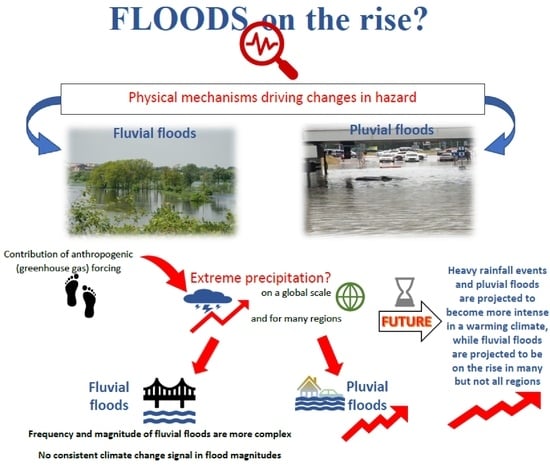
:The aim of this paper is accurately framed in its title: Are pluvial and fluvial (river) floods on the rise? First, physical mechanisms that drive changes in hazard of pluvial and fluvial floods were examined. Then, a review of literature was undertaken on detection and an attribution of changes in hazard of pluvial and fluvial floods in observation records for past to present, as well as in model-based projections for the future. Various aspects, factors, processes and mechanisms, as well as various indices of interest were considered. There is quite a common, even if not scientifically justified, belief that, generally, floods are on the rise. However, in this paper, a balanced, knowledge-based assessment was undertaken, with discussion and interpretation, including caveats and indicating considerable departures from such a flat-rate statement. Observation records show that precipitation extremes have been intensifying on a global scale and for many regions. A formal detection and attribution analysis shows that intensification of rainfall events may have been influenced by greenhouse gas forcing of anthropogenic origin. Frequency and magnitude of pluvial floods is on the rise with increasing intense precipitation, while changes of river floods are more complex. High river discharges were found to increase in some regions, but to decrease in other regions, so that no general corollaries can be drawn at the global scale. Heavy rainfall events and pluvial floods are projected to become, almost ubiquitously, more frequent and more intense with progressing climate change, while frequency and magnitude of fluvial floods are likely to increase in many but not all regions.
1. Introduction
Floods Directive, an essential legislation act of the European Union, defines a flood as the presence of a large amount of water beyond its normal limits, that is over land areas that are normally dry, i.e., not covered by water [1]. There exist several generation mechanisms that are responsible for the abundance of water. Often, precipitation of high magnitude (intensity and/or total volume) is the principal factor. However, storm surge, rapid snowmelt, flow obstruction (e.g., via landslide or ice jam), dam failure, inadequate storm drainage, rain on snow or ice, or groundwater saturation may play a significant role. Hence, floods should not be treated as homogeneous aggregates and flood-related statements may not ubiquitously hold in absolute terms. Their validity may be restricted to a class of floods.
Floods hit frequently and make it to headline news in the media. In July 2021, catastrophic floods with more than 200 fatalities and loss in excess of 30 billion Euro occurred in Germany and Belgium. Such a high number of fatalities has been unprecedented in European Union since many decades. The coincidence of floods and coronavirus disease 2019 (COVID-19) has been recognized as a genuine multi-hazard (threat multiplier) problem. Indeed, many dozens of countries around the Globe have been experiencing the double emergency of serious flooding and the pandemic [2].
For one possible taxonomy of floods, depending on the major factors and processes involved, as well as on temporal and spatial scales, see [3]. This taxonomy embraces coastal floods, flash floods typically caused by convective storms, river and lake floods, as well as cold-season floods. When river waters inundate normally dry lands, the important event characteristics are flood magnitude, flood extent (flooded area) and flood duration. However, for better availability of records, high river discharge is often examined either via annual maxima or peak-over-threshold as proxy information for fluvial floods. Since pluvial floods are triggered by heavy precipitation, the hazard of such floods (flash floods, urban floods) is typically associated using extreme precipitation as the main proxy.
There exists quite a common, even if not scientifically justified, belief that floods are generally on the rise. However, there are many caveats to such a flat-rate statement, hence a balanced, knowledge-based, assessment should include more subtleties [4,5].
The present paper is restricted to flood hazard that can be defined via the probability of exceedance of a specific level of daily precipitation or maximum river flow (with some return period). A much broader notion of flood risk embraces hazard and two other components: exposure and vulnerability [3].
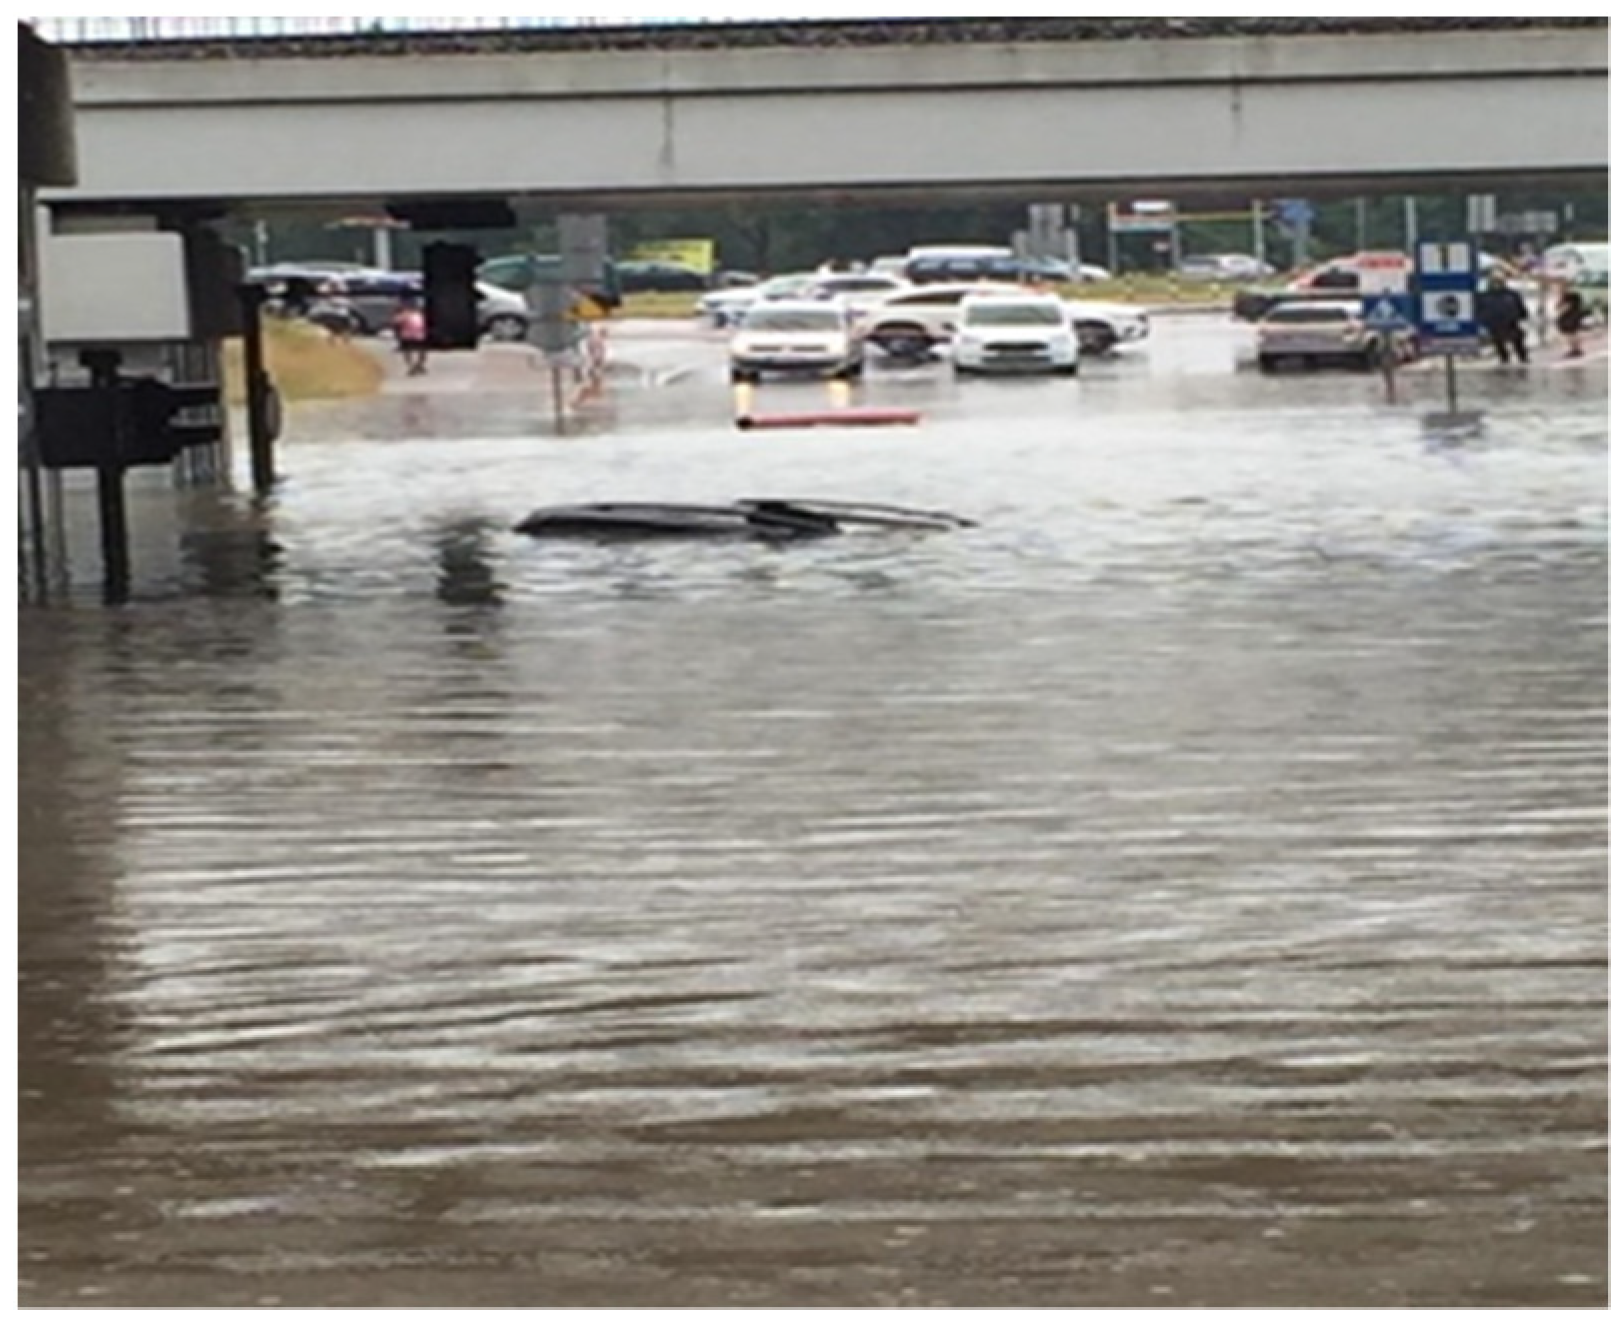
The destructive abundance of water under the rail viaduct in Swarzędz near Poznań (Poland) on 22 June 2021 was caused by an intense rainfall. At the observation station Gruszczyn, which is about 5 km away from the spot shown in Figure 1, 136.9 mm of precipitation was recorded [6]. The amount that normally falls in two months fell in just two hours. The drainage system was not able to convey the masses of water. Even if two cars on the photo are nearly totally under water, the drivers and passengers could leave the vehicles and wade to safety. Heavy precipitation triggered a landslide of the slope that caused water masses to grow and inundated the cars almost completely.
2. Methodology
This paper aims to overview and assess selected references on changes in pluvial and fluvial flood hazard in past to present (based on observation records) as well as in the future (based on projections generated by mathematical models). Physical mechanisms responsible for changes in hazard are also briefly discussed.
The issue of changes in hazard of pluvial and fluvial flooding in observations and projections has been examined in scientific literature since many decades. Our present paper is not a review but rather an assessment based on expert opinion. A review would require spatial delimitations (e.g., to a continent, a region, or a country), because a rigorous global review of thousands of references on changes in observations and projections in both intense precipitation and high river flow would be far longer than a journal article. In the present paper, the focus is on a subjective selection of more recent studies, based on updated observation records that extend as near to present as possible and based on projections for the future generated by up-to-date climate and hydrological models. A temporally unlimited review would be of historical rather than utilitarian value.
We did not conduct a complete literature search after specific keywords in bibliographic databases. Our criteria to select the literature were based on expert judgement, supported by more than two decades of experience of each of the authors in the topical area of this paper, including careful monitoring, on a regular basis, of the ongoing developments reported in publications. To a modest extent, the authors have also contributed to these developments. The spirit of the present paper largely follows the IPCC (Intergovernmental Panel on Climate Change) assessment approach. The senior author, ZWK, has gathered considerable IPCC assessment experience, being a four-fold coordinating lead author of IPCC publications (chapters in three assessment reports and one technical paper) as well as multiple lead author and review editor. The present paper distills relevant information from IPCC reports (with appropriate referencing) and updates the references by essential current papers. We particularly refer to two chapters in the recent IPCC assessment [4,5]. We trust that relevant elements of the latter two works, which include very comprehensive lists of useful references, are indeed essential further reading for everyone interested in the subject area. We summarize essential results of IPCC assessment and convey the relevant core messages of very large tables from [4] in a nutshell.
3. Physical Mechanisms behind Change in Hazard
There are many factors responsible for changes in flood hazard, in the realm of hydrological, terrestrial, and atmospheric systems [7,8]. The first two systems embrace river regulation (e.g., straightening and shortening of riverbeds), structural flood defenses (levees and dams), as well as watershed management, therein: changes in land use and land cover, e.g., related to urbanization, deforestation or reforestation. Conditions of transformation of precipitation into runoff have been changing by way of increasing sealed land areas and reduction of natural water storage areas, such as wetlands and floodplains. Changes in atmospheric systems embrace increase of the water holding capacity of the Earth’s atmosphere in the warming climate, changes in amplitude, frequency, and seasonality of heavy precipitation, changing precipitation phase (less solid and more liquid precipitation in many areas of moderate and cold climatic zone), snowmelt pattern, as well as atmospheric circulation patterns. Observations, physical understanding, and mathematical modelling instruct us that heavy precipitation events that may trigger several types of floods generally intensify with warming.
Extreme precipitation events are driven by physical processes of thermodynamic and dynamic nature. It was assessed in [4] that thermodynamic change is induced by temperature rise and leads to more intense and more frequent heavy precipitation events. At a global scale, the rate of the increase basically agrees with the Clausius-Clapeyron law. In contrast, the impact of dynamic drivers on heavy precipitation, related to warming, is considerably more complex and also more difficult to quantify.
Increase of concentration of sulfate aerosols in the Earth’s atmosphere exerts a cooling effect on the land, water, and air. In result, decrease of precipitation is observed and this reduction effect is stronger for precipitation extremes than for its mean values [9]. In contrast, decreases in atmospheric sulfate aerosols, that add to warming, enhance heavy precipitation. Furthermore, there are other factors influencing extreme precipitation, such as changes in land use and land cover. Urbanization may intensify heavy precipitation over the urban area and the downwind area, especially in particular times during a day, such as the afternoon and early evening. Several responsible mechanisms were identified in [4]. The urban heat island effect drives increase of atmospheric moisture due to horizontal air convergence. There are increases in condensation due to urban aerosol emissions; aerosol pollution that impacts cloud microphysics; and urban structures that impede atmospheric motion. However, also other local forcing, including reservoirs and irrigation can affect extreme precipitation.
The Clausius-Clapeyron equation indirectly quantifies a theoretical link between the warming and the pluvial flood hazard. The warming leads to an increase in the atmosphere’s water holding capacity and this increases the intense precipitation potential. It should be stressed, though, that an increase in the potential value does not have to lead to an increase of the actual value. According to the Clausius-Clapeyron equation, intense daily precipitation may increase at the rate of about 6–7% per warming at one degree Celsius, while for very extreme sub-daily precipitation, even higher scaling rates may apply. Thermodynamics leads to an increase in potential convective energy that is available with temperature rise as well as to increase in the intensity of convective storms. Also lifting condensation level due to declining relative humidity over land and increasing tropopause height can intensify convective systems thus amplifying storm precipitation [4].
It is convincingly demonstrated [10] that large inundations depend also on other factors, beyond rainfall, hence trends in precipitation extremes may be considerably different from trends in high river discharge. In many cases, extreme precipitation does not have to cause high river discharge and fluvial flooding, even if it may cause pluvial flooding. For instance, on 22 June 2021 in Poznań area (Poland) there was no exceedance of the alarm stage in rivers and streams (Figure 1). Also, the other way round, high river discharge can occur even if precipitation is not extreme. In particular, the antecedent precipitation, shaping the soil moisture in the river basin can largely modulate the rainfall-runoff process. The precipitation preceding destructive floods in Poland in the spring (May-June) of 2010 was not record high, indeed far from being extreme. However, the soil moisture in drainage basins was high, leading to large flooding, with high material damage and fatalities.
The statements made above were generalized in [10]. It was assessed that one should not expect the existence of a strict one-to-one correspondence between an extreme precipitation event and a flood event. Floods are also affected by factors other than precipitation of high amplitude or volume. However, intensification of intense rainfall of short duration is likely to increase the flash flooding severity (caeteris paribus, that is—with other factors unchanged), hence changes in extreme precipitation may be conveniently used as a proxy for flash flood potential. Increase of the fraction of sealed surfaces in urbanized areas also augments the hazard of flash and urban floods. There are also several modulating factors, related to the design of storm water drainage systems that can play an important role in the development of flash floods.
Since flash and urban floods are responsible for considerable risk to humans and infrastructure in Europe, an information base was built up in the form of inventory of major documented flash flood events [11]. The magnitude of most extreme flash floods was found to be greater in the Mediterranean belt in comparison to the inner continental countries of Europe. Furthermore, a strong seasonality of flash flood occurrence was detected, in agreement with different climatic forcing mechanisms in particular European regions.
Heavy and long-lasting precipitation can lead to widespread flooding and landslides. Other important factors affecting river floods include stream morphology, snow cover, snow water-equivalent and snowmelt, as well as feedback between climate, soil, snow, and vegetation. On the one hand, more intense but less frequent storms favor groundwater recharge through leakage from surface waters and runoff to aquifers. However, on the other hand, they may also favor flash flooding if the soil moisture capacity is saturated, so that no further water can be stored in the soil, so that it forms surface runoff. Flood hazard can be considerably compounded by sea level rise in coastal and delta regions that accompany the warming. Direct human intervention works, such as river and catchment engineering, e.g., river regulation, may, in general, increase resilience to flooding, masking effects of precipitation intensity increase on inundation hazard.
There is a plethora of references that tackle links between large-scale modes of climate variability and hydrometeorological variables. This manifests itself via oscillations in the complex coupled system of ocean and atmosphere. The links between climate variability indices and global mean temperature are probably best known [12]. However, the existence of links of climate variability indices and characteristics of heavy precipitation and floods was also reported (e.g., [13,14]). The principal variability mode for which such links have been broadly recognized is the ENSO (El Niño-Southern Oscillation). In some areas there is a propensity of the occurrence of water abundance under El Niño phase, while in other areas—under La Niña phase. However, there are hypotheses that extremes in precipitation and river discharge as well as floods can also have links to the rhythm of other oscillation modes in the ocean-atmosphere system, such as the NAO (North Atlantic Oscillation), the PDO (Pacific Decadal Oscillation), and the AMO (Atlantic Multidecadal Oscillation) [13]. The effects of observed changes in internal climate variability and its modes have to be separated from the effect of warming and this is not a trivial task.
4. Change Detection and Attribution for Past to Present
4.1. Heavy Precipitation
Observation records show that precipitation extremes have been intensifying with warming on a global scale and in most regions. Important recent global scale studies are [15,16]. Trends in the annual maximum one-day and five-day precipitation were analyzed in [15], at the global, continental, and regional scales, over land areas where adequate observation records were available. The analysis was carried out for two time intervals, over a longer period, 1900–2018 (for which temporal coverage was better, but spatial coverage was more limited) and over a shorter period, 1950–2018 (for which spatial coverage was better, but temporal coverage was more limited). Increasing trends were detected for more than two thirds of examined stations. Statistically significant increasing trends were found for approximately 10% of stations and double that, respectively, for the two periods, 1950–2018 and 1900–2018. The percentage of observation stations with statistically significant increasing trends was found to be significantly larger than could be expected by chance for the global scale, as well as for several continents and regions. In contrast, the percentage of observation stations with statistically significant decreasing trends was found not to differ from that expected by chance. A significant intensification of precipitation extremes was reported at the continental scale in Europe, North America, and Asia, where station coverage is high [15]. In regions (Africa and South America), data coverage is poor, that is the number of precipitation gauges, their density and data quality are not sufficient, and spatial sampling cannot be regarded as representative. However, over areas with fine data coverage in both Africa and South America, increases in extreme precipitation appear to dominate. Detection of significant trends becomes more difficult at the regional scale, because of the decrease of the signal-to-noise ratio. However, in much of the Northern Hemisphere, detected intensification in precipitation extremes is statistically significant. In contrast, in southern Australia, a decreasing trend in five-day precipitation is observed. Statistically significant connections between changes in extreme (annual maximum) precipitation and global mean surface temperature were found in [15], at a range of scales (global, continental, and regional—for many data-rich regions). The scaling rates follow what is expected from the Clausius–Clapeyron law. The global median sensitivity of change in extreme precipitation to global temperature rise of 1° K was estimated to be 6.6% and 5.7%, respectively, for one-day precipitation and for five-day precipitation.
Table 1 summarizes observed changes in heavy precipitation, after IPCC regions, based on references on global coverage [4,15,16].
In addition to global, continental and regional studies (see assessment in [4]), there have been many papers reporting on national research. For instance, a study carried out over central India [17] reported that precipitation extremes dramatically increased.
Changes in indices of extreme precipitation were studied over the Yangtze River Basin [18], in relation to global temperature rise and ocean-atmosphere oscillation (ENSO). It was shown that heavy precipitation increased in intensity and frequency. In contrast, frequency of precipitation and wet spells duration significantly decreased. Also, a distinct regional difference was identified. Namely, over the middle and lower reaches of the Yangtze, precipitation extremes increase faster in intensity and frequency than those over the upper reach of the Yangtze. Increase of the number of days with heavy rain was also reported for all China [19].
Among the many studies in Europe, a study of observed changes in extreme precipitation in Poland [20] in the 60-year interval, 1959–2018, divided into two consecutive 30-year subintervals, demonstrated increase of precipitation above the 99th percentile.
The intensity of precipitation extremes over Germany was found [21] to rise at the warming. Convective precipitation (and thunderstorms) was found to increase stronger than stratiform (frontal) precipitation. The database used in this study include radar and rain gauge observations as well as synoptic observations and temperature records, and information on convective and stratiform precipitation obtained by cloud observations. It was found in [21] that stratiform precipitation extremes increase with the warming at about the Clausius–Clapeyron rate, while intensity of convective precipitation response to temperature rise exceeds the Clausius–Clapeyron rate. The conclusion was that convective precipitation responds much more sensitively to warming than stratiform precipitation, and increasingly dominates in extreme precipitation events.
The attribution issue has been tackled and assessed in literature. According to [4], over the second half of the 20th century, anthropogenic forcing contributed to intensification of precipitation extremes at the global scale. A formal detection and attribution study [22] was conducted for several percentile-based indices of extreme precipitation. Increases in extreme indices were detected in [22] for most data-rich land areas during the interval 1951–2014 when temperature rise was ubiquitous. A detectable anthropogenic signal (increasing atmospheric concentration of greenhouse gases) was found in examined extreme precipitation indices at the global scale and in parts of the Northern Hemisphere. Examination of changes in percentile-based indices allowed a complementary analysis to annual maximum one-day and five-day precipitation, by embracing the combined look at the frequency and intensity of precipitation extremes.
Important mechanisms of relevance to flooding are atmospheric rivers [5]; that is, corridors of massive water vapor transport in the atmosphere (of the width of up to few hundred kilometers and depth of up to few kilometers). Atmospheric rivers, that may develop ahead of the cold front of an extratropical cyclone, are often associated with extreme precipitation events and floods. It was assessed [5] that, since the mid-20th century, increasing trend in the atmospheric river’s activity was likely (>66%) in the eastern North Pacific.
4.2. High River Flow
The IPCC SR1.5 assessment [23] reported increasing trends in observed extreme river flow and flood frequency in some regions, while in other regions decreases were detected. However, hydrological literature on observed changes in high river discharge and fluvial flood indices is largely heterogeneous. While it focusses at lower (sub-regional, as well as river basin) spatial scales, it does not allow to draw meaningful corollaries at the larger (global and even regional) scales. There is high regional variability in peak discharge trends, so that no ubiquitous findings can be reported. Decreases or increases look quite random, largely depending on the start-year and the end-year of analysis and lack statistical significance.
The finding of a global study of trends in annual maximum daily river discharge data from the GRDC (Global Runoff Data Centre) holdings [24] was that there were less stations with significant increasing trends and more stations with significant decreasing trends. This result may seem somewhat surprising to many a reader, as it does not follow the detected intensification of precipitation extremes over many areas. Interestingly, such factors as dams and forest cover appeared not to exert a substantial effect on the results of trend detection, while the catchment size was found to be important. In [24], limits of evidence of increasing flood hazard were demonstrated.
Examining the relation of changes in flood magnitude and changes in precipitation extremes, the authors of [25] noted that the magnitude of peak river flows is decreasing in many areas of the world, despite the increasing evidence of intensification of precipitation extremes with temperature rise. They found a low correlation (below 0.2) between changes in annual precipitation extremes and changes in floods over the contiguous USA, attributable to a small fraction of co-occurrence. Also, the covariation between extreme precipitation and flood indices was found to be low, with a coefficient of determination being less than 0.5 for most drainage basins.
Global changes in indicators of extreme streamflow (90th percentiles and the annual maximum of daily streamflow) were analyzed in [26]. The analysis for three study periods of 40 years each: 1951–1990, 1961–2000, and 1971–2010 confirms the complex nature of hydrological change. Trends in river flow are strongly dependent on start-year and end-year in some regions (Table 2). Not for all sub-regions adequate data for were available.
Indeed, even if intensity and frequency of extreme precipitation have grown in many (but not all) regions, there is no ubiquitous, gauge-based, evidence for a clear, widespread, and consistent change in the magnitude and frequency of fluvial floods. Complex changes of river flood hazard have been extensively examined for two decades (e.g., [30,31]). Climate-driven variability in major flood occurrence in Europe and North America was analyzed [27] for two periods: 1931–2010 and 1961–2010, in quasi-natural (more precisely—minimally altered) catchments, so that essential non-climatic effects were eliminated. It was found that the number of statistically significant trends was about equal to the number expected due to chance alone. Noting that detection of ubiquitous changes of flood hazard in observation records in Europe was not possible, the authors of [32] found an increase in the number of large floods, amidst distinct natural variability. However, no consistent signal related to climate change was found in magnitude of floods in Europe [29]. Instead, climate-induced change patterns were found in observed flood timing, at the continental scale. Warming-driven changes were detected, such as earlier spring floods caused by snowmelt throughout northeastern Europe, as well as later winter floods in part of the Mediterranean coast and around the North Sea, and—in contrast–earlier winter floods in western Europe. The latter may have reflected advancement of soil moisture maxima. In the study of trends in flood flow in Europe [28], it was noted that the range of change is from −23% to +11% per decade. Increase in autumn and winter rainfall was found to result in increasing floods in northwestern Europe. In contrast, decrease in precipitation and increase in evaporation was found to lead to decreasing floods in medium and large drainage basins in the south of Europe; while decrease in snow cover and snowmelt, accompanying the warming, was found to result in decreasing floods in the east of Europe.
Long-term trends in selected indices of high river flow in drainage basins of medium to small size; with low degree of modification of flow regime (i.e., semi-natural basins), were analyzed [33] for Poland. A strong random component in the process of river discharge was found, with changes being weak in general and the spatial pattern of changes being complex. Yet, the trend detection results for several indices of river flow in Poland demonstrate the existence of a spatial divide. Decreases of river discharge were found to dominate in the north of the country and increases usually in the south. For most stations in the central part of the country, no trend could be detected.
In [34], the authors demonstrated a significant decrease of flood frequency in the Vietnamese Mekong Delta over the past two decades. A statistically significant, descending trend in water stage data but not in river discharge was demonstrated. This was interpreted by incision (lowering of the riverbed), caused by mining of sand, rather than by climatic factors.
The concept of UEF (Urban Exposure to Flooding), studied in [35] on the global scale, proved to be important for developing strategies of risk reduction for sustainable development of urban areas. It was found that the global UEF corresponding to 100-year return period increased more than five-fold between 1985 and 2018, with accelerated temporal trends, while in Asia the growth was most notable.
A pioneer attribution study by [36] referring to a large flood event in the UK from September to November of 2000 demonstrated that increase in global anthropogenic emissions of greenhouse gases, as well as a displacement of jet stream in the North Atlantic could have led to increase in the risk of occurrence of rain-caused flooding. According to results of this study, the chance that an anthropogenic influence can be detected in UK extreme precipitation in winter is of the order of 50%. However, in other seasons the likelihood of such detection was assessed to be very small [37]. According to assessment in [4], the confidence in the anthropogenic influence on the changes in high river discharges on the global scale is low.
Trends in high flows, computed from state-of-the-art model simulations, were found [38] to be consistent with the observations only if radiative forcing that accounts for anthropogenic climate change is considered. Simulated effects of water and land management do not suffice to reproduce the observed trend pattern.
5. Projections
5.1. Heavy Precipitation
It is expected that intensity and amount of rainfall conveyed by extratropical storms could increase with warming-induced rise in atmospheric moisture. Extratropical cyclonic precipitation, including atmospheric river events (associated with many large floods) was projected [4,5] to intensify through increased atmospheric moisture flux. Further, intense precipitation is projected to become even more intense with the ongoing temperature rise. Increased atmospheric moisture and its convergence within both extratropical and tropical cyclones and storms are projected to likely increase precipitation during wet events.
It was assessed in [4] that extreme precipitation in the future, warmer, world is likely to increase in intensity and frequency over most land areas in mid-latitudes and wet tropics, while larger increases are projected to accompany higher warming. A few seasonal and regional exceptions are projected, though, e.g., in Southern, Mediterranean, Europe.
At a large global warming level, such as 4 °C above the pre-industrial temperature, it was assessed [4] to be virtually certain (IPCC calibrated uncertainty term, meaning >99%) that in comparison to the recent past, very rare intense precipitation events, with return period of 10 years or more, would increase in intensity and frequency. This holds true for the global scale, but also for the continental and regional scales. The increase in frequency and intensity is extremely likely (IPCC calibrated uncertainty term, meaning >95%), for most continents. The likelihood is projected to be lower at lower warming and for less-rare heavy precipitation. At the global scale, heavy precipitation is projected to intensify, following the Clausius-Clapeyron scaling, i.e., about 7% per °C of global warming, governing the maximum amount of moisture that the warmer atmosphere can hold. This is projected across all SSP (shared socioeconomic pathways) scenarios and all models, for the 50-year return value. The increase in the heavy precipitation frequency is projected to accelerate with larger warming and to be stronger for more-rare events. For recurrence intervals of 10 years and 50 years, the frequency is projected to double and treble, respectively, at the high-end global warming level of 4 °C. Regional increases of the rate of heavy precipitation are projected to depend on the level of regional temperature rise and on changes in atmospheric circulation and storm dynamics that may lead to regional differences.
Table 3 summarizes projected changes in heavy precipitation.
It was assessed in [4] that, based on available evidence, despite all the recognized limitations, one may expect an increase of extreme sub-daily rainfall events in the future. This is bad news for the hazard and risk of flash and urban flooding, caused by short-lasting (e.g., two-hour, see Figure 1) intense precipitation. It was also assessed in [4] that in Europe and in North America, precipitation extremes will likely (IPCC calibrated uncertainty term, meaning >66%) increase at the global temperature rise of 2 °C and below, but very likely (IPCC calibrated uncertainty term, meaning >90%) increase for higher global warming. A larger part of land areas is projected to witness an increase in fluvial floodings than a decrease in fluvial flooding.
5.2. High River Flow
As a rule, at the regional level, projected changes in fluvial floods are more uncertain than projected changes in pluvial floods. This is so, because there are complex hydrological processes and forcings involved in transformation of precipitation into river discharge. These complicated factors include watershed management (therein changes in land use and land cover) as well as water management. It was assessed in [5] that increased fluvial flood severity can be expected on larger, hence slowly-responding, rivers, reflecting increased accumulation of rainfall during persistent wet events over a rainy season. This can occur in regions where atmospheric blocking patterns drive extratropical cyclones across large river basins, e.g., in mid-latitudes of the Northern Hemisphere and in the Asian continent, although groundwater flooding and antecedent conditions including soil moisture and snowmelt may be also important.
There have been many studies of flood hazard projections in scientific literature, but their results do not necessarily agree. Large differences in projections reported in various papers were demonstrated and interpreted in [40,41] as well as [42] and sources of uncertainty of projections were discussed. It was found in [43] that a contribution of global hydrological models can equal or even outweigh a contribution of global climate models to the overall uncertainty in hydrological projections for the future. The performance of hydrological models was found [44] to be related to credibility of river flow projections for the future, under climate change.
Projections by [45] indicated that, in many areas of the globe, what used to be a flood with return period of 100 years (Q100, i.e., exceeded once in hundred years, on average) in the reference period may occur considerably more frequently in the warming climate. An increase in hazard was projected in most areas of the Asian continent (except for its western part), and in particular eastwards of the longitude of 80°E. The flood hazard was also projected to increase in the northern part of North America and the east US coast, in Central and South America, as well as in Central Africa. In contrast, a decrease in flood hazard was projected for most of the European continent. Findings of another study [46], referring to Q30 (i.e., 30-year five-day peak discharge), were qualitatively similar to those in [45] as to the direction of change, yet with some exceptions. In contrast, [43] projected increase in the number of days with high river discharge northwards of 50° N, but projected changes were rather small.
Regionally, the projected frequency of flooding may strongly depend on characteristics of the river basin, antecedent wetness conditions and on the response of circulation systems to climate change, bound with uncertainty.
The Paris Agreement (2015) established at the 21st Conference of Parties of the United Nations Framework Convention on Climate Change (COP 21 of UNFCC) set the ambitious targets to curb global warming at the level of least 2 °C above pre-industrial temperature, but making efforts to curb the warming even more, to 1.5 °C. There exist numerous studies examining changes in flood hazard and flood risk for different warming thresholds, demonstrating that a small increment of 0.5 °C (that is whether 2 °C or 1.5 °C) in global warming does really matter in the sense of effect on precipitation extremes [23].
The impact of an additional half degree of global warming increment (1.5° vs. 2 °C) on high river discharge was analyzed in [47]. Projections demonstrated that what used to be a 100-year river discharge could occur more frequently already at low global warming level of 1.5 °C. However, for the global warming level of 2 °C warming, projected changes were considerably stronger for many regions. The median decrease of the return period of the current 100-year discharge was to 70–90 years at 1.5 °C warming, while it was at least 50 years at 2 °C warming. In the most affected regions, such as South Asia, where precipitation patterns can be influenced by region-specific features, e.g., atmospheric aerosol loads, the historical 100-year discharge could occur four times more frequently, becoming 25-year discharge under 1.5 °C global temperature rise [47]. At a warming of 2 °C, similar increases were projected in several regions of the globe. These results suggest that in many areas, there can be decreases in duration of rainy seasons and increase of precipitation intensity and this clearly affects the occurrence of high river discharge.
Projections of increasing flood hazard changes in China for global temperature rise in a range of 1.5°–4 °C above the pre-industrial level, with a 0.5 °C increment were reported in [48]. The projections in this study were based on a distributed hydrological model driven by an ensemble of downscaled GCMs (general circulation models). Historical reference 100-yr floods in China are projected to occur much more frequently in the warming climate, becoming (median values) 71-, 68-, 59-, 50-, 42-, and 42-yr events, under 1.5°, 2.0°, 2.5°, 3.0°, 3.5°, and 4.0 °C global warming scenarios, respectively.
A study of flood risk change in the Pearl River Delta [49] demonstrated that joint effects of climatic and non-climatic factors (urbanization) are projected to converge to challenge the flood control system. An increase in intensity and frequency of precipitation extremes and progressing urbanization are projected to exacerbate flood risk in most parts of the region within the next few decades.
An overwhelming increase of future flood hazard over Europe was projected in [50] for different recurrence intervals of concern. The eastern and southern regions of the continent were projected to experience the highest increase.
6. Concluding Remarks
Is the hazard of pluvial and fluvial floods on the rise? This is a specific research question of broad relevance, since often flat-rate judgments on increase of flood hazard are being issued. There is quite a common, even if not scientifically justified, belief that, generally, floods are on the rise. We demonstrate, in a systematic way, that a binary (yes or no), and generally valid, response to the question posed in the title cannot be issued. For some aspects and some regions, a statement on increase is largely true, yet we indicate, and interpret, considerable departures from such a flat-rate statement. Therefore, based on overview of literature, we provide a balanced, knowledge-based, assessment, including more subtleties and showing that such a flat-rate statement does not unconditionally hold.
Observation records show that extreme precipitation has been getting more extreme on a global scale, as well as in many, but not all, regions of the globe. A formal detection and attribution analysis shows that there has been a contribution of anthropogenic forcing (emission of greenhouse gases, and CO2 in particular, to the atmosphere) to intensification of heavy precipitation. Observed connections between heavy precipitation and temperature do broadly agree with the Clausius–Clapeyron law, foreseeing increase in the vapour holding capacity of the atmosphere, at the rate of approximately 6–7% per 1 °C warming.
Analysis of observation records demonstrates that pluvial floods are increasing if heavy precipitation is on the rise, while the mechanism of changes in frequency and magnitude of fluvial floods is more complex. There are several factors in addition to heavy precipitation change that affect river floods. At times, very heavy (even extreme) precipitation does not cause high river discharge and, the other way round, a river flood may not be preceded by very heavy precipitation. An obvious example is the snowmelt flooding in moderate and cold climates, where the driving factors are availability of snow cover (possibly resulting from snowfall over a longer time, even the whole winter) and the rate of temperature rise. High river discharges were found in trend-detection studies to increase in some regions, but to decrease in other regions. Unfortunately, no simple and general, ubiquitously valid, statements can be made at the global scale. Despite evidence of extreme precipitation getting more extreme in the warming climate, high river discharges (maximum annual discharge or peak over threshold values) tend to decrease at many stations. Actually, globally, the number of stations with significant decreasing trends is greater than the number of stations with significant increasing trends.
Heavy rainfall events and pluvial floods are projected to become more intense in a warming climate of the future, reflecting an increase in the water vapor capacity of the Earth’s atmosphere. Frequency and intensity of extreme precipitation events are projected to increase over most mid-latitude land masses, as well as in the wet tropics. Larger increases are expected at higher global warming levels, even if with some exceptions (e.g., in the Mediterranean belt). Urban and flash floods, corresponding to the precipitation intensity exceeding the infiltration capacity and the conveying capacity of the drainage systems, are related to extreme precipitation.
In the future, fluvial (river) floods are expected to increase in frequency and magnitude in many, but not all, regions, hence general, and unconditional, statement “fluvial floods on the rise” is ungrounded. However, the fraction of land areas, for which river floods are projected to increase, is greater than the fraction of areas, for which a decrease in fluvial floods is projected.
Extreme precipitation has become more extreme in many areas of the globe, but the impact on river floods is less clear and in fact difficult to detect in many studies of time series of observation records. In contrast, projections for the future tend to demonstrate increases over large areas. Hence, there is a disturbing lack of consistency between the results of change detection in observations (no increasing trend) and the model-based projections (increasing trend). Perhaps this does not have to be regarded as surprising, because climate change has accelerated relatively recently; hence, the change expected for the far future, especially for the so called high-end climate change scenarios, like RCP (representative concentration pathway) 8.5 can be considerably different from the trend determined for observed records.
It is likely that we may witness better detectability of intensification of extremes of precipitation and river flow in the future, when observation records become longer. Therefore, it is necessary to repeat the trend detection activity on a regular basis, for updated observation records. However, unfortunately, the availability of ground-truth data has been worsening in many countries. As a result, observations in many stations with long records are discontinued, for economies. It is also necessary to continue striving to work towards reduction of uncertainty in projections. Since flood hazard is on the rise in many regions of the globe, it is urgently necessary to undertake effective combination of diverse flood risk management strategies to safeguard flood risk reduction [51].
Author Contributions
Conceptualization, Z.W.K.; Visualization, I.P. and Z.W.K.; Writing draft, Z.W.K.; Writing—review & editing, Z.W.K. and I.P. All authors have read and agreed to the published version of the manuscript.
Funding
IP was supported by the National Science Centre of Poland [project number 2018/31/B/HS4/03223].
Data Availability Statement
Not applicable.
Acknowledgments
Useful comments of two of three anonymous reviewers are gratefully acknowledged.
Conflicts of Interest
The authors declare no conflict of interest.
References
- EU Directive 2007/60/EC of the European Parliament and of the Council of 23 October 2007 on the Assessment and Management of Flood Risks. Off. J. Eur. Union 2007, L288, 27–34.
- Simonovic, S.P.; Kundzewicz, Z.W.; Wright, N. Floods and the COVID-19 Pandemic—A New Double Hazard Problem. WIREs Water 2021, 8, e1509. [Google Scholar] [CrossRef] [PubMed]
- Kron, W.; Eichner, J.; Kundzewicz, Z.W. Reduction of Flood Risk in Europe—Reflections from a Reinsurance Perspective. J. Hydrol. 2019, 576, 197–209. [Google Scholar] [CrossRef]
- Seneviratne, S.I.; Zhang, X.; Adnan, M.; Badi, W.; Dereczynski, C.; di Luca, A.; Ghosh, S.; Iskandar, I.; Kossin, J.; Lewis, S.; et al. Weather and Climate Extreme Events in a Changing Climate. In Climate Change 2021: The Physical Science Basis. Contribution of Working Group I to the Sixth Assessment Report of the Intergovernmental Panel on Climate Change; Masson-Delmotte, V., Zhai, P., Pirani, A., Connors, S.L., Péan, C., Berger, S., Caud, N., Chen, Y., Goldfarb, L., Gomis, M.I., et al., Eds.; Cambridge University Press: Cambridge, UK; New York, NY, USA, 2021; pp. 1513–1766. [Google Scholar]
- Douville, H.; Raghavan, K.; Renwick, J.; Allan, R.P.; Arias, P.A.; Barlow, M.; Cerezo-Mota, R.; Cherchi, A.; Gan, T.Y.; Gergis, J.; et al. Water Cycle Changes. In Climate Change 2021: The Physical Science Basis. Contribution of Working Group I to the Sixth Assessment Report of the Intergovernmental Panel on Climate Change; Masson-Delmotte, V., Zhai, P., Pirani, A., Connors, S.L., Péan, C., Berger, S., Caud, N., Chen, Y., Goldfarb, L., Gomis, M.I., et al., Eds.; Cambridge University Press: Cambridge, UK; New York, NY, USA, 2021; pp. 1055–1210. [Google Scholar]
- Skonieczna, M.; Hański, A.; Topiłko, J.; Barszczewska, M.; Wdowikowski, M. Miejskie Powodzie—Winny Klimat Czy Czlowiek? (Urban Floods—Guilty Climate or Human?). Gazeta Obserwatora IMGW. 2021. Available online: https://obserwator.imgw.pl/miejskie-powodzie-winny-klimat-czy-czlowiek/ (accessed on 1 June 2022). (In Polish).
- Kundzewicz, Z.W.; Schellnhuber, H.-J. Floods in the IPCC TAR Perspective. Nat. Hazards 2004, 31, 111–128. [Google Scholar] [CrossRef]
- Kundzewicz, Z.W. Quo Vadis, Hydrology? Hydrol. Sci. J. 2018, 63, 1118–1132. [Google Scholar] [CrossRef]
- Sillmann, J.; Stjern, C.W.; Myhre, G.; Samset, B.H.; Hodnebrog, Ø.; Andrews, T.; Boucher, O.; Faluvegi, G.; Forster, P.; Kasoar, M.R.; et al. Extreme Wet and Dry Conditions Affected Differently by Greenhouse Gases and Aerosols. Npj Clim. Atmos. Sci. 2019, 2, 24. [Google Scholar] [CrossRef]
- Ivancic, T.J.; Shaw, S.B. Examining Why Trends in Very Heavy Precipitation Should Not Be Mistaken for Trends in Very High River Discharge. Clim. Chang. 2015, 133, 681–693. [Google Scholar] [CrossRef]
- Gaume, E.; Bain, V.; Bernardara, P.; Newinger, O.; Barbuc, M.; Bateman, A.; Blaškovičová, L.; Blöschl, G.; Borga, M.; Dumitrescu, A.; et al. A Compilation of Data on European Flash Floods. J. Hydrol. 2009, 367, 70–78. [Google Scholar] [CrossRef]
- Kundzewicz, Z.W.; Pińskwar, I.; Koutsoyiannis, D. Variability of Global Mean Annual Temperature Is Significantly Influenced by the Rhythm of Ocean-Atmosphere Oscillations. Sci. Total Environ. 2020, 747, 141256. [Google Scholar] [CrossRef]
- Kundzewicz, Z.W.; Szwed, M.; Pińskwar, I. Climate Variability and Floods—A Global Review. Water 2019, 11, 1399. [Google Scholar] [CrossRef]
- Kundzewicz, Z.W.; Huang, J.; Pińskwar, I.; Su, B.; Szwed, M.; Jiang, T. Climate Variability and Floods in China—A Review. Earth-Sci. Rev. 2020, 211, 103434. [Google Scholar] [CrossRef]
- Sun, Q.; Zhang, X.; Zwiers, F.; Westra, S.; Alexander, L.V. A Global, Continental, and Regional Analysis of Changes in Extreme Precipitation. J. Clim. 2021, 34, 243–258. [Google Scholar] [CrossRef]
- Dunn, R.J.; Alexander, L.V.; Donat, M.G.; Zhang, X.; Bador, M.; Herold, N.; Lippmann, T.; Allan, R.; Aguilar, E.; Barry, A.A.; et al. Development of an updated global land in situ-based data set of temperature and precipitation extremes: HadEX3. J. Geophys. Res. Atmos. 2022, 125, e2019JD032263. [Google Scholar] [CrossRef]
- Roxy, M.K.; Ghosh, S.; Pathak, A.; Athulya, R.; Mujumdar, M.; Murtugudde, R.; Terray, P.; Rajeevan, M. A Threefold Rise in Widespread Extreme Rain Events over Central India. Nat. Commun. 2017, 8, 708. [Google Scholar] [CrossRef] [PubMed]
- Li, X.; Zhang, K.; Gu, P.; Feng, H.; Yin, Y.; Chen, W.; Cheng, B. Changes in Precipitation Extremes in the Yangtze River Basin during 1960–2019 and the Association with Global Warming, ENSO, and Local Effects. Sci. Total Environ. 2021, 760, 144244. [Google Scholar] [CrossRef]
- Kundzewicz, Z.; Su, B.; Wang, Y.; Xia, J.; Huang, J.; Jiang, T. Flood risk and its reduction in China. Adv. Water Resour. 2019, 130, 37–45. [Google Scholar] [CrossRef]
- Pińskwar, I. Complex Changes of Extreme Precipitation in the Warming Climate of Poland. Int. J. Climatol. 2022, 42, 817–833. [Google Scholar] [CrossRef]
- Berg, P.; Moseley, C.; Haerter, J.O. Strong Increase in Convective Precipitation in Response to Higher Temperatures. Nat. Geosci. 2013, 6, 181–185. [Google Scholar] [CrossRef]
- Dong, S.; Sun, Y.; Li, C.; Zhang, X.; Min, S.-K.; Kim, Y.-H. Attribution of Extreme Precipitation with Updated Observations and CMIP6 Simulations. J. Clim. 2021, 34, 871–881. [Google Scholar] [CrossRef]
- Hoegh-Guldberg, O.; Jacob, D.; Taylor, M.; Bindi, M.; Brown, S.; Camilloni, I.; Diedhiou, A.; Djalante, R.; Ebi, K.; Engelbrecht, F.; et al. Impacts of 1.5 °C Global Warming on Natural and Human Systems. In Global Warming of 1.5 °C. An IPCC Special Report on the Impacts of Global Warming of 1.5 °C above Pre-Industrial Levels and Related Global Greenhouse Gas Emission Pathways, in the Context of Strengthening the Global Response to the Threat of Climate Change; Masson-Delmotte, V., Zhai, P., Pörtner, H.O., Roberts, D., Skea, J., Shukla, P.R., Pirani, A., Moufouma-Okia, W., Péan, C., Pidcock, R., et al., Eds.; World Meteorological Organization Technical Document: Geneva, Switzerland, 2018; pp. 175–311. [Google Scholar]
- Do, H.X.; Westra, S.; Leonard, M. A Global-Scale Investigation of Trends in Annual Maximum Streamflow. J. Hydrol. 2017, 552, 28–43. [Google Scholar] [CrossRef]
- Do, H.X.; Mei, Y.; Gronewold, A.D. To What Extent Are Changes in Flood Magnitude Related to Changes in Precipitation Extremes? Geophys. Res. Lett. 2020, 47, e2020GL088684. [Google Scholar] [CrossRef]
- Gudmundsson, L.; Leonard, M.; Do, H.X.; Westra, S.; Seneviratne, S.I. Observed trends in global indicators of mean and extreme streamflow. Geophys. Res. Lett. 2019, 46, 756–766. [Google Scholar] [CrossRef]
- Hodgkins, G.A.; Whitfield, P.H.; Burn, D.H.; Hannaford, J.; Renard, B.; Stahl, K.; Fleig, A.K.; Madsen, H.; Mediero, L.; Korhonen, J.; et al. Climate-Driven Variability in the Occurrence of Major Floods across North America and Europe. J. Hydrol. 2017, 552, 704–717. [Google Scholar] [CrossRef]
- Blöschl, G.; Hall, J.; Viglione, A.; Perdigão, R.A.P.; Parajka, J.; Merz, B.; Lun, D.; Arheimer, B.; Aronica, G.T.; Bilibashi, A.; et al. Changing Climate Both Increases and Decreases European River Floods. Nature 2019, 573, 108–111. [Google Scholar] [CrossRef] [PubMed]
- Blöschl, G.; Hall, J.; Parajka, J.; Perdigão, R.A.P.; Merz, B.; Arheimer, B.; Aronica, G.T.; Bilibashi, A.; Bonacci, O.; Borga, M.; et al. Changing Climate Shifts Timing of European Floods. Science 2017, 357, 588–590. [Google Scholar] [CrossRef]
- Kundzewicz, Z.W.; Graczyk, D.; Maurer, T.; Pińskwar, I.; Radziejewski, M.; Svensson, C.; Szwed, M. Trend Detection in River Flow Series: 1. Annual Maximum Flow/Détection de Tendance Dans Des Séries de Débit Fluvial: 1. Débit Maximum Annuel. Hydrol. Sci. J. 2005, 50, 796–810. [Google Scholar] [CrossRef]
- Madsen, H.; Lawrence, D.; Lang, M.; Martinkova, M.; Kjeldsen, T.R. Review of Trend Analysis and Climate Change Projections of Extreme Precipitation and Floods in Europe. J. Hydrol. 2014, 519, 3634–3650. [Google Scholar] [CrossRef]
- Kundzewicz, Z.W.; Pińskwar, I.; Brakenridge, G.R. Changes in River Flood Hazard in Europe: A Review. Hydrol. Res. 2018, 49, 294–302. [Google Scholar] [CrossRef]
- Piniewski, M.; Marcinkowski, P.; Kundzewicz, Z.W. Trend Detection in River Flow Indices in Poland. Acta Geophys. 2018, 66, 347–360. [Google Scholar] [CrossRef]
- Park, E.; Ho, H.L.; Tran, D.D.; Yang, X.; Alcantara, E.; Merino, E.; Son, V.H. Dramatic Decrease of Flood Frequency in the Mekong Delta Due to River-Bed Mining and Dyke Construction. Sci. Total Environ. 2020, 723, 138066. [Google Scholar] [CrossRef]
- Cao, W.; Zhou, Y.; Güneralp, B.; Li, X.; Zhao, K.; Zhang, H. Increasing Global Urban Exposure to Flooding: An Analysis of Long-Term Annual Dynamics. Sci. Total Environ. 2022, 817, 153012. [Google Scholar] [CrossRef] [PubMed]
- Pall, P.; Aina, T.; Stone, D.A.; Stott, P.A.; Nozawa, T.; Hilberts, A.G.J.; Lohmann, D.; Allen, M.R. Anthropogenic Greenhouse Gas Contribution to Flood Risk in England and Wales in Autumn 2000. Nature 2011, 470, 382–385. [Google Scholar] [CrossRef] [PubMed]
- Fowler, H.J.; Wilby, R.L. Detecting Changes in Seasonal Precipitation Extremes Using Regional Climate Model Projections: Implications for Managing Fluvial Flood Risk. Water Resour. Res. 2010, 46, 153012. [Google Scholar] [CrossRef]
- Gudmundsson, L.; Boulange, J.; Do, H.X.; Gosling, S.N.; Grillakis, M.G.; Koutroulis, A.G.; Leonard, M.; Junguo Liu Schmied, H.M.; Papadimitriou, L.; Pokhrel, Y.; et al. Globally observed trends in mean and extreme river flow attributed to climate change. Science 2021, 371, 1159–1162. [Google Scholar] [CrossRef] [PubMed]
- Li, C.; Zwiers, F.; Zhang, X.; Li, G.; Sun, Y.; Wehner, M. Changes in Annual Extremes of Daily Temperature and Precipitation in CMIP6 Models. J. Clim. 2021, 34, 3441–3460. [Google Scholar] [CrossRef]
- Kundzewicz, Z.W.; Krysanova, V.; Dankers, R.; Hirabayashi, Y.; Kanae, S.; Hattermann, F.F.; Huang, S.; Milly, P.C.D.; Stoffel, M.; Driessen, P.P.J.; et al. Differences in Flood Hazard Projections in Europe—Their Causes and Consequences for Decision Making. Hydrol. Sci. J. 2017, 62, 1–14. [Google Scholar] [CrossRef]
- Kundzewicz, Z.W.; Krysanova, V.; Benestad, R.E.; Hov, Ø.; Piniewski, M.; Otto, I.M. Uncertainty in Climate Change Impacts on Water Resources. Environ. Sci. Policy 2018, 79, 1–8. [Google Scholar] [CrossRef]
- Dankers, R.; Kundzewicz, Z.W. Grappling with Uncertainties in Physical Climate Impact Projections of Water Resources. Clim. Chang. 2020, 163, 1379–1397. [Google Scholar] [CrossRef]
- Giuntoli, I.; Vidal, J.-P.; Prudhomme, C.; Hannah, D.M. Future Hydrological Extremes: The Uncertainty from Multiple Global Climate and Global Hydrological Models. Earth Syst. Dyn. 2015, 6, 267–285. [Google Scholar] [CrossRef]
- Krysanova, V.; Donnelly, C.; Gelfan, A.; Gerten, D.; Arheimer, B.; Hattermann, F.; Kundzewicz, Z.W. How the Performance of Hydrological Models Relates to Credibility of Projections under Climate Change. Hydrol. Sci. J. 2018, 63, 696–720. [Google Scholar] [CrossRef]
- Hirabayashi, Y.; Mahendran, R.; Koirala, S.; Konoshima, L.; Yamazaki, D.; Watanabe, S.; Kim, H.; Kanae, S. Global Flood Risk under Climate Change. Nat. Clim. Chang. 2013, 3, 816–821. [Google Scholar] [CrossRef]
- Dankers, R.; Arnell, N.W.; Clark, D.B.; Falloon, P.D.; Fekete, B.M.; Gosling, S.N.; Heinke, J.; Kim, H.; Masaki, Y.; Satoh, Y.; et al. First Look at Changes in Flood Hazard in the Inter-Sectoral Impact Model Intercomparison Project Ensemble. Proc. Natl. Acad. Sci. USA 2014, 111, 3257–3261. [Google Scholar] [CrossRef] [PubMed]
- Paltan, H.; Allen, M.; Haustein, K.; Fuldauer, L.; Dadson, S. Global Implications of 1.5 °C and 2 °C Warmer Worlds on Extreme River Flows. Environ. Res. Lett. 2018, 13, 94003. [Google Scholar] [CrossRef]
- Jiang, T.; Su, B.; Huang, J.; Zhai, J.; Xia, J.; Tao, H.; Wang, Y.; Sun, H.; Luo, Y.; Zhang, L.; et al. Each 0.5 °C of Warming Increases Annual Flood Losses in China by More than US$60 Billion. Bull. Am. Meteorol. Soc. 2020, 101, E1464–E1474. [Google Scholar] [CrossRef]
- Chen, X.; Zhang, H.; Chen, W.; Huang, G. Urbanization and Climate Change Impacts on Future Flood Risk in the Pearl River Delta under Shared Socioeconomic Pathways. Sci. Total Environ. 2021, 762, 143144. [Google Scholar] [CrossRef]
- Hosseinzadehtalaei, P.; Tabari, H.; Willems, P. Satellite-Based Data Driven Quantification of Pluvial Floods over Europe under Future Climatic and Socioeconomic Changes. Sci. Total Environ. 2020, 721, 137688. [Google Scholar] [CrossRef]
- Kundzewicz, Z.W.; Hegger, D.L.T.; Matczak, P.; Driessen, P.P.J. Flood-Risk Reduction: Structural Measures and Diverse Strategies. Proc. Natl. Acad. Sci. USA 2018, 115, 12321–12325. [Google Scholar] [CrossRef] [Green Version]
Figure 1.
Inundated cars in Swarzedz (Poland) on 22 June 2021 illustrate a pluvial flood event, generating major costs and risk to the drivers and passengers. Photo: Zbigniew W. Kundzewicz.
Figure 1.
Inundated cars in Swarzedz (Poland) on 22 June 2021 illustrate a pluvial flood event, generating major costs and risk to the drivers and passengers. Photo: Zbigniew W. Kundzewicz.


Table 1.
The observed changes in heavy precipitation, after IPCC regions. Principal sources: [4,15,16].
| IPCC Region | Summary of Changes [Principal IPCC Source] |
|---|---|
| Africa | In most of Africa, there is insufficient data to assess trends or lack of agreement on evidence of trends. Intensification of heavy precipitation is noted only in two sub-regions: western Southern Africa and eastern Southern Africa ([4], Table 11.5). |
| Asia | Significant intensification of heavy precipitation is reported in most of Asia (in particular, in the following subregions—Western Central Asia, Western Siberia, Eastern Siberia, Russian Far East, East Asia, East-Central Asia, Tibetan Plateau, South Asia, and South-East Asia). In contrast, there is insufficient data or lack of agreement on the change in Russian Arctic and Arabian Peninsula ([4], Table 11.8). |
| Australasia (Australia and New Zealand) | There is limited evidence and low confidence or lack of agreement on evidence of trends in most of Australasia. Only in Northern Australia, intensification of heavy precipitation is reported ([4], Table 11.11). |
| Central and South America | Only in South-Eastern South America intensification of heavy precipitation is recorded. In other sub-regions of Central and South America, there is insufficient data to assess trends ([4], Table 11.14). |
| Europe | In nearly all of Europe, there is a significant increasing trend. Only in the Mediterranean sub-region of Europe, there is lack of agreement on the evidence of trend ([4], Table 11.17). |
| North America | In most of North America, there is a significant increasing trend. Exceptions are: North-central North America where trends are generally not significant and in Western North America, where lack of agreement is reported ([4], Table 11.20). |
Table 2.
The observed changes in high river flow (90th quantile, maximum annual flow), after IPCC regions.
Table 2.
The observed changes in high river flow (90th quantile, maximum annual flow), after IPCC regions.
| IPCC Region | Summary of Changes [Principal Sources] |
|---|---|
| Africa | In the subregion of South Africa, indicators of high river flow increased for 1951–1990, but decreased in 1961–2000 and 1971–2020 [26]. |
| Asia | In the sub-region of North Asia, increasing trend was found for 90th quantile, while decreasing trend for maximum flow in 1951–1990 and 1961–2000 (no sufficient data for 1971–2010 were available). Weak increasing trend was found for East Asia for 1961–2000 and 1971–2010 [26]. |
| Australasia (Australia and New Zealand) | Weak decrease was noted for South Australia and New Zealand in 1961–2000 and strong decrease in 1971–2010 [26]. |
| Central and South America | Complex change of high flows in North-East Brazil was noted: increase for 1951–1980 and decreases in 1961–2000 and 1971–2010 [26]. |
| Europe | The strongest trend in the region was noted in Mediterranean sub-region of Europe—decline in all three examined periods [26]. Otherwise, the signal is weak. Trends strongly depend on start-year and end-year. In North and Central Europe, increases were noted [26]. There is little evidence of changes in flood frequency [27]—the number of statistically significant trends was about equal to the number expected due to chance alone. In autumn and winter, increasing floods were noted in northwestern Europe, while decreasing floods in the south and east of Europe [28]. Warming-driven change patterns were found in observed flood timing [29]. |
| North America | Lack of observed annual maximum trends and lacking evidence if compelling increase of flood hazard was noted [27], with the number of statistically significant trends was about equal to the number expected due to chance alone. For Eastern North America, increase was found for 1951–1990 and 1961–2000, decrease in 1971–2020 [26]. |
Table 3.
The projected changes in heavy precipitation, after IPCC regions. Principal sources [4,39].
| IPCC Region | Summary of Changes [Principal Sources] |
|---|---|
| Africa | For all Africa, projections convey increase in the intensity and frequency of heavy precipitation (50-year return, 1 day and 5 days events) for three global warming levels (1.5 °C, 2 °C, and 4 °C), for which median increase from present are greater than 2%, 6%, and 20%, respectively. Intensification is projected for all regions except for: West Southern Africa (inconsistent changes for 1.5 °C and 2 °C but consistent increase for 4 °C) and Mediterranean sub-region of Africa (inconsistent changes for 1.5 °C warming, but robust increases in intensity and frequency of heavy precipitation for 2 °C and 4 °C) ([4,39], Table 11.5). |
| Asia | Significant intensification of heavy precipitation for all Asia. Increase in the intensity and frequency of heavy precipitation (50-year return, 1 day and 5 days events) is projected for three global warming levels (1.5 °C, 2 °C, and 4 °C), for which median increases from present are greater than 4%, 8%, and 25%, respectively. Robust increase is projected in the intensity and frequency of heavy precipitation in sub-regions ([4,39], Table 11.8). |
| Australasia (Australia and New Zealand) | For all region, increase in the intensity and frequency of heavy precipitation (50-year return, 1 day and 5 days events) for higher two global warming levels (2 °C, and 4 °C), for which median increase from present are greater than 4%, and 10%, respectively. Inconsistent changes are projected for 1.5 °C warming level for the whole continent and for each of sub-regions ([4,39], Table 11.11). |
| Central and South America | For all region, increase in the intensity and frequency of heavy precipitation (50-year return, 1 day and 5 days events) is projected for three global warming levels (1.5 °C, 2 °C, and 4 °C), for which median increases from present are greater than 0%, 4%, and 10%, respectively. Inconsistent changes or conflicting projections for sub-regions. Yet, for 2 °C and 4 °C warming levels, intensification of heavy precipitation is projected, with medium confidence, for such sub-regions as Northern South America, South American Monsoon, North-Eastern South America, South-Eastern South America. Increase in the intensity and frequency of heavy precipitation is projected for Southern South America ([4,39], Table 11.14). |
| Europe | For all region, increase in the intensity and frequency of heavy precipitation (50-year return, 1 day and 5 days events) for three global warming levels (1.5 °C, 2 °C, and 4 °C), for which median increases from present are greater than 0%, 2%, and 8%, respectively. Inconsistent changes are projected for 1.5 °C warming for the Mediterranean sub-region of Europe ([4,39], Table 11.17). |
| North America | For all region, increase in the intensity and frequency of heavy precipitation (50-year return, 1 day and 5 days events) is projected for three global warming levels (1.5 °C, 2 °C, and 4 °C), for which median increases from present are greater than 2%, 6%, and 15%, respectively. Inconsistent changes are projected for Western North America for 1.5 °C warming ([4,39], Table 11.20). |
| IPCC Region | Summary of Changes [Principal Sources] |
|---|---|
| Africa | High river flow is projected to increase in Central African parallel belt in [45], while in [47] increase is projected south of the Sahel, except for parts of the South, with the Orange Basin. |
| Asia | High river flow is projected to increase in most areas of Asia, except for its western part [45]. Historical reference 100-yr floods in China are projected to occur much more frequently under global warming [48]. Increase of frequency of high flow conditions in the north of the region is projected [43]. |
| Australasia (Australia and New Zealand) | High river flow is projected to increase in Northern Australia [45], while in much of Australia in [47]. |
| Central and South America | High river flow is projected to increase in Central and South America, except for Southern South America and North-Eastern South America [45]. |
| Europe | A decrease in flood hazard is projected for most of the European continent [45]. Projections agree on increase of fluvial flood hazard in Western Europe and British Isles. For Eastern, Northern and Southern Europe, decreases dominate [40]. |
| North America | High river flow is projected to increase in the northern part of North America and the east US coast [45] and to decrease in the Colorado Basin [47]. Increase of frequency of high flow conditions in the north of the region [43]. |
Publisher’s Note: MDPI stays neutral with regard to jurisdictional claims in published maps and institutional affiliations. |
© 2022 by the authors. Licensee MDPI, Basel, Switzerland. This article is an open access article distributed under the terms and conditions of the Creative Commons Attribution (CC BY) license (https://creativecommons.org/licenses/by/4.0/).
Share and Cite
MDPI and ACS Style
Kundzewicz, Z.W.; Pińskwar, I. Are Pluvial and Fluvial Floods on the Rise? Water 2022, 14, 2612. https://doi.org/10.3390/w14172612
AMA Style
Kundzewicz ZW, Pińskwar I. Are Pluvial and Fluvial Floods on the Rise? Water. 2022; 14(17):2612. https://doi.org/10.3390/w14172612
Chicago/Turabian StyleKundzewicz, Zbigniew W., and Iwona Pińskwar. 2022. "Are Pluvial and Fluvial Floods on the Rise?" Water 14, no. 17: 2612. https://doi.org/10.3390/w14172612
Note that from the first issue of 2016, this journal uses article numbers instead of page numbers. See further details here.