
Seasonal Variations in Water Quality and Algal Blooming in Hypereutrophic Lake Qilu of Southwestern China


1
Institute for International Rivers and Eco-Security, Yunnan University, Kunming 650504, China
2
Institute for Ecological Research and Pollution Control of Plateau Lakes, School of Ecology and Environmental Science, Yunnan University, Kunming 650504, China
3
School of Geography and Engineering of Land Resources, Yuxi Normal University, Yuxi 653100, China
*
Authors to whom correspondence should be addressed.
Water 2022, 14(17), 2611; https://doi.org/10.3390/w14172611
Submission received: 18 July 2022
/
Revised: 19 August 2022
/
Accepted: 22 August 2022
/
Published: 25 August 2022
(This article belongs to the Special Issue Plateau Lake Water Quality and Eutrophication: Status and Challenges)
Abstract
:Understanding the spatiotemporal distributions and variation characteristics of water quality parameters is crucial for ecosystem restoration and management of lakes, in particular, Lake Qilu (QL), a typical plateau shallow lake on the Yunnan-Guizhou Plateau, southwestern China. To identify the main causes of harmful algal blooming and continuous water quality decline, the total phosphorus (TP), total nitrogen (TN), water temperature (WT), dissolved oxygen (DO), chlorophyll-a (Chl-a), pH, and turbidity in hypereutrophic Lake Qilu from January 2017 to December 2021 were analyzed. The results showed a complex pattern in spatiotemporal distribution and variation. WT showed no significant change in the vertical profile. DO and pH value variations were caused by both physical and biochemical processes, especially at the bottom of Lake QL with an anaerobic environment. The Trophic State Index (TSI) assessment results showed that Lake QL is a eutrophic (70.14% of all samples, 50 < TSI < 70) to a hypereutrophic lake (29.86%, 70 < TSI) with poor water quality (WQI < 25). TP and WT were the main factors controlling harmful algal blooms (HABs) based on the statistical analysis of Principal Component Analysis (PCA), Random Forest Model (RFM), and Correlation Analysis (CA). In lake QL, TP loading reduction and water level increase might be the key strategies for treating HABs in the future. Based on our results, reducing TP loading may be more effective than reducing TN to prevent HABs in the highly eutrophicated Lake Qilu.
Keywords:
Lake Qilu; seasonal variation; water temperature; dissolved oxygen; chlorophyll-a; pH; turbidity1. Introduction
Global eutrophication and harmful algal blooms (HABs) in water bodies, for instance, rivers, lakes, ponds, streams, etc., are expected to intensify with climate change and anthropogenic pressure [1,2,3] and may seriously affect our living environments and standard [4,5]. Lakes are an important natural and strategic water resource, and play a critical role in the integrated processes of social and economic development [6]. Lakes are affected by changes in the atmosphere, lithosphere, biosphere, and terrestrial hydrosphere, as they are sensitive to variations in natural processes. Thus, it is important to study climate, environmental and biological changes, and evolution [7]. However, over the last decades, human activities have led to nutrient over-enrichment, especially in nitrogen (N) and phosphorus (P), due to urban, agricultural, and industrial expansion, accelerating the rates of primary production or eutrophication [1,8,9]. Many lake and reservoir ecosystems have been degraded, with their ecological functions being, or have been lost, which not only endangers the healthy development of lake and reservoir ecosystems but also seriously threatens the productivity and lives of people near these lake basins [10].
Both the natural environment and human activities have affected the physical and chemical parameters of lakes. The effects of anthropogenic activities on lake water quality could exceed those of the natural environment, which not only accelerates the evolutional processes of lakes but also disbalances the ecosystem, leading to water pollution and eutrophication [4,11]. HABs are the most serious results that originated from the above effects [9].
Nutrients influence algal biomass and community structure [12,13,14]. An aquatic ecosystem heavily loaded with nutrients can display N limitation, P limitation, and co-limitation the limiting nutrient could change both seasonally and spatially [15]. Dodds et al., [12] found that N limitation (13%), P limitation (18%), and N + P limitation (44%) occur based on the data from 158 limitation bioassays. The limitation of nutrients on phytoplankton is mainly the concentration and relative ratio of nutrients, but there are still controversies in lakes with different nutrient levels [14,16,17,18]. Besides, water temperature (WT) is often considered one of the most important determinants of growth and metabolism in freshwater algae without nutrient limitations [19,20]. However, previous studies have found that the density of HABs (e.g., P. agardhii) does not have a linear relationship with WT [21]. In other words, the reproduction of HABs may not be in the summer with the highest temperature [20,21]. In the background of global warming, the frequency and duration of HABs are expected to increase in eutrophic ecosystems [1,19]. Algal blooms also significantly alter the physicochemical properties of water (non-stabilized pH changes, organic matter enrichment, dissolved oxygen (DO) depletion/super-saturation), which can deteriorate the ecosystem [22]. Moreover, the mass development of HABs increases turbidity and restricts light diffusion in affected ecosystems. HABs also cause oxygen depletion by respiration and bacterial decomposition of dense blooms, which can result in the death and loss of aquatic animals and hydrophytes [23,24].
In recent years, more and more attention has been paid to performing research on lakes in the Yunnan-Guizhou Plateau [13,25,26]. Lake Qilu (QL) is one of nine major lakes in the Yunnan province, southwestern China, and its water quality has reached hypereutrophic levels, classified in the inferior Grade V standard (GB3838-2002). In the past decades, research on lake QL focused mainly on eutrophication, pollution characteristics, sedimentation, and watershed land-use changes [13,25,26,27], and less often on water quality. Based on the relation between HABs proliferation and eutrophication, the water quality parameter changes should be investigated [1,2,28], especially determining whether algal blooms are limited by N or P, or both N and P [16,17,29]. The interactions between water quality parameters (e.g., DO, pH value, and turbidity) and HABs are complex. Real-time monitoring of a lake’s water quality could enhance our understanding of the health status of its ecosystem and allow correct assessment of the ecological condition of the lake [6,30].
Lake QL is not only the center of surface runoff of water collection in a basin but also the sink of many kinds of pollutants. As a result of anthropogenic activities, the water quality of Lake QL has been continuously declining for the past three decades [31]. The eutrophic conditions of the lake have been dominated by cyanobacteria species in dry and rainy seasons [13]. HABs with high Chl-a concentrations are the primary environmental problem at the moment, but the most important water quality parameters influencing HABs remain unclear. Therefore, the objectives of this study were to (1) understand the spatiotemporal distribution characteristics of each water quality parameter; (2) assess the water quality and the nutrition level of Lake QL, and; (3) identify the major factors controlling HABs and provide targeted advice to control the pollution in lake QL. This not only contributes to the timely implementation of remedial actions but also provides a theoretical basis for understanding the changing trends in hypertrophsic lakes under the joint influence of natural and human activities.
2. Sampling and Methods
2.1. Overview of the Study Area
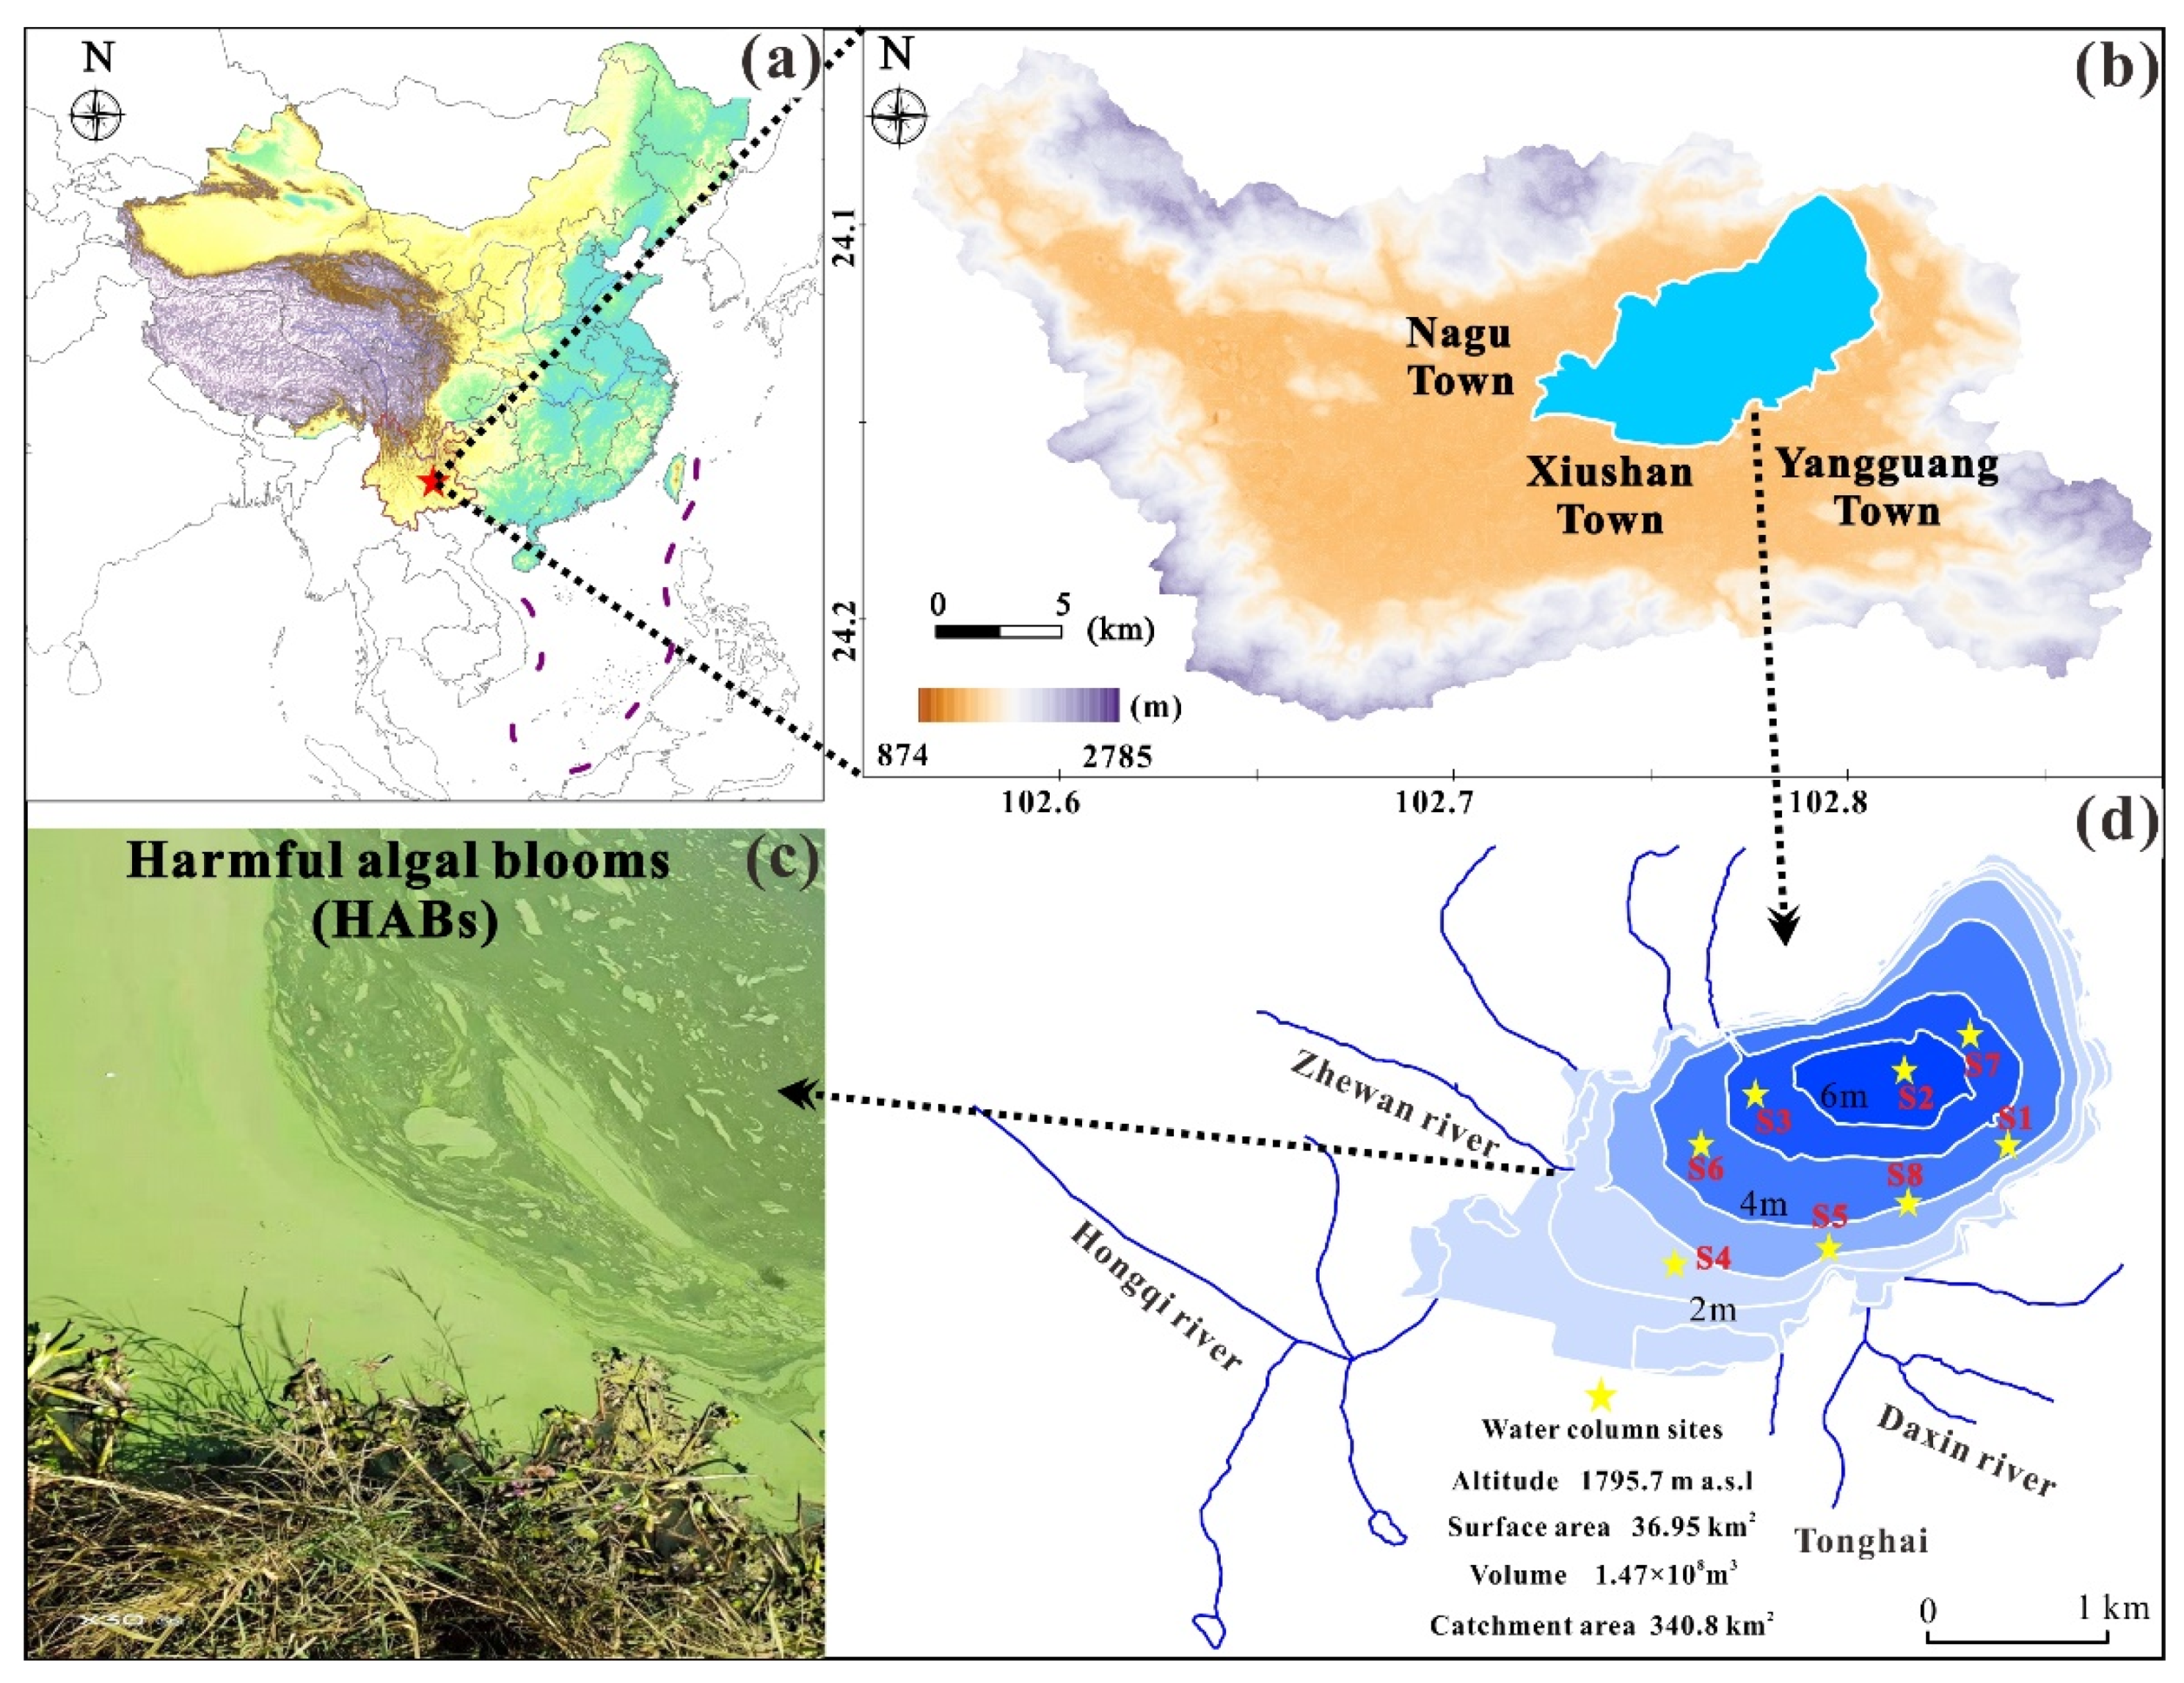
Lake QL (24°4′36″ N–24°14′21″ N, 102°33′48″ E–102°52′36″ E; 1795.7 m a.s.l.) is located in Tonghai County, Yuxi City, Yunnan Province, southwestern China. It is bordered to the north by Jiangchuan county, to the west by the Yuxi River (the upper reach of the Qujiang River), and to the east by the Longdong River, which is part of the Nanpanjiang river system. Lake QL has a rectangular outline oriented northeast to southwest. The lake’s surface area is 36.95 km2 when the surface water level is located at an altitude of 1795.7 m a.s.l. Its length from east to west is 10.4 km, with an average width from north to south of about 3.5 km [13]. The maximum water depth is 6.84 m, and the lake capacity is 1.47 × 10⁸ km3 (Figure 1). In recent decades (e.g., 1958, 1983, 2012, etc.), Lake QL has experienced many episodes of reduced area and falling water levels. Due to the anthropogenic discharge of water and expanding farmland, the area of Lake QL has dropped sharply from 33.53 km2 in February 2012 to 21.8 km2 in April 2013, and 23 km2 in 2015 [13].
The lake area, located in southwestern China (Figure 1a), is characterized by a subtropical monsoon climate, with an average annual precipitation of 881.0 mm and an annual average temperature of 15.6 °C. Lake QL is a closed shallow plateau lake with no obvious outlet and is discharged only through natural karst caves. Water input is derived mainly from rainfall and runoff. More than a dozen seasonal watercourses enter the lake, such as the Hongqi, Daxin, and Zhewan rivers. Lake QL is an important water resource for the city (Figure 1c). The basin of lake QL is the focus of social and economic development for the county and the basis for its survival and development. In Tonghai city, lake QL is colloquially referred to as the “Mother Lake” because it has various functions, including industrial and agricultural water usage, regulation and storage, flood control, shipping, tourism, aquaculture, etc. [31].
2.2. Measurements and Sampling
Based on the shape and hydrological condition of the lake, sampling points were set up at the center of the lake (S6), estuarine (S3, S4, S5), the deepest point (S2), and the area of the shore where there was no obvious freshwater input (S8, S1, S7). Sampling sites were marked using the Magellan GPS2000XL satellite-based global positioning system (Figure 1c). To determine the seasonal variation and spatial distribution of water quality, the lake was monitored and sampled for a complete year (from Jan. 2017 to Dec. 2017), after which the sampling time was randomly selected to understand the dynamic changes in water quality (Jan., Mar., Jun., Jul., and Aug. in 2018, while Apr., May, and Aug. in 2020, May., and Dec. in 2021). A complete year of data was used to identify seasonal variation characteristics, and other random sampling data were used to understand the lake’s water quality dynamics. Through 22 times of monitoring and sampling at 8 points, we obtained approximately 880 datasets (nutrients to environmental factors). To investigate the water quality parameter seasonal variation pattern at different depths and times, we averaged the data at 8 points using intervals of two meters. A multi-parameter water quality monitor (YSI 6600V2) was used to measure water temperature, Chl-a, DO, pH value, turbidity, and other water quality parameters at an interval of one meter. It was reported that it could be ideal to monitor industrial sewage, sewage discharge estuaries, rivers, lakes, swamps, estuaries, coasts, and potable water [7]. The instrument was cross-calibrated before each test to ensure data reliability and accuracy. Water columns were collected at intervals of one meter at each site. The Tonghai County Meteorological Bureau provided the lake’s meteorological data (air temperature and precipitation).
The total nitrogen (TN) and total phosphorus (TP) were measured by a UV-spectrophotometer (UV-2600). TN was determined using an alkaline potassium persulfate digestion-UV spectrophotometric method (GB11894-89) at wavelengths of 220 nm and 275 nm, and the ammonium molybdate spectrophotometric method (GB11893-89) at wavelengths of 700 nm for TP, established by the State Environmental Protection Administration of China (SEPAC) [29,32,33]. Program blank and standard samples were used in the test and analysis process to ensure the analysis’s accuracy. All glassware and plastic containers were soaked in HNO3 for 24 h before use and thoroughly washed with deionized water.
2.3. Water Quality and Trophic State Assessment
To access the water quality of Lake QL, the National Sanitation Foundation Water Quality Index (NSFWQI) was performed [34,35]. The NSFWQI was calculated using the following equation:
Here, Qi and Wi represent the sub-index and weight of water quality parameters, while n refers to the number of water quality parameters. Based on recent work [35,36], the weights of six water quality parameters (0.21 for WT, 0.17 for pH, 0.17 for turbidity, 0.21 for DO, 0.13 for TP, and 0.13 for TN) were calculated. The NSFWQI classification of the water quality is shown in Table 1.
To access the trophic state of Lake QL, the Trophic State Index (TSI) is calculated independently from Secchi disk depth (SD), chlorophyll a (Chl-a), and total phosphorus concentration (TP) using the following equations (Equations (2)–(5) and separated water parameter concentrations [37].
Here, Chl-a represents chlorophyll-a concentration (μg/L), TP represents the total phosphorus concentration (μg/L), and SD represents the Secchi disk depth (meter). The TSI classification of the trophic state is shown in Table 1.
2.4. Statistical Procedures
Statistical analyses of chemical analytical data were performed using the IBM SPSS 24.0 and 2019 Microsoft Excel software [13]. CorelDraw X8 (Corel, Ottawa, ON, Canada) was used to generate the map of sampling locations. Ordinary Kriging interpolations of water parameters were computed in Surfer 16 at a 99% confidence interval. Correlation analysis (CA) was conducted using the spearman method in OriginPro 2021 to detect the relationships between the Chl-a and each water quality parameter (pH, DO, TP, TN, etc.). The dimension reduction of the dataset was determined using Principal Component Analysis (PCA) by the “factoextra” and “FactoMineR” packages in R. Random Forest Model (RFM) was performed using the “randomForest” package to select the important factors affecting HABs (https://www.r-project.org/ (accessed on 15 July 2022)).
3. Results and Discussions
3.1. Water Temperature Changes
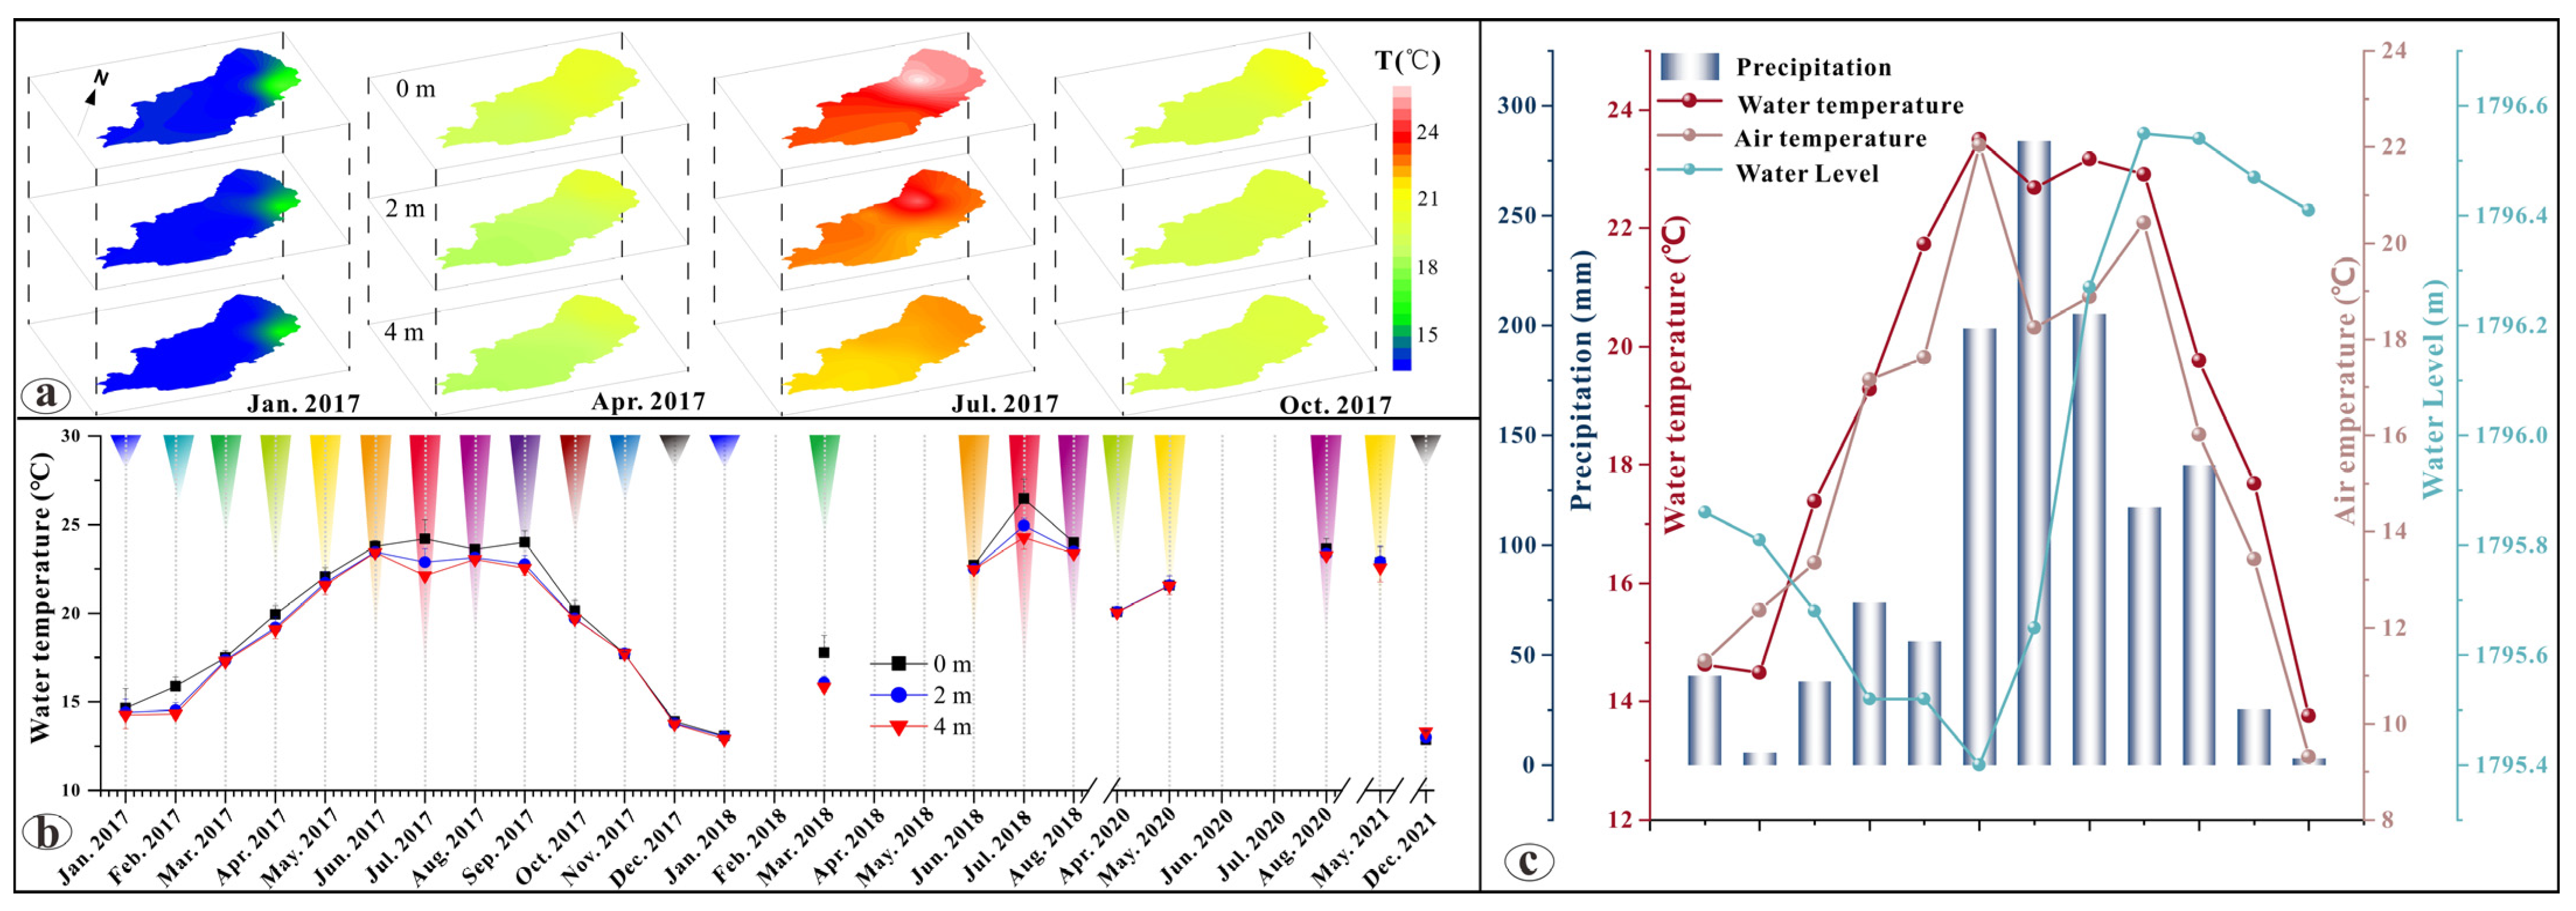
From January 2017 to May 2021, water temperature (WT) was inherently synchronized with seasonal change at each monitoring point (Figure 2b). The results showed that the WT of lake QL ranged from 13.45 °C to 26 °C during the whole monitoring period. Spatially, WT decreased gradually from the lake’s surface to its bottom, especially during the summer. The average water temperature at 8 sample sites at 0 m, 2 m, and 4 m was 24.2 °C, 22.9 °C, and 22.1 °C, respectively. Seasonally, WT in the northern part of the lake was higher than in the south in January. WT in the center of the lake was higher than in other parts of the water body in July (Figure 2a). Due to the shallow depth of the lake, WT showed no significant changes in its vertical profile. Overall, these results revealed that water column exchange was weaker in summer than in other seasons. WT stratification occurred in many deep-water lakes and reservoirs and generally showed a stable thermocline in spring, and the thermocline thickness and temperature gradient increased continuously under the influence of water thermal conditions, transparency, light, and lake shape [39]. The seasonal variations of air temperature and characteristics of the lake basin were stratified according to seasons [28]. Water quality parameters such as DO, pH, Chl-a, and turbidity were affected by temperature stratification and also changed in vertical distribution.
Changes in WT were consistent with those of air temperature and precipitation (Figure 2c). It shows that during the monitoring period, WT changed synchronously with air temperature, with no apparent lag effect, and that WT was slightly higher than air temperature (except in February and April). The Tonghai county meteorological station was approximately 150 m higher than the current lake surface. The warming of the basin and the difference in altitude were the main reasons why the WT of Lake QL was higher than that recorded at the Tonghai meteorological station. Another possible reason is that the water temperature was measured during the day and the air temperature was the average value for the whole day. Precipitation was concentrated between June and October of each year. Simultaneously, precipitation resulted in a lower water level in June and a higher one in September.
Lake QL is a representative shallow lake on the Yunnan-Guizhou Plateau. WT in the lake exhibited strong seasonal variability. Figure 2a shows the absence of thermocline at lake QL, which differed significantly from other deep-water bodies such as Lakes Fuxian [39] and Yangzong [40]. Increasing air temperatures in May of 2017 resulted in rising WT (Figure 2b) due to thermal energy exchange between surface water and air, causing the surface WT to be higher than those at the bottom of the lake. Furthermore, this condition caused decreasing water density in surface water and hindered caloric exchange with bottom water, especially in summer. In winter, due to the disappearance of the thermocline and shallow lake characteristics, the exchange capacity of the water body was enhanced, with the surface and bottom water exhibiting the same properties. Since there was no temperature stratification phenomenon in the lake water, the heat transformation was relatively rapid, making WT sensitive to temperature changes but without any lag (Figure 2c), which differs from the changing characteristics of deep-water lakes and reservoirs on the Yunnan-Guizhou Plateau [40]. As a heat reservoir, lake QL plays a vital role in regulating the basin’s climate and maintaining salubrious temperatures in the surrounding area. WT is often considered one of the most important determinants of growth and metabolism in freshwater algae without nutrient limitations [1]. The effects of WT on eutrophication and HABs are discussed in Section 3.7.
3.2. Dissolved Oxygen (DO) Characteristics and Variability
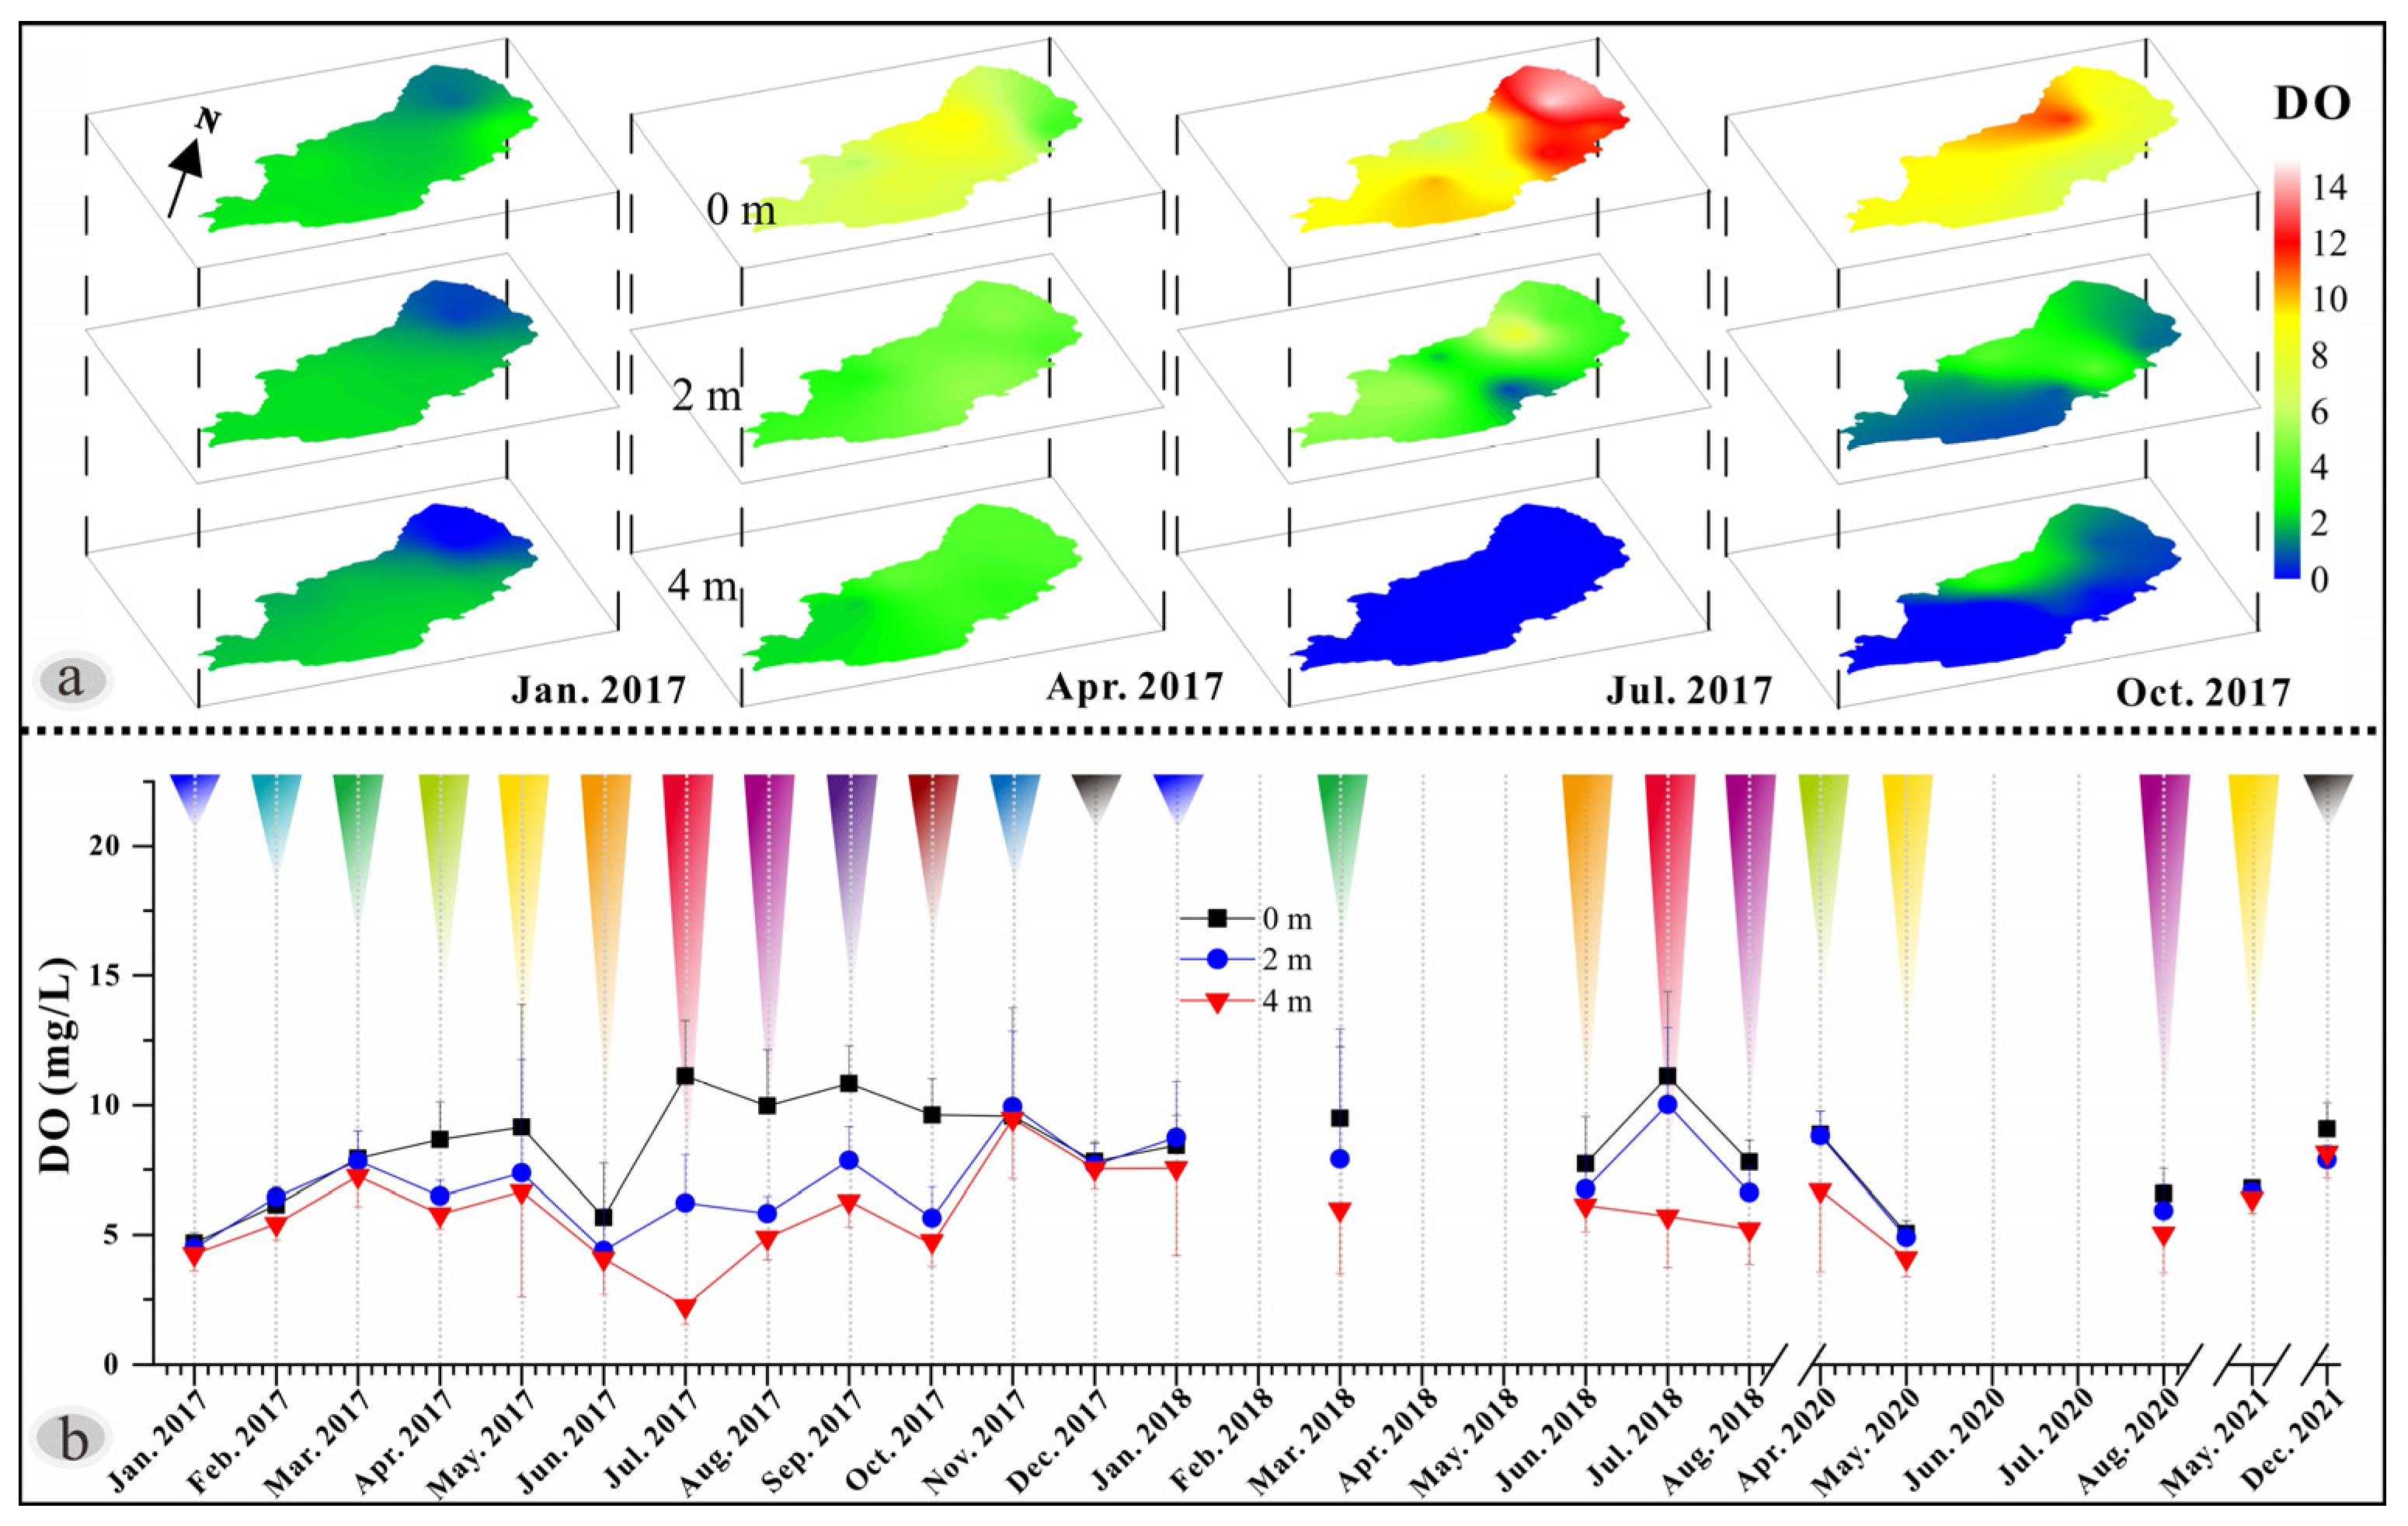
Dissolved oxygen (DO) concentration is essential in defining water health status in aquatic ecosystems and certainly affects the well-being of zooplankton. Our results indicated that the DO concentration in lake QL ranged from 0.67 to 14.96 mg/L during the monitoring time. Figure 3a shows that the DO concentration of the lake’s water decreased from the surface to the bottom in all seasons in terms of vertical variation. The DO concentration at the bottom of the water was significantly lower than at the surface from July to October (Figure 3b), and the lowest DO concentration was 0.67 mg/L in July, showing a relatively anaerobic environment at the bottom of the lake. Spatially, the DO concentration showed strong heterogeneity at the different lakeshores (Figure 3a). DO concentration was controlled by physical and biochemical processes (i.e., wind and wave disturbance, shipping, and other factors). These results were related to the lake’s seasonal and annual changes in DO concentration. Fluctuations in DO concentration could also be caused by planktonic photosynthesis and the respiration of microorganisms. Notably, because of the shallow water depth (~1 m) and abundant nutrients, a large number of aquatic plants (dominant by Potamogeton pectinatus, a pollution-tolerant species, and Phragmites communis, etc.) lived in the western part of lake QL [41], resulting in a relatively lower DO concentration. In summer, because of microorganism respiration, the DO concentration at the bottom water approached anaerobic levels (Figure 3). Thus, based on these results, more attention should be paid to the reductive dissolution of heavy metals and P, which causes water pollution under anoxic conditions [42,43,44].
3.3. Variations in Water Turbidity
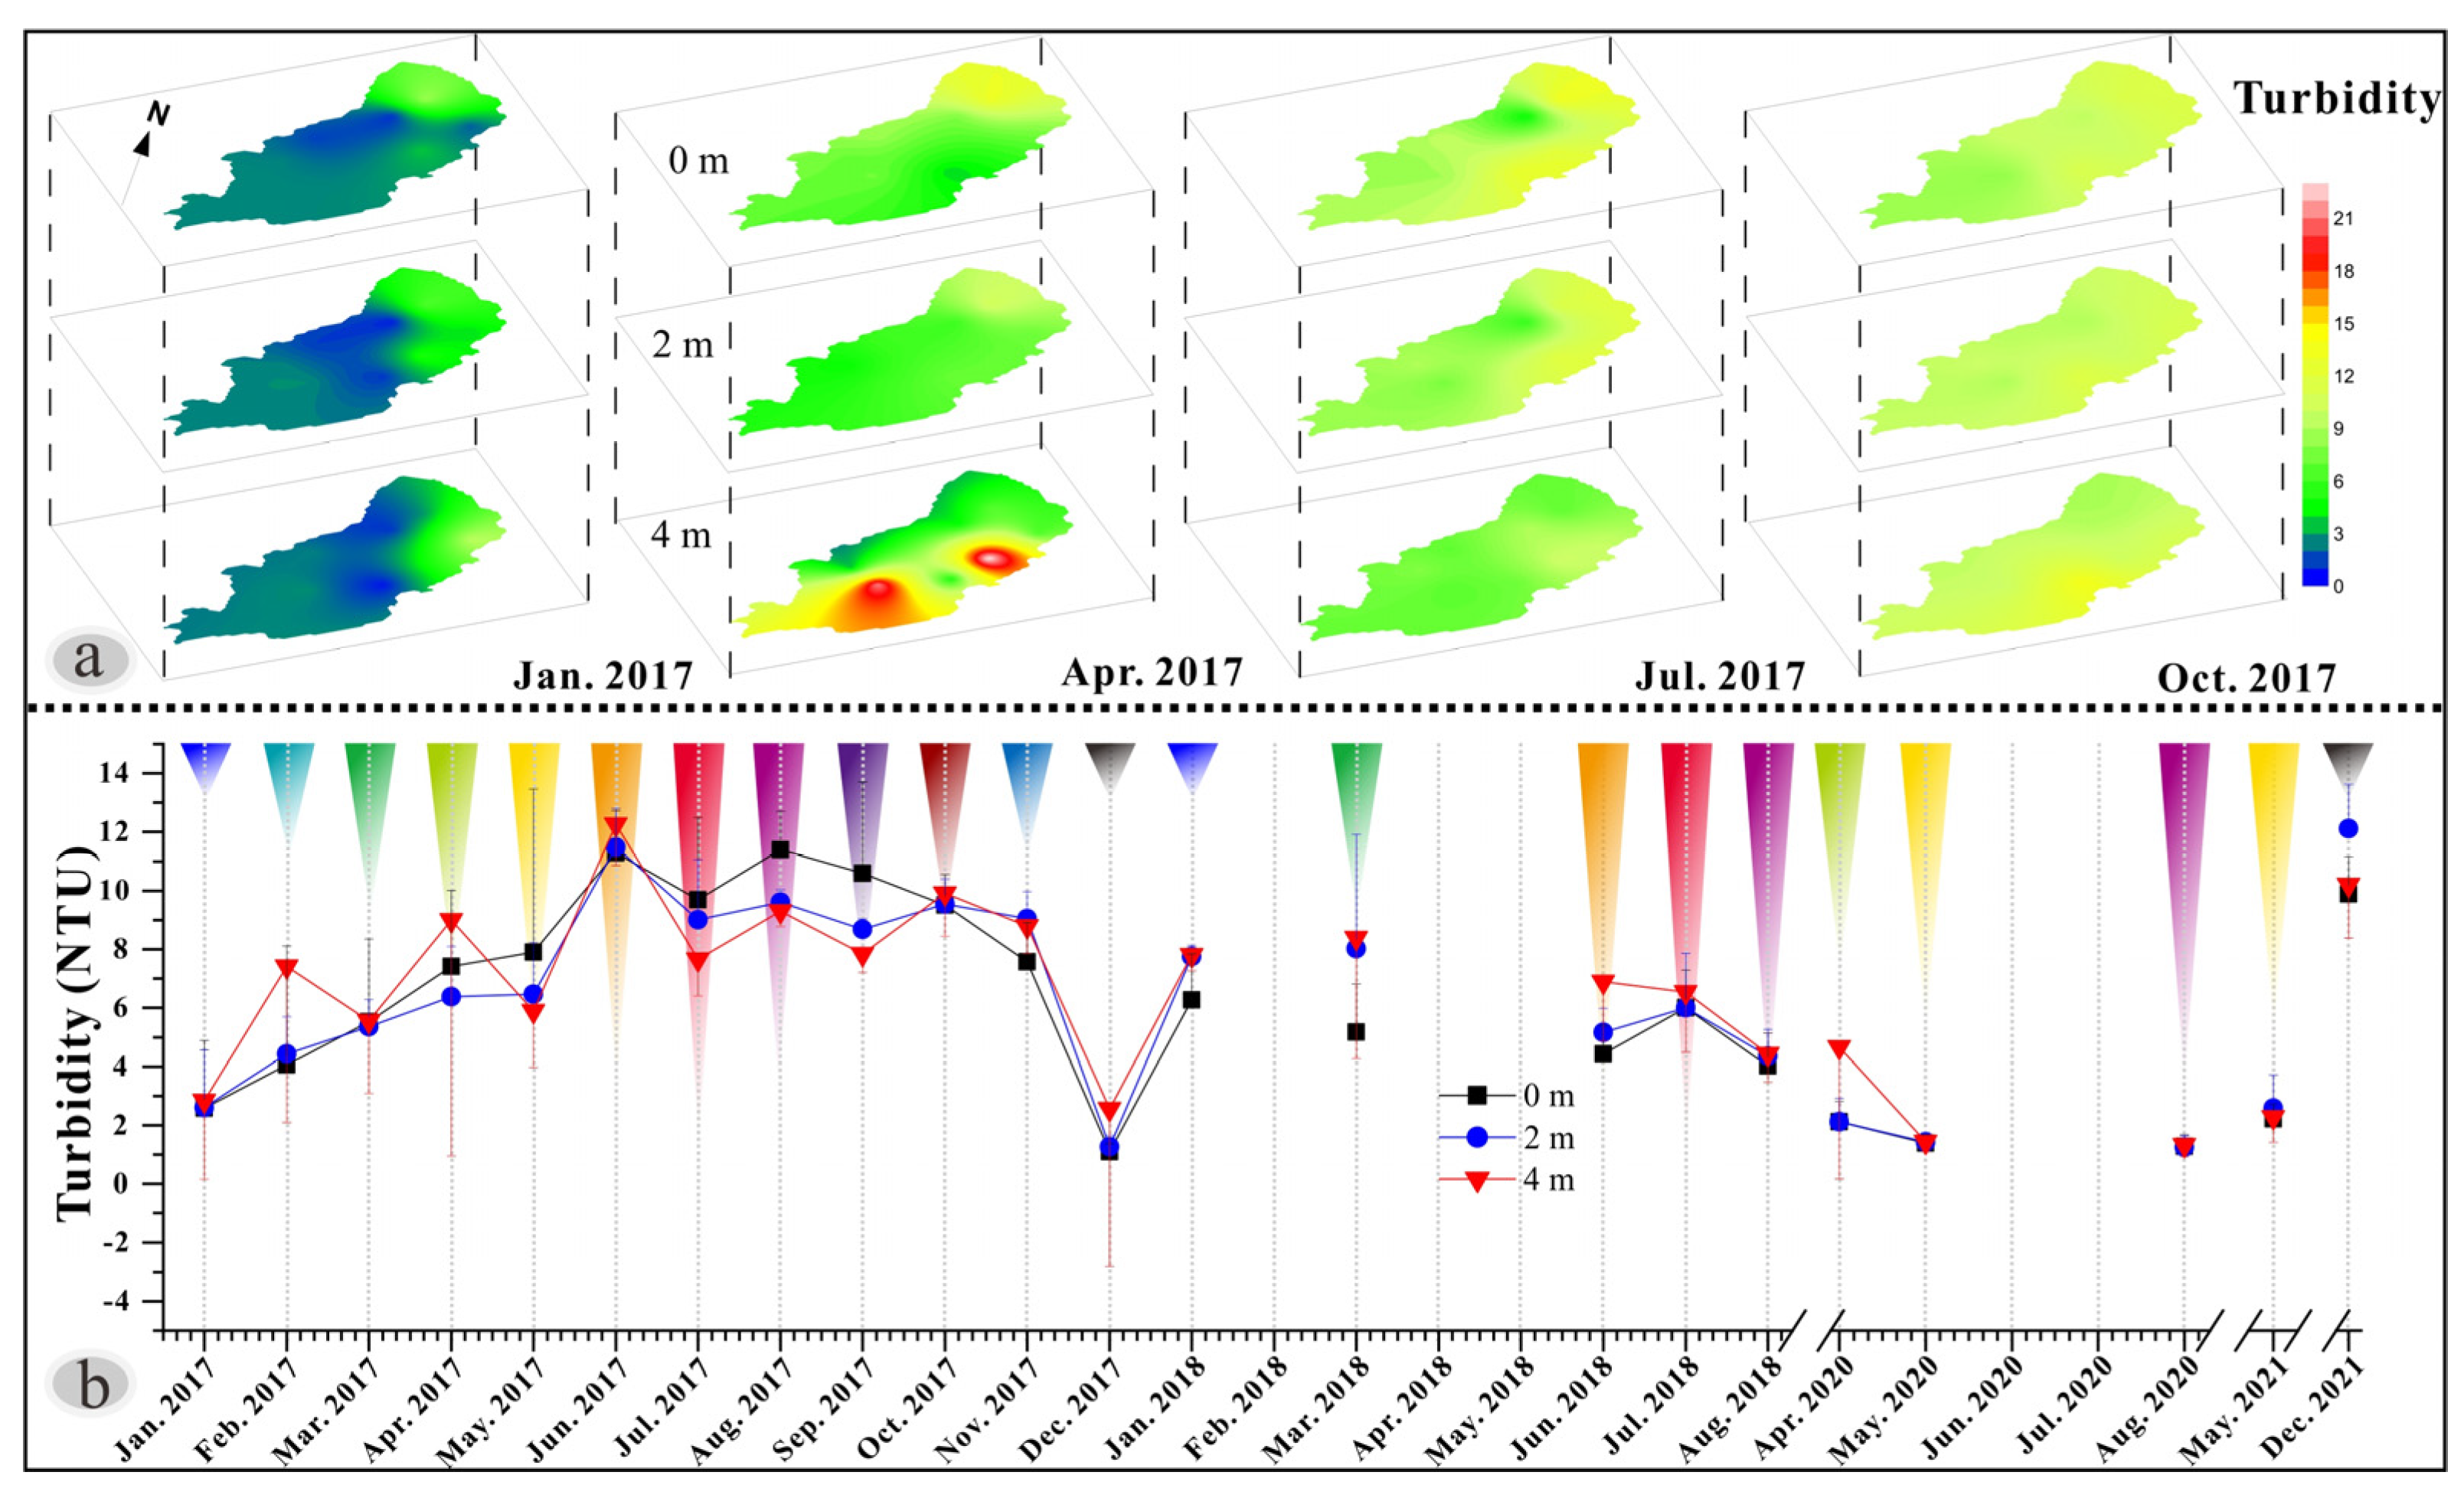
Turbidity describes the degree to which suspended matter blocks light passing through water and is expressed in terms of the mean number of particles [26]. Our monitoring data revealed that the turbidity of Lake QL ranged from 0.32 to 22.9 NTU, changed seasonally, increased from January to June, and decreased from June to December 2017, with the highest values observed in June (Figure 4). With increasing depth, turbidity also increased, and the highest turbidity levels were measured at a depth of 4 m in April. From the spatial perspective, turbidity on the eastern lakeshore was consistently greater than on the western shore, indicating that the dense HABs may have been caused due to a decline in turbidity [6]. Another important factor controlling turbidity is sediment suspension due to disturbance, shipping, and other factors, resulting in a high turbidity value at the bottom of April 2017.
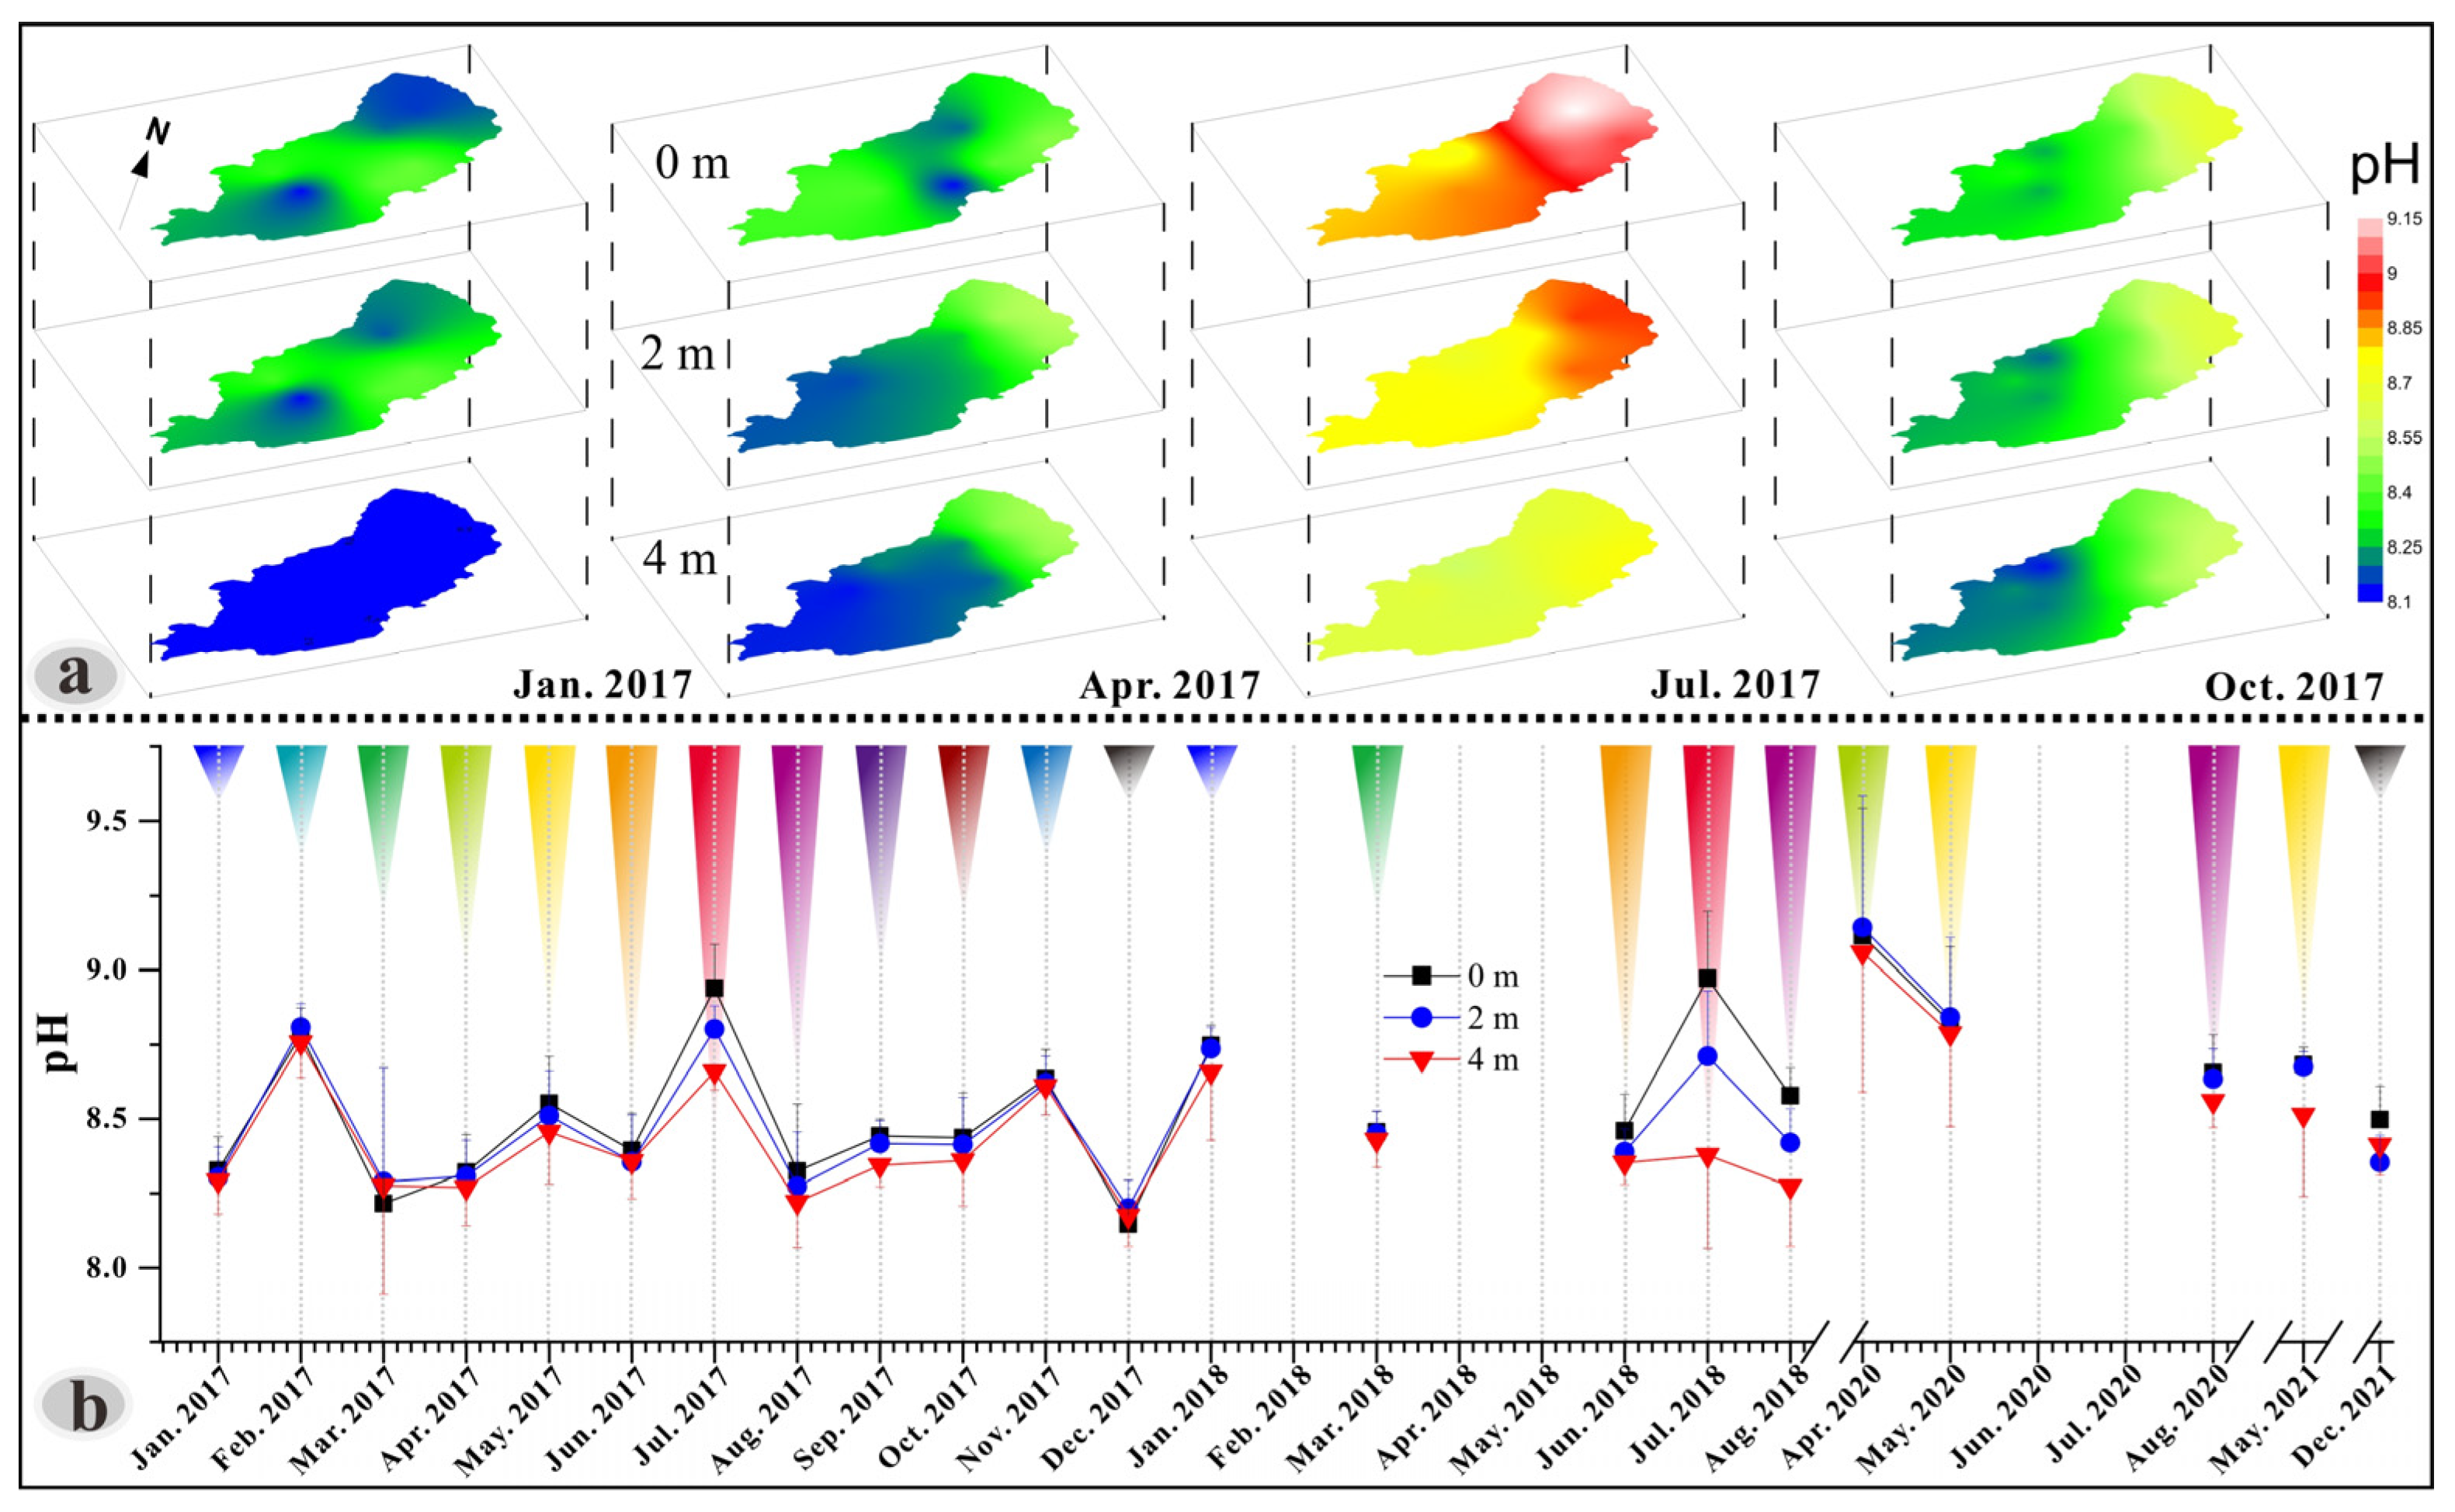
3.4. pH Characteristics and Variability
pH value has an important impact on controlling the P cycle sediment and eutrophication [17,45]. H+, CO32−, and HCO3− ions in water have a dominant influence on pH value. Our monitoring data showed that the pH of lake QL ranged from 7.45 to 9.15 and changed seasonally. The pH values from the lake surface to the bottom decreased on a seasonal basis, and the values were relatively high on the eastern lakeshore (Figure 5). Vertically, the pH value of the surface was significantly higher than the lake bottom from July to October.
The pH of Lake QL changed because of phytoplankton photosynthesis and the exchange of carbon dioxide (CO2) in the air. Liu et al., [46] reported that HCO3− significantly increased algal growth compared with CO32− when the pH values ranged from 8.0 to 9.5. Lake QL is a typical naturally alkaline lake with pH values ranging from 8.14 to 9.15 (Figure 5), similar to most natural lakes and reservoirs on the Yunnan-Guizhou Plateau [40]. pH value decreased with water depth in lake QL (Figure 5a), possibly due to the decomposition of microorganisms at the sediment-water interface producing large quantities of acidic substances (e.g., H2S), which were easily detected from July to October 2017 (Figure 5b). In addition, with the increase of WT, the dissolution rate of CO2 decreased, leading to an increase in pH in the water column. A high pH value was observed during summer (Figure 5a). pH is an important factor regulating P cycle sediment and lake eutrophication. Thus, an increase in pH reduced the P absorption capacity of ferric iron (oxy)hydroxides, thereby increasing the potential for sediment P release [47].
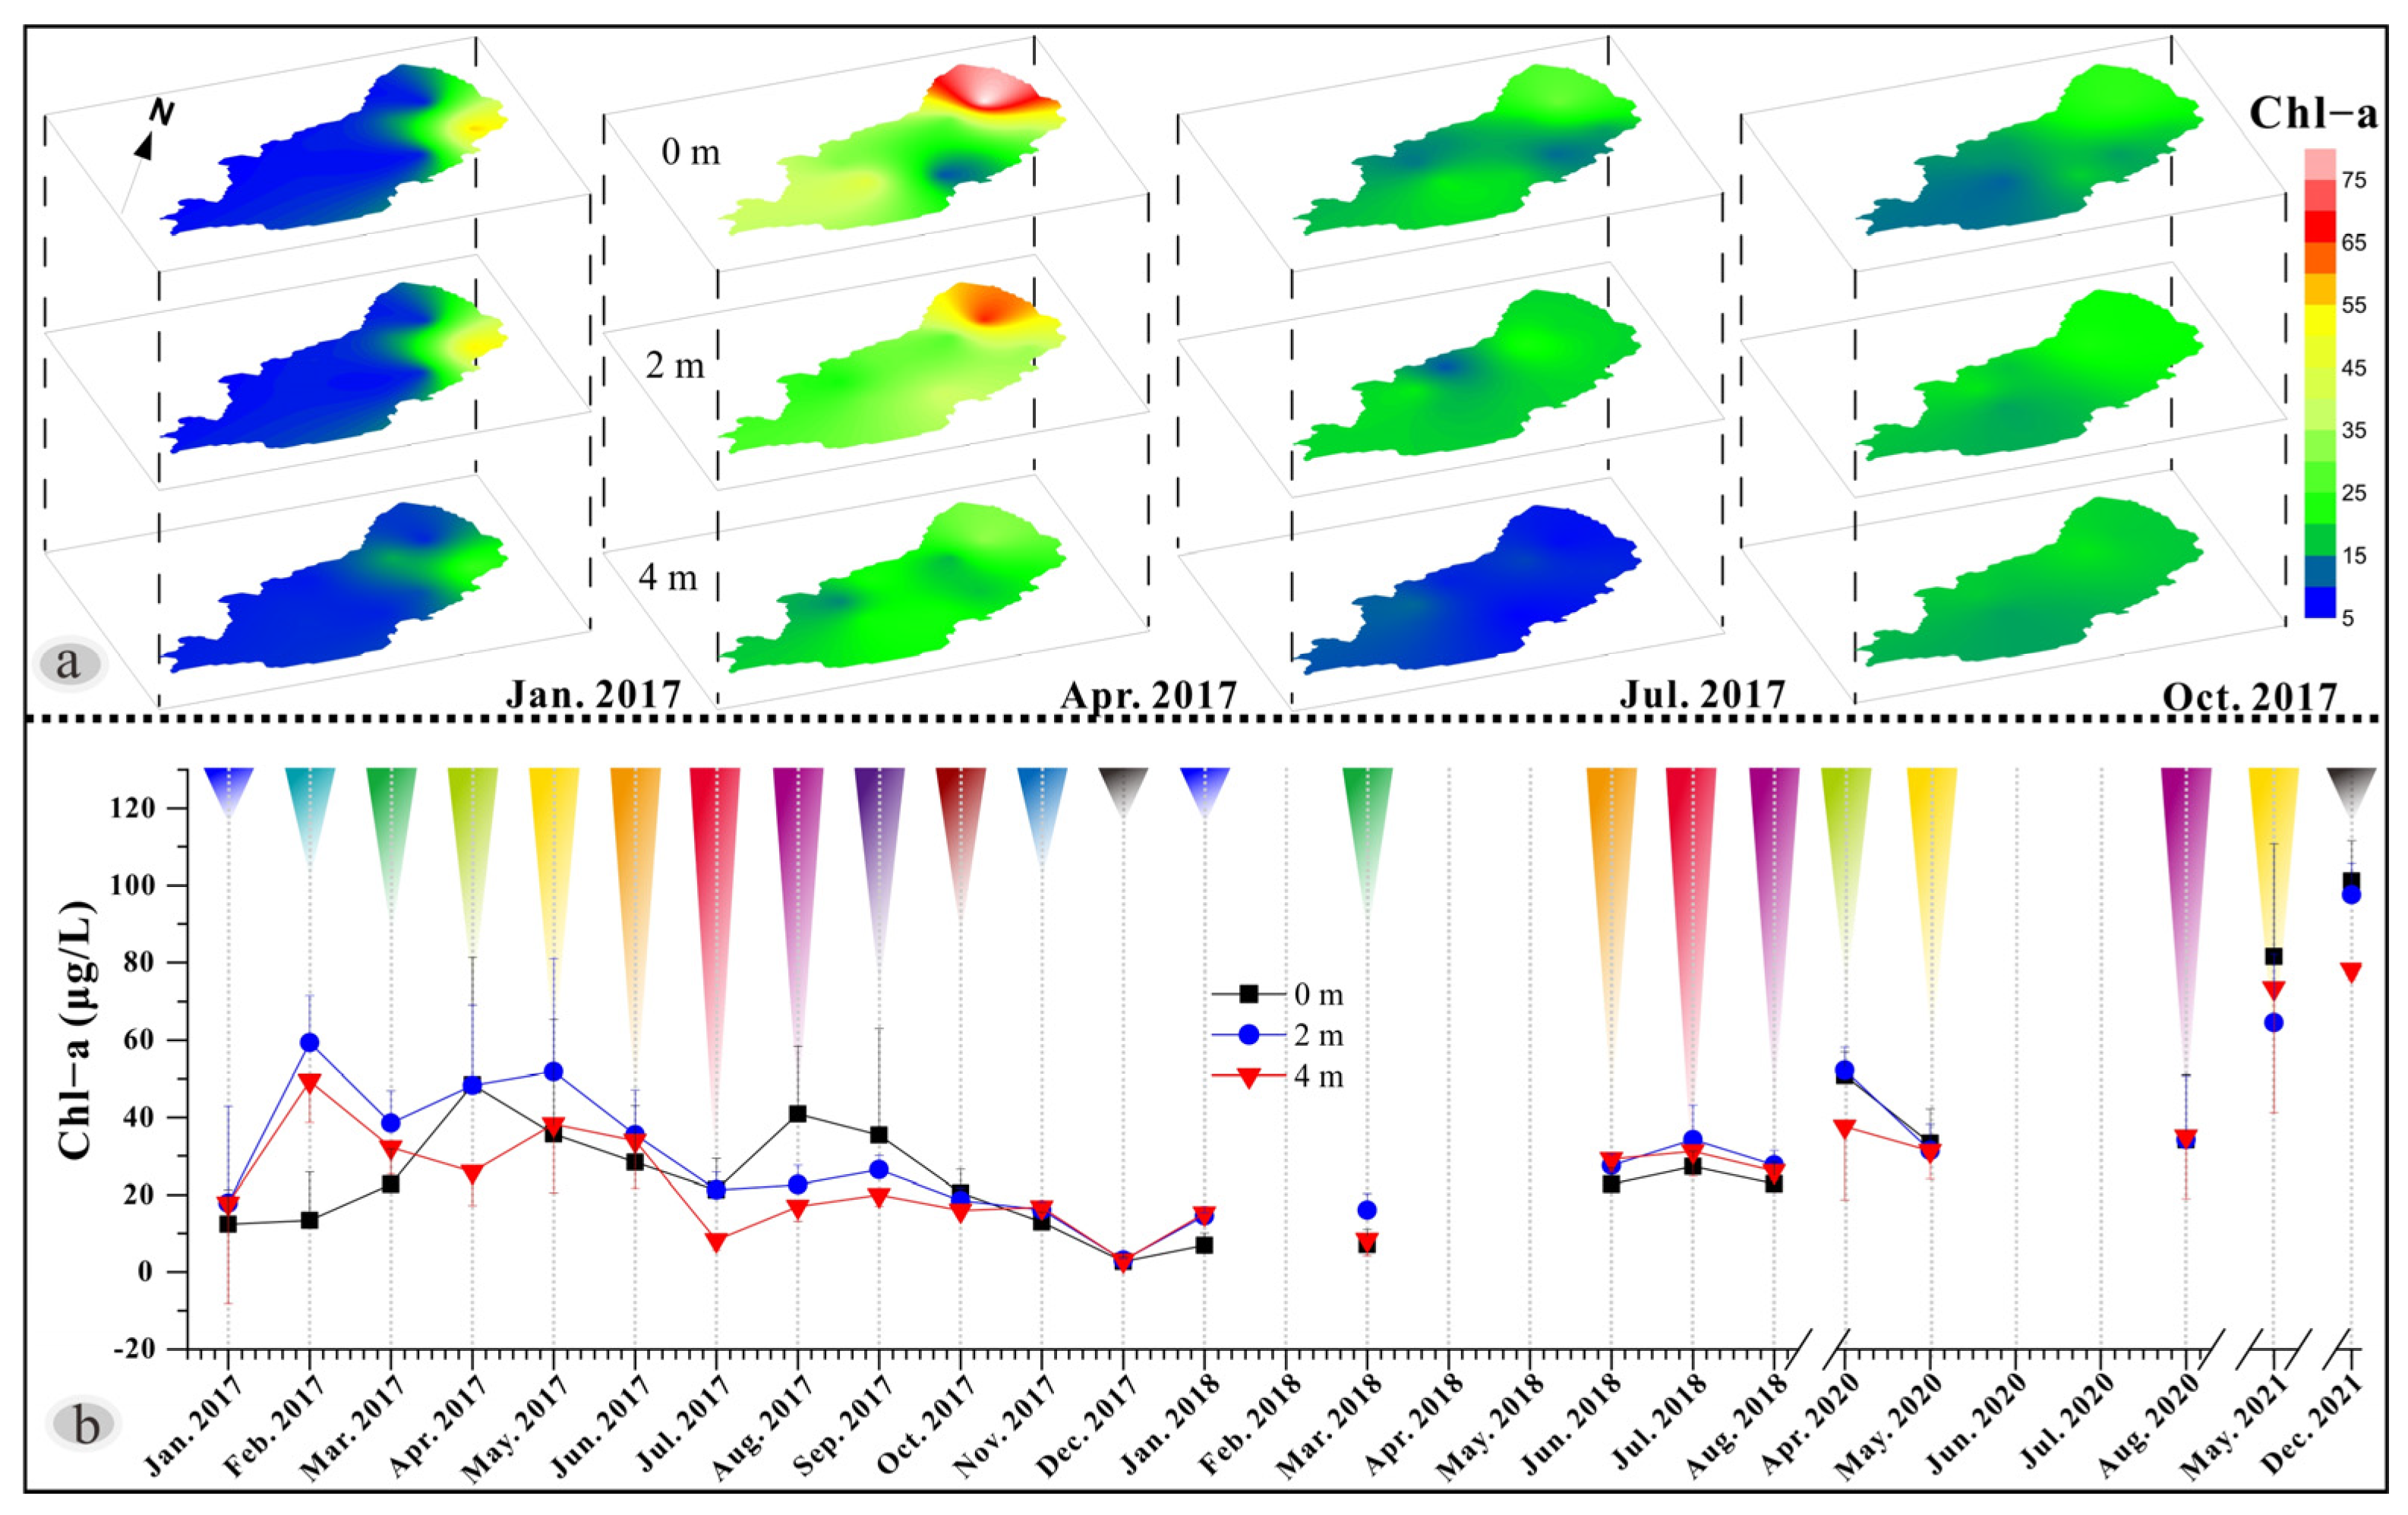
3.5. Chlorophyll-a (Chl-a) Characteristics and Variability
Chlorophyll-a (Chl-a) is an essential component of phytoplankton organisms and a valuable index for evaluating phytoplankton biomass and standing stock. Our monitoring results showed that the concentration of Chl-a in Lake QL ranged from 1.7 μg/L to 119.9 μg/L. Based on the assessment of maximum Chl-a concentration (75 μg/L), the trophic status of Lake QL was classified as hypereutrophic (Table 1). Simultaneously, the Chl-a changes differently at various water depths (Figure 6a), its concentration increased continuously from 2017 to 2021, indicating a constantly decreasing water quality (Figure 6b).
From the perspective of spatial distribution, we observed a significant variation in seasonal Chl-a concentration, which was significantly higher on the eastern lakeshore than that of the west from January to April, corresponding to dense HABs in the west. In terms of vertical distribution, the Chl-a concentration at the bottom was significantly lower than that of the surface from July to October, indicating that relatively dense HABs appeared on the surface rather than at the bottom (Figure 6a). From the perspective of annual change, we observed that the concentration of Chl-a was higher than in other months from February 2017 to May 2017. The time of HABs was inconsistent with other eutrophic lakes (e.g., Lake Taihu [43] and Lake Dianchi [48]).
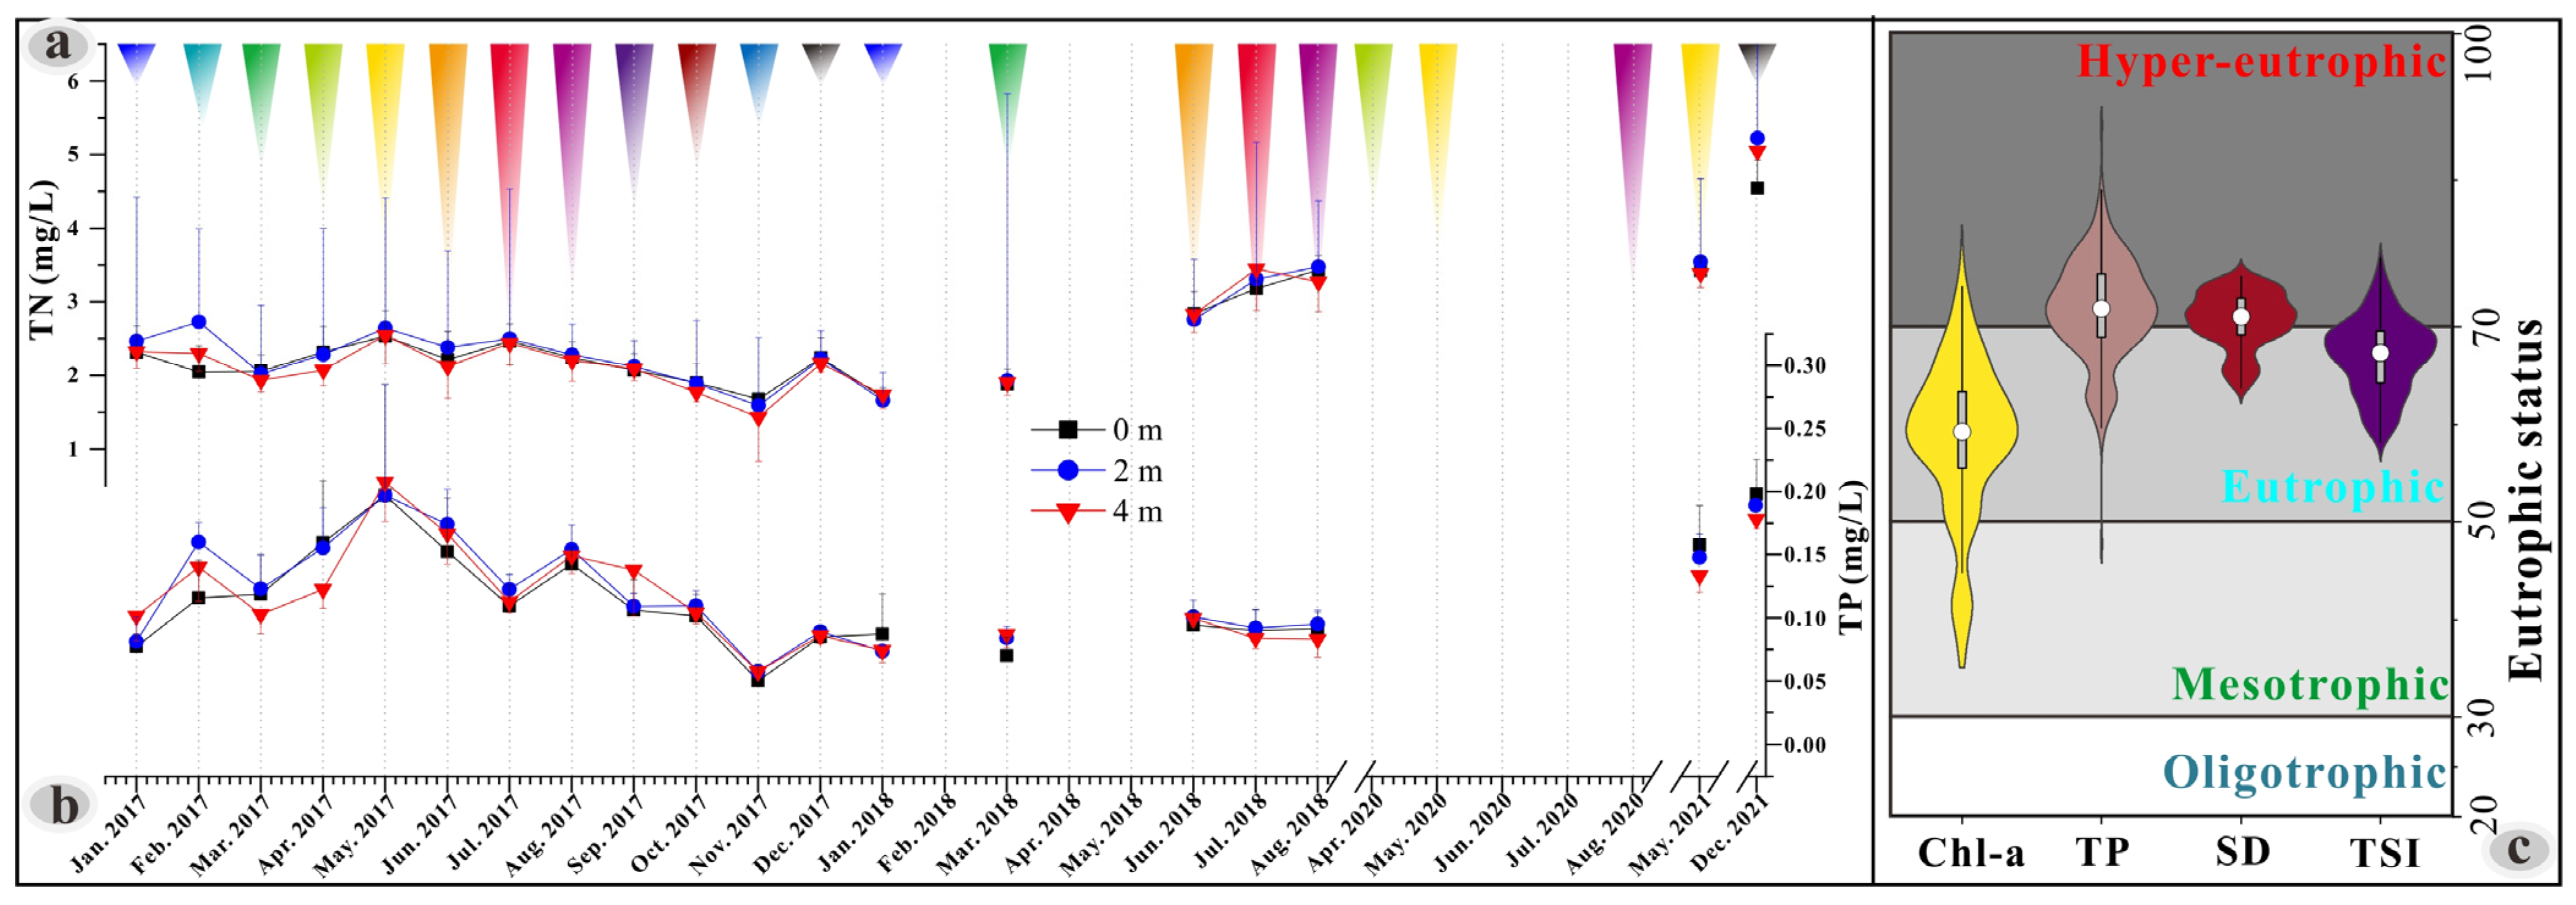
3.6. Assessment of Trophic State and Water Quality
The monitoring dataset showed that the TN and TP concentrations ranged from 1.6 to 3.57 (2.19 ± 0.37) mg/L and 0.02 to 0.4 (0.12 ± 0.04) mg/L, respectively. They were inferior to Class V (GB3838-2002) for a long time [25]. Notably, TN and TP concentrations continuously increased from 2017 to 2021, showing an increasing trophic status in Lake QL (Figure 7). Compared with the so-called nine large lakes (>30 km2), the concentrations of TN and TP were higher than Lake Chenghai (0.75 ± 0.12, 0.05 ± 0.01), Erhai (0.57 ± 0.51, 0.05 ± 0.05), Yangzong (0.69 ± 0.11, 0.02 ± 0.00), Lugu (0.31 ± 0.11, 0.01 ± 0.00), and Fuxian (0.20 ± 0.32, 0.02 ± 0.00) [13]. Based on the TP and TN concentration threshold (TP, 0.05 mg/L; TN, 1.4 mg/L) in the trophic state reported by Liang et al., [16], Lake QL was classified as a hypereutrophic lake. According to a review by Tanvir et al., [38], the trophic state of the lake was hypereutrophic when the mean TP and maximum Chl-a concentration were higher than 100 μg/L and 75 μg/L, respectively, (Table 2). Based on the work of Carlson and Simpson [37], the percentages of all samples were eutrophic for Chl-a (80.21%), TP (34.72%), and the depth of Secchi disk transparency (30.21%). The hypereutrophic percentage was 6.60%, 65.28%, and 69.44%, respectively. There were 70.14% and 29.86% of comprehensive TSI that showed a eutrophic and hypereutrophic level in lake Qilu, respectively. All assessments of trophic state results indicated that Lake QL was a eutrophic to the hypereutrophic lake. Simultaneously, NSFWQI assessment of all numbers showed that the water quality of Lake QL was very bad (0 ≤ WQI ≤ 25) [49]. Another interesting finding is that TP concentration continuously increased from January to May of 2017 and decreased after May but was relatively steady for TN, which led to a change in TN/TP ratios.
Nutrient inputs are the primary cause of eutrophication in a lake [13,25]. It is situated at the lowest point in a basin and the accumulation point of all pollutants in a watershed. Social and economic activities may exacerbate the fragility of the lacustrine ecosystem [31]. On the one hand, more than ten seasonal watercourses carried anthropogenic effluents into the lake, including the Hongqi, Zhewan, and Daxin rivers. Every month, TN and TP concentrations were higher than the thresholds of Class V (GB3838-2002), especially in May, possibly related to precipitation transporting many rocks, soil weathering products, and agricultural pollutants from the basin into the lake at the beginning of the rainy season (Figure 7).
On the other hand, the basin land-use type was mainly farmland that produces large quantities of vegetables along these rivers. In addition, there are now many industrial enterprises in the basin, especially on the lake’s south shore at Xiushan and Yangguang, and to the north near Nagu (Figure 1b). At the beginning of the rainy season, large quantities of chemical fertilizers, domestic sewage, and weathering products from soil and rock were transported into the lake, making it the principal reason for the apparent imbalance in the lake’s ecosystem. Previous studies also showed that TP and TN were the major pollutants in Lake QL [27,31,50]. These results, therefore, indicate that the decrease in both N and P should be taken into account for HABs’ movement and treatment in future critical lake managing strategies [51].
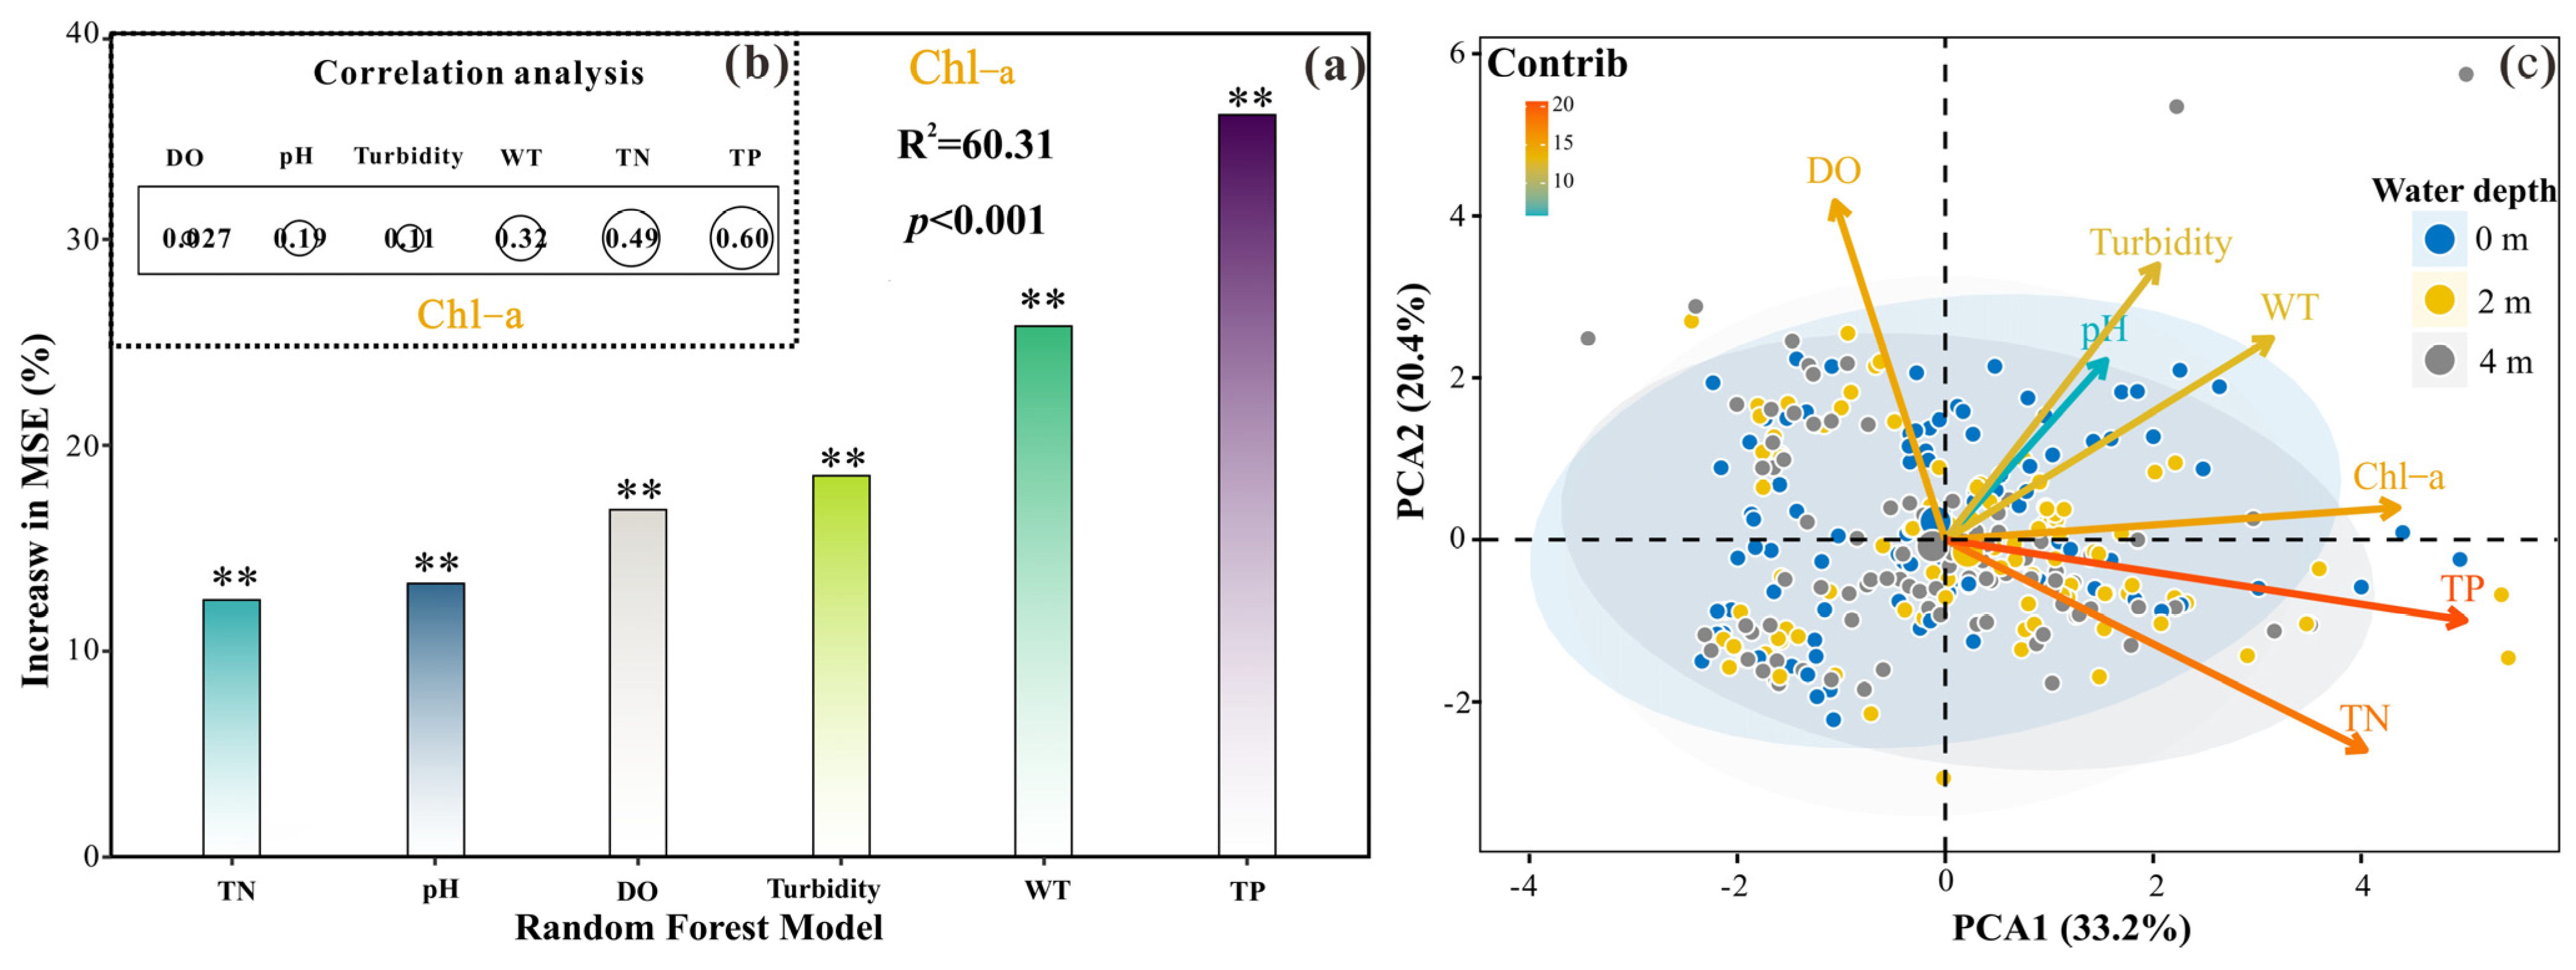
3.7. Control Factors of Harmful Algal Blooms
The input of excessive nutrients and climate change caused eutrophication and increased harmful algal blooms (HABs) in Lake QL (Figure 8). However, despite the many water quality parameters, the primary factor controlling algal productivity remains unknown. Herein, we combined PCA, RFM, and CA to address such issues. PCA results showed that 53.6% of the variables, including PC1 and PC2 accounted for 33.2% and 20.4% of all datasets, respectively (Figure 8c). PCA results found no significant difference in water quality parameters at different depths, indicating a strong water mixing process. Chl-a, TP, and TN were highly and positively correlated with PC1, indicating a eutrophication status. DO, pH, and other water parameters were significantly correlated with PC2, suggesting “physical parameters” (Figure 8c). PCA results showed that Lake QL’s trophic status and conditions were the primary driving factors for HABs. Based on the results from RFM, six variables explained 60.31% of the variation in Chl-a (p < 0.001), with TP, WT, and turbidity the first three important variables for Chl-a (Figure 8a). CA confirmed that Chl-a concentration was significantly correlated with TP (r = 0.60, p < 0.001) and TN (r = 0.49, p < 0.05), revealing the ongoing climate warming and eutrophication that could accelerate and promote the intensity and frequency of HABs (Figure 8b). Previous studies also showed that TP and TN were the major pollutants in lake QL [27,31,50].
The WT and Chl-a of lake QL sharply increased after the end of winter (January), accelerating the timing of HABs compared with other lakes (e.g., Lake Dianchi [6] and Taihu [47]) (Figure 2). Walls et al., [20] reported that cyanobacteria biomass increased with warming and was greatest at a WT ranging from 9 °C to 19 °C and declining at temperatures above those optimal for growth (≥19 °C). The effects of WT on HABs suggest that we should move the timing of HAB control forward. An increase in turbidity was found in January in Lake QL, which was from HABs [26]. DO has an important effect on lake ecosystems and is an important index of ecological balance. DO can more accurately reflect the metabolism of an aquatic ecosystem than other variables [52]. A high DO concentration enhanced pollutant degradation in water so that the water column could be purified more quickly. In contrast, the pollutant degradation rate was sluggish in low DO concentration environments. Figure 3 shows that DO concentration exhibited seasonal variation, especially on the vertical scale. Based on CA, no significant correlation between DO and Chl-a was found in lake QL, indicating no significant effect of DO on HABs. However, we observed that HABs decreased DO concentrations due to the respiration and decomposition of cyanobacteria, leading to a decline in pH because of the increase in CO2. Simultaneously, the increase in HABs resulted in a decrease in transparency and photocatalytic efficiency due to light interruption.
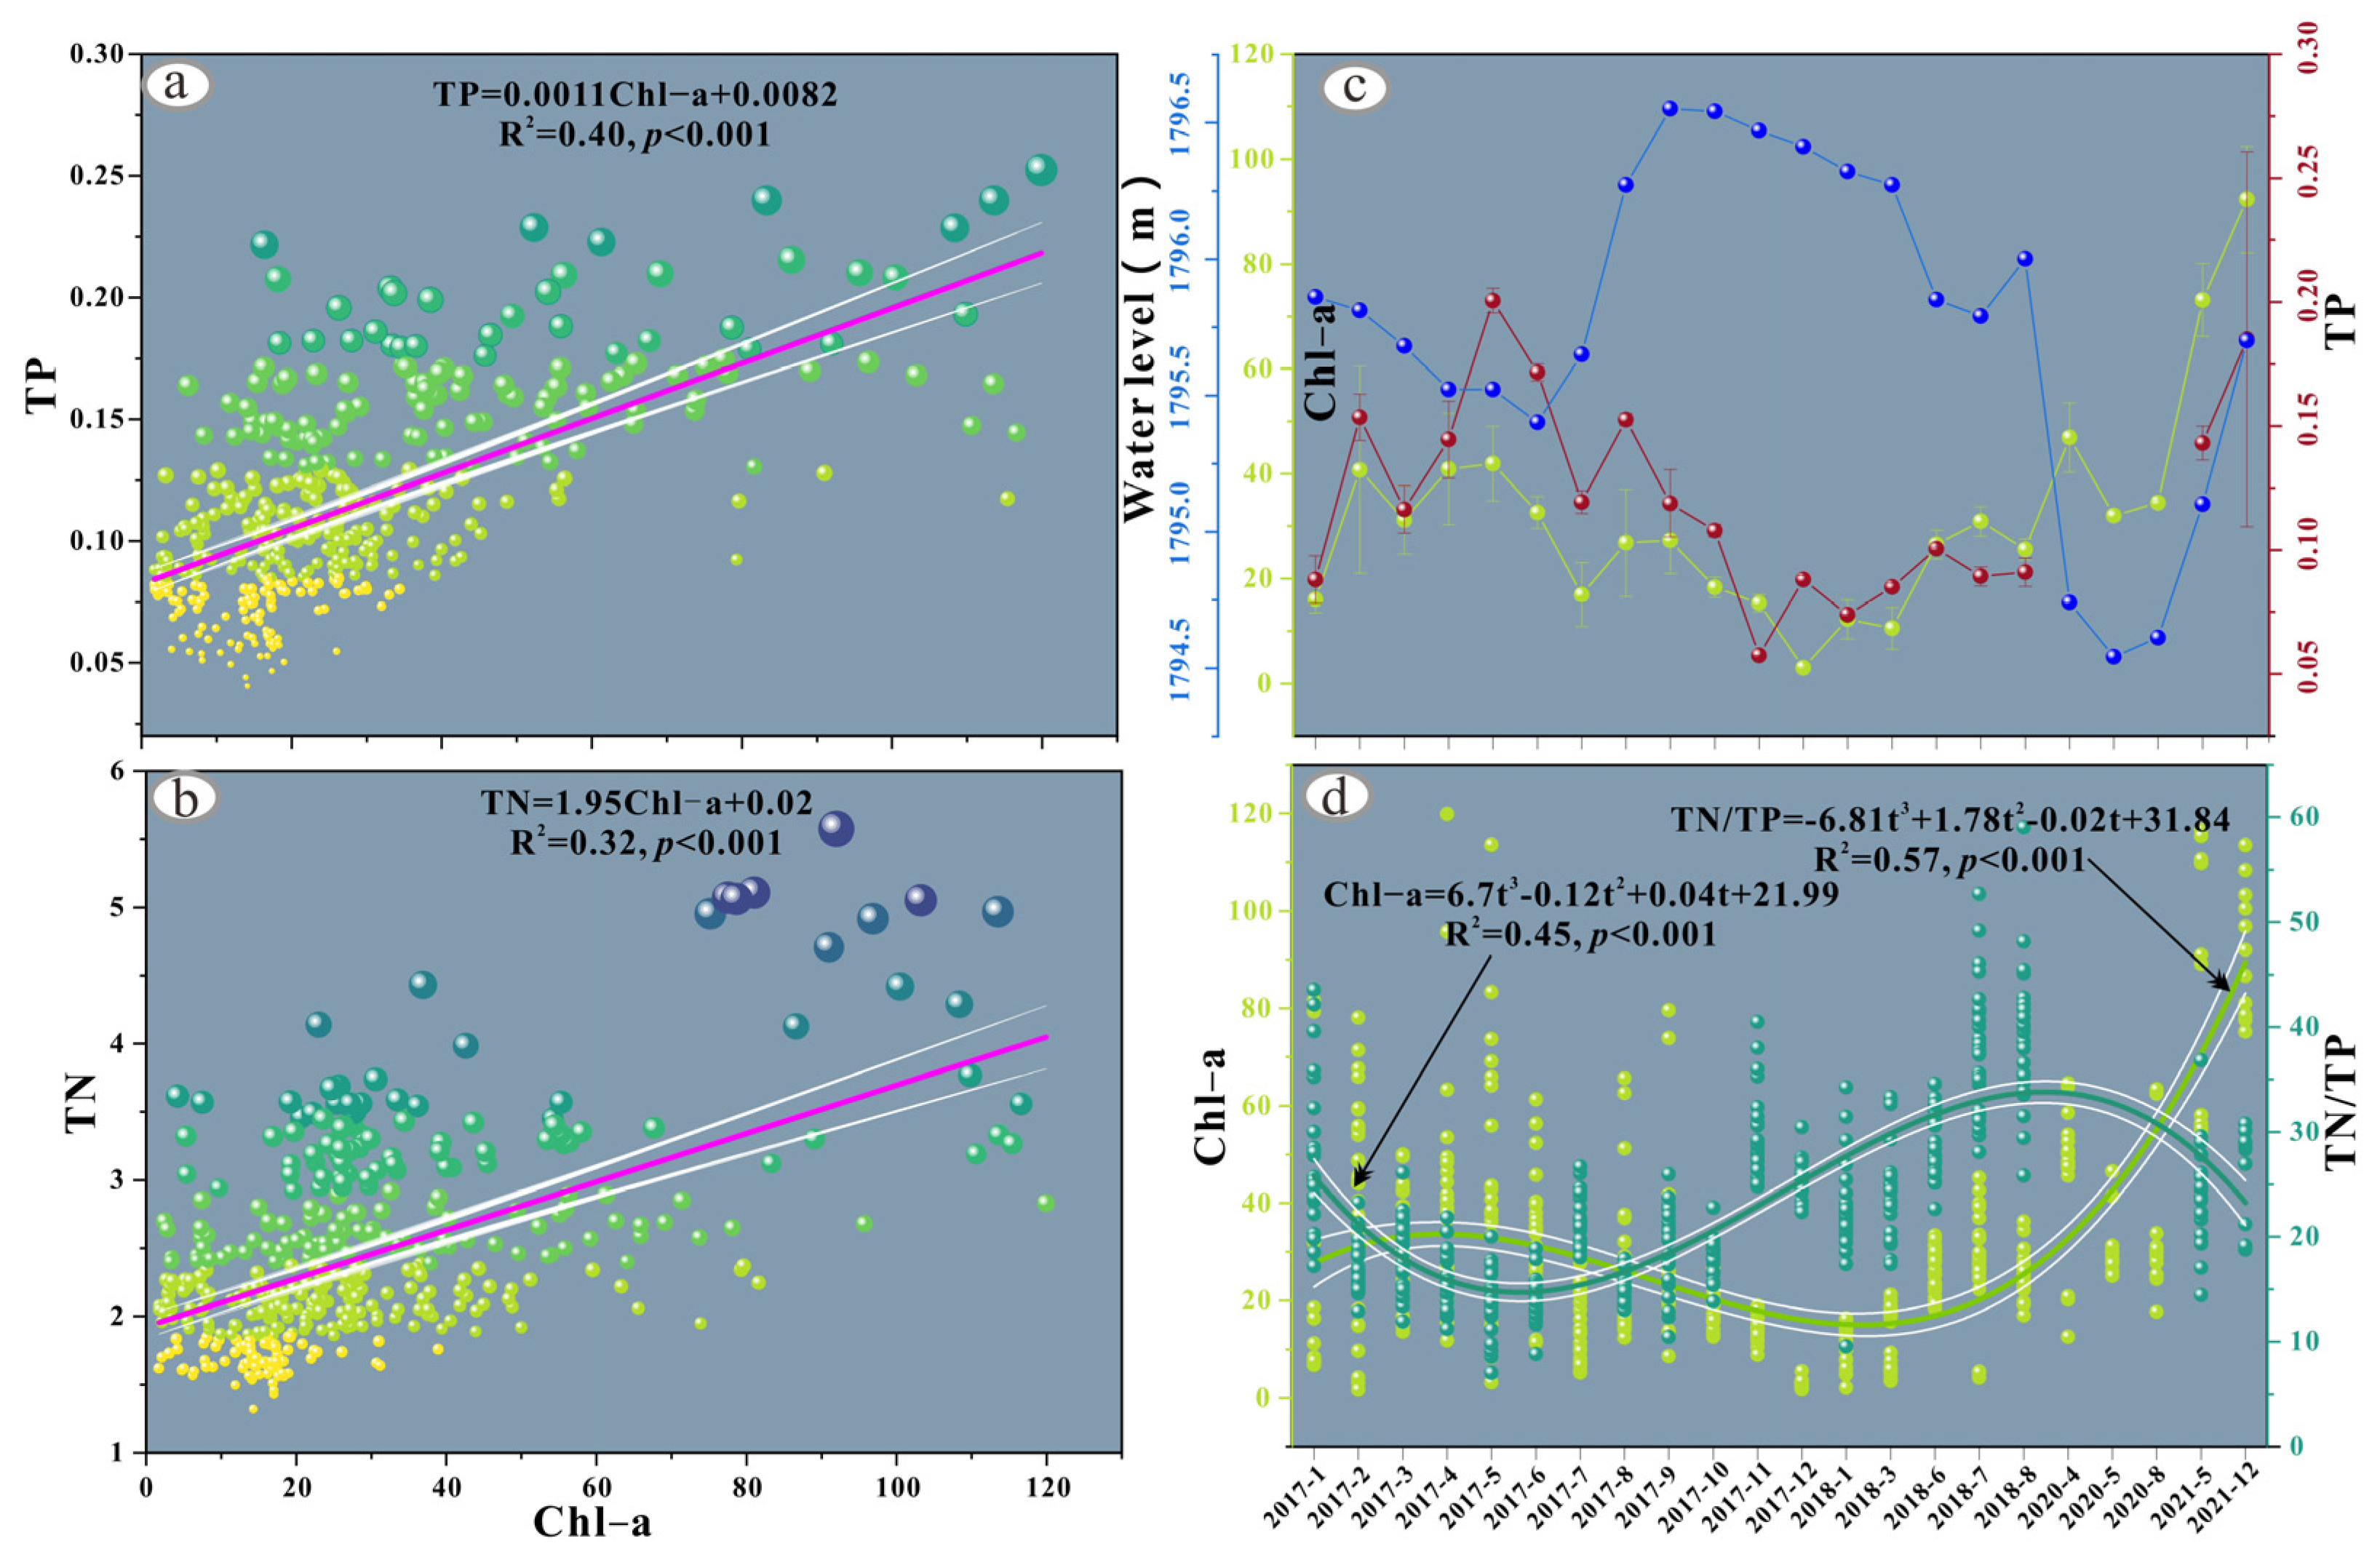
Ecologists and governments have had a long and strong interest in determining whether N and/or P limited HABs in lakes [16,17,29,51]. Generally, TP could limit the primary production in freshwater lakes partly because the fixation of atmospheric nitrogen could compensate for N limitations to support phytoplankton growth [53]. TP was more closely related to Chl-a than TN under oligo-mesotrophic and eutrophic conditions, and both TP and TN were important under hypereutrophic conditions [16]. TP was more correlated to Chl-a than TN in lake QL (Figure 9a–c). Further, the TN/TP ratio was reported to be a good index to predict nutrient limitation in the lake [16]. An interesting result was that Chl-a concentrations were negatively correlated with TN/TP ratios. In other words, Chl-a concentration increased with a decrease in TN/TP (Figure 9d) due to an increase in TP but only a weak change in TN (Figure 9d). The increase in TP could be related to the decrease in water level during the dry season, especially from January to May (Figure 9c), suggesting that Lake QL was mainly limited by TP for HABs. Overall, these results suggest that more attention should be paid to TP and not to ignore TN because we found that TN promoted the efficiency of P use by phytoplankton directly or by impacting diversity [13].
3.8. Environmental Implication
The trophic status indexes showed that Lake QL was a eutrophic to the hypereutrophic lake from 2017 to 2021, and the trend shows an ongoing increase. The reasons for the eutrophication of QL were the use of large quantities of chemical fertilizers and the discharge of domestic sewage, which both led to large quantities of nutrient accumulation into the lake. In summer, the high nutrients were probably released from bottom sediments, due to their strengthened heating and periodic deoxidation. Therefore, adjusting the agricultural production type and improving domestic sewage treatment capacity could be effective ways to control the eutrophication of QL. TP may have a more restrictive effect on algal blooming than TN, implying that we should reduce TP concentrations by inputting clean water to raise water levels and dilute water bodies to increase TN/TP ratios.
4. Conclusions
Based on our monitoring dataset of water parameters in Lake QL, complex seasonal changes in water quality parameters were identified. The lake water was well mixed during the monitoring period, resulting in no significant thermal stratification. Variations in DO and pH were caused by the physical (disturbing by shipping and wind) and biochemical processes (respiration organic matter degradation) associated with an anaerobic environment at the bottom of the water during summer.
Lake QL is a eutrophic to a hypereutrophic lake with poor water quality, which might continue to aggravate due to extreme climate conditions and intense human activities in the future. The ratios of TN/TP were negatively correlated with Chl-a, revealing that TP mainly limited phytoplankton growth more than TN. Thus, these findings enhance our understanding of the effects of water parameters and eutrophication on HABs, which suggests that reducing TP loading, increasing the water level, and advancing the timing of HABs treatment could be critical strategies for Lake Qilu management.
Author Contributions
Conceptualization, methodology, foundations acquisition, writing—review and editing, H.Z.; formal analysis, writing—original draft preparation, L.D. and F.C.; data curation, D.L. and X.W. All authors have read and agreed to the published version of the manuscript.
Funding
This research was funded by the Special Project for Social Development of Yunnan Province (Grant No. 202103AC100001).
Data Availability Statement
The original contributions presented in the study are included in the article. Further inquiries can be directed to the corresponding author.
Acknowledgments
Thanks to the teachers and students who participated in the field data collection.
Conflicts of Interest
The authors declare no conflict of interest.
Abbreviations
| CA | Correlation analysis |
| Chl-a | Chlorophyll-a |
| DO | Dissolved oxygen |
| HABs | Harmful algal blooms |
| NSFWQI | National Sanitation Foundation Water Quality Index |
| PCA | Principal component analysis |
| QL | Qilu |
| RFM | Random Forest Model |
| SD | Secchi disk depth |
| SEPAC | State Environmental Protection Administration of China |
| TN | Total nitrogen |
| TN/TP | Total nitrogen/total phosphorus |
| TP | Total phosphorus |
| TSI | Trophic State Index |
| WT | Water temperature |
References
- Paerl, H.W.; Paul, V.J. Climate change: Links to global expansion of harmful cyanobacteria. Water Res. 2012, 46, 1349–1363. [Google Scholar] [CrossRef]
- Przytulska, A.; Bartosiewicz, M.; Vincent, W.F. Increased risk of cyanobacterial blooms in northern high-latitude lakes through climate warming and phosphorus enrichment. Freshw. Biol. 2017, 62, 1986–1996. [Google Scholar] [CrossRef]
- Ranjbar, M.H.; Hamilton, D.P.; Etemad-Shahidi, A.; Helfer, F. Impacts of atmospheric stilling and climate warming on cyanobacterial blooms: An individual-based modelling approach. Water Res. 2022, 221, 118814. [Google Scholar] [CrossRef] [PubMed]
- Vinçon-Leite, B.; Casenave, C. Modelling eutrophication in lake ecosystems: A review. Sci. Total Environ. 2019, 651, 2985–3001. [Google Scholar] [CrossRef]
- Zhang, Y.; Liang, J.; Zeng, G.; Tang, W.; Lu, Y.; Luo, Y.; Xing, W.; Tang, N.; Ye, S.; Li, X.; et al. How climate change and eutrophication interact with microplastic pollution and sediment resuspension in shallow lakes: A review. Sci. Total Environ. 2020, 705, 135979. [Google Scholar] [CrossRef] [PubMed]
- Zhang, H.; Chang, F.; Duan, L.; Li, H.; Zhang, Y.; Meng, H.; Wen, X.; Wu, H.; Lu, Z.; Rongxin, B.; et al. Water Quality Characteristics and Variations of Lake Dian. Adv. Earth Sci. 2017, 32, 651–659, (In Chinese with English abstract). [Google Scholar] [CrossRef]
- Yang, K.; Yu, Z.Y.; Luo, Y.; Zhou, X.L.; Shang, C.X. Spatial-Temporal Variation of Lake Surface Water Temperature and Its Driving Factors in Yunnan-Guizhou Plateau. Water Resour. Res. 2019, 55, 4688–4703. [Google Scholar] [CrossRef]
- King, W.M.; Curless, S.E.; Hood, J.M. River phosphorus cycling during high flow may constrain Lake Erie cyanobacteria blooms. Water Res. 2022, 222, 118845. [Google Scholar] [CrossRef]
- Diaz, R.J.; Rosenberg, R. Spreading Dead Zones and Consequences for Marine Ecosystems. Science 2008, 321, 926–929. [Google Scholar] [CrossRef]
- Cheng, H.; Li, M.; Zhao, C.; Yang, K.; Li, K.; Peng, M.; Yang, Z.; Liu, F.; Liu, Y.; Bai, R.; et al. Concentrations of toxic metals and ecological risk assessment for sediments of major freshwater lakes in China. J. Geochem. Explor. 2015, 157, 15–26. [Google Scholar] [CrossRef]
- Zeng, L.; Yan, C.; Guo, J.; Zhen, Z.; Zhao, Y.; Wang, D. Influence of algal blooms decay on arsenic dynamics at the sediment-water interface of a shallow lake. Chemosphere 2018, 219, 1014–1023. [Google Scholar] [CrossRef] [PubMed]
- Dodds, W.K.; Smith, V.H.; Lohman, K. Nitrogen and phosphorus relationships to benthic algal biomass in temperate streams. Can. J. Fish. Aquat. Sci. 2002, 59, 865–874. [Google Scholar] [CrossRef]
- Zhang, Y.; Zhang, H.; Liu, Q.; Duan, L.; Zhou, Q. Total nitrogen and community turnover determine phosphorus use efficiency of phytoplankton along nutrient gradients in plateau lakes. J. Environ. Sci. 2023, 124, 699–711. [Google Scholar] [CrossRef]
- Conley, D.J.; Paerl, H.W.; Howarth, R.W.; Boesch, D.F.; Seitzinger, S.P.; Havens, K.E.; Lancelot, C.; Likens, G.E. Controlling eutrophication: Nitrogen and phosphorus. Science 2009, 323, 1014–1015. [Google Scholar] [CrossRef]
- Conley, D.J. Biogeochemical nutrient cycles and nutrient management strategies. Hydrobiologia 1999, 410, 87–96. [Google Scholar] [CrossRef]
- Liang, Z.; Soranno, P.A.; Wagner, T. The role of phosphorus and nitrogen on chlorophyll a: Evidence from hundreds of lakes. Water Res. 2020, 185, 116236. [Google Scholar] [CrossRef]
- Qin, B.; Zhou, J.; Elser, J.J.; Gardner, W.S.; Deng, J.; Brookes, J.D. Water Depth Underpins the Relative Roles and Fates of Nitrogen and Phosphorus in Lakes. Environ. Sci. Technol. 2020, 54, 3191–3198. [Google Scholar] [CrossRef]
- Schindler, D.W.; Hecky, R.E. Eutrophication: More Nitrogen Data Needed. Science 2009, 324, 721–722. [Google Scholar] [CrossRef]
- Paerl, H.W.; Huisman, J. Climate change: A catalyst for global expansion of harmful cyanobacterial blooms. Environ. Microbiol. Rep. 2009, 1, 27–37. [Google Scholar] [CrossRef]
- Walls, J.T.; Wyatt, K.H.; Doll, J.C.; Rubenstein, E.M.; Rober, A.R. Hot and toxic: Temperature regulates microcystin release from cyanobacteria. Sci. Total Environ. 2018, 610–611, 786–795. [Google Scholar] [CrossRef]
- Park, H.-K.; Lee, H.-J.; Heo, J.; Yun, J.-H.; Kim, Y.-J.; Kim, H.-M.; Hong, D.-G.; Lee, I.-J. Deciphering the key factors determining spatio-temporal heterogeneity of cyanobacterial bloom dynamics in the Nakdong River with consecutive large weirs. Sci. Total Environ. 2021, 755, 143079. [Google Scholar] [CrossRef] [PubMed]
- Kim, H.-J.; Nam, G.-S.; Jang, J.-S.; Won, C.-H.; Kim, H.-W. Cold Plasma Treatment for Efficient Control over Algal Bloom Products in Surface Water. Water 2019, 11, 1513. [Google Scholar] [CrossRef]
- Jeppesen, E.; Sondergaard, M.; Meerhoff, M.; Lauridsen, T.L.; Jensen, J.P. Shallow lake restoration by nutrient loading reduction—Some recent findings and challenges ahead. Hydrobiologia 2007, 584, 239–252. [Google Scholar] [CrossRef]
- Karlson, B.; Andersen, P.; Arneborg, L.; Cembella, A.; Eikrem, W.; John, U.; West, J.J.; Klemm, K.; Kobos, J.; Lehtinen, S.; et al. Harmful algal blooms and their effects in coastal seas of Northern Europe. Harmful Algae 2021, 102, 101989. [Google Scholar] [CrossRef]
- Dong, Y.; Zhao, L.; Chen, Y.; Yu, Y.; Zhao, R.; Yang, G. Succession of Nine Plateau Lakes and Regulation of Ecological Safety in Yunnan Province. Ecol. Econ. 2015, 31, 185–191, (In Chinese with English Abstract). [Google Scholar] [CrossRef]
- Yu, Z.Y.; Yang, K.; Luo, Y.; Yang, Y.L. Secchi depth inversion and its temporal and spatial variation analysis-A case study of nine plateau lakes in Yunnan Province of China. Int. J. Appl. Earth Obs. Geoinf. 2021, 100, 102344. [Google Scholar] [CrossRef]
- Hillman, A.L.; O’Quinn, R.F.; Abbott, M.B.; Bain, D.J. A Holocene history of the Indian monsoon from Qilu Lake, southwestern China. Quat. Sci. Rev. 2020, 227, 106051. [Google Scholar] [CrossRef]
- Ahn, C.Y.; Oh, H.M.; Park, Y.S. Evaluation of Environmental Factors on Cyanobacterial Bloom in Eutrophic Reservoir Using Artificial Neural Networks. J. Phycol. 2011, 47, 495–504. [Google Scholar] [CrossRef]
- Su, X.; Steinman, A.D.; Oudsema, M.; Hassett, M.; Xie, L. The influence of nutrients limitation on phytoplankton growth and microcystins production in Spring Lake, USA. Chemosphere 2019, 234, 34–42. [Google Scholar] [CrossRef]
- Iqbal, M.M.; Li, L.L.; Hussain, S.; Lee, J.L.; Mumtaz, F.; Elbeltagi, A.; Waqas, M.S.; Dilawar, A. Analysis of Seasonal Variations in Surface Water Quality over Wet and Dry Regions. Water 2022, 14, 1058. [Google Scholar] [CrossRef]
- Dong, Y.; Liu, Y.; Li, Y.; Zhang, R. Analysis on Factors of Ecological Vulnerability of Qilu Lake in Yunnan Province. Environ. Sci. Surv. 2011, 30, 24–29, (In Chinese with English abstract). [Google Scholar] [CrossRef]
- Li, Y.; Wang, L.; Yan, Z.; Chao, C.; Yu, H.; Yu, D.; Liu, C. Effectiveness of dredging on internal phosphorus loading in a typical aquacultural lake. Sci. Total Environ. 2020, 744, 140883. [Google Scholar] [CrossRef] [PubMed]
- Shen, Y.S.; Huang, Y.Y.; Hu, J.; Li, P.P.; Zhang, C.; Li, L.; Xu, P.; Zhang, J.Y.; Chen, X.C. The nitrogen reduction in eutrophic water column driven by Microcystis blooms. J. Hazard. Mater. 2020, 385, 121578. [Google Scholar] [CrossRef] [PubMed]
- Iqbal, M.M.; Shoaib, M.; Farid, H.U.; Lee, J.L. Assessment of Water Quality Profile Using Numerical Modeling Approach in Major Climate Classes of Asia. Int. J. Environ. Res. Public Health 2018, 15, 2258. [Google Scholar] [CrossRef] [PubMed]
- Acuña-Alonso, C.; Álvarez, X.; Lorenzo, O.; Cancela, Á.; Valero, E.; Sánchez, Á. Assessment of water quality in eutrophized water bodies through the application of indexes and toxicity. Sci. Total Environ. 2020, 728, 138775. [Google Scholar] [CrossRef] [PubMed]
- Valera, C.A.; Pissarra, T.C.T.; Martins, M.V.; do Valle, R.F.; Oliveira, C.F.; Moura, J.P.; Fernandes, L.F.S.; Pacheco, F.A.L. The Buffer Capacity of Riparian Vegetation to Control Water Quality in Anthropogenic Catchments from a Legally Protected Area: A Critical View over the Brazilian New Forest Code. Water 2019, 11, 549. [Google Scholar] [CrossRef]
- Carlson, R.E.; Simpson, J. A Coordinator’s Guide to Volunteer Lake Monitoring Methods. N. Am. Lake Manag. Soc. 1996, 99, 96. [Google Scholar]
- Tanvir, R.U.; Hu, Z.; Zhang, Y.; Lu, J. Cyanobacterial community succession and associated cyanotoxin production in hypereutrophic and eutrophic freshwaters. Environ. Pollut. 2021, 290, 118056. [Google Scholar] [CrossRef]
- Chen, J.; Lyu, Y.; Zhao, Z.; Liu, H.; Zhao, H.; Li, Z. Using the multidimensional synthesis methods with non-parameter test, multiple time scales analysis to assess water quality trend and its characteristics over the past 25 years in the Fuxian Lake, China. Sci. Total Environ. 2019, 655, 242–254. [Google Scholar] [CrossRef]
- Wu, H.; Zhang, H.; Li, Y.; Chang, F.; Duan, L.; Zhang, X.; Peng, W.; Liu, Q.; Liu, F.; Zhang, Y. Plateau lake ecological response to environmental change during the last 60 years: A case study from freshwater Lake Yangzong, SW China. J. Soils Sed. 2021, 21, 1550–1562. [Google Scholar] [CrossRef]
- Shen, Y.; Wang, H.; Liu, X. Aquatic flora and assemblge characteristic of submerged macrophytics in five lakes of the Yunnan province. Resour. Environ. Yangtze Basin. 2010, 19, 9, (In Chinese with English Abstract). [Google Scholar]
- Chen, J.; Wang, S.; Zhang, S.; Yang, X.; Huang, Z.; Wang, C.; Wei, Q.; Zhang, G.; Xiao, J.; Jiang, F.; et al. Arsenic pollution and its treatment in Yangzonghai lake in China: In situ remediation. Ecotoxicol. Environ. Saf. 2015, 122, 178–185. [Google Scholar] [CrossRef] [PubMed]
- Jin, Z.; Ding, S.; Sun, Q.; Gao, S.; Fu, Z.; Gong, M.; Lin, J.; Wang, D.; Wang, Y. High resolution spatiotemporal sampling as a tool for comprehensive assessment of zinc mobility and pollution in sediments of a eutrophic lake. J. Hazard. Mater. 2019, 364, 182–191. [Google Scholar] [CrossRef] [PubMed]
- Pan, F.; Guo, Z.; Cai, Y.; Liu, H.; Wu, J.; Fu, Y.; Wang, B.; Gao, A. Kinetic Exchange of Remobilized Phosphorus Related to Phosphorus-Iron-Sulfur Biogeochemical Coupling in Coastal Sediment. Water Resour. Res. 2019, 55, 10494–10517. [Google Scholar] [CrossRef]
- Liu, N.; Yang, Y.; Li, F.; Ge, F.; Kuang, Y. Importance of controlling pH-depended dissolved inorganic carbon to prevent algal bloom outbreaks. Bioresour. Technol. 2016, 220, 246–252. [Google Scholar] [CrossRef] [PubMed]
- Liu, Y.; Guo, H.; Yang, P. Exploring the influence of lake water chemistry on chlorophyll a: A multivariate statistical model analysis. Ecol. Model. 2010, 221, 681–688. [Google Scholar] [CrossRef]
- Yao, Y.; Li, D.; Chen, Y.; Liu, H.; Wang, G.; Han, R. High-resolution distribution of internal phosphorus release by the influence of harmful algal blooms (HABs) in Lake Taihu. Environ. Res. 2021, 201, 111525. [Google Scholar] [CrossRef]
- Li, X.; Janssen, A.B.G.; de Klein, J.J.M.; Kroeze, C.; Strokal, M.; Ma, L.; Zheng, Y. Modeling nutrients in Lake Dianchi (China) and its watershed. Agric. Water Manag. 2019, 212, 48–59. [Google Scholar] [CrossRef]
- Tyagi, S.; Sharma, B.; Singh, P. Water Quality Assessment in Terms of Water Quality Index. Am. J. Water Resour. 2013, 1, 34–38. [Google Scholar] [CrossRef]
- Qin, J.; Wu, X.; Gao, W.; Yang, S.; Wang, Q.; Luo, W. Study on Temporal and Spatial Distribution Characteristics of Chl-a and Water Quality Factors in Qilu Lake and Their Correlations. J. Anhui Agric. Sci. 2012, 40, 345–348, (In Chinese with English Abstract). [Google Scholar] [CrossRef]
- Zhou, J.; Han, X.; Brookes, J.D.; Qin, B. High probability of nitrogen and phosphorus co-limitation occurring in eutrophic lakes. Environ. Pollut. 2022, 292, 118276. [Google Scholar] [CrossRef] [PubMed]
- Krueger, K.M.; Vavrus, C.E.; Lofton, M.E.; McClure, R.P.; Gantzer, P.; Carey, C.C.; Schreiber, M.E. Iron and manganese fluxes across the sediment-water interface in a drinking water reservoir. Water Res. 2020, 182, 116003. [Google Scholar] [CrossRef] [PubMed]
- Hayes, N.M.; Patoine, A.; Haig, H.A.; Simpson, G.L.; Swarbrick, V.J.; Wiik, E.; Leavitt, P.R. Spatial and temporal variation in nitrogen fixation and its importance to phytoplankton in phosphorus-rich lakes. Freshw. Biol. 2019, 64, 269–283. [Google Scholar] [CrossRef] [Green Version]
Figure 1.
Sampling locations in Lake Qilu, southwestern China. (a) Location of lake Qilu; (b) Basin of Lake Qilu; (c) Main inflows in lake Qilu; and (d) the dense harmful algal blooms in lake Qilu.
Figure 1.
Sampling locations in Lake Qilu, southwestern China. (a) Location of lake Qilu; (b) Basin of Lake Qilu; (c) Main inflows in lake Qilu; and (d) the dense harmful algal blooms in lake Qilu.

Figure 2.
Seasonal and interannual variations in water temperature in lake QL. (a) Seasonal variations in water temperature; (b) Interannual variations in water temperature; (c) Monthly changes in precipitation, air temperature, water temperature, and water levels in Lake QL.
Figure 2.
Seasonal and interannual variations in water temperature in lake QL. (a) Seasonal variations in water temperature; (b) Interannual variations in water temperature; (c) Monthly changes in precipitation, air temperature, water temperature, and water levels in Lake QL.

Figure 3.
Seasonal and annual variations in dissolved oxygen in Lake QL. (a) Seasonal variations in dissolved oxygen; (b) Interannual variations in dissolved oxygen.
Figure 3.
Seasonal and annual variations in dissolved oxygen in Lake QL. (a) Seasonal variations in dissolved oxygen; (b) Interannual variations in dissolved oxygen.

Figure 4.
Seasonal variations in turbidity in Lake QL. (a) Temporal and spatial variation characteristics in turbidity; (b) Interannual variations in turbidity.
Figure 4.
Seasonal variations in turbidity in Lake QL. (a) Temporal and spatial variation characteristics in turbidity; (b) Interannual variations in turbidity.

Figure 5.
Seasonal and annual pH variations in Lake QL. (a) Temporal and spatial variation characteristics in pH; (b) Interannual variations in pH.
Figure 5.
Seasonal and annual pH variations in Lake QL. (a) Temporal and spatial variation characteristics in pH; (b) Interannual variations in pH.

Figure 6.
Seasonal and annual variations in Chl-a in Lake Qilu. (a) Temporal and spatial variation characteristics in Chl-a; (b) Interannual variations in Chl-a.
Figure 6.
Seasonal and annual variations in Chl-a in Lake Qilu. (a) Temporal and spatial variation characteristics in Chl-a; (b) Interannual variations in Chl-a.

Figure 7.
Seasonal and annual variations of TN and TP in Lake Qilu. (a) Seasonal and annual variations of TN; (b) Seasonal and annual variations of TP; and (c) the eutrophic status of Chl-a, TN, and TP.
Figure 7.
Seasonal and annual variations of TN and TP in Lake Qilu. (a) Seasonal and annual variations of TN; (b) Seasonal and annual variations of TP; and (c) the eutrophic status of Chl-a, TN, and TP.

Figure 8.
Comprehensive analysis of each water parameter in Lake Qilu. (a) Random Forest Model of variables prediction for Chl-a; (b) The correlations between Chl-a and each parameter based on correlation analysis; and (c) the Principal Component Analysis of all water quality parameters. **: The significance of variables (p < 0.01).

Figure 9.
The effects of nutrients on HABs. (a) Linear regression between TP and Chl-a; (b) changes in water level, TP, and Chl-a during the monitoring time; (c) linear regression between TN and Chl-a; and (d) Chl-a concentrations increased with the decreasing of TN/TP ratios.
Figure 9.
The effects of nutrients on HABs. (a) Linear regression between TP and Chl-a; (b) changes in water level, TP, and Chl-a during the monitoring time; (c) linear regression between TN and Chl-a; and (d) Chl-a concentrations increased with the decreasing of TN/TP ratios.


Table 1.
Water quality and trophic classification.
| Water Quality | Excellent | Good | Medium | Bad | Very bad |
|---|---|---|---|---|---|
| NSFWQI 1 | 91–100 | 71–90 | 51–70 | 26–50 | 0–25 |
| Trophic status | Classification | Oligotrophic | Mesotrophic | Eutrophic | Hypereutrophic |
| Chl-a 2 | <0.95 | 0.95–7.3 | 7.3–56 | >56 | |
| SD 2 | >8 | 8–2 | 2–0.5 | <0.5 | |
| TP 2 | <6 | 6–24 | 24–96 | >96 | |
| TSI 2 | <30 | 30–50 | 30–70 | >70 | |
| Mean. TP 3 | <10 | 10 | 30–100 | >100 | |
| Max.Chl-a 3 | <8 | 30 | 25–75 | >75 |
Table 2.
The ranges of TP and TN, and the trophic state and proportion.
| TSI | TP (μg/L) | TN (mg/L) | Chl-a (μg/L) | SD (meter) | TP (μg/L) | TSI | WQI |
|---|---|---|---|---|---|---|---|
| Oligotrophic | 0–50 | 0–1.4 | <0.95 | >8 | <6 | <30 | 0–25 |
| 1.40% | 0.00% | 0.00% | 0.00% | 0.00% | 0.00% | 100.00% | |
| Mesotrophic | 50–100 | 1.4–2 | 0.95–7.3 | 2-8 | 6–24 | 30–50 | 26–50 |
| 31.20% | 31.90% | 13.19% | 0.00% | 0.35% | 0.00% | 0.00% | |
| Eutrophic | >100 | >2 | 7.3–56 | 0.5-2 | 24–96 | 50–70 | 50–75 |
| 68.40% | 68.10% | 80.21% | 34.72% | 30.21% | 70.14% | 0.00% | |
| Hypereutrophic | >56 | <0.5 | >96 | >70 | 75–100 | ||
| 6.60% | 65.28% | 69.44% | 29.86% | 0.00% |
Publisher’s Note: MDPI stays neutral with regard to jurisdictional claims in published maps and institutional affiliations. |
© 2022 by the authors. Licensee MDPI, Basel, Switzerland. This article is an open access article distributed under the terms and conditions of the Creative Commons Attribution (CC BY) license (https://creativecommons.org/licenses/by/4.0/).
Share and Cite
MDPI and ACS Style
Li, D.; Chang, F.; Wen, X.; Duan, L.; Zhang, H. Seasonal Variations in Water Quality and Algal Blooming in Hypereutrophic Lake Qilu of Southwestern China. Water 2022, 14, 2611. https://doi.org/10.3390/w14172611
AMA Style
Li D, Chang F, Wen X, Duan L, Zhang H. Seasonal Variations in Water Quality and Algal Blooming in Hypereutrophic Lake Qilu of Southwestern China. Water. 2022; 14(17):2611. https://doi.org/10.3390/w14172611
Chicago/Turabian StyleLi, Donglin, Fengqin Chang, Xinyu Wen, Lizeng Duan, and Hucai Zhang. 2022. "Seasonal Variations in Water Quality and Algal Blooming in Hypereutrophic Lake Qilu of Southwestern China" Water 14, no. 17: 2611. https://doi.org/10.3390/w14172611
Note that from the first issue of 2016, this journal uses article numbers instead of page numbers. See further details here.