Article

Estimating Energy Efficient Design Parameters for Trash Racks at Low Head Hydropower Stations

by
Muhammad Ahsan Latif
1,
Muhammad Kaleem Sarwar
1,
Rashid Farooq
2,
Nadeem Shaukat
3,4,
Shoaib Ali
5,
Abrar Hashmi
6 and
Muhammad Atiq Ur Rehman Tariq
7,8,*
1
Centre of Excellence in Water Resources Engineering, University of Engineering and Technology, Lahore 54890, Pakistan
2
Department of Civil Engineering, International Islamic University, Islamabad 44000, Pakistan
3
Center for Mathematical Sciences, Pakistan Institute of Engineering & Applied Sciences, Nilore, Islamabad 45650, Pakistan
4
Department of Physics and Applied Mathematics, Pakistan Institute of Engineering & Applied Sciences, Nilore, Islamabad 45650, Pakistan
5
School of Water Conservancy & Civil Engineering, Northeast Agricultural University, Harbin 150030, China
6
Department of Electrical Engineering, Capital University and Technology, Islamabad 45750, Pakistan
7
College of Engineering, IT & Environment, Charles Darwin University, Darwin, NT 0810, Australia
8
Institute for Sustainable Industries & Liveable Cities, Victoria University, P.O. Box 14428, Melbourne, VIC 8001, Australia
*
Author to whom correspondence should be addressed.
Water 2022, 14(17), 2609; https://doi.org/10.3390/w14172609
Submission received: 25 July 2022 / Revised: 13 August 2022 / Accepted: 19 August 2022 / Published: 24 August 2022
(This article belongs to the Special Issue Advances in Hydraulic Engineering Management)

Abstract

:
Trash racks are usually composed of an array of bars installed in a hydropower scheme to safeguard the turbines by collecting water-borne detritus. However, current design approaches for the design of trash racks focus on structural criteria. A little attention renders the proper evaluation of hydraulic criteria, which causes a significant hydraulic head loss in low head hydropower schemes with an integral intake. This study investigates the head loss through trash racks by employing computational fluid dynamics (CFD) for several design combinations. A three-dimensional model of trash racks using fractional area/volume obstacle representation (FAVOR) method in FLOW-3D is set up to define the effects of the meshing on the geometry and several simulations are carried out considering various approach velocities and different bar spacings, inclination angles, and blockage ratios. The results indicate that head loss increases with an increase in approach velocity, the inclination angle of the rack with channel bed, and blockage ratio. It is noticed that a clear spacing between vertical bars greater than or equal to 0.075 m has a minimum head loss before it becomes significantly high for lower spacing. In addition, the head loss coefficient increases for screen angles greater than 60°, which can be considered as an optimal parameter for design purpose.

1. Introduction

The momentum transfer phenomenon plays a significant role in complex flow intakes [1]. Usually, water intakes divert the required amount of water into a power canal or into a penstock without producing a negative impact on the local environment and with the minimum possible head losses. In low head hydropower schemes, intake structures may be broadly classified as power intake and conveyance intake. Power intake supplies water directly to the turbine via a penstock. These intakes are often encountered in lakes and reservoirs and transfer the water as pressurized flow. Conveyance intake supplies water to other waterways (power canal, flume, tunnel, etc.) that usually end in a power intake. These are most frequently encountered along rivers and waterways, which generally transfer the water as free surface flow. Conveyance intakes along rivers can be classified into lateral, frontal, and drop intakes [2]. One of the main functions of intake in hydroelectric power plants is to minimize the quantity of debris carried by water, so trash racks are provided at the entrance of intake of hydroelectric power plants to restrict the floating and submerged debris, which could otherwise cause damage to downstream structures and malfunctioning of electromechanical equipment [3,4,5,6,7].
Trash racks are composed of one or more panels, which are made up of a category of evenly spaced parallel metal bars [8,9]. Accumulation of debris upstream of trash racks causes the variation in flow depth and velocity, which in turn creates an increased differential head across the trash racks [10,11]. Studies around the globe [12,13,14,15,16,17,18] pointed out that the main concern for hydro-power intake design is how to maintain a high discharge coefficient and minimize entrance losses while minimizing the size, complexity, and cost of the entrance structure. The design and selection of trash racks are governed by many site-specific factors, whereas hydraulic head loss is one of the key parameters in the design of trash racks. Researchers [11,19,20] pointed out that trash racks significantly contribute to a total loss in low head plants with integral intakes.
Loss of head, ultimately, reduces net effective head and power output of a hydropower plant [21,22,23]. Since the design of trash racks greatly varies and is used in a wide range of operating conditions, therefore, numerous experimental studies have been carried out to investigate this problem. As a result of these studies, different equations have been derived to assess the head losses caused by trash racks [23,24,25,26]. One of the first head loss equations was proposed by Kirschmer [27] for vertical and slightly inclined (angled to channel floor) trash racks. Escande [28] considered the physical aspect of jet contraction and derived an expression for head loss calculation due to rack bars. Later on, Mosonyi [29] modified Kirschmer’s equation by taking the oblique flow coefficient into consideration. USBR [30] also presented an equation for the calculation of head loss through trash racks. However, it overestimates the head losses by as much as 55%, and the source or derivation of this equation are still missing in the literature [19]. Meusburger [31] proposed an equation similar to the Kirschmer–Mosonyi equation, but considered some other parameters like bar shape, blockage ratio, and the bars angle relative to the flow. Clark et al. [32] modified Meusburger’s [31] equation with new empirical coefficients for head loss calculation through trash rack. Tsikata et al. [33] defined the term block ratio used in Clark et al. [32] equation as the ratio between the area of rack bars and the area of the entire trash rack.
Recently, Carrillo et al. [34] proposed expressions by using CFD modelling to calculate the discharge coefficient for clear water collected through the rack and showed a good agreement with the laboratory data. In another study, Carrillo et al. [35] numerically investigated the design of bottom intake system. Study results showed differences smaller than 1% in the wetted rack length, and discharge coefficients also presented good agreement with lab data. García et al. [36] presented a novel computational tool, DIMRACK, for the design of the required length of bottom racks in intake systems. This study also proposed designing monograms to obtain the approximate graphical computation of the rack length with clear water. In sediment transport cases, an occlusion factor is proposed, which is obtained from experimental gravel tests.
Heidi Böttcher et al. [37] experimentally found out the head loss coefficient of an angled horizontal trash rack with circular bars (CBTR) and flexible fish fence (FFF). The study proposed a design equation to improve the estimation of head loss on both rack options. Furthermore, it was also noted that several trash racks problems such as vortex formations, vibrations, and instantaneous change in intake discharge are dynamic, therefore, understanding the dynamic properties of trash rack fitting, in general, is critical [38,39]. Sadrnejad [40] proposed an effective added-mass method for assessing the intensity of vibration in submerged structures. Tsikata et al. [41] investigated turbulent flow in the vicinity of the trash racks models. The bar thickness, depth, and center-to-center spacing were kept constant in all experiments. At three different stream velocities, the flow properties were examined by aligning the direction of approaching flow with the bars. The tests were recorded with the stream velocity constant for four distinct bar inclinations relative to the direction of approaching flow. A high-resolution particle image velocimetry (PIV) approach was employed for each test condition. According to this study, head loss and bar inclination have a nonlinear relationship.
Several experimental studies with various rack shapes and sizes have been published, many of which are discussed in Tsikata et al. [41,42,43]. However, there are only a few numerical investigations available in the literature on trash racks flow. For instance, Herman et al. [44] studied the flow through an array of rectangular bars using direct numerical simulation (DNS). Ghamry et al. [45] investigated the flow across an array of 3, 7–14 rectangular bars using multiple turbulence models. They concluded that the turbulent models considered, such as k-ε, k-ω, and Reynold’s stress models, all yield nearly identical outcomes. Recently, Akerstedt et al. [46] also conducted similar research and investigated numerically the turbulent flow through rectangular and biconvex-shaped trash racks. They noticed that overall loss of the biconvex bars is in general about 15% of the loss for the rectangular case for small angles of attack. For a large angle of attack, this difference diminishes. Similarly, Hribernik et al. [47] investigated the various trash racks shapes and their effects on fluid flow losses. For the experiment, they used three distinct rack bar profiles (one plain rectangular profile and two alternative aerodynamically shaped profiles) that result in various flow losses. An ANSYS CFX 12 solver (Version12, creator ANSYS, Country USA) was utilized to simulate the flow for 3D CFD simulations. For each trash racks profile, the gross head loss was computed, and the trash racks with the least head loss were determined. The net profit was computed, and it was revealed that the profit from the alternative trash racks design would only be expected after 10 years.
In addition to the above-discussed relations, several empirical equations are available in the literature to anticipate the head loss through trash racks of various configurations. However, local experience indicates that these empirical equations underestimate the head loss through trash racks. Considering this fact, it is required to evaluate trash racks head losses at low head hydropower plants. Therefore, this study presents a concept for the design of trash racks with maximum hydraulic efficiency for low head hydropower plants by utilizing computational fluid dynamics (CFD) modeling. Based on this design concept, a new equation was developed for the estimation of head loss at low head hydropower plants. For this purpose, a three-dimensional (3D) CFD model of trash racks was set up and a number of simulations were performed corresponding to varying approach velocity, for different bar spacing, inclination angle, and blockage ratio.

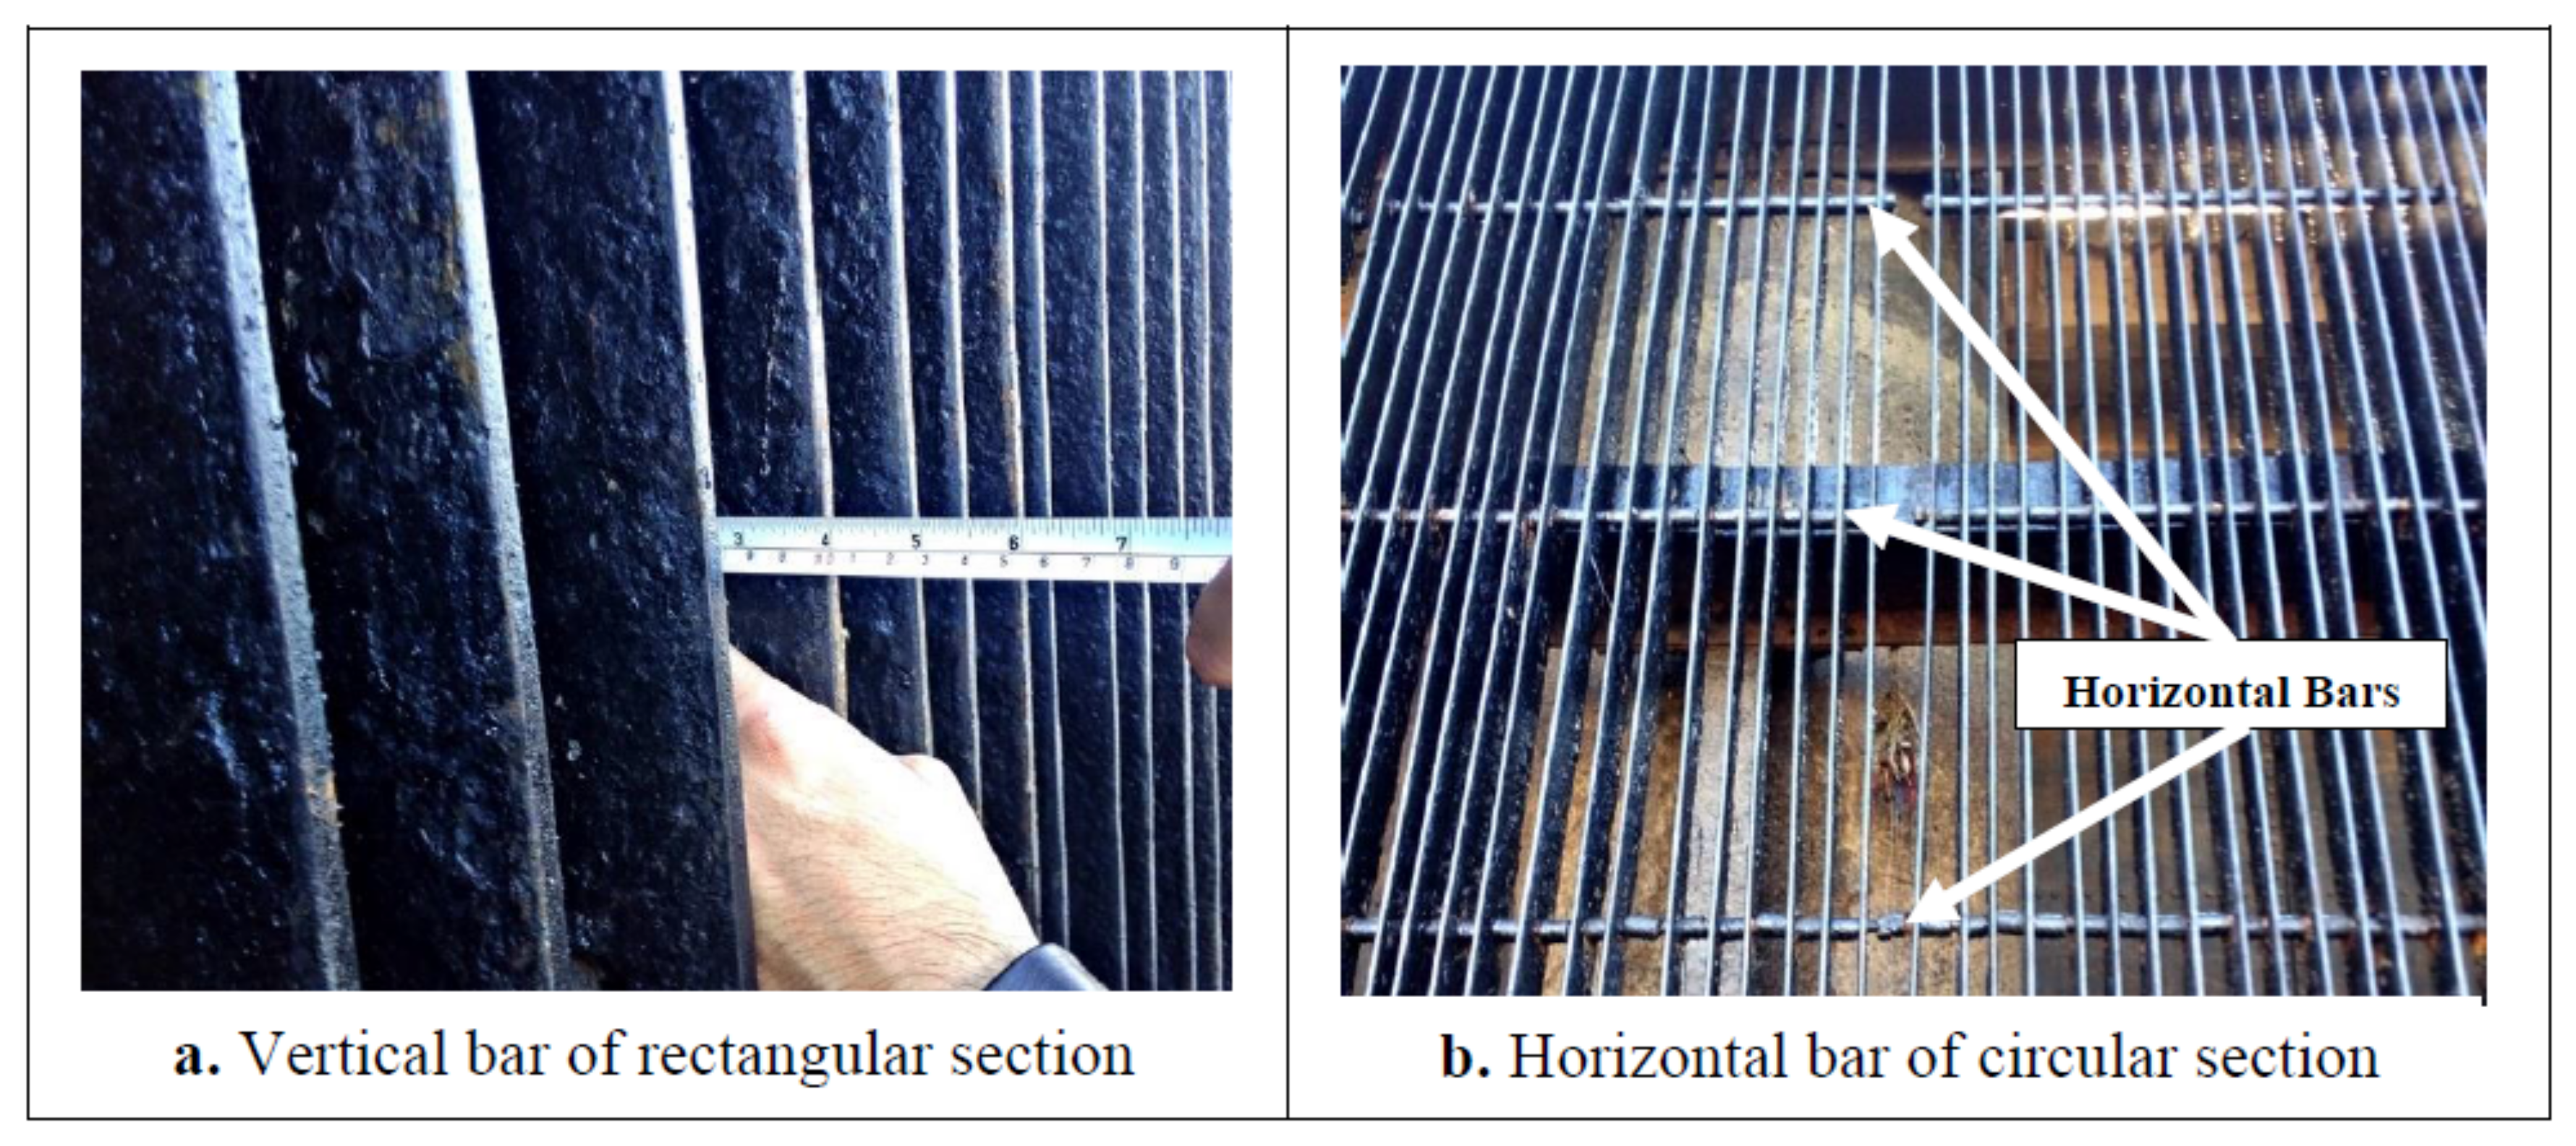
2. Materials and Methods

A comprehensive methodology was worked out and formulated after a detailed technical literature review and on-site assessment of trash racks. For this purpose, existing low head hydropower power stations at Nandipur, Rasul, Chichoki Malian, and Shadiwal were studied. All hydropower stations have a maximum designed output of 13 MW except the Shadiwal hydropower station, which has a 22 MW capacity. At all power stations, trash racks are an integral part of the intake structure. Trash racks are slightly inclined and provided with horizontal and vertical bars (Figure 1) fabricated in form of panels supported by girders. Vertical bars have a rectangular cross-section, whereas horizontal bars are configured with a circular cross-section (Figure 1). Bars in both vertical and horizontal directions are evenly spaced (vertical bar spacing: 100 mm, horizontal bar spacing: 600 mm).

3. Modelling with CFD Code FLOW-3D
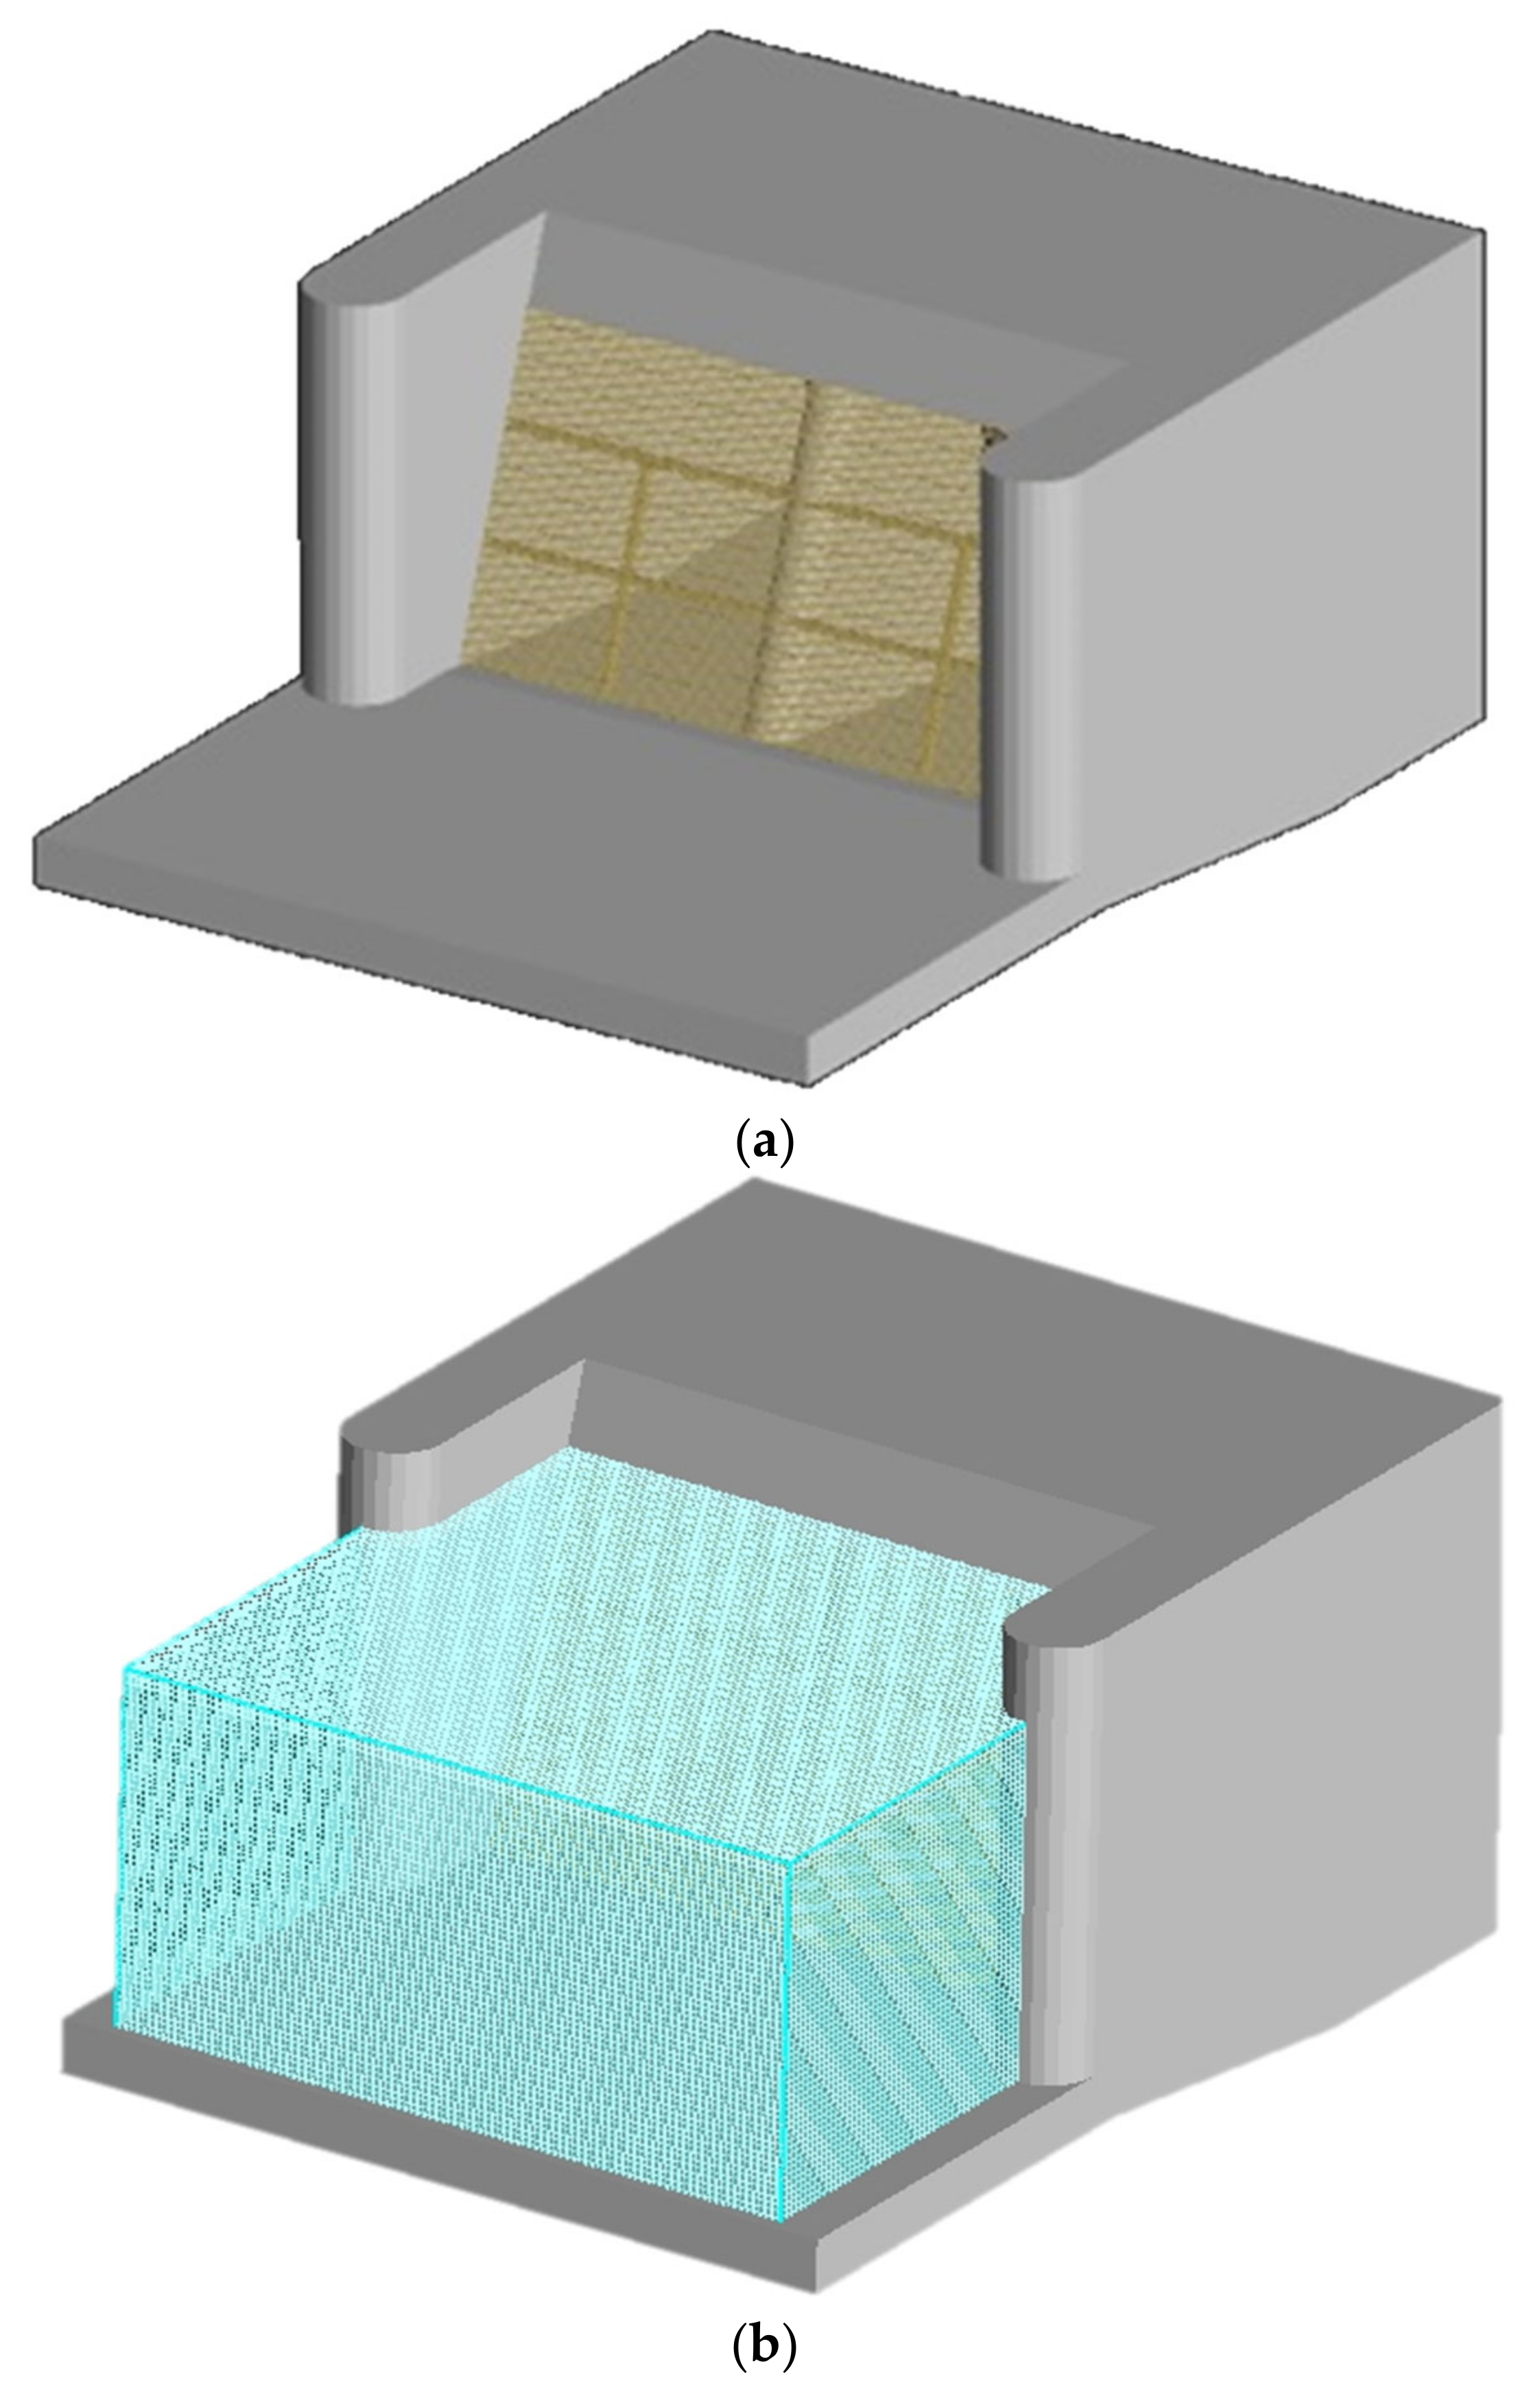
For the current study, numerical modeling of flows through Nandipur Hydropower Station was carried using CFD code FLOW-3D. It was selected due its ability to model the free surface flows using the volume of fluid method (VOF). This method adopts the accurate pressure and kinetic boundary conditions. It describes the movement between two fluids in order to prevent the boundary face from smearing [48]. VOF method defines the cells as empty, full, and partially full of fluid. It assigns the value of zero, one (01), and between zero and one (01), to empty, full, and partially full cells, respectively [49]. To determine the void or flow region in each cell, FLOW-3D uses the fractional area/volume obstacle representation (FAVOR) method. Moreover, FLOW-3D uses a multi-block mesh to model large domain and nested mesh to capture more flow details in the area of interest [50]. FLOW-3D provides several methods to track fluid interfaces. There are two main types of fluid interfaces: a diffuse interface and a sharp interface. Code automatically selected the best-fit option depending on the number of fluids [46].
Governing equations for FLOW-3D are continuity and momentum equations as shown below.
Continuity:
x u A x + y v A y + z w A z = 0
Momentum:
U i t + 1 V F U j A j U i d x j = 1 ρ P d x i + g i + f i
In the above, equation’s variables u, v, and w represent the velocities in the x-, y-, and z-directions; VF = volume fraction of fluid in each cell; Ax, Ay, and Az = fractional areas open to flow in the subscript directions; ρ = density; P′ is defined as the pressure; gi = gravitational force in the subscript direction; fi represents the Reynolds stresses, and Aj = cell face areas. Equations (1) and (2) are partial differential equations. They are discretized both in time and space. Due to the complex nature of turbulence, it is often simplified and approximated using an average approach (e.g., Reynolds-averaged Navier–Stokes).

4. Model Setup

CFD modeling was carried out for this study to simulate the flows through trash racks installed at intake of Nandipur Hydel Power Station as it is recognized as a good tool for the estimation of head losses through trash racks [51]. The collected drawings of intake trash racks were converted into a three-dimensional drawing of a single bay, which was further formatted into stereolithographic (Stl) file format. Cartesian coordinate system was used in this study. The geometry was created such as to represent the flow direction by X-component, lateral direction by Y-component, and elevation of geometry and fluid by Z-component. Length, height, and width of fluid domain were 24.96 m, 11.6 m, and 16.81 m respectively. The geometry file was then imported into CFD code FLOW-3D as shown in Figure 2a. Thereafter, meshing was carried out (Figure 2b) and the fluid region was added in the model.

5. Sensitivity Analysis

Selection of grid size, appropriate boundary conditions, and turbulence model was made based on the sensitivity analysis.

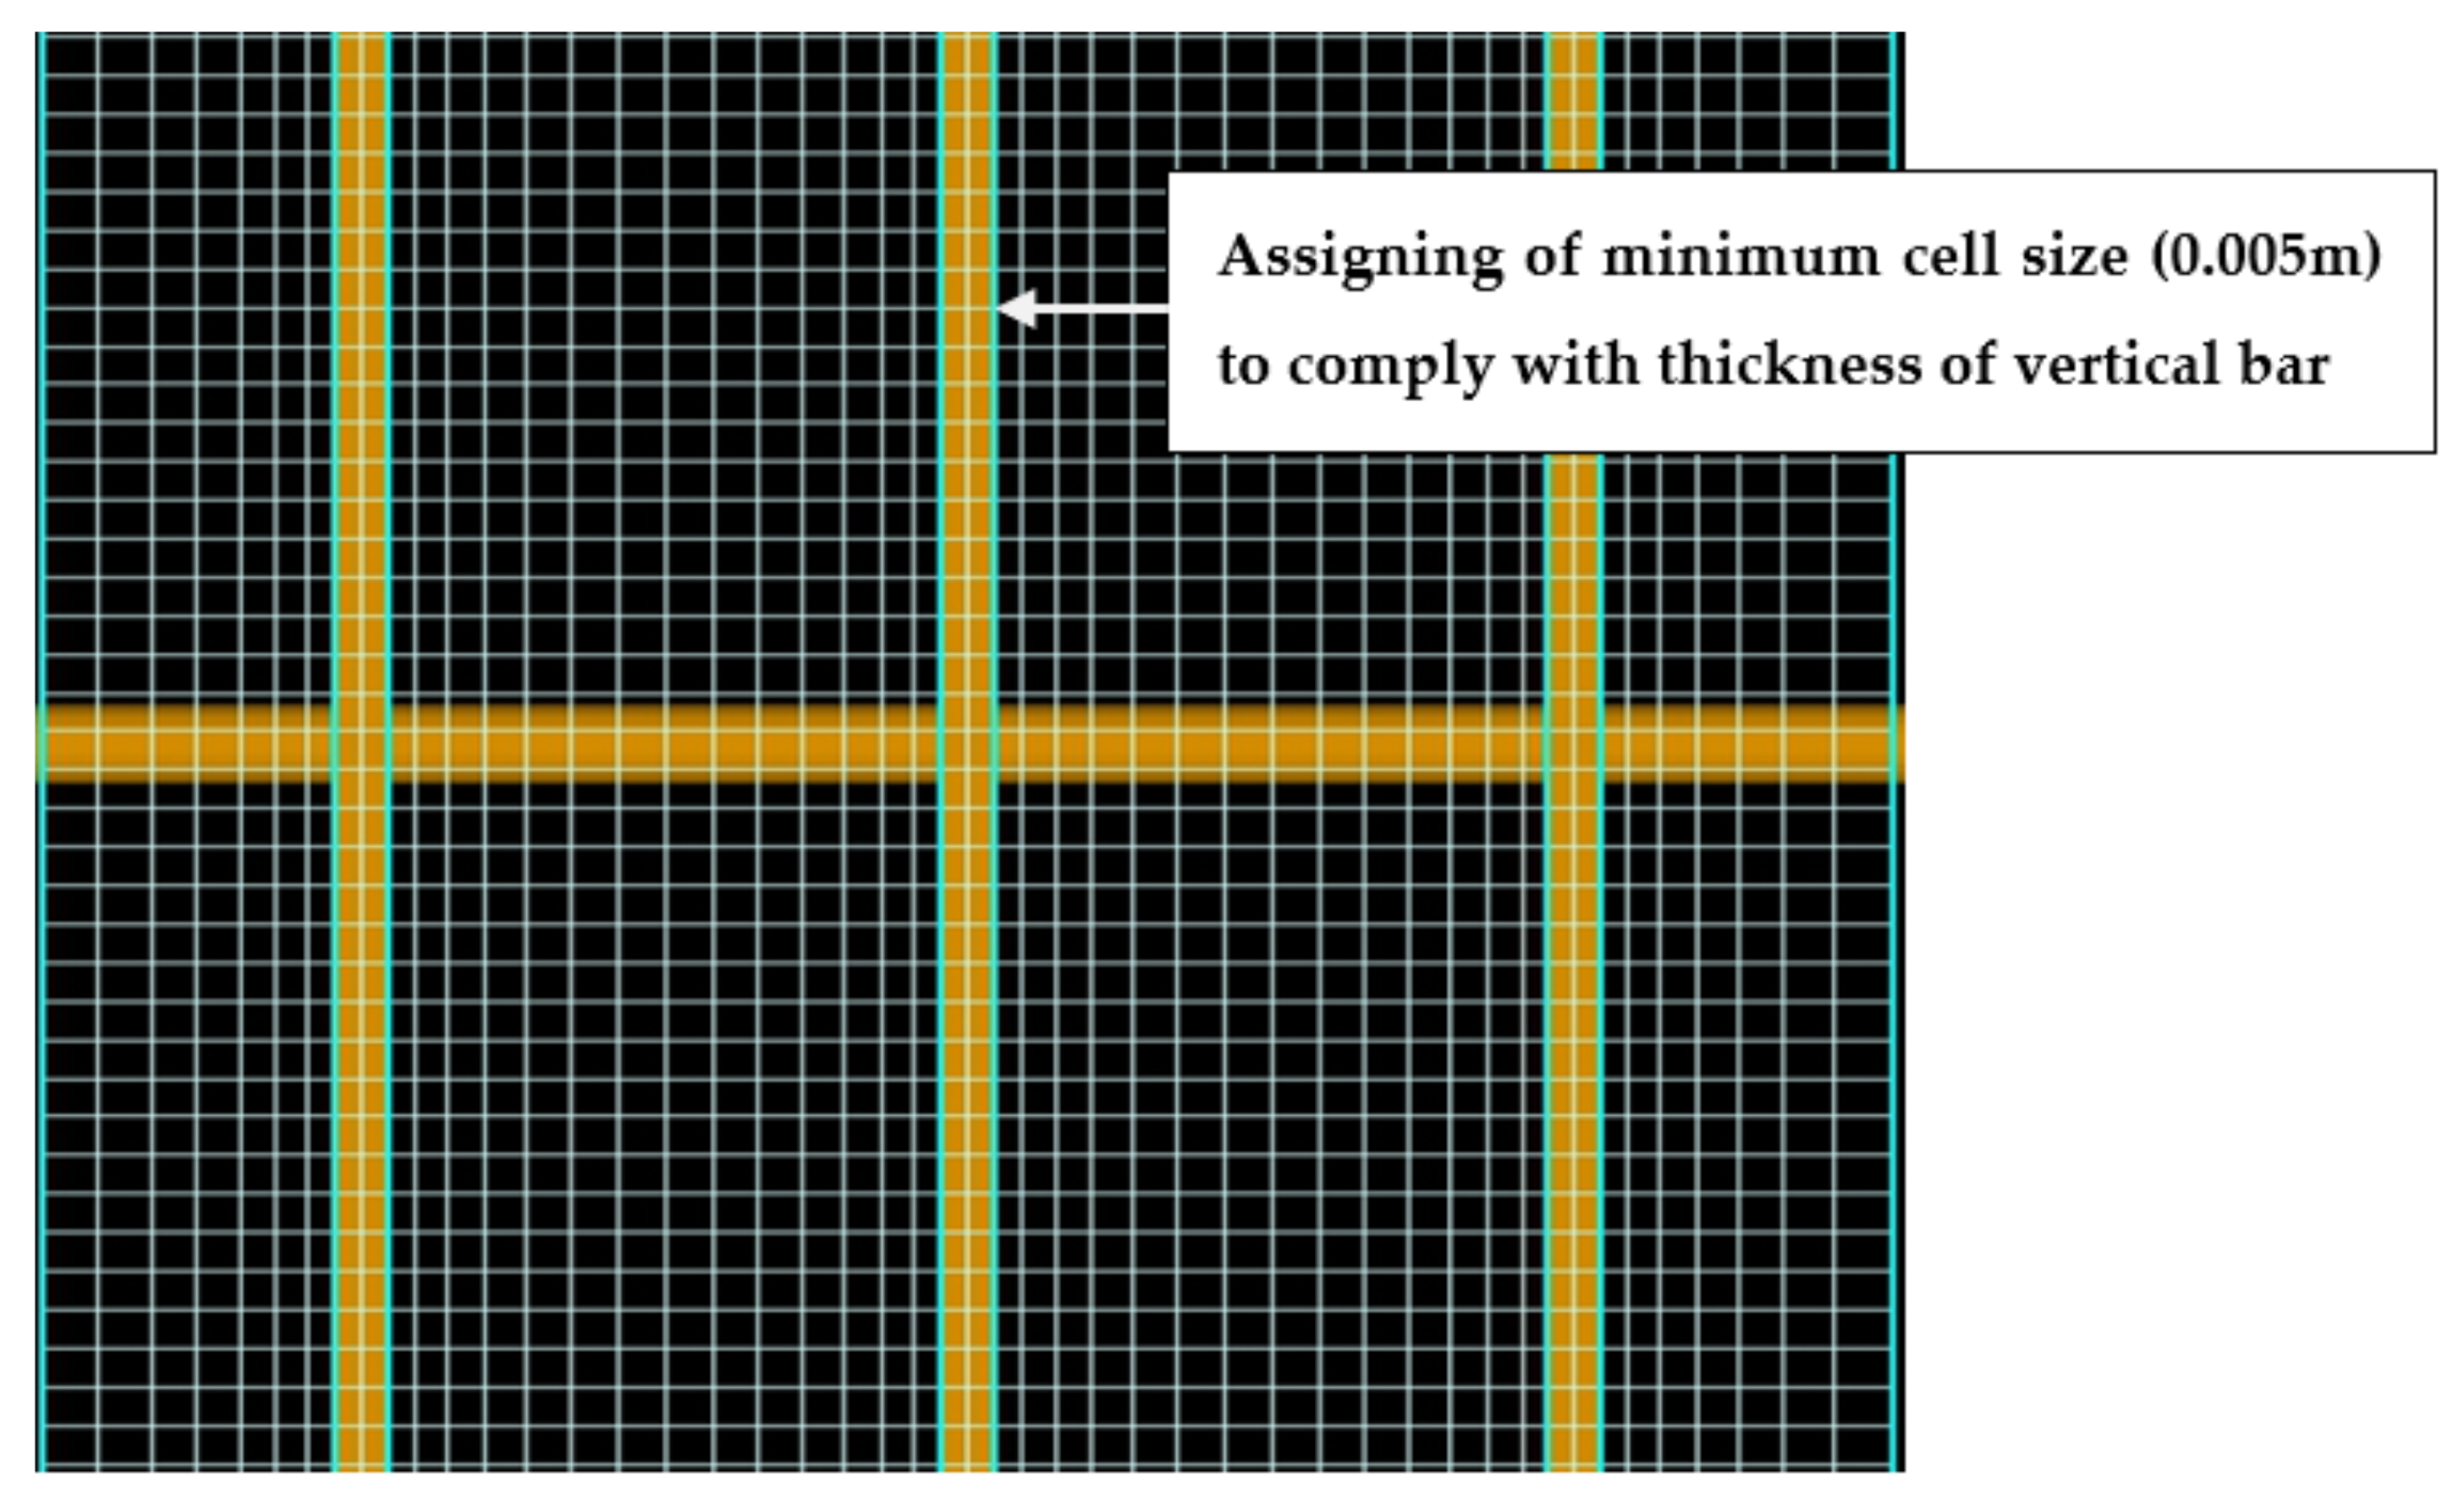
5.1. Sensitivity Analysis for Grid Size

Simulations were initially run with a grid size of 0.3 m in X, Y, and Z directions. The grid size was then reduced to 0.2 m, 0.1 m, and 0.2 m in X, Y, and Z direction, respectively, to investigate the grid size effect on model results for a validation process. After validation, the mesh domain was reduced to a part of the trash racks panel, such as to assimilate the blockage ratio of the complete unit of trash racks. Accordingly, minimum cell size was further reduced up to 0.005 m to ensure that the effect of 0.01 m thick bars is considered during scenario modeling for equation development (Figure 3).

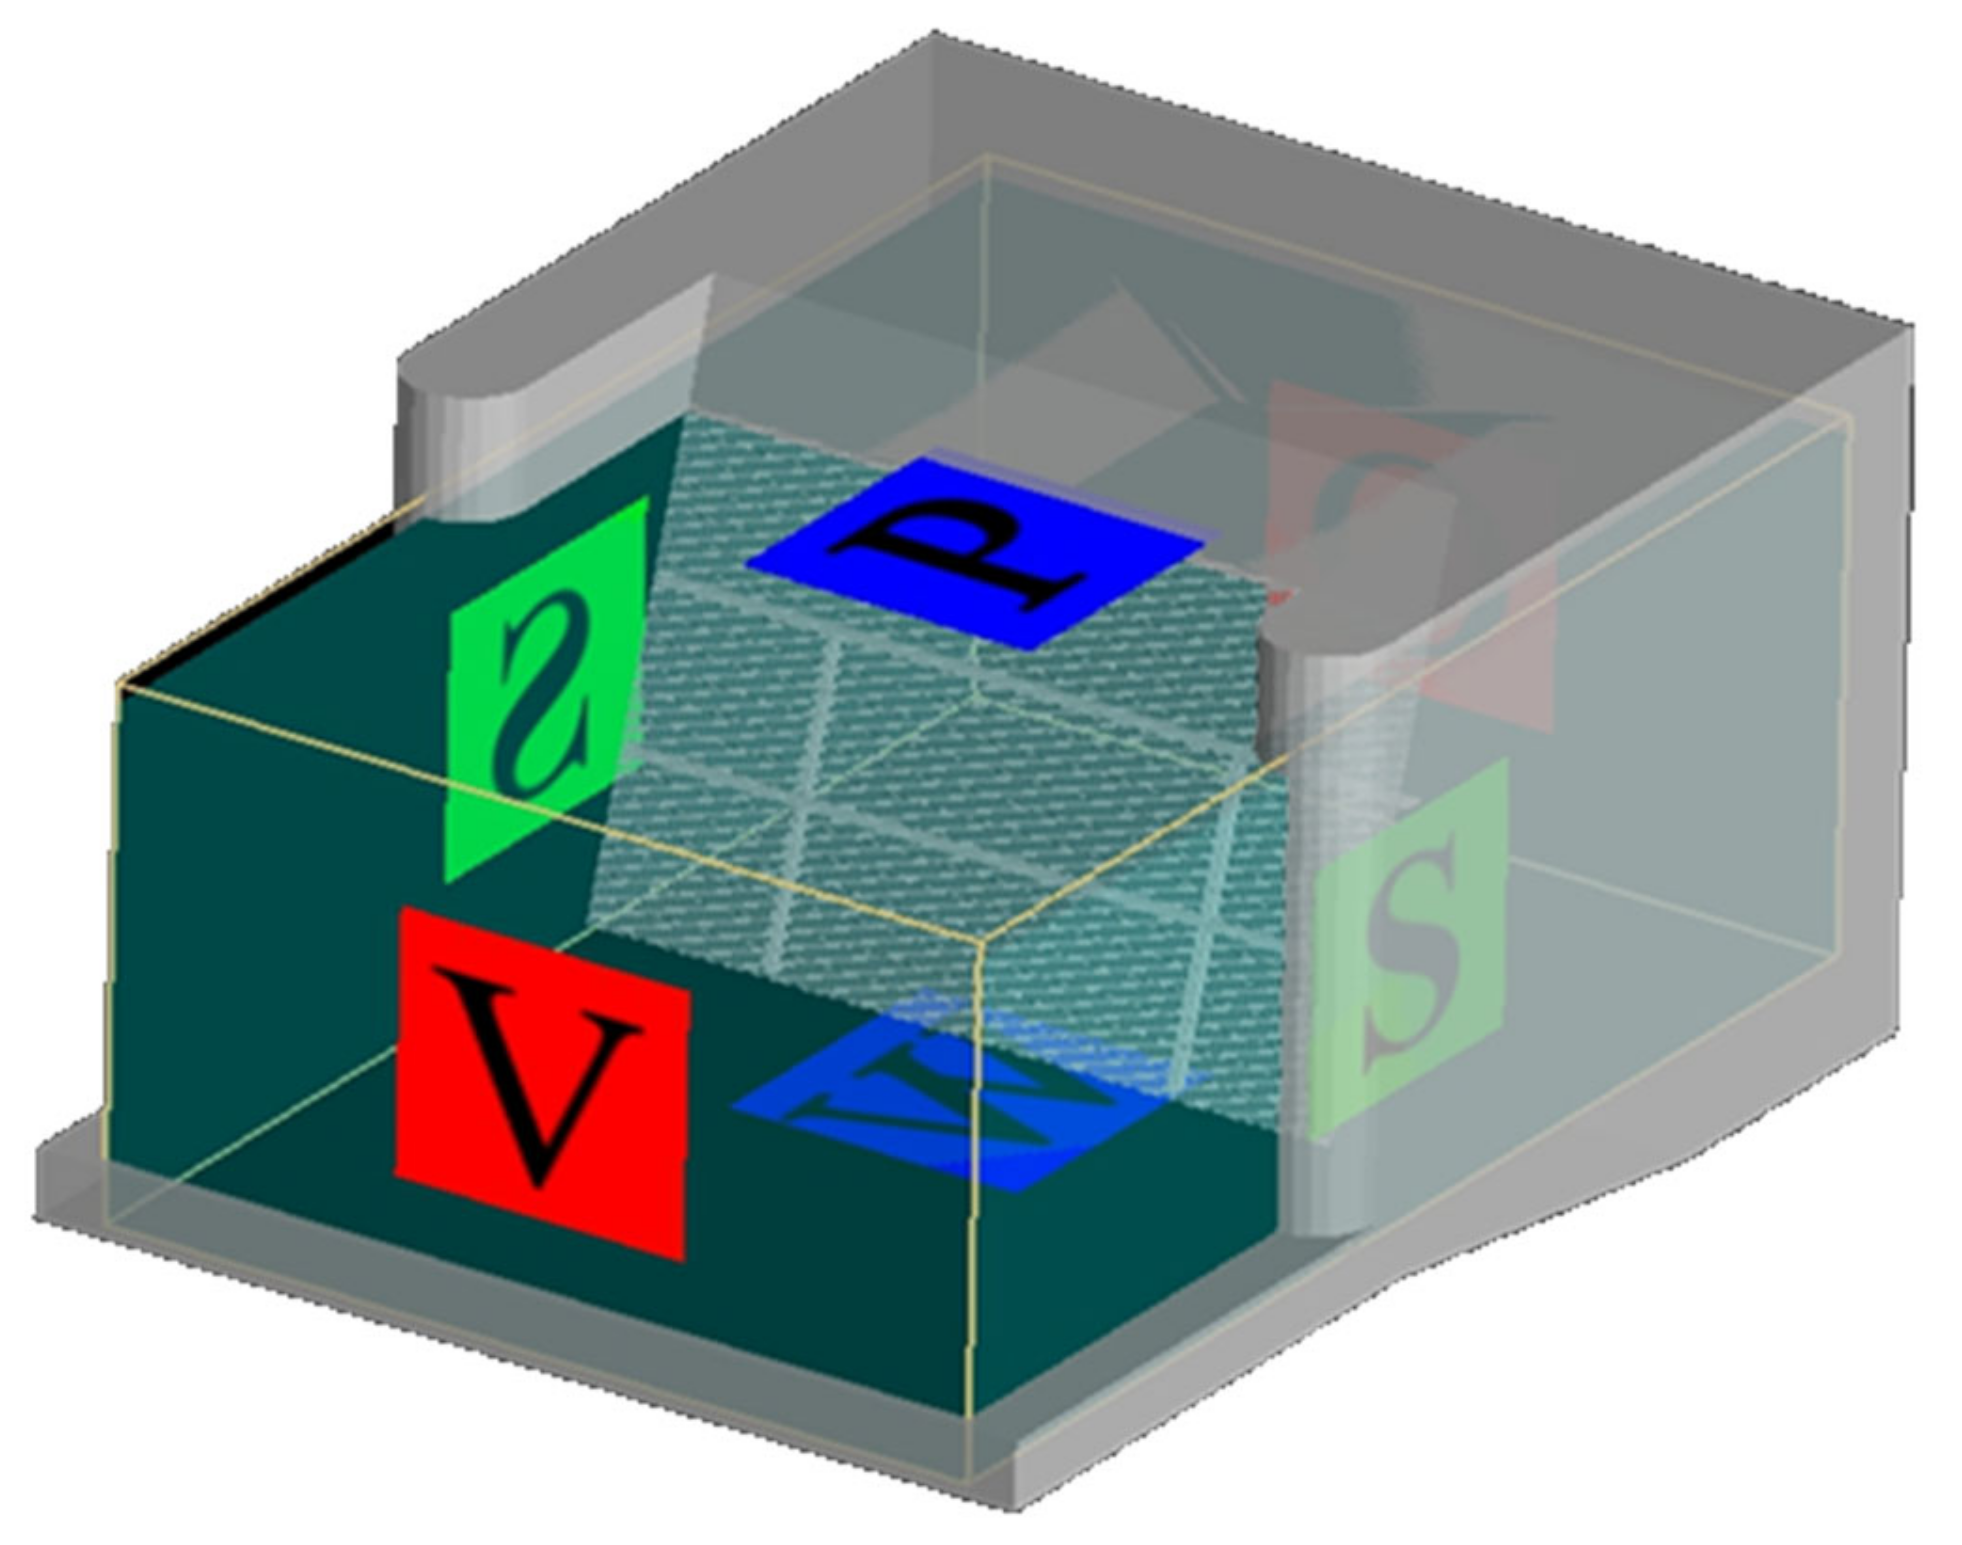
5.2. Sensitivity Analysis for Boundary Conditions

Sets of various boundary conditions (Table 1) were applied to simulations, considering the approach channel side as Xmin, downstream of trash racks as Xmax, and right and left side of the flow as the Ymin & Ymax, respectfully. To properly select and apply input and output boundary conditions of flow in Xmax and Xmin based on experimental studies, a stable flow with a certain height of the fluid through the trash racks should be introduced to the model. Hence, using boundary conditions existing in FLOW-3D, the fluid height for Xmin is applied with the boundary conditions of fluid height. It is fully in accordance with the model through which the results’ validation and calibration are performed. Moreover, Zmin is the floor and Zmax is the upper boundary of the flow domain. Chanel and Doering [52] indicated that boundary conditions should match the physical conditions of the problem. Considering this fact, among the different sets of tested boundary conditions, one of the sets (Figure 4) validated the model: Xmin as ‘Specified Averaged Depth Velocity’, Xmax as ‘Outflow’, Ymin & Ymax as ‘Symmetry’ to reflect the identical flows on another side of right and left boundaries, Zmin as ‘Wall’, and Zmax as the ‘Specified Pressure’ boundary.

5.3. Sensitivity Analysis to Turbulence Model

Simulations were carried out using Renormalization Group Turbulence (RNG) model, Two Equation k-ε model, and Two Equation k-ω model. Two equation k-ε model computes turbulent kinetic energy and its dissipation rate. In this way, it finds mixing length dynamically [53]. The most robust version of k-ε model is RNG model because it explicitly calculates the constant coefficient of k-ε model [54]. All these models bring about similar results. The RNG model, being robust and most accurate, was used for further simulations [55].

6. Model Validation

The accuracy of a numerical model depends upon the validation. True validation includes a comparison of model results with observed data [50]. Therefore, validation of the model was carried out in this study by comparing its results of total hydraulic head in approach channel, just upstream of trash rack, with actual water levels at the site against average approach velocity. Moreover, the roughness parameter used within the CFD model was 0.6 mm for concrete surface of intake structure. Overall hydraulic losses incorporate surface roughness (from drag) and turbulence losses.

6.1. Scenario Modeling

After validation, the model was simplified to three rack bars. These racks bars were subjected to several simulations by employing the cell size up to 0.005 m and encompassing the blockage ratio of the complete unit of trash racks. Six different values of approach velocity were used for these simulations: 0.5 m/s, 0.6 m/s, 0.7 m/s, 0.8 m/s, 0.9 m/s, and 1 m/s. Spacing between trash racks bars, an inclination angle of racks with channel bed, and blockage ratio was considered as the variable parameters in this study. A total of 48 numbers of simulations were performed. A total of 40 data points (training data) out of 48 were then employed to formulate an empirical relation for the head loss through trash racks and the other 8 data points (testing data) were utilized for validation of the derived equation.
Scenario modeling was grouped into three categories to investigate the effects of changing parameters on head loss. Simulations in ‘category 1’ were performed to investigate the effects of change in clear spacing between bars (s) and consequent effects of varying blockage ratios (p) for different approach velocities. The trash racks geometry in the existing condition was reformed to three different geometries with a clear spacing of 0.05 m, 0.075 m, and 0.125 m. The effects of inclination angle (α) of the trash racks from channel bed were investigated for different approach flow velocities in ‘category 2’. The trash racks angle in the existing condition was reformed to three different inclination angles (α) i.e., 60°, 70°, and 80°. The effect of blockage ratio (p) was investigated for different approach flow velocities in category 3. Table 2 summarizes these categories.
Figure 5a shows the water way between bars named as clear spacing, whereas Figure 5b defines inclination angle as the angle of rack bar with channel bed. Variable blockage ratio (p) shown in Table 2 is expressed as the total area perpendicular to flow blocked by rack bars, compared to the total area, i.e., ratio between the area of rack bars and the area of entire trash rack.
The generally used empirical relation for computation of head loss is given below:
Δ h = Δ h c × v 2 2 g
where as in Equation (3), Δ h is the head loss, Δ h c is the head loss coefficient, v is the velocity of approaching flow, and g is the gravitational acceleration. Equation (4) indicates that head loss coefficient Δ h c is the function of factors that were analyzed to study the effect on head loss.
Δ h v 2 2 g = f   ( s ,   α ,   p )
In Equation (4), “s” is the clear spacing between bars, “α” is the inclination angle of the trash racks with channel bed, and “p” is the blockage ratio. Equation (4) was used for the derivation of empirical relation for head loss computation considering the impact of clear spacing between trash racks bars, inclination angle, and blockage ratio.

6.2. Development of Equation for Head Loss through Trash Racks

To develop an equation for the estimation of head loss through trash rack, multiple regression analysis was performed. Initially, a table was developed, enlisting results obtained from CFD model simulations along with their corresponding inputs and independent and dependent variables. Afterward, different combinations of independent variables were made to establish the candidate terms for multiple regression analysis.
On the derivation of the new equation from regression analysis, the equation was subjected to a validation process, using the testing data. Results of FLOW-3D and from the newly derived equation were then collectively compared with already published equations for trash racks loss computation. Equations of Kirschmer [27], USBR [30], Orsborn [10], Fellenius [9], and Escande [28] shown in Table 3 were used for this comparison. Mean relative error (MRE) was also calculated to quantify the error of each comparison.

7. Results and Discussion

7.1. Model Validation

Sensitivity analysis led to the validation of the model. Hydraulic head (water level) and water depth were observed at design discharge of Nandipur hydropower station. These measurements were observed from gauges installed in approach channel. At the site it was impossible to observe the total head just downstream of the trash rack during plant operation. Therefore, the model was validated only using upstream hydraulic head (water level) and water depth. CFD simulation resulted in 8.6 m flow depth compared to the actual depth of 9.4 m, corresponding to the actual approach velocity. The relative error in comparison of results up to 10% is considered acceptable as per different CFD model studies conducted across the globe [52,56,57]. All results shown in Table 4 are within the acceptance range of 10%, indicating a good correlation.

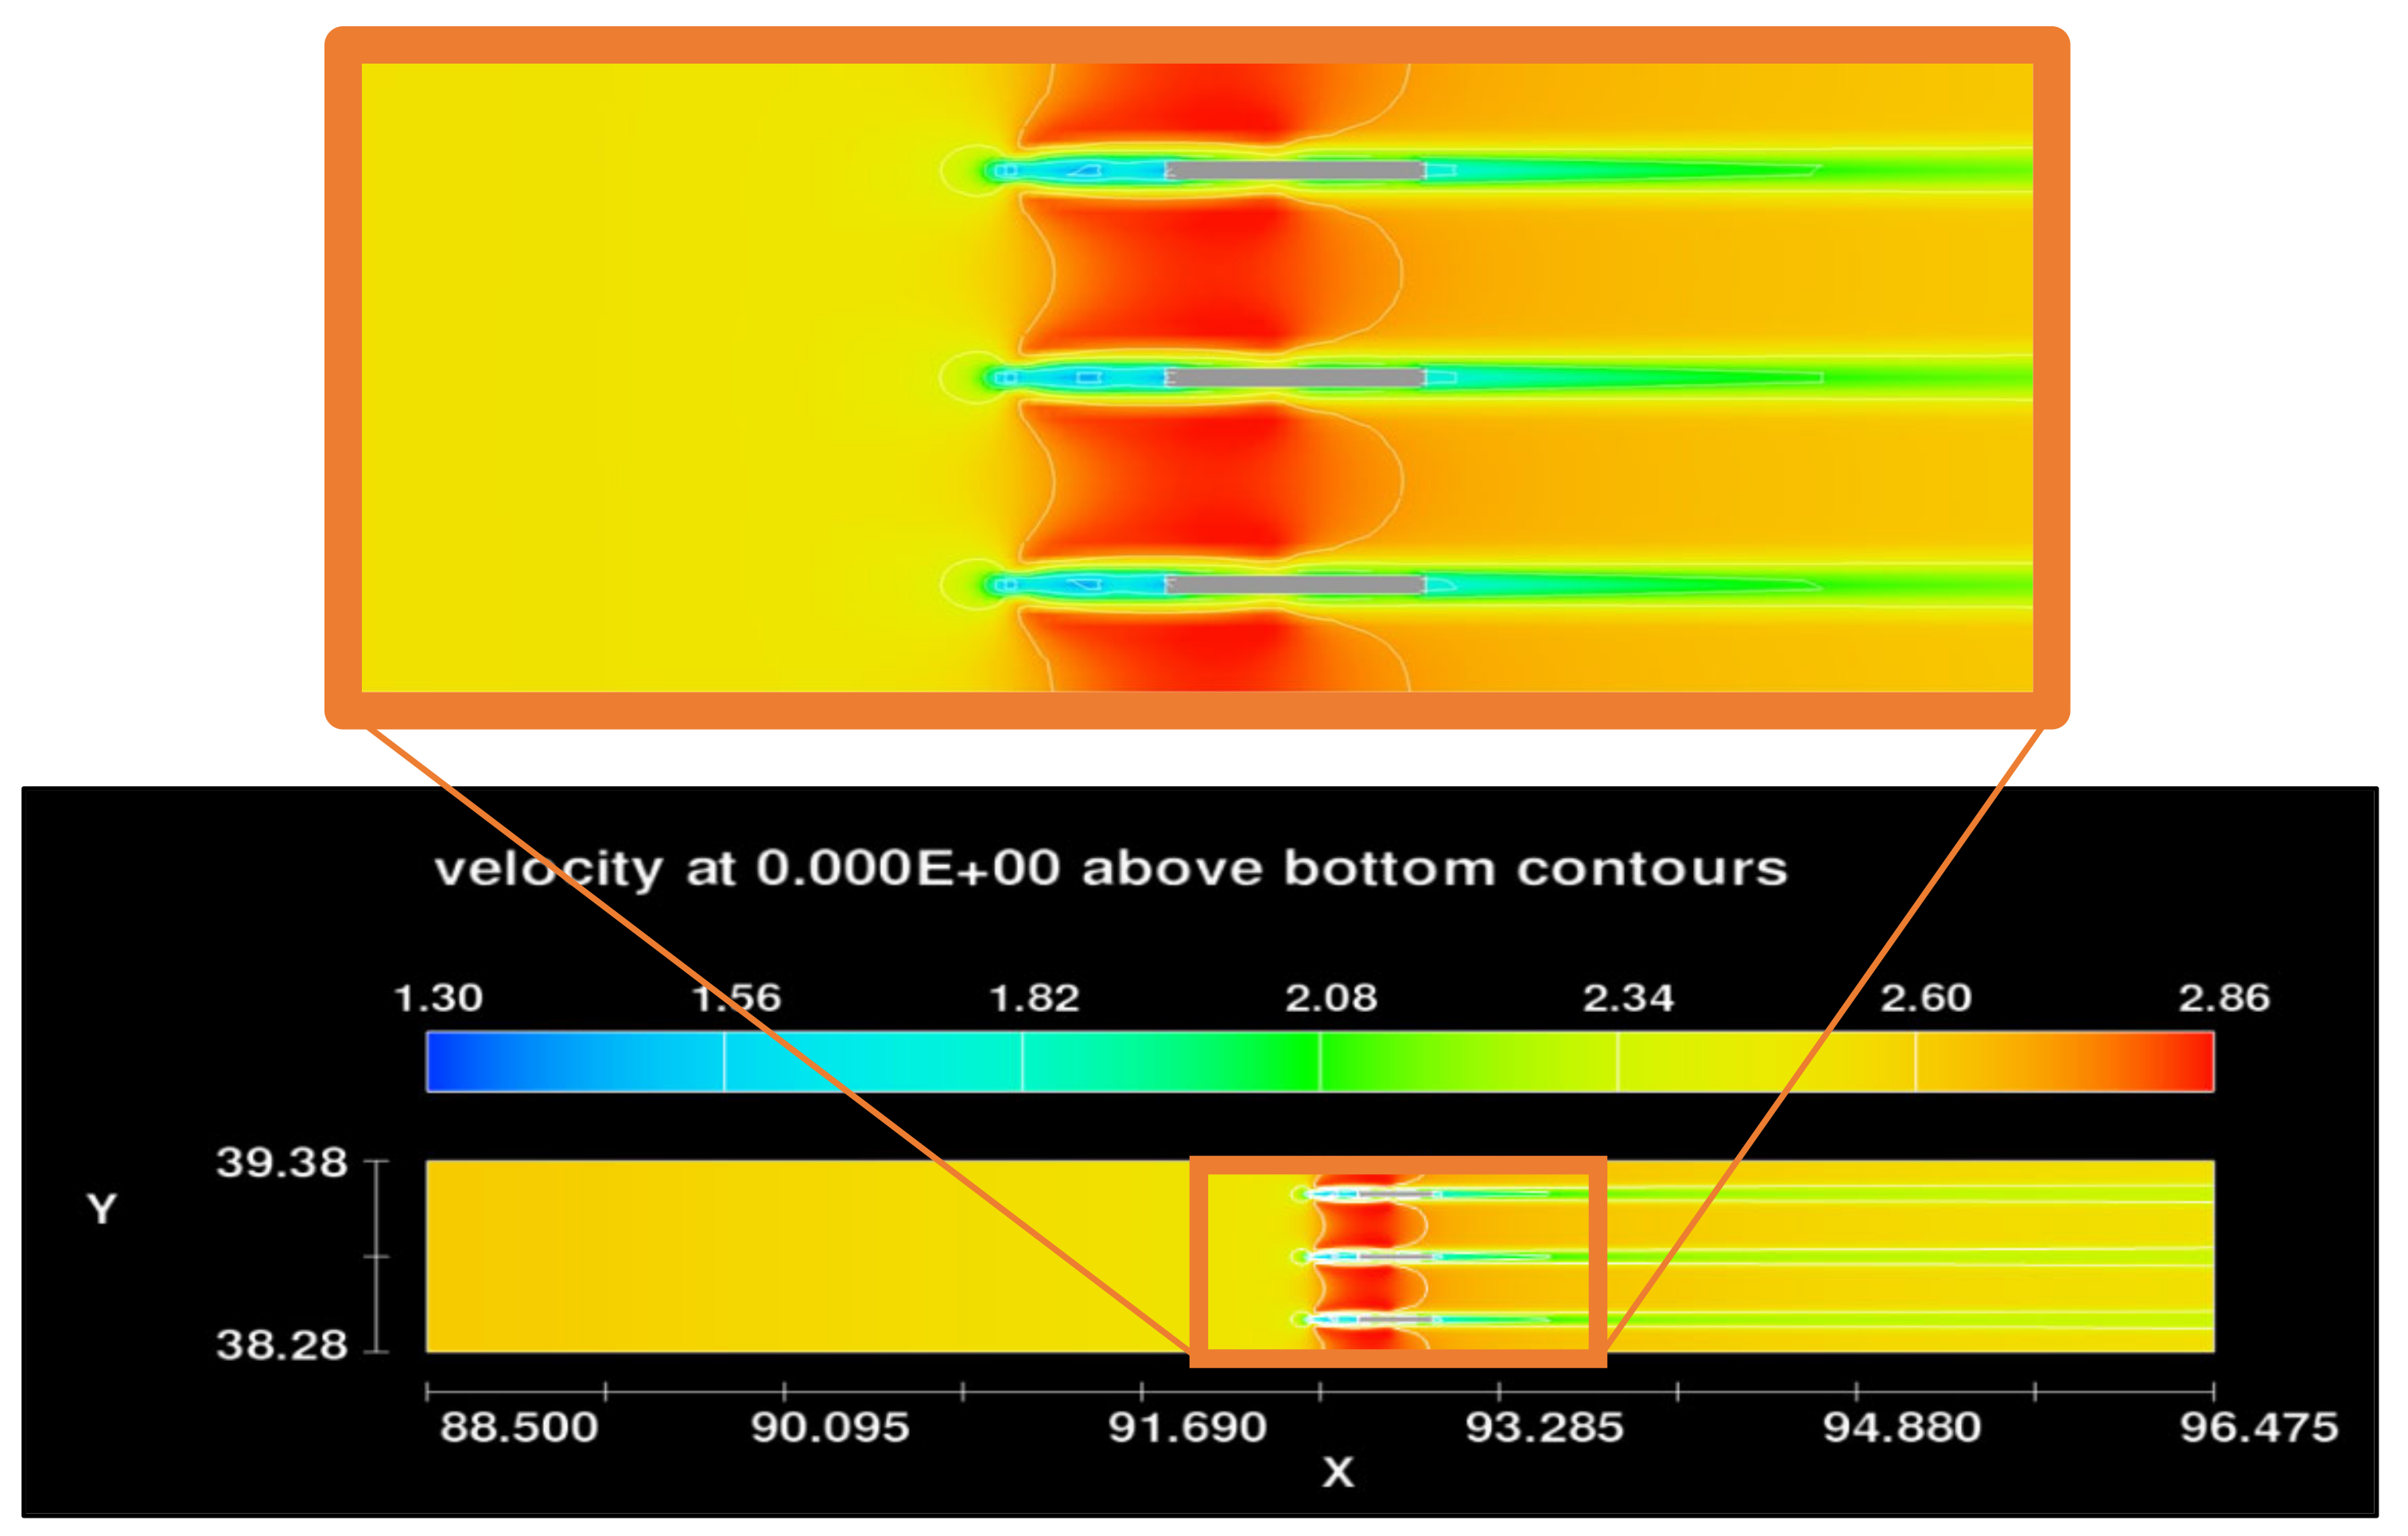
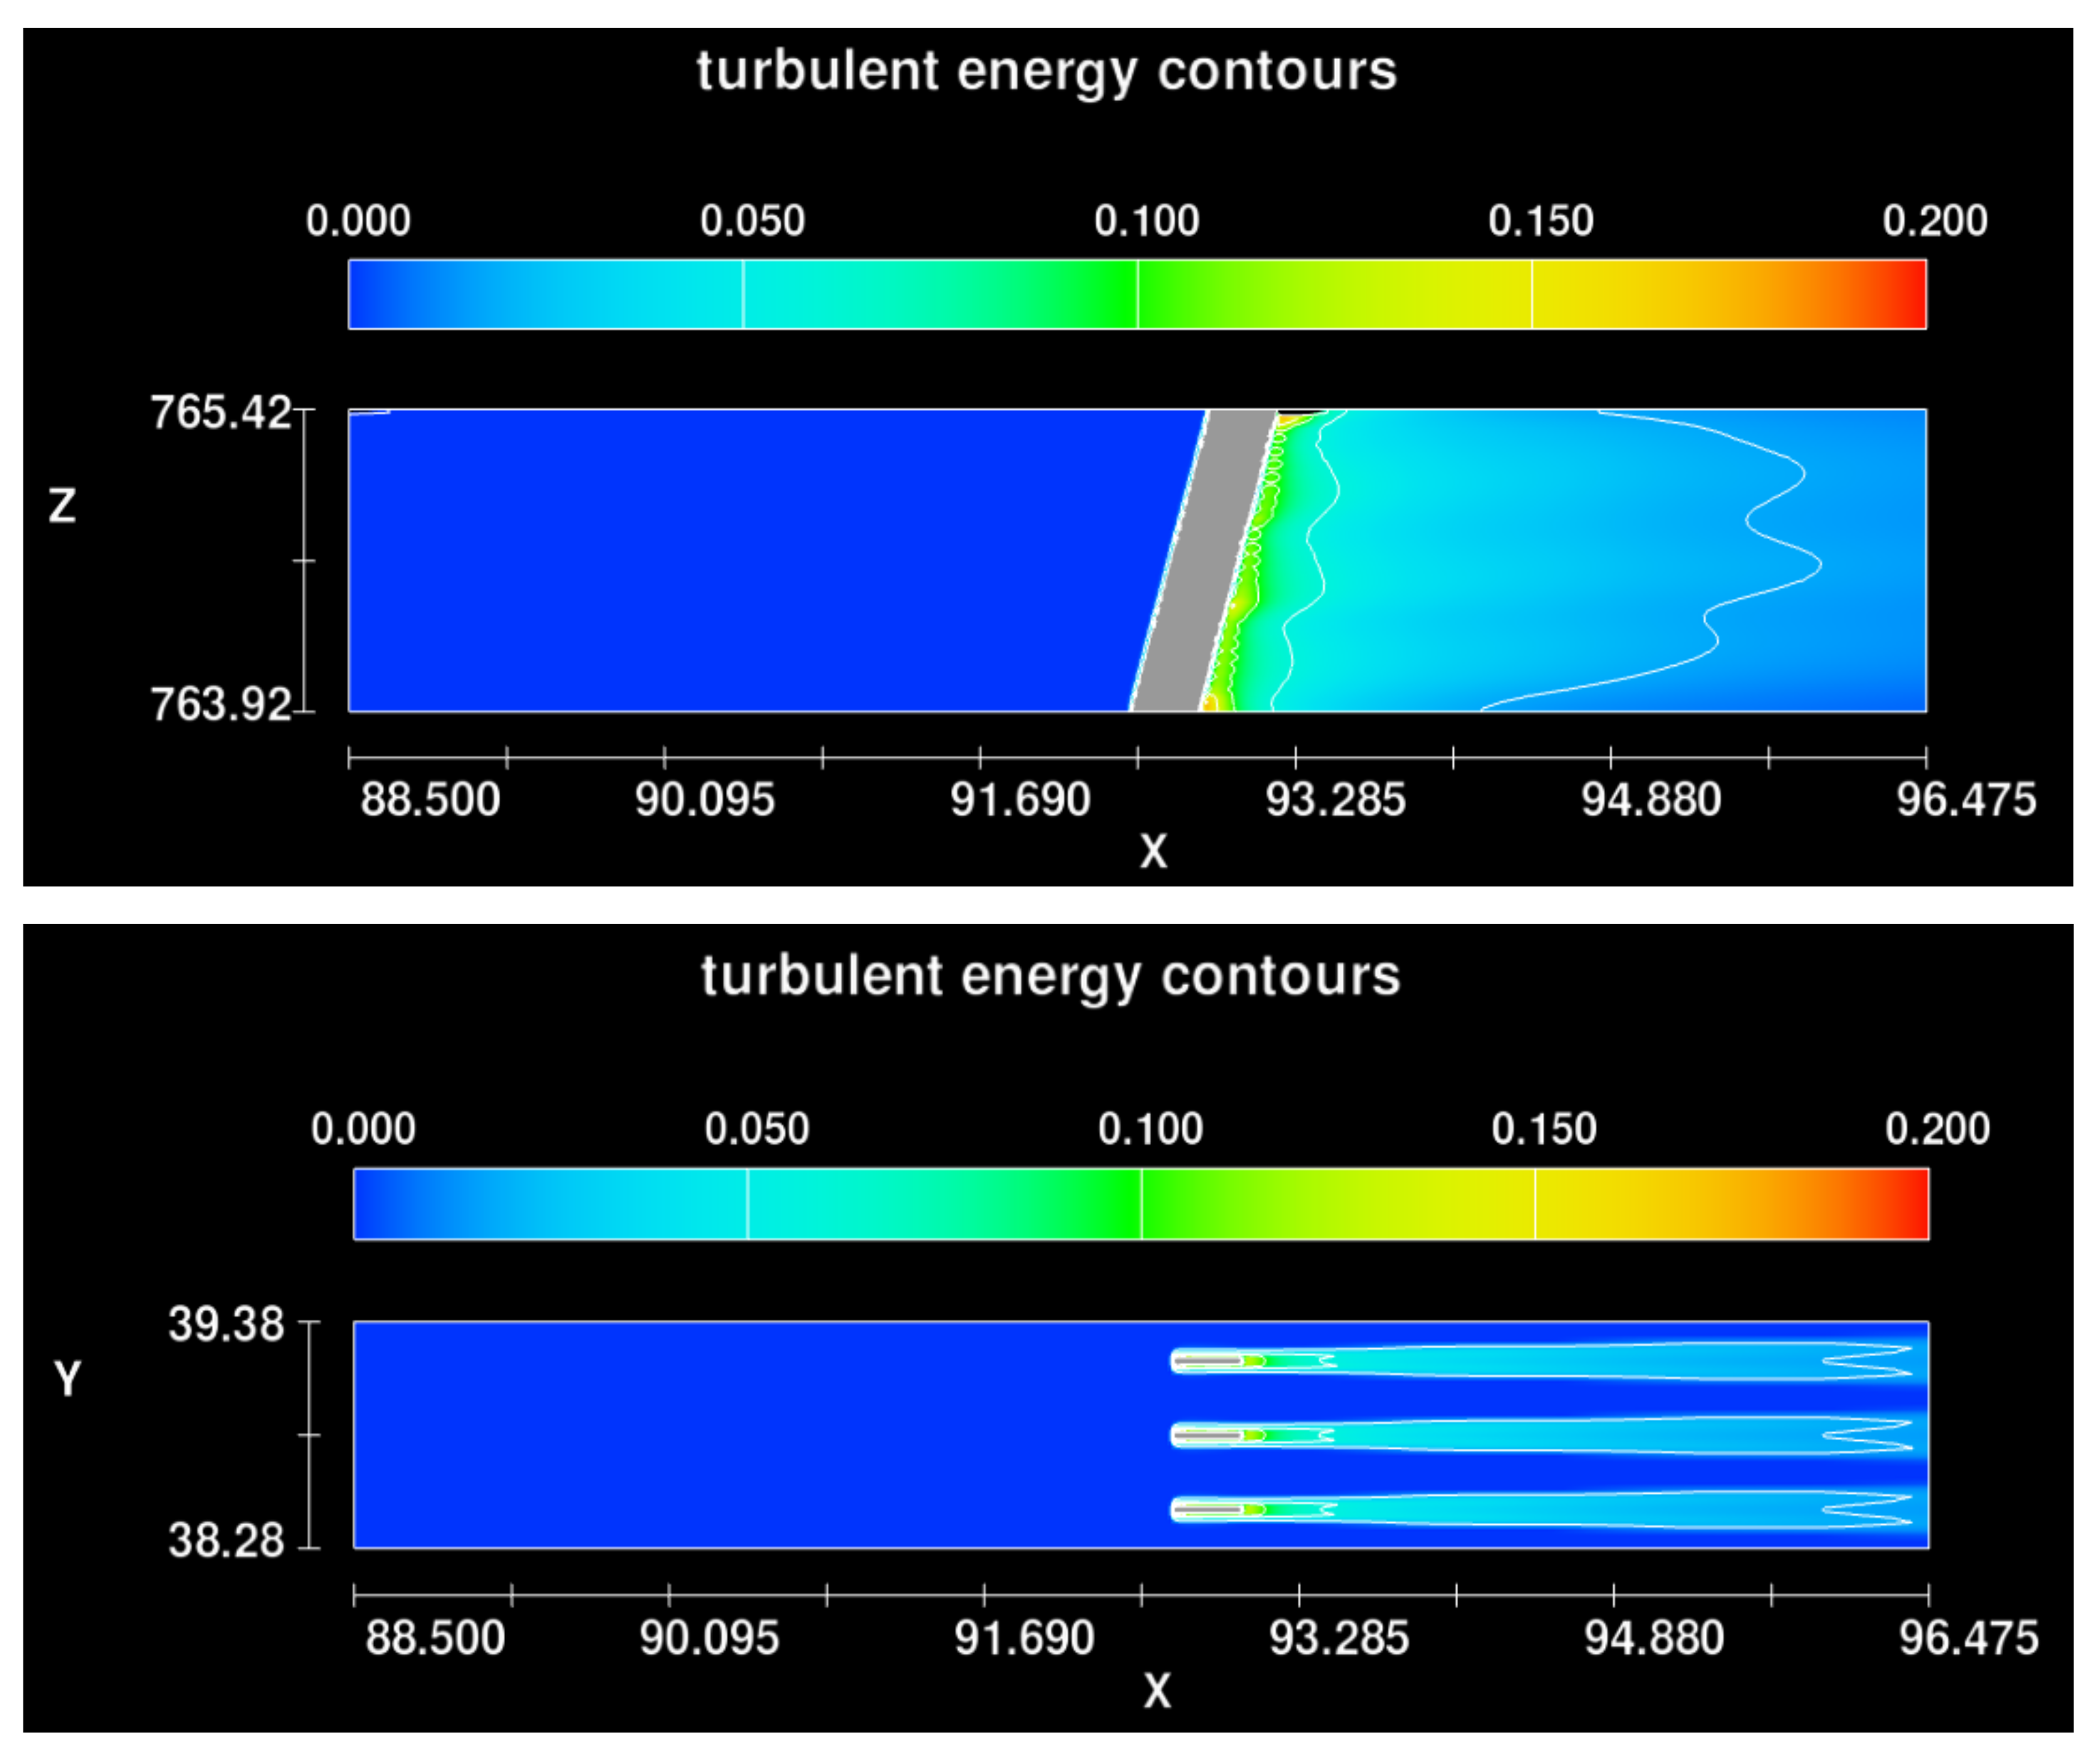
7.2. Flow Characteristic through Rack Bars

The flow characteristics through rack bars were studied considering two planes i.e., plane 1, along the mid-point of clear spacing between two rack bars, and plane 2, along the periphery of rack bars. Along plane 1, as the area of flow decreases in between rack bars, velocity increases to maximum when flow passes through the center of clear spacing in between rack bars and it starts decreasing towards the downstream end. Along plane 2, velocity decreases at the leading edge of the rack bar and then gradually increases towards the downstream end. These observations are shown in Figure 6. All measurements/computed values shown in Figure 6 are in the FPS system.
Table 5 shows variation in head loss with velocity for exiting parameters of trash racks at Nandipur hydropower station, Pakistan. It is clear from the results that head loss through trash racks increases with the increase in approach velocity. Turbulent characteristics of the flow near rack bars were observed through turbulent energy contours. Contour plots (Figure 7) indicate that the regions of extremely high turbulence levels are close to the rack bars, which become low as flow moves further downstream. All measurements/computed values shown in Figure 7 are in FPS system.

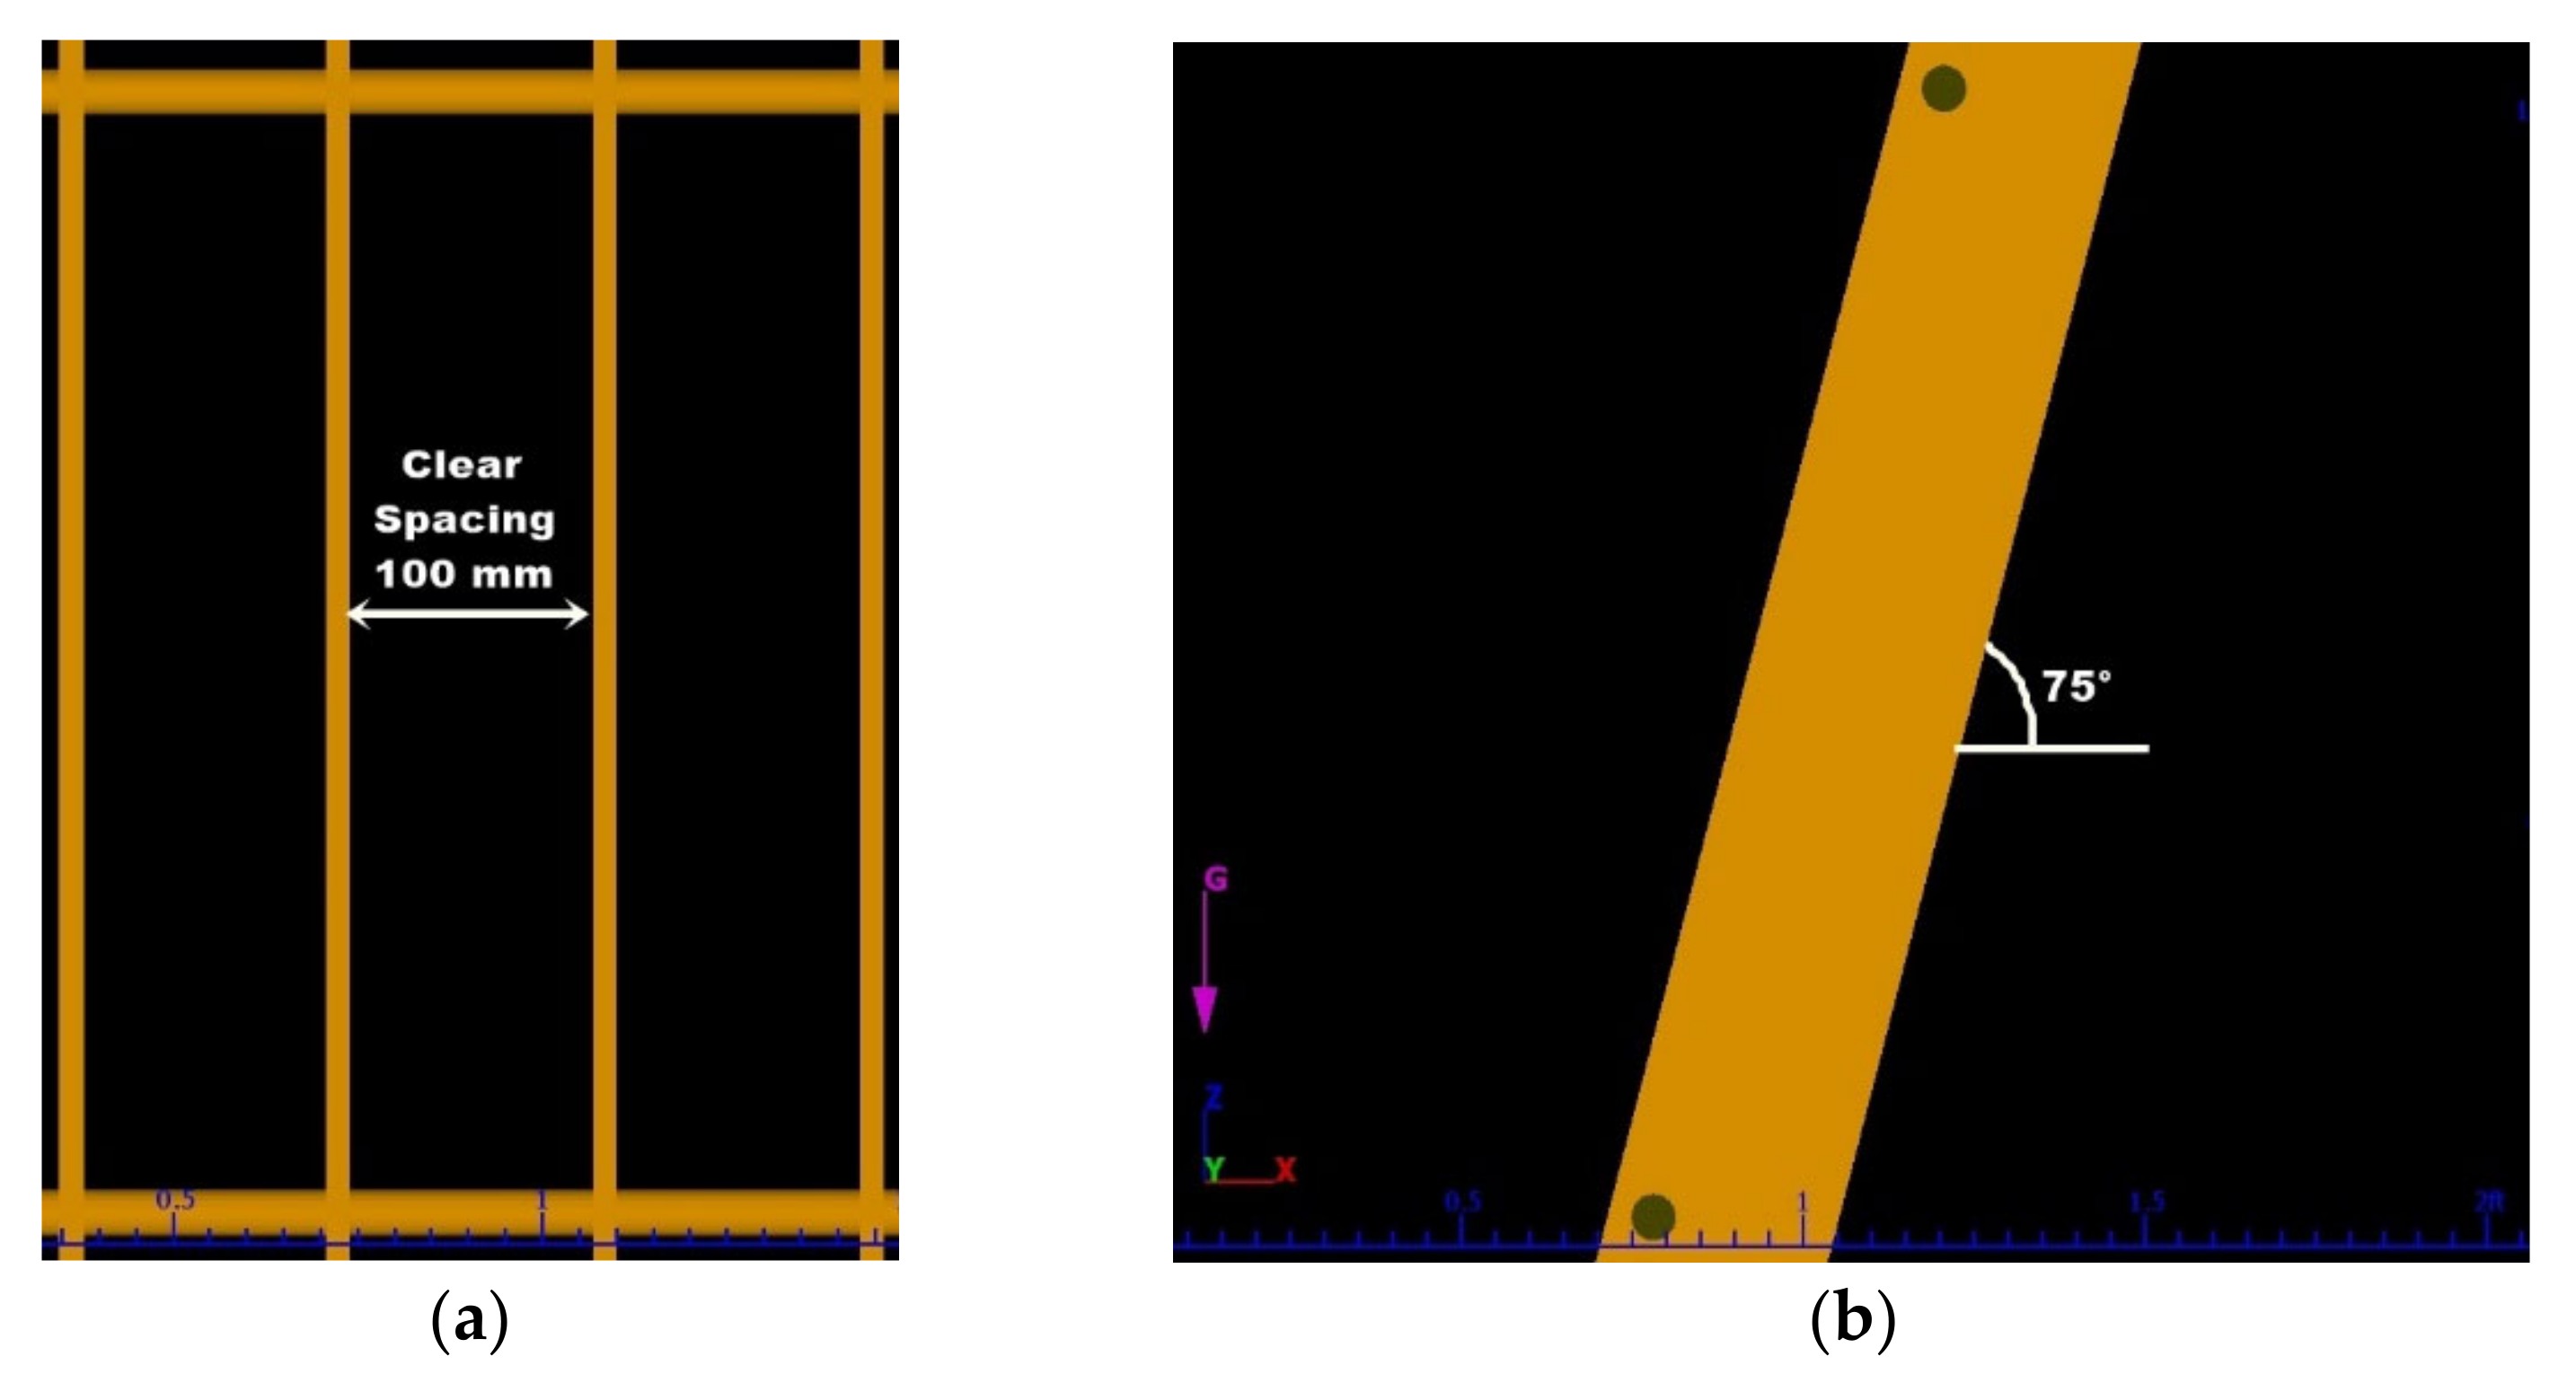
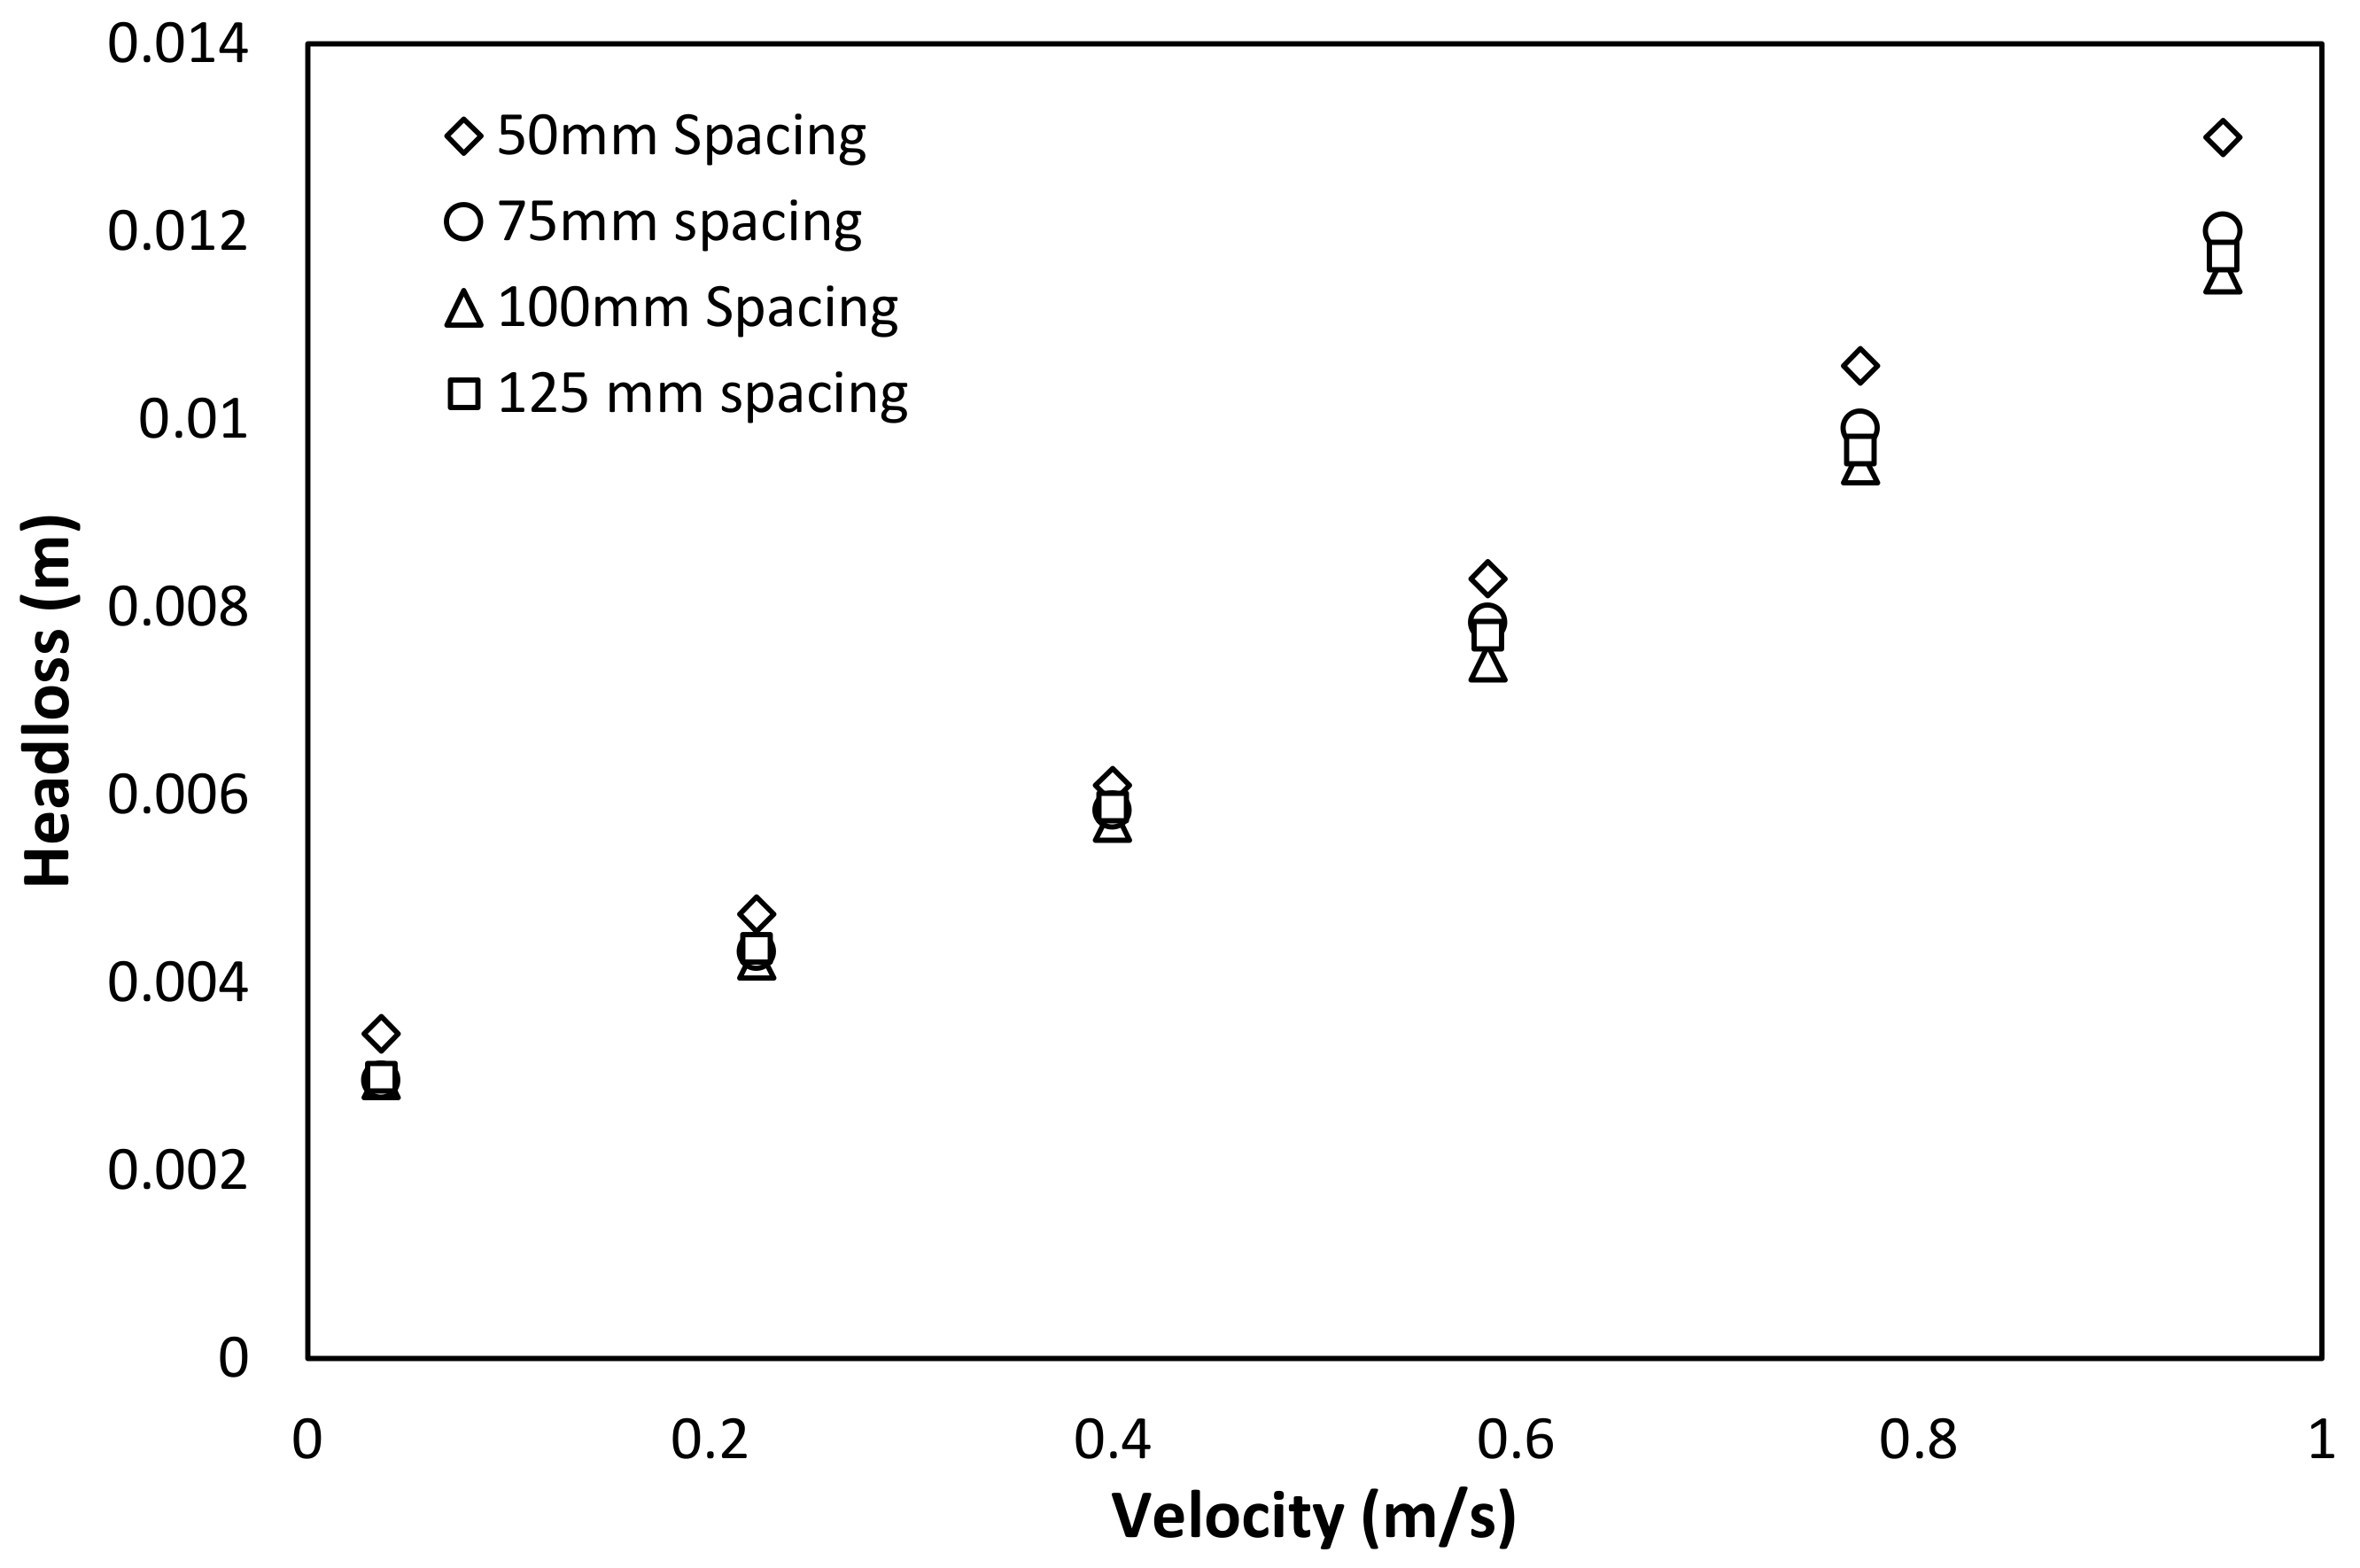
7.2.1. Impact of Bar Spacing (Category-1 of Scenario Modeling)

For equivalent approach velocities, the rack bars with a spacing of 0.05 m caused greater head losses as compared to trash bars with clear spacing of 0.075 m, 0.1 m, and 0.125 m (Figure 8). Increased blockage ratio because of reduced spacing between bars aggravated the head loss. It indicates that relation between bar spacing and blockage ratio is exponential. That is why bars with a spacing of 0.05 m exhibited considerable head loss.
The simulations for the clear spacing of 0.1 m and 0.125 m provided almost comparable results. It shows that rack bars do not induce greater impact to the flow beyond 0.1 m spacing of racks bar. The simulation results exhibited the similarity for clear spacing of 0.075 m and 0.1 m at lower velocities and displayed a slight disparity between results for higher velocities. In this case, head loss coefficients (Δhc>) varied between 0.23 and 0.26.

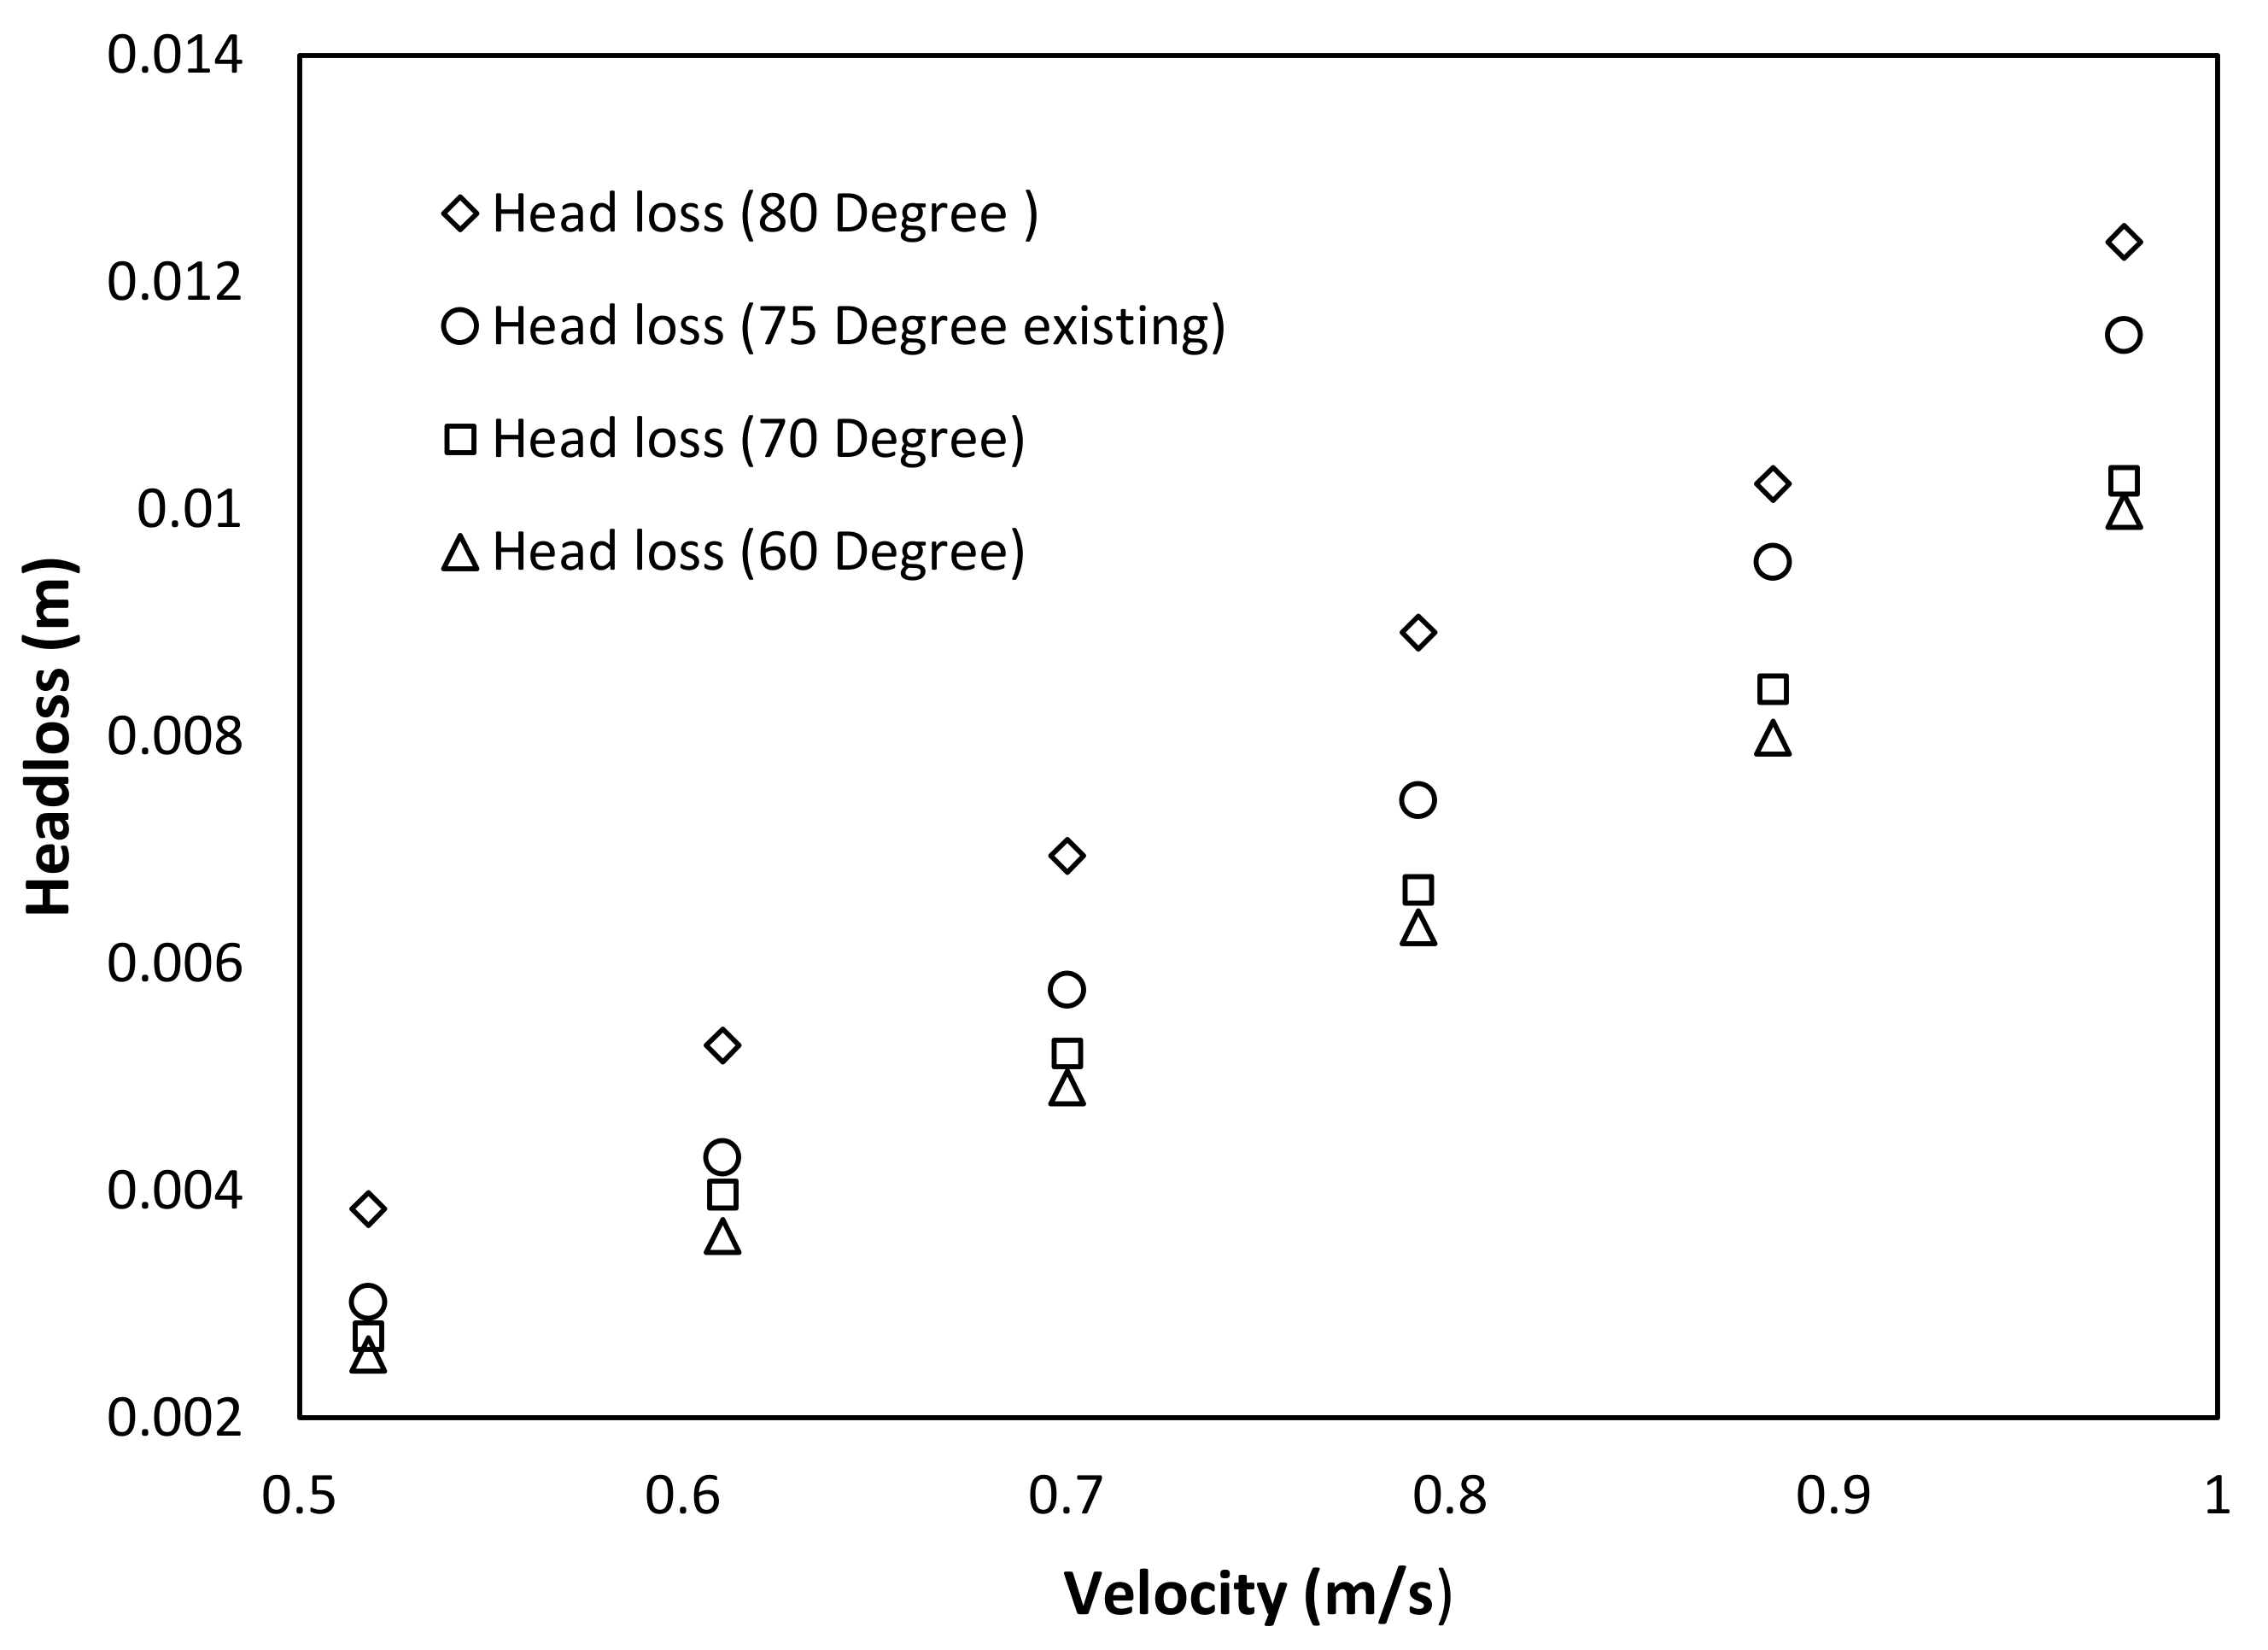
7.2.2. Impact of the Inclination Angle of Bars (Category-2 of Scenario Modeling)

The results indicated that racks with more inclination to vertical caused less head loss than rack bars with smaller angles (Figure 9). It showed that head loss is directly proportional to the inclination of racks with channel beds. For equivalent approach velocities, 80° inclination of rack bars with channel bed caused greater head losses. The trash racks in an existing condition with 75° inclination with channel bed also exhibited large values of head losses when compared with results of other simulations for bar angle of 60° and 70°. The simulations with bar angles of 60° and 70° somewhat resulted in the close values of head loss. Whereas head loss coefficient (Δhc) varied between 0.20 and 0.27. The change in inclination of trash racks, however, does not alter the blockage ratio for any of the simulated arrangements. It implies that inclination angle is itself an influencing factor to induce the loss in head of approaching flow.

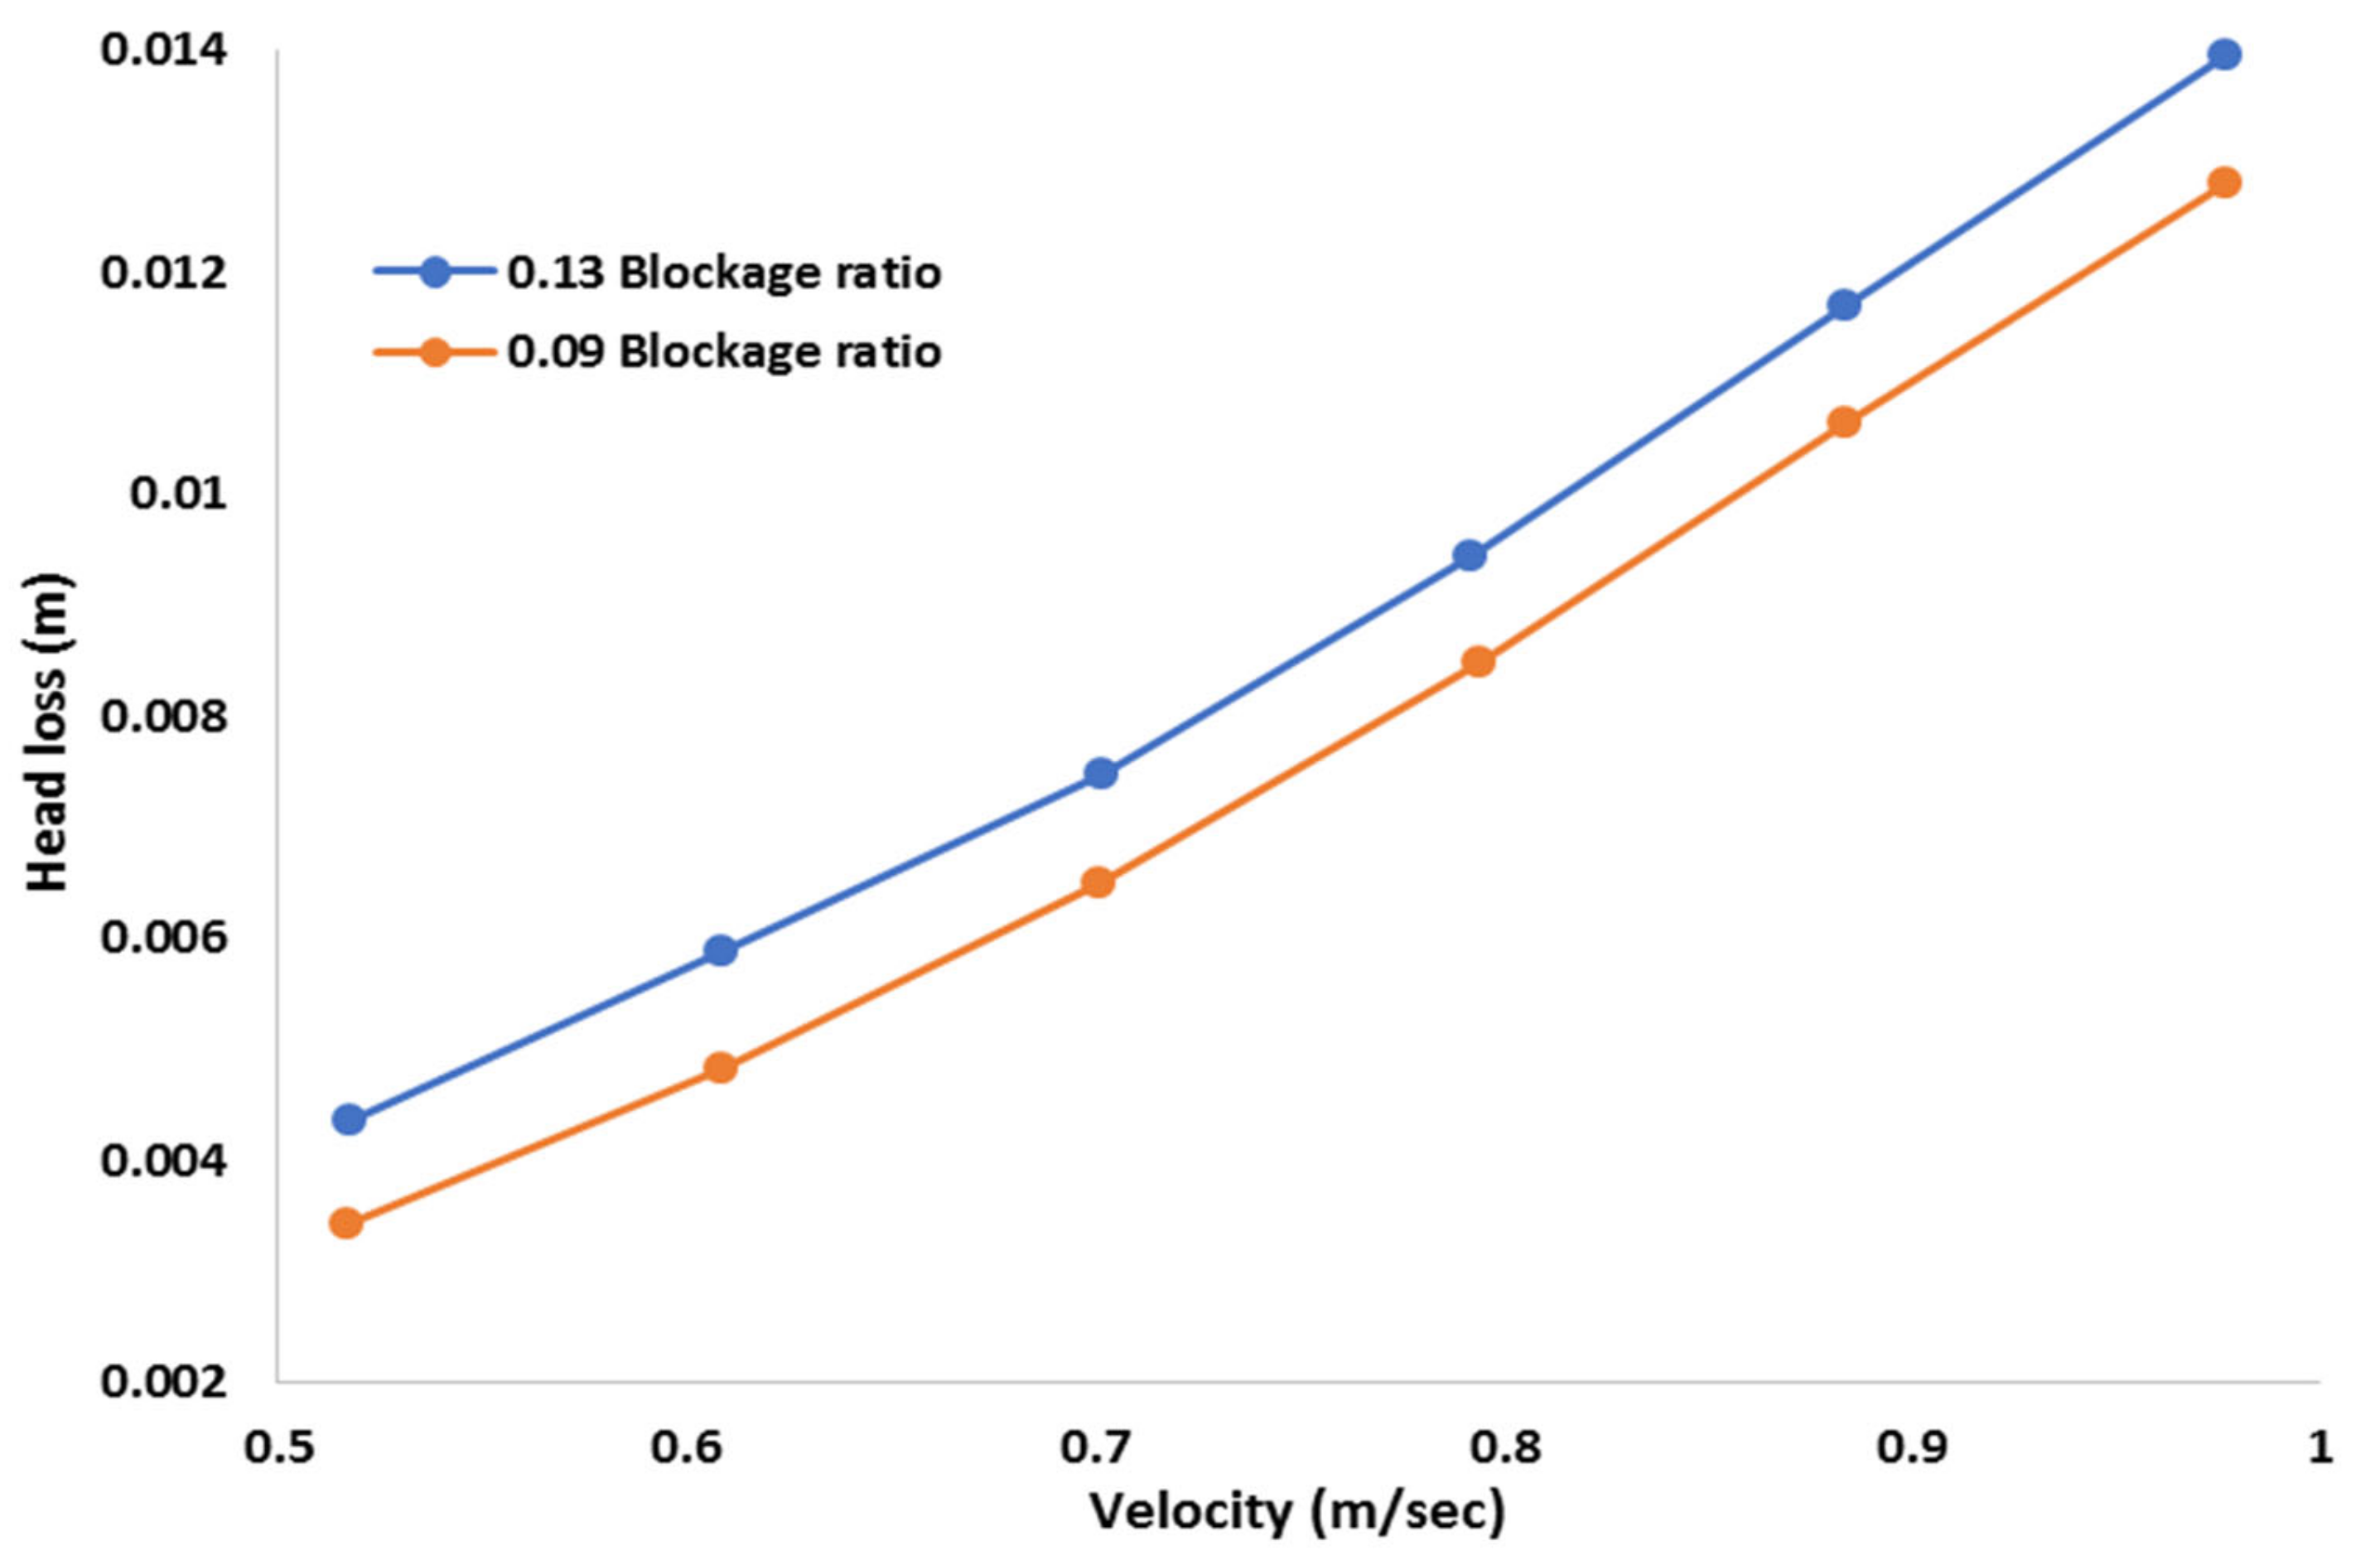
7.2.3. Impact of Blockage Ratio (Category-3 of Scenario Modeling)

The simulations in this category were performed to incorporate the effect of supporting horizontal bar. The results were then compared with trash racks geometry in the existing condition. The increased blockage ratio and higher approach velocity contribute immensely to the drop in the water level. Figure 10 shows that a blockage ratio of 0.13 leads to more head losses than with a blockage ratio of 0.09 (existing condition). Head loss coefficients (Δhc>), in this case, varied between 0.23 and 0.26.

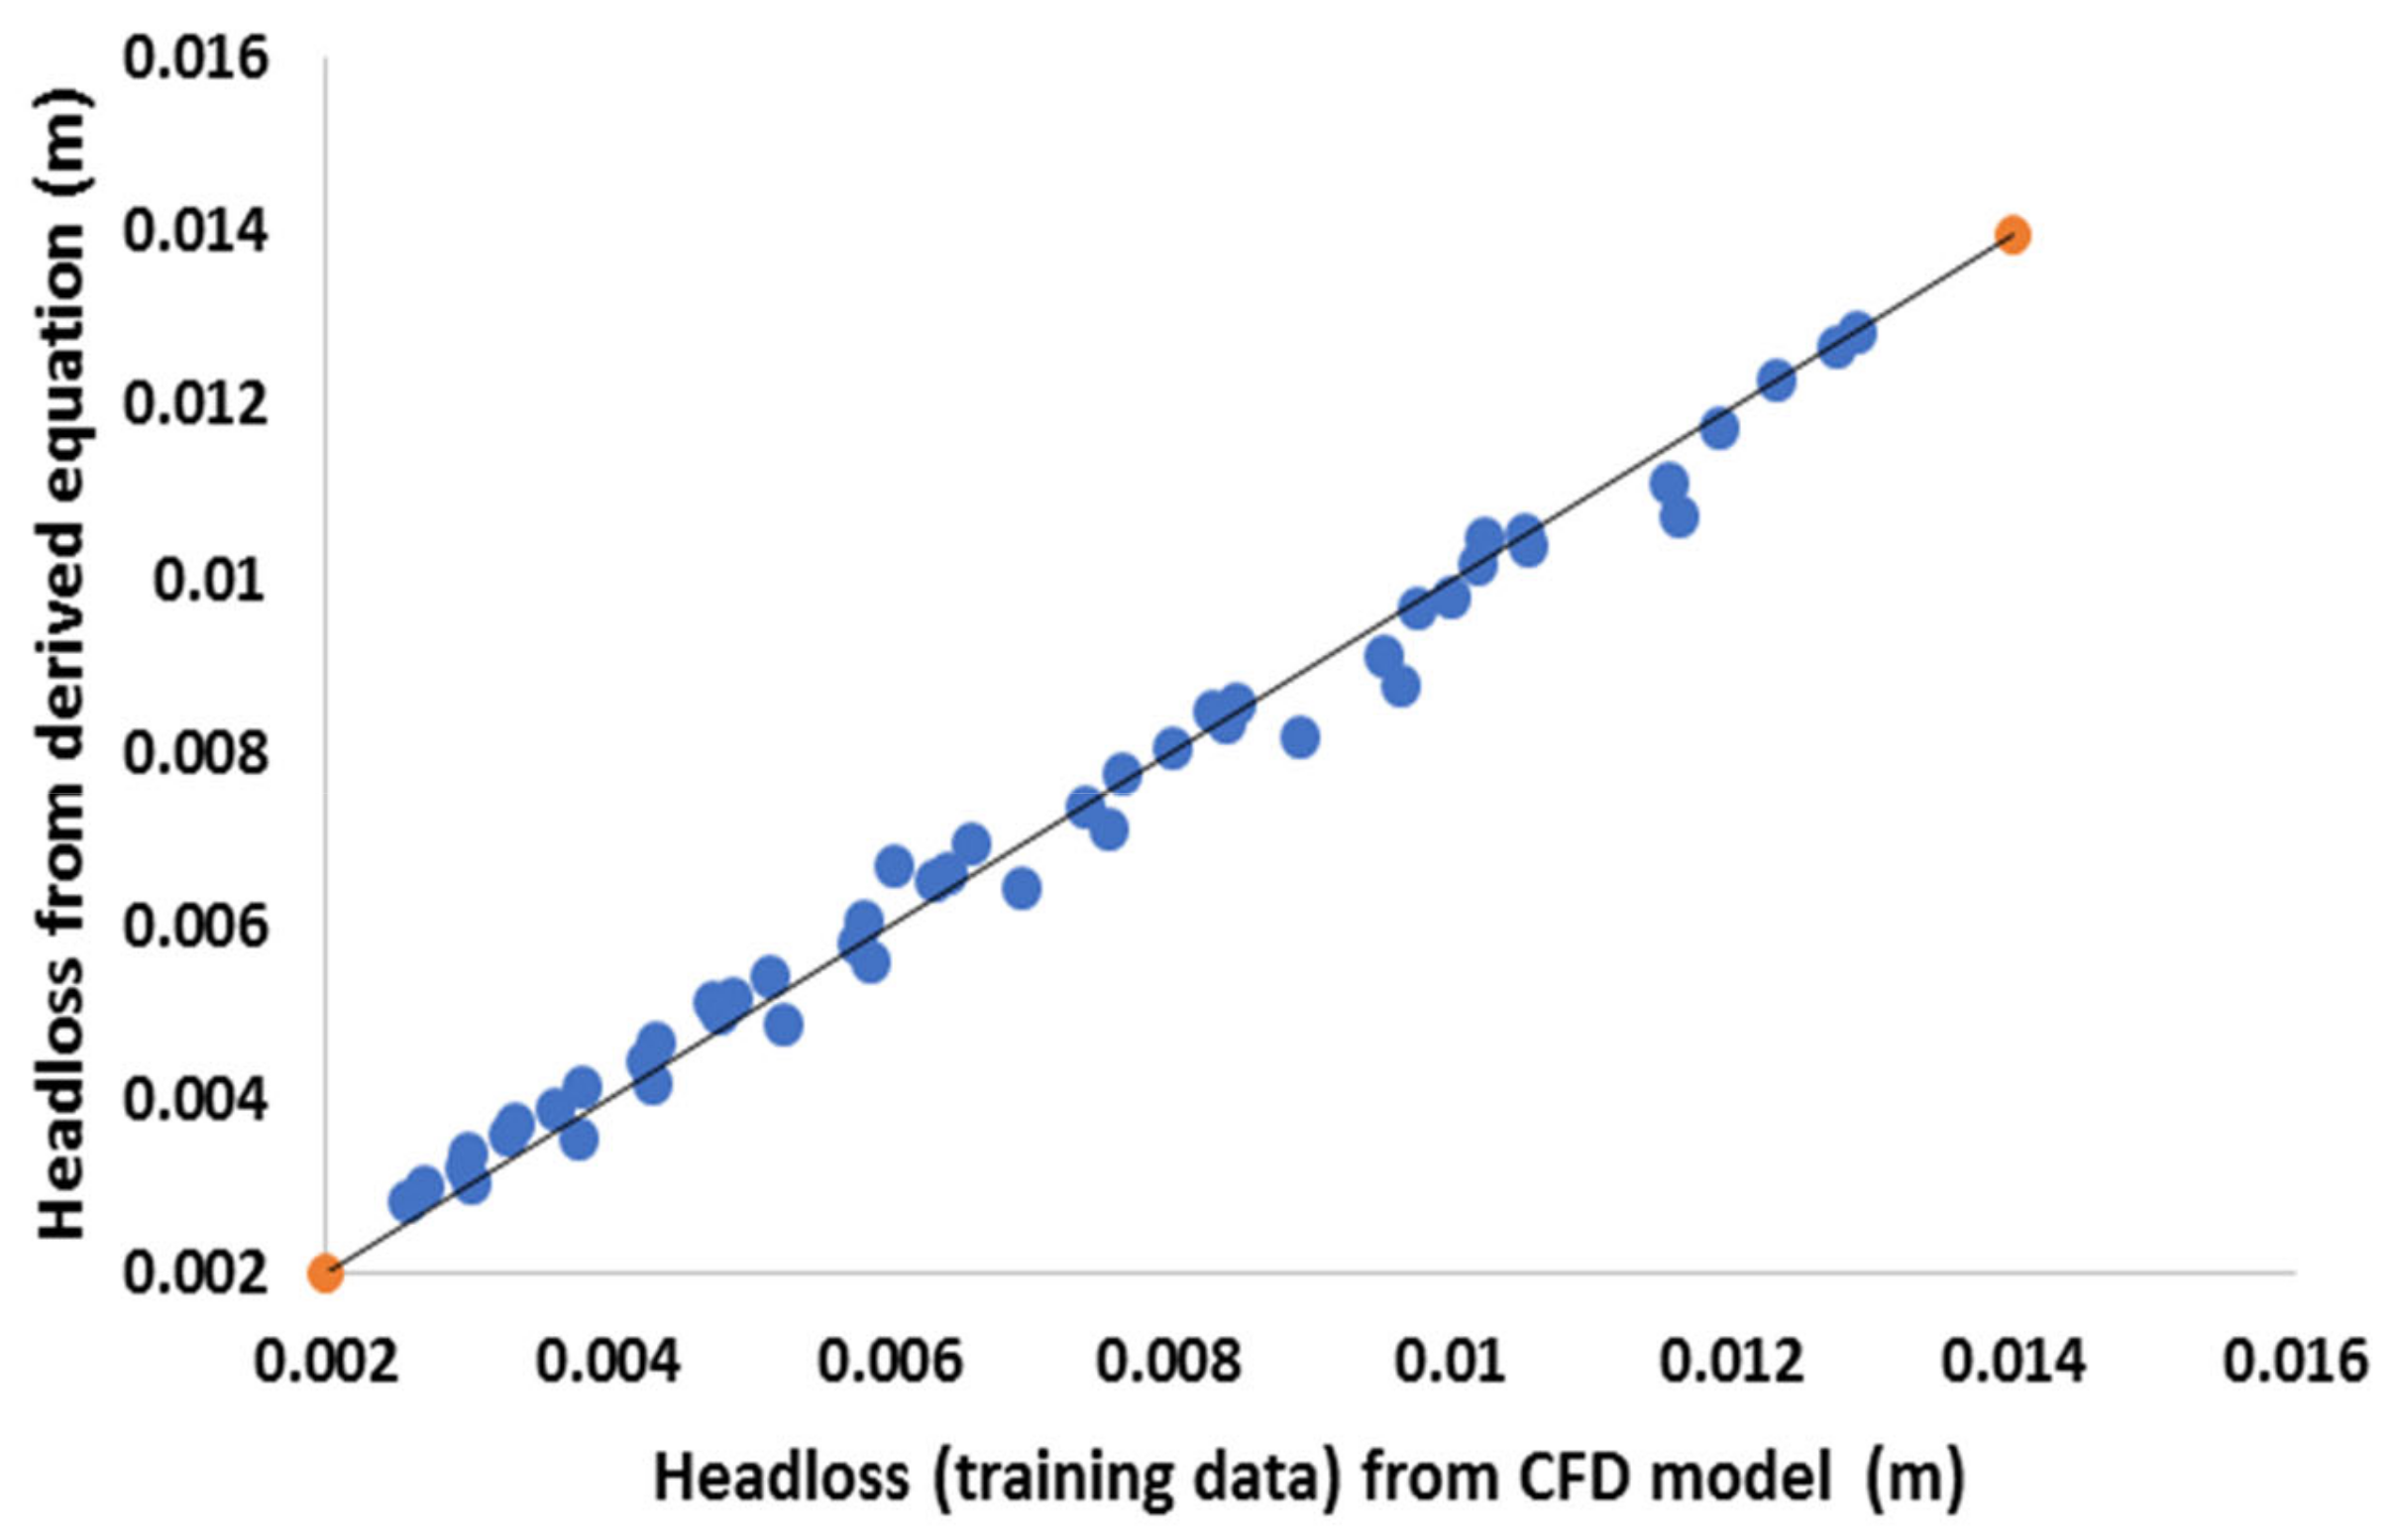
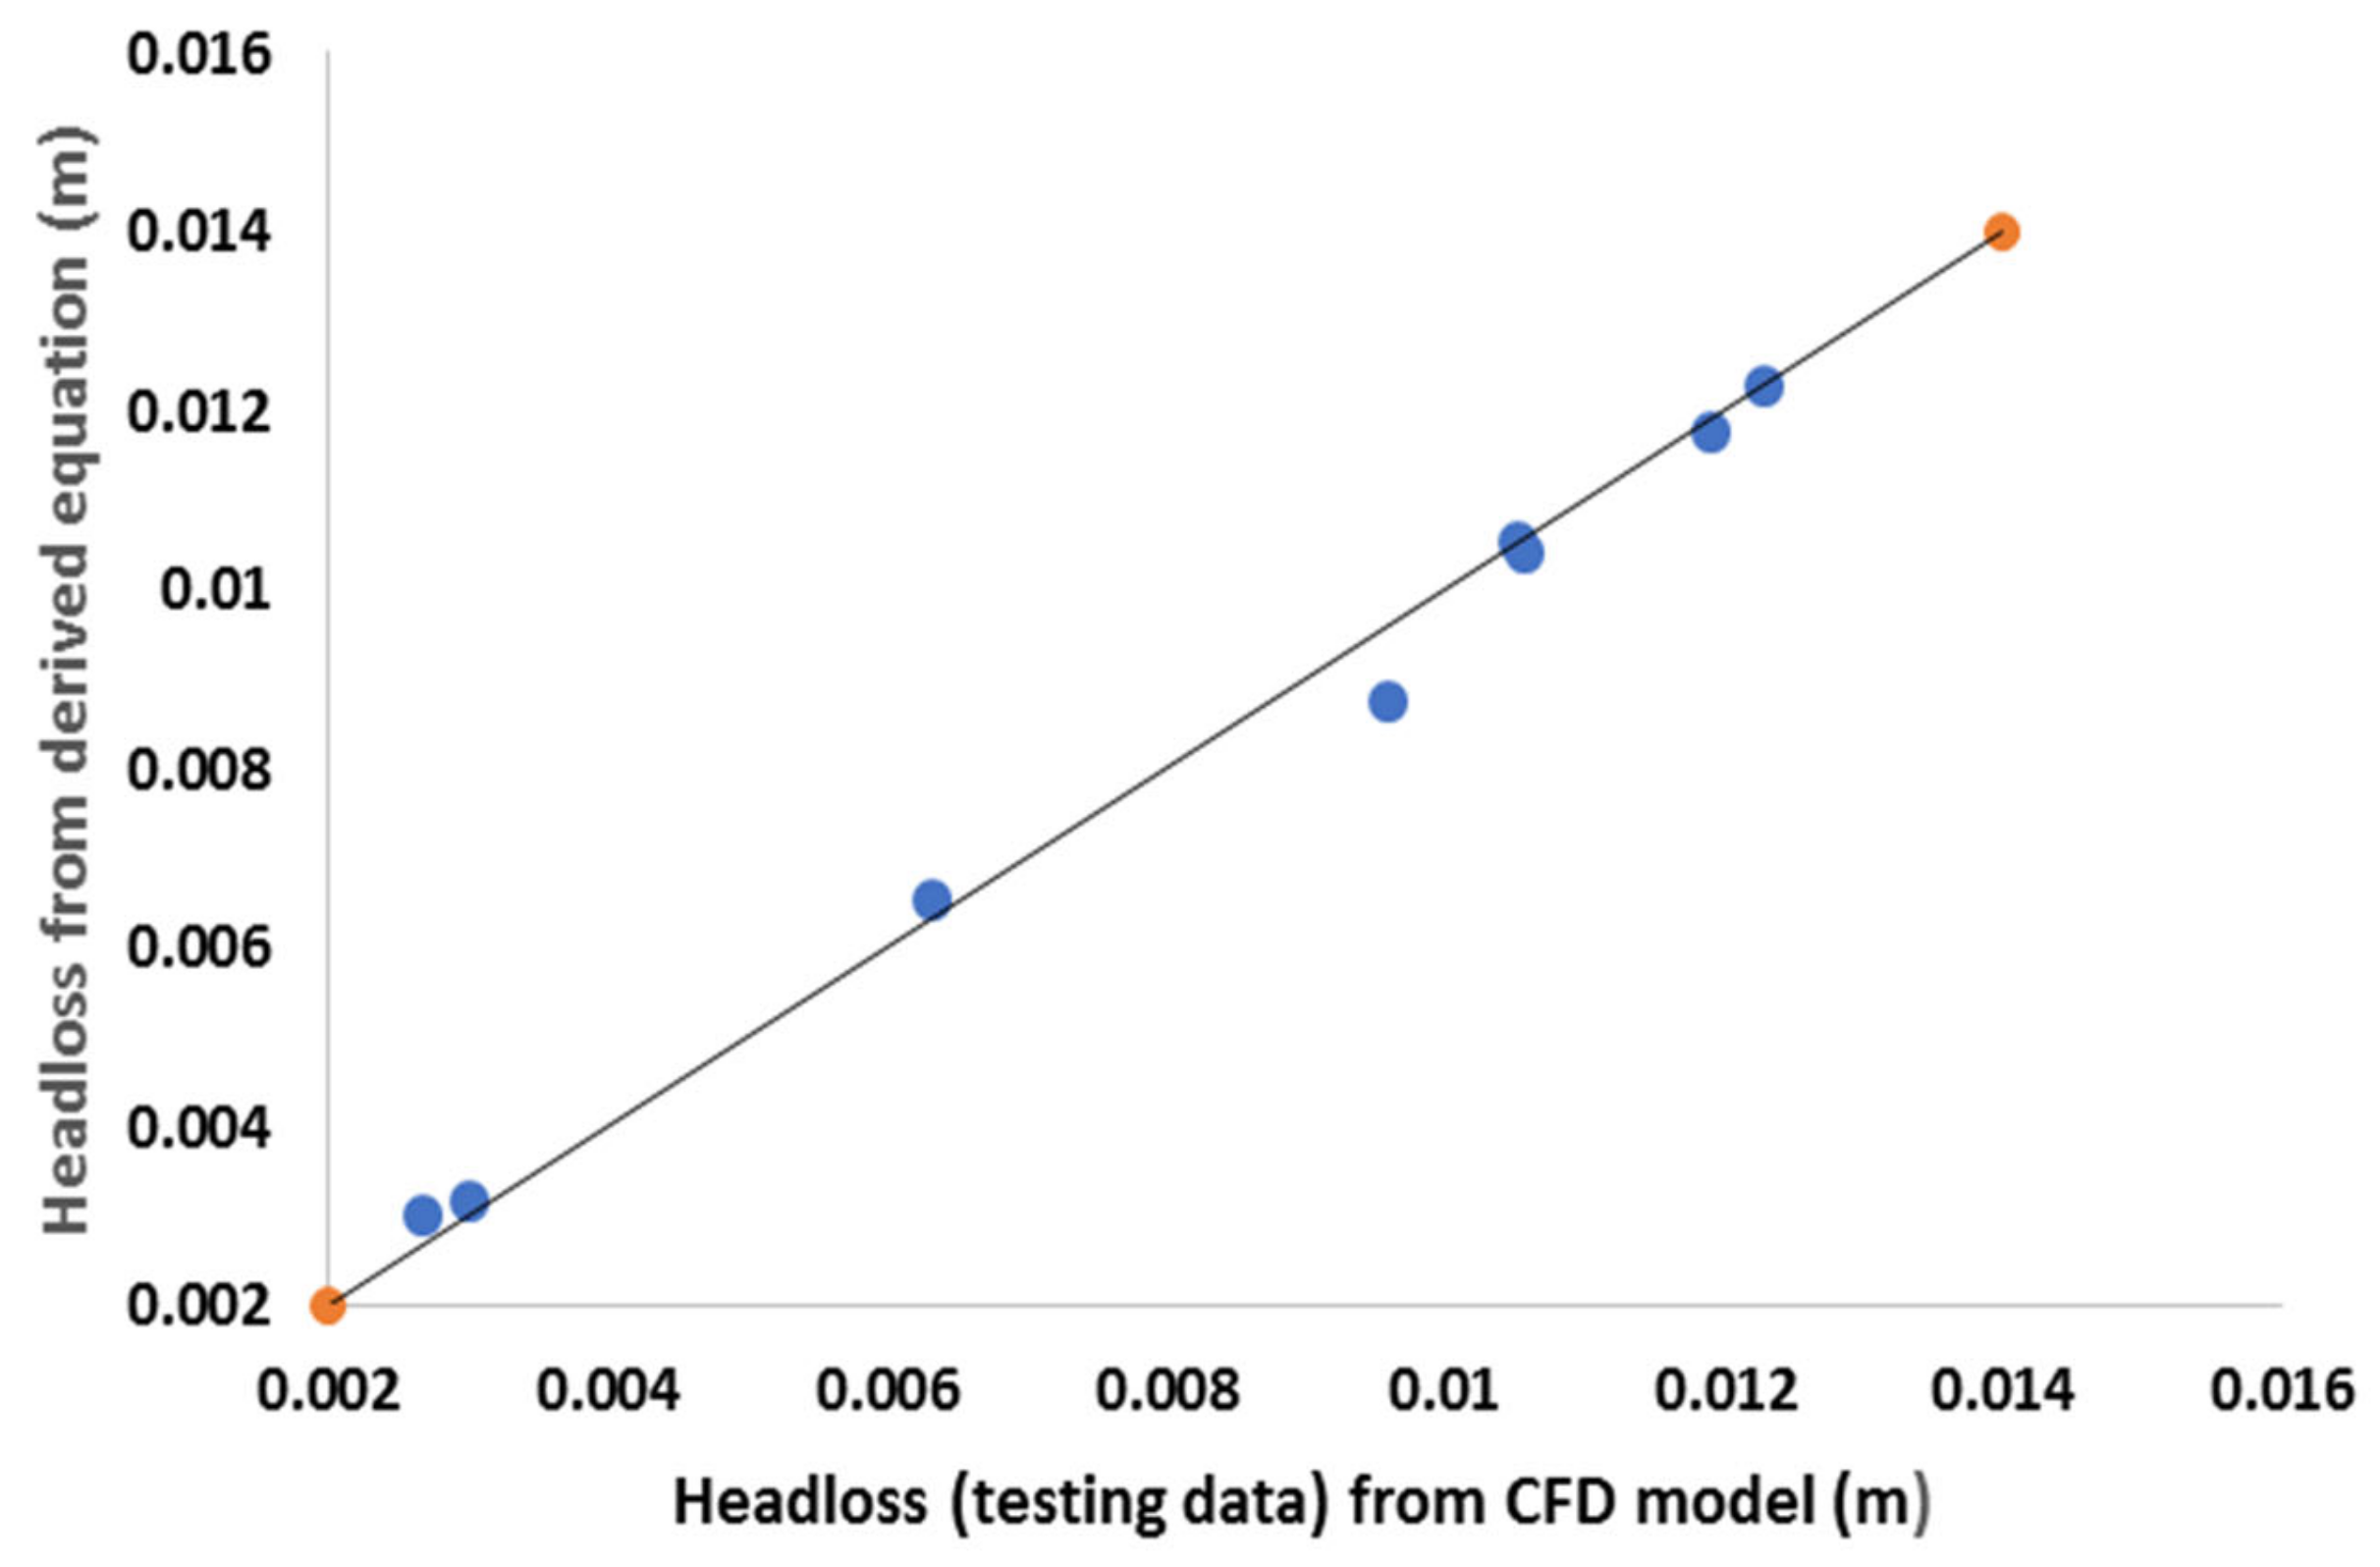
7.3. Derivation of an Empirical Equation

The derived relation between the trash racks loss and influential design parameters is expressed below:
Δ h v 2 2 g = [ ( 0.04622   ×   p 0.02104   ×   t s )   ×   t a n 2   ( α ) ] 0.0441   ×   t a n   ( 90 α ) + 0.21419
In Equation (5), Δ h v 2 2 g   = Δ h c is head loss coefficient, t is the thickness of vertical rack bars, b is the clear spacing between vertical rack bars, α is the angle of rack bars with channel bed, and p is blockage ratio. Equation (5) represented a determination coefficient ( R 2 ) value of 0.894 and adjusted determination coefficient (adj. R 2 ) value of 0.885, indicating a good fit of the equation with data [58,59].
The equation represented zero p-value, which shows that the developed equation is a true representative of the input data, and the equation is statistically significant. Moreover, each term in the equation possessed a p-value less than 0.05, indicating the statistical significance of the relationships in the equation. The terms and coefficients in the equation and their corresponding p-values are listed in Table 6.
The correlation between calculated values of head loss from the derived equation and training data (head loss from CFD model) is shown in Figure 11. The graphical relation shows that the newly formulated equation has a good correlation with the training data.
Figure 12 shows the comparison between testing data and calculated values for verification of the derived equation. Figure 12 shows that the correlation between both data sets is strong enough for the verification of the equation.

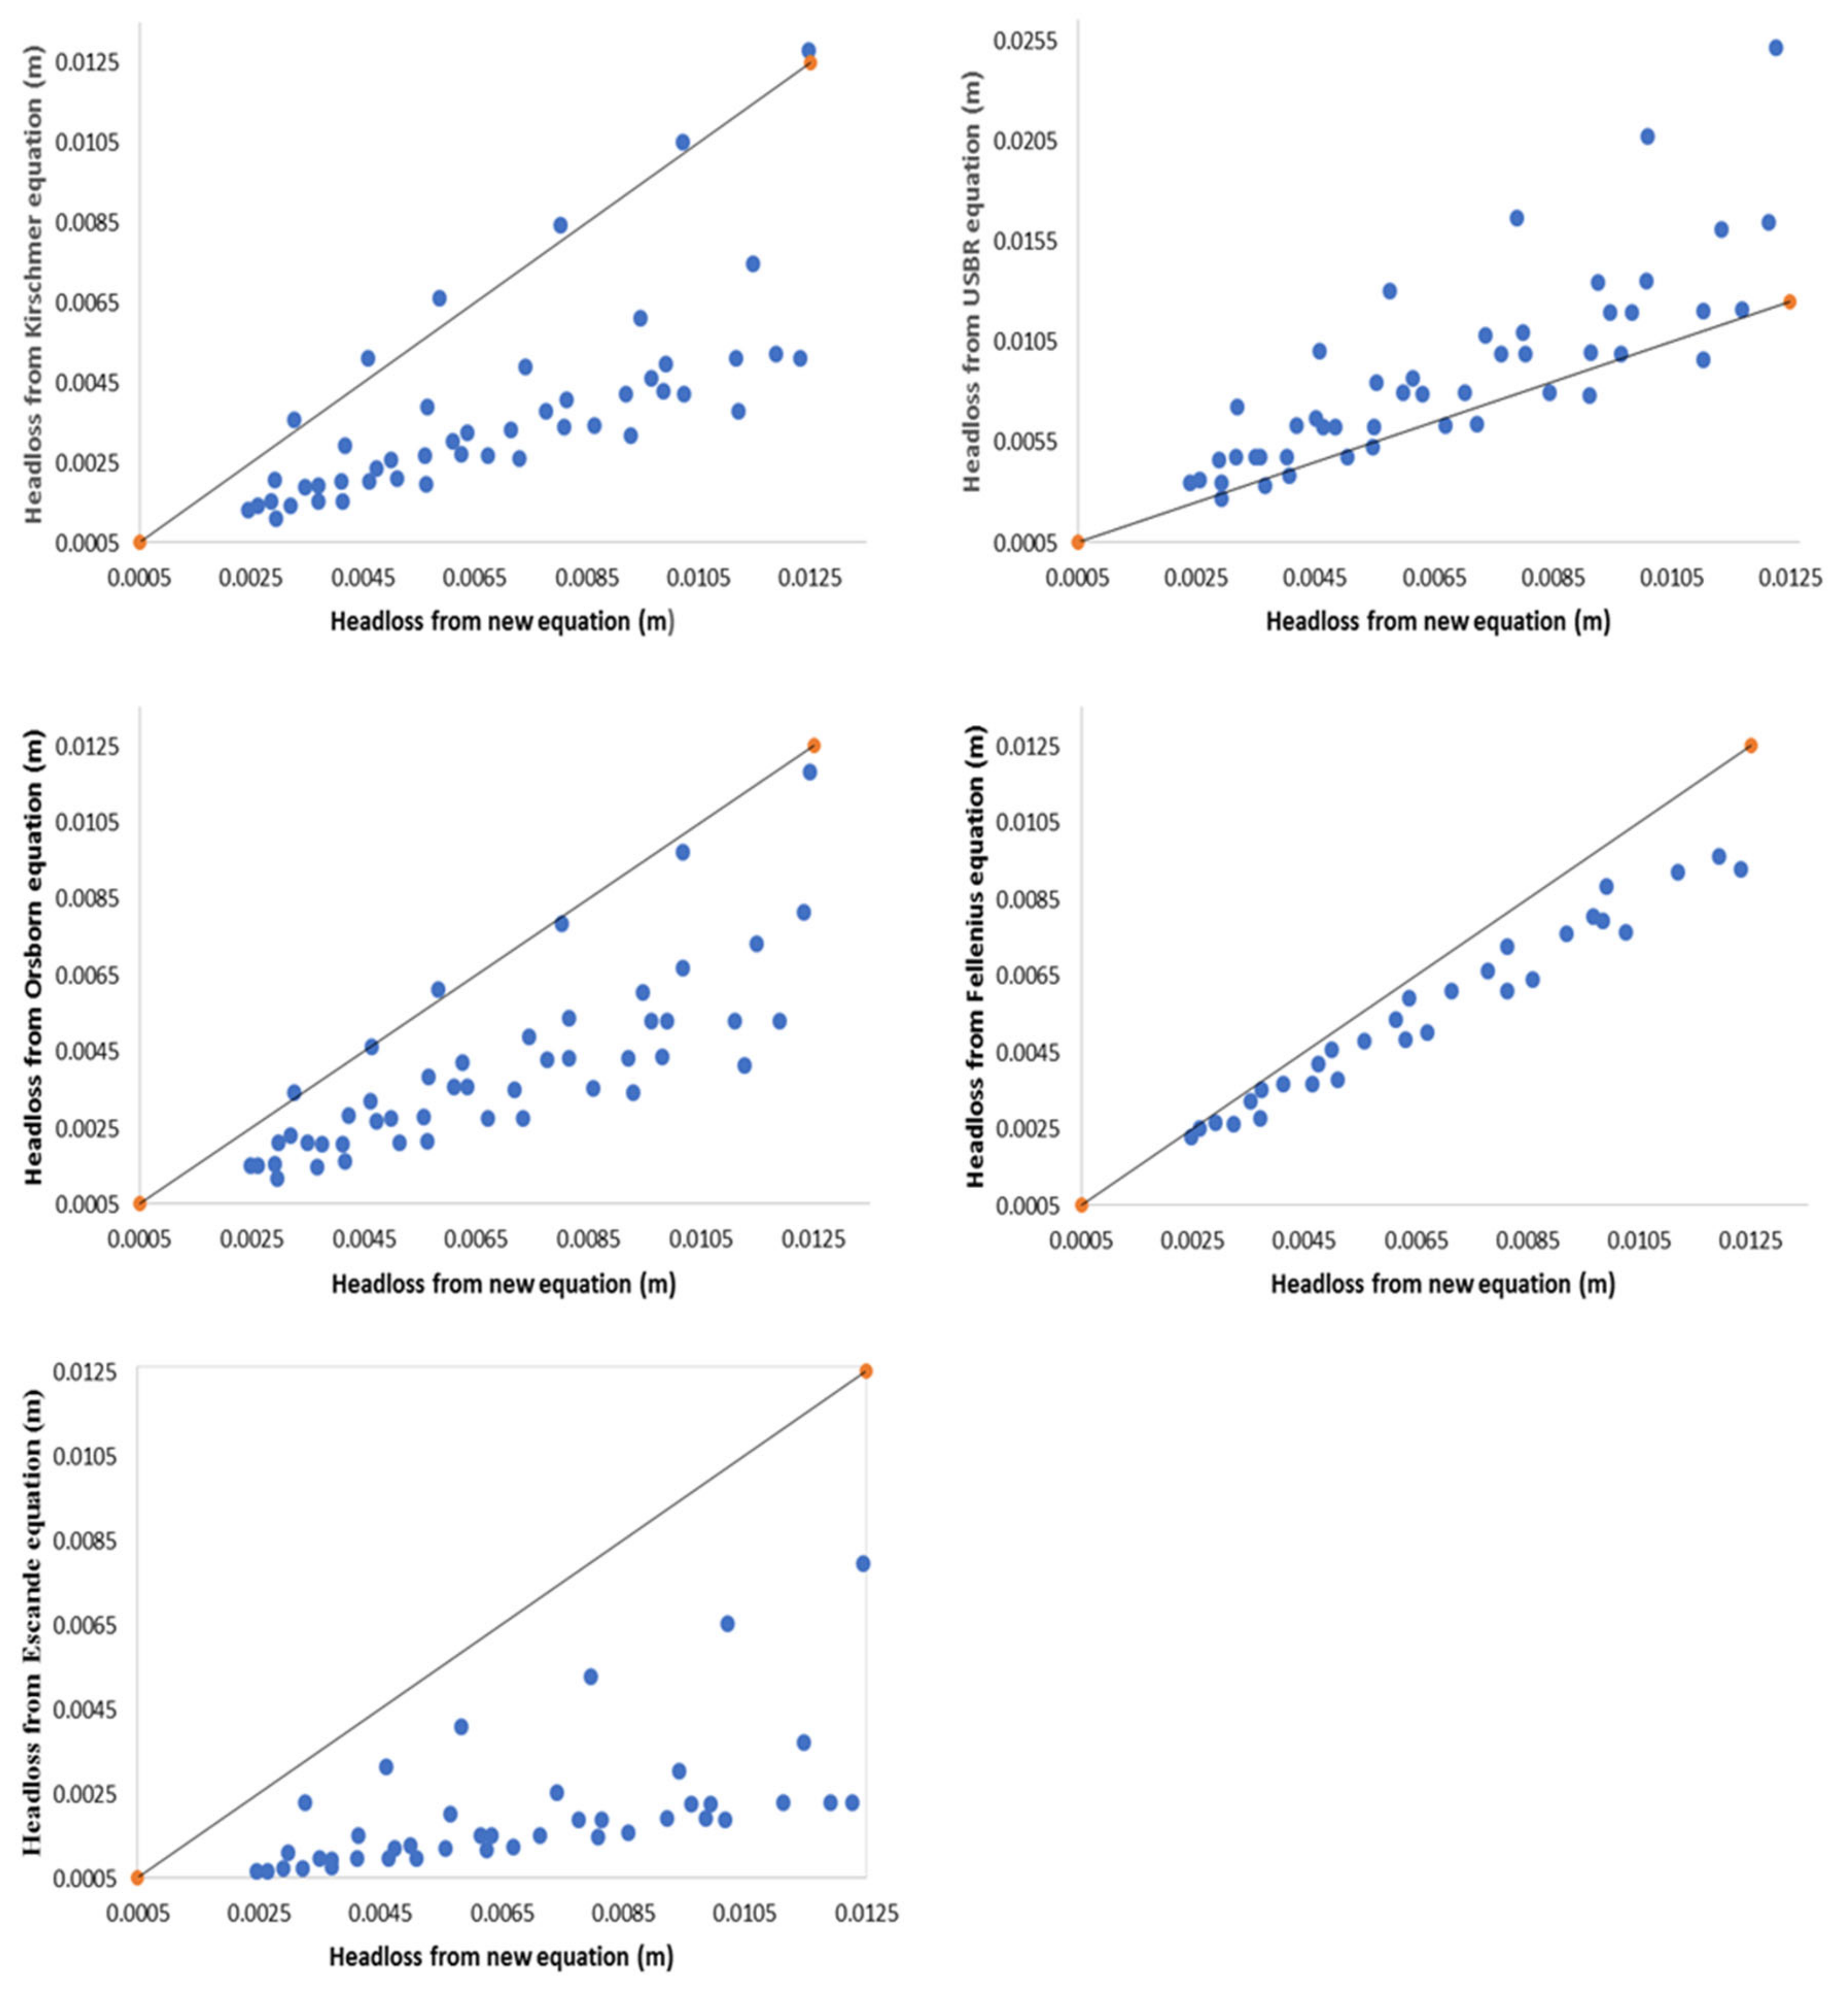
7.4. Comparison of the Proposed Equation with Existing Head Loss Equations

Comparison of the head loss data obtained from the CFD model with head loss data from different empirical equations is shown in Figure 13. Kirschmer equation under-estimated the head loss in comparison to head loss calculated by the new equation. Kirschmer relation only shows the good fit for the results of thickness to a bar ratio of 5. It is certainly due to the reason that the bar opening (b) term in the equation starts governing the equation at smaller openings [51]. USBR relation overestimated head loss more than the new equation. It can also be noted that the calculated head loss values are somewhat conforming to measured head losses for low values of velocities.
Orsborn equation also underestimated the head loss as compared to head losses from the new equation. It could be the reason that the equation did not consider the effect of the inclination angle of the trash racks. Results of the Fellenius equation are relatively less deviated compared to other equations. However, it underestimated the head loss. Fellenius equation did not consider the effect of the inclination angle of trash racks. Escande equation underestimated the head loss as compared to head losses from the new equation with more deviation.
Mean relative error (MRE) was also calculated to quantify the uncertainty of each equation to the new equation. Mean relative error for all the equations is presented below in Table 7.

8. Conclusions

It is noticed that a clear spacing between vertical bars greater than or equal to 0.075 m (or thickness to bar ratio of greater than or equal to 7.5) has a minimum head loss, whereas the increase is considerable otherwise. The angle of the trash racks screen has a significant effect on the head loss. The head loss coefficient increased with the increase in screen angle greater than 60°. A significant effect was noticed for screen angle greater than 70°. The inclination of rack bars with the channel bed facilitates the raking as well. The submerged trash tends to ride up the sloping racks with the flow. An angle of 60° should therefore be considered as an optimal parameter for design. Moreover, the blockage ratio showed a significant effect on head loss. Likewise, the head loss coefficient increased significantly with increased blockage ratio and reduced clear spacing between vertical bars. Based on research findings, trash racks for future hydropower projects may be designed accordingly. Whereas head losses can also be assessed by using the equation presented by this study.

Author Contributions

Conceptualization, M.A.L. and M.K.S.; methodology, M.A.L.; software, M.A.L.; validation, M.A.L. and M.K.S.; formal analysis, M.A.U.R.T.; investigation, R.F.; resources, M.K.S.; data curation, N.S., S.A., A.H.; writing—original draft preparation, M.A.L.; writing—review and editing, M.K.S.; visualization, M.A.U.R.T.; supervision, M.K.S.; project administration, M.K.S.; funding acquisition, M.A.U.R.T. All authors have read and agreed to the published version of the manuscript.

Funding

This research received no external funding.

Institutional Review Board Statement

Study doesn’t require ethical approval from Institutional review board.

Informed Consent Statement

Not applicable.

Data Availability Statement

Study did not report any data, however only drawings of the pwer station were acquired from the operators of hydel power station(WAPDA) for development of model.

Acknowledgments

This study is supported by Centre of Excellence in Water Resources Engineering (CEWRE) UET, Lahore and Hydel power station(WAPDA), Nandipur, Gujranwala Pakistan.

Conflicts of Interest

The authors declare no conflict of interest.

Nomenclature

Following symbols are used in this paper:
u, v, and wvelocities in the x-, y-, and z-directions;
Vvolume fraction of fluid in each cell;
Ax, Ay, and Azfractional areas open to flow in the subscript directions;
ρdensity;
P′pressure;
gigravitational force in the subscript direction;
fiReynolds stresses;
Ajcell face areas;
Stlstereo lithographic;
sclear spacing between bars;
αinclination angle of the trash racks with channel bed;
pblockage ratio;
Δ h head loss;
h r head loss by Kirschmer;
k F Kirschmer shape factor;
K Escande head loss coefficient;
k Fellenius head loss coefficient;
Shape factor
s Bar thickness for Orsborn equation
A N net area through rack bars;
A g gross are through rack bars;
Δ h c head loss coefficient;
vvelocity of approaching flow;
ggravitational acceleration;
U/Supstream;
t thickness of vertical rack;
R 2 determination coefficient;
a d j . R 2 adjusted determination coefficient;

References

  1. Farooq, R.; Ahmad, W.; Hashmi, H.N.; Saeed, Z. Computation of Momentum Transfer Coefficient and Conveyance Capacity in Asymmetric Compound Channel. Arab. J. Sci. Eng. 2016, 41, 4225–4234. [Google Scholar] [CrossRef]
  2. European Small Hydropower Association. ESHA Guide on How to Develop a Small Hydropower Plant; European Small Hydropower Association: Brussels, Belgium, 2004. [Google Scholar]
  3. Walczak, N. Operational Evaluation of a Small Hydropower Plant in the Context of Sustainable Development. Water 2018, 10, 1114. [Google Scholar] [CrossRef]
  4. Walczak, N.; Walczak, Z.; Nieć, J. Assessment of the Resistance Value of Trash Racks at a Small Hydropower Plant Operating at Low Temperature. Energies 2020, 13, 1775. [Google Scholar] [CrossRef]
  5. Lauterjung, H.; Schmidt, G. Planning of Water Intake Structures for Irrigation or Hydropower—Planning for Intake Structures; Deutsche Gesellschaft für Technische Zusammenarbeit (GTZ) GmbH: Eschborn, Germany, 1989; Volume 122. [Google Scholar]
  6. Singh, S.K.; Mustak, S.; Srivastava, P.K.; Szabó, S.; Islam, T. Predicting Spatial and Decadal LULC Changes Through Cellular Automata Markov Chain Models Using Earth Observation Datasets and Geo-information. Environ. Process. 2015, 2, 61–78. [Google Scholar] [CrossRef]
  7. Kumar, V. Trash Rack Arrangement in Intakes for Hydro-Power Development. Ph.D. Thesis, University of Roorkee, Roorke, India, 1972. [Google Scholar]
  8. Spangler, J. Investigation of the loss through trash racks inclined obliquely to the stream flow. In Hydraulic Laboratory Practice; ASME: New York, NY, USA, 1929; pp. 461–470. [Google Scholar]
  9. Fellenius, W.; Lindquist, E.G.W. Experiments on the head loss caused by protecting racks at water-power plants. In Hydraulic Laboratory Practice; ASME: New York, NY, USA, 1929; pp. 533–538. [Google Scholar]
  10. Orsborn, J.F. Rectangular-bar trashrack and baffle headlosses. J. Power Div. 1968, 94, 111–123. [Google Scholar] [CrossRef]
  11. Josiah, N.R.; Tissera, H.P.S.; Pathirana, K.P.P. An Experimental Investigation of Head loss through Trash Racks in Conveyance Systems. Eng. J. Inst. Eng. Sri Lanka 2016, 49, 1. [Google Scholar] [CrossRef]
  12. Pang, M.; Zhang, L.; Ulgiati, S.; Wang, C. Ecological impacts of small hydropower in China: Insights from an emergy analysis of a case plant. Energy Policy 2015, 76, 112–122. [Google Scholar] [CrossRef]
  13. Walczak, N. Economic Evaluation of Maintaining the Capacity of Trash Racks in Hydraulic Engineering Structures. J. Ecol. Eng. 2017, 18, 195–201. [Google Scholar] [CrossRef]
  14. Zayed, M.; El Molla, A.; Sallah, M. Experimental Investigation of Curved Trash Screens. J. Irrig. Drain. Eng. 2020, 146, 06020003. [Google Scholar] [CrossRef]
  15. Larinier, M. Fish passage experience at small-scale hydro-electric power plants in France. Hydrobiologia 2008, 609, 97–108. [Google Scholar] [CrossRef]
  16. Johnson, P.L. Hydro-Power Intake Design Considerations. J. Hydraul. Eng. 1988, 114, 651–661. [Google Scholar] [CrossRef]
  17. Watterstein, N.; Thorne, C.R.; Abt, S.R. Debris Control at Hydraulic Structures in Selected Areas of the United States and Europe; Nottingham University: Nottingham, UK, 1997. [Google Scholar]
  18. Sarwar, M.K.; Tariq, M.A.U.R.; Farooq, R.; Abbasi, H.K.J.; Haq, F.U.; Ahmad, I.; Shah, M.I.; Ng, A.W.M.; Muttil, N. A Hydraulic Analysis of Shock Wave Generation Mechanism on Flat Spillway Chutes through Physical Modeling. Hydrology 2021, 8, 186. [Google Scholar] [CrossRef]
  19. Wahl, T.L. Trash Control Structures and Equipment: A Literature Review and Survey of Bureau of Reclamation Experience; U.S. Department of the Interior: Denver, CO, USA, 1992; pp. 1–33.
  20. America Society of Civil Engineers. Guidelines for Design of Intakes for Hydroelectric Plants; ASCE: Reston, VA, USA, 1995. [Google Scholar]
  21. Japan International Cooperation Agency. Guideline and Manual for Hydropower Development—Small Scale Hydropower; Japan International Cooperation Agency: Tokyo, Japan, 2011. [Google Scholar]
  22. Walczak, N.; Walczak, Z.; Hämmerling, M.; Spychała, M.; Nieć, J. Head losses in small hydropower plant trash racks (SHP). Acta Sci. Pol. Form. Circumiectus 2016, 15, 369. [Google Scholar]
  23. Lučin, I.; Čarija, Z.; Grbčić, L.; Kranjčević, L. Assessment of head loss coefficients for water turbine intake trash-racks by numerical modeling. J. Adv. Res. 2020, 21, 109–119. [Google Scholar] [CrossRef] [PubMed]
  24. Nascimento, L.; Silva, J.; Di Giunta, V. Damage of hydroelectric power plant trash racks due to fluid-dynamic exciting frequencies. Lat. Am. J. Solids Struct. 2006, 3, 223–243. [Google Scholar]
  25. Nakayama, A.; Hisasue, N. Large eddy simulation of vortex flow in intake channel of hydropower facility. J. Hydraul. Res. 2010, 48, 415–427. [Google Scholar] [CrossRef]
  26. Huang, X.; Valero, C.; Egusquiza, E.; Presas, A.; Guardo, A. Numerical and experimental analysis of the dynamic response of large submerged trash-racks. Comput. Fluids 2013, 71, 54–64. [Google Scholar] [CrossRef]
  27. Kirschmer, O. Untersuchungen über den Gefällsverlust an Rechen. In Mitteilungen des Hydraul; Instituts der TH München: Munich, Germany, 1926. [Google Scholar]
  28. Escande, L. Hydraulique Générale; Edouard Privat: Toulouse, France, 1947. [Google Scholar]
  29. Mosonyi, E. Wasserkraftwerke, Band I, Niederdruckanlagen; VDI: Düsseldorf, Germany, 1966. [Google Scholar]
  30. U.S. Department of the Interior. Folsom Dam Joint Federal Project Existing Spillway Modeling; U.S. Department of the Interior: Denver, CO, USA, 2009.
  31. Meusburger, H. Energieverluste an Einlaufrechen von Flusskraftwerken. Ph.D. Thesis, Versuchsanstalt für Wasserbau, Hydrologie und Glaziologie der Eidgenössischen Technischen Hochschule, Zurich, Switzerland, 2002. [Google Scholar]
  32. Clark, S.P.; Tsikata, J.M.; Haresign, M. Experimental study of energy loss through submerged trashracks. J. Hydraul. Res. 2010, 48, 113–118. [Google Scholar] [CrossRef]
  33. Tsikata, J.M.; Tachie, M.F.; Katopodis, C. Open-channel turbulent flow through bar racks. J. Hydraul. Res. 2014, 52, 630–643. [Google Scholar] [CrossRef]
  34. Carrillo, J.M.; García, J.T.; Castillo, L.G. Experimental and numerical modelling of bottom intake racks with circular bars. Water 2018, 10, 605. [Google Scholar]
  35. Carrillo, J.M.; Castillo, L.G.; García, J.T.; Sordo-Ward, Á. Considerations for the design of bottom intake systems. J. Hydroinform. 2018, 20, 232–245. [Google Scholar] [CrossRef]
  36. García, J.T.; Castillo, L.G.; Haro, P.L.; Carrillo, J.M. Multi-Parametrical Tool for the Design of Bottom Racks DIMRACK—Application to Small Hydropower Plants in Ecuador. Water 2019, 11, 2056. [Google Scholar] [CrossRef]
  37. Böttcher, H.; Gabl, R.; Aufleger, M. Experimental hydraulic investigation of angled fish protection systems—Comparison of circular bars and cables. Water 2019, 11, 1056. [Google Scholar] [CrossRef] [Green Version]
  38. Fei, Y.; Gao, X. Numerical simulations of the hydraulic characteristics of side inlet/outlets. J. Hydrodyn. Ser. B 2011, 23, 48–54. [Google Scholar]
  39. Elger, D.F.; LeBret, B.A.; Crowe, C.T.; Roberson, J.A. Engineering Fluid Mechanics; John Wiley & Sons: Hoboken, NJ, USA, 2020; ISBN 1119723507. [Google Scholar]
  40. Sadrnezhad, S. Hydrodynamics induced vibration to trash-racks. Int. J. Eng. 2002, 15, 357–366. [Google Scholar]
  41. Tsikata, J.M.; Tachie, M.F.; Katopodis, C. Particle image velocimetry study of flow near trashrack models. J. Hydraul. Eng. 2009, 135, 671–684. [Google Scholar] [CrossRef]
  42. Tsitaka, J.M.; Tachie, M.F.; Katopodis, C.; Teklemariam, E.; Ghamry, H.; Sydor, K.; Shumilak, B. A Particle Image Velocimetry Study Turbulent Through Model Trash Rack. In Proceedings of the 18th Hydrotechnical Conference, Winnipeg, MB, Canada, 22–24 August 2007; pp. 22–24. [Google Scholar]
  43. Tsikata, J.M.; Katopodis, C.; Tachie, M.F. Experimental study of turbulent flow near model trashracks. J. Hydraul. Res. 2009, 47, 275–280. [Google Scholar] [CrossRef]
  44. Herman, F.; Billeter, P.; Hollenstein, R. Investigations on the flow through a trashrack under different inflow conditions. In Proceedings of the Hydroinformatics ’98, Kopenhagen, Denmark, 24–26 August 1998; Balkema: Rotterdam, The Netherlands, 1998; pp. 121–128. [Google Scholar]
  45. Ghamry, H.K.; Katopodis, C. Numerical investigation of turbulent flow through bar racks in closed conduits. In Proceedings of the 9th International Symposium on Ecohydraulics, Vienna, Austria, 17–21 September 2012; pp. 17–21. [Google Scholar]
  46. Åkerstedt, H.O.; Eller, S.; Lundström, T.S. Numerical investigation of turbulent flow through rectangular and biconvex shaped trash racks. Engineering 2017, 9, 412. [Google Scholar] [CrossRef]
  47. Hribernik, A.; Fike, M.; Hribernik, T.M. Economical optimization of a trashrack design for a hydropower plant. J. Trends Dev. Mach. Assoc. Technol. 2013, 17, 161–164. [Google Scholar]
  48. Hirt, C.; Nichols, B. Volume of fluid (VOF) method for the dynamics of free boundaries. J. Comput. Phys. 1981, 39, 201–225. [Google Scholar] [CrossRef]
  49. Savage, B.M.; Johnson, M.C. Flow over ogee spillway: Physical and numerical model case study. J. Hydraul. Eng. 2001, 127, 640–649. [Google Scholar] [CrossRef]
  50. Ho, D.K.H.; Riddette, K.M. Application of computational fluid dynamics to evaluate hydraulic performance of spillways in australia. Aust. J. Civ. Eng. 2010, 6, 81–104. [Google Scholar] [CrossRef]
  51. Botero, L.; Woodley, M.; Knatz, C.; Topa, T. Hydraulic Similarity of Headloss Predictions Derived Using Commonly Used Methods Versus Actual Results as It Relates to Wastewater Screen Elements. In Proceedings of the Water Environment Federation (WEFTEC 2011), Los Angeles, CA, USA, 15–19 October 2011; Volume 2011, pp. 3665–3691. [Google Scholar] [CrossRef]
  52. Chanel, P.G.; Doering, J.C. Assessment of spillway modeling using computational fluid dynamics. Can. J. Civ. Eng. 2008, 35, 1481–1485. [Google Scholar] [CrossRef]
  53. Harlow, F.H. Turbulence Transport Equations. Phys. Fluids 1967, 10, 2323. [Google Scholar] [CrossRef]
  54. Yakhot, V.; Orszag, S.A.; Thangam, S.; Gatski, T.B.; Speziale, C.G. Development of turbulence models for shear flows by a double expansion technique. Phys. Fluids A Fluid Dyn. 1992, 4, 1510–1520. [Google Scholar] [CrossRef] [Green Version]
  55. Flow Sciences, Inc. Flow 3D; Flow Sciences, Inc.: Leland, NC, USA, 2013. [Google Scholar]
  56. Jothiprakash, V.; Bhosekar, V.V.; Deolalikar, P.B. Flow characteristics of orifice spillway aerator: Numerical model studies. ISH J. Hydraul. Eng. 2015, 21, 216–230. [Google Scholar] [CrossRef]
  57. Usta, E. Numerical Investigation of Hydraulic Characteristics of Laleli Dam Spillway and Comparison with Physical Model Study. Master’s Thesis, Middle East Technical University, Ankara, Turkey, 2014. [Google Scholar]
  58. Van Liew, M.W.; Arnold, J.G.; Garbrecht, J.D. Hydrologic Simulation on Agricultural Watersheds: Choosing Between Two Models. Trans. ASAE 2003, 46, 1539–1551. [Google Scholar] [CrossRef]
  59. Santhi, C.; Arnold, J.G.; Williams, J.R.; Dugas, W.A.; Srinivasan, R.; Hauck, L.M. Validation of the Swat Model on a Large Rwer Basin with Point and Nonpoint SourceS. J. Am. Water Resour. Assoc. 2001, 37, 1169–1188. [Google Scholar] [CrossRef]
Figure 1. Vertical and horizontal bar profiles of trash racks screen at a hydropower station.
Water 14 02609 g001
Figure 2. (a): Geometry of intake trash racks imported in CFD Code. (b): Intake geometry after applying mesh.
Water 14 02609 g002
Figure 3. Refinement of the mesh for the numerical modeling (close view of rack’s FAVOR image).
Water 14 02609 g003
Figure 4. Assigned boundary conditions to the geometry.
Water 14 02609 g004
Figure 5. Definition sketch of clear spacing (s) and inclination angle (α). (a) Front view of rack bars; (b) Side view of rack bar.
Water 14 02609 g005
Figure 6. Variation of velocity through rack bars (FAVOR geometry).
Water 14 02609 g006
Figure 7. Turbulent energy contours of existing trash racks—XZ & XY Plane (FAVOR geometry).
Water 14 02609 g007
Figure 8. Head loss variation at different bar spacings (Δhc> = 0.23 to 0.26).
Water 14 02609 g008
Figure 9. Head loss variation at different inclination angles (Δhc> = 0.20 to 0.27).
Water 14 02609 g009
Figure 10. Head loss variation at two different blockage ratios (Δhc> = 0.23–0.26).
Water 14 02609 g010
Figure 11. Correlation between training data and calculated values.
Water 14 02609 g011
Figure 12. Verification of derived equation.
Water 14 02609 g012
Figure 13. Comparison of head loss computed from the new equation and commonly used equations.
Water 14 02609 g013
Table 1. Different sets of assigned boundary conditions.
Set
No.
XYZ
Xmin.Xmax.Ymin.Ymax.Zmin.Zmax.
Set 1Specified PressureOutflowSymmetrySymmetryWallSpecified Pressure
Set 2Specified PressureSpecified PressureSymmetrySymmetryWallSpecified Pressure
Set 3Volume Flow RateOutflowSymmetrySymmetrySymmetrySpecified Pressure
Set 4Specified VelocityOutflowSymmetrySymmetryWallSpecified Pressure
Table 2. Summary of parameters used in scenario modelling and head loss computation.
ParameterExisting
Trash Rack
Category 1Category 2Category 3
(a)(b)(c)(a)(b)(c)(a)
Clear spacing ‘s’ (mm)1005075125100100100100
Inclination angle ‘α’75°75°75°75°60°70°80°75°
Blockage ratio ‘p0.090.170.120.070.090.090.090.13
Table 3. Equations from literature used to compute head loss for comparison.
Equation Developed byFormulation for Head Loss
Kirschmer Δ h r = k F × t b 4 3 × sin α × v 2 2 g
USBR Δ h = 1.45 0.45 A N A g A N A g 2 × v 2 2 g
Orsborn Δ h = × s b 4 3 × sin α × v 2 2 g
Fellenius Δ h r = k × t t + b × v 2 2 g
Escande Δ h r = 1 K 1   2 × v 2 2 g
Note(s): Symbols used in above equations are defined with nomenclature.
Table 4. Comparison of results between CFD model and site data.
CFD ResultsSite Data% Difference in Flow Depth% Difference in Hydraulic Head
U/S Hydraulic Head (m)Flow Depth (m)U/S Hydraulic Head (m)Flow Depth (m)
232.788.6233.599.48.60.35
Table 5. Variation in head loss with velocity for existing parameters of trash rack.
Approach Velocity
(m/s)
Upstream of Trash RackDownstream of Trash RackHead Loss
(m)
Observation Points (m)Total Hydraulic Head (m)Observation Points (m)Total Hydraulic Head (m)
xy xy
0.527.3211.85233.31329.6211.85233.3100.0030
0.627.3211.85233.31829.6211.85233.3140.0043
0.727.3211.85233.32329.6211.85233.3170.0060
0.827.3211.85233.33029.6211.85233.3230.0074
0.927.3211.85233.33829.6211.85233.3280.0010
127.3211.85233.34629.6211.85233.3340.0120
Table 6. p-Values corresponding to terms of regression model.
TermCoefficientp-Value
Constant0.214190.000
t a n (90 − α) −0.04410.035
t s × t a n 2 (α)−0.021040.002
p × t a n 2 (α) 0.046220.000
Table 7. Summary of mean relative error.
Equation for Trash Racks LossesMRE (%)
Kirschmer46.8
USBR36.5
Orsborn40.8
Fellenius19.1
Escande71.3
Present Study3.6
Publisher’s Note: MDPI stays neutral with regard to jurisdictional claims in published maps and institutional affiliations.

