Article

Effect of Particle Character and Calcite Dissolution on the Hydraulic Conductivity and Longevity of Biosand Filters Treating Winery and Other Acidic Effluents

by
Gareth Alistair Holtman
1,2,
Rainer Haldenwang
2 and
Pamela Jean Welz
1,*
1
Applied Microbial and Health Biotechnology Institute (AMHBI), Cape Peninsula University of Technology, P.O. Box 1906, Bellville 7535, South Africa
2
Department of Civil Engineering, Cape Peninsula University of Technology, P.O. Box 1906, Bellville 7535, South Africa
*
Author to whom correspondence should be addressed.
Water 2022, 14(17), 2603; https://doi.org/10.3390/w14172603
Submission received: 4 August 2022 / Revised: 18 August 2022 / Accepted: 20 August 2022 / Published: 24 August 2022
(This article belongs to the Section Wastewater Treatment and Reuse)

Abstract

:
Acidic effluent such as winery wastewater is challenging to remediate. Biological sand reactors can simultaneously remove organics and neutralize winery wastewater via biotic and abiotic mechanisms. The systems have been shown to be suitable for treating the intermittent flow of wastewater at small wineries. It has been shown that dissolution of calcite is the most important abiotic mechanism for increasing the pH of the influent. In this study, sand column experiments were used to determine the effects of (i) sand particle size distribution on calcite dissolution kinetics, and (ii) the effects of calcite particle dissolution on the hydraulic conductivity. The results were then used to calculate the theoretical temporal abiotic neutralization capacity of biological sand reactors with differently sized sand fractions, including unfractionated (raw) sand. The results were compared with those determined from a pilot system treating winery wastewater over a period of 3 years. Sand fractions with larger particles contained lower amounts of calcite (using Ca as a proxy), but exhibited higher hydraulic conductivities (3.0 ± 0.05 %Ca and 2.57 to 2.75 mm·s−1, respectively) than those containing smaller particles and/or raw sand (4.8 ± 0.04 to 6.8 ± 0.03 %Ca and 0.19 to 1.25 mm·s−1, respectively). The theoretical abiotic neutralization capacity of biological sand reactors was compared with a pilot system with the same flow rates, and a temporal abiotic neutralization capacity of 37 years was calculated for biological sand reactors, which compared favorably with the theoretical results obtained for wastewater with pH values between 2 (8.2 years) and 3 (82 years). It was concluded that biological sand filters with around 10% calcite will be able to abiotically neutralize winery wastewater and other wastewaters with similar acidities for the projected life span of the system. Future work should focus on determining the effect of sand grain size on the bioremediation capacity, as well as the use of biological sand reactors for treating other acidic organic wastewaters such as fruit processing, food production and distillery wastewater.

1. Introduction

In the cycle of production, development and processing of raw material to a final product, waste and/or wastewater (WW) is generated. The global shortage of clean water is aggravated by the rapid expansion of industries and the subsequent increase in the overall volume of WW, including acidic WW, which has become a global environmental challenge [1,2,3]. If the acid WW is not sufficiently remediated, there is potential for adverse impacts on the environment and on human health [2,4]. If the WW is treated before discharge, the energy and cost requirements as well the quality and quantity of the acid WW inform the choice of treatment method. Physicochemical methods include adsorption, extraction, distillation, and membrane filtration [5,6,7]. However, these treatment systems require large capital outlays and skilled personnel which may not be economically feasible for some industries, especially those that do not generate large quantities of WW. Wineries typically generate acidic WW that is highly seasonal in quantity and quality, but most smaller wineries cannot afford to install, maintain and operate sophisticated WW treatment systems.
Biosand reactors (BSRs), otherwise known as biological sand filters (BSF) or unplanted constructed/treatment wetlands are cost-efficient, low maintenance treatment systems that are able to effectively biodegrade the organic fraction of winery wastewater (WWW). Operational results from a pilot horizontal flow system as well as a more advanced vertical flow system with a novel hydraulic design have shown that the systems are also effective in neutralizing acidic WWW while increasing the sodium adsorption ratio (SAR) of the effluent [8,9]. The neutralization mechanism has been attributed to abiotic dissolution of calcite present in the sand [8,9] and may be applicable to other forms of acidic WW, similar to passive systems for treatment of acid mine drainage [10,11].
While there are in depth reports in the literature on determining and modelling particle shapes in sand [12,13,14], and it has been shown that stress pressure is the major factor influencing the size and shape of sand particles, including calcareous particles [15], there is little information in the literature comparing the shape and size of particles in sand with mixed mineralogy. Uing QEMSCAN® analyses [16,17], demonstrated differences in particle shape related to minerology in dune sand containing approximately 18% calcite and 81% quartz. In this case, it was found that the calcite particles were more angular and less round than the quartz particles. As shape plays a major role in particle packing, the hydraulic conductivity (HC) of the sand could not be predicted accurately using existing models which assume particle sphericity [17].
The dissolution kinetics of CaCO3 from the calcite is affected by the pH and partial pressure of CO2. Three heterogenous reactions usually take place simultaneously at the solid–liquid interface, namely: solid surface protonation where the H+ ions in solution diffuse to the solid surface (Equation (1)), surface interaction with carbonic acid (H2CO3) where it adsorbs to the surface of the calcite (Equation (2)), and surface hydration where the H2O migrates to an active site (Equation (3)) [18]. The exothermic dissolution reaction (Equation (4)) results in an increase in temperature of the solution and a decrease in calcite solubility [19]. Once solubilised, the products desorb into solution and migrate away from the reaction sites into the bulk solution [18]. Solubilisation is driven at lower pH values, while reprecipitation can take place when the pH of the WWW increases. While BSRs are effective at neutralizing acidic WWW, the longevity of the abiotic calcite dissolution process is unknown and cannot be modelled using kinetics due to the seasonal variability in the quality and quantity of this effluent, both inter- and intra-winery [8,9,20]. In addition, flow rates are confounded by the attachment of functional microbial biomass to the sand particles creating ever-changing porosities in the sand matrix [17]. The pH of the liquid is the most important parameter affecting calcite dissolution. Although WWW generally has a low pH and high sodium (Na) concentration, the pH varies from acidic to alkaline depending on the seasonal cellar practices taking place at the time of WWW generation [21,22].
CaCO3 + H+ ↔ Ca2+ + HCO3
CaCO3 + H2CO3 ↔ Ca2++ 2HCO3
CaCO3 + H2O ↔ Ca2+ + HCO3 + OH
CaCO3 ↔ Ca2+ + CO32−
This study was conducted in order to ascertain: (i) How BSR systems may function over time in terms of calcite removal viz how long before the abiotic neutralizing capacity is expended, (ii) Whether calcite dissolution kinetics can be improved by using different sand size fractions in BSRs, (ii) Whether calcite dissolution positively or negatively affects the HC of fractionated and/or raw sand, (iii) How results obtained from ex-situ column experiments may relate to field data from operational BSRs.

2. Materials and Methods

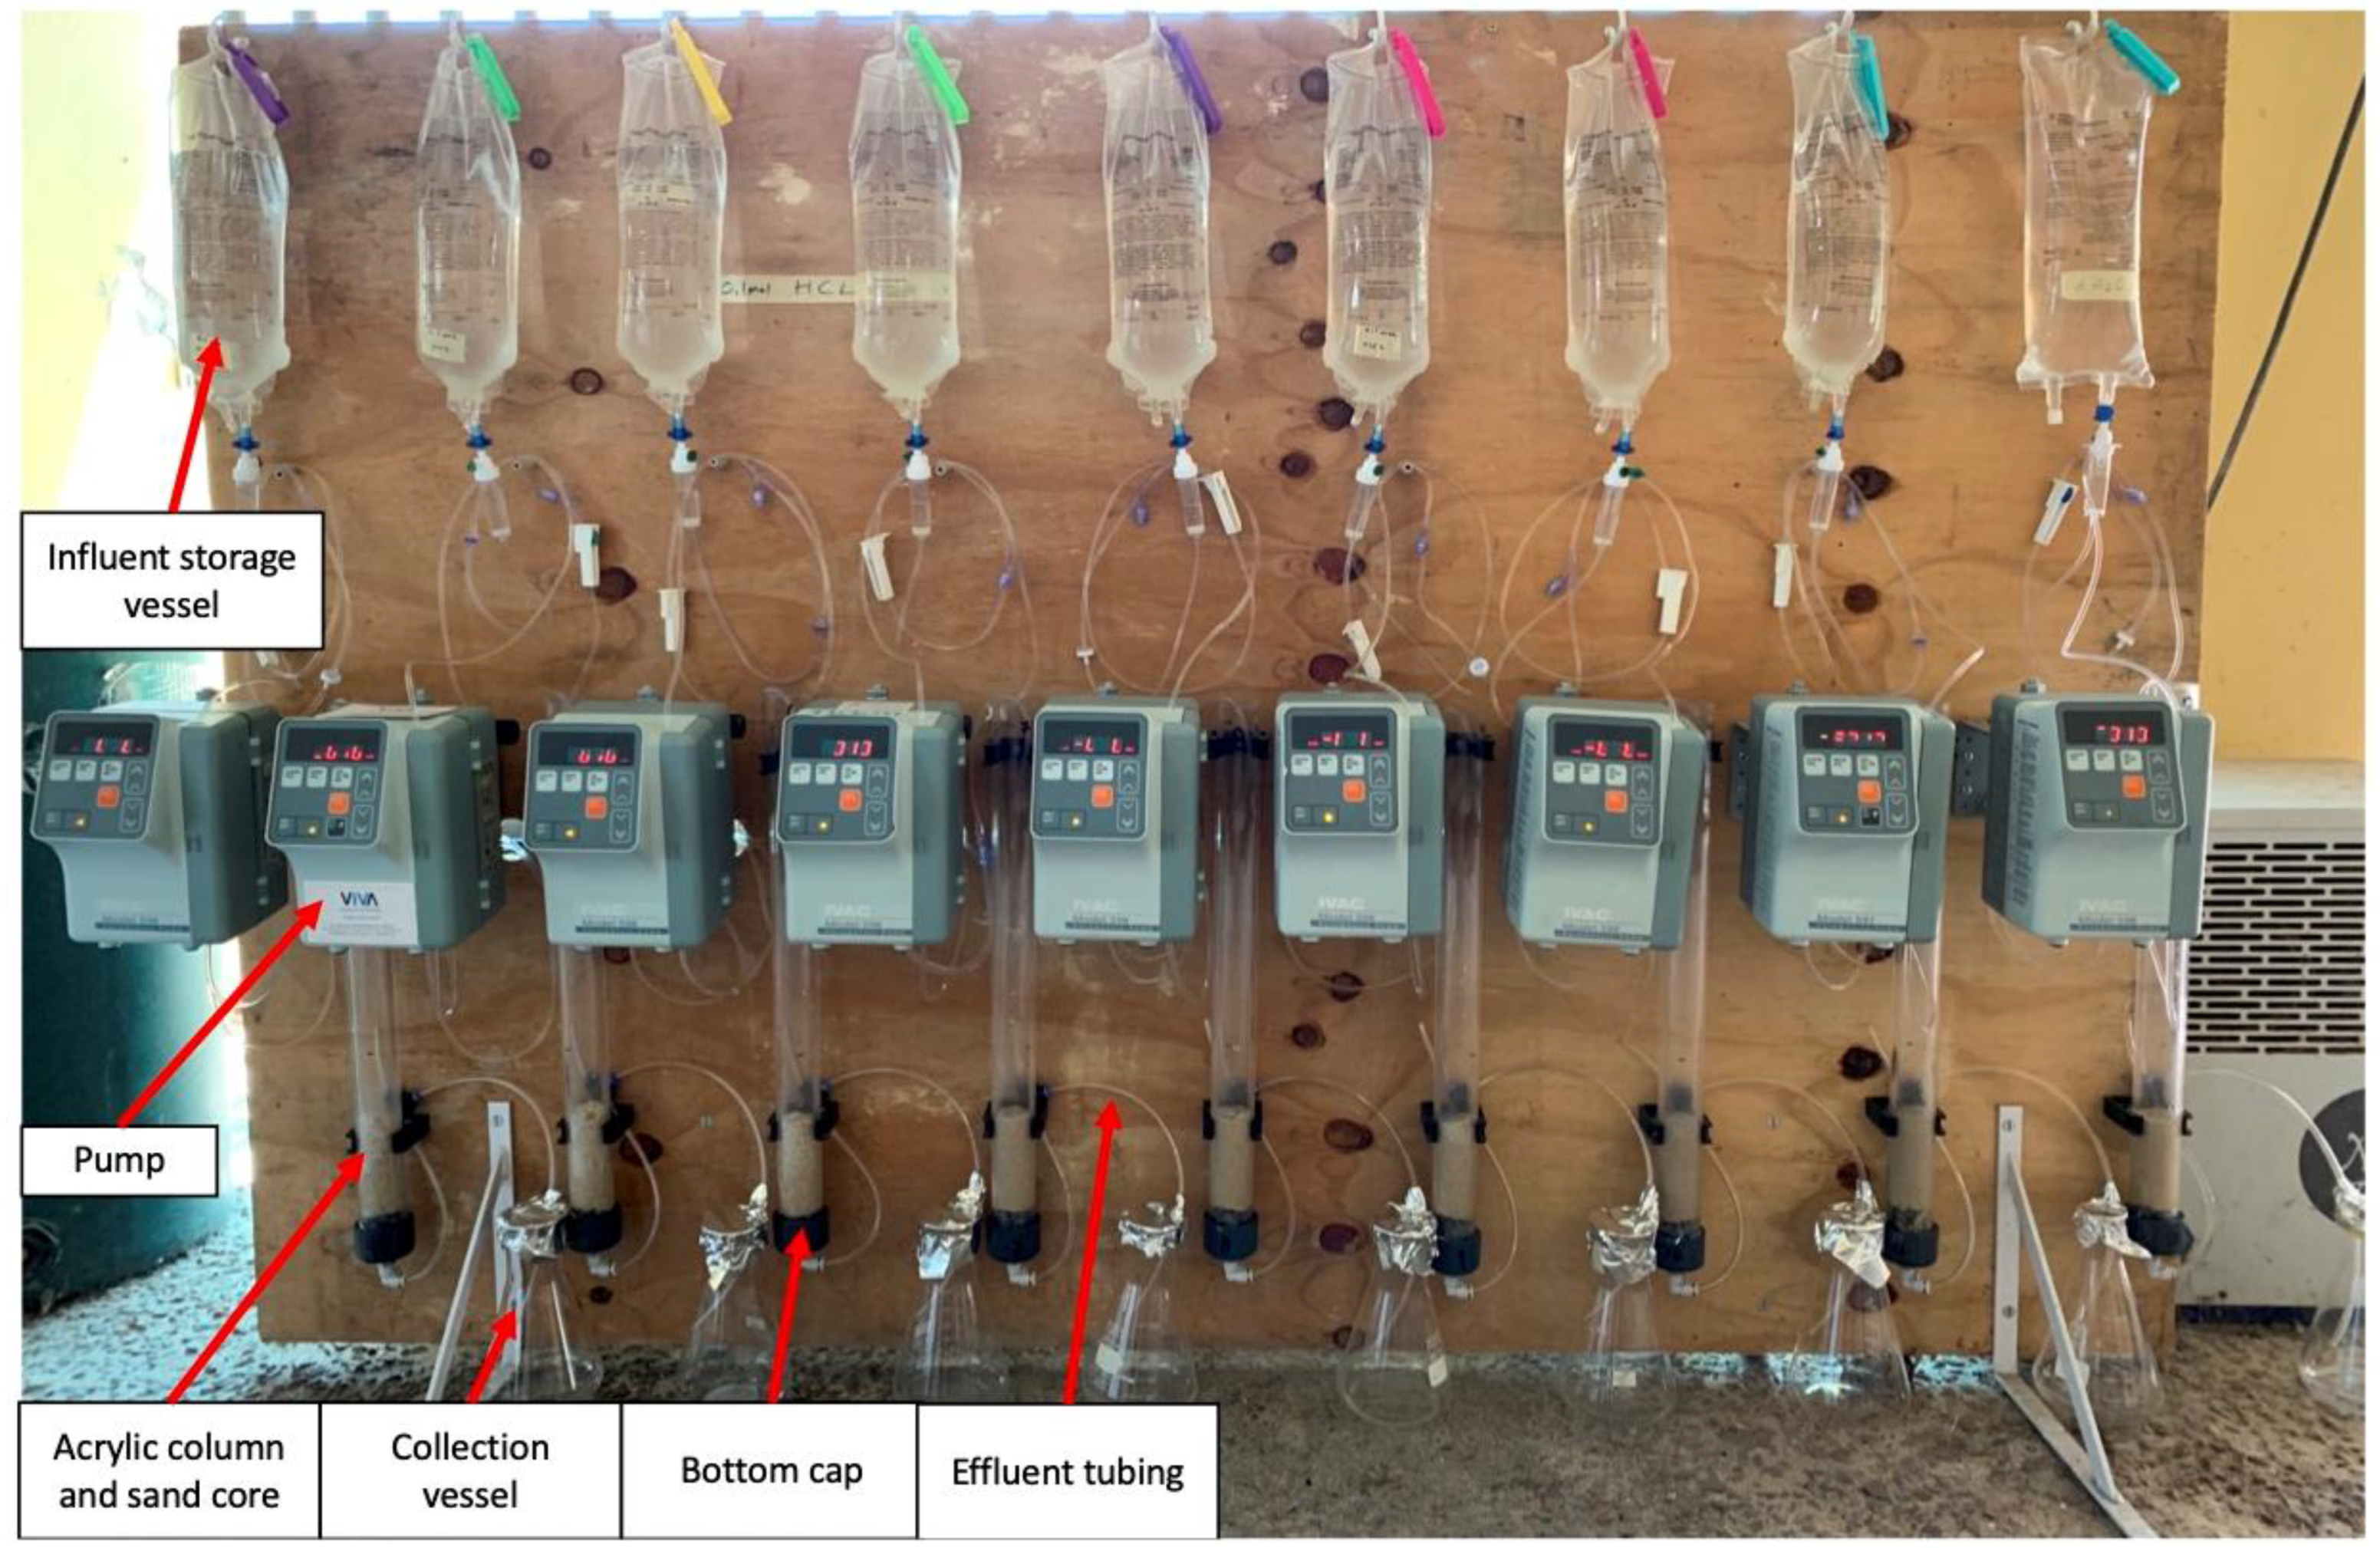
2.1. Column Experiments: Set-Up and Operation

The experimental set-up (Figure 1) consisted of a series of identical clear acrylic columns with internal diameters of 30 mm and lengths of 500 mm. The particle size distribution of the raw sand was determined (Section 2.4.2), and the sand was then partitioned into six different size fractions. Each column was filled with 100 g of Dune quarry sand from Philippi, Cape Town, South Africa with either raw (unfractionated) sand or sand with different size fractions (Table 1). The bottom caps of the columns consisted of stainless-steel screens and open cell polyurethane that retained the sand but did not impede the flow rate. The sand was saturated and allowed to settle for 24 h and the HC was determined by the falling head method using tap water as described in Section Calculation of Hydraulic Conductivity by the Falling Head Method. The columns were then placed in a 37 °C constant environment room overnight to allow the sand to dry.
Each column was dosed continuously with 2.5 L of either 0.1 M HCl (tests) or distilled water (dH2O) (negative control) using IVAC volumetric pumps (Model 597) at a flow rate of 10 mL·h−1 for a total of 10.4 days at a hydraulic retention time (HRT) of approximately 1.8 h and a hydraulic loading rate (HLR) of ±3850 L·m−3 of sand·day−1. The volume of influent was theoretically calculated according to Equation (1) to ensure complete dissolution of calcite in the original fraction of sand. The effluent was collected in enclosed Erlenmeyer flasks which were emptied daily, and the contents from each column was pooled and stored at 3 °C until the end of each respective column experiment. After the dosing period, the final HC was measured and the sand was allowed to dry at 37 °C and then weighed. Each experiment was conducted in triplicate.

2.1.1. Calculation of Operational Parameters

Calculation of Hydraulic Conductivity by the Falling Head Method

The HC or co-efficient of permeability (k) of a porous media is the ease of which water passes through it and is defined by Darcy’s Law. This can be rewritten in terms of the falling head conditions as in Equation (5):
k = (2.303aL/At)·Log10(h1/h2)
where a is the cross-sectional area of the standpipe, L is the length of the porous media, A is the cross-sectional area of the porous media, t is the time the liquid takes to drop from h1 to h2, and h1 and h2 are the start and stop levels above the outlet. In this study, in the HC experiment, h1 and h2 were 470 mm and 145 mm above the stainless-steel sieve, respectively. The times taken for the water to drop from h1 to h2 were recorded with a stopwatch. Each measurement was conducted in triplicate.

2.1.2. Hydraulic Loading Rate

The HLR was calculated in terms of the volume of sand within the column as previously described [8] and was on average 2244 L·m−3 of sand·day−1.

2.2. Biosand Filters: Set Up and Operation
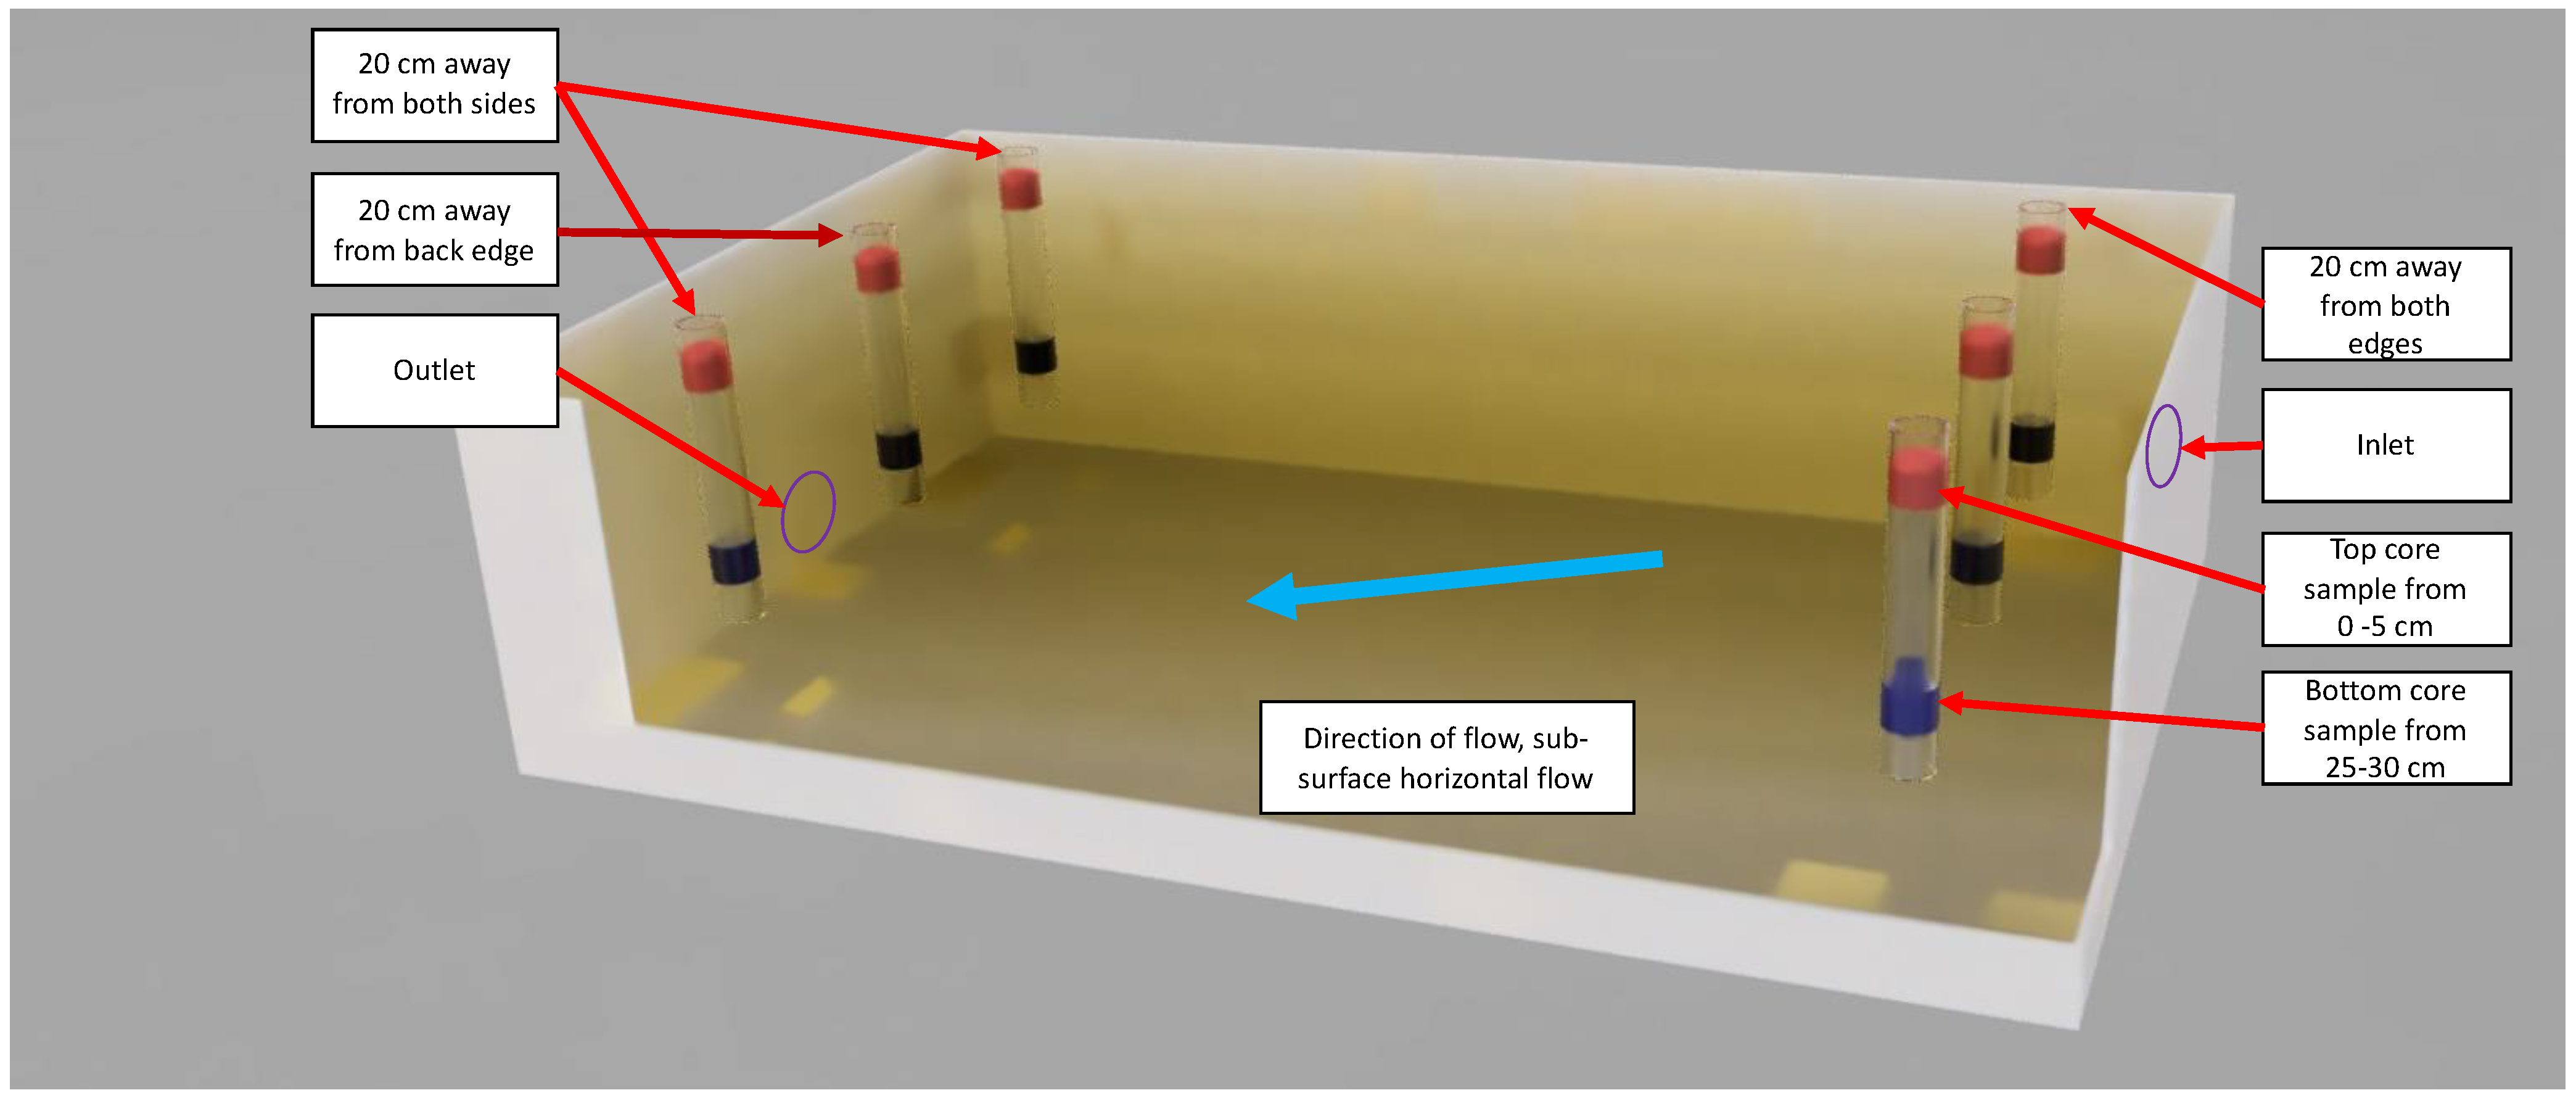
A novel pilot scale BSR/BSF was installed and operated at a small cellar within the Western Cape, South Africa. The system consisted of four units (1.73 × 1.05 × 0.42 m) filled with a total volume of 7.26 m3 sand which were gravity fed and operated in horizontal subsurface flow mode (Figure 2). The system treated approximately 402 L·day−1 or 137 L·m−3 of sand·day−1, and the performance results have been published elsewhere [8].

2.3. Sampling

For the column experiments, the effluent from each column was collected and analysed daily, then pooled and stored at 3 °C until the end of each experimental run. Samples of homogenised fractions and raw unfractionated sands (Table 1) were set aside before the start of the experiments. At the end of the experimental period, the contents of each column were homogenised and sampled.
In order to compare the ex-situ experimental data obtained with the columns with in-situ operational data, core samples were extracted from each of the 4 BSR modules each year for three years. At each sampling instance, six sand cores were extracted from each module (three from the inlet and three from the outlet, as shown in Figure 2). The contents of each core were partitioned into samples from the top (0–5 cm below the surface) and bottom (25–30 cm below the surface) of the BSRs. A total of 144 samples were collected (48 each year). All the sand samples were dried thoroughly before further analyses.
An additional set of samples were taken at 3.2 years at the inlet, middle and outlet from one filter at (0–5 cm below the surface) and middle (25–30 cm below the surface) bottom (45–50 cm below the surface) of the BSRs.

2.4. Analytical Procedures

2.4.1. Effluent

The pH of the daily and pooled effluent was determined according to the manufacturer’s instructions using a CyberScan pH300 meter and appropriately calibrated pH probe PHWP300/02K (Eutech instruments, Singapore). Concentrations of Ca in the pooled effluent samples were determined using a Thermo ICap 6200 ICP-AES plasma optical emission spectrophotometer (Thermo Fisher Scientific, Waltham, MA, USA) at the Central Analytical Facility at Stellenbosch university (Stellenbosch, South Africa) according to the manufacturers’ instructions.

2.4.2. Sand

The particle size distribution of the sand was performed according to SANS 3001 (Method AG1, PR5, AG21) by Cetlab, South Africa.
The sand samples were ground to a fine powder by swing milling and the elemental composition was determined by the Central Analytical Facility by X-ray fluorescence (XRF) spectrometry on a PANalytical (Almelo, The Netherlands) wavelength dispersive spectrometer according to the manufacturer’s instructions.
Fractionated samples of sand were analysed by automated scanning electron microscopy using a FEI QEMSCAN® (Quantitive Evaluation of Minerals by SCANning Electron Microscopy) instrument as previously described [23] (Thermo Fisher Scientific, Waltham, MA, USA) and iDiscover™ software. The roundness and aspect ratios of the different mineral fractions determined using the iDiscover™ software were used to compare the shapes and sizes of particles with different mineral compositions according to the method described by [16].

3. Results and Discussion

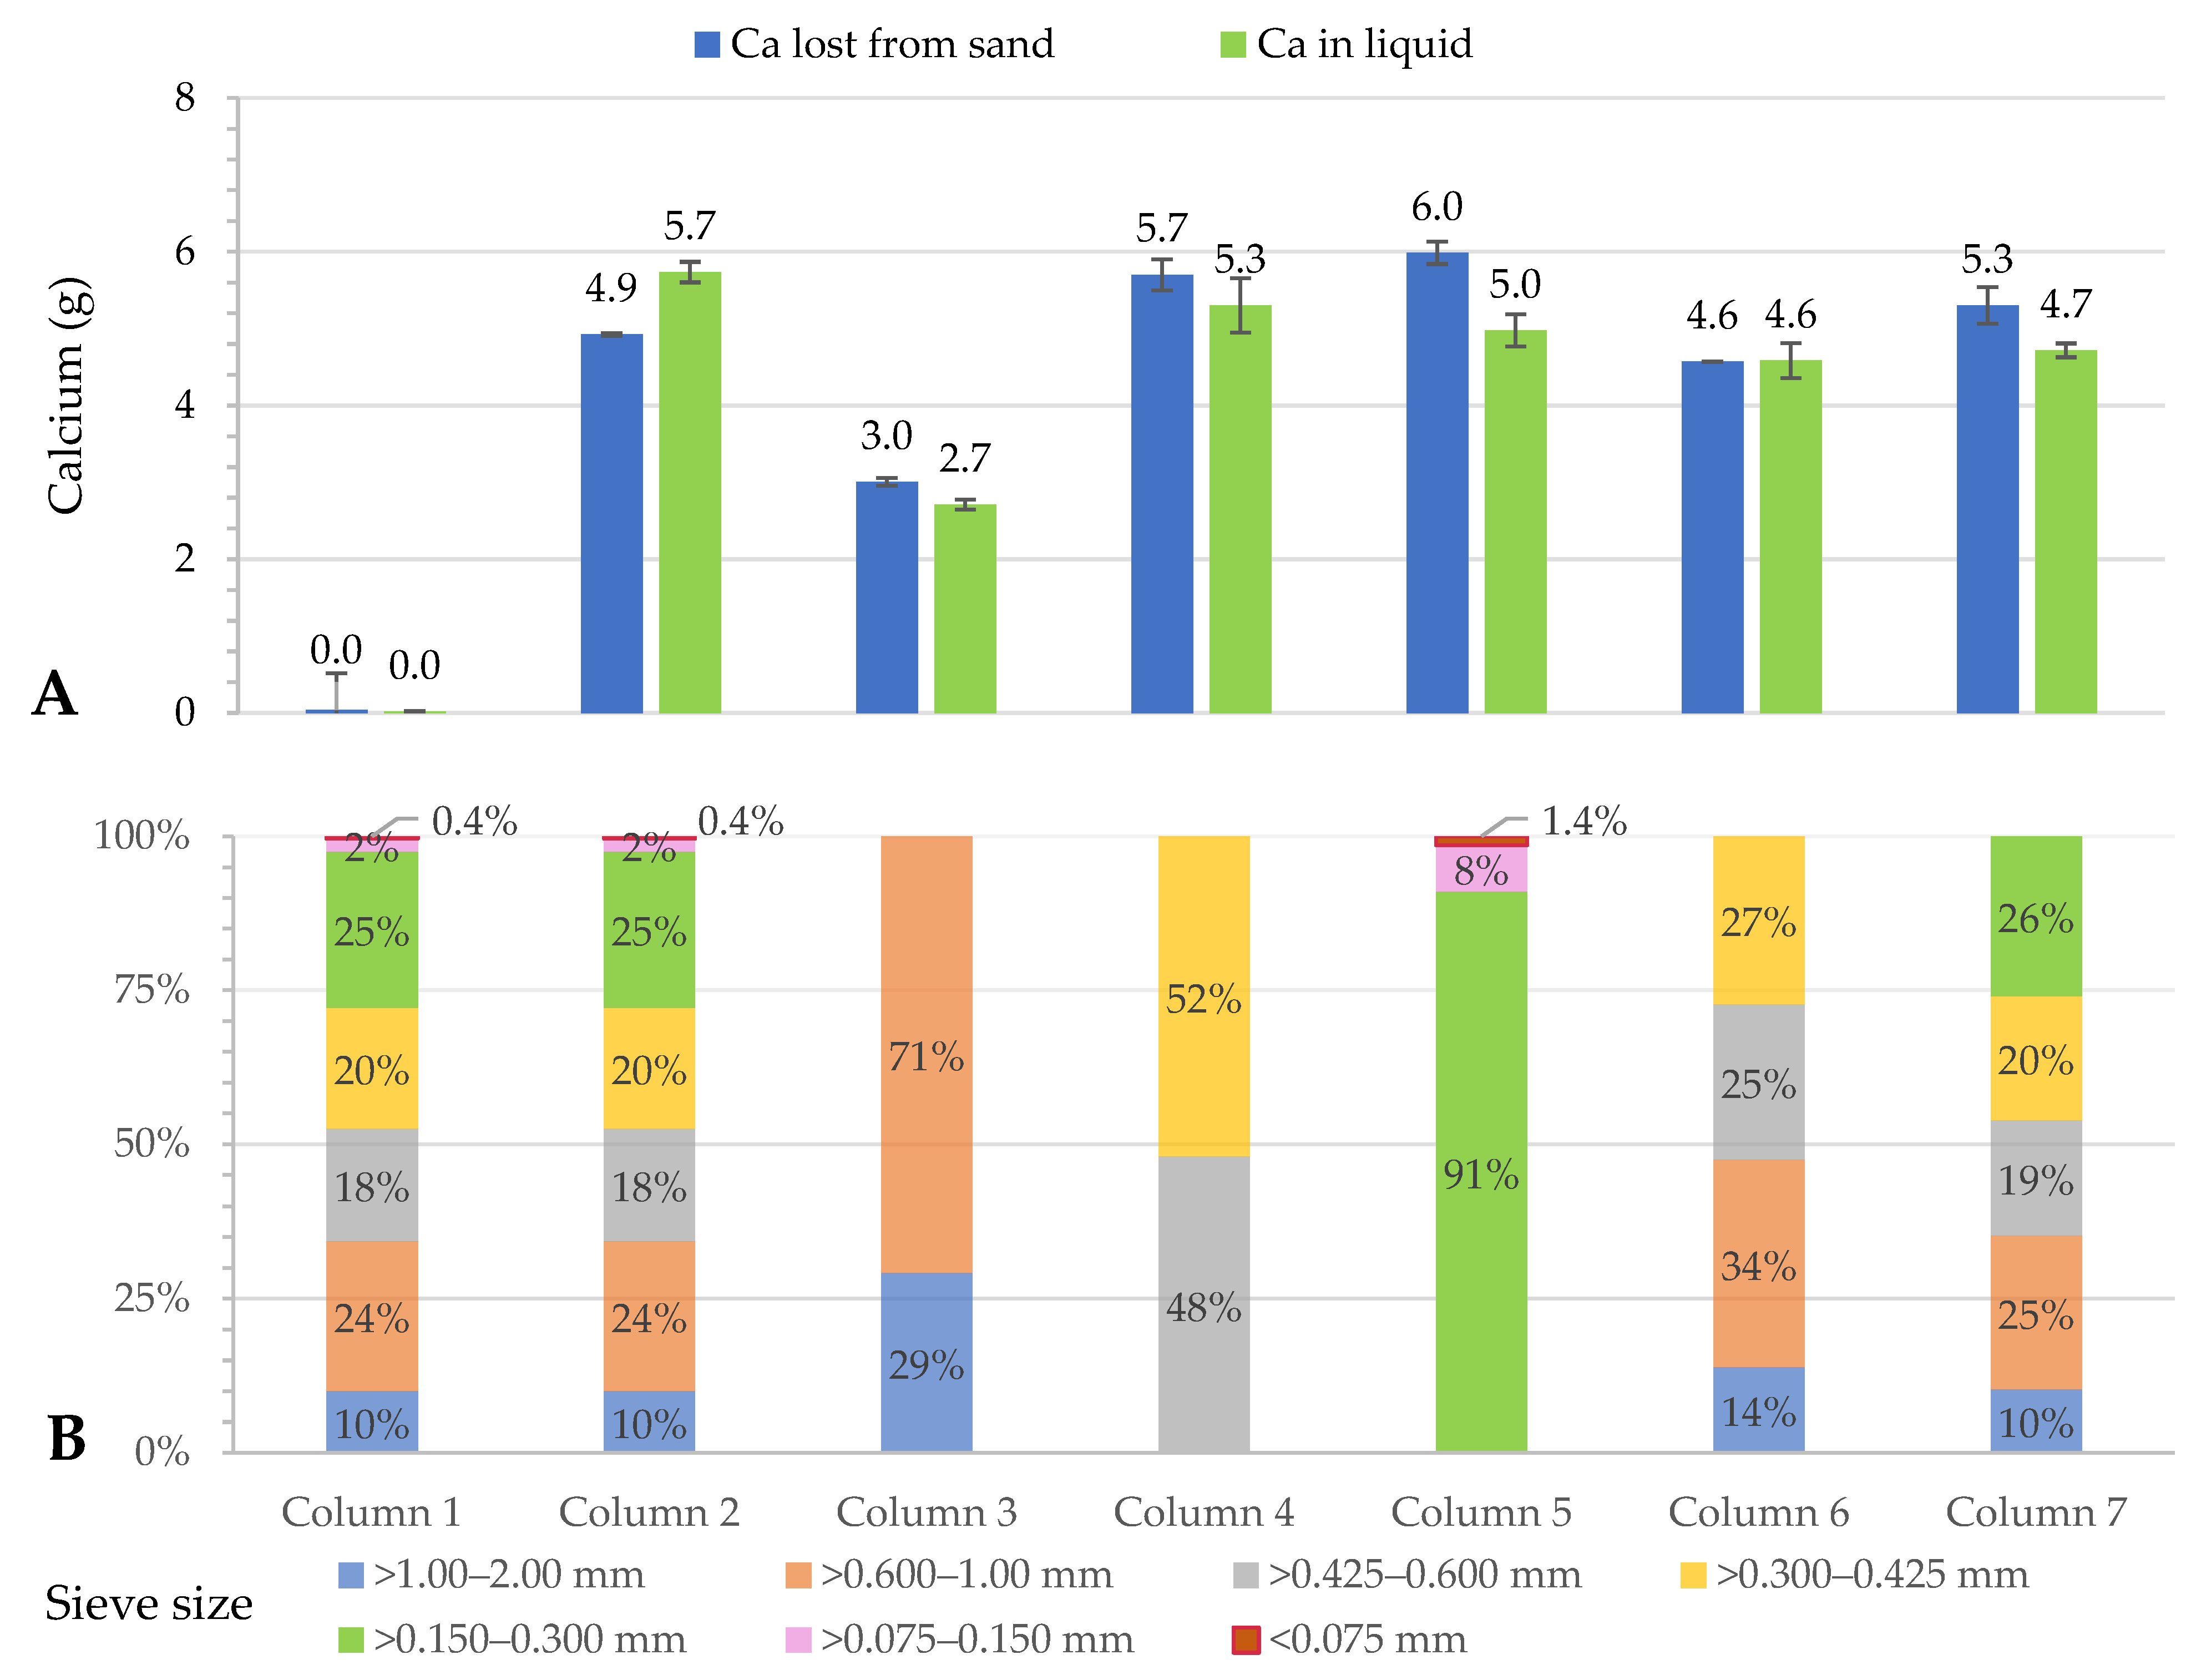
3.1. Calcite Dissolution in Raw Sand and Fractionated Sand: Column Experiments

The concentration of Ca was measured as an equimolar proxy for dissolution of CaCO3 from the calcite particles (Equations (1)–(3)). In order to cross check CaCO3 solubilisation, the total amount of Ca captured in the column effluent was compared with the total amount of Ca lost from the sand in the columns (Figure 3A). Results were generally in good agreement with one another, with no significant differences between the amount of Ca lost and Ca captured (p > 0.05, paired T-test).
Only negligible amounts (<1%) of CaCO3 were solubilised from the negative control columns containing raw unfractionated sand treated with dH2O (column 1, Figure 3). In the case of the test columns, less CaCO3 was mineralised in the columns containing the larger sand particles (column 3) than in the other columns. This was an anomaly unique to column 3 because: (i) the initial Ca concentration in the sand (3% wt.wt) was lower than in the other columns (4.8–6.8% wt.wt, Table 1), (ii) 99% of the Ca was removed during the experimental period, and (iii) the neutralization endpoint was achieved between day 6 and day 7 of the experiment (Figure 4). In comparison, neutralization endpoints were achieved after 10 days in the columns containing raw sand (column 2), and those with medium/large particles sizes only (columns 6 and 7), with 91%, 96% and 95%, respectively, of the Ca being solubilised. In contrast, only 84–85% of the Ca was solubilised in the columns that contained only small sand particles (columns 4 and 5), and no neutralization endpoint was achieved after 11 days. However, these columns contained the highest Ca concentrations (≥6.7 g), and the amount of HCl solution added was theoretically calculated to solubilise 5.00 g CaCO3.
Overall, as shown in Figure 4 there were no significant differences in the average pH values measured in the effluent from the test columns (2–7) over the first 5 days of the experimental period (ANOVA: F crit > F, p > 0.05), indicating that CaCO3 solubilisation may not be significantly affected by particle size provided sufficient calcite is available. The results clearly demonstrate that from a long-term neutralization perspective, it is important to include sand particles with higher calcite concentrations in BSRs. In this study, more of the smaller sand particles were composed of calcite, as discussed in more detail in Section 3.3. This may also be beneficial in terms of dissolution kinetics because the overall reaction surface area is larger with smaller particles [10].

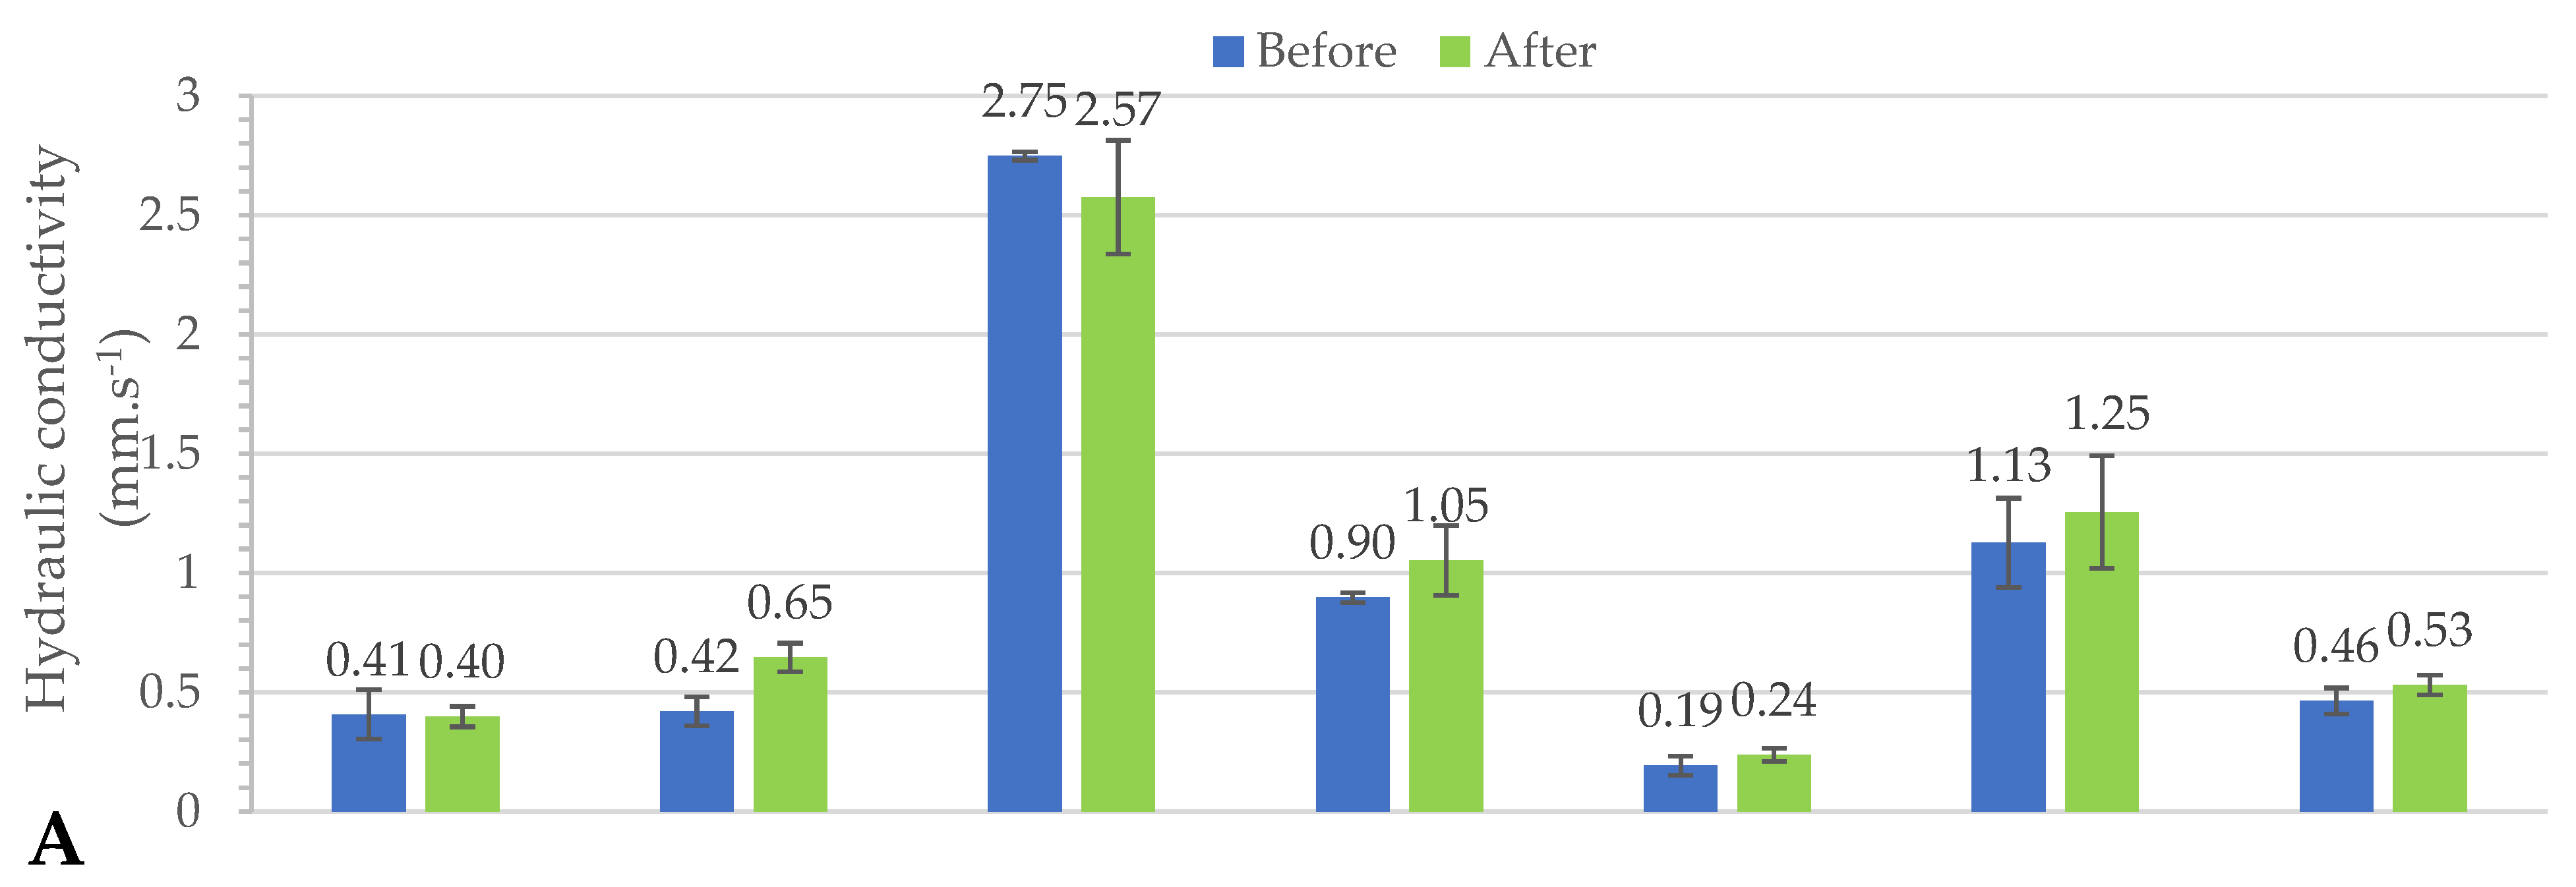
3.2. Hydraulic Conductivities of Raw and Fractionated Sand: Column Experiments

The column CaCO3 dissolution experiments (Section 3.1) provided insight into which fractions of sand and combinations thereof can maximise the capacity of BSRs to neutralize acidic WW such as WWW. However, the HC of BSRs needs to be maintained at rates that will allow sufficient HRT for treatment but not impede the flow to the extent where the treatment capacity becomes limited [9,24]. For spherical sand particles, the HC increases as the particles increase in size and/or become less uniform in size [25,26]. More holistically, the particle size, particle size distribution (PSD) and particle morphology all influence the manner in which the particles physically pack together [27,28,29]. The porosity as well as the intrapore distribution space are key parameters influencing the HC, and these are dependent on particle packing [27,28,29].
To determine whether particular fractions of sand particles, or combinations thereof could offer both good flow properties as well as neutralization efficiencies, the HCs of the sand-containing columns were experimentally determined (Figure 5). There were no significant differences (p > 0.05, paired T-test) in the HC measurements taken before and after CaCO3 solubilisation, indicating that the loss of the calcite particles did not have a negative effect on particle packing. The HC measurements in column 3 containing the largest particles (>0.6 to 2 mm) were more than 10-fold higher than those in the columns 1,2 and 5 containing the smallest particles (≤0.150 mm). In all the columns containing fractionated sand mixes without particles ≤0.150 mm (columns 3, 4, and 6), the HC was higher than that in the columns containing raw (unfractionated) sand. The second highest HC was measured in the columns containing all fractions of sand >0.150 mm (column 6); however, this was only half the HCs measured in the columns containing the larger particles (column 3) but double the HC of the raw sand (columns 1 and 2).
In summary, the column experiments showed that prudent fractionation of sand particles can increase the HC of sand-based treatment systems significantly. As expected, the columns with the most and least efficient HCs were those containing the largest and smallest particles, respectively. The converse was true when considering the neutralization capacity (Section 3.1). When designing BSR systems, if the HC of raw sand is too low to achieve design HLRs, it may justify the cost of fractionating the sand. Following this, it should be considered which fractions of sand afford the best treatment performance. In this study, there was a trade-off between achievable flow rates and neutralization capacity. It must also be noted that while neutralization of acidic WW was emphasised in this study, other important factors such as the bioremediation capacity may also differ between sand fractions.

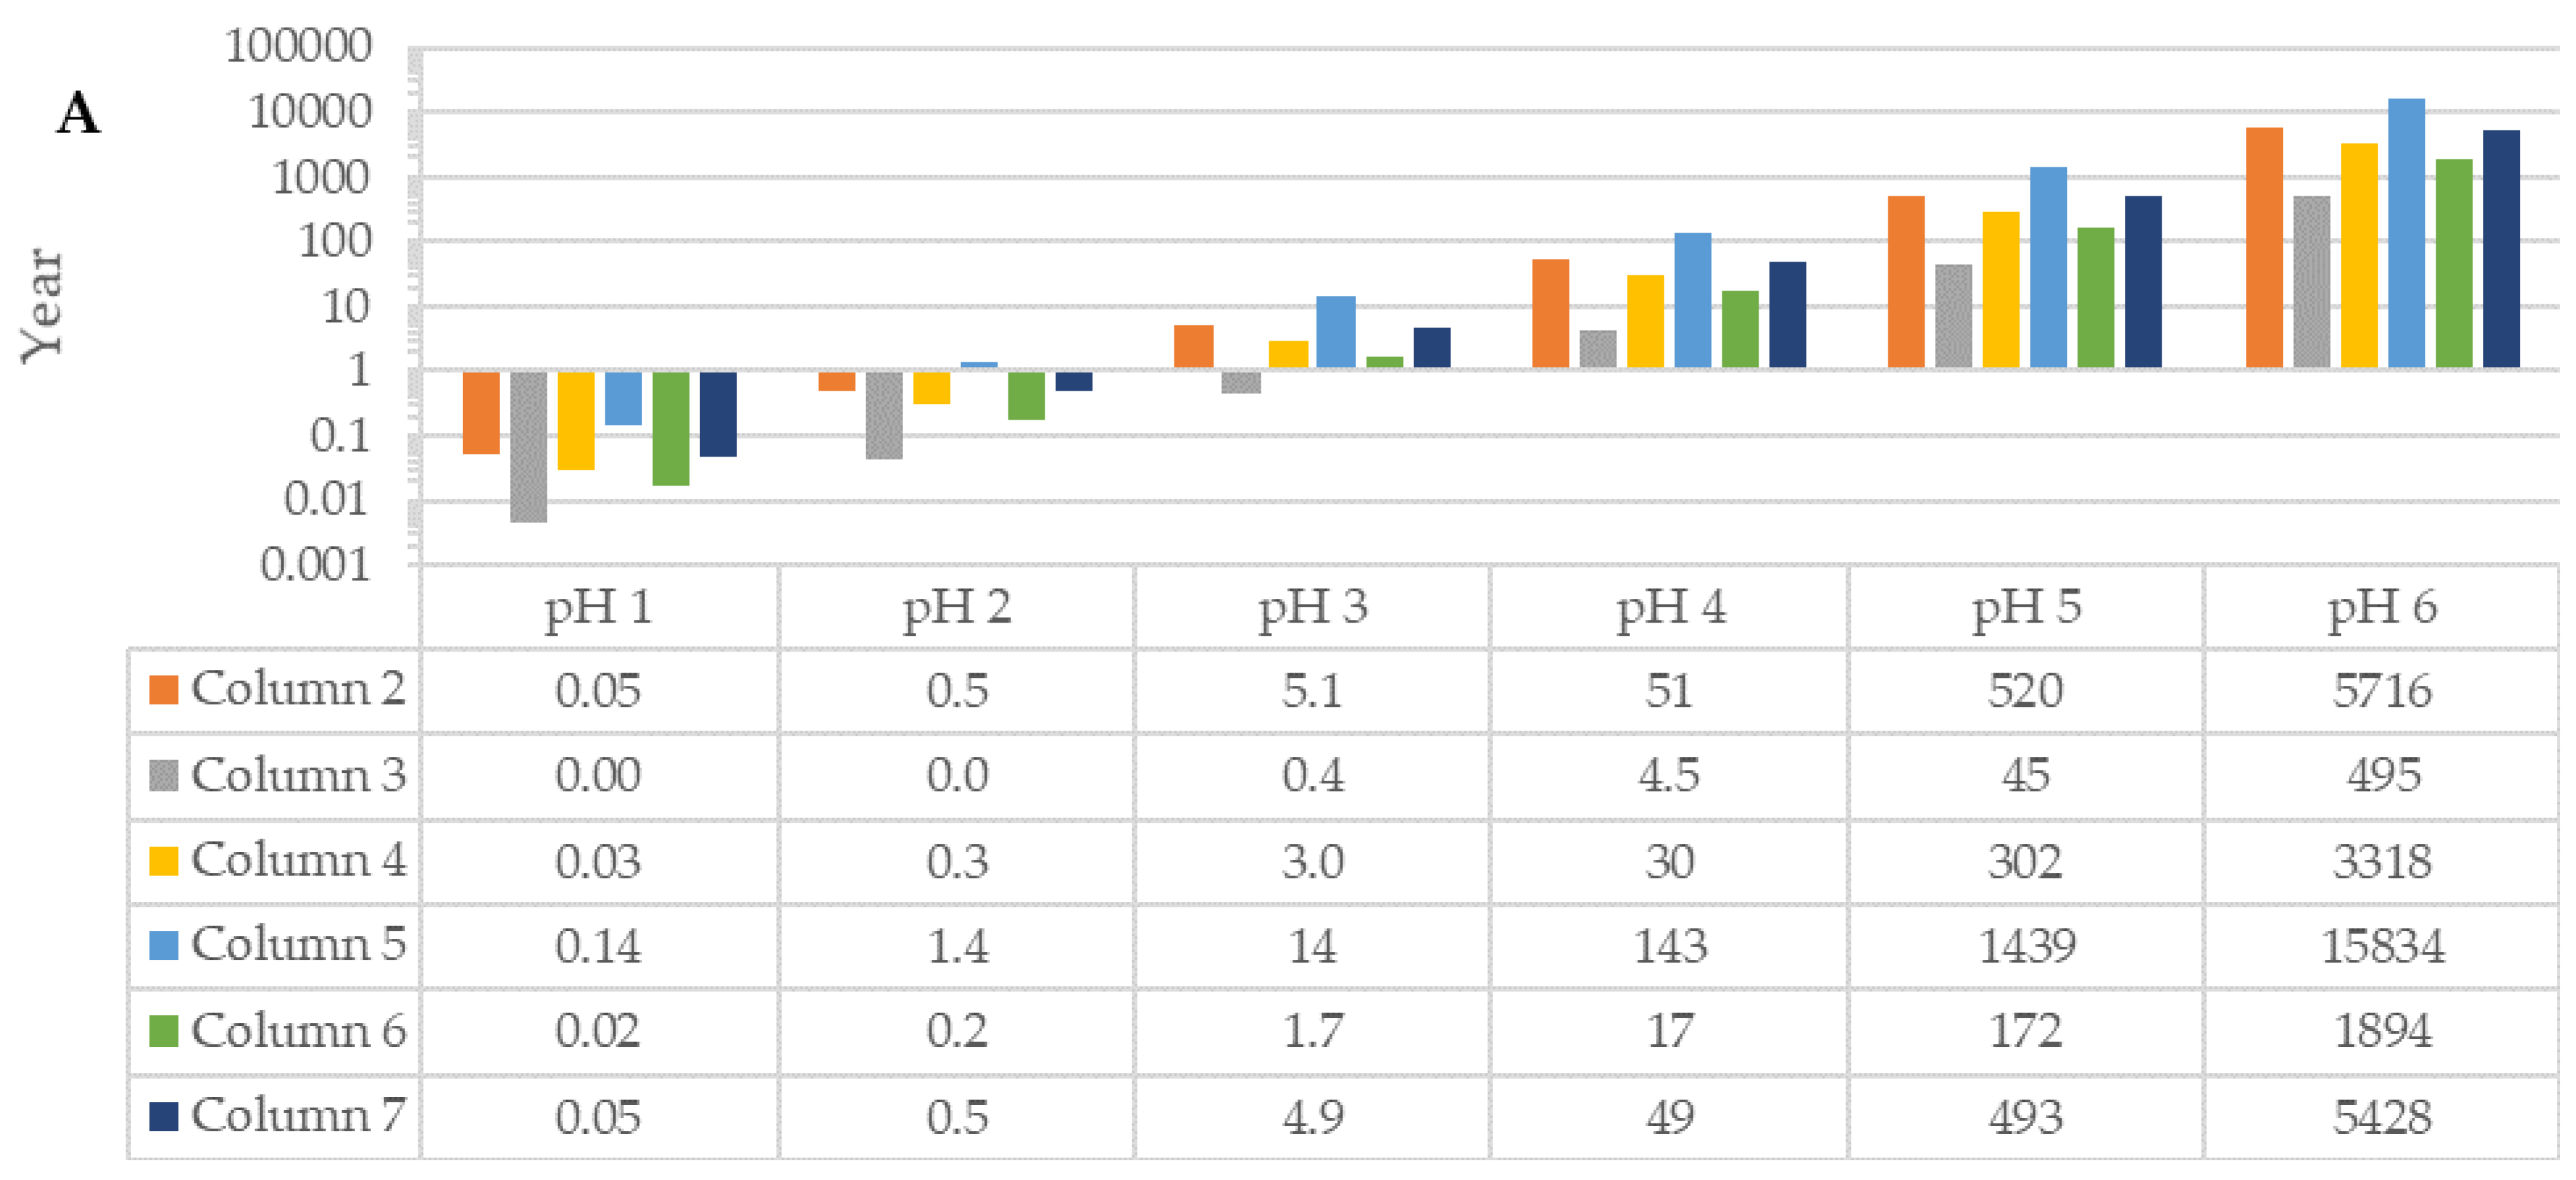
3.3. Temporal Abiotic Neutralization Capacity (TANC) of Biological Sand Reactors

3.3.1. Theoretical Values Based on Data Obtained from Column Experiments

To date, operational BSR systems have been filled with raw (unfractionated sand) [8,9]. In the column replicates containing raw sand (5.4 ± 0.01 g), the neutralization endpoint was reached after 10 days, and 91% of the Ca in the columns was solubilised and washed out after 11 days. These results indicated that 9% of the calcite in the raw sand was recalcitrant to solubilisation and/or that preferential flow paths existed within the column intra-pores so that some calcite particles were not exposed to the acidic influent. The latter is more likely, as smaller particles can fill the void spaces afforded by larger particles, hampering flow on a spatial level, as evidenced by low HC values previously measured using sand with mixed grain sizes [17].
The longevity of BSRs in terms of the temporal abiotic neutralization capacity (TANC) is theoretically affected by three main factors: the available calcite, the HC (or flow rate), and the influent WW composition. The pH is the most important WW parameter affecting calcite dissolution kinetics. Although the calcite in a particular batch of sand is finite, it is anticipated that the neutralization capacity may be supplemented in a dedicated upstream or downstream process similar to a permeable reactive barrier (PRB) once the calcite within BSRs is expended [30].
Simplified reaction kinetics (Equation (6)) using the major overall chemical reaction were used to determine the TANC of BSR systems containing the raw sand and the different sand fractions used in the column experiments. Based on Equation (4), Equation (7) was formulated to calculate the longevity of BSRs per cubic meter of sand by using the mass of available calcium concentration with the sand and dividing it by the amount of H+ applied to the sand due to the influent pH values (Ca as a proxy for CaCO3).
CaCO3 + 2HCl ↔ CaCl2 + CO2 + H2O
Tyears = %Ca × ρ ÷ (731.4235 × Q × (10−pH − 10−7))
In Equation (7) the %Ca is the percentage calcium available in the sand, ρ is the density of the sand, Q is the flow rate of a reactor expressed in L·m−3 of sand·day−1, and 731.4235 is a constant for converting the molar masses of Ca to H+ required per annum at a given Q. The pH is converted into the concentration of H+, and effluent pH values > 7 are ignored.
The theoretical TANCs based on a pilot BSR system containing raw sand from the same quarry site and operated in horizontal subsurface flow mode [8] were calculated for the raw sand and different sand fractions used in the column experiments. The experimental HCs measured in the column experiments (Figure 5A) were notably higher than the actual HC (0.040 mm·s−1) calculated from the in-situ flow rates (150 L·m−3 of sand.d−1) in the pilot BSR system [8].
When flow rates were extrapolated from the experimental HCs determined in the column experiments to the scale (0.735 m3) of the pilot BSR system, the TANC ranged from around 2 months to over 15.8 centuries for influent with pH values ranging from 2 to 6 (Figure 6A). The HC values for the columns containing raw sand (column 2 replicates) and the columns with the highest HC and least amount of Ca (column 3 replicates) would translate into theoretical flow rates of 2400 L·m3 of sand·day−1 and 15,600 L·m3 of sand·day−1, respectively, in the BSR system. Although such high flow rates can increase treatment capacity, the RTs of 10.4 and 1.5 h, respectively, would be insufficient for effective WW bioremediation. In reality, BSRs can be designed with mechanisms to retard flow rates/RTs and, to a lesser extent, to increase flow rates [9].
The HC values obtained in the column experiments did not account for the accumulation of functional biomass, which was shown to reduce the HC by up to 80% without problematic clogging [8]. The microbial biomass in sand-based systems promotes not only biodegradation, but also flocculation, adsorption and interception [31].
Taking all these factors into account, the TANCs were re-calculated using the actual HC achieved in the pilot BSR system (Figure 6B). In each case, the values increased. For example, the theoretical TANC of a BSR containing the same sand as column 2 increased from around 6 months to 8 years and from 5 to 90 centuries at influent pH values from 2 to 6, respectively.

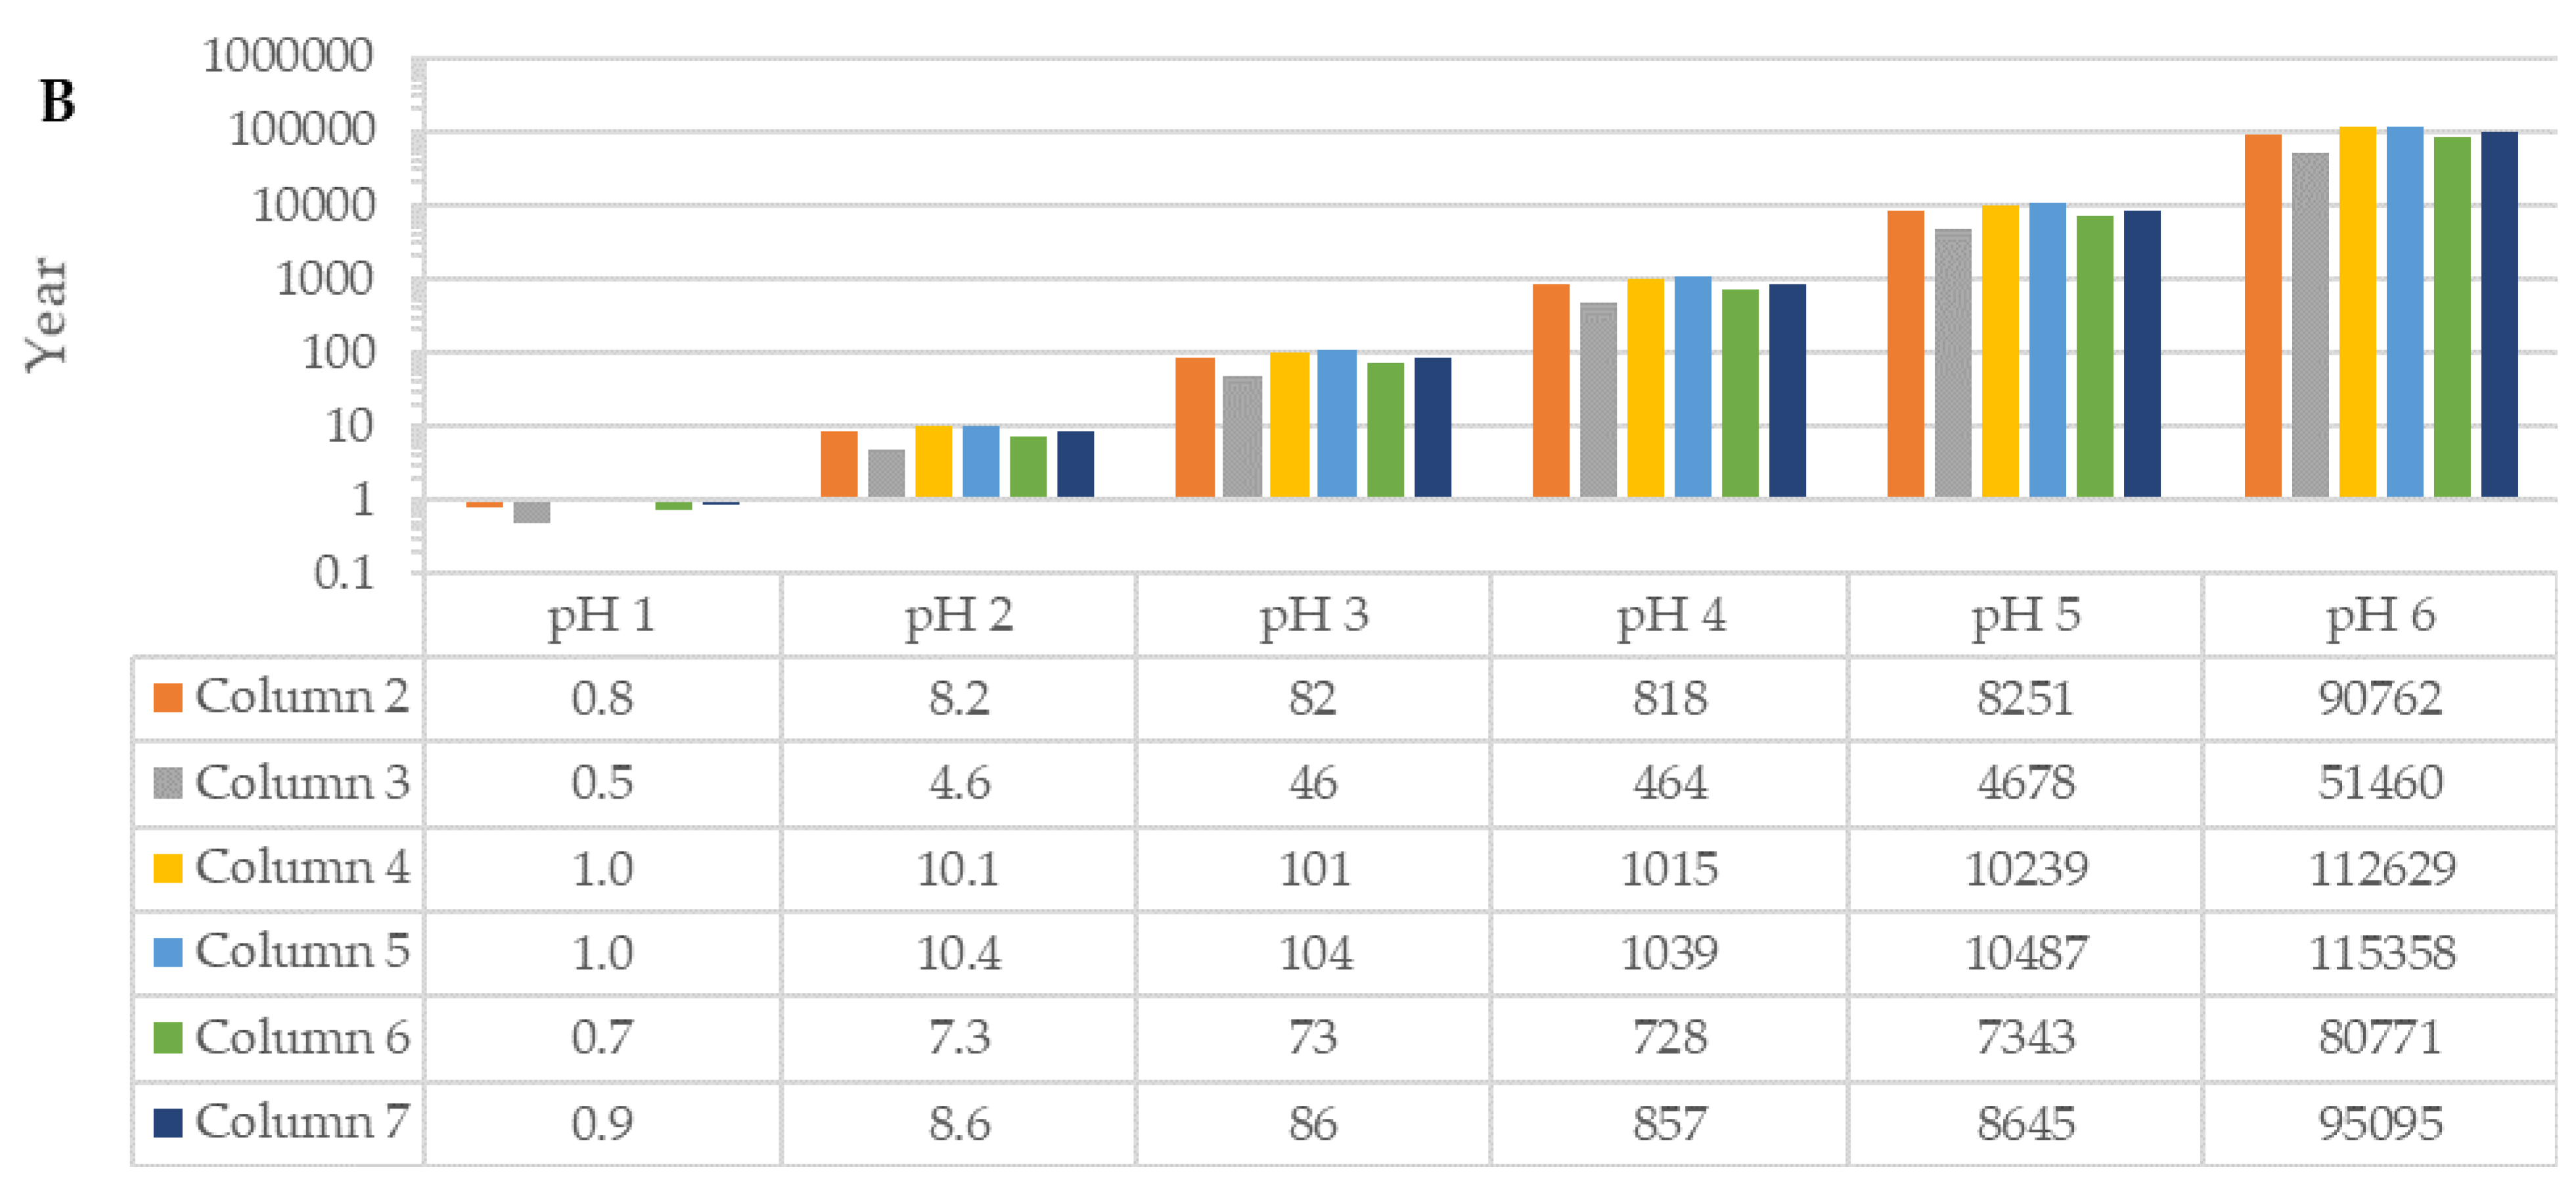
3.3.2. Validation of Theoretical Results with Data Obtained from Operational Biological Sand Reactors

In order to validate the TANC results obtained using Equation (7) (Figure 6), a three-part approach was adopted using the results from the on-site BSR system and the measured flow rates of that system. Three chemical parameters were assessed: (i) the Ca concentrations in sand cores taken annually over a three-year period, (ii) The difference in Ca concentrations between influent and effluent (Ca solubilised), and (iii) the average H+ of the influent calculated from the pH values [8].

Results Based on the Calcium Concentrations in Core Samples

The Ca was preferentially removed from the top inlet of the BSR modules, with negligible removal in the other core samples (Figure 7A). The different spatial results were anticipated as the WWW is expected to become gradually less acidic as it passes through the BSR modules, perhaps even precipitate again as CaCO3 in some instances towards the outlet. Despite the spatial variation, it was estimated from averaged inlet, middle and outlet core results taken after 3.2 years of operation that 8.6% of the calcite or a 5.3 kg Ca·m−3 of sand·year−1 had been solubilised (Table 2), translating into a TANC of approximately 37 years with an influent of the same strength and composition.

Results Based on Influent and Effluent Calcium Concentrations

The Ca concentration increased by an average of 24 ± 32 mg·L−1 from influent to effluent, which translates into a removal of 1.3 kg ± Ca·m−3 of sand·year−1 as previously published [8]. The initial Ca concertation in the sand was 159 kgCa·m−3 of sand (9.6% wt.wt), which would result in a TANC of 132 years.

Results Based on Influent pH Values

The pH measurements in the WWW influent ranged from 4.55 to 7.95 (n = 33) as previously published by [8]. The amount of Ca that could theoretically be solubilised for the amount of H+ added was 0.003 mol·year−1, indicating a TANC of 17,652 years using Equation (7).
In summary, the three approaches provided notably different results ranging from 37 years to 17,652 years. Amongst other factors, the accuracy of the results based on the influent and effluent values was compromised by the variability of WWW and temporal sampling, while those based on Ca removal from the BSRs were compromised to a lesser extent by the spatial variation in calcite dissolution. Nonetheless, the preservation of calcite within the middle and outlet of the BSRs after 3.2 years provided unequivocal evidence of system longevity. The TANC of 37 years based on temporal changes in the %Ca in the extracted cores compared favourably with the theoretical TANC based on the results obtained from column 2 containing raw sand, with the actual BSR flow rates for influent with pH between 2 (8.2 years) and 3 (82 years).

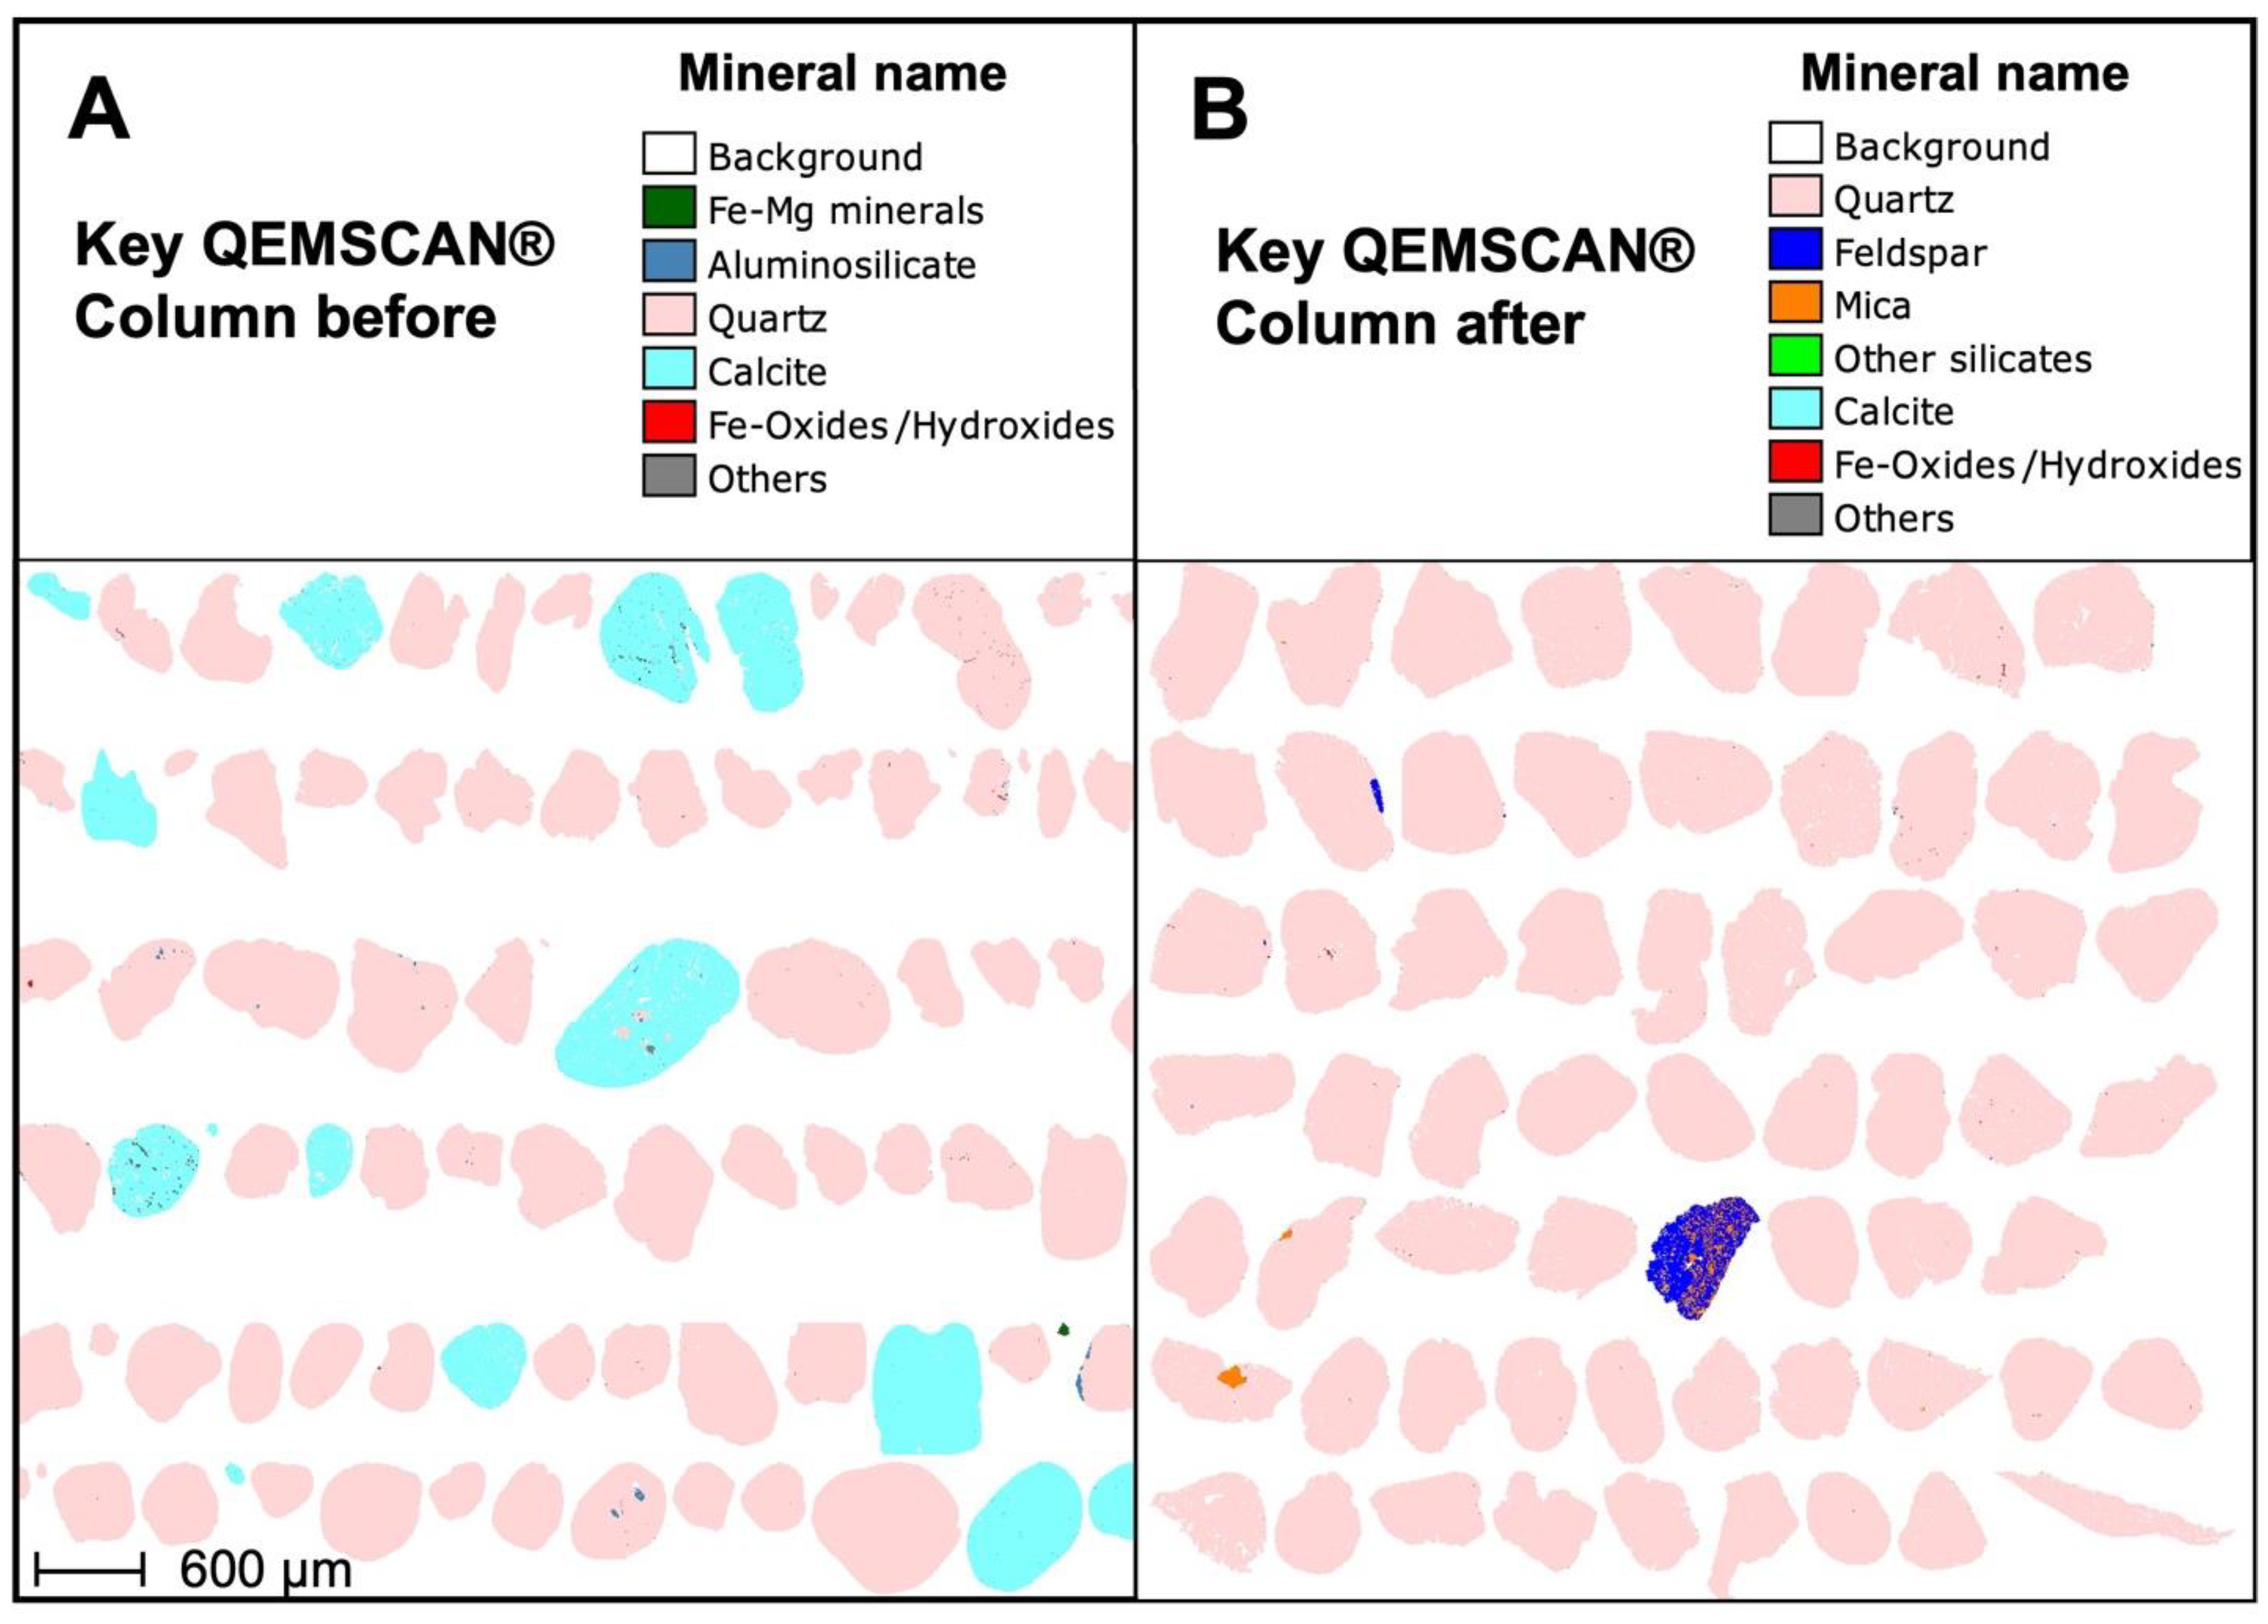
3.4. Changes in the Character of the Sand Particles before and after Calcite Dissolution in Columns and Biological Sand Reactors

The changes in the character of the sand particles after calcite dissolution were assessed using two batches of raw sand from the same quarry site, namely, the sand used in the column experiments, and the sand used in the BSR system. Only sand taken from the top inlet area of the BSRs was used to assess changes in the BSR system sand as negligible calcite dissolution was observed in the other spatial niches (Table 2). In the case of the columns, the calcite was dissolved artificially using HCl, while in the BSRs, real WWW was responsible for any dissolution that occurred.

3.4.1. Chemical Composition of Sand

The major minerals and accompanying elements in both batches of sand were calcite and Ca, and quartz and Si, respectively. In both batches of sand, decreases in Ca and calcite were accompanied by relative increases in Si and quartz (Table 3 and Table 4). Other elements and minerals were only present in very low concentrations, and only negligible relative or actual increases or decreases occurred (Table 3 and Table 4).
In the columns, the %Ca and calcite were reduced by 91%, and 99.9%, respectively (Table 3 and Table 4), indicating almost complete dissolution of calcite, but there was some residual Ca, either alone or complexed with other anions in the sand. In contrast, in the BSRs, the %Ca and calcite were reduced by 57% and 29.7%, respectively, after 3 years of operation. The absence and presence of calcite in the column and BSR sands at the end of the respective experimental periods were determined by QEMSCAN® using thousands of automated digital images, an example of which is shown in Figure 8 The anomalous result between the %calcite and Ca reduction in the BSFs can be explained by the addition of Ca from the influent WWW which contained an average of 36.2 mg·L−1 Ca (range 6.6 to 104.0 mg·L−1) [8].

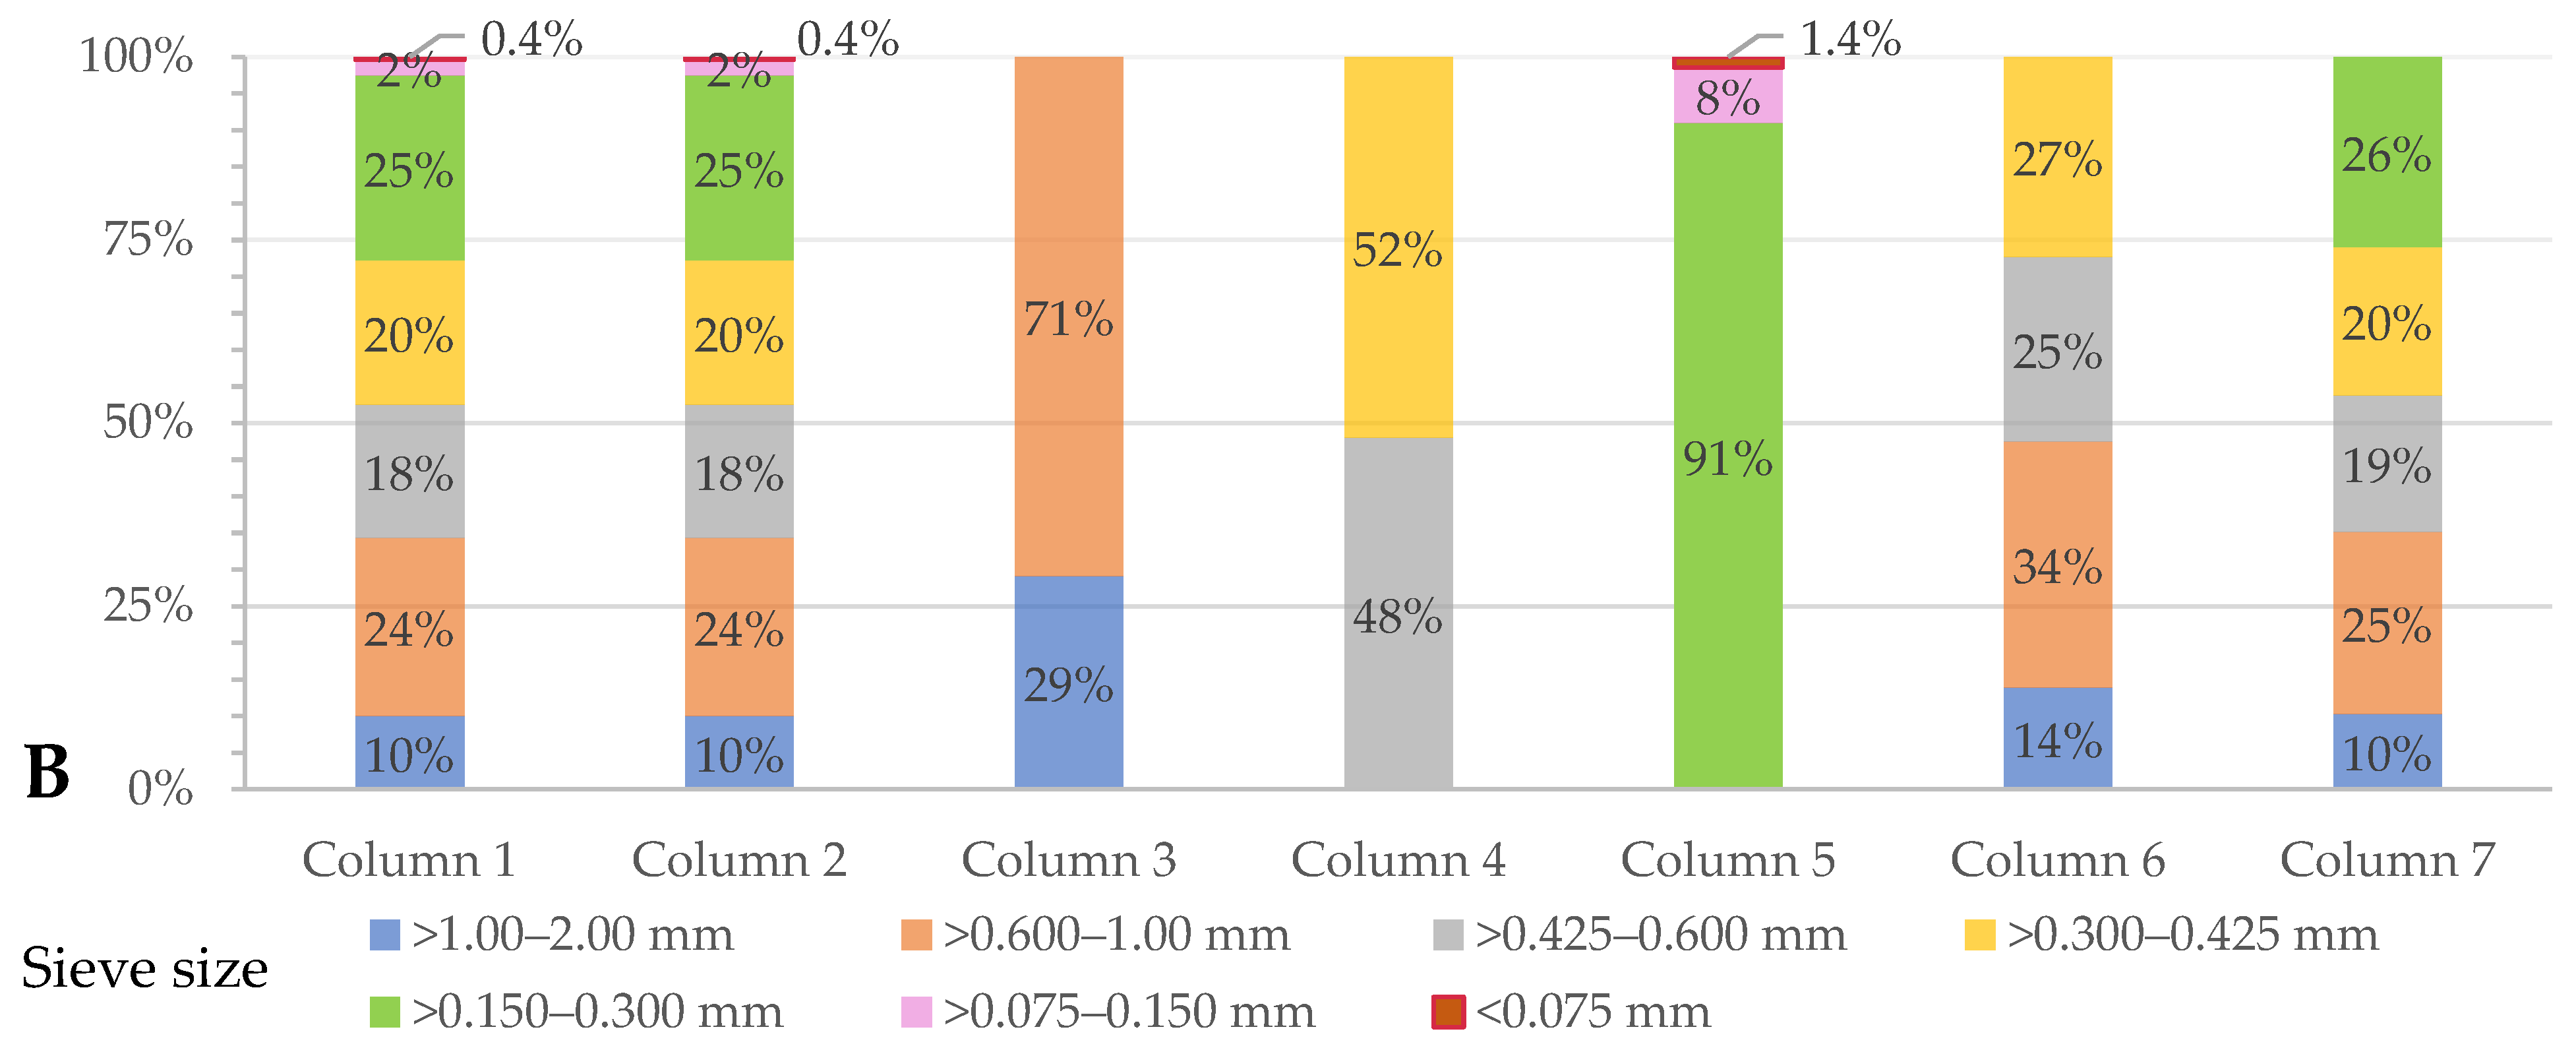
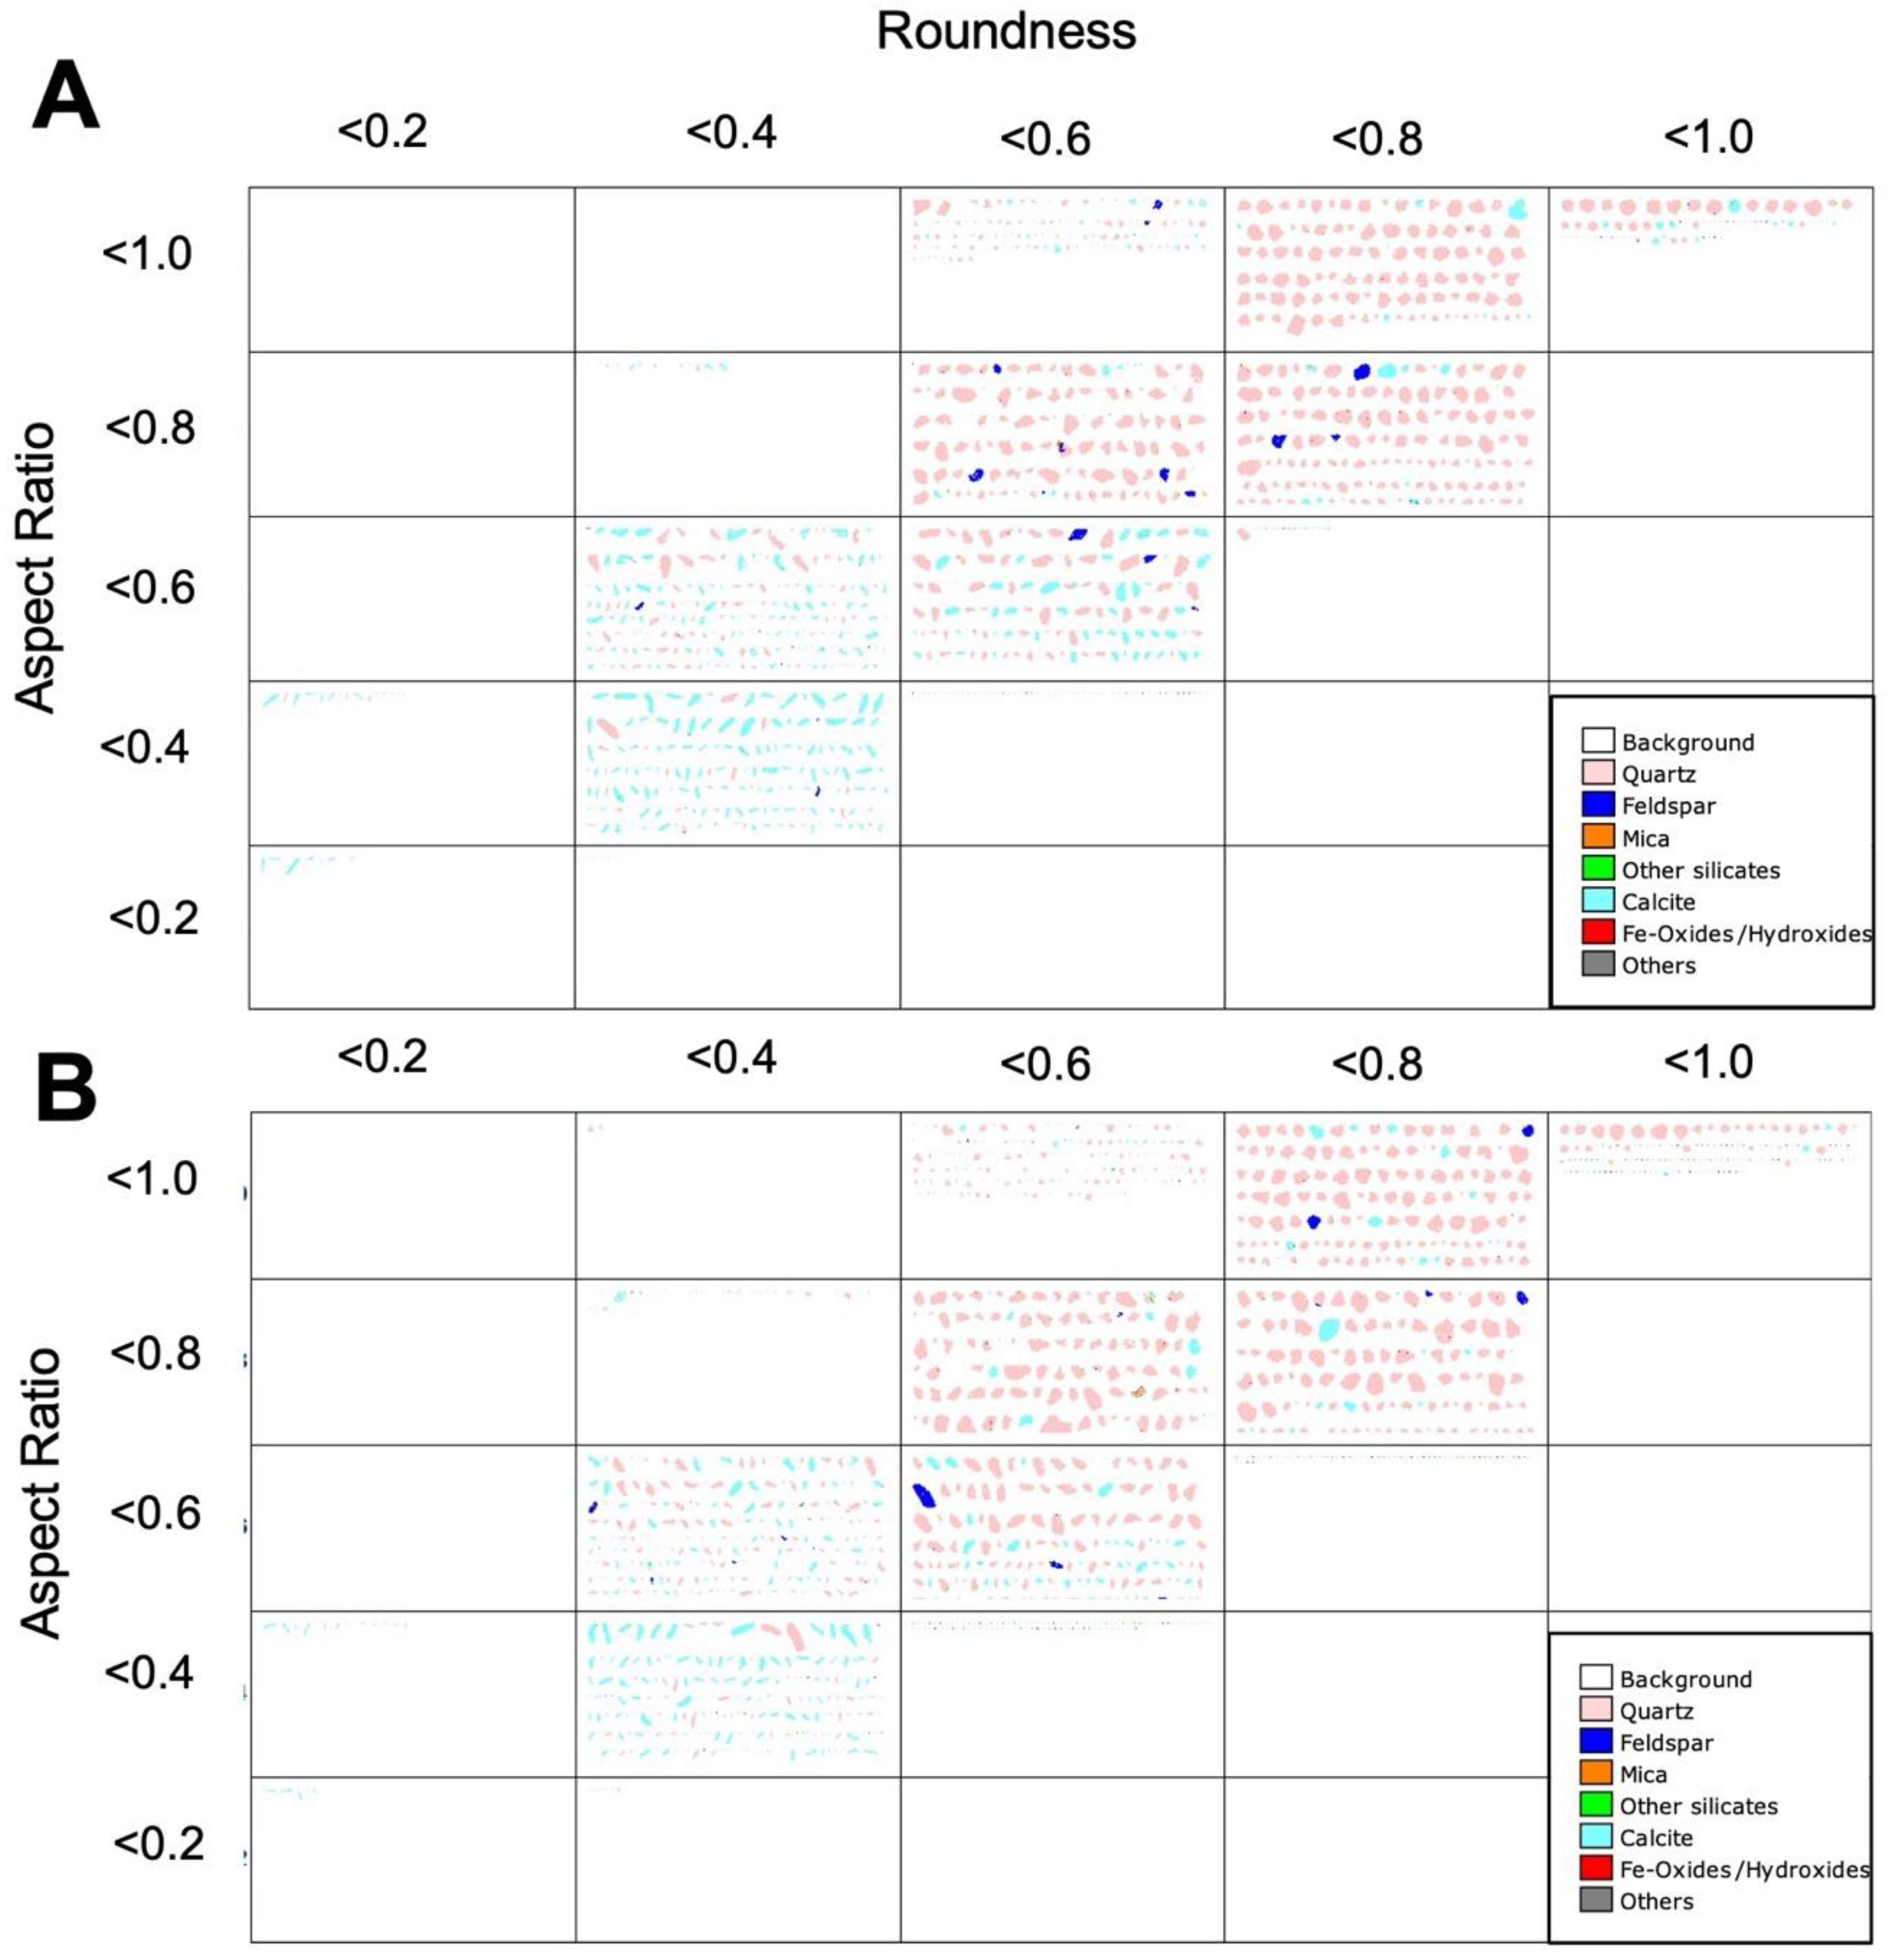
3.4.2. Size and Shape of Sand Particles

After respective dissolution with HCl and WWW, the sand particle sizes between 0.1 and 1 mm in both the columns and the BSR sands decreased, but the differences were negligible in the BSR sand (Figure 9). This could be related to some extent to the lower calcite dissolution in the BSR and/or physical effects of the HCl on the non-calcite particles in the column sand.
The shape of particles in terms of roundness and elongation can be described using roundness and aspect ratios [16]. Roundness is the ratio of the area of the particle to the smallest perfect circle able to fit around the particle outline, with rounder particles having higher roundness ratios. The aspect ratio is a ratio of the lengths of the long and short particle axes, so that higher ratios equate to more elongated particles [16]. In this study, the mineral composition of the grains was relatively pure and the quartz particles of both batches of raw sand before dissolution were generally rounder and more elongated than the calcite quartz particles (Table 5, Figure 8 and Figure 10).
In the columns, only 9% of the original calcite particles remained after dissolution. Although the roundness and aspect ratio mass balances of these particles showed marked temporal differences, no trends were noted (Table 5). The quartz particles, however, became less round as well as less elongated, possibly due to the action of the HCl on the particle surfaces.
In the BSRs, there were no significant temporal changes in the roundness or aspect ratios of either the calcite or quartz particles (p > 0.05, paired t-test). It was hypothesized that the less acidic WWW allowed the particles to maintain their structure in comparison with the particles subjected to HCl in the columns. In addition, less calcite was solubilised in the BSRs.

4. Conclusions

Biosand reactors containing unfractionated sand have a TANC longer than the projected lifespan of the related infrastructure. The hydraulic conductivity is unaffected by dissolution of calcite particles but can be increased by removing smaller sand particles. In real world situations, it is suggested that the sand is replaced every 10 to 15 years or when the effluent pH is no longer increased though the filters. Based on the results of this study, future research should focus on the bioremediation performance of BSRs containing selected fractions of sand, as well as changes in HC that occur due to build-up of functional biomass in these systems. It is suggested that future BSRs should operate in vertical flow conditions which allows for sufficient head across the filter together with the ability to manipulate flow rates, and the systems should be operated with an HRT of no less than 24 h to allow sufficient microbial interaction with the wastewater. It is also suggested that the optimal grading would be sand particles > than 0.450 mm which would be a combination of the sand used in column 3 and column 4 in this study. For the sand used in this study, this would constitute 54% of the entire grading and would provide the 46% fraction with smaller particles for use in concrete mixes where smaller particles are more desirable. The projected TANC of such a system would be 68 years. In addition, the use of BSRs for the remediation of other acidic organic WW should be investigated.

Author Contributions

Conceptualization, G.A.H., R.H. and P.J.W.; methodology, G.A.H., R.H. and P.J.W.; software, G.A.H.; validation, G.A.H. and P.J.W.; formal analysis, G.A.H.; investigation, G.A.H., R.H. and P.J.W.; resources, R.H. and P.J.W.; data curation, G.A.H.; writing—original draft preparation, G.A.H. and P.J.W.; writing—review and editing, G.A.H., R.H. and P.J.W.; visualization, G.A.H.; supervision, R.H. and P.J.W.; project administration, G.A.H. and P.J.W.; funding acquisition, G.A.H. and P.J.W. All authors have read and agreed to the published version of the manuscript.

Funding

This research was funded by the Wine industry network of expertise and technology (WINETECH), South Africa, grant number CSUR 13091742538 and the National Research Foundation of South Africa, grant number CSUR13091742638.

Data Availability Statement

The data presented in this manuscript is available on request from the corresponding author.

Acknowledgments

The authors would like to thank the Wine industry network of expertise and technology (Winetech), Jacques Rossouw and Reckson Mulidzi from the Agricultural Research Council and previously from Distell, respectively, for assistance with site selection, and the (unnamed) winery involved.

Conflicts of Interest

The authors declare no conflict of interest.

References

  1. Gu, K.; Pang, S.; Yang, B.; Ji, Y.; Zhou, Y.; Gao, C. Polyethyleneimine/4,4′-Bis(chloromethyl)-1,1′-biphenyl nanofiltration membrane for metal ions removal in acid wastewater. J. Membr. Sci. 2020, 614, 118497. [Google Scholar] [CrossRef]
  2. Cao, Y.; Luo, J.; Chen, C.; Wan, Y. Highly permeable acid-resistant nanofiltration membrane based on a novel sulfonamide aqueous monomer for efficient acidic wastewater treatment. Chem. Eng. J. 2021, 425, 131791. [Google Scholar] [CrossRef]
  3. Shang, Y.; Hei, P.; Lu, S.; Shang, L.; Li, X.; Wei, Y.; Jia, D.; Jiang, D.; Ye, Y.; Gong, J.; et al. China’s energy-water nexus: Assessing water conservation synergies of the total coal consumption cap strategy until 2050. Appl. Energy 2018, 210, 643–660. [Google Scholar] [CrossRef]
  4. Alam, P.N.; Yulianis; Pasya, H.L.; Aditya, R.; Aslam, I.N.; Pontas, K. Acid mine wastewater treatment using electrocoagulation method. Mater. Today Proc. 2022, 63, S434–S437. [Google Scholar] [CrossRef]
  5. Yu, L.; Guo, Q.; Hao, J.; Jiang, W. Recovery of acetic acid from dilute wastewater by means of bipolar membrane electrodialysis. Desalination 2000, 129, 283–288. [Google Scholar] [CrossRef]
  6. Xiao, D.; Huang, H.; Zhang, P.; Gao, Z.; Zhao, N. Utilizing the supernatant of waste sulfuric acid after dolomite neutralization to recover nutrients from swine wastewater. Chem. Eng. J. 2018, 337, 265–274. [Google Scholar] [CrossRef]
  7. Aguiar, A.; Andrade, L.; Grossi, L.; Pires, W.; Amaral, M. Acid mine drainage treatment by nanofiltration: A study of membrane fouling, chemical cleaning, and membrane ageing. Sep. Purif. Technol. 2018, 192, 185–195. [Google Scholar] [CrossRef]
  8. Holtman, G.; Haldenwang, R.; Welz, P. Biological sand filter system treating winery effluent for effective reduction in organic load and pH neutralisation. J. Water Process Eng. 2018, 25, 118–127. [Google Scholar] [CrossRef]
  9. Holtman, G.; Haldenwang, R.; Welz, P. Comparison of continuous and pulse mode of operation of pilot biosand reactors treating winery effluent. Ecol. Eng. 2022, 182, 106706. [Google Scholar] [CrossRef]
  10. Turingan, C.O.A.; Singson, G.B.; Melchor, B.T.; Alorro, R.D.; Beltran, A.B.; Orbecido, A.H. Evaluation of Efficiencies of Locally Available Neutralizing Agents for Passive Treatment of Acid Mine Drainage. Minerals 2020, 10, 845. [Google Scholar] [CrossRef]
  11. Larraguibel, A.; Navarrete-Calvo, A.; García, S.; Armijos, V.F.; Caraballo, M.A. Exploring sulfate and metals removal from Andean acid mine drainage using CaCO3-rich residues from agri-food industries and witherite (BaCO3). J. Clean. Prod. 2020, 274, 123450. [Google Scholar] [CrossRef]
  12. Wu, M.; Wang, J. Constitutive modelling of natural sands using a deep learning approach accounting for particle shape effects. Powder Technol. 2022, 404, 117439. [Google Scholar] [CrossRef]
  13. Cheng, Z.; Zhou, B.; Wang, J. Tracking particles in sands based on particle shape parameters. Adv. Powder Technol. 2020, 31, 2005–2019. [Google Scholar] [CrossRef]
  14. Xie, W.-Q.; Zhang, X.-P.; Yang, X.-M.; Liu, Q.-S.; Tang, S.-H.; Tu, X.-B. 3D size and shape characterization of natural sand particles using 2D image analysis. Eng. Geol. 2020, 279, 105915. [Google Scholar] [CrossRef]
  15. Li, X.; Liu, J.; Li, J. Fractal dimension, particle shape, and particle breakage analysis for calcareous sand. Bull. Eng. Geol. Environ. 2022, 81, 1–20. [Google Scholar] [CrossRef]
  16. Welz, P.; Mbasha, W.; Smith, I.; Holtman, G.; Terblanche, G.; Le Roes-Hill, M.; Haldenwang, R. The influence of grain physicochemistry and biomass on hydraulic conductivity in sand-filled treatment wetlands. Ecol. Eng. 2018, 116, 21–30. [Google Scholar] [CrossRef]
  17. Little, L.; Becker, M.; Wiese, J.; Mainza, A.N. Auto-SEM particle shape characterisation: Investigating fine grinding of UG2 ore. Miner. Eng. 2015, 82, 92–100. [Google Scholar] [CrossRef]
  18. Kim, Y.C.; Yoon, H. Exploitation of acetic acid for calcite dissolution in small-capacity desalination plants. Desalination 2021, 516, 115227. [Google Scholar] [CrossRef]
  19. Lehmann, O.; Birnhack, L.; Lahav, O. Design aspects of calcite-dissolution reactors applied for post treatment of desalinated water. Desalination 2013, 314, 1–9. [Google Scholar] [CrossRef]
  20. Welz, P.J.; Holtman, G.; Haldenwang, R.; Le Roes-Hill, M. Characterisation of winery wastewater from continuous flow settling basins and waste stabilisation ponds over the course of 1 year: Implications for biological wastewater treatment and land application. Water Sci. Technol. 2016, 74, 2036–2050. [Google Scholar] [CrossRef] [Green Version]
  21. Pokrovsky, O.S.; Golubev, S.V.; Schott, J. Dissolution kinetics of calcite, dolomite and magnesite at 25 °C and 0 to 50 atm pCO2. Chem. Geol. 2005, 217, 239–255. [Google Scholar] [CrossRef]
  22. Bories, A.; Sire, Y. Impacts of Winemaking Methods on Wastewaters and their Treatment. S. Afr. J. Enol. Vitic. 2016, 31, 38–44. [Google Scholar] [CrossRef]
  23. Goodall, W.R.; Scales, P.J.; Butcher, A.R. The use of QEMSCAN and diagnostic leaching in the characterisation of visible gold in complex ores. Miner. Eng. 2005, 18, 877–886. [Google Scholar] [CrossRef]
  24. Mader, A.E.; Holtman, G.A.; Welz, P.J. Treatment wetlands and phyto-technologies for remediation of winery effluent: Challenges and opportunities. Sci. Total Environ. 2021, 807, 150544. [Google Scholar] [CrossRef]
  25. Giraldi, D.; Vitturi, M.D.; Zaramella, M.; Marion, A.; Iannelli, R. Hydrodynamics of vertical subsurface flow constructed wetlands: Tracer tests with rhodamine WT and numerical modelling. Ecol. Eng. 2009, 35, 265–273. [Google Scholar] [CrossRef]
  26. Suliman, F.; Futsaether, C.; Oxaal, U.; Haugen, L.; Jenssen, P. Effect of the inlet–outlet positions on the hydraulic performance of horizontal subsurface-flow wetlands constructed with heterogeneous porous media. J. Contam. Hydrol. 2006, 87, 22–36. [Google Scholar] [CrossRef]
  27. Narsilio, A.G.; Yun, T.S.; Kress, J.; Evans, T.M. Hydraulic and thermal conduction phenomena in soils at the particle-scale: Towards realistic FEM simulations. IOP Conf. Ser. Mater. Sci. Eng. 2010, 10, 012086. [Google Scholar] [CrossRef]
  28. Bruch, I.; Alewell, C.; Hahn, A.; Hasselbach, R. Influence of soil physical parameters on removal efficiency and hydraulic conductivity of vertical flow constructed wetlands. Ecol. Eng. 2014, 68, 124–132. [Google Scholar] [CrossRef]
  29. Urumović, K. The effective porosity and grain size relations in permeability functions. Hydrol Earth Syst. Sci. Discuss 2014, 11, 6675–6714. [Google Scholar]
  30. Rakotonimaro, T.V.; Neculita, C.M.; Bussière, B.; Zagury, G.J. Comparative column testing of three reactive mixtures for the bio-chemical treatment of iron-rich acid mine drainage. Miner. Eng. 2017, 111, 79–89. [Google Scholar] [CrossRef]
  31. Ji, X.; Zhao, C.; Lv, Y.; Yang, J.; Li, B. Influence of Particle Size of River Sand on the Decontamination Process in the Slow Sand Filter Treatment of Micro-Polluted Water. Water 2022, 14, 100. [Google Scholar] [CrossRef]
Figure 1. Experimental set-up.
Water 14 02603 g001
Figure 2. Sample locations of onsite treatment system.
Water 14 02603 g002
Figure 3. Mass balance of the calcium captured in the effluent and the calcium lost from the sand (A), and the distribution of grain size fractions in the columns (B). The bars from plot A are aligned vertically with those from plot B, both representing columns 1 to 7.
Water 14 02603 g003
Figure 4. Daily effluent pH measurements used to compare neutralization efficiencies and endpoints.
Water 14 02603 g004
Figure 5. Measured hydraulic conductivity in sand columns before and after calcite dissolution (A), and the distribution of grain size fractions in the columns (B). The bars from plot A are aligned vertically with those from plot B, both representing columns 1 to 7.
Water 14 02603 g005aWater 14 02603 g005b
Figure 6. Log graphs and tables showing the theoretical abiotic neutralization capacity values of a horizontal flow gravity-fed biological sand reactor system with flow rates based on: (A) Column experiments (this study), and (B) in-situ flow rates in a pilot biological sand reactor system as previosuly described [8]).
Water 14 02603 g006aWater 14 02603 g006b
Figure 7. Percentage calcium in sand from cores taken from biosand reactors treating winery wastewater for three years.
Water 14 02603 g007
Figure 8. Particle image of column sand before (A) and after (B) calcite dissolution.
Water 14 02603 g008
Figure 9. Particle size distribution curves for the batches of sand used in the column 2 experiments and the biological sand reactors at the beginning and end of the respective experimental periods.
Water 14 02603 g009
Figure 10. Image showing the mineralogy and relative roundness and aspect ratios of the different sizes of sand particles from the biological sand reactors of core samples taken at year 0 (A) and year 3 (B).
Water 14 02603 g010
Table 1. Sand particle size fractions in columns (100 g per column).
Column
(n = 3)
Particle Size
(mm)
Amount
(% wt.wt)
Ca in Sand
(% wt.wt)
Comments
1 & 2>1.00–2.00
>0.600–1.00
>0.425–0.600
>0.300–0.425
>0.150–0.300
>0.075–0.150
<0.075
10.0
24.3
18.2
19.7
25.3
2.1
0.4
5.4 ± 0.01Raw (unfractionated) sand
3>1.00–2.00
>0.600–1.00
29.2
70.8
3.0 ± 0.05Homogenized fractions
40.425–0.600
>0.300–0.425
48.0
52.0
6.7 ± 0.07Homogenized fractions
50.150–0.300
>0.075–0.150
<0.075
91.0
7.6
1.4
6.8 ± 0.03Homogenized fractions
61.00–2.00
>0.600–1.00
>0.425–0.600
>0.300–0.425
13.9
13.7
25.2
27.3
4.8 ± 0.04Homogenized fractions
71.00–2.00
>0.600–1.00
>0.425–0.600
>0.300–0.425
>0.150–0.300
10.3
24.9
18.7
20.2
25.9
5.6 ± 0.019Homogenized fractions
Table 2. Percentage calcium in sand from cores taken from biosand reactors treating winery wastewater.
PositionInlet (ca wt.wt)Middle (ca wt.wt)Outlet (ca wt.wt)
Top (0–5 cm)4.59.09.2
Middle (25–30 cm)9.29.39.4
Bottom (45–50 cm)9.49.29.5
Table 3. Average major elemental composition (% wt.wt) of the raw sand determined using X ray diffraction (n = 4).
AlCaCrFeKMgMnNaPSiTi
Column before0.155.39bdl0.050.110.01bdl0.060.0143.00.03
Column after0.160.54bdl0.040.12bdl0.010.020.0049.00.02
BSR year 00.189.57bdl0.060.130.06bdl0.100.0137.70.03
BSR year 30.244.26bdl0.090.170.060.010.040.0243.90.03
Note(s): bdl = below detectable limit.
Table 4. Mineral composition of the raw sand determined using QEMSCAN®.
Column beforeColumn after
Size fraction (µm)Combined1180>>425<425Combined600>>300<300
Quartz81.387.880.082.587.4997.3099.3697.91
Feldspar0.80.10.90.81.252.460.501.56
MicaNDNDNDND0.070.140.020.09
Other silicatesNDNDNDND0.060.030.040.13
Calcite17.611.919.016.20.020.010.020.06
Fe-oxides/hydroxides0.10.10.10.10.080.050.050.18
Others *0.10.00.10.20.030.010.010.08
Note(s): ND = not detected, * = includes accessory minerals e.g., fluorite and apatite.
Table 5. Relationship of mass % distribution of quartz and calcite particles in terms of aspect ratio and roundness.
Column
Aspect ratio<0.2<0.3<0.4<0.5<0.6<0.7<0.8<0.9<1.0
%Quartz before (n = 2572)0.000.020.152.198.2418.1928.9326.8815.40
%Quartz after (n = 5191)0.000.180.964.4012.4823.3027.4423.038.15
%Calcite before(n = 253)0.531.814.6015.8513.7721.5818.4815.108.28
%Calcite after(n = 478) *0.000.000.792.3333.3916.381.763.2842.07
Roundness<0.2<0.3<0.4<0.5<0.6<0.7<0.8<0.9<1.0
%Quartz before (n = 2572)0.000.101.178.1318.8633.2631.477.000.00
%Quartz after = 5191)0.100.663.9914.7229.1332.0616.692.660.01
%Calcite before (n = 253)0.531.814.6015.8513.7721.5818.4815.108.28
%Calcite after(n = 478) *0.004.786.959.2632.955.380.001.1739.50
BSR
Aspect ratio<0.2<0.3<0.4<0.5<0.6<0.7<0.8<0.9<1.0
%Quartz year 0 (n = 5267)0.000.081.175.3514.2221.4729.2420.338.13
%Quartz year 3 (n = 5472)0.000.121.125.3413.9023.7825.5920.1110.04
%Calcite year 0 (n = 4768)0.964.2016.6918.9922.1814.4811.207.873.42
%Calcite year 3 (n = 2999)0.525.8817.1116.9017.3119.7711.897.533.07
Roundness<0.2<0.3<0.4<0.5<0.6<0.7<0.8<0.9<1.0
%Quartz year 0 (n = 5267)0.060.895.1217.7830.5931.4812.002.030.06
%Quartz year 3(n = 5472)0.020.925.8616.8232.0826.0915.512.660.05
%Calcite year 0 (n = 4768)1.6711.1124.1127.0018.7511.484.501.160.22
%Calcite year 3 (n = 2999)1.5011.0125.3425.1419.2513.403.460.700.18
Note(s): * = calcite in too low quantities for reliable shape data.
Publisher’s Note: MDPI stays neutral with regard to jurisdictional claims in published maps and institutional affiliations.

