Article

High-Precision Calculation of the Proportions of Water with δ2H and δ18O, the Cumulative Effect of Evaporation in the Vertical Direction and Depleted δ2H and δ18O of the Shallow Soil Water Caused by Evaporation

1
State Key Laboratory of Water Resources and Hydropower Engineering Science, Wuhan University, No.8 Donghu South Road, Wuhan 430072, China
2
Hubei Key Laboratory of Water System Science for Sponge City Construction, Wuhan University, No.8 Donghu South Road, Wuhan 430072, China
3
Changjiang Water Resources Protection Institute, Wuhan 430051, China
*
Author to whom correspondence should be addressed.
These authors contributed equally to this work.
Water 2022, 14(17), 2594; https://doi.org/10.3390/w14172594
Submission received: 27 June 2022 / Revised: 16 August 2022 / Accepted: 18 August 2022 / Published: 23 August 2022

Abstract

:
Exploring the water sources taken up by plants is necessary for ecological protection. The purpose of this study was to determine the exact proportions of different water sources absorbed by herbaceous plant species in the wetland of Poyang Lake in an inland humid region. This identified the water sources patterns in wetlands and provide Poyang Lake managers information about the lake water level needed to sustain vegetative life. We analysed the deuterium isotope composition ( δ 2 H) and oxygen isotope composition ( δ 18 O) values in the stem water of dominant herbaceous plant during its different growth stages to explore the proportions of water sources in different growth stages by using the Phillips equation, and the results supported the accuracy. The results indicate that the groundwater should not be lower than 0.13 m, otherwise the Carex cinerascens may not be able to absorb it. In previous studies, the lower slopes and intercepts of δ 2 H– δ 18 O were attributed to the secondary evaporation under the cloud, but we found that there is a cumulative evaporation effect in rainwater, soil water, and groundwater, which makes the slopes and the intercepts of δ 2 H– δ 18 O relationship lines become lower from top to bottom. In this study, the final effect of evaporation on the δ 2 H and δ 18 O values of shallow soil water is depleting the δ 2 H and δ 18 O values of shallow soil water, which is different from previous studies. The δ 2 H and δ 18 O values of groundwater varied little with changes of seasons and rainfalls. The δ 2 H– δ 18 O relationship lines established by various substances can also reflect the regulation of d-excess by large lakes through secondary sources.

1. Introduction

Stable isotope approaches can be used for source partitioning [1]. To determine the source partitions, there are several models with stable isotopes, such as IsoSource [2] and MixSIAR [3]. The IsoSource is a simple mass balance of the isotope compositions, so it is used wider. In this way, distinguishing water sources and their depth in plants has strong practical significance, because it provides key information about water sources for maintaining the growth of vegetation. There is a lot of work related to this. So far, most cases are about distinguishing water sources with δ 2 H and δ 18 O. However, in nearly all literatures about this topic, there is few exact solutions for calculating the proportions of water sources. We first tried to find the exact solutions. If there was no exact solutions, we tried to find the most approximate solutions. If we only give an approximate solution, through which the readers can not judge whether the IsoSource model has an exact solution in this case. Because when the approximate solution is fitted into the formula, even if it does not exactly match, readers will think it is caused by the retention of decimal numbers. Therefore, if the author does not state whether there is a solution, it is difficult for readers to judge. When using IsoSource model to calculate water sources, it is necessary to verify whether there is an exact solution, and the most approximate solution can be used only when there is no exact solution.
A lot of researchers have sampled soil water at different depth levels to study the depths of water obtained by plants and the proportions of water corresponding to the depths, but they have always sampled soils every 10 cm or more, regardless of seasons’ change, which is likely to result in a situation where the groundwater level is higher than that of the deep soil water, so the δ 2 H and δ 18 O values of soil water may be heavily influenced by the isotope composition of groundwater. For the accuracy of the proportion of water sources analyzed, it is most common to stratify the soil layer into three or four layers. For example, Chen et al. [4] stratified the soil with 0–10 cm, 10–20 cm, 20–40 cm and 40–100 cm, Wu et al. [5] stratified the soil with 0–20 cm, 20–40 cm, 40–80 cm and 80–270 cm and Guo and Zhao [6] stratified the soil with 0–40 cm, 40–140 cm, 140–200 cm. Although many researchers [7,8,9,10,11,12] have determined the depths of soil stratifications according to the actual situations, they were all stratified by multiples of ten centimetres. So stratifying the soil according to the actual situations, especially taking the groundwater level into consideration, at different times and tracing the sources with dual isotopes ( δ 2 H and δ 18 O), allow to better study relative amount of water sources uptaken by plants.
For analyzing the relationship between δ 2 H and δ 18 O of water, the local relationship between δ 2 H– δ 18 O, called Local Meteoric Water Line (LMWL), is usually calculated, for comparison with the Global Meteoric Water Line (GMWL [13]). Comparing the linear relationship between δ 2 H– δ 18 O in soil water with GMWL may not be easy to find out the influencing factors as comparing LMWL with GMWL, because there are more factors affecting the isotope composition of soil water than precipitation. However, it is still necessary to compare the difference between soil water and atmospheric precipitation by δ 2 H– δ 18 O, since linear relationships of δ 2 H– δ 18 O have been deeply and widely studied. Chen et al. [4] and Wang et al. [14] compared the isotope composition of soil water as a whole, not stratified, with those of precipitation or irrigation water, etc. Wu et al. [5] compared the isotope compositions of soil water stratified with those of precipitation or irrigation water, etc., but the stratifications of the soil were fixed so it did not change with time or seasons. Vargas et al. [15] took into account seasonal changes and established an δ 2 H– δ 18 O relationship between the isotope compositions of plant stem water and soil water, but the authors have neither sampled soil water at different depths with different times and nor precipitations, soil water, plant water and groundwater were studied together. Goldsmith et al. [16] analyzed the isotope characteristics of rainwater, stream water, stratified soil water, etc., and established their respective δ 2 H– δ 18 O relationship lines, but lacked δ 2 H– δ 18 O relationship line that included all types of water.
Therefore, it is common to establish the δ 2 H– δ 18 O relationship line of each various substances’ water [4,17] and there are more and more studies [9,18] on establishing the δ 2 H– δ 18 O relationship line between various substances, such as including soil water and plant water. Some scholars have also stratified the soil and established δ 2 H– δ 18 O relationship lines of each layer of soil water. However, there are few studies on the δ 2 H– δ 18 O relationship line of water of stratified soil according to changes of time or seasons and based on this type of stratified soil, it is rare to analyse δ 2 H– δ 18 O relationship lines of each layer of soil water and the whole δ 2 H– δ 18 O relationship line with plant water, rainwater, soil water and groundwater in different seasons. According to the depth of groundwater, the soil above groundwater was stratified into shallow soil and deep soil by its color, viscosity and isotope compositions. In the soil water layer, the top layer was influenced by evaporation near the surface and its isotope compositions differed from those of lower soil water.
D-excess in percipitaion reflects kinetic fractionation when the phase state of water changes [19]. The influence of this effect is likely to be different in different regions, so d-excess is widely used to identify different water vapour sources for percipitation [20,21,22]. During the interaction between surface water and the atmosphere, the d-excess of the remaining water body will change, mainly through the evapotranspiration of plants and water bodies [23]. The d-excess of large lakes is related to the secondary water vapor source [23,24], and lakes that are far apart may even have close d-excess values. Whether the δ 2 H– δ 18 O relationship line established by rainwater, plant water, shallow soil water, deep soil water, and groundwater together can reflect the d-excess characteristics of lakes affected by the secondary water vapor source is an issue to be studied.
The effect of evaporation on the isotope composition has been widely studied, but most scholars only focus on the evaporation of rainwater and surface water, and few scholars compared effects of rainwater, plant water, shallow soil water, deep soil water, and groundwater by the accumulation of vaporation. With the help of dynamic soil stratification, the cumulative effect of evaporation on the isotope compositions of rainwater, shallow soil water, deep soil water, and groundwater can be further studied. Evaporation will increase the δ 2 H and δ 18 O of the remaining water which has been studied in depth, but few scholars has ever found out that the slope and intercept of each δ 2 H– δ 18 O relationship line of rainwater, shallow soil water, deep soil water, and groundwater gradually decrease due to evaporation accumulation.
The secondary source effect of Poyang Lake, the isotope fractionation characteristics explained by the new soil stratification method, the high-precision water sources ratios using IsoSource, and whether the fractionation of the isotope composition in the recharge process of the deep soil water to the shallow soil water exists, are the focuses of our discussions.

2. Materials and Methods
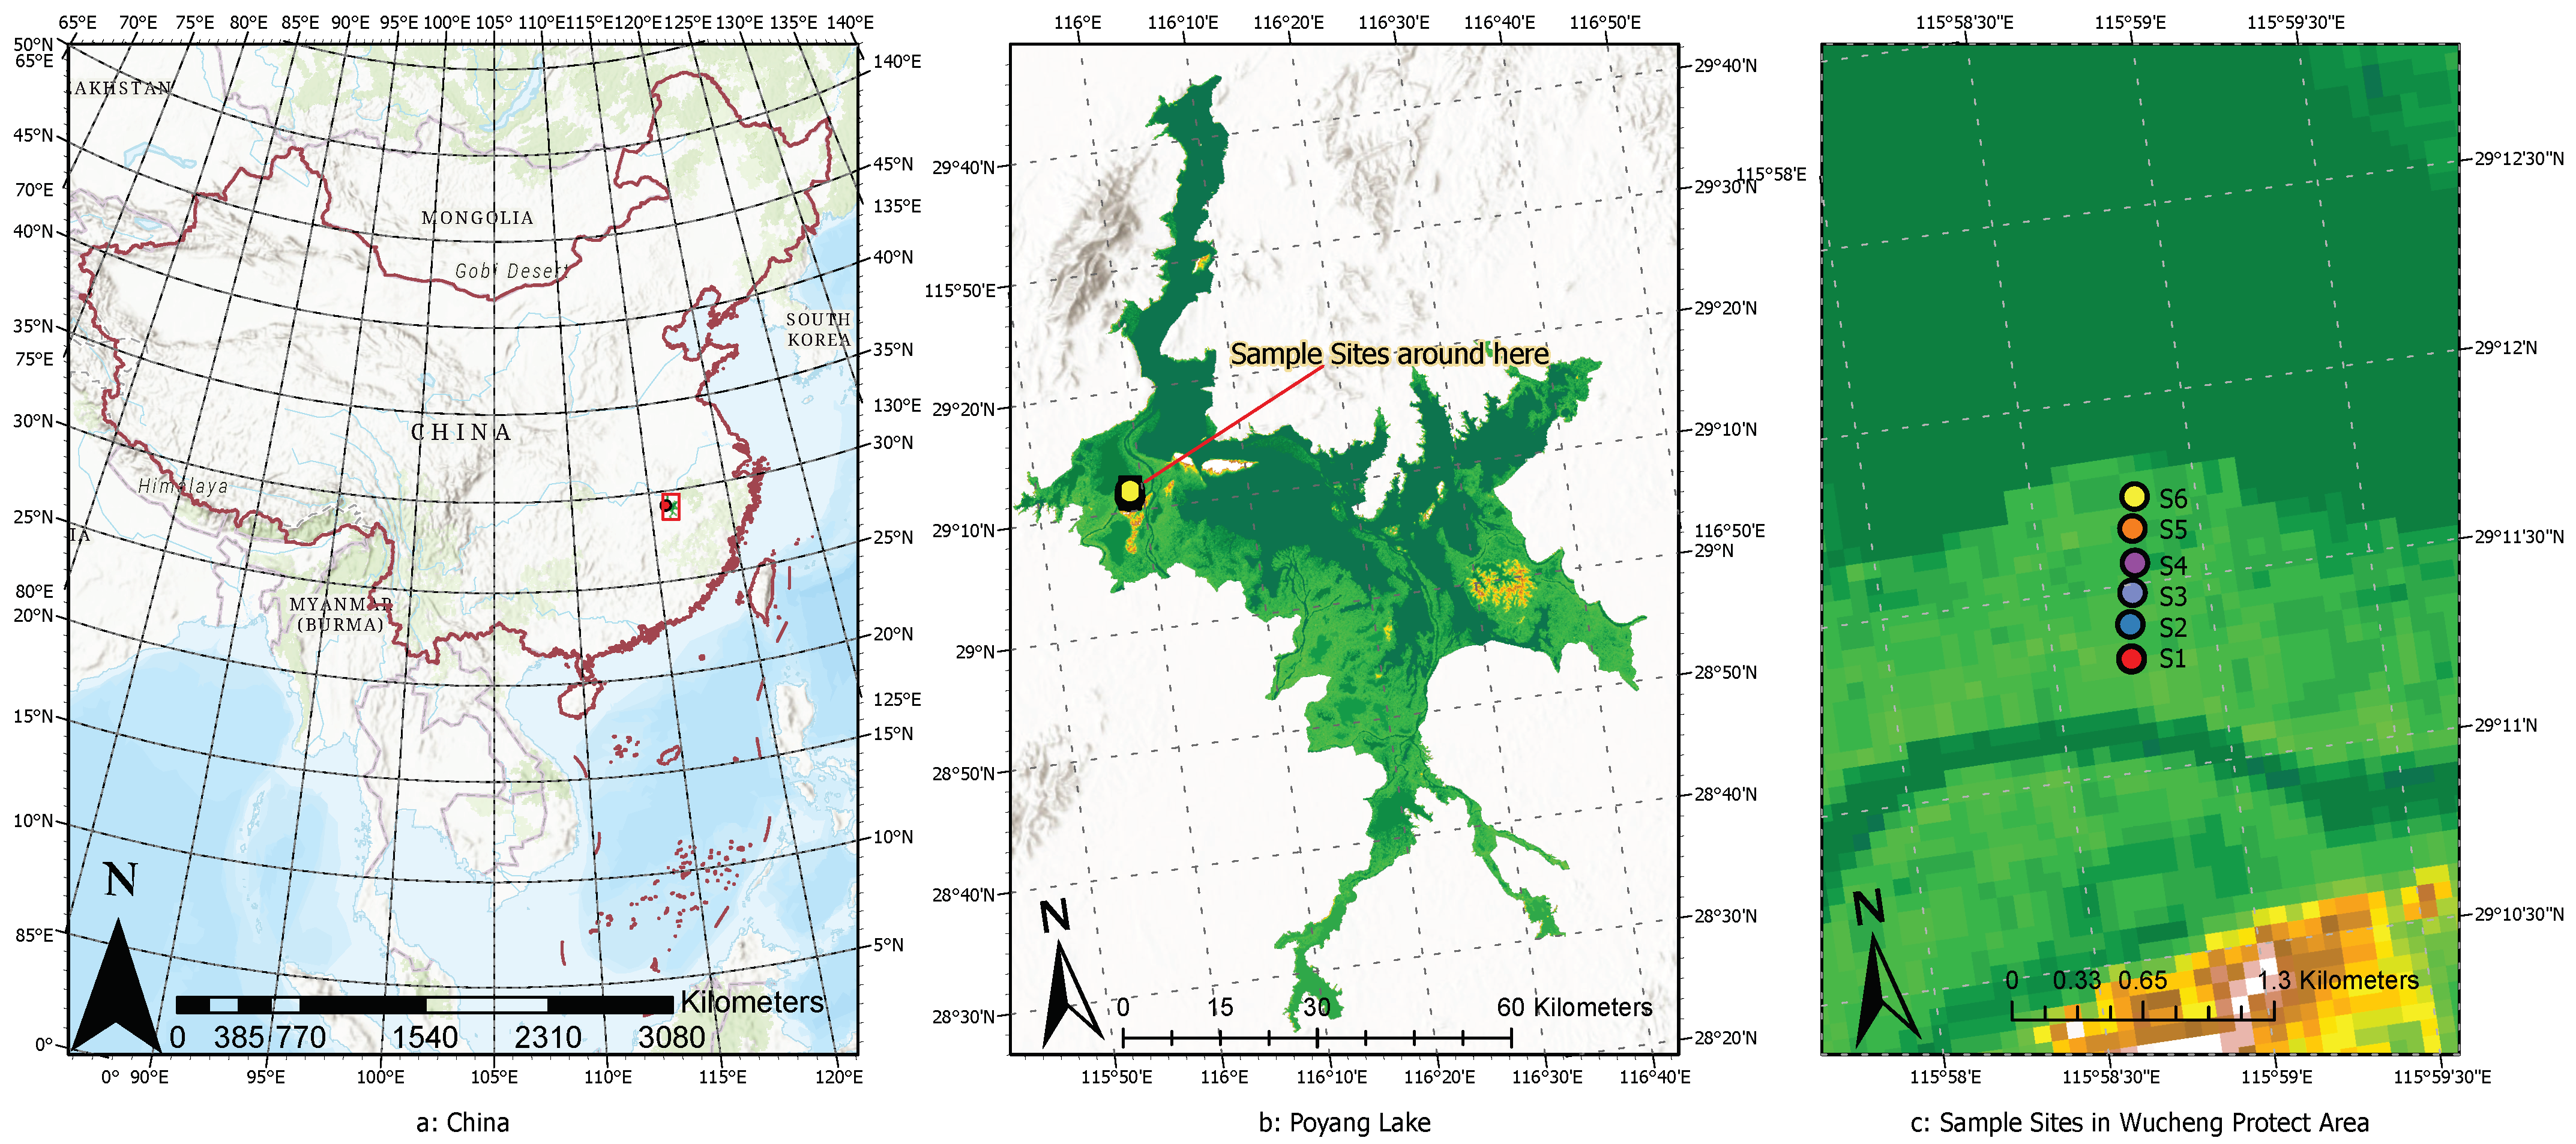
2.1. Sampling Sties

The sampling sites are in Poyang Lake wetland ( 29 ° 5 29 ° 15 N , 115 ° 55 116 ° 3 E ), along the middle and lower reaches and at the south of the Yangtze River. The Poyang Lake is the largest freshwater lake in China and is an important protected ecological area [25]. The ecological environment of Poyang Lake, located in the middle of China, is of great significance to the migration of animals and the growth of plants. We selected six sampling sites represented in the Figure 1.
The wetland is characterized by a subtropical humid monsoon climate with an average annual temperature of 17.6   C and average annual precipitation ranging from 1450 to 1550 m m [26]. The Poyang Lake wetland has different types of perennial herbaceous vegetation such as Carex, Triarrhena lutarioriparia and Artemisia selengensis [27,28,29]. Carex is a perennial herbaceous plant genus [30], accounting for 60–90% of the total vegetation [31,32], which is most affected by flooding fluctuations. It has two distinct growing seasons (February to May and September to December) (Figure 2). In this study, monthly water levels represented the average daily water levels of every month from 1 January 1953, to 31 December 2013. Poyang Lake is a seasonal lake where lake water may discharge to groundwater in the wet season, and groundwater may discharge to Poyang Lake in the dry season [25], so the water level of Poyang Lake is affected by that of the Yangtze River. When the water level of the Yangtze River is higher than that of Poyang Lake, the Yangtze River flows into Poyang Lake. For example, this occurred during the flood of July 2020. If the water level of Poyang Lake is higher than that of the Yangtze River, the water of Poyang Lake flows to the Yangtze River, and eventually, the water level of Poyang Lake equals that of the Yangtze River.

2.2. Sample Collection and Processing

Carex cinerascens is a widespread species in the Carex community and was selected to represent the perennial herbaceous species in the inland humid region. Carex cinerascens is distributed evenly in the meadow between two tributaries of Poyang Lake. We sampled soils, Carex cinerascens and groundwater from six different sites within an area of 150 m. The soil textures were mainly silt (96.64% silt, 3.14% clay, and 0.22% sand) with soil water content ranging from 12% to 20% (Figure 3). We drilled six water wells, from which we measure the groundwater levels, with a diameter of 10 cm near the sampling points. The soil was extracted through a soil collector, then we divided the soil columns into single stratum of several centimeters each, and then we extracted the soil water through a cryogenic vacuum distillation extraction system. This system can convert liquid water to gas by applying a vacuum, and then convert the gas to solid by cold trapping with liquid nitrogen. Groundwater was taken directly from the well. Carex cinerascens stem water was also extracted through the cryogenic vacuum distillation extraction system untill no new droplets were condensed within 2 h. The soil moisture was calculated layer by layer, which was strictly measured in accordance with Chinese national standards (HJ 613-2011) [35]. After each drying, the soil was cooled in a drying dish for 4 h. Repeat the previous steps until the weight difference was less than 1.5% of the mass. The soil moisture was calculated by:
Soil moisture ( % ) = Weight of wet soil Soil weight dried Soil weight dried × 100 %
Rainwater, soil water, groundwater, and Carex cinerascens stem water samples were collected at the end of October 2015, the beginning of December 2015, the end of December 2015, and the middle of April 2016. Three samples of the same type from the same sampling points on the same day were collected and in the end, there were 5 to 7 data of each type for each point at the same time. The data in November 2015 in this paper were calculated from the samples in early December 2015. This period encompassed the stable growth stage (October 2015), the transitional growth stage (November 2015), the declining growth stage (December 2015), and the rapid growth stage (April 2016). The definition of growth stages is based on the growth status of the plant. Rainwater was collected using plastic buckets, which were cleaned 5 times after each use, and rinsed 3 times before sampling, near the sampling sites in the village. The collected water was placed into 60 mL polyethylene plastic bottles quickly after it was collected to prevent fractionation. At each sampling site, a plastic syringe-automatic sampling device was used to collect three replicate groundwater samples using a PVC tube with 60 mL polyethylene plastic bottles. A flexible ruler with a liquid level sensor was used to record groundwater depth. Three replicates of Carex cinerascens stems from each site were also collected and placed into 8 mL glass bottles. All bottles were sealed with ParafilmR and were stored in an incubator with ice bags. When we finished collecting the samples and returned to our experimental site around Poyang Lake, we transported the plant samples in a 20   C freezer lent by Poyang Lake management.
All samples were transported to the laboratory. Before analyses, rainwater and groundwater samples were filtered through 0.22   μ m aperture filters and were placed into 1.5 mL autosampler vials.

2.3. Methods

Water samples were analysed using a continuous-flow isotope composition mass spectrometer coupled with a TC/EA (MAT-253, Thermo-Finnigan Instrument Inc., Bremen, Germany) at Wuhan University in China. All the isotope data are reported with the δ notation (‰) against Vienna Standard Mean Ocean Wate (VSMOW) and the results were calculated by Equation (2). We measured more than 6 international isotopic standards for calibrating analyses. Analytical reproducibility was within ±2‰ for the δ 2 H values and ±0.2‰ for the δ 18 O values.
δ s a m p l e ( ) = ( R s a m p l e R s t a n d a r d ) × 1000 R s t a n d a r d
where R s a m p l e is 18 O/ 16 O or 2 H/ 1 H of a water sample and R s t a n d a r d is 18 O/ 16 O or 2 H/ 1 H of the VSMOW standard. A higher value of δ s a m p l e indicates it is enriched with heavy isotopes; a lower value indicates a lower ratio of heavy isotope compared to the standard.
The root lengths of herbaceous plant species in the inland humid region were always shorter than 40 cm, with the majority of them having a length between 0 and 10 cm [36]. There were significant variations in groundwater depth and soil water levels between different seasons in humid regions. This affected the water sources available for plant growth. To determine potential water sources for herbaceous plant species, we analysed the isotope compositions of soil water, rainwater, Carex cinerascens stem water and groundwater. Wang et al. [37] used hydrogen and oxygen isotopes to study the water sources of three plants and they found these plantes mainly use water from 0 to 40 cm, but with the change of seasons, the depth of water obtained by the plants in the soil changes and the depth can reach up to 300 cm. Therefore all the water sources are potential water sources for plant growth: rainwater, shallow soil water, deep soil water and groundwater, and the groundwater is rarely below the depth of 100 cm in Poyang Lake.
The IsoSoure mixing model [38] was used to identify the water sources supporting Carex cinerascens growth. The sum of the products of the isotope compositions and the quantity of the substances is equal to the product of the total quantity and the isotope composition of these mixed substances. The mean and standard deviation of isotope compositions and the isotope discrimination value (in this case, zero) from potential sources were provided to calculate in the IsoSource model. This study used the mean measured dual isotope compositions ( δ 2 H and δ 18 O) of the Carex cinerascens stem water, rainwater, shallow soil water, deep soil water, and groundwater without calculating the influence of their standard deviation in IsoSource model. No isotope fractionation should occurr during root water uptake [39,40]. Regression coefficients and correlations between pairs of variables were assessed using linear regressions using determination coefficients ( R 2 ).

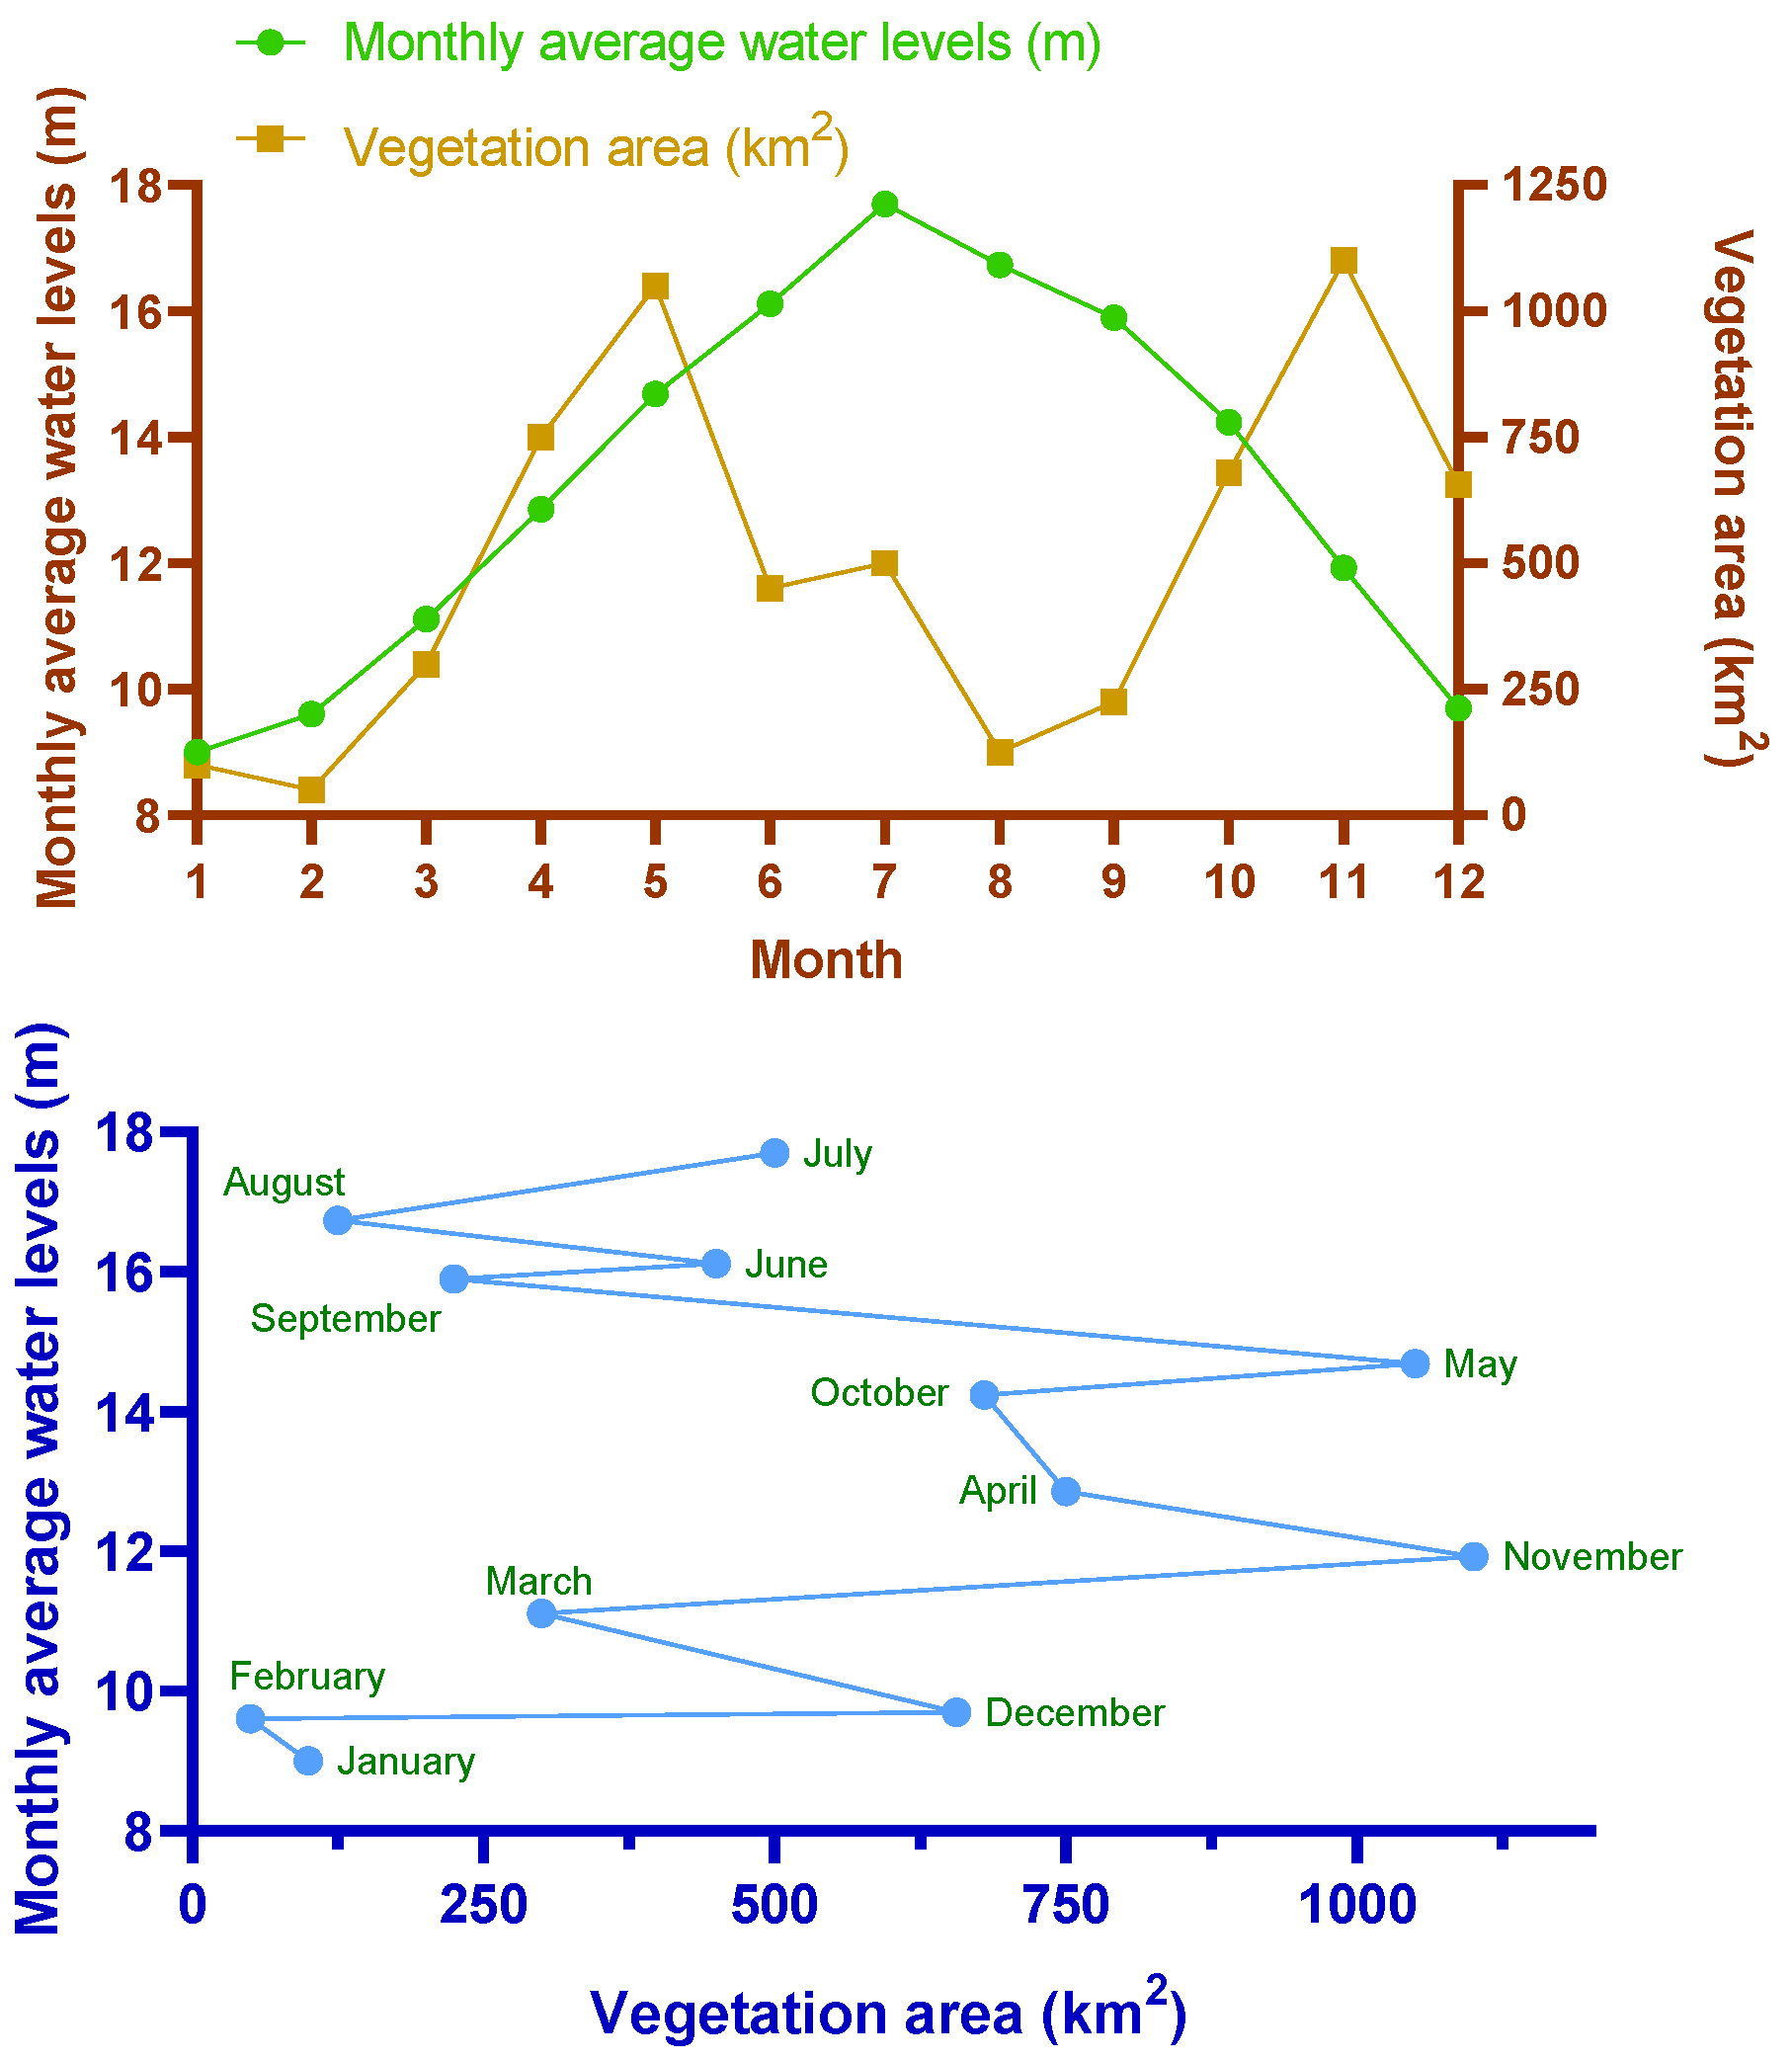
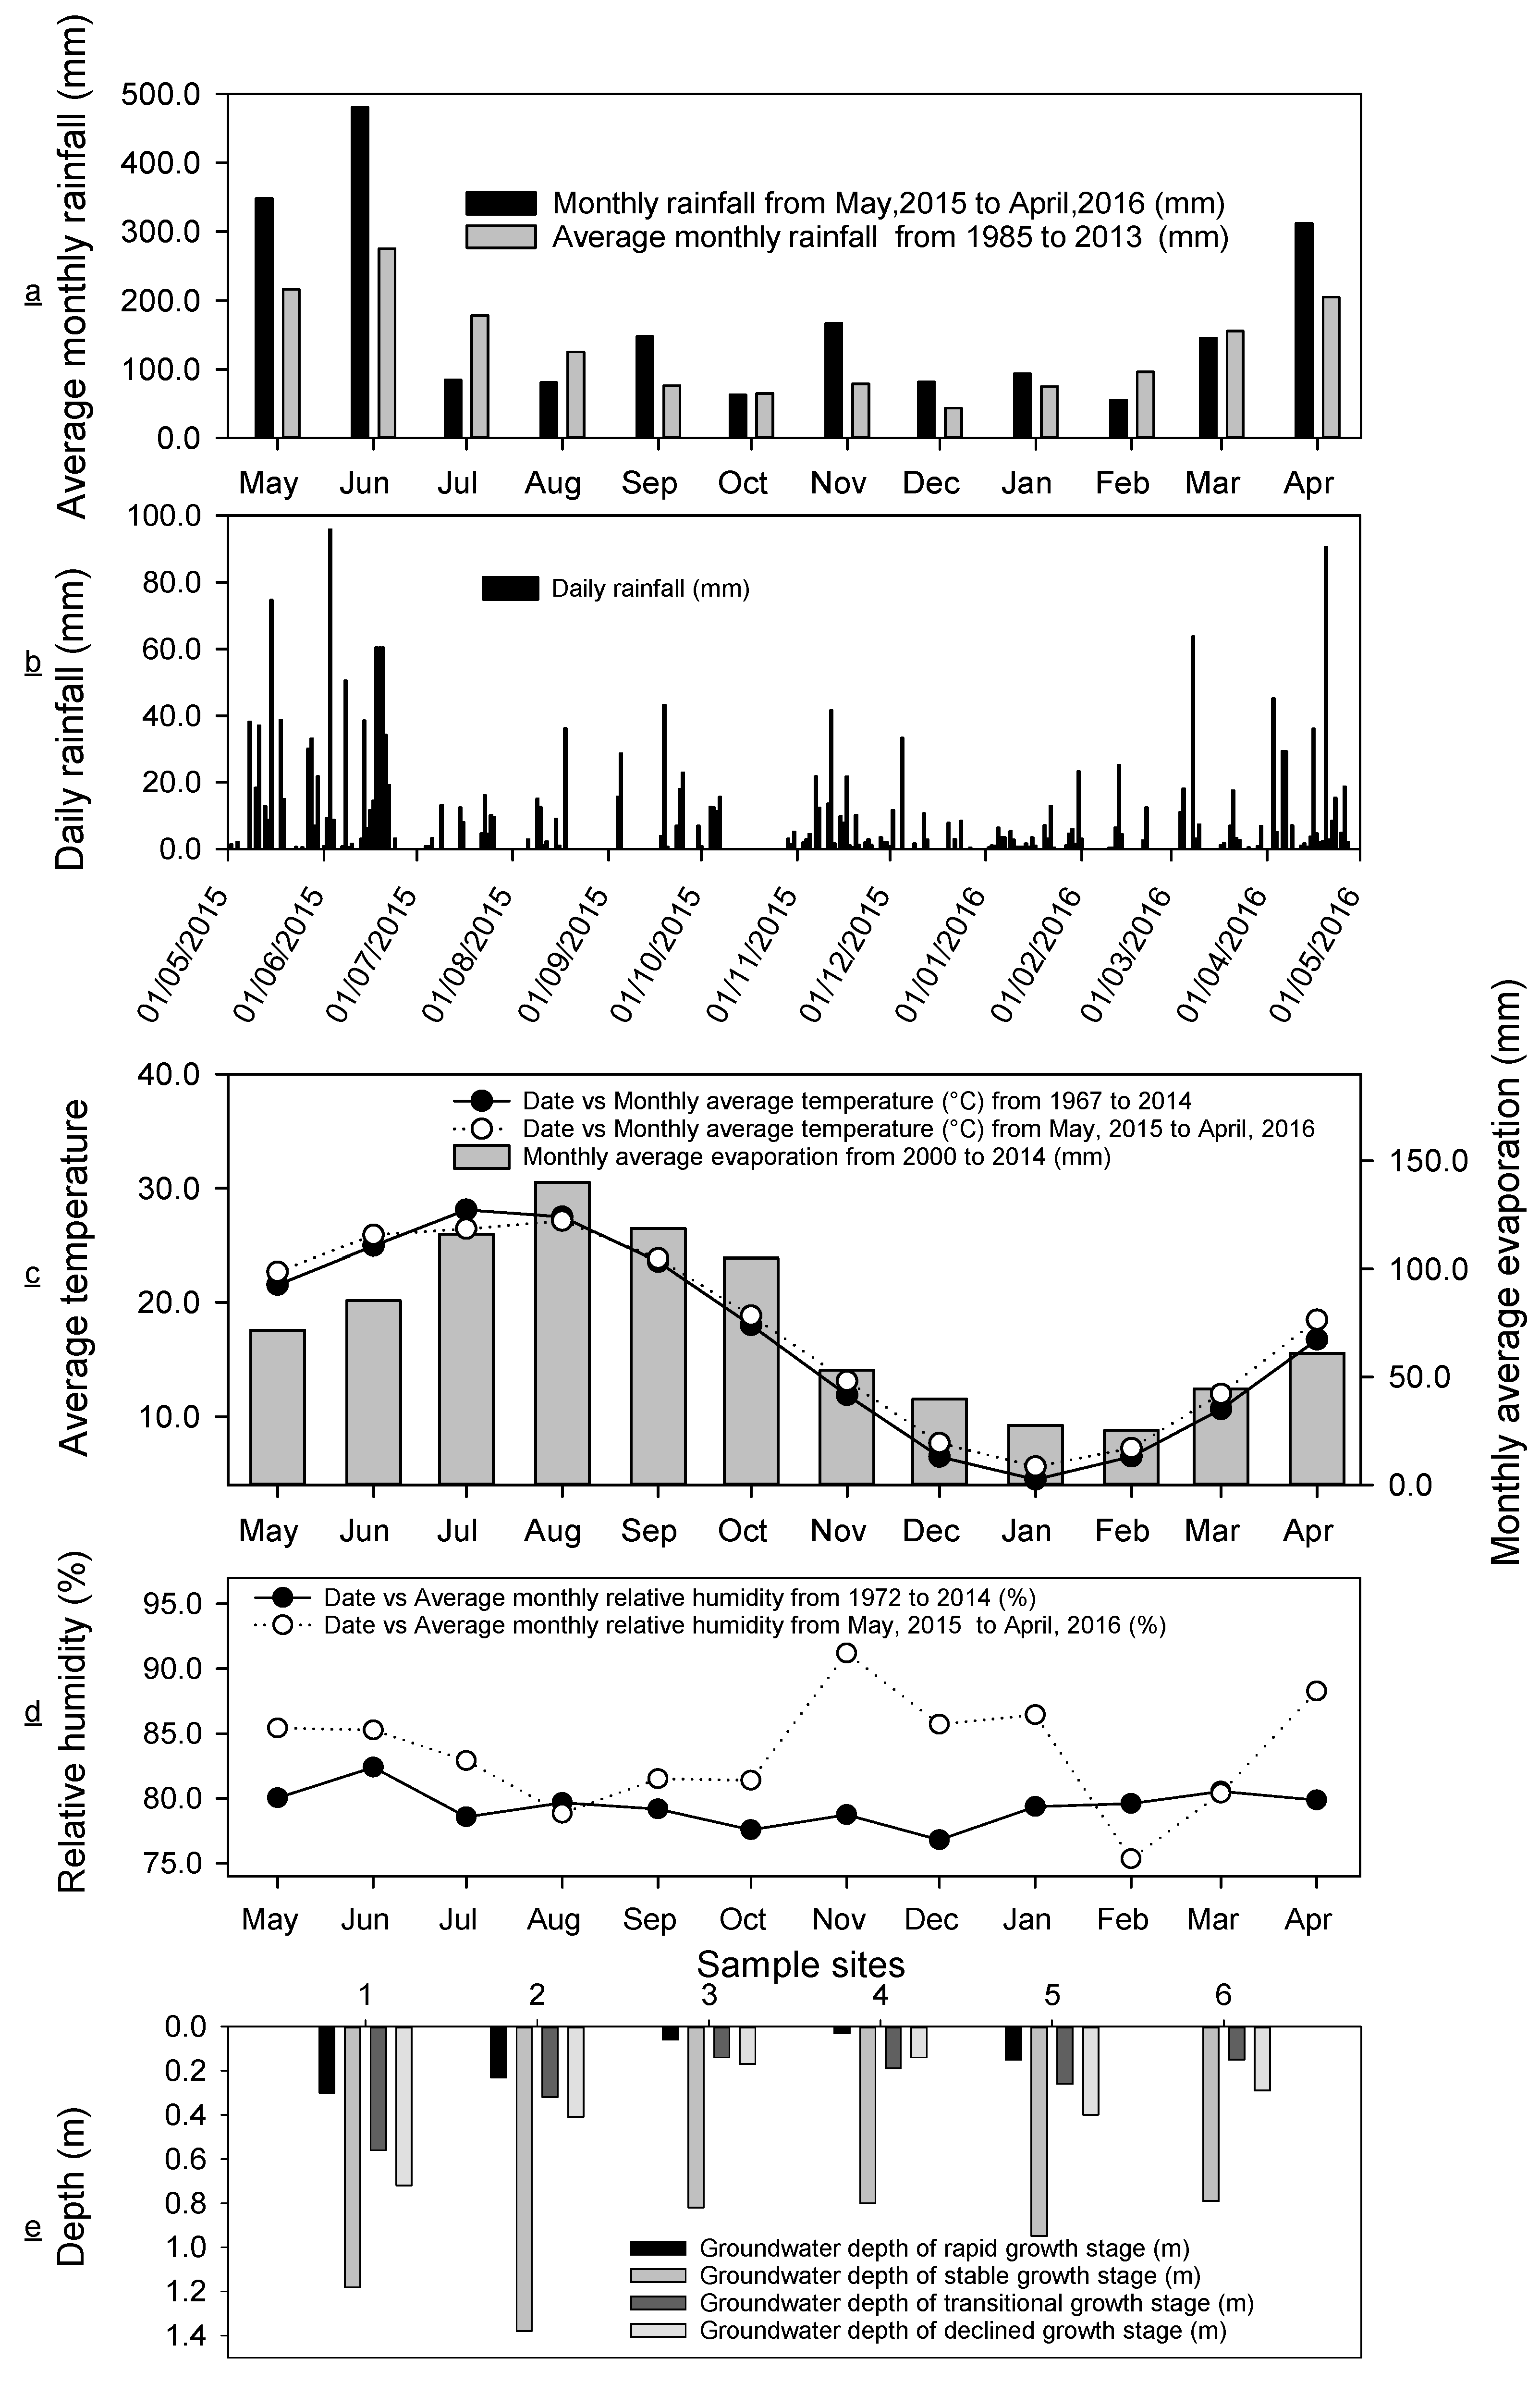
2.4. Climatic and Hydrological Characteristics

The average monthly rainfall for the 29 years from 1985 to 2013 indicated a decrease in rainfall from June to December except for November with a little increase, and an increase in rainfall from December to June (Figure 4a). The period from May 2015 to April 2016 had different monthly rainfall levels, but the overall monthly rainfall trend was similar to the general trend from 1985 to 2013. The maximum rainfall was consistently in June; setting June as the horizontal centre in the Figure 4a, results in the curve are similar to inverted triangles. Figure 4b shows the daily rainfall characteristics from May 2015 to April 2016.
The largest difference between the average monthly rainfall levels from 1985 to 2013 and the monthly rainfall levels from May 2015 to April 2016 was that the rainfall levels in May and June of 2015 were significantly higher than the average monthly rainfall levels from 1985 to 2013. This can be attributed to the El Nino effect, which resulted in heavy rain in Southern China, including the study area during the summer [41,42]. The El Nino-related rainfall resulted in warmer and rainier conditions in late autumn (November) and winter (December–next February) in 2015. The frequency of rainfall in the late autumn and winter in 2015 was high and was close to spring 2016 levels (March to May) (Figure 4b). However, given the lower maximum rainfall intensity, rainfall patterns in the winter of 2015 significantly differed from those previously observed. As such, the stable growth stage of Carex cinerascens extended into the dry season, while the rapid growth stage, the transitional growth stage, and the declining growth stage extended into the rainy season.
The monthly mean temperatures from November 2015 to April 2016, except for July and August, were higher than the corresponding mean monthly average temperatures from 1985 to 2013 and led to warmer late autumn and winter in 2015 (Figure 4c). Monthly evaporation should follow a similar trend as the mean monthly temperatures in the long-term measurements (14 years). Evaporation data were measured from the water surface and therefore did not represent actual evaporation of soil, making it difficult to obtain precise soil evaporation data between 2015 to 2016 because these evaporation data were from the nearest hydrological station which measures water surface evaporation every day. However, these data were still useful as the reference for 2015 to 2016. At all growth stages, evaporation was high with its maximum value during the stable growth stage (October, 104.98 mm/month) followed by the rapid growth stage (April, 61.00 mm/month), the transitional growth stage (November, 53.05 mm/month), and the declining growth stage(December, 39.78 mm/month). The mean monthly relative humidity (RH) from the Chinese Meteorological Department, ranged from 76.8% to 82.4% from 1972 to 2014. However, the monthly humidity levels from May 2015 to April 2016 exceeded the corresponding mean monthly values from 1972 to 2014, except for August and February. In November, the humidity levels were significantly higher compared to other months in 2015 and 2016 (Figure 4d), which is also one reason for the increased rainfall in 2015–2016. This is inconsistent with the variations in mean monthly humidity from 1972 to 2014. The relative humidity in November 2015 (91.2%, the transitional growth stage) exceeded the levels in October 2015 (81.39%, stable growth stage), December 2015 (85.71%, declining growth stage), and April 2016 (88.27%, rapid growth stage). The level also exceeded the monthly relative humidity of November from 1972 to 2014 by 15.81%.
Figure 4e and Table 1 show the variations in the groundwater depth and water table at the sampling sites between the different growth stages. The groundwater depth during the rapid growth stage ranged from 0.00 to 0.30 m, making it close to the soil surface. As the rainfall decreased and evaporation increased, the groundwater reached its maximum depth, ranging from 0.79 to 1.38 m during the stable growth stage. As the rainfall increased, the groundwater depth rose, ranging from 0.14 to 0.56 m and 0.14 to 0.72 m during the transitional growth stage and declining growth stage respectively.
During the stable growth stage (in October) in 2015, the water level of the Lake was lower than that of the Xiu River. However, the water levels of the Lake during the rapid growth stage, transitional growth stage, and declining growth stage were significantly higher than those of the Xiu River in the corresponding months (the Lake and the Xiu River rows in Table 1). Sample site 1 in Figure 1c was located close to the river, where the water level was higher than that of Poyang Lake across all growth stages (Figure 1).
Figure 3 shows the variation in the soil water content with their depths during different plant growth stages. Generally, the soil water moisture increased at deeper soil across all growth stages. The changing trends of soil water moisture at different depths across different growth stages. At the depth of about 0.20 m, except in the stable growth stage, in other stages soil moistures all decreased with depths increase. This proved that evaporation had a strong effect on the soil at a depth of 0.00 to 0.20 m, which reduced the soil moisture. In the stable growth stage, because the rainfall was the smallest of the four stages, soil moisture increased with soil depth increases. In the other three stages, due to the increase of rainfall, the uppermost soil was replenished by rainwater, so that the soil moistures at the soil depth of 0.05 to 0.10 m was higher than those of the soil at depth of 0.20 m. This is closely related to the sampling time. If samplings were carried out after a very long time after rainfalls, the rainwater can be gradually replenished downward and evaporation can reduce moisture of the upper soil so that the soil moisture at the depth of 0.05 to 0.10 m would not be higher than that of the soil moisture of about 0.20 m at the transitional growth stage, declining growth stage and rapid growth stage. Because the soil moisture data did not show significant jumps, it means that from the surface to the depth of 2.00 m, the hydraulic connection was very good, so the upper soil layer water can flow to the lower layer, and the lower layer water can also replenish the upper layer and there’s no reason that 0.00 to 0.10 m hydraulic connection were bad and 0.10 to 2.00 m hydraulic connection were all good. Maximum soil water moisture was reached at the rapid growth stage, followed by transitional growth stage, declined growth stage, and stable growth stage. The soil water moisture approached about 12% at the stable growth stage, which was the lowest limit. This contrasted with the variations in the groundwater depth and was consistent with the variations in monthly rainfall levels in different growth stages. The pattern of these data changes should be related to the variation of isotope compositions and the proportions of water sources.

3. Results and Discussion

Table 2 shows the isotope compositions of the water sources during different growth stages. The δ 2 H values of the Carex cinerascens stem water during the rapid growth stage, the stable growth stage, the transitional growth stage, and the declining growth stage were 11.73 ‰, 28.91 ‰, 61.91 ‰, and 24.73 ‰ respectively; the δ 18 O values were 2.76 ‰, 4.72 ‰, 8.91 ‰, and 5.10 ‰ respectively. The isotope compositions of Carex cinerascens stem water were within the range of all available water sources (Table 2), indicating that all sources (rainwater, shallow soil water, deep soil water, and groundwater) could serve as potential water sources for Carex cinerascens. Carex cinerascens stem water may be composed of four types of water with different isotope compositions.
In the Figure 5, from the rapid growth stage to declined growth stage, there is a rising trend of slopes (from 7.28 13.43 ) and of intercepts ( 8.69 43.53 ). This might not be caused by temperature and relative humidity, as when the relative humidity was lower and the temperatures were higher and when the kinetic fractionation was stronger, the slopes and intercepts of the δ 2 H– δ 18 O regression lines were lower [43,44]. Silverman [45] found at sufficiently high temperatures, there would be a very small isotope fraction concerning the mass contribution. This cannot explain the simultaneous unidirectional increase in slope and intercept, since the mean temperature of each stage did not vary unidirectionally (Figure 4). This is not the case here because of no significant correlation between the slope of the δ 2 H– δ 18 O regression line and temperature or relative humidity. In different regions, the slopes and the intercepts of the local meteoric water lines may be different. In the same area, the slopes and the intercepts of the local meteoric water lines may be different too, because the slopes and the intercepts of the linear relationships between δ 2 H and δ 18 O of different water vapor sources may be different. Southeastern part of China, and specifically the area around the Yangtze River, is characterized by a monsoon climate, so the water vapor source changes in different seasons. The Poyang Lake is located in the area of multiple water vapor sources. At different Carex cinerascens growth stages, the slopes and the intercepts of the local meteoric water lines were different. In this region, the slopes and the intercepts of δ 2 H– δ 18 O in summer are lower than those in winter [46]. Although this feature belongs to the local meteoric water lines, but it appeared in the δ 2 H– δ 18 O relationship line of shallow soil water, deep soil water, groundwater, rainwater and Carex cinerascens which indicates that researchers should further analyze the δ 2 H– δ 18 O relationship line of multi-substance mixing, which is likely to show the characteristics of the local meteoric water lines.

3.1. Secondary Sources Characteristics

When comparing the different growth stages, the temperature was highest during the stable growth stage (October). This was followed by the rapid growth stage (April), the transitional growth stage (November), and the declining growth stage (December). The relative humidity was highest in the transitional growth stage (November), followed by the rapid growth stage (April), the declining growth stage (December), and the stable growth stage(October). Given this, in the stable growth stage, the high temperature and low humidity should have resulted in the strongest isotope fractionation, such as the lower slope and intercept of the δ 2 H– δ 18 O regression lines. Similarly, low temperatures and high humidity should have led to a higher slope and intercept of the δ 2 H– δ 18 O regression lines in the transitional growth stage, but in four stages there is no one as such occasion (Figure 5).
The slope and intercept of the LMWL in the Figure 5 were higher than those of previous studies. The LMWL of Wu et al. [47] was δ 2 H = 8.17 δ 18 O + 12.5 whose slope and intercept were higher than those of Zhan et al. [48]. The slope and intercept of LMWL of Poyang Lake are much higher than those of surrounding areas. Even in the Yongxiu area, which is very close to Poyang Lake, the slope of δ 2 H– δ 18 O from its surface water was only 4.71, and the intercept was only 9.3 [49], which is far from 9.62 and 19.48 in the Figure 5. The surface water of Yongxiu should be affected by evaporation, which made the slope and intercept lower, but the LMWL of Mount Lu [50], 13 km away, is also significantly different from that of Poyang Lake. The LMWL of Mount Lu is δ 2 H = 8.4 × δ 18 O + 14 [50]. Even if compared with the δ 2 H and the δ 18 O the Yangtze River connecting to Poyang Lake, the farther the sample points in Poyang Lake from the Yangtze River were, the bigger the difference between their δ 2 H and δ 18 O were [51], but the LMWL δ 2 H = 8.38 δ 18 O + 17.30 [52] of Dongting Lake which is as large as Poyang Lake had close intercept in the Figure 5. Why is the LMWL of Poyang Lake so different from the δ 2 H– δ 18 O relationship line of its surrounding areas, but Poyang Lake and Dongting Lake, which is about 300 km apart, had similar intercepts of their LMWLs? If we ignore distance and focus more on the type and size of water, the reason is obvious: large lakes may have the ability to control the intercepts of LMWLs above them. Because both Poyang Lake and Dongting Lake are large lakes, they modulate their LMWLs so that their intercepts are similar. How did they do that?
Dongting Lake is located at about 29 ° N [53]. Dongting Lake [54] and Poyang Lake [55] belong to humid subtropical monsoon climate region. The average altitude of Dongting Lake is about 25 m [56]. The average altitude Poyang Lake is about 13 m [57], which is very close to our data (Table 1). The average area of Dongting Lake is about 2680.29 km 2 [58]. The average area of Poyang Lake is over 3000.00 km 2 [59]. So, Dongting Lake and Poyang Lake have similar latitudes, elevations and areas and the same climate type, so their evaporation intensity will not vary too much, which makes them have similar secondary water sources. The evaporated water from lake surface mixes with atmospheric water to form rainfall, which changes the LMWL characteristics (the slope and the intercept). Gat et al. [60] calculated that moisture derived from the evaporation of the Great Lake contributes 4.0∼15.7% during the summer months to the atmospheric vapour load in the region. Machavaram and Krishnamurthy [23] estimated 9.0∼16.0% of the atmospheric water content downwind from Lake Michigan was derived from Lake evaporation during summer. The evaporation of Poyang Lake is also the strongest in summer (Figure 4). Both Gat et al. [60] and Machavaram and Krishnamurthy [23] found that evaporation significantly increased the d-excess (intercept) of the LMWL. The slope changes when the intercept changes. If secondary sources effect is strong, the LWML characteristics of atmospheric water will be altered, resulting in a LMWL dominated by this factor. This is the reason why Dongting Lake and Poyang Lake had nearly the same intercepts of their LMWLs and why Poyang Lake’s LMWL was inconsistent with those of nearby waters. D-excess most influenced by the secondary sources can be increased to to several tens or even close to one hundred [23], and it was highest in winter, lowest in summer [23,24,61]. The LMWL of Poyang Lake also had such characteristics [47,62]. Vimeux et al. [63] studied 420,000 year d-excess record of East Antarctica, and the maximum value was only about 20, but the max of the d-excess of 2018 to 2019 in Poyang Lake can reach about 40 [62]. D-excess was negatively correlated with rainfall amount [61,62,64]. But the d-excess in some models was significantly low, or even negative [65,66]. The d-excesses in the Figure 5 were from 8.69 to 42.53, which is within the range of secondary sources effect and showed a trend of increasing from summer to winter. D-excess increased almost linearly from summer to winter (Figure 6). Therefore, the secondary sources is indeed an important reason for the increase of d-excess of δ 2 H– δ 18 O in Poyang Lake.
There is a negative correlation between the rainfalls and the slopes in the Figure 6, as when the rainfall decreased (the stable growth stage and the declining growth stage), the slope increases significantly, and when the rainfall increased (the transitional growth stage), the slope decreased. A negative correlation between rainfall and slope is rare and may be related to the way we plotted Figure 6. More often, the δ 2 H– δ 18 O relationship line is plotted by only one type of water, such as merely rainwater or surface water. However, except the δ 2 H– δ 18 O relationship line of rainfall (Figure 6), each of δ 2 H– δ 18 O relationship lines in the Figure 6 were drawn together by rainwater, shallow soil water, deep soil water, Carex cinerascens and groundwater at the same stage. But in this way, the δ 2 H– δ 18 O line at each stage actually displayed the effect of secondary sources, which was previously only represented in δ 2 H– δ 18 O relationship line for rainfall or surface water from large lakes, so we propose three explanations:
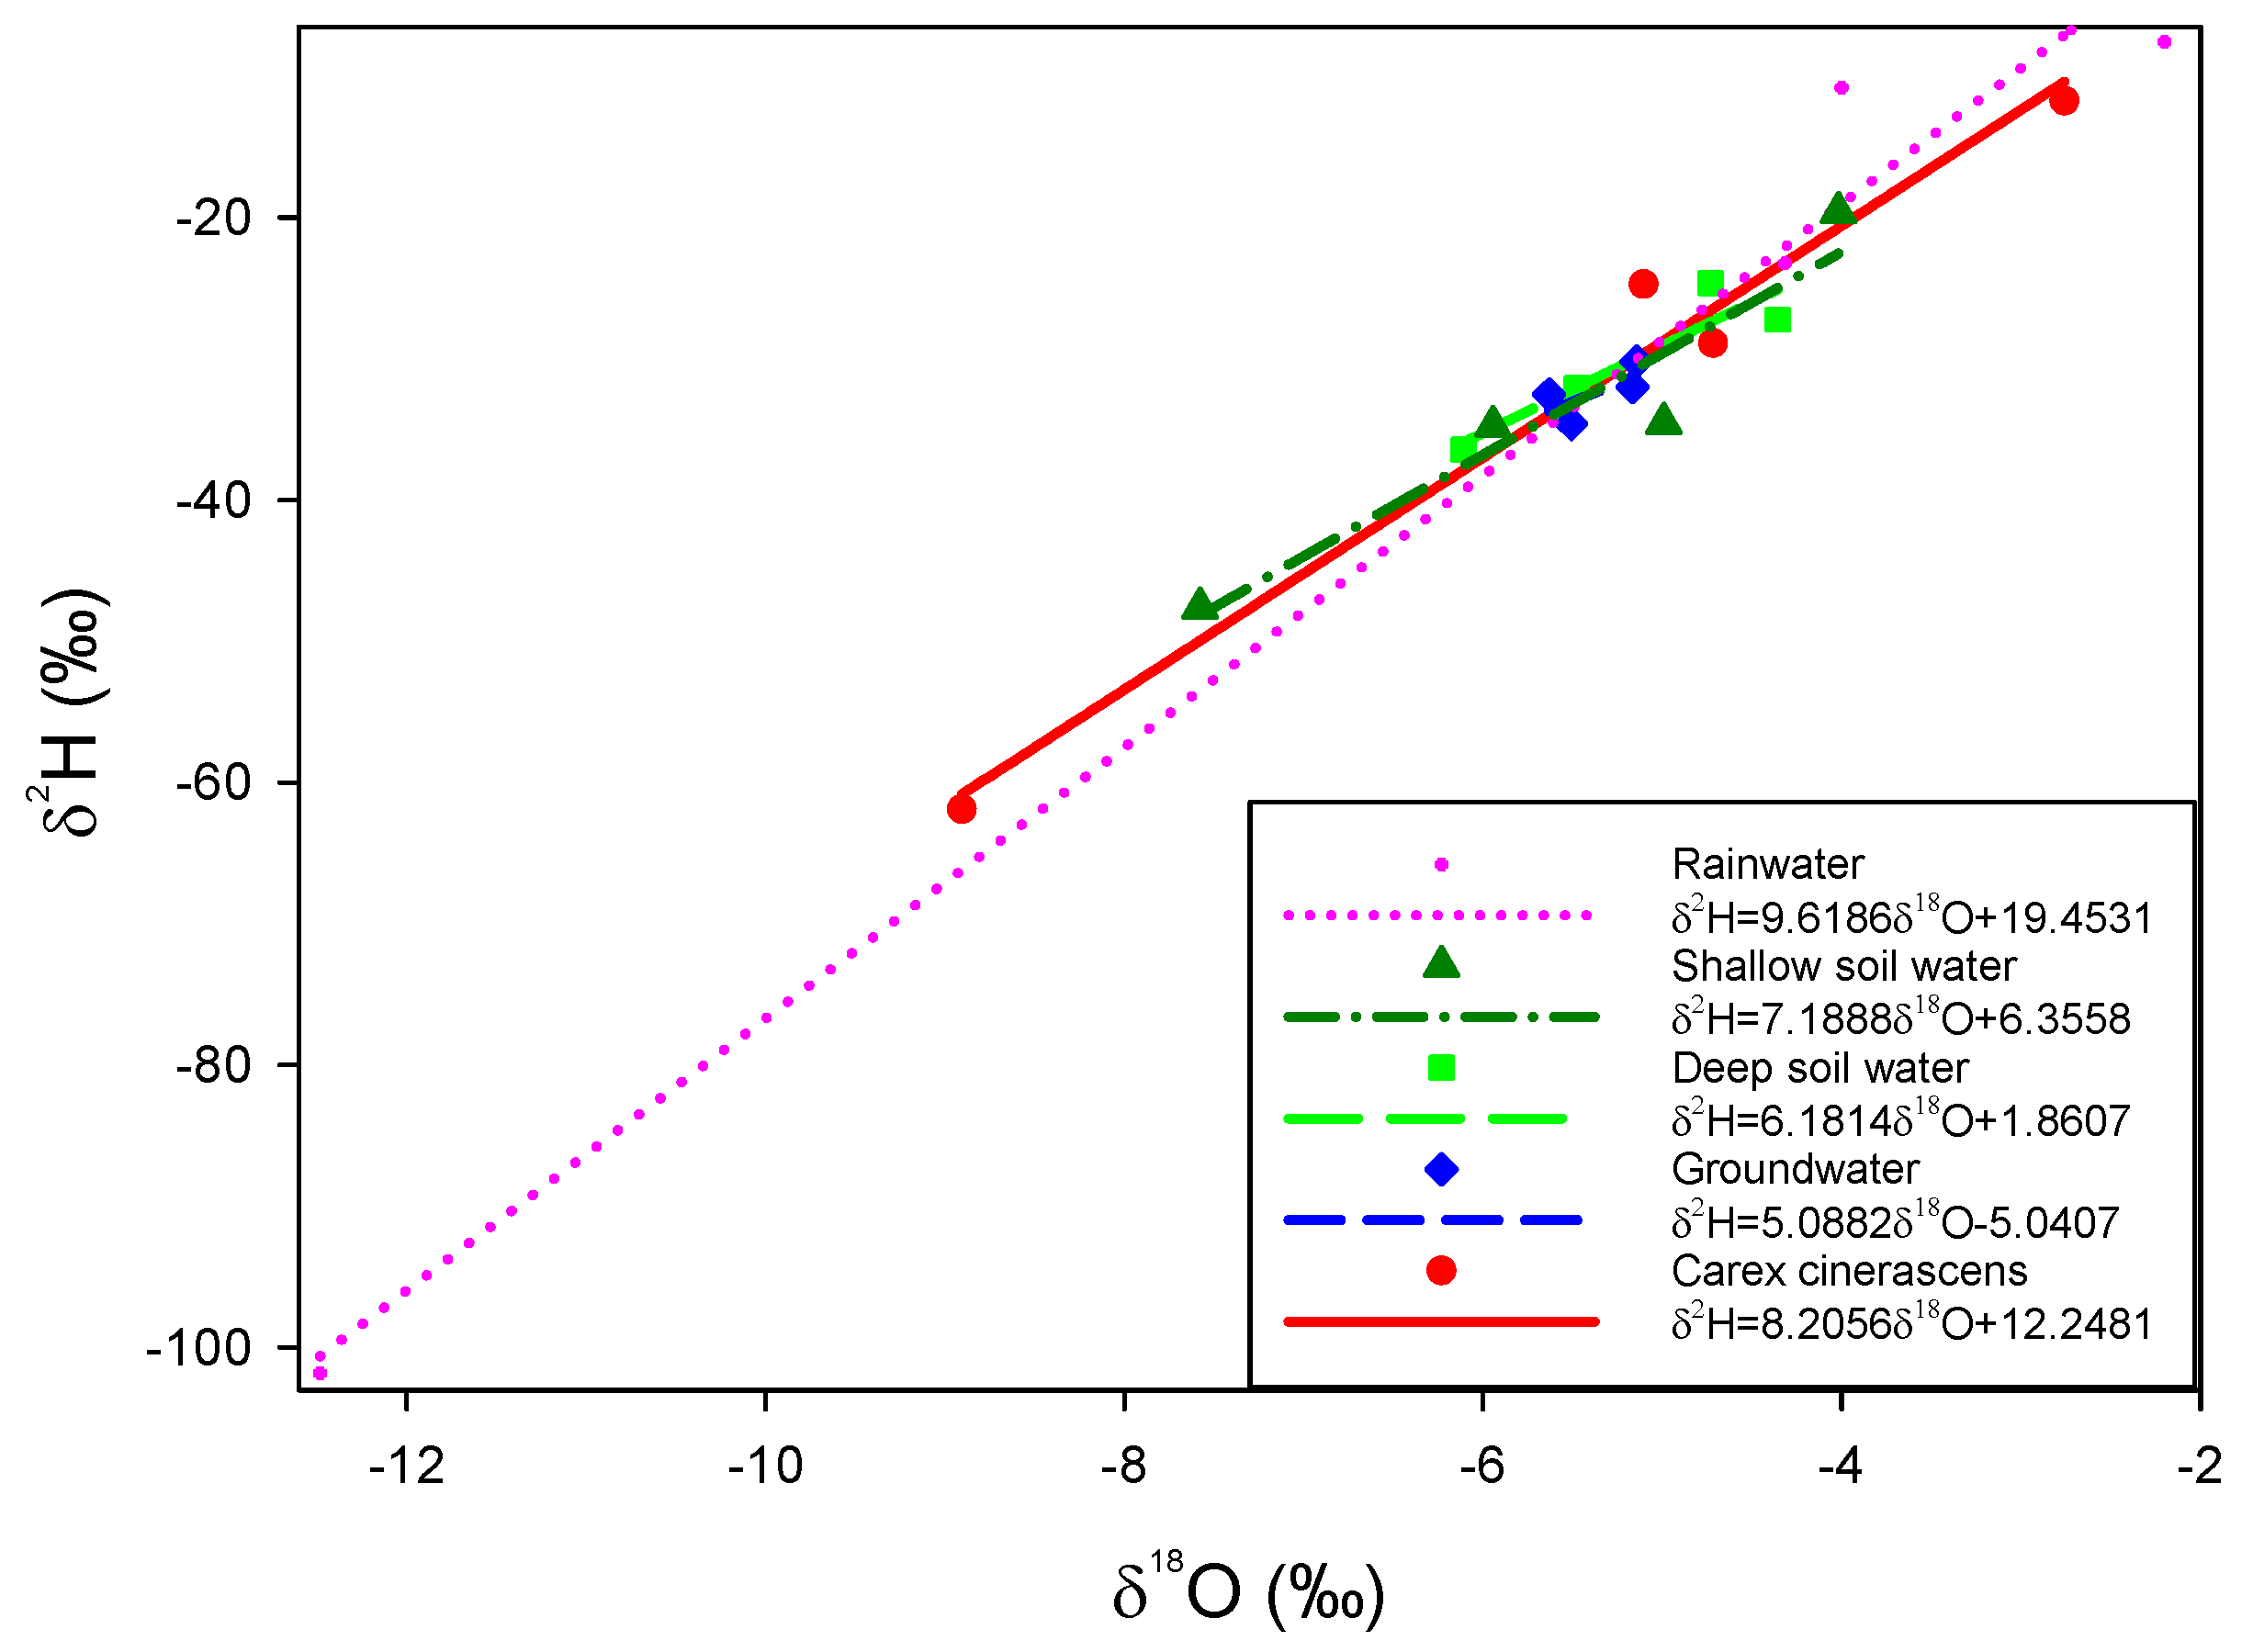
  • Using the isotope compositions of various substances together, such as rainwater, shallow soil water, deep soil water, Carex cinerascens and groundwater, to plot the δ 2 H– δ 18 O relationship lines can also reflect the secondary sources characteristic, which is the embodiment of the δ 2 H– δ 18 O relationship of rainfall in the aquatic ecosystem;
  • There are also secondary sources effects similar to lakes in plants, shallow soil water, deep soil water, and groundwater, which should be studied in the future. No matter where, no matter how small, as long as there is evaporation and condensation, there is secondary sources. How big the impact is a further question;
  • The first explanation and the second explanation work together.

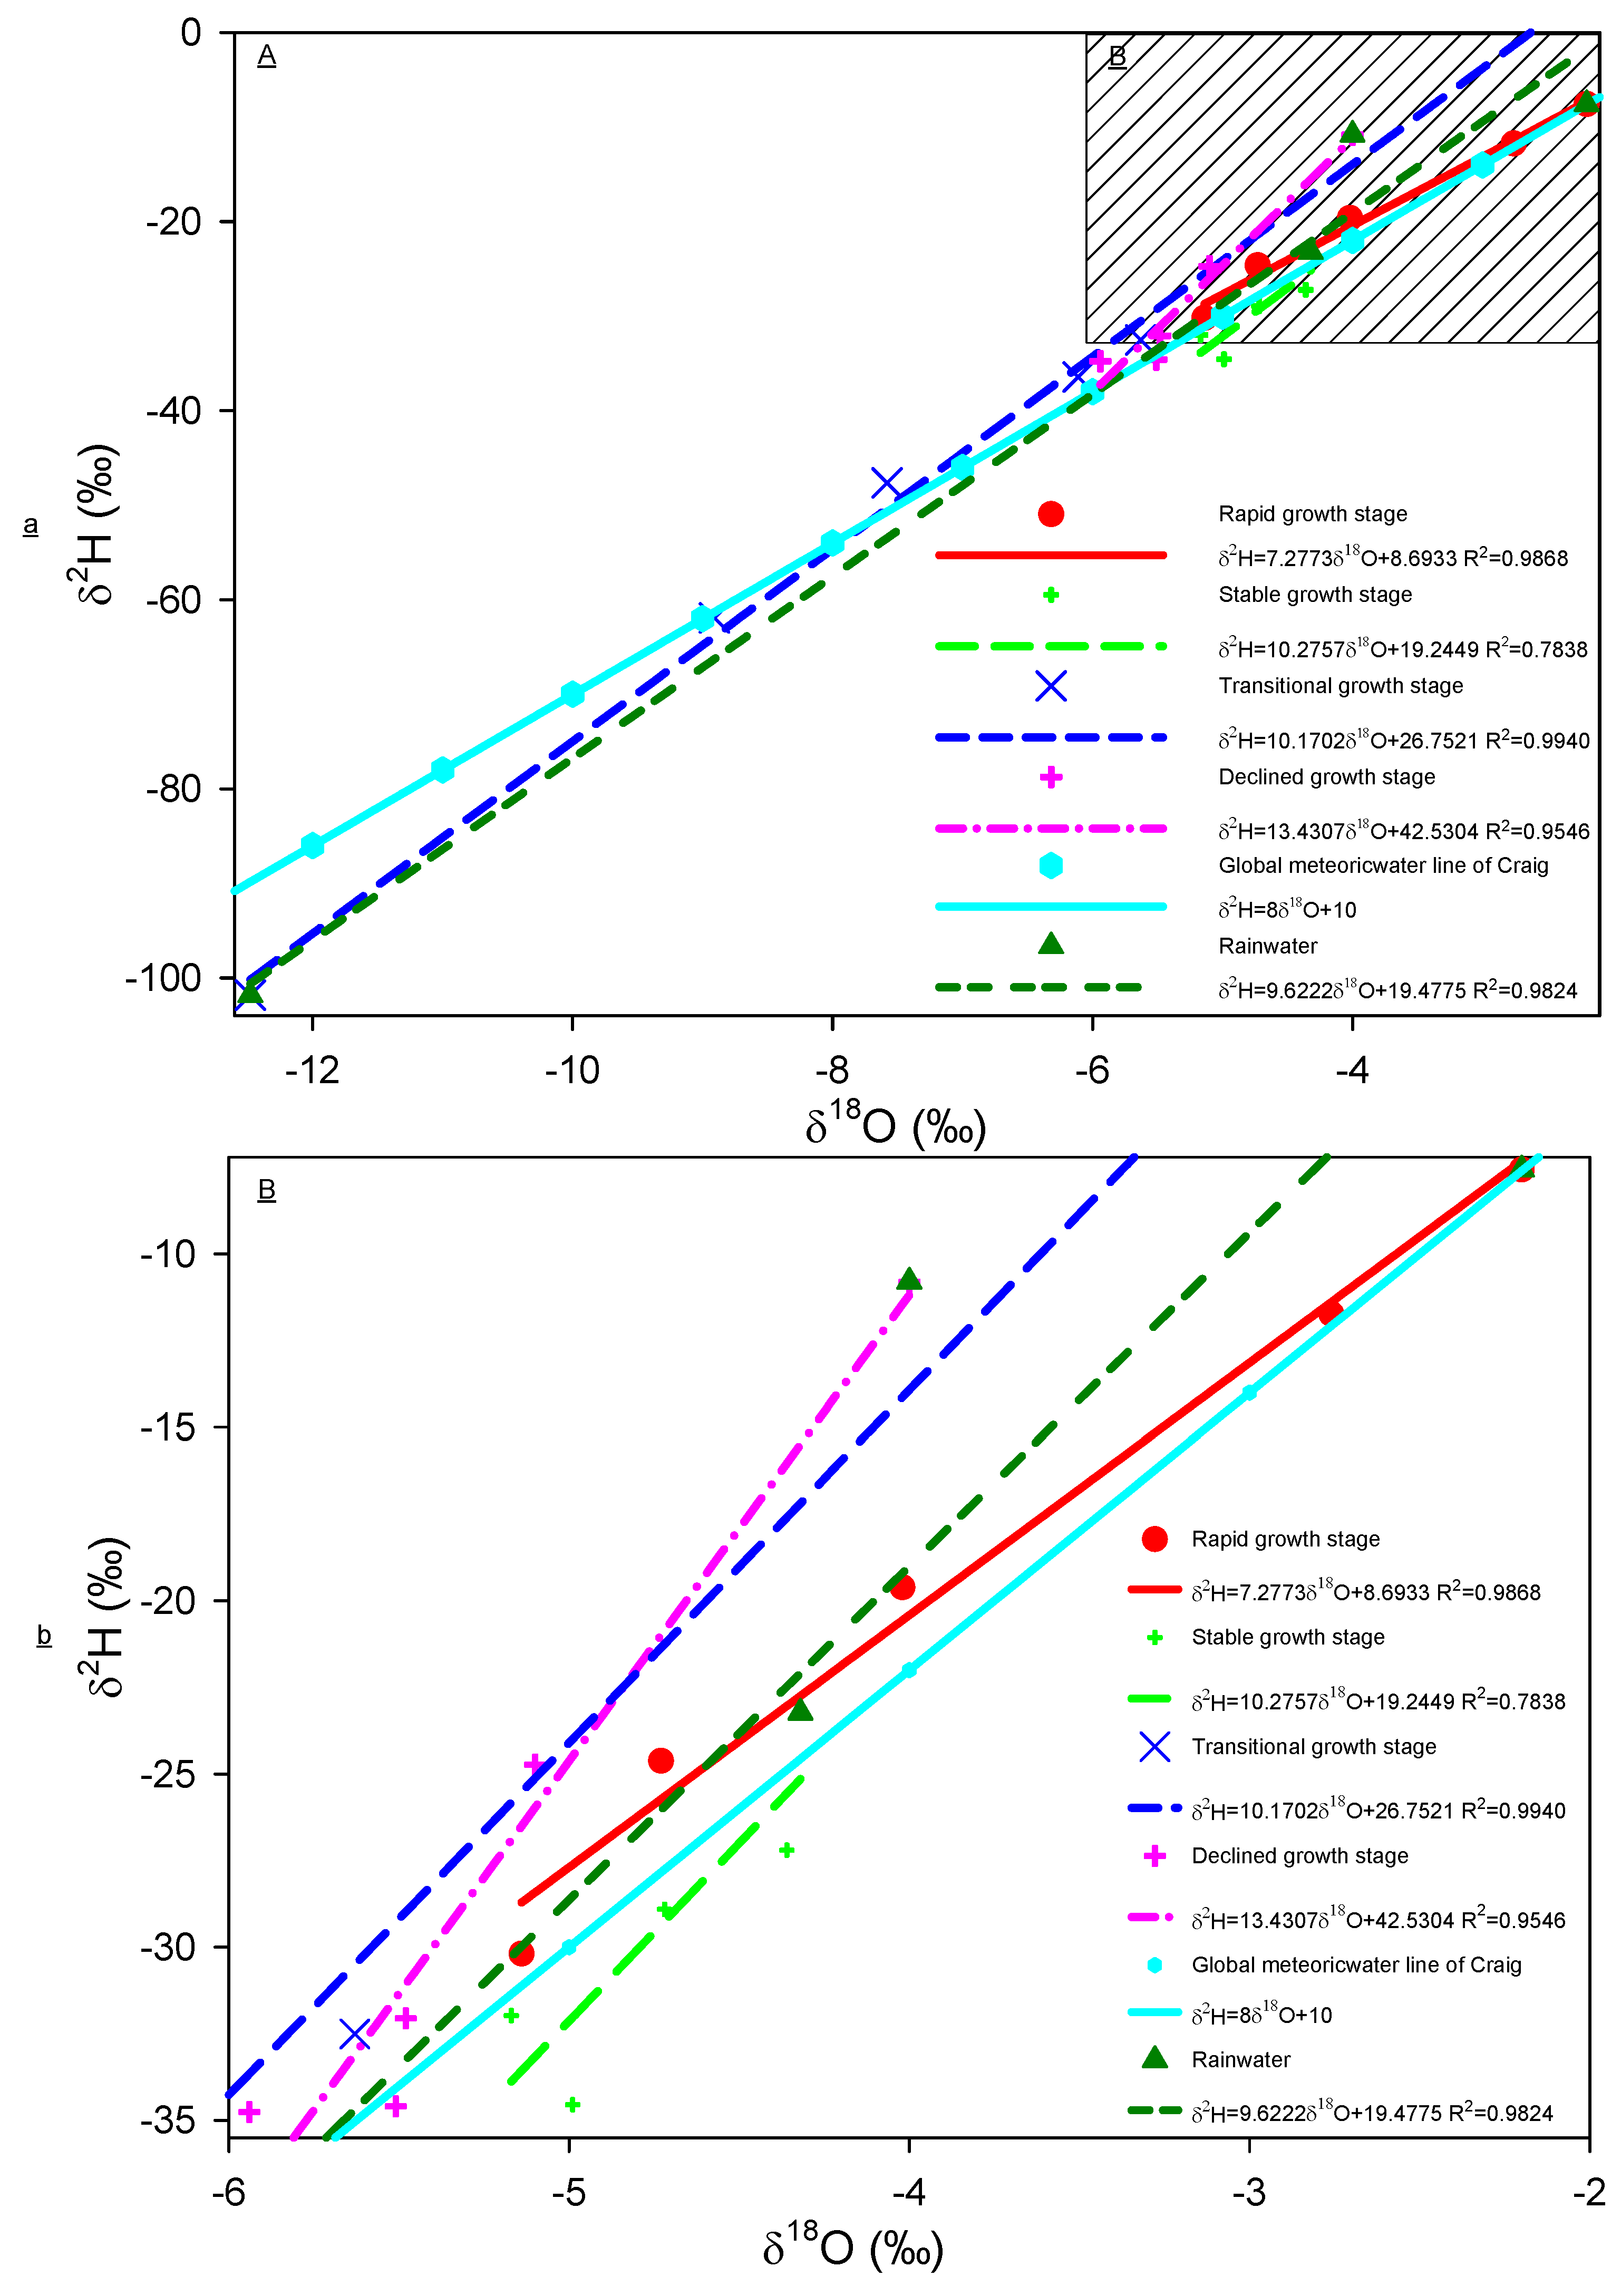
3.2. The Vertical Cumulative Effect of Evaporation Is Reflected in the Monotonically Decreasing Slope and Intercept of δ 2 H– δ 18 O

There was a significant linear relationship between the δ 2 H– δ 18 O values of the same sort of water samples of the different growth stages (Figure 7). Zhao et al. [67] investigated the effects of local processes on the d-excess variations in different water sources in the Heihe River Basin in China. They found that the δ 2 H– δ 18 O regression lines of leaf water, xylem water, and shallow soil water deviated gradually from the corresponding local meteoric water lines under different climatic conditions (increased temperature or decreased relative humidity). This demonstrates that comparing the δ 2 H– δ 18 O regression lines of different water sources with the global meteoric water line or local meteoric water line can find the effect of climate on isotope compositions of different water sources.
Evaporation can lower the slope of δ 2 H– δ 18 O relationship line, so the slope of the local evaporation line tends to be smaller than that of the GMWL [68,69,70]. Evaporation [20] and subcloud evaporation of raindrops [71] could lower d-excess. Benetti et al. [72] found a negative correlation between humidity and d-excess. If it is the simple results of evaporation, the slope and the intercept of the δ 2 H– δ 18 O relationship line for the shallow soil water should be the lowest, because the evaporation intensity of shallow soil water should be the greatest. As soil depth increases, soil moisture also increases (Figure 3), which may explain the top-to-bottom decrease in d-excess. The soil moisture in soil and the air moisture in the soil should be positively correlated. Therefore, the greater the soil moisture, the greater the air humidity in the soil, and the smaller the d-excess. But if considers that the factor affecting soil moisture was temperature, actually greater soil moisture should imply less evaporation and thus higher d-excess. As soil depth increases, soil moisture also increases, thus an increase of d-excess with depth is expected. According to the analysis of evaporation, the d-excess should become larger, but according to the analysis of humidity factors, the d-excess should become smaller. As soil moisture increases, temperature and humidity affect d-excess in opposite directions. But groundwater had the lowest slope and intercept, which is obviously not the effect of simple evaporation intensity and soil moisture, but the result of cumulative evaporation of water flowing from top to bottom and the effect of soil moisture.
We can conclude that from rainwater to shallow soil water, to deep soil water, and to groundwater, there is a decreasing trend not only in slopes but also in intercepts in the Figure 7. This can be explained as the following steps:
  • Rainwater on the ground is affected by evaporation, which will cause the δ 2 H and δ 18 O of water to increase [73] and lower the slope and the intercept of δ 2 H– δ 18 O relationship line;
  • When rainwater flows from shallow soil to deep soil and to groundwater, it is still affected by evaporation. The rainwater flows into the soil and then reaches the groundwater. The deeper the flow, the stronger the total evaporation. For example, when rainwater becomes groundwater, it needs to experience surface evaporation, shallow soil evaporation, lower soil evaporation, and groundwater evaporation, but shallow soil water only needs to experience surface evaporation and the shallow soil water evaporation.;
  • In every month or every season, there are changes in isotopes compositions of rainwater and so is the water seeping into the soil. But in the soil and groundwater, the previous water which bears more evaporation than the newer water seeping in already exists. So, further down, the average evaporation of the water body subjected is still increasing as depths increases. That’s the reason that when we fitted the line about δ 2 H– δ 18 O values through the points from different stages of those materials respectively, there is a decreasing trend in slopes and intercept of those lines from the ground to underground.
  • D-excess is not only lowered by accumulation of evaporation, but also by the increasing of soil moisture.
Rainwater flows to the depths to become groundwater, and this process is always affected by evaporation, so the lower the water body is, the longer the evaporation time and the stronger the cumulative evaporation effect. This is the vertical accumulated performance of the evaporation effect on the isotope compositions of water. The slope and intercept of the Carex cinerascens line in the Figure 7 are located between rainwater and the others. This can reflect that Carex cinerascens have obtained water from different water sources, such as shallow soil water, deep soil water, rainwater, and groundwater. But what percentage of different water sources are absorbed by Carex cinerascens is another question that we will discuss next.

3.3. Exact Solutions for Proportion of Potential Water Sources in Carex Cinerascens Stem Water
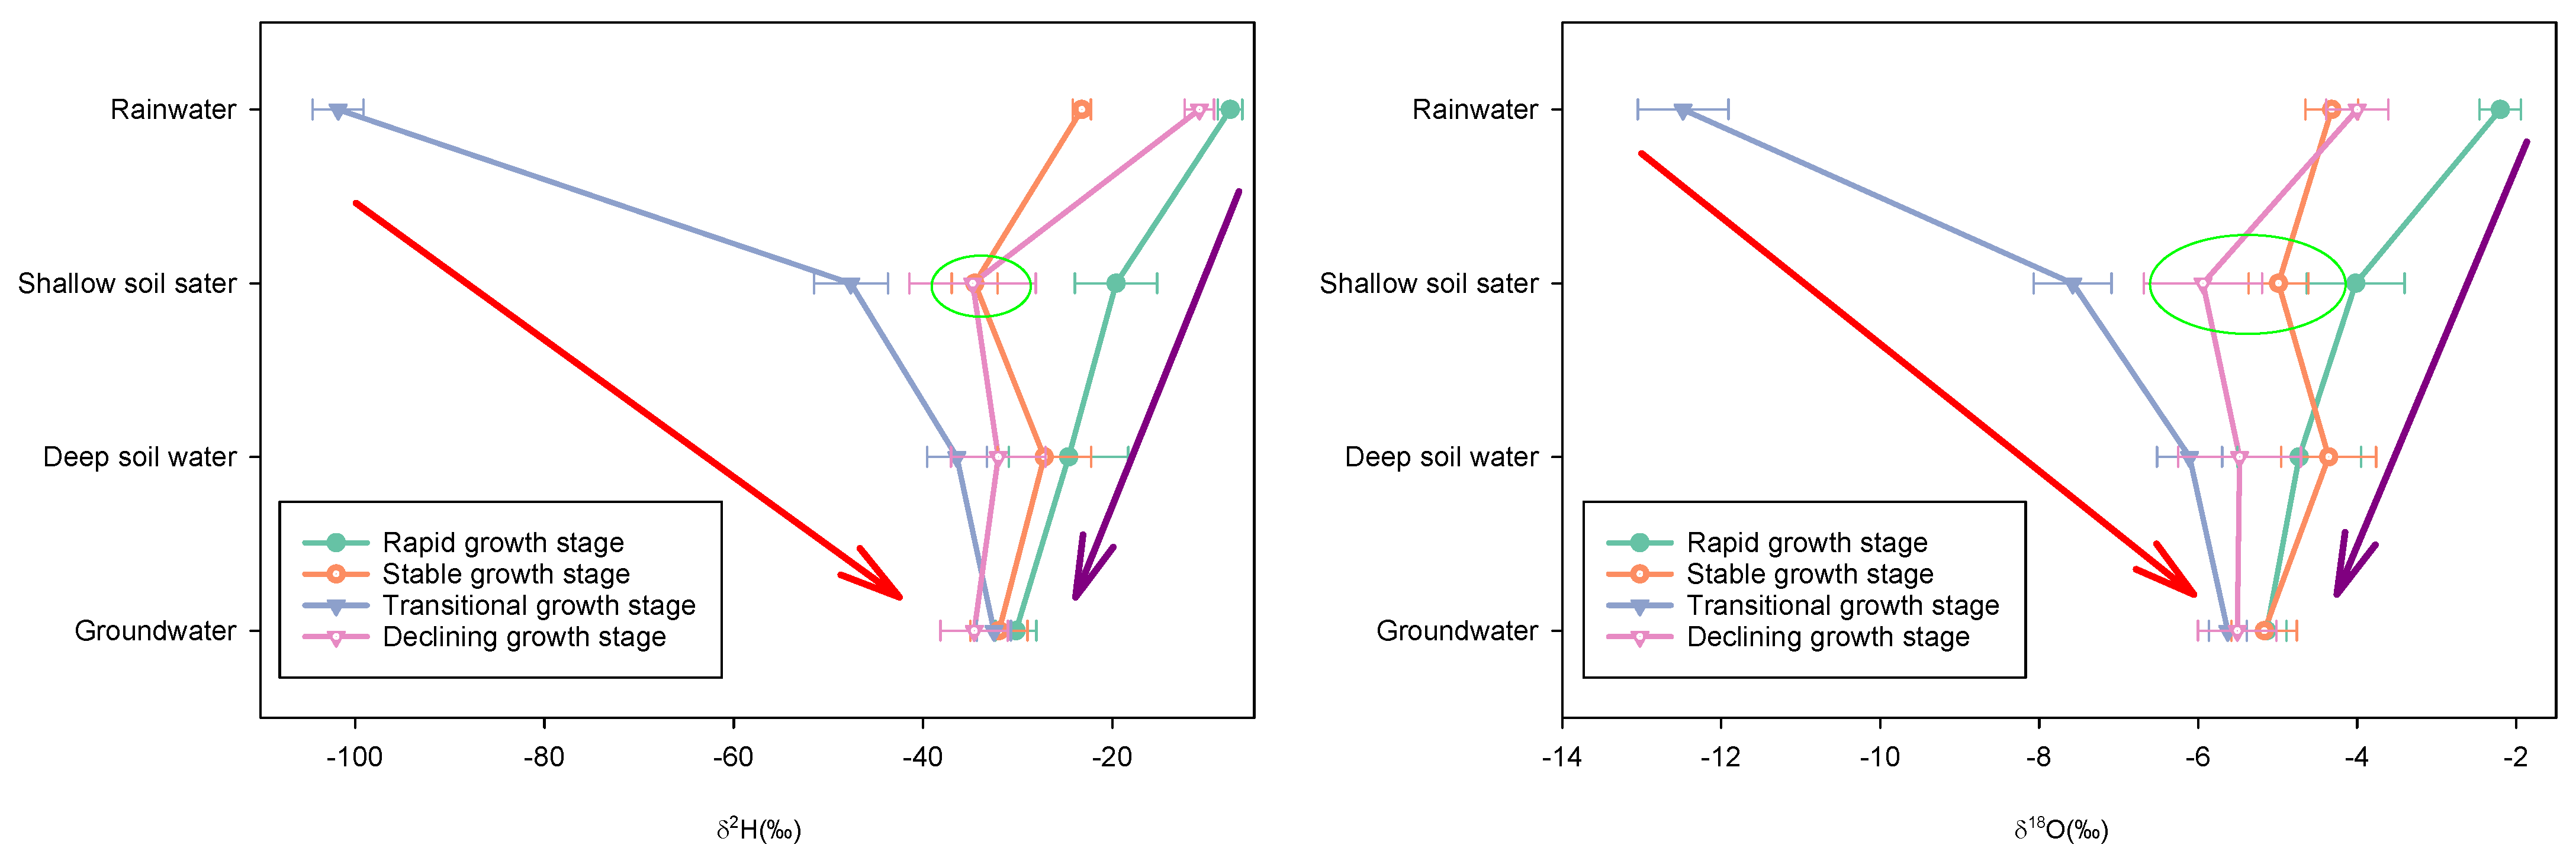
The measured dual isotopic compositions ( δ 2 H and δ 18 O) of potential water sources for Carex cinerascens can be combined into a high–low limits. If both δ 2 H and δ 18 O values of Carex cinerascens stem water fall between the maximum and the minimum values of the corresponding δ 2 H and δ 18 O values of various sources, then accurate proportions of potential water sources in Carex cinerascens stem water can be calculated [74,75]. During the different growth stages, the δ 2 H and δ 18 O of Carex cinerascens stem water were between the maximum and minimum of the corresponding limits (Table 2); as such, there were appropriate proportions of different water sources. When using a mixed linear model to find the proportions of water sources, the number of water sources is required to be greater than the number of equations, so that the solution should not be unique [74]. However, in order to obtain the range of all solutions, the solution step size should be set, such as 1.0% or 0.5% and so on. Therefore, this algorithm has limited accuracy and error, and the margin of error is the step size. The question is why do we need to set the step size? Why not just solve it directly? Solving mixed linear model is not difficult, so the accuracy can be improved.
The proportion of different water sources varied across different growing seasons [76,77,78]. The linear mixed model, based on isotopic mass conservation, can be used to identify the contributiona of different water sources during different seasons [74,79]. Table 3 shows the results after applying Phillips’ formula. The equations calculated were as follows:
δ 18 O ( C a r e x c i n e r a s c e n s ) = δ 18 O R a i n w a t e r × x + δ 18 O ( S h a l l o w s o i l w a t e r ) × y + δ 18 O ( D e e p s o i l w a t e r ) × z + δ 18 O G r o u n d w a t e r × l δ 2 H ( C a r e x c i n e r a s c e n s ) = δ 2 H R a i n w a t e r × x + δ 2 H ( S h a l l o w s o i l w a t e r ) × y + δ 2 H ( D e e p s o i l w a t e r ) × z + δ 2 H G r o u n d w a t e r × l x + y + z + l = 1 x 0 y 0 z 0 l 0
In the Equation (3) above, x, y, z, and l are the proportions of rainwater, shallow soil water, deep soil water and groundwater respectively. δ 18 O ( C a r e x c i n e r a s c e n s ) is the δ 18 O of Carex cinerascens. δ 2 H ( C a r e x c i n e r a s c e n s ) is the δ 2 H of Carex cinerascens. All other symbols follow this pattern.
In general, rainfall and groundwater depth were inversely proportional (Table 3). During the rapid growth stage, the precipitation was highest and the average groundwater depth was highest too. At this stage, Carex cinerascens mainly absorbed rainwater directly ( 78.22 80.14 % ) and less shallow soil water and deep soil water. Because the depth of groundwater was very shallow (0.13 m), groundwater was also intaken by Carex cinerascens, but the ratio of groundwater ( 14.04 14.61 % ) was higher than those of shallow soil water (0∼ 7.17 % ) and deep soil water (0∼ 5.82 % ). Plant roots tend to draw water from multiple water sources in the soil [80], perhaps it is a genetically-retained strategy to resist changes of water sources. During the stable growth stage, percipitation was the smallest (62.8 mm) and the average groundwater depth (0.99 m) was the lowest. At this time, compared with other stages, Carex cinerascens absorbed the largest proportion of groundwater ( 19.22 44.99 % ), and the proportion of rainfall was also higher ( 11.10 45.46 % ). The proportion of shallow soil water (0∼ 35.32 % ) and deep soil water were wide (0∼ 43.91 % ), which were influenced by the proportions of rainfall and groundwater. During the transitional growth stage, the percipitation was 167.2 mm, only smaller than that of the rapid growth stage. At this stage, the depth of groundwater was relatively shallow with 0.27 m. Carex cinerascens obtained water only from rainwater and shallow soil water and absorbed more shallow soil water (73.62%) than rainwater (26.38%). During the declining growth stage, the percipitation in this stage was only higher than that in the stable growth stage, so the groundwater depth was only higher than that in the stable growth stage. At this stage, the proportion of water obtained by plants from multiple water sources varied within a small range, among which rainwater ( 40.56 41.82 % ) and shallow soil water ( 47.89 51.50 % ) dominated. The proportions of deep soil water (0∼ 11.55 % ) and groundwater (0∼ 6.69 % ) were small. It showed that the demand for water of Carex cinerascens decreased in this stage, otherwise, with the percipitation amount in this stage which was close to that of stable growth stage, plants should obtain more deep soil water and groundwater.
The proportions of water obtained by Carex cinerascens from each water source can be calculated according to Equation (3) and the proportions can be explained, which indicates high precision, dual isotopic compositions and stratified the soil water layer according to the actual situation to calculate the proportion of water obtained by plants from multiple water sources works. In the transitional growth stage, if we solve with the previously setting step size, the extent to which we get solutions depends on the length of the step size, but we can’t realize that there is no real solution at all. It is very necessary to give the exact solution. The approximate solutions can be found in the Table 3, but in fact, the exact solution cannot be found in the transitional growth stage (see the Appendix A). In the literature we have read about using the IsoSource model to solve the water source ratios, there is no article that says there is no solution. But now, the first time we strictly solved them, we found that there is no solution in the transitional growth stage. If we only gave approximate solutions, firstly, we don’t know whether there is an exact solution, and secondly, we don’t know whether the range of the solution is all here. For Carex cinerascens, the rapid growth stage is the most important. At this stage, despite the heaviest rainfall, Carex cinerascens still absorbed groundwater. The groundwater level was 0.13 m, so controlling the water level of Poyang Lake to 0.13 m is a better management policy to protect the growth of Carex cinerascens.

3.4. δ 2 H and δ 18 O of the Shallow Soil Water Is More Depleted Due to Evaporation

In the Table 3 and Figure 8, the δ 2 H and δ 18 O of groundwater changed very small at any stages, no matter how big the δ 2 H and δ 18 O of rainfall changed at any stage. All groundwater is ultimately derived from surface water because gravity limits the upward transport of large volumes of water. On the one hand, the groundwater volume is very large, so it is less affected by external water bodies; on the other hand, the downward movement of surface water is mixed with soil water, continuously affected by evaporation and even rechaged by upward movement of groundwater, which greatly weakens the δ 2 H and δ 18 O characteristics of surface water reaching groundwater. Although the retention time of rainfall in shallow soil water, deep soil water, and groundwater is an important factor that shoul be considered [81], the isotope compositions of shallow soil water and deep soil water in the Figure 8 were much different and showed a monotonic change from top to bottom at each stage. The variation of groundwater isotope compositions was small at all stages, but a monotonic change from rainfall to groundwater was shown. There was a negative correlation between the depth of the groundwater table and rainfall amount in the Table 3. These mean that the retention of rainwater in shallow soil water, deep soil water, and groundwater may have not much effect on the isotope composition of the remaining water. If need to judge the retention time very accurately, in the future we should measure radioisotopes, anion and cation concentration, heavy metal concentration, nutrient salt concentration, etc.
It is understandable whether the isotope compositions are monotonically increasing or decreasing from top to bottom in the Figure 8. Because rainfall replenishes shallow soil water, replenishes deep soil water, and finally replenishes groundwater. From rainfall to groundwater, the isotope composition characteristics of rainwater gradually become weaker, resulting in a monotonic change in isotope compositions. Because of the monsoon climate of Poyang Lake, the sources of rain are different in summer and winter, so the directions of monotonic changes of δ 2 H and δ 18 O are different in summer and winter from rainwater to shallow soil water, to deep soil water, and to groundwater. So, there should be reasons for non-monotonic changes in isotope compositions as the points in ovals in the Figure 8.
Not only about δ 2 H (the left part of the Figure 8) but also about δ 18 O (the right part of the Figure 8), during the rapid growth stage, did isotope compositions showed monotonically decreasing trend, while during the transitional growth stage, did isotope compositions show monotonically increasing trend. Because the rainfall isotope compositions were the enrichest in the rapid growth stage and the depletest in the transitional growth stage compared to those of soil and groundwater. When rainfall leaked through the soil and then into the groundwater, the rainfall isotope compositions characteristics were weakened, tending to the surrounding soil water isotope compositions, showing monotonically trends. However, not only about δ 2 H but also about δ 18 O, during the stable growth stage and the declining growth stage, isotope compositions showed non-monotonically decreasing nor monotonically increasing. Curiously, if we ignore the isotope compositions of the shallow soil water, we still can conclude that they were monotonically decreasing. Therefore, the anomaly is that the isotope compositions in the shallow soil water were too depleted (points in ovals in the Figure 8). Outliers in ellipses involve only two stages: the stable growth stage and the declining growth stage, which also had the lowest soil moistures and lowest rainfalls (Figure 3), indicating that soil water moisture was significantly reduced by evaporation. Based on these data, we speculated the cause of this anomaly:
  • Partial evaporation of the shallow soil water, which caused the isotopic composition of the shallow soil water to enrich;
  • After the process 1, the shallow soil water was insufficient due to evaporation, and then the deep soil water moved from bottom to top to replenish the shallow soil water. At this time, since lighter water molecules were easier to move upwards, the isotope composition of the recharging water was depleted;
  • If the effect of the process 2 was greater than that of the process 1, then the isotope composition of shallow soil water becomes depleted.
The reason this happened only in the stable growth stage and the declining growth stage (it did not occur in the transitional growth stage and the rapid growth stage) is the rainfalls (Table 3) in these two phases were the lowest two of the four stages. The soil moistures (Figure 3) in these two stages were also the lowest two of the four stages, indicating that in these two stages, shallow soil water was insufficient, so it was necessary to obtain water replenished from deep soil water. In the transitional growth stage and the rapid growth stage, due to sufficient precipitation, precipitation gradually replenished shallow soil water, deep soil water, and groundwater from top to bottom, so that the water isotope compositions tended to be monotonous from top to bottom, which is confirmed by higher soil moisture of the transitional growth stage and the rapid growth stage compared with those of the stable growth stage and the rapid growth stage (Figure 3). Although rainwater infiltrates to form groundwater, it can be divided into two types: mobile water and tightly bound water, and in different seasons, it can be divided into pore water and preferential flow, etc. [82]. The Figure 8 showed monotonic changes in the isotope composition of the water body from top to bottom in different seasons and the isotope composition of groundwater was relatively stable, indicating that the preferential flow has limited influence on the isotope composition of groundwater and that at different soil depths, mobile water was mixed with tightly bound water [83]. The replenishment of deep soil water to shallow soil water may also be that deep soil water evaporates first and then condenses in shallow soil water. If so, it indicates that there is likely to be a secondary source effect in the soil (Section 3.1 Secondary Sources Characteristics).

4. Conclusions

Soil was stratified into shallow soil and deep soil as time changed. δ 2 H and δ 18 O of Carex cinerascens stem water, rainwater, groundwater, shallow soil water, and deep soil water were analyzed. The proportions of water absorbed by Carex cinerascens from multiple water sources were calculated. Although the new water source ratio calculation is based on the mixed linear model model, we strictly solved the equations, which improves the accuracy of the equation solutions and the accuracy of the range of the equation solutions. This soil stratification method is different from the previous research works. The new stratification method was used to explore the linear relationship characteristics established by the δ 2 H– δ 18 O relationship lines of multi-substances (Carex cinerascens stem water, rainwater, groundwater, shallow soil water and deep soil water) from top to bottom of the same stage. δ 2 H– δ 18 O relationship lines of the rainwater, shallow soil water, deep soil water and groundwater respectively were fully analysed too. Combined with sufficient meteorological data, especially soil moisture, rainfall, and temperature, the isotope composition data was thoroughly and rigorously analyzed and attempts were made to make appropriate guesses or explanations for all anomalies and trends. The main conclusions are summarized as follows:
  • The intercept of the LMWL of Poyang Lake was close to that of the LMWL of Dongting Lake which is about 300 kilometres away from Poyang Lake, and different from those surrounding areas, indicating that the large lakes indeed have the ability to regulate d-excess through secondary sources. Wouldn’t the GMWL rebuilted when large waters were excluded be different from GMWL of Craig [13]?
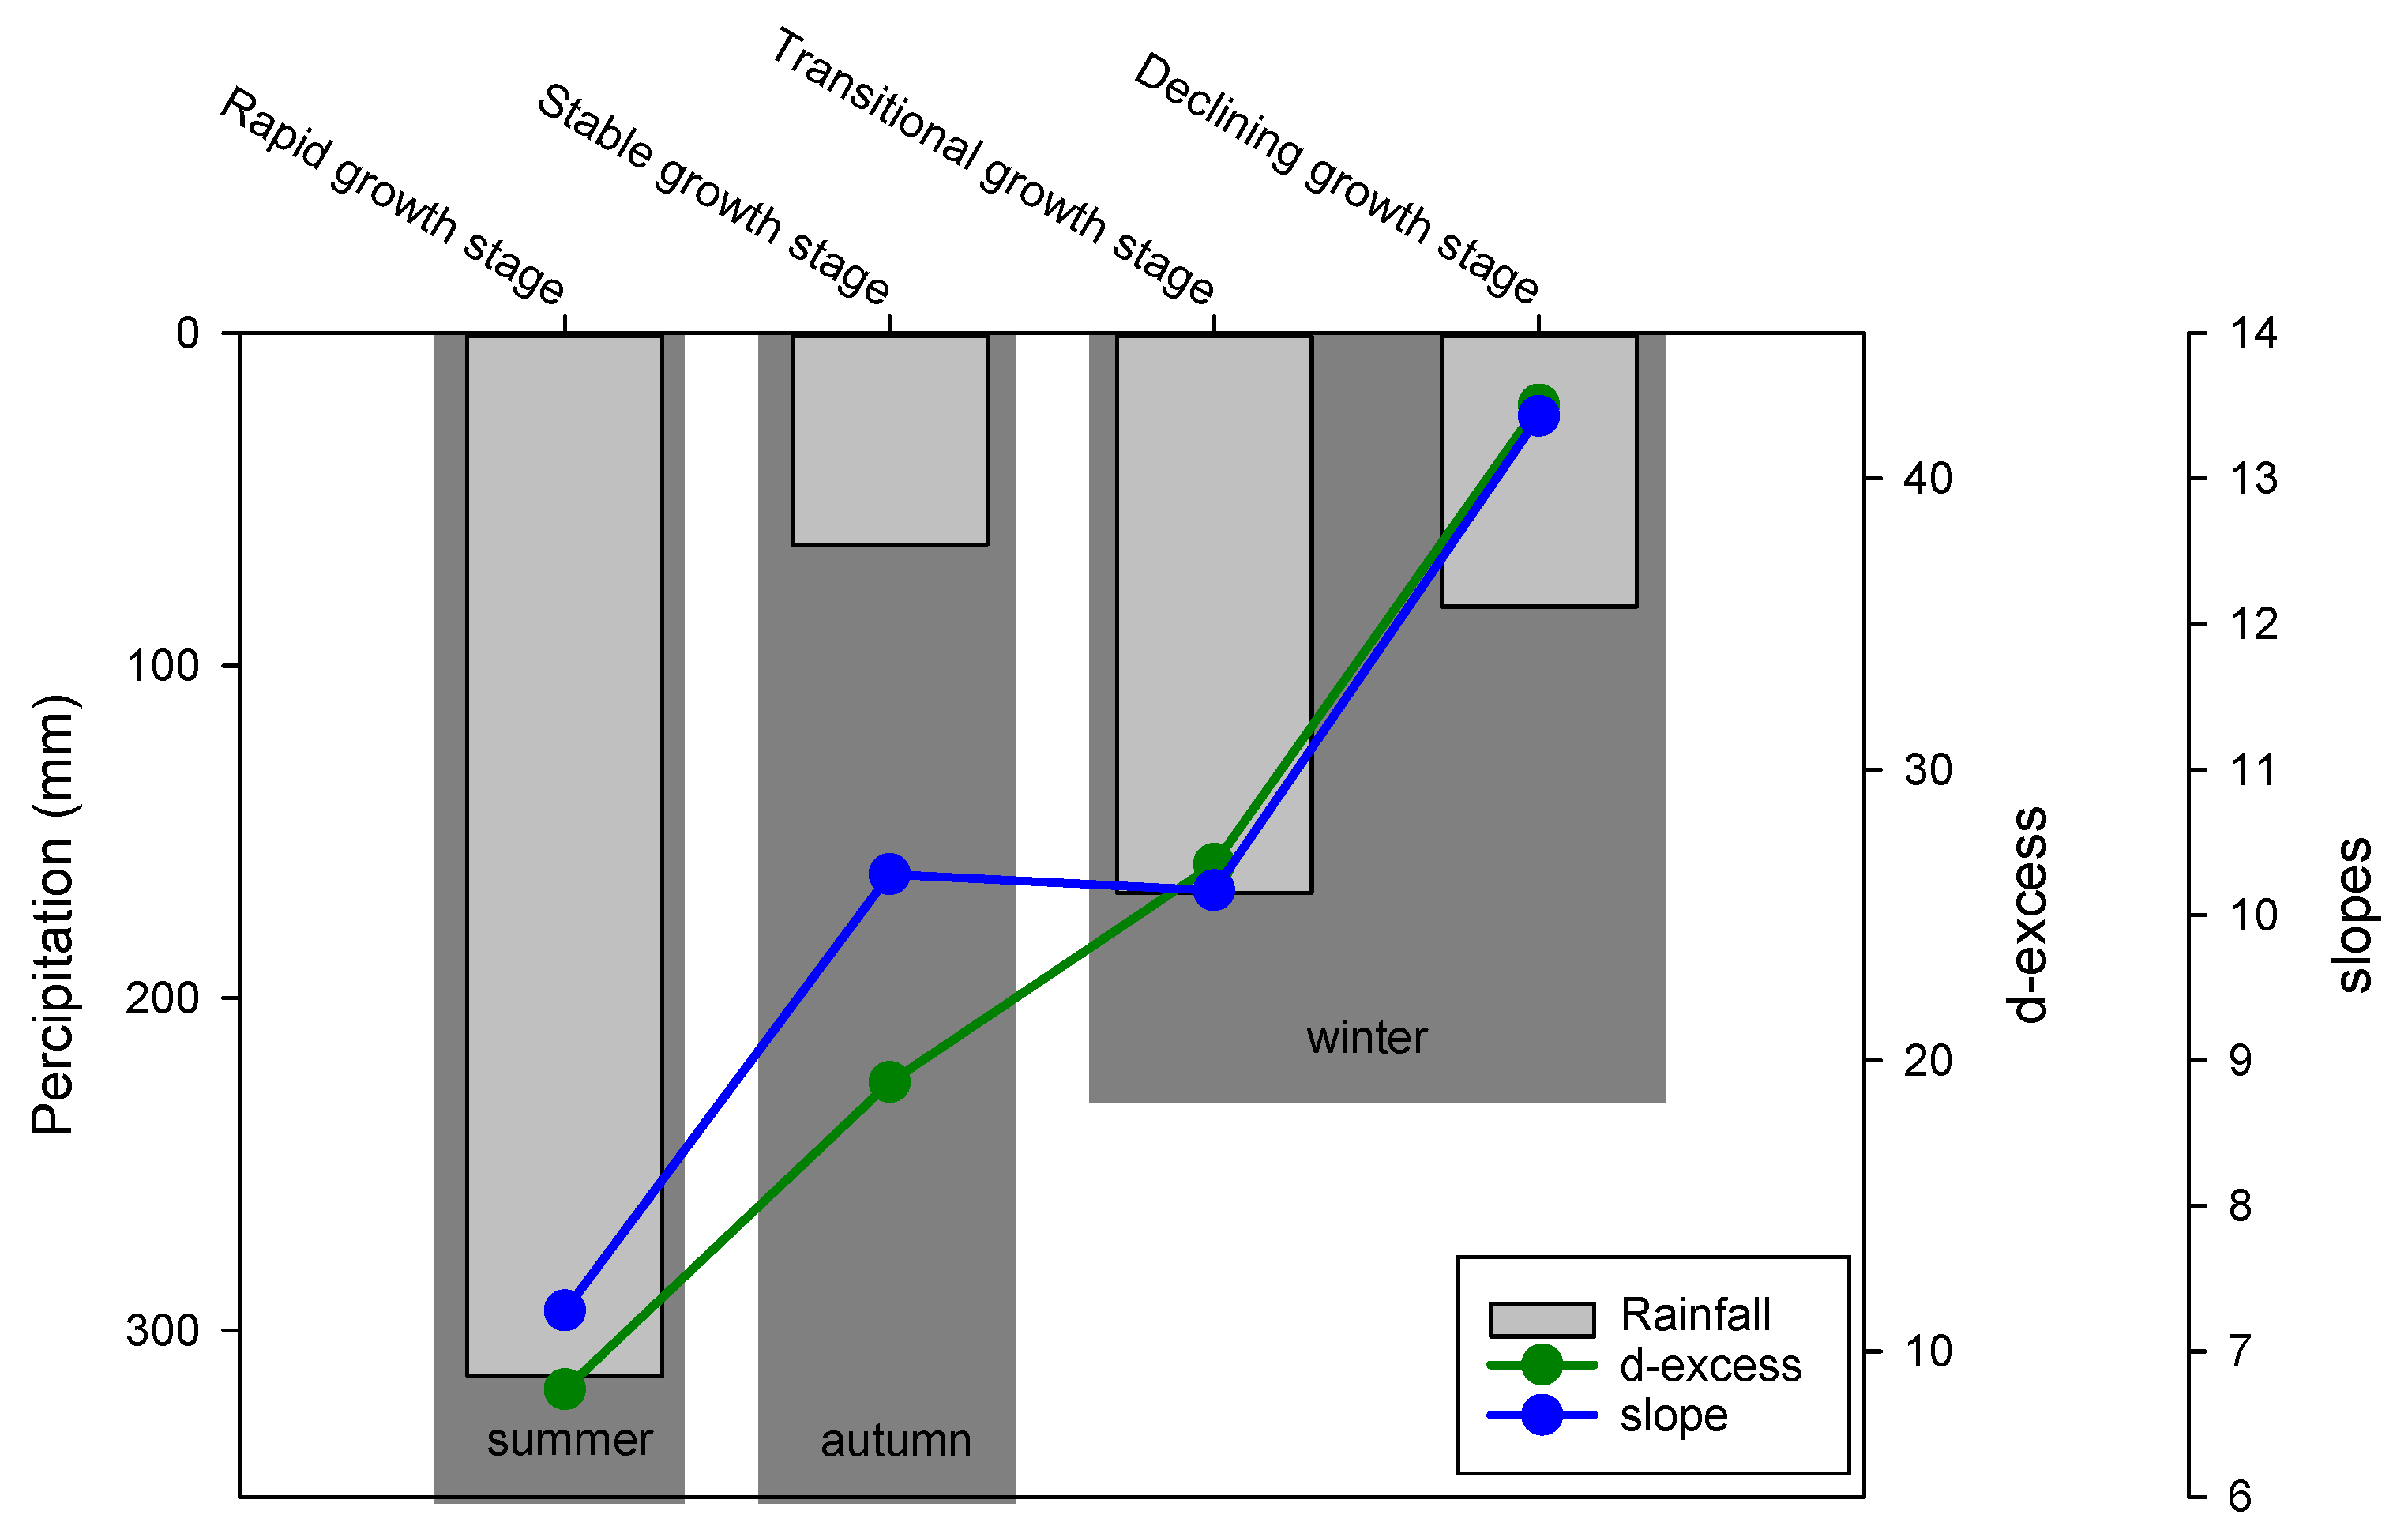
  • Although the LMWL of Poyang Lake was not established by seasons, it is impossible to know the d-excess change of the LMWL of Poyang Lake from summer to winter, but in the δ 2 H– δ 18 O relationship lines established by rainwater, plant water, shallow soil water, deep soil water, and groundwater the d-excess showed a clear and gradually increasing trend from summer to winter. Can the multi-substance δ 2 H– δ 18 O relationship lines also reflect the secondary moisture sources of large lakes or are there also micro-secondary sources in soil and groundwater?
  • By plotting the δ 2 H– δ 18 O relationship lines for rainwater, shallow soil water, deep soil water, and groundwater respectively, there is a clear trend of decreasing slope and intercept from top to bottom, which is likely to be the vertical cumulative effect of evaporation on the isotope compositions. The vertical effect of evaporation on the isotope composition has not received the attention it deserves.
  • It is common to calculate the respective water source ratios by IsoSource model, but the importance of giving an exact solution is not emphasized. Whether there is a solution (non-approximate solution) and the full range of the solution contains errors, need to be decided by the exact solution.
  • Regardless of the changes in the δ 2 H and δ 18 O values of rainwater and changes of seasons, the δ 2 H and δ 18 O values of groundwater varied very little. If we want to study the mechanism of isotope composition changes and isotope changes in the global water cycle, the stable δ 2 H and δ 18 O value of groundwater is a good intervention point.
  • Evaporation did enrich δ 2 H and δ 18 O values in the remaining shallow soil water, but the isotope fractionation accompanying the recharge of shallow soil water by deep soil water eventually resulted in depleted δ 2 H and δ 18 O values of shallow soil water. This isotope fractionation effect needs to be theoretically studied.

Author Contributions

Z.Z. and X.Z. contributed to the study conception and design. Material preparation and data collection were performed by Y.X. and G.P. Data analysis was performed by Z.Z. The first draft of the manuscript was written by Z.Z. and all authors commented on previous versions of the manuscript. All authors have read and agreed to the published version of the manuscript.

Funding

This study was supported financially by the National Natural Science Foundation of China (No. 41890823 and No. 52109005) and the National Key Research and Development Program of China (No. 2019YFC0408901).

Institutional Review Board Statement

Not applicable.

Informed Consent Statement

Not applicable.

Data Availability Statement

The first author can be contacted for data.

Conflicts of Interest

The authors declare no conflict of interest.

Appendix A. The Exact Solutions of the Equation (3) and the Table 3

Appendix A.1. Rapid Growth Stage

x = 1 756 1961 y 3019 1205 y 1706 ( 4130 57596 y ) 70975 + 417 2263 2462 ( 4130 57596 y ) 70975 + 1173 0 y 295 4114 z = 4130 57596 y 70975 l = 1205 y 1706 ( 4130 57596 y ) 70975 + 417 2263

Appendix A.2. Stable Growth Stage

x = 3455 y 3198 875 1132 y 397 ( 2656 7519 y ) 6049 + 568 2720 ( 2656 7519 y ) 6049 + 2891 2323 0 y 2656 7519 z = 2656 7519 y 6049 l = 1 875 1132 y 397 ( 2656 7519 y ) 6049 + 568

Appendix A.3. Transitional Growth Stage

Exact solutions cannot be obtained, so two algorithms are used to find approximate solutions.

Appendix A.3.1. Solution 1

Satisfy the third equation condition in the Equation (3), and then meet the first and second formulas as much as possible. Data calculated by this algorithm were used in the Table 3.

Appendix A.3.2. Solution 2

Satisfy the first equation and the second formular conditions in the Equation (3), and then meet the third formula as much as possible.
x + y + z + l 1 = 20517 1774222 x = 224918 887111 y = 1344903 1774222 z = 0 l = 0
The difference(26.38% vs. 25.35% and 73.62% vs. 75.80%) between the results of the two algorithms is very small.

Appendix A.4. Declining Growth Stage

x = 3476 y 173 119 2396 y 1063 ( 51457 99924 y ) 15607 + 1393 1603 ( 51457 99924 y ) 15607 + 2473 1080 6924 14459 y 51457 99924 z = 51457 99924 y 31214 l = 2396 y 1063 ( 51457 99924 y ) 15607 + 1393 2380

References

  1. Takahashi, K. Oxygen isotope ratios between soil water and stem water of trees in pot experiments. Ecol. Res. 1998, 13, 1–5. [Google Scholar] [CrossRef]
  2. Parnell, A.C.; Inger, R.; Bearhop, S.; Jackson, A.L. Source Partitioning Using Stable Isotopes: Coping with Too Much Variation. PLoS ONE 2010, 5, e9672. [Google Scholar] [CrossRef] [PubMed]
  3. Guerrero, A.I.; Rogers, T.L. Evaluating the performance of the Bayesian mixing tool MixSIAR with fatty acid data for quantitative estimation of diet. Sci. Rep. 2020, 10, 20780. [Google Scholar] [CrossRef] [PubMed]
  4. Chen, J.; Gao, Y.; Wang, X.; Wang, G. Seasonal Variation in Water Uptake Depth of Jujube Estimated with Stable Isotopes: Comparative Study of Drip and Basin Irrigation. J. Soil Sci. Plant Nutr. 2022, 22, 443–454. [Google Scholar] [CrossRef]
  5. Wu, Y.; Ma, Y.; Niu, Y.; Song, X.; Yu, H.; Lan, W.; Kang, X. Warming changed seasonal water uptake patterns of summer maize. Agric. Water Manag. 2021, 258, 107210. [Google Scholar] [CrossRef]
  6. Guo, H.; Zhao, Y. Using isotopic labeling to investigate root water uptake in an alley cropping system within Taklimakan Desert Oasis, China. Agrofor. Syst. 2021, 95, 907–918. [Google Scholar] [CrossRef]
  7. Wang, S.; An, J.; Zhao, X.; Gao, X.; Wu, P.; Huo, G.; Robinson, B.H. Age- and climate- related water use patterns of apple trees on China’s Loess Plateau. J. Hydrol. 2020, 582, 124462. [Google Scholar] [CrossRef]
  8. Rao, W.; Chen, X.; Meredith, K.T.; Tan, H.; Gao, M.; Liu, J. Water uptake of riparian plants in the lower Lhasa River Basin, South Tibetan Plateau using stable water isotopes. Hydrol. Process. 2020, 34, 3492–3505. [Google Scholar] [CrossRef]
  9. Pan, Y.X.; Wang, X.P.; Ya, R.H.; Zhang, F.; Zhao, Y. Variation in water source of sand-binding vegetation across a chronosequence of artificial desert revegetation in Northwest China. Sci. Cold Arid. Reg. 2020, 12, 306–316. [Google Scholar] [CrossRef]
  10. Liu, Z.; Ma, F.y.; Hu, T.x.; Zhao, K.g.; Gao, T.p.; Zhao, H.x.; Ning, T.y. Using stable isotopes to quantify water uptake from different soil layers and water use efficiency of wheat under long-term tillage and straw return practices. Agric. Water Manag. 2020, 229, 105933. [Google Scholar] [CrossRef]
  11. Li, P.; Cao, X.; Tan, H.; Wang, J.; Ren, S.; Yang, P. Studies on water uptake and heat status of cherry root under water-saving measures. Agric. Water Manag. 2020, 242, 106359. [Google Scholar] [CrossRef]
  12. Zheng, L.; Ma, J.; Sun, X.; Guo, X.; Li, Y.; Ren, R.; Cheng, Q. Effective root growth zone of apple tree under water storage pit irrigation using stable isotope methodology. Arch. Agron. Soil Sci. 2019, 65, 1521–1535. [Google Scholar] [CrossRef]
  13. Craig, H. Isotopic variations in meteoric waters. Science 1961, 133, 1702–1703. [Google Scholar] [CrossRef]
  14. Wang, H.; Jin, J.; Cui, B.; Si, B.; Ma, X.; Wen, M. Technical note: Evaporating water is different from bulk soil water in δ2H and δ18O and has implications for evaporation calculation. Hydrol. Earth Syst. Sci. 2021, 25, 5399–5413. [Google Scholar] [CrossRef]
  15. Vargas, A.I.; Schaffer, B.; Yuhong, L.; Sternberg, L.D.S.L. Testing plant use of mobile vs immobile soil water sources using stable isotope experiments. New Phytol. 2017, 215, 582–594. [Google Scholar] [CrossRef]
  16. Goldsmith, G.R.; Allen, S.T.; Braun, S.; Engbersen, N.; González-Quijano, C.R.; Kirchner, J.W.; Siegwolf, R.T.W. Spatial variation in throughfall, soil, and plant water isotopes in a temperate forest. Ecohydrology 2018, 12, e2059. [Google Scholar] [CrossRef]
  17. Yan, Y.; Zhou, X.; Liao, L.; Tian, J.; Li, Y.; Shi, Z.; Liu, F.; Ouyang, S. Hydrogeochemical Characteristic of Geothermal Water and Precursory Anomalies along the Xianshuihe Fault Zone, Southwestern China. Water 2022, 14, 550. [Google Scholar] [CrossRef]
  18. Ma, Y.; Wu, Y.; Song, X. How Elevated CO2 Shifts Root Water Uptake Pattern of Crop? Lessons from Climate Chamber Experiments and Isotopic Tracing Technique. Water 2020, 12, 3194. [Google Scholar] [CrossRef]
  19. Xia, Z.; Winnick, M.J. The competing effects of terrestrial evapotranspiration and raindrop re-evaporation on the deuterium excess of continental precipitation. Earth Planet. Sci. Lett. 2021, 572, 117120. [Google Scholar] [CrossRef]
  20. Malik, F.; Butt, S.; Mujahid, N. Variation in isotopic composition of precipitation with identification of vapor source using deuterium excess as tool. J. Radioanal. Nucl. Chem. 2022, 331, 683–690. [Google Scholar] [CrossRef]
  21. Kopec, B.G.; Feng, X.; Posmentier, E.S.; Sonder, L.J. Seasonal Deuterium Excess Variations of Precipitation at Summit, Greenland, and their Climatological Significance. J. Geophys. Res. Atmos. 2019, 124, 72–91. [Google Scholar] [CrossRef]
  22. Nakamura, T.; Nishida, K.; Kazama, F. Influence of a dual monsoon system and two sources of groundwater recharge on Kofu basin alluvial fans, Japan. Hydrol. Res. 2017, 48, 1071–1087. [Google Scholar] [CrossRef]
  23. Machavaram, M.V.; Krishnamurthy, R.V. Earth surface evaporative process: A case study from the Great Lakes region of the United States based on deuterium excess in precipitation. Geochim. Cosmochim. Acta 1995, 59, 4279–4283. [Google Scholar] [CrossRef]
  24. Hu, Y.; Xiao, W.; Wang, J.; Welp, L.R.; Xie, C.; Chu, H.; Lee, X. Quantifying the contribution of evaporation from Lake Taihu to precipitation with an isotope-based method. Isot. Environ. Health Stud. 2022, 58, 258–276. [Google Scholar] [CrossRef]
  25. Liao, F.; Wang, G.; Yi, L.; Shi, Z.; Cheng, G.; Kong, Q.; Mu, W.; Guo, L.; Cheng, K.; Dong, N.; et al. Applying radium isotopes to estimate groundwater discharge into Poyang Lake, the largest freshwater lake in China. J. Hydrol. 2020, 585, 124782. [Google Scholar] [CrossRef]
  26. Shao, M.; Gong, H.; Dai, N.; Zhi, Y.; Xu, N.; Lu, P. Study on time budgets and behavioral rhythm of wintering Siberian Cranes in a lotus pond reclamation area in Poyang Lake. Acta Ecol. Sin. 2018, 38, 5206–5212. [Google Scholar] [CrossRef]
  27. Wang, X.; Xu, L.; Xu, J.; Wu, Z. Effects of Prescribed Fire on Plant Traits and Community Characteristics of Triarrhena Lutarioriparia in Poyang Lake, China. Wetlands 2019, 39, 161–172. [Google Scholar] [CrossRef]
  28. Zhang, J.; Zhang, Y.; Zhang, L.; Liu, X.; Wang, Y.; Ji, Y. Assessing environmental and plant community changes by phytolith characteristics in sediments from Nanjishan Nature Reserve, Lake Poyang. Ecol. Inform. 2022, 69, 101586. [Google Scholar] [CrossRef]
  29. Wang, X.; Xu, J.; Wu, Z.; Shen, Y.; Cai, Y. Effect of annual prescribed burning of wetlands on soil organic carbon fractions: A 5-year study in Poyang, China. Ecol. Eng. 2019, 138, 219–226. [Google Scholar] [CrossRef]
  30. Chen, S.; Su, X.; Fang, L.; Chen, L. CarexDynamics as an Environmental Indicator in the Poyang Lake Wetland Area: Remote Sensing Mapping and GIS Analysis. Ann. GIS 2007, 13, 44–50. [Google Scholar] [CrossRef]
  31. Liu, C.Y.; Gong, X.F.; Tang, Y.P.; Chen, C.L. Lead sequestration in iron plaques developed on Phalaris arundinacea Linn. and Carex cinerascens Kukenth. from Poyang Lake (China). Aquat. Bot. 2015, 122, 54–59. [Google Scholar] [CrossRef]
  32. Zhang, L.; Yin, J.; Jiang, Y.; Wang, H. Relationship between the hydrological conditions and the distribution of vegetation communities within the Poyang Lake National Nature Reserve, China. Ecol. Inform. 2012, 11, 65–75. [Google Scholar] [CrossRef]
  33. Lei, S.; Zhang, X.-P.; Li, R.-F.; Xu, X.-H.; Fu, Q. Analysis the changes of annual for Poyang Lake wetland vegetation based on MODIS monitoring. Procedia Environ. Sci. 2011, 10, 1841–1846. [Google Scholar] [CrossRef]
  34. Running, S.W.; Nemani, R.R. Relating seasonal patterns of the AVHRR vegetation index to simulated photosynthesis and transpiration of forests in different climates. Remote Sens. Environ. 1988, 24, 347–367. [Google Scholar] [CrossRef]
  35. Ministry of Ecology and Environment of the People’s Republic of China. Soil–Determination of Dry Matter and Water Content–Gravimetric Method; Ministry of Ecology and Environment of the People’s Republic of China: Beijing, China, 2011.
  36. Zhang, X.; Xiao, Y.; Wan, H.; Deng, Z.; Pan, G.; Xia, J. Using stable hydrogen and oxygen isotopes to study water movement in soil-plant-atmosphere continuum at Poyang Lake wetland, China. Wetl. Ecol. Manag. 2017, 25, 221–234. [Google Scholar] [CrossRef]
  37. Wang, J.; Fu, B.; Lu, N.; Zhang, L. Seasonal variation in water uptake patterns of three plant species based on stable isotopes in the semi-arid Loess Plateau. Sci. Total Environ. 2017, 609, 27–37. [Google Scholar] [CrossRef]
  38. United States Environmental Protection Agency. Stable Isotope Mixing Models for Estimating Source Proportions; United States Environmental Protection Agency: Washington, DC, USA, 2022. [Google Scholar]
  39. White, J.W.C.; Cook, E.R.; Lawrence, J.R.; Wallace, S.B. The DH ratios of sap in trees: Implications for water sources and tree ring DH ratios. Geochim. Cosmochim. Acta 1985, 49, 237–246. [Google Scholar] [CrossRef]
  40. Zimmermann, U.; Ehhalt, D.; Muennich, K.O. Soil–Water Movement and Evapotranspiration: Changes in the Isotopic Composition of the Water; International Atomic Energy Agency: Viennam, Austria, 1967; pp. 567–585. [Google Scholar]
  41. Ronghui, H.; Yifang, W. The influence of ENSO on the summer climate change in China and its mechanism. Adv. Atmos. Sci. 1989, 6, 21–32. [Google Scholar] [CrossRef]
  42. Renhe, Z.; Sumi, A.; Kimoto, M. A Diagnostic Study of the Impact of El Nino on the Precipitation in China. Adv. Atmos. Sci. 1999, 16, 229–241. [Google Scholar]
  43. Zhang, X.; Yao, T. Relations Between δ D and δ18O in Precipitation at Present in the Northeast Tibetan Plateau. J. Glaciolgy Geocryol. 1996, 18, 360–365. [Google Scholar]
  44. Yang, Y.; Xiao, H.; Qin, Z.; Zou, S. Hydrogen and oxygen isotopic records in monthly scales variations of hydrological characteristics in the different landscape zones of alpine cold regions. J. Hydrol. 2013, 499, 124–131. [Google Scholar] [CrossRef]
  45. Silverman, S.R. The isotope geology of oxygen. Geochim. Cosmochim. Acta 1951, 2, 26–42. [Google Scholar] [CrossRef]
  46. Hu, Y.B.; Xiao, W.; Qian, Y.F.; Liu, Q.; Xie, C.Y.; Zhang, X.F.; Zhang, W.Q.; Wen, X.F.; Liu, S.D.; Lee, X.H. Effects of Water Vapor Source and Local Evaporation on the Stable Hydrogen and Oxygen Isotopic Compositions of Precipitation. Huan Jing Ke Xue= Huanjing Kexue 2019, 40, 573–581. [Google Scholar] [CrossRef]
  47. Wu, H.; Huang, Q.; Fu, C.; Song, F.; Liu, J.; Li, J. Stable isotope signatures of river and lake water from Poyang Lake, China: Implications for river–lake interactions. J. Hydrol. 2021, 592, 125619. [Google Scholar] [CrossRef]
  48. Zhan, L.; Chen, J.; Zhang, S.; Li, L.; Huang, D.; Wang, T. Isotopic signatures of precipitation, surface water, and groundwater interactions, Poyang Lake Basin, China. Environ. Earth Sci. 2016, 75, 1307. [Google Scholar] [CrossRef]
  49. Xu, B.; Wang, G. Surface water and groundwater contaminations and the resultant hydrochemical evolution in the Yongxiu area, west of Poyang Lake, China. Environ. Earth Sci. 2016, 75, 184. [Google Scholar] [CrossRef]
  50. Li, J.; Wu, H.W.; Zhou, Y.Q.; Zhao, Z.H.; Wang, X.L.; Cai, Y.J.; He, B.; Chen, W.; Sun, W. Variations of Stable Oxygen and Deuterium Isotopes in River and Lake Waters During Flooding Season Along the Middle and Lower Reaches of the Yangtze River Regions. Huan Jing Ke Xue= Huanjing Kexue 2020, 41, 1176–1183. [Google Scholar] [CrossRef] [PubMed]
  51. Liao, F.; Wang, G.; Shi, Z.; Cheng, G.; Kong, Q.; Mu, W.; Guo, L. Estimation of groundwater discharge and associated chemical fluxes into Poyang Lake, China: Approaches using stable isotopes (δ D and δ18O) and radon. Hydrogeol. J. 2018, 26, 1625–1638. [Google Scholar] [CrossRef]
  52. Zhang, Y.; Zhang, M.J.; Qu, D.Y.; Duan, W.G.; Wang, J.X.; Su, P.Y.; Guo, R. Water Use Strategies of Dominant Species (Caragana korshinskiiandReaumuria soongorica) in Natural Shrubs Based on Stable Isotopes in the Loess Hill, China. Water 2020, 12, 1923. [Google Scholar] [CrossRef]
  53. Jiang, C.; Yin, L.; Wen, X.; Du, C.; Wu, L.; Long, Y.; Liu, Y.; Ma, Y.; Yin, Q.; Zhou, Z.; et al. Microplastics in Sediment and Surface Water of West Dongting Lake and South Dongting Lake: Abundance, Source and Composition. Int. J. Environ. Res. Public Health 2018, 15, 2164. [Google Scholar] [CrossRef]
  54. Zhan, L.; Chen, J.; Zhang, S. Spatial and temporal characteristics of δ2H and δ18O in the basin of Dongting Lake: Impact of monsoon precipitation. J. Radioanal. Nucl. Chem. 2016, 307, 479–490. [Google Scholar] [CrossRef]
  55. Zhu, H.; Xu, L.; Jiang, J.; Fan, H. Spatiotemporal Variations of Summer Precipitation and Their Correlations with the East Asian Summer Monsoon in the Poyang Lake Basin, China. Water 2019, 11, 1705. [Google Scholar] [CrossRef]
  56. Fu, X.; Li, F.; Zhu, L.; Xie, Y.; Hu, C.; Chen, X.; Deng, Z. Change in ecological stoichiometry of Carex brevicuspis in response to seasonal dynamics and elevation in Dongting Lake, China. Nord. J. Bot. 2018, 36, e01821. [Google Scholar] [CrossRef]
  57. Zheng, L.; Wang, X.; Li, D.; Xu, G.; Guo, Y. Spatial heterogeneity of vegetation extent and the response to water level fluctuations and micro-topography in Poyang Lake, China. Ecol. Indic. 2021, 124, 107420. [Google Scholar] [CrossRef]
  58. Yu, D.; Yu, S.; He, Q.; Li, C.; Wei, C. Monitoring of Dongting Lake atrophy in the past 100 years by combining historical map and remote sensing technology. Remote Sens. Land Resour. 2016, 28, 116–122. [Google Scholar] [CrossRef]
  59. Ji, M.; Tang, J.; Gao, X.; Yang, Y.; Wu, Z. Analysis of Spatiotemporal Changes and Driving Factors of Poyang Lake Area Based on Google Earth Engine. J. China Hydrol. 2021, 41, 40–47. [Google Scholar] [CrossRef]
  60. Gat, J.R.; Bowser, C.J.; Kendall, C. The contribution of evaporation from the Great Lakes to the continental atmosphere: Estimate based on stable isotope data. Geophys. Res. Lett. 1994, 21, 557–560. [Google Scholar] [CrossRef]
  61. Guan, H.; Zhang, X.; Skrzypek, G.; Sun, Z.; Xu, X. Deuterium excess variations of rainfall events in a coastal area of South Australia and its relationship with synoptic weather systems and atmospheric moisture sources. J. Geophys. Res. Atmos. 2013, 118, 1123–1138. [Google Scholar] [CrossRef]
  62. Hu, C.; Froehlich, K.; Zhou, P.; Lou, Q.; Zeng, S.; Zhou, W. Seasonal variation of oxygen-18 in precipitation and surface water of the Poyang Lake Basin, China. Isot. Environ. Health Stud. 2013, 49, 188–196. [Google Scholar] [CrossRef]
  63. Vimeux, F.; Masson, V.; Delaygue, G.; Jouzel, J.; Petit, J.R.; Stievenard, M. A 420,000 year deuterium excess record from East Antarctica: Information on past changes in the origin of precipitation at Vostok. J. Geophys. Res. Atmos. 2001, 106, 31863–31873. [Google Scholar] [CrossRef]
  64. Ren, W.; Tian, L.; Shao, L. Regional moisture sources and Indian summer monsoon (ISM) moisture transport from simultaneous monitoring of precipitation isotopes on the southeastern and northeastern Tibetan Plateau. J. Hydrol. 2021, 601, 126836. [Google Scholar] [CrossRef]
  65. Chen, F.; Zhang, M.; Argiriou, A.A.; Wang, S.; Ma, Q.; Zhou, X.; Wu, X.; Chen, J. Modeling Insights into Precipitation Deuterium Excess as an Indicator of Raindrop Evaporation in Lanzhou, China. Water 2021, 13, 193. [Google Scholar] [CrossRef]
  66. Kavanaugh, J.L.; Cuffey, K.M. Generalized view of source-region effects on δD and deuterium excess of ice-sheet precipitation. Ann. Glaciol. 2002, 35, 111–117. [Google Scholar] [CrossRef]
  67. Zhao, L.; Wang, L.; Liu, X.; Xiao, H.; Ruan, Y.; Zhou, M. The patterns and implications of diurnal variations in the d-excess of plant water, shallow soil water and air moisture. Hydrol. Earth Syst. Sci. 2014, 18, 4129–4151. [Google Scholar] [CrossRef]
  68. Dogramaci, S.; Skrzypek, G.; Dodson, W.; Grierson, P.F. Stable isotope and hydrochemical evolution of groundwater in the semi-arid Hamersley Basin of subtropical northwest Australia. J. Hydrol. 2012, 475, 281–293. [Google Scholar] [CrossRef]
  69. Gammons, C.H.; Poulson, S.R.; Pellicori, D.A.; Reed, P.J.; Roesler, A.J.; Petrescu, E.M. The hydrogen and oxygen isotopic composition of precipitation, evaporated mine water, and river water in Montana, USA. J. Hydrol. 2006, 328, 319–330. [Google Scholar] [CrossRef]
  70. Benettin, P.; Volkmann, T.H.M.; Von Freyberg, J.; Frentress, J.; Penna, D.; Dawson, T.E.; Kirchner, J.W. Effects of climatic seasonality on the isotopic composition of evaporating soil waters. Hydrol. Earth Syst. Sci. 2018, 22, 2881–2890. [Google Scholar] [CrossRef]
  71. Bershaw, J. Controls on Deuterium Excess across Asia. Geosciences 2018, 8, 257. [Google Scholar] [CrossRef]
  72. Benetti, M.; Reverdin, G.; Pierre, C.; Merlivat, L.; Risi, C.; Steen-Larsen, H.C.; Vimeux, F. Deuterium excess in marine water vapor: Dependency on relative humidity and surface wind speed during evaporation. J. Geophys. Res. Atmos. 2014, 119, 584–593. [Google Scholar] [CrossRef]
  73. Dansgaard, W. Stable isotopes in precipitation. Tellus 1964, 16, 436–468. [Google Scholar] [CrossRef]
  74. Phillips, D.L.; Gregg, J.W. Source partitioning using stable isotopes: Coping with too many sources. Oecologia 2003, 136, 261–269. [Google Scholar] [CrossRef] [PubMed]
  75. Zhang, C.; Zhang, J.; Zhao, B.; Zhu, A.; Zhang, H.; Huang, P.; Li, X. Coupling a two-tip linear mixing model with a δD–δ18O plot to determine water sources consumed by maize during different growth stages. Field Crop. Res. 2011, 123, 196–205. [Google Scholar] [CrossRef]
  76. Dawson, T.E.; Pate, J.S. Seasonal water uptake and movement in root systems of Australian phraeatophytic plants of dimorphic root morphology: A stable isotope investigation. Oecologia 1996, 107, 13–20. [Google Scholar] [CrossRef] [PubMed]
  77. Zencich, S.J.; Froend, R.H.; Turner, J.V.; Gailitis, V. Influence of groundwater depth on the seasonal sources of water accessed by Banksia tree species on a shallow, sandy coastal aquifer. Oecologia 2002, 131, 8–19. [Google Scholar] [CrossRef]
  78. Bchir, A.; Escalona, J.M.; Gallé, A.; Hernández-Montes, E.; Tortosa, I.; Braham, M.; Medrano, H. Carbon isotope discrimination (δ13C) as an indicator of vine water status and water use efficiency (WUE): Looking for the most representative sample and sampling time. Agric. Water Manag. 2016, 167, 11–20. [Google Scholar] [CrossRef]
  79. Phillips, D.L.; Newsome, S.D.; Gregg, J.W. Combining sources in stable isotope mixing models: Alternative methods. Oecologia 2005, 144, 520–527. [Google Scholar] [CrossRef]
  80. Cramer, V.A.; Thorburn, P.J.; Fraser, G.W. Transpiration and groundwater uptake from farm forest plots of Casuarina glauca and Eucalyptus camaldulensis in saline areas of southeast Queensland, Australia. Agric. Water Manag. 1999, 39, 187–204. [Google Scholar] [CrossRef]
  81. Sprenger, M.; Stumpp, C.; Weiler, M.; Aeschbach, W.; Allen, S.T.; Benettin, P.; Dubbert, M.; Hartmann, A.; Hrachowitz, M.; Kirchner, J.W.; et al. The Demographics of Water: A Review of Water Ages in the Critical Zone. Rev. Geophys. 2019, 57, 800–834. [Google Scholar] [CrossRef]
  82. Renée Brooks, J.; Barnard, H.R.; Coulombe, R.; McDonnell, J.J. Ecohydrologic separation of water between trees and streams in a Mediterranean climate. Nat. Geosci. 2010, 3, 100–104. [Google Scholar] [CrossRef]
  83. Horton, J.H.; Hawkins, R.H. Flow path of rain from the soil surface to the water table. Soil Sci. 1965, 100, 377–383. [Google Scholar] [CrossRef]
Figure 1. Geographic locations of sampling points. The red rectangle in the (a) part represents the (b) part area. S1 to S6 represent sampling point 1 to sampling point 6. Because the map resolution is too low, so we extended the distance from every sample point and the actual distances are smaller than those on the map (c) part. They are closer to the middle of the 6 points.
Water 14 02594 g001
Figure 2. Relationships among months, vegetation area, and monthly water levels. The vegetation area [33] is assumed to be proportional to the vegetation transpiration rate [34]. The monthly water levels are calculated by 61 years of data from 1953 to 2013.
Water 14 02594 g002
Figure 3. Variation characteristics of soil moisture and depth with different stages.
Water 14 02594 g003
Figure 4. Hydrological and climatic characteristics. The air humidity data was from the weather station (XiuShui Station) closest to the sample points, so there would be some differences with the humidity data of sample points, but their trends should be consistent.
Water 14 02594 g004
Figure 5. Isotope compositions of rainwater, shallow soil water, deep soil water, and Carex cinerascens stem water. Isotope compositions were calculated from the isotope composition from sampling sites. The lower part (b or B) of the figure is the same as the shaded part (B) of the upper part (a or A) of the figure. In the legend, each line is fitted by the points above it. In every stage, the points include the shallow soil water, the deep soil water, the groundwater, Carex cinerascens and rainwater. In rainwater, the points include isotope compositions of rainwater of all stages.
Water 14 02594 g005
Figure 6. Rainfall vs. d-excess and slopes from the Figure 5.
Water 14 02594 g006
Figure 7. In the legend, each line is fitted by the points above it. Each point plotted is an average of several data in the same stage and each line is fitted through four stages about one sort of material.
Water 14 02594 g007
Figure 8. The symbols in the figure represent arithmetic means. During different stages, from rainwater to shallow soil water, then to deep soil water, and then to groundwater, δ 2 H and δ 18 O monotonically increasing or decreasing, except the points inside ovals, which is the evidence of the isotopes fractionation existing when water moves from bottom to top in soil. (See the Table 3 for detailed data). The arrows represent the direction of isotope composition change, which were generally unidirectional for the same stage.
Water 14 02594 g008
Table 1. Water–levels in the river and the lake and groundwater tables of the sample sites in different growth stages.
SitesGroudwater LevelLand Surface Elevation
Rapid Growth StageStable Growth StageTransitional Growth StageDeclining Growth Stage
the Lake14.2211.8613.7012.45
the Xiu River11.6812.0710.378.99
115.5514.6715.2915.1315.85
215.4714.3215.3815.2915.70
315.3514.5915.2715.2415.41
414.8314.0614.6714.7214.86
514.2013.4014.0913.9514.35
613.8913.1013.7413.6013.89
Note: Based on the Wusong Base Level of China. In the Lake and the Xiu River rows, the values are the monthly average values of Poyang Lake and those of the Xiu River. Their relative locations can be seen in Figure 1c. The numbers 1, 2, 3, 4, 5 and 6 represent six sample sites. The units in the table are meters.
Table 2. Isotope compositions of water sources at different growth stages.
Isotope Compositions (‰)WaterRapid Growth StageStable Growth StageTransitional Growth StageDeclining Growth Stage
δ 2 HRainwater−7.56−23.23−101.81−10.80
Shallow soil water−19.61−34.55−47.62−34.76
Deep soil water−24.62−27.20−36.42−32.06
Groundwater−30.19−31.98−32.51−34.60
Carex cinerascens−11.73−28.91−61.91−24.73
δ 18 ORainwater−2.20−4.32−12.48−4.00
Shallow soil water−4.02−4.99−7.58−5.94
Deep soil water−4.73−4.36−6.11−5.48
Groundwater−5.14−5.17−5.63−5.51
Carex cinerascens−2.76−4.72−8.91−5.10
Table 3. Proportions of potential water sources of Carex cinerascens stem water.
StagesSourcesAverage δ 2 H (‰)Average δ 18 O (‰)ProportionsPrecipitations (mm)Average Groundwater Depths of Sample Sites (m)
Rapid growth stageRainwater−7.56−2.2078.22∼80.14%312.00.13
Shallow soil water−19.61−4.020.00∼7.17%
Deep soil water−24.62−4.730.00∼5.82%
Groundwater−30.19−5.1414.04∼14.61%
Carex cinerascens−11.73−2.76
Stable growth stageRainwater−23.23−4.3211.1∼45.46%62.80.99
Shallow soil water−34.55−4.990.00∼35.32%
Deep soil water−27.20−4.360.00∼43.91%
Groundwater−31.98−5.1719.22∼44.99%
Carex cinerascens−28.91−4.72
Rapid growth stageRainwater−101.81−12.4826.38%167.20.27
Shallow soil water−47.62−7.5873.62%
Deep soil water−36.42−6.110.00%
Groundwater−32.51−5.630.00%
Carex cinerascens−61.91−8.91
Rapid growth stageRainwater−10.80−4.0040.56∼41.82%81.40.36
Shallow soil water−34.76−5.9447.89∼51.50%
Deep soil water−32.06−5.480.00∼11.55%
Groundwater−34.60−5.510.00∼6.69%
Carex cinerascens−24.73−5.10
Note: The exact values of the calculations are listed in the Appendix A.
Publisher’s Note: MDPI stays neutral with regard to jurisdictional claims in published maps and institutional affiliations.

