Article

Seasonal Total Nitrogen and Phosphorus Variation, Speciation, and Composition in the Maowei Sea Affected by Riverine Flux Input, South China Sea

1
Marine Environmental Monitoring Center of Guangxi, Beihai 536000, China
2
College of Chemistry and Environmental Science, Guangdong Ocean University, Zhanjiang 524088, China
*
Author to whom correspondence should be addressed.
Water 2022, 14(16), 2584; https://doi.org/10.3390/w14162584
Submission received: 7 June 2022 / Revised: 12 August 2022 / Accepted: 17 August 2022 / Published: 22 August 2022
(This article belongs to the Section Water Quality and Contamination)

Abstract

:
Human activities have altered global nutrient cycling and have significantly changed marine systems. This is evidenced by the significant changes in nitrogen and phosphorus availability. The Maowei Sea (MWS) is the largest oyster culture bay in southwest China. From August 2018 to May 2019, the spatial and temporal nutrient concentrations and fluxes in MWS using system-wide scale seasonal data were assessed from river estuaries and adjacent coastal waters. The annual average concentrations of total nitrogen (TN) and total phosphorus (TP) in the three estuaries of Maolingjiang River (MLJR), Dalanjiang River (DLJR) and Qinjiang River (QJR) were 3.00 mg/L and 0.183 mg/L, respectively. Therein, the highest TN and TP concentrations were in DLJR, the lowest TN concentration was in MLJR, and the lowest TP concentration was in QJR. DIN and DIP were the main forms of TN and TP, accounting for 80.9% and 59.4%, respectively. The main form of DIN in MLJR and QJR was NO3, accounting for 86.8% and 84.4%, respectively, while the main form of DIN in DLJR was NH4+, accounting for 55.9%. The annual flux of pollutants discharged into MWS from the three estuaries is 10,409.52 t for TN and 556.21 t for TP. The month with the largest contribution to the annual load was July, accounting for 29.2% and 24.2% of TN and TP, respectively, and the fluxes of TN and TP were significantly different among the three seasons (p < 0.05). The annual average concentrations in the surface waters of the MWS were 1.07 mg/L for TN and 0.129 mg/L for TP, and there were significant differences (p < 0.05) in the concentrations of TN and TP among the three seasons. The annual average N/P ratios of the river water and seawater were 43 and 18, respectively, which were higher than the Redfield ratio (N/P = 16), indicating that the growth of phytoplankton in MWS may be limited by phosphorus. Eutrophication owing to nutrient pollution in the three estuaries may be persistent in adjacent coastal waters, and land–ocean integrated mitigation measures should be taken to effectively improve the water quality in the river estuary and coastal water.

1. Introduction

Pollutants and nutrients in the ocean come primarily from land-based (e.g., riverine inputs), anthropogenic (e.g., wastewater discharge) and natural sources (e.g., soil minerals, plants and animals). Many studies have shown that globally, nearly 70–80% of nitrogen (N) and phosphorus (P) are imported into coastal waters from terrestrial sources via rivers [1,2,3]; rivers play an important role in this land–sea linkage [4]. The estuary–ocean interface was the area with the highest land–sea interaction and productivity, and the interaction processes of its hydrodynamic environment, biogeochemical processes [5] and human activities [6] were very complex [7,8,9]. With the rapid development of the economy and society and the intensification of human activities in the past decades, the environmental pollution of the global estuarine coastal zone has become more and more prominent, and the eutrophication of near-shore waters due to the inflow of large amounts of nutrients has gradually become an important issue of global concern [10,11,12,13].
As an important source of phytoplankton growth, the increase in nitrogen and phosphorus will cause eutrophication and harmful red tide outbreaks in near-shore waters and consequently damage coastal ecosystems [14,15,16]. At the same time, nitrogen and phosphorus content and composition had important effects on the primary productivity and population structure of phytoplankton [17,18,19,20]. According to the existence form in seawater, nitrogen (TN) in natural seawater could be divided into dissolved state (TDN) and particulate state (PN), among which TDN could be divided into dissolved inorganic nitrogen (DIN) and dissolved organic nitrogen (DON), and DIN exists in seawater in three forms: ammonium (NH4+), nitrite (NO2) and nitrate (NO3). Different forms of nitrogen enter the ocean and underwent complex biogeochemical processes and transform each other [20,21,22]; these transformations between different forms could have an impact on the eutrophication status of water bodies [23,24]. TDP in seawater was also divided into dissolved organic phosphorus (DOP) and dissolved inorganic phosphorus (DIP) [25,26]. The growth of phytoplankton in many marine areas was usually limited by the DIP levels in that area [27,28]. Land-based inputs were an important source of nitrogen and phosphorus pollution in seawater and an important cause of water quality degradation in near-shore waters. An objective understanding of the concentration, composition and fluxes of pollutants from land-based sources into the sea is important to reveal the composition of nitrogen and phosphorus pollutants and to effectively improve the water quality in coastal water [25,26,29].
The Maowei Sea (MWS) is a typical subtropical bay, mainly fed by three rivers, Maolingjiang River (MLJR), Dalanjiang River (DLJR) and Qinjiang River (QJR), and connected to the Beibu Gulf through the Qinzhou Bay, forming a unique complex estuarine bay ecosystem with rich aquatic resources and a suitable environment for oyster farming [30,31]. In recent years, due to rapid industrialization, urbanization and strong mariculture activities in the basin, a large amount of land-based pollutants have entered MWS through rivers and sewage treatment plants, resulting in the frequent occurrence of harmful algal blooms in MWS [32,33]. Previous studies have shown that total N (TN) and total P (TP) pools are dominated by DON (DON/TN = 35–72%) and DOP (DOP/TP = 27–51%), respectively, in MWS [34,35]. On a global scale, few studies have also shown that DON and DOP are among the potential eutrophication-causing nutrients [36,37]. It indicated that with the rapid economic development and human influence in recent years, a large amount of sewage discharge had brought a large amount of nitrogen and phosphorus pollutants to the MWS, which may lead to the deterioration of water quality, imbalance of nitrogen and phosphorus ratio and change in TN and TP structure in the MWS. However, detailed information on the biogeochemistry of N and P in MWS surface waters, the transformation behavior between different forms and their spatial distribution in relation to physicochemical parameters and associated dissolved nutrients in surface waters is lacking. Therefore, considering the importance of MWS and its environmental functions for mariculture and fishery resources, a systematic study of the biogeochemical behavior of all N and P in MWS is needed to better understand the compositional analysis of total N (PN, DON and DIN (NH4+, NO2 and NO3) and total P (PP, DOP and DIP) in estuaries and bays. This is important for understanding the relationships between nutrients and their variation patterns in typical estuaries and bays, and for achieving integrated land–sea environmental monitoring and assessment.
Therefore, in order to address the aforementioned gaps in our understanding of the riverine and coastal systems, the MWS and its surrounding rivers were selected for this study; eight stations were explored in MWS, and 1 station was deployed in the inlets of MLJR, DLJR and QJR (a total of 11 monitoring stations), and sampling and monitoring were carried out in August 2018, October 2018 and May 2019, respectively. We explored the concentration in estuaries of three major rivers, and the coastal water quality response in MWS in order to (1) assess the spatial nutrient contamination in the river estuaries of MWS, (2) quantify the seasonal nutrient fluxes of three rivers discharged into coastal waters, (3) identify the spatiotemporal distribution of TN and TP concentrations in coastal water adjacent to MWS and (4) clarify the seasonal variation in N/P in the coastal rivers inputs for MWS and the seawater response. This study provided a comprehensive dataset on the river fluxes of major nutrients into the coastal water and the water quality response, which was beneficial for nutrient load reduction in MWS within the Chinese total pollutant load control system and also provides baseline information for coastal water quality protection in MWS.

2. Materials and Methods
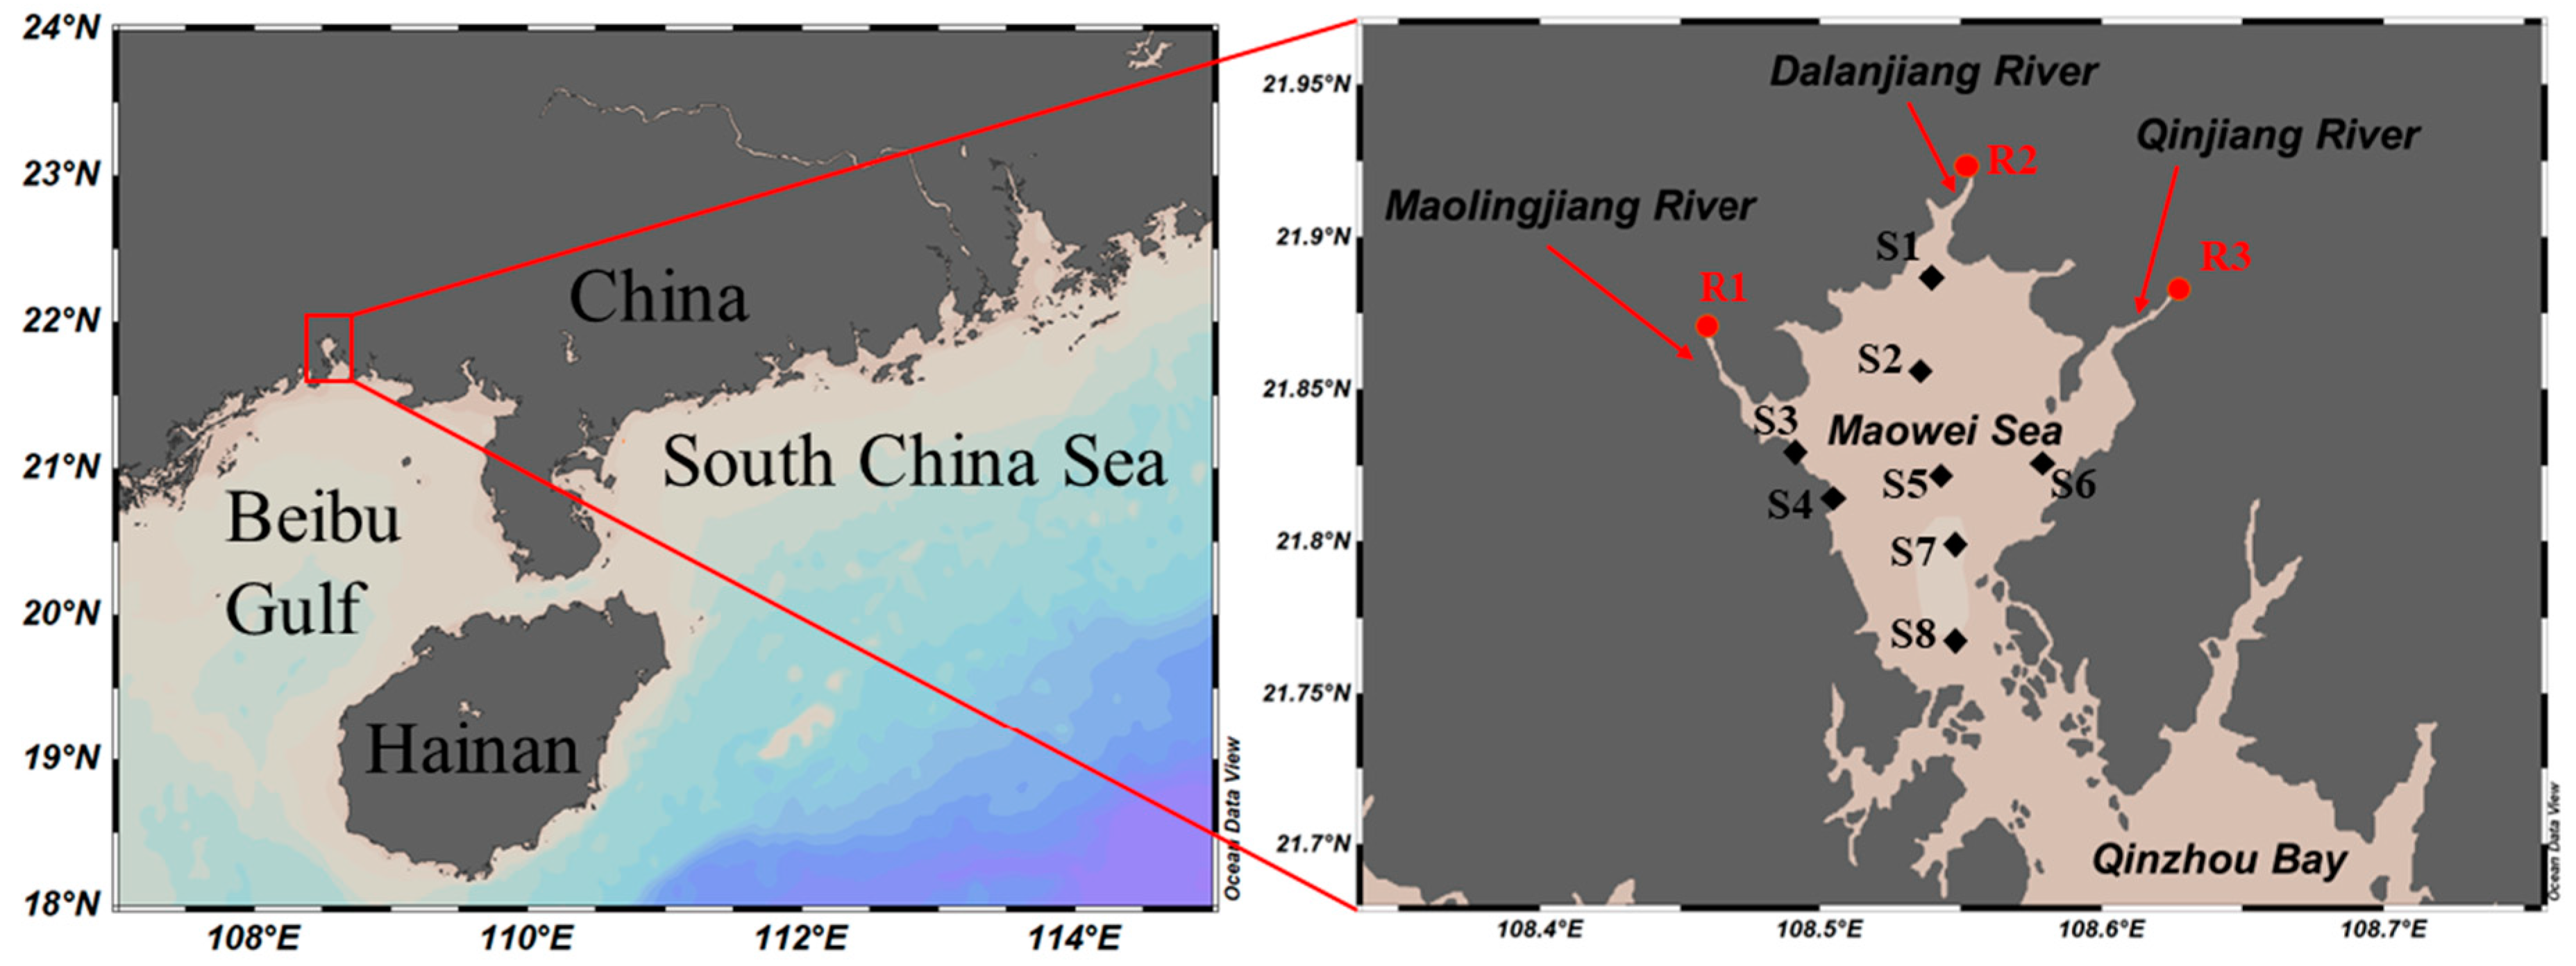
2.1. Study Area

The MWS is a semi-enclosed bay in the northern part of the Beibu Gulf, located in the northwestern part of the South China Sea (21.55°–21.95° N, 108.4°–108.75° E) and is connected to Qinzhou Bay through a narrow channel [38,39] (Figure 1). The bay has a surface area of about 135 km2 and is relatively shallow, with an average depth of about 5.4 m. [40]. The regional climate is controlled by the tropical marine monsoon, with annual air temperatures ranging from 0.8 to 37.4 °C, with an average of 22.1 °C. The average annual rainfall is 2140 mm, of which 80–85% falls during the rainy season (from May to September) [41,42]. The average tidal range along the coast is ~2.5 m, with a maximum tidal elevation of 5.5 m [42,43]. Three main rivers, MLJR, DLJR and QJR, feed into the MWS, with MLJR and QJR being the two largest rivers in the MWS, located on the west and east sides, respectively, with annual freshwater discharges of 2.59× and 2.03 × 10⁹ m3 y−1, respectively. The DLJR is a tributary of the QJR after the bifurcation, and the flow in the DLJR after the bifurcation is less than 30% of the main river section; it has a length of 21.33 km and a catchment area of only 62.3 km2, with a low freshwater discharge. Approximately 8.6 × 10⁴ t y−1 of suspended sediment is co-transported from these rivers to the MWS. Water flows from Qinzhou Bay into the MWS from the eastern coastal area and out of the MWS from the west. [44]. The narrow channel connecting the MWS and Qinzhou Bay limits the exchange between these two water bodies to some extent [45]. Land use in the catchment is dominated by urban settlements and shrimp ponds in the north. The eastern catchment is also dominated by shrimp ponds, including agricultural activities and mangroves, while the western area is dominated by factories and farms. The MWS has abundant natural mangrove resources of approximately 2784 hm2. As of 2016, the population within 1–15 km of the area where the MWS is located was approximately 450,000, accounting for 10% of the total population of Qinzhou City, Guangxi Province, China. [46]. The MWS is the largest natural oyster nursery and mariculture bay, and the region has gradually developed into an important area for economic development with increasing impacts from human activities [40].

2.2. Sampling and Analytical Methods

The survey data in this paper were sampled and monitored by the Marine Environment Monitoring Center Station of Guangxi Zhuang Autonomous Region during the dry (May 2019), wet (August 2018) and normal (October 2018) water flow seasons. Estuarine and coastal water quality monitoring is shown in Figure 1. DIN and DIP seawater samples were first filtered with a 0.45 μm acetate membrane (Jinjing, Shanghai Xingya Purification Material Factory) and stored refrigerated at −20 °C. In accordance with the methods specified in the Marine Survey Code of the State Administration of Quality and Technical Supervision [47], TN, TDN, TP and TDP were determined by potassium persulfate oxidation, NH4+ and Phosphate (PO43−) were determined by hypobromide oxidation and phosphorus–molybdenum blue spectrophotometry, respectively, and NO3 and NO2 were determined by flow injection colorimetric method in the Offshore Waters Environmental Monitoring Code [48]. The DIN is the sum of NH4+, NO2 and NO3, and the DIP is PO43−. Environmental parameters such as chemical oxygen demand (COD), total suspended particles (TSP), dissolved oxygen (DO), water temperature, pH and salinity (S) are determined in accordance with the methods of the Marine Survey Code of the State Administration of Quality and Technical Supervision [47].

2.3. Riverine Flows and Fluxes of TN and TP

The nutrient flux transported from the estuary to the coastal waters was quantified by the nutrient concentration entering the sea and the flow of the river, and the annual nutrients flux entering the sea was calculated using the following formula:
F R = C R × Q R
where FR is the flux of various forms of nitrogen and phosphorus in the estuary and sewage outlet, the unit is g, CR is the concentration of various forms of nitrogen and phosphorus pollutants in the estuary and sewage outlet, the unit is g/m3, QR is the flow of the river estuary and the sewage outlet, the unit is m3.

2.4. Statistical Analyses

The map of the MWS monitoring station used Ocean Data View (4.0) software (Alfred-Wegener-Institut (AWI), Bremerhaven, Germany). The spatial distribution of TN and TP concentrations and eutrophication indexes was plotted using Ocean Data View (4.0) software, and the Origin 2021 software (OriginLab, Northampton, MA, USA) was used to draw nitrogen and phosphorus pollutant concentration composition, sea flux map and N/P map. Data processing used Excel software and saliency level analysis through SPSS software. One-way ANOVA was used to analyze the significance of differences in TN and TP fluxes in the estuarine area in different months and the significance of differences in TN and TP concentrations in the Maowei Sea in different seasons.

3. Results

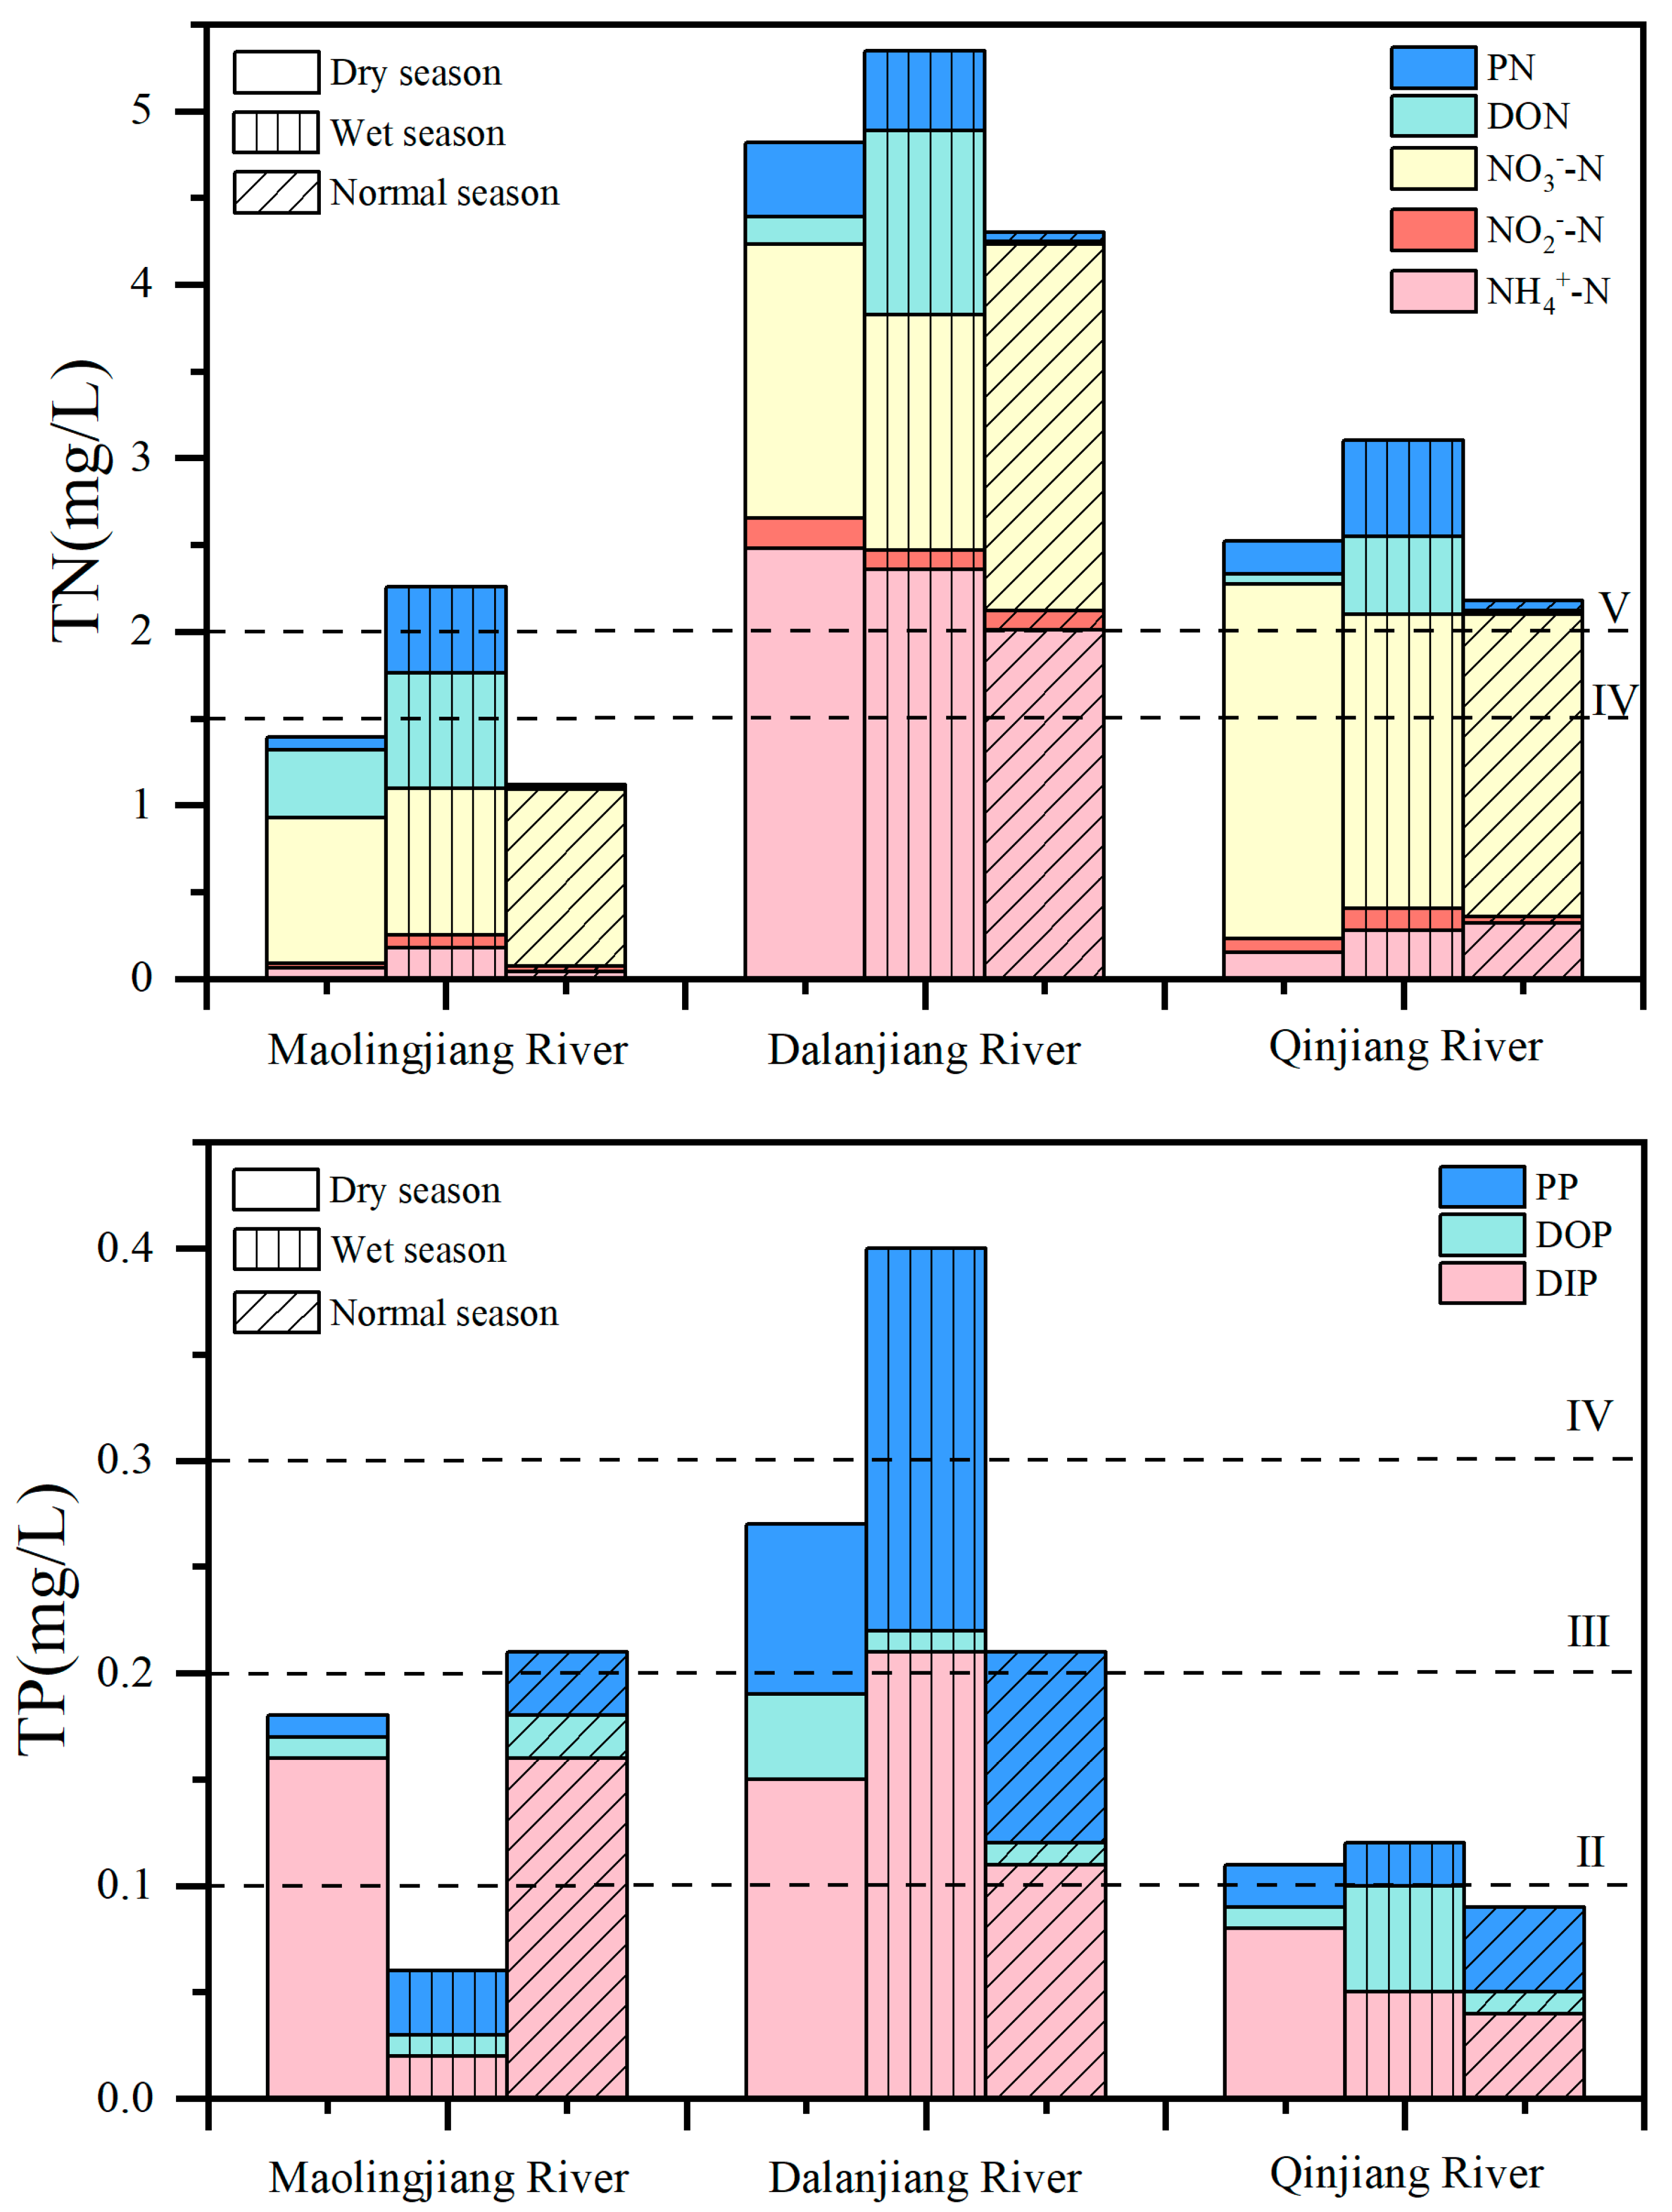
3.1. Concentration and Composition of TN and TP in Estuaries of the Maowei Sea

The results showed that the average TN concentration was 3.00 mg/L (Figure 2). The range was 1.12–3.35 mg/L; the highest was DLJR, and the lowest was MLJL, of which the TN concentration was the highest in the wet season of DLJR, which was 5.35 mg/L, and the lowest TN concentration in the normal season of MLJL was 1.12 mg/L. According to the Environmental Quality Standards for Surface Water in China [49], the water quality of MLJR in the wet season and the three seasons of DLJR and QJR was inferior to standard V (TN < 2 mg/L), the water quality in the wet season and normal season of MLJR was between standards III (TN < 1 mg/L) and IV (TN < 1.5 mg/L). The concentration levels of DIN and DON ranged from 0.93 to 4.23 mg/L and 0.01 to 1.06 mg/L, respectively, and DIN accounted for an average of 80.9% of TN, which was the main form of land-source TN. Among them, the main forms of DIN of MLJR and QJR were NO3, accounting for an average of 86.8% and 84.4% of DIN of MLJL and QJR, respectively, while the main form of DIN of DLJR was NH4+, accounting for an average of 55.9% of its DIN. The average concentration of TP was 0.183 mg/L, ranging from 0.060 to 0.400 mg/L; the highest was DLJR, and the lowest was QJR, of which the TP concentration was the highest in the wet season of DLJR, which was 0.400 mg/L, and the lowest concentration of TP in the wet season of MLJL was 0.060 mg/L. The water quality of MLJR in the wet season and QJR in the normal season was better than standard II (TP < 0.1 mg/L), the water quality in the dry season of MLJR and the dry season and the wet season of QJR was between standards II and III (TP < 0.2 mg/L), the water quality of MLJL in the normal season and the dry season and the normal season of DLJR was between standards III and IV (TP < 0.3 mg/L), only the water quality in the wet season of DLJR was inferior to standard IV. In the land-source TP, the average concentration of PP was 0.056 mg/L, accounting for 30.3%. The average concentration of DOP was 0.019 mg/L, accounting for 10.3%. The average concentration of DIP was 0.109 mg/L, accounting for 59.4%, which was the main form of TP. In addition, the TN and TP concentrations of DLJR were higher in all seasons.

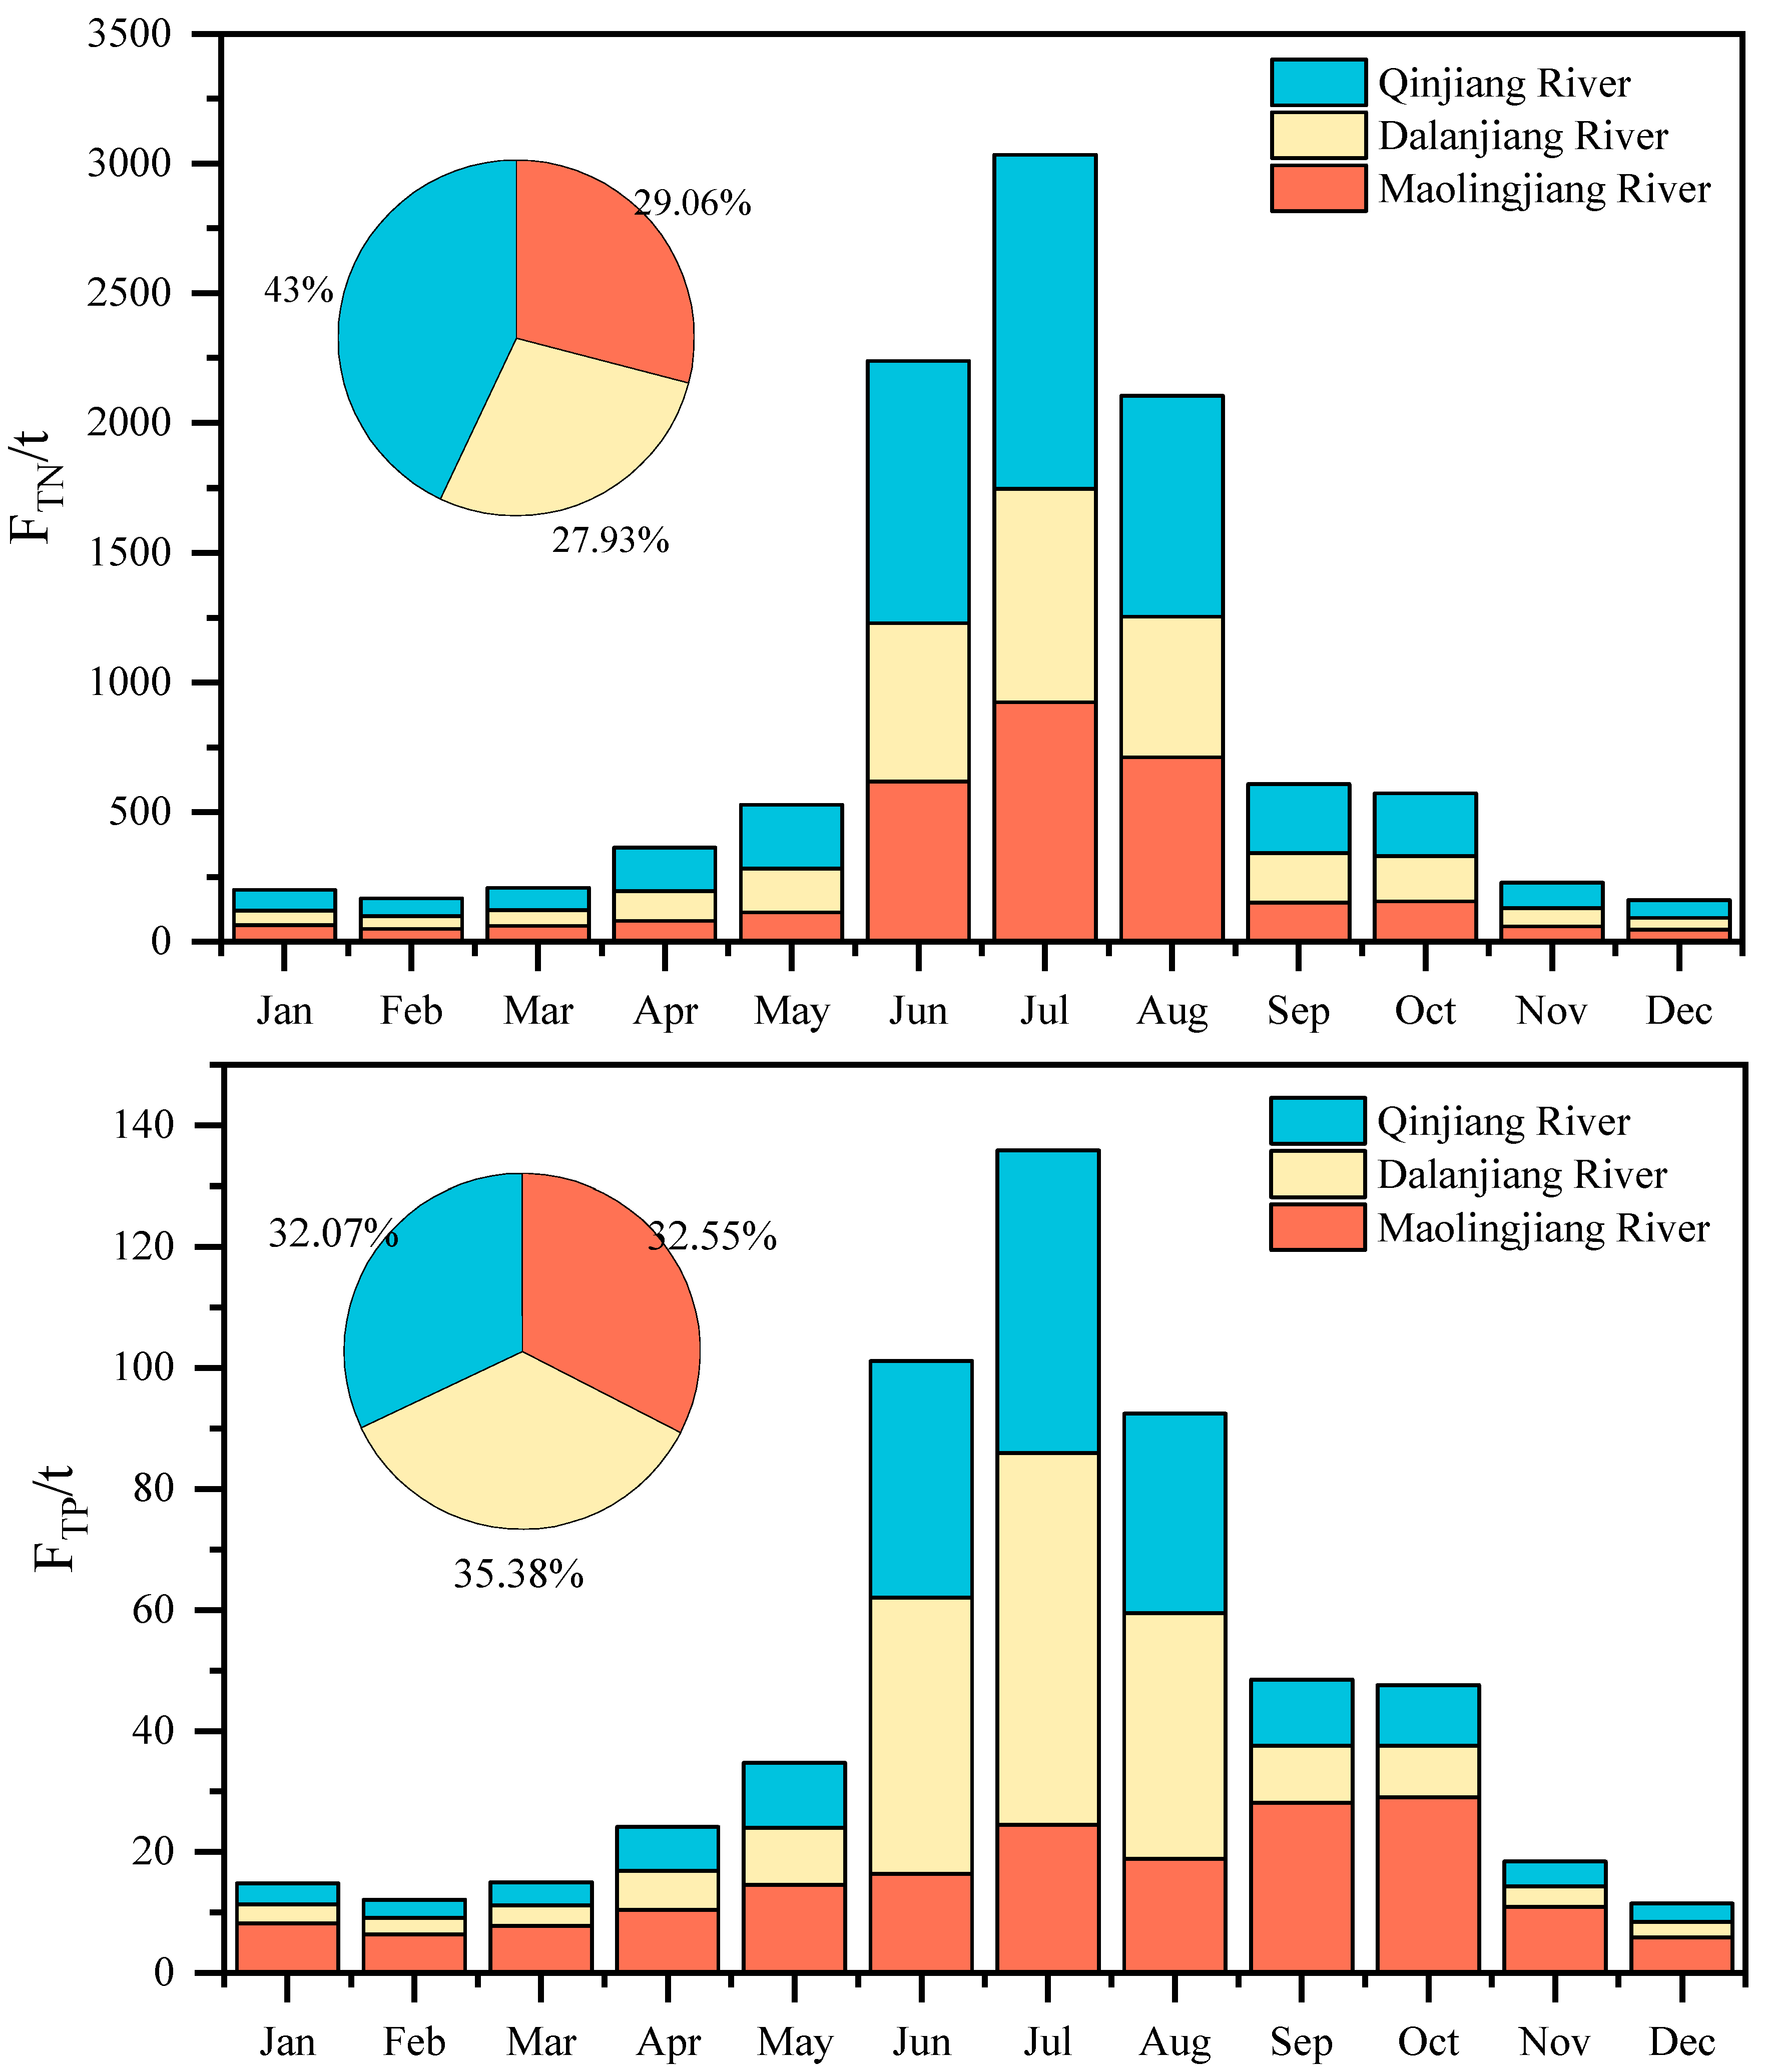
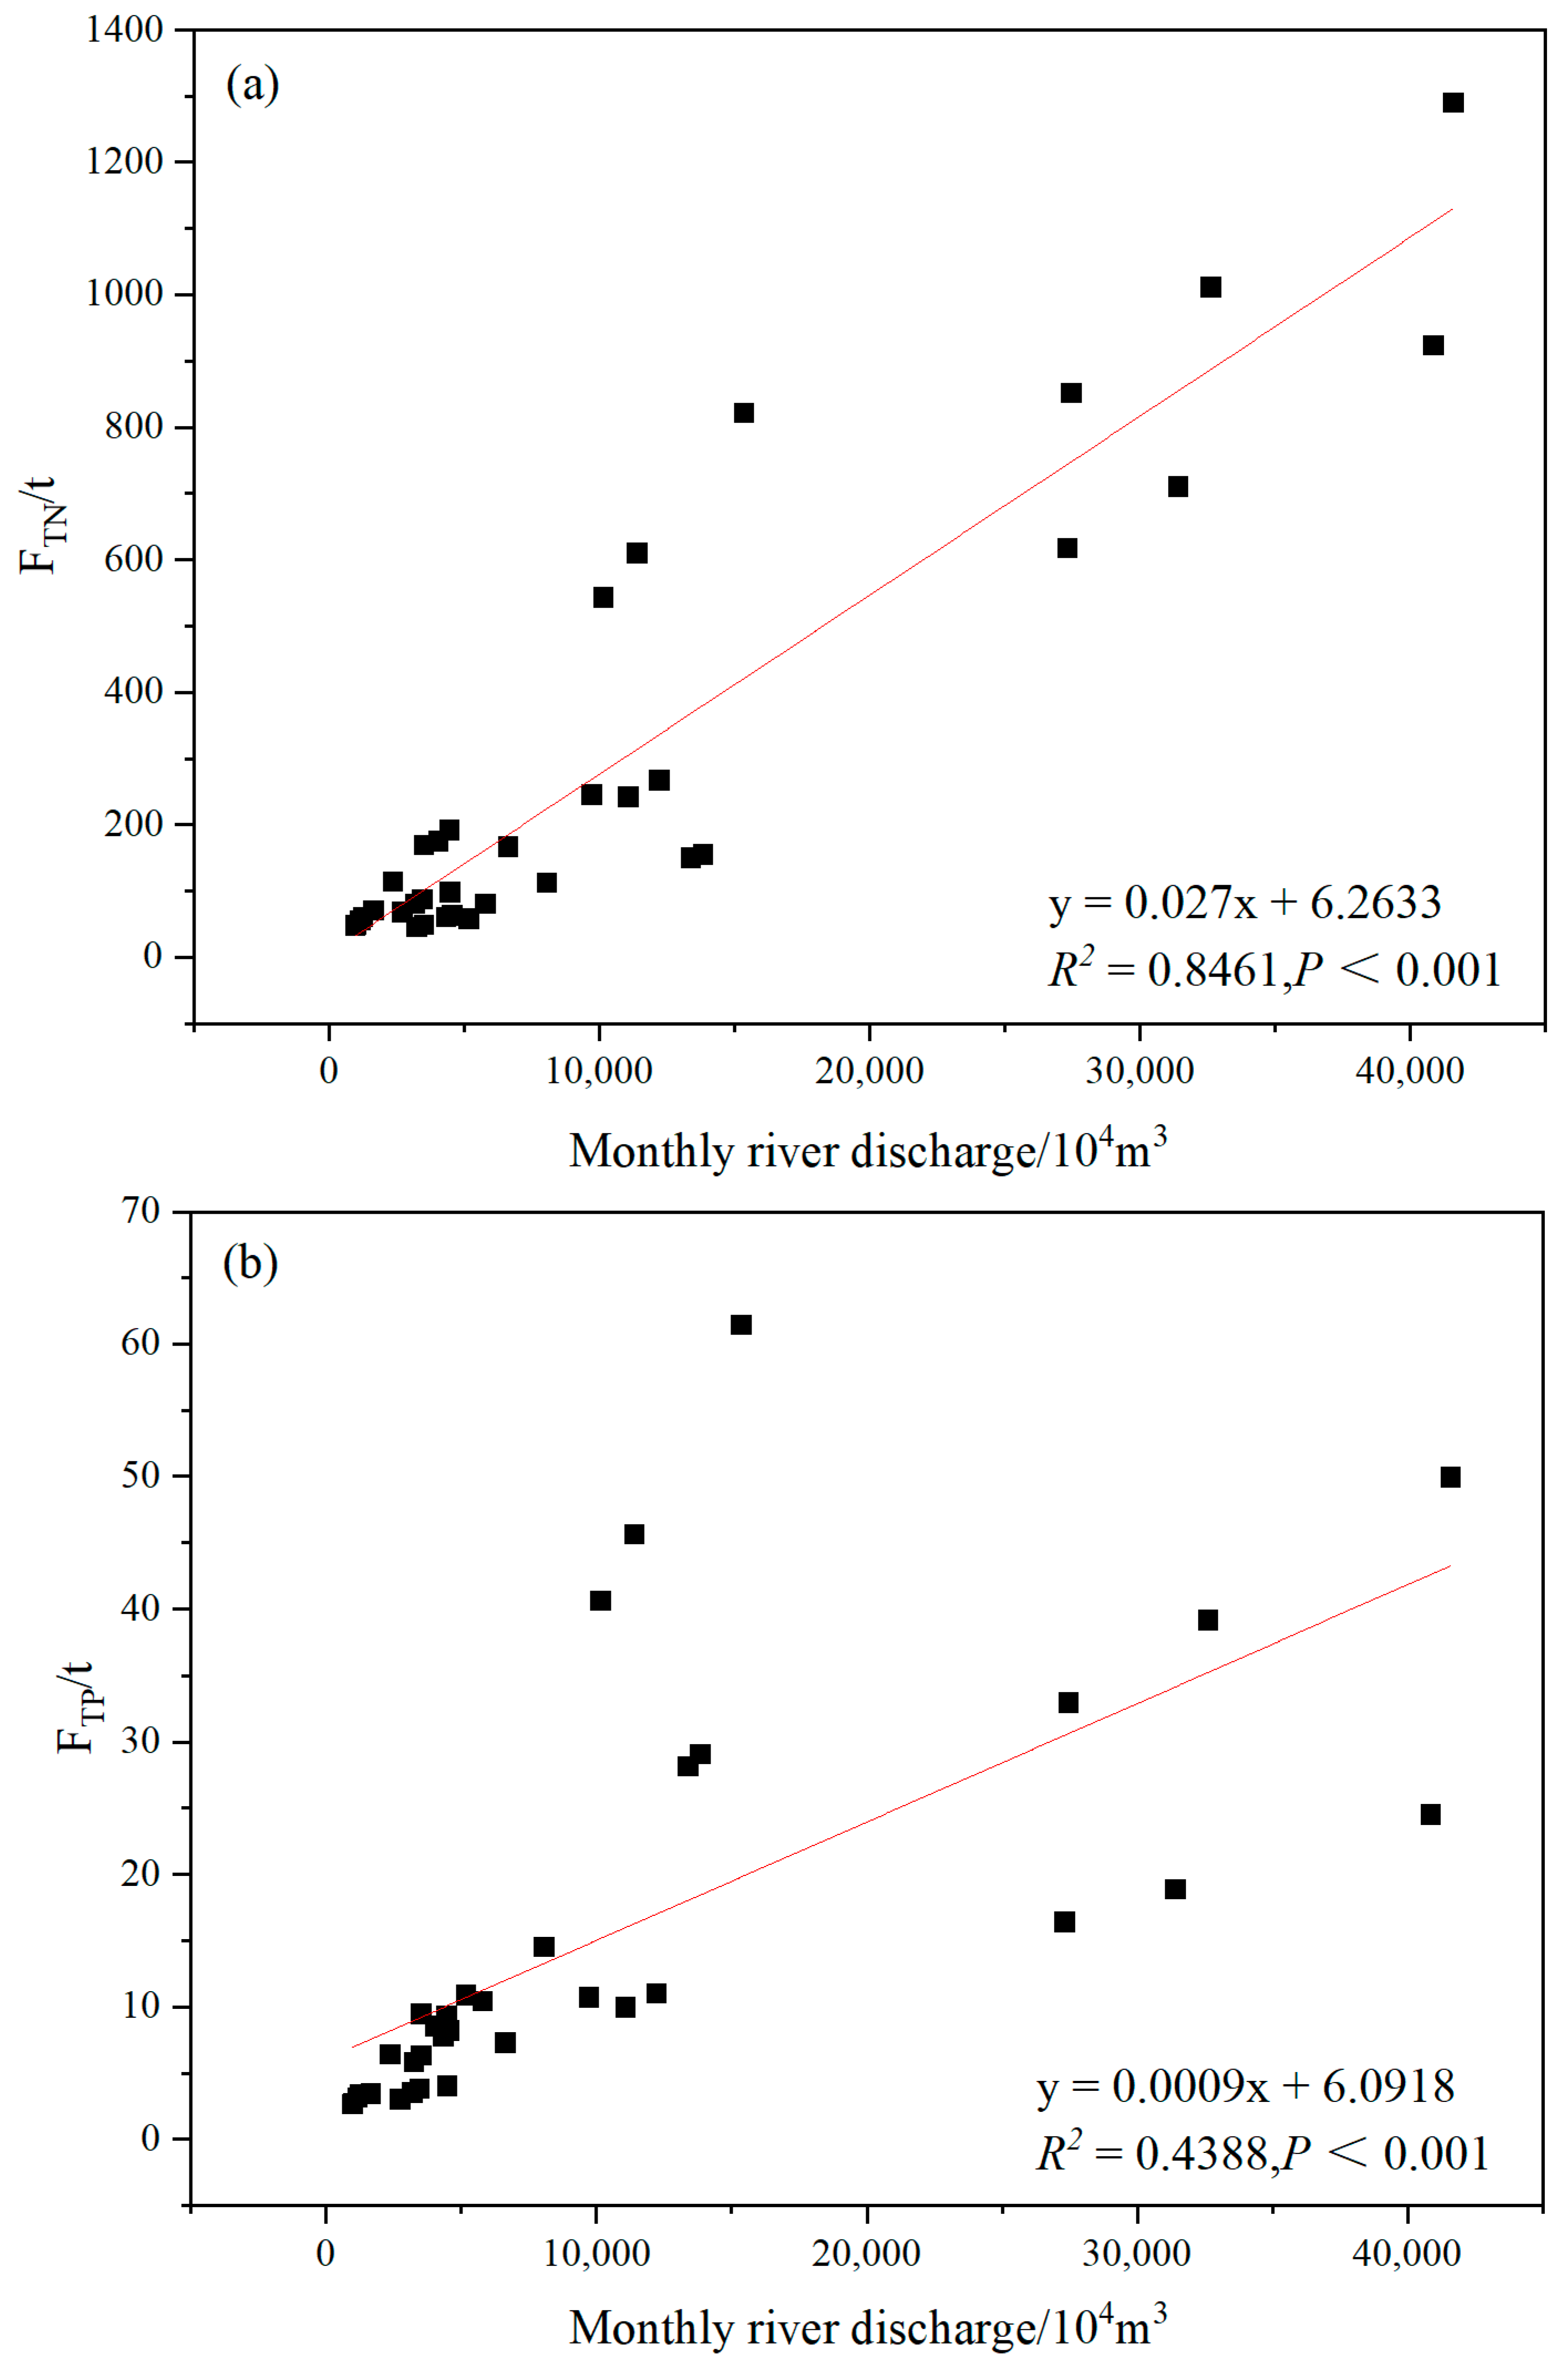
3.2. Seasonal Variations of the TN and TP Fluxes of the Rivers Discharged into the Maowei Sea

The total annual flux of TN and TP pollutants entering the sea from the three rivers was 10,409.52 and 556.21 t, respectively (Figure 3). From the perspective of the monthly flux of TN and TP, the TN and TP of the three rivers had a similar trend, except for the TP of MLJR into the sea flux in October, the TN and TP into the sea flux of the three rivers were the highest in July, accounting for 29.2% and 24.2% of the annual flux, respectively, the lowest in December, accounting for only 1.5% and 2.1% of the annual flux, respectively. The contribution rates of TN and TP of MLJR, DLJR and QJR were 29.06% and 27.94%, 43.00% and 32.55%, and 35.38% and 32.07%, respectively.

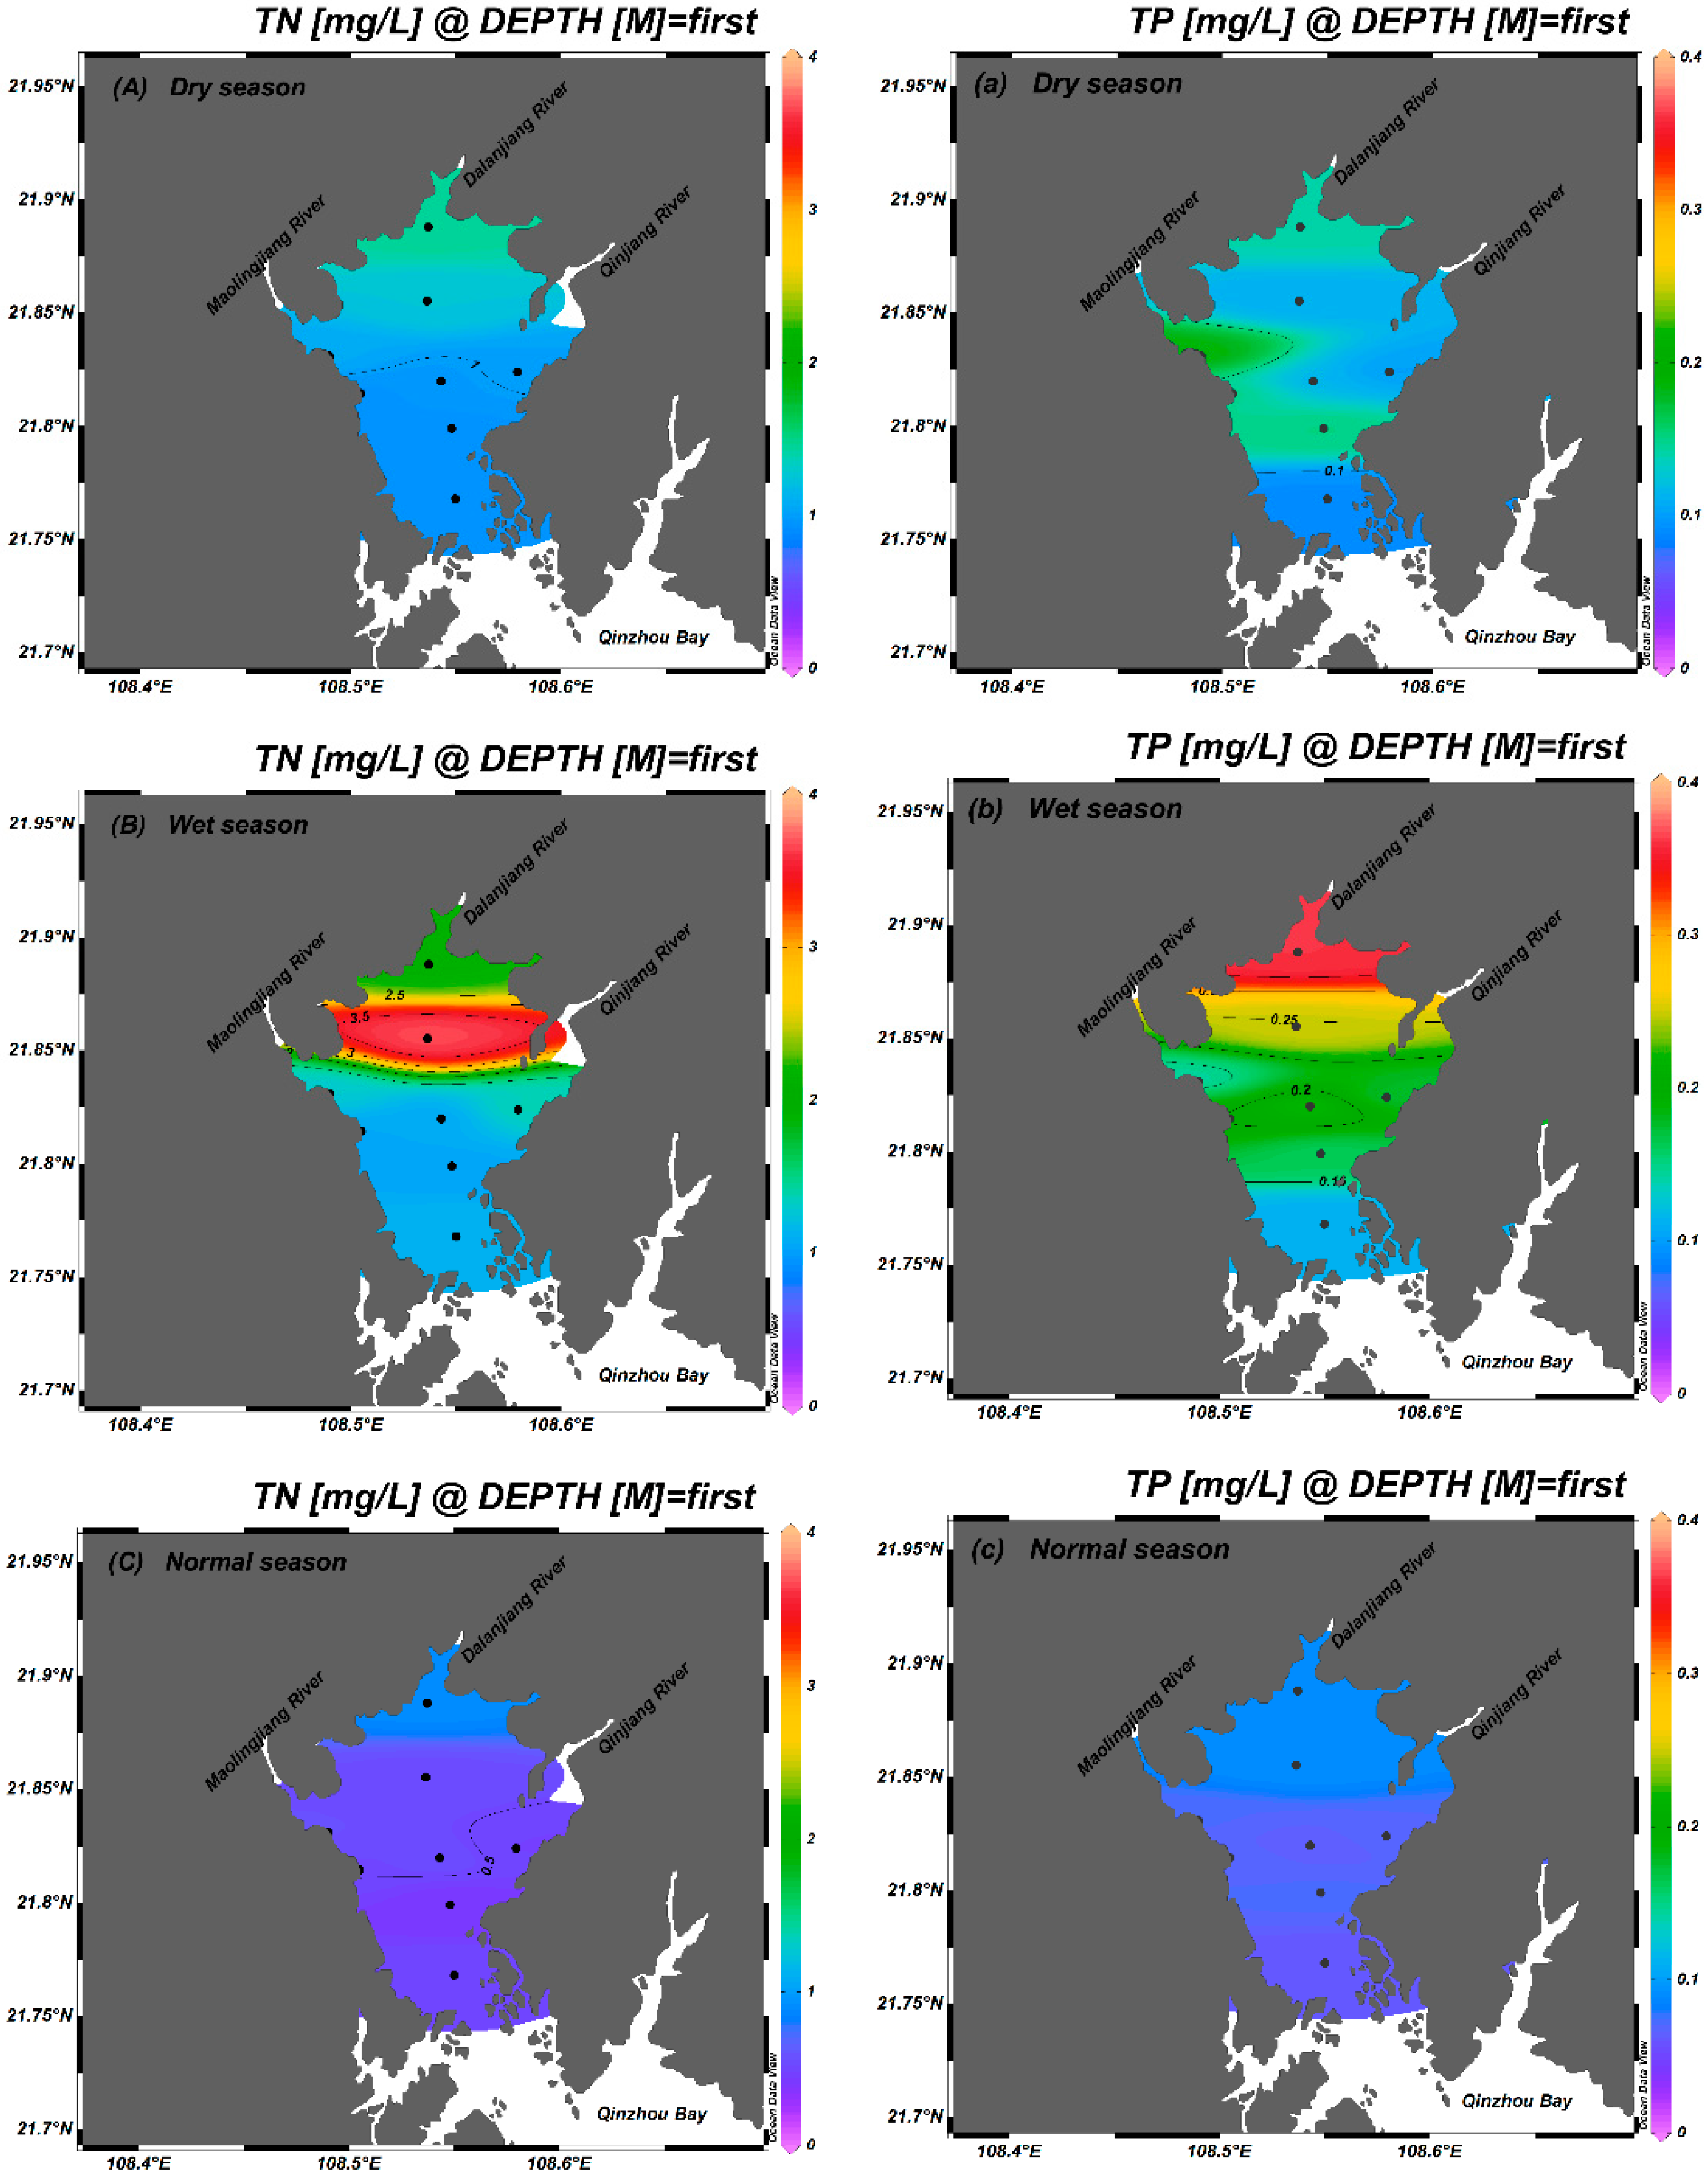
3.3. Seasonal Distribution of TN and TP in the Maowei Sea

The results of the seasonal distribution of TN and TP in the MWS estuary area showed that the average concentration of TN was 1.07 mg/L, and the range was 0.40–3.66 mg/L (Figure 4) (Table 1). The average concentration of TN in the dry season was 1.07 mg/L, ranging from 0.93 to 1.44 mg/L, the average concentration of TN in the wet season was 1.59 mg/L, in the range of 1.04 to 3.66 mg/L, and the average concentration of TN in the normal season was 0.55 mg/L, in the range of 0.40 to 0.89 mg/L. The average concentration of DIN was 0.60 mg/L, accounting for an average of 62.4% of TN, which was the main form of TN in MWS. Among them, the average concentrations of NH4+, NO2 and NO3 were 0.05, 0.04 and 0.51 mg/L, accounting for 7.4%, 6.8% and 85.8% of DIN, respectively, and NO3 was the main form of DIN of MWS. The average concentration of TP was 0.129 mg/L, which ranges from 0.061 to 0.357 mg/L. The average concentration of TP in the dry season was 0.129 mg/L, in the range of 0.089 to 0.192 mg/L, the average concentration of TP in the wet season was 0.203 mg/L, in the range of 0.109 to 0.357 mg/L, and the average concentration of TP in the normal season was 0.073 mg/L, in the range of 0.061 to 0.091 mg/L. The average concentration of DIP was 0.06 mg/L, accounting for 41.0% of TP.

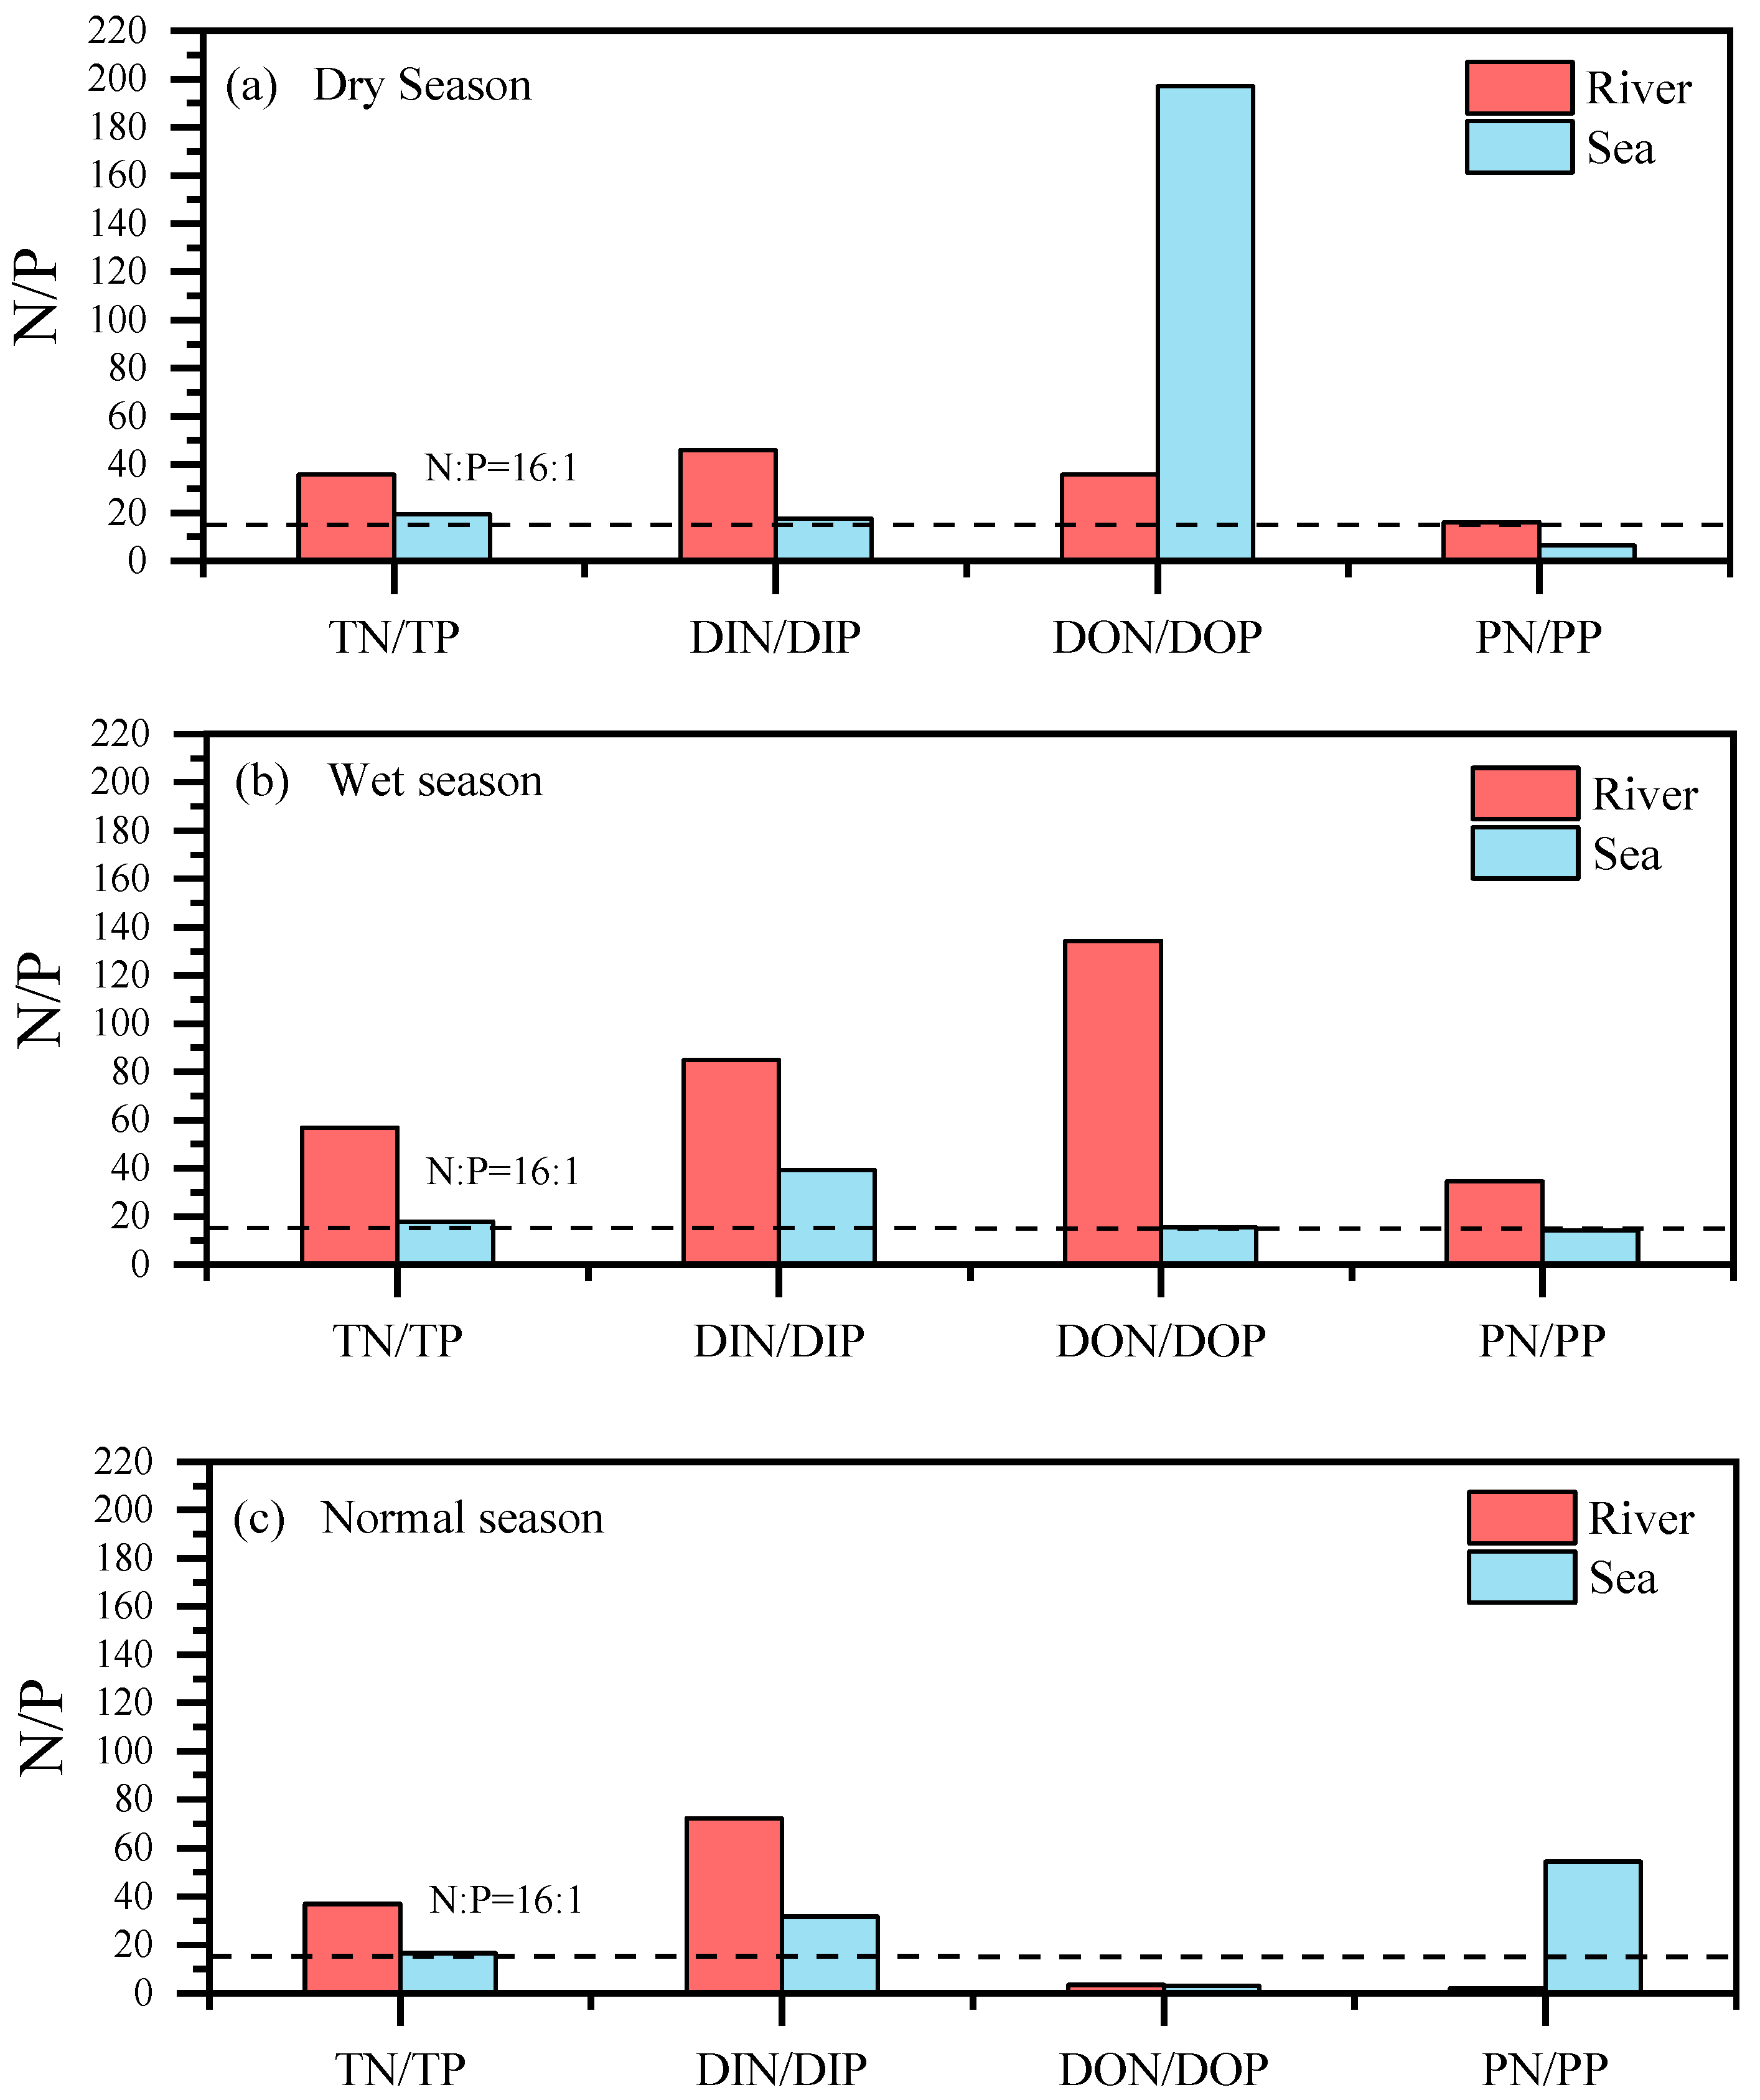
3.4. Seasonal Variation in the Input of N/P from Rivers Estuaries of Maowei Sea and Seawater Response

In 1963, Redfield proposed that the N/P ratio in plankton was nearly constant (N:P = 16:1) [50], and the Redfield ratio has since been widely used to determine whether the growth of phytoplankton in a certain area is N limited or P limited. The N/P ratio of the three rivers entering the sea was generally higher; the annual average of the TN/TP ratio was 43, the range was 12–54, the average DIN/DIP ratio was 68, the range was 13–121, the DON/DOP ratio was 58 on average, the range was 1–235, and the average PN/PP ratio was 18, and the range was 1–61. The overall performance of the estuarine area was phosphorus restriction (Figure 5), and the N/P ratio was higher than that in the dry season and the normal season, which was mainly due to the high nitrogen input concentration of the rivers entering the sea during the wet season. Compared to the rivers entering the sea, the N/P ratio of MWS was not high. The annual average of the TN/TP ratio was 18, ranging from 10 to 32, the average DIN/DIP ratio was 30, ranging from 10 to 62, the average DON/DOP ratio was 72, ranging from 0 to 308, and the average PN/PP ratio was 25, ranging from 2 to 252. The waters of the MWS and its estuarine area were generally relatively excessive in nitrogen and relatively insufficient in phosphorus, which may be one of the key reasons for the phosphorus limitation characteristics of MWS and its rivers entering the sea.

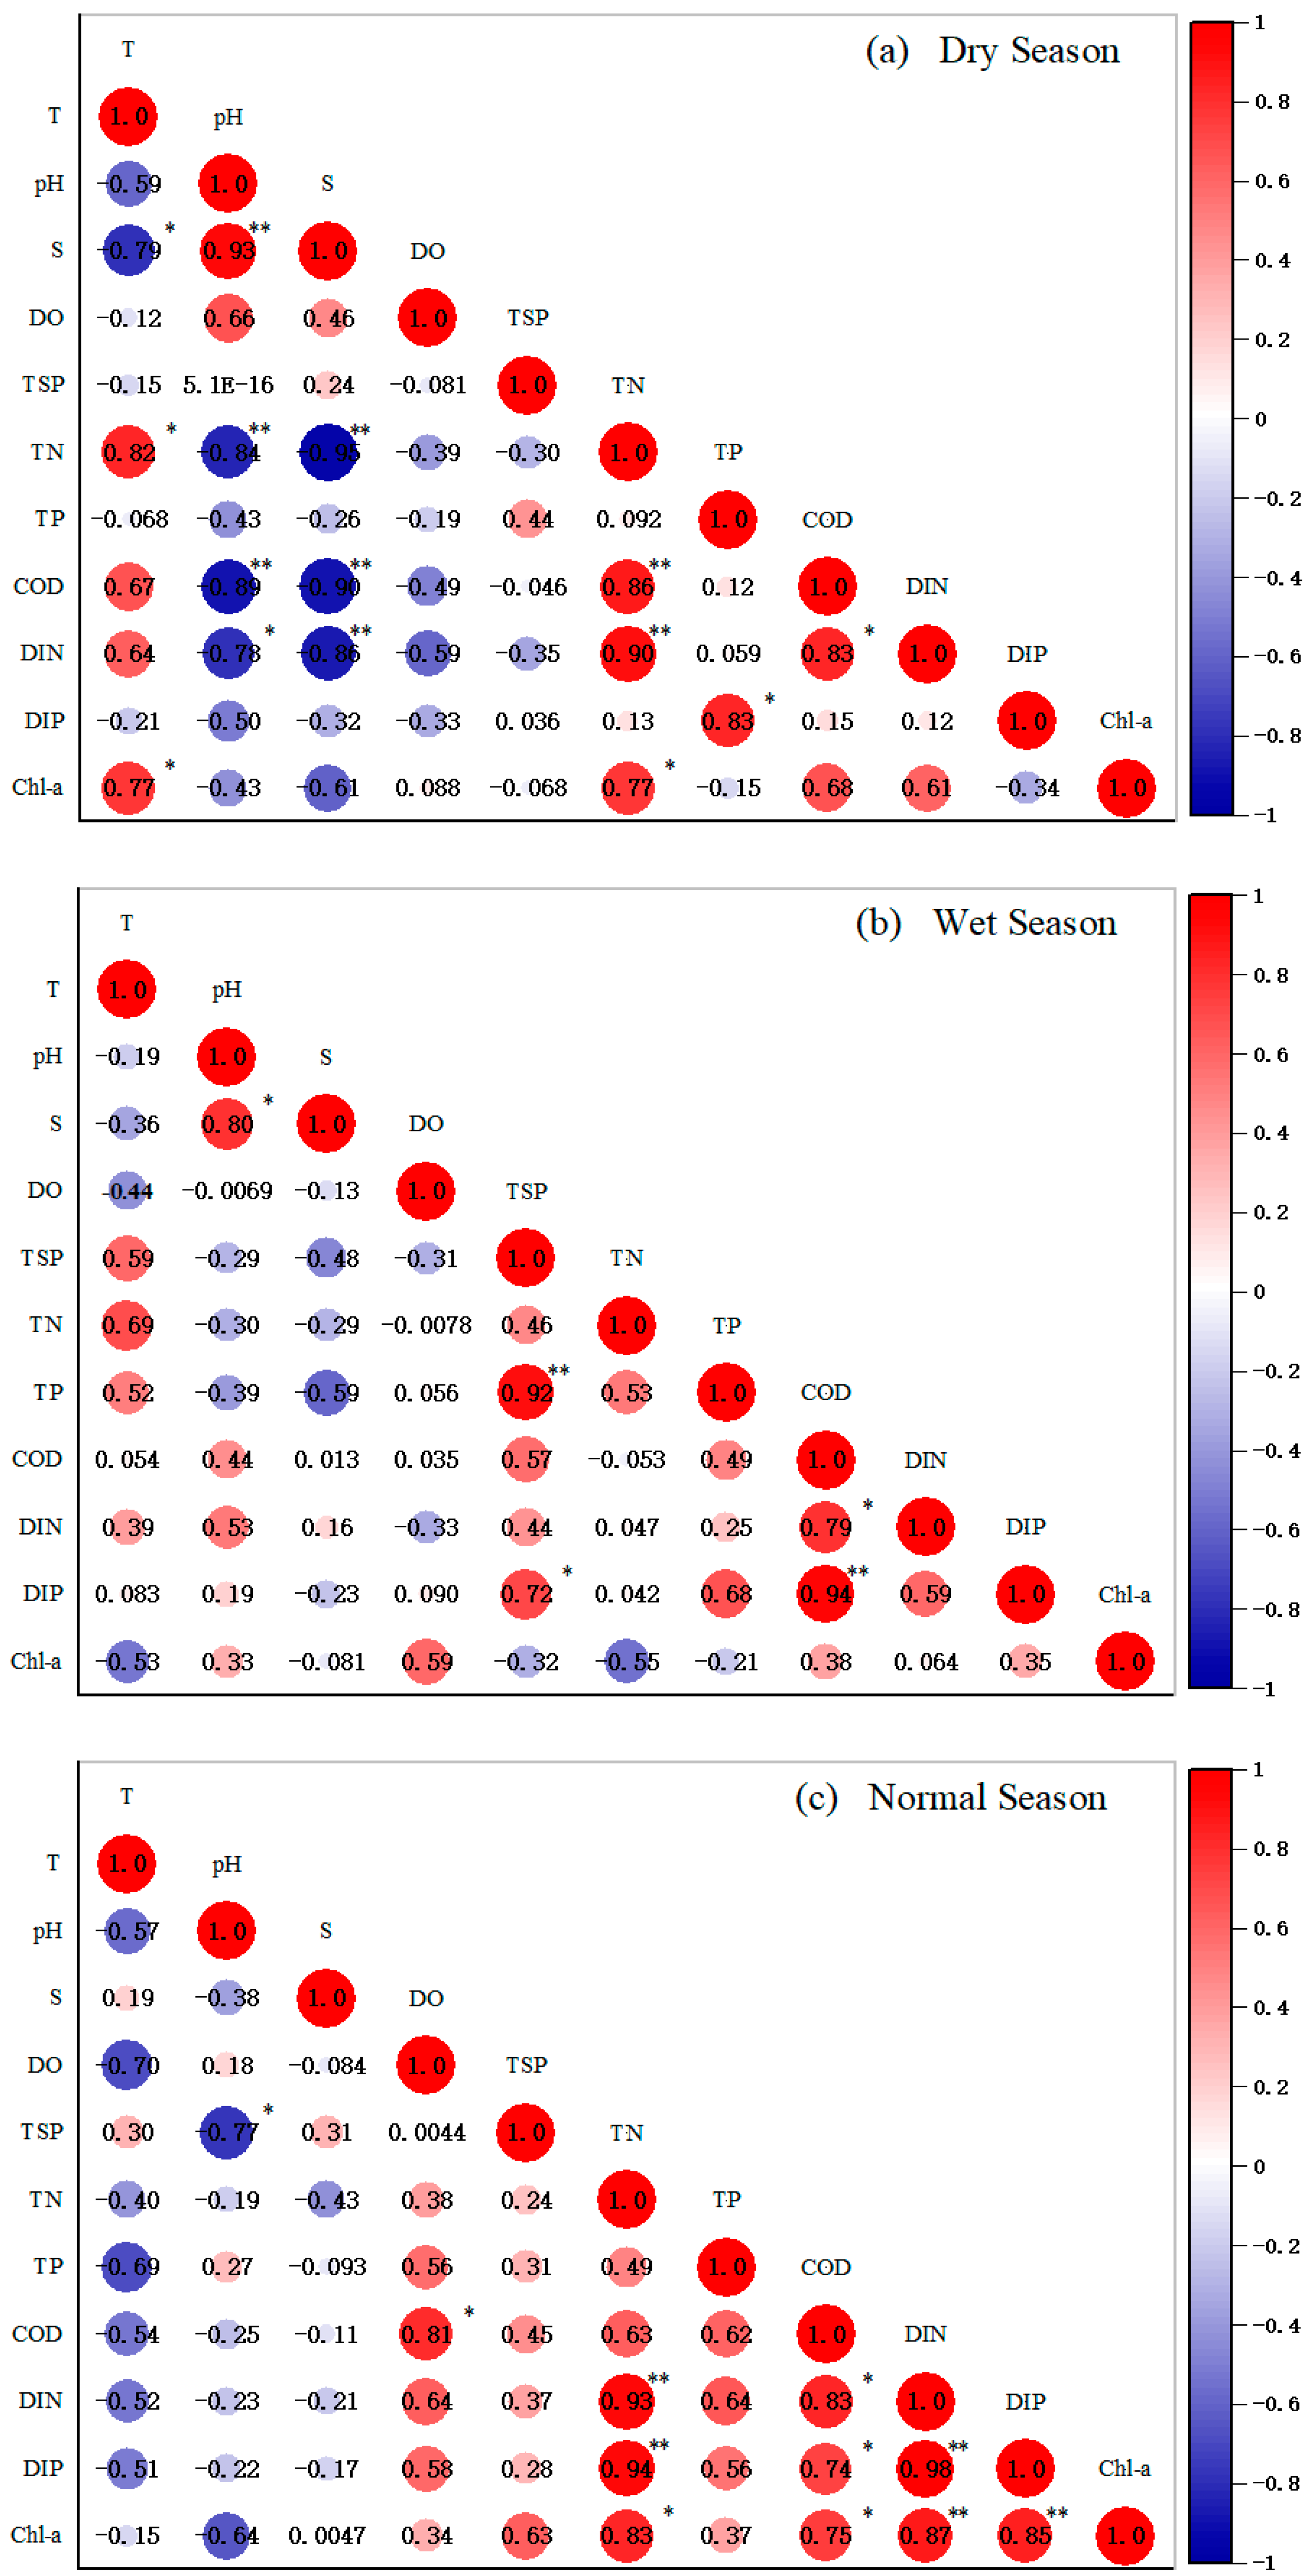
3.5. Correlation Analysis of Influencing Factors on Water Quality in Maowei Sea

The correlation coefficients of the influencing factors showed that the TN and TP concentrations in the MWS exhibited significant changes in different seasons (Figure 6). There was a highly significant negative correlation between S and TN in the dry season (p < 0.01) but not in the wet and normal seasons. It indicated that the TN in the surface water of MWS was not only influenced by terrestrial input but may also be input from other sources [11]. S and TP were not significantly correlated in all three seasons. This suggested that TN and TP concentrations in MWS may be related to groundwater input, urban sewage, aquaculture wastewater input and freshwater discharge from the estuaries. In many cases, the flux of basement input nutrients was also greater than that from local rivers, such as in Sanggou Bay, China [51], eastern Laizhou Bay, China [52], and Maalaea and Kuau, USA [53]. DIN and DIP concentrations during the normal season were highly significantly positively correlated (Figure 6) and insignificantly correlated during the dry and wet seasons. This indicated that the main factors affecting the transport and transformation processes of nitrogen and phosphorus are not the same. During the wet and dry seasons, changes in precipitation and river flow, river leached on agricultural land, groundwater discharge, precipitation and other factors can affect DIN and DIP concentrations.
DIN, DIP concentration and COD were significantly positively correlated in all seasons except the dry season (p < 0.05). This suggested that they had common riverine sources and that organic nitrogen and phosphorus in coastal waters could also be converted to DIN and DIP, respectively [12,28]. In terms of spatial differences in nutrient distribution patterns, the influence of human activities could not be ignored. Riverine TN and TP fluxes could be influenced by urban and industrial effluent discharges, poultry/livestock farming and other aquaculture [11]. In addition, submarine groundwater discharged, and nutrient input in certain areas may play an important role in nutrient control in adjacent coastal waters [42]. In a previous study in MWS, the DIN and DIP nutrient fluxes derived from submarine groundwater discharge were verified to be more than 1.9 and 0.9 times higher than local riverine inputs [42]. Nutrients in the seawater also vary seasonally with submarine groundwater discharge.
From the TN and TP influent fluxes of the three estuaries of MWS throughout the year (Figure 3), the fluxes of TN and TP in the three inlet rivers were significantly different in different months (p < 0.05), the contribution of MLJR, DLJR and QJR to the nitrogen and phosphorus input to MWS was similar, but the reasons for this distribution were different. The contribution of nitrogen and phosphorus input from MLJR and QJR was mainly due to the larger runoff from these two rivers, while the runoff from DLJR was much smaller. However, the difference in the annual input fluxes of TN and TP from the three rivers to the sea was smaller due to the higher concentration of TN and TP in DLJR. This indicated that DLJR was more polluted. The freshwater fluxes during both the wet and normal seasons were greater than those during the dry season, leading to an increase in nitrogen and phosphorus discharge from coastal waters. In the dry season, TN and TP fluxes decreased with the decrease in freshwater flow. This indicated that TN and TP were related to freshwater discharge from rivers and the dilution of seawater in MWS.

4. Discussion

4.1. Concentration and Composition of N and P in the MWS Estuary and Seawater

Among the three rivers that feed into MWS, the concentration of TN was in the descending order: DLJR > QJR > MLJR, and only the TN concentration of MLJR reached standard V (TN < 2 mg/L) of surface water quality [49], while the TN concentrations of DLJR and QJR are both of poor standard V. TDN was the main component of TN in the three rivers, and the highest concentration of TDN was in DLJR. Compared with other estuaries at home and abroad, the concentrations of TDN and DIN in the three estuaries of MWS were relatively high. The average TDN concentration was lower than that of the inlet rivers of Jiaozhou Bay in Qingdao but much higher than that of the rivers less affected by human activities, such as the Delaware River, USA, Bass River, USA, Savannah River, USA, and Pocomoke River, USA (Table 2). The TDP and DIP of the three estuaries were generally higher than those of the domestic and foreign estuarine bay areas (Table 3), which indicated that the nitrogen and phosphorus pollution in the three estuaries of the MWS was influenced by human activities. On the one hand, it was due to the input of urban domestic sewage and industrial wastewater, which brought a large amount of nutrient wastewater with high concentrations; on the other hand, the discharge of a large amount of agricultural drenching and aquaculture wastewater was also an important reason for the excess of N and P. Meanwhile, the concentration of TN in the three estuaries increases to different degrees during the period of abundant water, which was mainly due to the fact that a large amount of strong rainfall in a short period of time will cause the concentration in the estuaries to increase, and these factors have caused a non-negligible impact on the water quality of the estuaries and offshore water quality. Among them, DIN/TDN and DIP/TDP were generally higher than those of domestic and foreign estuaries, at 74.6%, 90.9%, 92.4%, 89.5%, 88.7% and 70.8%, respectively. Excess river DIN and DIP may come from large amounts of agricultural leaching, urban sewage discharge, groundwater and aquaculture water discharge in these river basins; land use in the MWS basin is dominated by agriculture, aquaculture and industry. Therefore, large amounts of DIN and DIP could be imported from different sources. In the past few years, frequent red tides in MWS have been reported, which may be due to the input of estuaries bringing large amounts of DIN and DIP, which provided a large nutrient source for phytoplankton within MWS, prompting phytoplankton outbreaks to form red tides [54]. The main component of DIN in the QJR and MLJR was NO3; NO3 may originate from strong terrestrial sources of nitrogen input, and the upstream areas of QJR and MLJR are densely populated areas, with a population of about 450,000 people [45], so QJR and MLJR may be more seriously affected by human activities. Meanwhile, the DIN of DLJR was mainly composed of NH4+, which was mainly due to the large amount of NH4+ input from aquaculture along the DLJR.
The highest concentrations of DIN and DIP in the MWS during the dry season were due to the decrease in the uptake efficiency of phytoplankton, the regeneration of nutrients and the conversion of DON and DOP into DIN and DIP [55]. The other parameters were higher in the wet season mainly due to the large amount of strong precipitation in the wet season, which led to the increase in river flow into the sea, bringing a large amount of TN and TP to the MWS, resulting in a significant increase in TN and TP concentration in the MWS.

4.2. Seasonal Variation of TN and TP Behavior in Maowei Sea Coastal Water

In this study, the spatial distribution of TN and TP in MWS during the dry season, wet season and normal season were generally similar, and they all showed a gradual increase from the inner bay to the estuary, and there were significant differences in TN and TP concentrations in the three seasons (p < 0.05). The fluxes of TN and TP in the three estuaries were significantly positively correlated with changes in river discharge (Figure 7). It indicated that nutrients are affected by the combined effect of river input and seawater dilution. At the same time, the concentrations of TN and TP increased significantly during the wet season, which was mainly due to the increase in the flow of the estuaries by the large amount of heavy precipitation during the wet season, which brought a large amount of TN and TP to the MWS.
The concentrations of DIN, DIP and TP were similar to the results of the previous study in the MWS (DIN: 0.41 mg/L, DIP: 0.09 mg/L, TP: 0.16 mg/L) [33], while the concentration of TN was much lower than the previous study (TN: 5.02 mg/L) [33]. The concentration of DIN was slightly higher than that of the heavily polluted Jiaozhou Bay (meanDIN: 0.46 mg/L) [3] but slightly lower than that of major tropical bays, such as Zhanjiang Bay (mean DIN: 0.85 mg/L) [12] and Shenzhen Bay (mean DIN: 1.63 mg/L) [68]. DIN was the main constituent of TN, and the source of DIN may be mainly river input. Rivers import large amounts of urban domestic sewage, industrial wastewater and aquaculture wastewater into MWS, which contain large amounts of DIN. The proportion of DIN in MWS decreased, and the proportion of DON increased mainly because the metabolic rate of phytoplankton accelerated in summer, converting DIN in the water into DON and changing the structure of TN. Meanwhile, there are large mangrove reserves along the coast of MWS, and the mangroves at the junction of land and marine ecosystems are rich in plant, animal and microbial biodiversity, which could contribute to the large amounts of DON in coastal waters [69,70]. The structural composition of DIP and DOP have the same variable profile, which converts a large amount of riverine input of DIP to DOP with the onset of summer when phytoplankton flourish. Therefore, the structural composition and spatial distribution of TDN and TDP may depend not only on the hydrodynamic transport mechanisms affecting the composition of DIN and DON and DIP and DOP but also on biogeochemical processes and environmental factors [33].
DIP was the main component of TP in the three estuaries, while the composition of TP in MWS has changed to DOP as the main component of TP. Phosphorus is mainly adsorbed by soil particles and suspended particulate matter, and the adsorption effect on phosphorus may be enhanced with increasing levels of iron, calcium, aluminum and other oxides and organic matter in water. In particular, the presence of iron oxides or apatite effectively limits the dissolution of phosphorus in water [71]. Therefore, the lower DIP concentration may be due to the higher adsorption capacity of particulate matter in it. [72]. In addition, the MWS was the largest oyster farming bay in southwest China, and oyster farming within the MWH may lead to an increase in surface water DOP. Although rivers and groundwater were the primary sources of nutrients in estuarine and coastal waters, studies have shown that increases in DON and DOP also came primarily from natural sources in coastal waters [70,73,74]. Thus, the amount and characteristics of dissolved inorganic or organic phosphorus in most estuarine and coastal marine systems may not depend exclusively on anthropogenic disturbances but may also depend on natural sources in aquatic systems.
Previous studies have evaluated the eutrophication in the MWS, and the origins of the eutrophication processes were attributed to the nutrient inputs from rivers [75,76]. However, it has also been shown that nutrients from groundwater sources were greater than riverine inputs [42]. The present study also indicated that the main nutrient sources in MWS were not only riverine inputs but may be influenced by other major sources together. This result suggested that the contribution of nutrients to water eutrophication in MWS should be re-evaluated.

4.3. Nutrient Ratio Relationship and Influencing Factors in the Maowei Sea

Algal blooms and eutrophication are occurring in many estuaries, and coastal waters as human activities increasingly impact coastal areas of China [77,78,79]. As the amount of nitrogen and phosphorus entering the marine ecosystem increases, it may stimulate phytoplankton growth, leading to an increase in phytoplankton biomass [80,81], damage to the ecosystem, such as the depletion of dissolved oxygen [81,82], red tide outbreaks [83,84,85], adverse human health conditions [86] and eutrophication [87], as well as impacts to global nutrient cycling [88,89]. The growth and reproduction of phytoplankton are usually limited by one or more essential nutrients. Thus, phytoplankton can be nutrient limited and thus affect primary production, which is important for the study of phytoplankton’s metabolic characteristics in many freshwater and coastal marine ecosystems. Because excess DIN and DIP can cause phytoplankton outbreaks in coastal areas, resulting in harmful red tides, the molar ratio of N to P (16:1) is often used to indicate whether the nutrient limitation of phytoplankton growth occurs in freshwater and coastal marine systems [50]. Based on laboratory bioassays, DIP may limit primary productivity when the DIN/DIP molar ratio exceeds 22 [90]. DIP may be potentially limiting when DIN/DIP exceeds 30, and DIN limitation to phytoplankton production occurs when DIN/DIP < 8 [91]. The biological limitation of DIP may occur when DIN/DIP is >32, and limitation for phytoplankton production may occur if DIN/DIP < 12 [92].
In the present study, the N/P in the estuarine zone was generally high and mainly characterized by P limitation. The N/P ratio in the estuarine area increased during the wet season, which was mainly due to the high proportion of N relative to P in river inputs. The N/P of MWS decreased relative to the estuarine zone but was also generally higher than the Redfield ratio (16:1). In China, high DIN/DIP concentrations were mainly distributed in adjacent coastal waters [93]. The growth of phytoplankton was potentially limited by P, which has important effects on phytoplankton growth, reproduction and species composition [94,95]. In addition, MWS and its estuarine area waters were generally relatively N overabundant, and P underabundant, and this study was characterized by P limitation. This may affect the primary productivity, species distribution and ecosystem structure of phytoplankton along MWS. Therefore, the results of this study suggested that changes in nutrient ratios and DIN dominance may be important for the frequent algal outbreaks reported in the MWS in recent years.

5. Conclusions

In this study, the composition of nitrogen and phosphorus in MWS and their spatial and temporal distribution characteristics were investigated in three different water periods. The nitrogen and phosphorus pollution in all three estuaries of the MWS was high, and most of the water quality was below Class III standard. The main components of TN and TP were DIN and DIP, respectively, indicating that the estuaries of MWS were seriously affected by human activities. In addition, the concentrations of TN and TP in MWS were mainly influenced by inputs from land-based sources, but there were also sources other than land-based input for TN. From the river mouth to the bay mouth, the concentrations of almost all nutrient species showed a decreasing trend, indicating that the MWS was mainly influenced by nutrients from land-based sources. Moreover, the MWH and its inlet estuary were generally characterized by a relative excess of N and a relative deficit of P, showing phosphorus limitation. Therefore, management efforts were encouraged to reduce nutrient (especially N) loading to the MWS in order to maintain its water quality and preserve its ecosystem services and functions.

Author Contributions

Conceptualization: C.R. and J.Z.; Methodology: C.R. and J.Z.; Software: D.P.; Validation: D.P.; Formal analysis: D.P.; Writing—original draft preparation: P.Z. and D.P.; Writing—review and editing: P.Z., J.Z. and D.P.; Visualization: X.S. and S.Y.; Supervision: P.Z.; Project management: J.Z.; Funding acquisition: P.Z. and J.Z. All listed authors made substantial, direct and intellectual contributions to the work and are approved for publication. All authors have read and agreed to the published version of the manuscript.

Funding

This research was funded by Guangxi Key Research and Development Program (GuiKeAB22035065), Research and Development Projects in Key Areas of Guangdong Province (2020B1111020004), Guangdong Ocean University Fund Project (R18021), Science and Technology Special Project of Zhanjiang City (2019B01081), First-class Special Fund (231419018) and the Innovation Strong School Project (230420007) of Guangdong Ocean University.

Institutional Review Board Statement

Not applicable.

Informed Consent Statement

Not applicable.

Data Availability Statement

Not applicable.

Acknowledgments

Special thanks go to the reviewers for their careful review and constructive suggestions. We thank all members of the research team and others involved in this study.

Conflicts of Interest

The authors declare no conflict of interest.

References

  1. Tuncer, G.; Karakas, T.; Balkas, T.I.; Gökçay, C.F.; Aygnn, S.; Yurteri, C.; Tuncel, G. Land-based sources of pollution along the Black Sea coast of Turkey: Concentrations and annual loads to the Black Sea. Mar. Pollut. Bull. 1998, 36, 409–423. [Google Scholar] [CrossRef]
  2. Páez-Osuna, F.; Guerrero-Galván, S.R.; Ruiz-Fernández, A.C. Discharge of nutrients from shrimp farming to coastal waters of the Gulf of California. Mar. Pollut. Bull. 1999, 38, 585–592. [Google Scholar] [CrossRef]
  3. Lu, D.L.; Yang, N.N.; Liang, S.K.; Li, K.Q.; Wang, X.L. Comparison of land-based sources with ambient estuarine concentrations of total dissolved nitrogen in Jiaozhou Bay (China). Estuar. Coast. Shelf Sci. 2016, 180, 82–90. [Google Scholar] [CrossRef]
  4. Liu, H.; Chen, M.; Shen, P.; Huang, H.; Dai, M.; Qi, Z. A first description of ciliate assemblages in a subtropical, eutrophic bay, South China Sea: Species assemblage and environmental correlates-Ciliate variation in a subtropical bay. Aquat. Living Resour. 2016, 29, 304. [Google Scholar] [CrossRef]
  5. Huang, F.J.; Lin, X.B.; Hu, W.F.; Zeng, F.; He, L.; Yin, K.D. Nitrogen cycling processes in sediments of the pearl river estuary: Spatial variations, controlling factors, and environmental implications. Catena 2021, 206, 105545. [Google Scholar] [CrossRef]
  6. Lin, G.; Lin, X. Bait input altered microbial community structure and increased greenhouse gases production in coastal wetland sediment. Water Res. 2022, 218, 118520. [Google Scholar] [CrossRef]
  7. Conley, D.J.; Paerl, H.F.; Howarth, R.W.; Fau-Boesch, D.F.; Boesch, D.F.; Seitzinger, S.P.; Havens, K.E.; Lancelot, C.; Likens, G.E. Controlling eutrophication: Nitrogen and phosphorus. Science 2009, 323, 1014–1015. [Google Scholar] [CrossRef]
  8. Li, J.; Zheng, B.H.; Zhang, L.; Jin, X.; Hu, X.; Liu, F.; Shao, J.B. Eutrophication characteristics and variation analysis of estuaries in China. Zhongguo Huanjing Kexue China Environ. Sci. 2016, 36, 506–516. [Google Scholar]
  9. Smith, V.H.; Tilman, G.D.; Nekola, J.C. Eutrophication: Impacts of excess nutrient inputs on freshwater, marine, and terrestrial ecosystems. Environ. Pollut. 1999, 100, 179–196. [Google Scholar] [CrossRef]
  10. Bricker, S.B.; Longstaff, B.; Dennison, W.; Jones, A.; Boicourt, K.; Wicks, C.; Woerner, J. Effects of nutrient enrichment in the nation’s estuaries: A decade of change. Harmful Algae 2008, 8, 21–32. [Google Scholar] [CrossRef]
  11. Zhang, J.B.; Zhang, P.; Dai, P.D.; Lai, J.Y.; Chen, Y. Spatiotemporal distributions of DIP and the eutrophication in Hainan Island adjacent coastal water. Zhongguo Huanjing Kexue China Environ. Sci. 2019, 39, 2541–2548. [Google Scholar]
  12. Zhang, P.; Wei, L.R.; Lai, J.Y.; Dai, P.D.; Chen, Y.; Zhang, J.B. Concentration, Composition and Fluxes of Land-based Nitrogen and Phosphorus Source Pollutants Input into Zhanjiang Bay in Summer. J. Guangdong Ocean Univ. 2019, 39, 63–72. [Google Scholar]
  13. Zhang, P.; Su, Y.; Liang, S.K.; Li, K.Q.; Li, Y.B.; Wang, X.L. Assessment of long-term water quality variation affected by high-intensity land-based inputs and land reclamation in Jiaozhou Bay, China. Ecol. Indic. 2017, 75, 210–219. [Google Scholar] [CrossRef] [Green Version]
  14. Paerl, H.W. Coastal eutrophication and harmful algal blooms: Importance of atmospheric deposition and groundwater as “new” nitrogen and other nutrient sources. Limnol. Oceanogr. 1997, 42, 1154–1165. [Google Scholar] [CrossRef] [Green Version]
  15. Rabalais, N.N. Nitrogen in aquatic ecosystems. Ambio 2002, 31, 102–112. [Google Scholar] [CrossRef]
  16. Wasmund, N. Harmful Algal Blooms in Coastal Waters of the South-Eastern Baltic Sea. Balt. Coast. Ecosyst. 2002, 93–116. [Google Scholar] [CrossRef]
  17. Glibert, P.M. Eutrophication, harmful algae and biodiversity—Challenging paradigms in a world of complex nutrient changes. Mar. Pollut. Bull. 2017, 124, 591–606. [Google Scholar] [CrossRef]
  18. Jani, J.; Toor, G.S. Composition, sources, and bioavailability of nitrogen in a longitudinal gradient from freshwater to estuarine waters. Water Res. 2018, 137, 344–354. [Google Scholar] [CrossRef]
  19. Strokal, M.; Yang, H.; Zhang, Y.; Kroeze, C.; Li, L.; Luan, S.; Wang, H.; Yang, S.; Zhang, Y. Increasing eutrophication in the coastal seas of China from 1970 to 2050. Mar. Pollut. Bull. 2014, 85, 123–140. [Google Scholar] [CrossRef]
  20. Li, K.; Liu, C.; Ma, Y.; Wang, X. Land-based dissolved organic nitrogen dynamics and bioavailability in Jiaozhou Bay, China. Estuar. Coast. Shelf Sci. 2019, 220, 13–24. [Google Scholar] [CrossRef]
  21. Seitzinger, S.P.; Sanders, R.W. Estuarine eutrophication: The contribution of dissolved organic nitrogen. Mar. Ecol. Prog. Ser. 1997, 159, 1–12. [Google Scholar] [CrossRef] [Green Version]
  22. Moschonas, G.; Gowen, R.J.; Paterson, R.F.; Mitchell, E.; Davidson, K. Nitrogen dynamics and phytoplankton community structure: The role of organic nutrients. Biogeochemistry 2017, 134, 125–145. [Google Scholar] [CrossRef] [PubMed] [Green Version]
  23. Officer, C.B.; Ryther, J.H. The possible importance of silicon in marine eutrophication. Mar. Ecol. Prog. Ser. 1980, 3, 83–91. [Google Scholar] [CrossRef]
  24. Anderson, D.M.; Glibert, P.M.; Burkholder, J.M. Harmful algal blooms and eutrophication: Nutrient sources, composition, and consequences. Estuaries 2002, 25, 704–726. [Google Scholar] [CrossRef]
  25. Jia, M.; Yu, Z.; Yao, Q.; Bianchi, T.S.; Paytan, A.; Zhao, B.; Pan, H.; Peng, Y. Distribution, mixing behavior, and transformation of dissolved inorganic phosphorus and suspended particulate phosphorus along a salinity gradient in the Changjiang Estuary. Mar. Chem. 2015, 168, 124–134. [Google Scholar]
  26. Duan, L.Q.; Song, J.M.; Yuan, H.M.; Li, X.G.; Li, N. Distribution, partitioning and sources of dissolved and particulate nitrogen and phosphorus in the north Yellow Sea. Estuar. Coast. Shelf Sci. 2016, 181, 182–195. [Google Scholar] [CrossRef]
  27. Sundareshwar, P.V.; Morris, J.T.; Koepfler, E.K.; Fornwalt, B. Phosphorus limitation of coastal ecosystem processes. Science 2003, 299, 563–565. [Google Scholar] [CrossRef] [Green Version]
  28. Yuan, H.M.; Song, J.M.; Xing, J.W.; Li, X.G.; Li, N.; Duan, L.Q.; Qiu, B.X.; Wang, Q.D. Spatial and seasonal variations, partitioning and fluxes of dissolved and particulate nutrients in Jiaozhou Bay. Cont. Shelf Res. 2018, 171, 140–149. [Google Scholar] [CrossRef]
  29. Bronk, D.A.; See, J.H.; Bradley, P.; Killberg, L. DON as a source of bioavailable nitrogen for phytoplankton. Biogeosciences Discuss. 2006, 3, 1247–1277. [Google Scholar] [CrossRef] [Green Version]
  30. Xu, C.; Dan, S.F.; Yang, B.; Lu, D.; Ning, Z. Biogeochemistry of dissolved and particulate phosphorus speciation in the maowei sea, northern beibu gulf. J. Hydrol. 2021, 593, 125822. [Google Scholar] [CrossRef]
  31. Wei, C.X.; Zhao, S.; Song, L.R.; Wu, H.P. Analysis and assessment of nutrient status in Maowei Sea of inner Qinzhou Bay. Environ. Sci. Manag. 2017, 42, 148–153. [Google Scholar]
  32. Gu, Y.G.; Lin, Q.; Yu, Z.L.; Wang, X.N.; Ke, C.L.; Ning, J.J. Speciation and risk of heavy metals in sediments and human health implications of heavy metals in edible nekton in Beibu Gulf, China: A case study of Qinzhou Bay. Mar. Pollut. Bull. 2015, 101, 852–859. [Google Scholar] [CrossRef]
  33. Lu, D.; Huang, X.; Yang, B.; Dan, S.F.; Kang, Z.; Zhou, J.; Lao, Y.; Zhong, Q.; Wu, H. Composition and Distributions of Nitrogen and Phosphorus and Assessment of Eutrophication Status in the Maowei Sea. J. Ocean Univ. China 2021, 20, 361–371. [Google Scholar] [CrossRef]
  34. Qin, X.L.; Chen, X.Y.; Lai, J.X.; Jiang, F.J.; Chen, B. The distribution characteristics and seasonal variation of total dissolved nitrogen and phosphorus in the surface of Qinzhou Bay. Mar. Environ. Sci. 2017, 36, 349–353. [Google Scholar]
  35. Yang, B.; Zhou, J.B.; Lu, D.L.; Dan, S.F.; Zhang, D.; Lan, W.L.; Cui, D.Y. Phosphorus chemical speciation and seasonal variations in surface sediments of the Maowei Sea, northern Beibu Gulf. Mar. Pollut. Bull. 2019, 141, 61–699. [Google Scholar] [CrossRef] [PubMed]
  36. Stepanauskas, R.; Jorgensen, N.O.; Eigaard, O.R.; Zvikas, A.; Tranvik, L.J.; Leonardson, L. Summer inputs of riverine nutrients to the Baltic Sea: Bioavailab. Eutrophication Relev. 2002, 72, 579–597. [Google Scholar]
  37. Oneil, J.M.; Davis, T.W.; Burford, M.A.; Gobler, C.J. The rise of harmful cyanobacteria blooms: The potential roles of eutrophication and climate change. Harmful Algae 2012, 14, 313–334. [Google Scholar] [CrossRef]
  38. Wang, Y.J.; Liao, R.Q.; Liu, W.L.; Kannan, K.; Ohura, T.; Wu, M.H.; Ma, J. Chlorinated polycyclic aromatic hydrocarbons in surface sediment from Maowei Sea, Guangxi, China: Occurrence, distribution, and source apportionment. Environ. Sci. Pollut. Res. 2017, 24, 16241–16252. [Google Scholar] [CrossRef]
  39. Dan, S.F.; Lan, W.; Yang, B.; Han, L.; Xu, C.; Lu, D.; Kang, Z.; Huang, H.; Ning, Z. Bulk sedimentary phosphorus in relation to organic carbon, sediment textural properties and hydrodynamics in the northern Beibu Gulf, South China Sea. Mar. Pollut. Bull. 2020, 155, 111176. [Google Scholar] [CrossRef]
  40. Gu, Y.G.; Huang, H.H.; Liu, Y.; Gong, X.Y.; Liao, X.L. Non-metric multidimensional scaling and human risks of heavy metal concentrations in wild marine organisms from the Maowei Sea, the Beibu Gulf, South China Sea. Environ. Toxicol. Pharmacol. 2018, 59, 119–124. [Google Scholar] [CrossRef]
  41. Meng, X.; Xia, P.; Li, Z.; Meng, D. Mangrove degradation and response to anthropogenic disturbance in the Maowei Sea (SW China) since 1926 AD: Mangrove- derived OM and pollen. Org. Geochem. 2016, 98, 166–175. [Google Scholar] [CrossRef]
  42. Chen, X.; Lao, Y.; Wang, J.; Du, J.; Liang, M.; Yang, B. Submarine groundwater-borne nutrients in a tropical bay (Maowei Sea, China) and their impacts on the oyster aquaculture. Geochem. Geophys. Geosystems 2018, 19, 932–951. [Google Scholar] [CrossRef]
  43. Tian, H.T.; Hu, X.S.; Zhang, S.F.; Xie, J.; Zhang, D.; An, J.S. Distribution andpotential ecological risk assessment of heavy metals insurface sediments of Maowei Sea. Mar. Environ. Sci. 2014, 33, 187–191. [Google Scholar]
  44. Xu, C.; Yang, B.; Dan, S.F.; Zhang, D.; Liao, R.Q.; Lu, D.R.; Li, R.H.; Ning, Z.M.; Peng, S.Q. Spatiotemporal variations of biogenic elements and sources of sedimentary organic matter in the largest oyster mariculture bay (Maowei Sea), Southwest China. Sci. Total Environ. 2020, 730, 139056. [Google Scholar] [CrossRef]
  45. Zhang, D.; Lu, D.L.; Yang, B.; Zhang, J.B.; Ning, Z.M.; Yu, K.F. Influence of natural and anthropogenic factors on spatial-temporal hydrochemistry and the susceptibility to nutrient enrichment in a subtropical estuary. Mar. Pollut. Bull. 2019, 146, 945–954. [Google Scholar] [CrossRef] [PubMed]
  46. Guangxi Statistical Bureau. Guangxi Statistical Yearbook; China Statistics Press: Beijing, China, 2017; pp. 366–369. [Google Scholar]
  47. State Bureau of Quality Technical Supervision. GB17378.4—2007; The Specification for Marine Monitoring Part 4: Seawater Analysis. China Standards Press: Beijing, China, 2007.
  48. Specification for Offshore Environmental Monitorin. HJ 442-2008; Part 3 Offshore Seawater Quality Monitor. China Standards Press: Beijing, China, 2008.
  49. GB3838-2002; MEPC, Environmental QUALITY Standards for Surface Water. Ministry of Environment Protection, People’s Republic of China, Standards Press of China: Beijing, China, 2002.
  50. Redfield, A.C.; Ketchum, B.H.; Richards, F.A. The influence of organisms on the composition of seawater. In The Sea; Hill, M.N., Ed.; Interscience Publishers: Geneva, Switzerland; John Wiley: New York, NY, USA, 1963; Volume 2, pp. 26–77. [Google Scholar]
  51. Yang, B.; Kang, Z.J.; Lu, D.L.; Dan, S.; Ning, Z.M.; Lan, W.L.; Zhong, Q.P. Spatial variations in the abundance and chemical speciation of phosphorus across the river–sea interface in the Northern Beibu Gulf. Water 2018, 10, 1103. [Google Scholar] [CrossRef] [Green Version]
  52. Yao, Q.Z.; Yu, Z.G.; Chen, H.T.; Liu, P.X.; Mi, T.Z. Phosphorus transport and speciation in the Changjiang (Yangtze River) system. Appl. Geochem. 2009, 24, 2186–2194. [Google Scholar] [CrossRef]
  53. Wang, X.L.; Du, J.Z.; Ji, T.; Wen, T.Y.; Liu, S.M.; Zhang, J. An estimation of nutrient fluxes via submarine groundwater discharge into the Sanggou Bay—A typical multi-species culture ecosystem in China. Mar. Chem. 2014, 167, 113–122. [Google Scholar] [CrossRef]
  54. Gong, B.; Wu, H.P.; Ma, J.X.; Luo, M.M.; Li, X. The algae community in taxon Haptophyceae at the early bloom stage of Phaeocystis globosa in Northern Beibu Gulf in winter. BioReliance 2018, 492454. [Google Scholar] [CrossRef] [Green Version]
  55. Wu, M.L.; Hong, Y.G.; Yin, J.P.; Dong, J.D.; Wang, Y.S. Evolution of the sink and source of dissolved inorganic nitrogen with salinity as a tracer during summer in the Pearl River Estuary. Sci. Rep. 2016, 6, 36638. [Google Scholar] [CrossRef] [Green Version]
  56. Wiegner, T.N.; Seitzinger, S.P.; Glibert, P.M.; Bronk, D.A. Bioavailability of dissolved organic nitrogen and carbon from nine rivers in the eastern United States. Aquat. Microb. Ecol. 2006, 43, 277–287. [Google Scholar] [CrossRef] [Green Version]
  57. Yang, N.N. Terrigenous Input, Distribution and Bioavailability of Dissolved Organic Nitrogen in Jiaozhou Bay from 2012 to 2013; Ocean University of China: Qingdao, China, 2014. [Google Scholar]
  58. Shi, X.Y.; Zhang, G.C.; Liang, S.K.; Han, X.R. Potential bioavailability and flux of dissolved organic nitrogen at the Datong station of the Yangtze River. China Environ. Sci. 2015, 35, 3698–3706. [Google Scholar]
  59. Liu, S.M.; Li, L.W.; Zhang, G.L.; Liu, Z.; Yu, Z.G.; Ren, J.L. Impacts of human activities on nutrient transports in the Huanghe (Yellow River) estuary. J. Hydrol. 2012, 430, 103–110. [Google Scholar] [CrossRef]
  60. Lin, P.; Klunp, J.V.; Guo, L.D. Dynamics of dissolved and particulate phosphorus influenced by seasonal hypoxia in Green Bay, Lake Michigan. Sci. Total Environ. 2016, 541, 1070–1082. [Google Scholar] [CrossRef] [PubMed]
  61. Baker, D.B.; Confesor, R.; Ewing, D.E.; Johnson, L.T.; Kramer, J.W.; Merryfield, B.J. Phosphorus loading to Lake Erie from the Maumee, Sandusky and Cuyahoga rivers: The importance of bioavailability. J. Great Lakes Res. 2014, 40, 502–517. [Google Scholar] [CrossRef]
  62. Lin, P.; Chen, M.; Guo, L.D. Speciation and transformation of phosphorus and its mixing behavior in the Bay of St. Louis estuary in the northern Gulf of Mexico. Geochim. Cosmochim. Acta 2012, 87, 283–298. [Google Scholar] [CrossRef]
  63. Cai, Y.H.; Guo, L.D.; Douglas, T.A.; Whitledge, T.E. Seasonal variations in nutrient concentrations and speciation in the Chena River, Alaska. J. Geophys. Res. Biogeosciences 2008, 113, 1–11. [Google Scholar] [CrossRef] [Green Version]
  64. Vanderzee, C.; Roevros, N.; Chou, L. Phosphorus speciation, transformation and retention in the Scheldt estuary (Belgium/The Netherlands) from the freshwater tidal limits to the North Sea. Mar. Chem. 2007, 106, 76–91. [Google Scholar] [CrossRef]
  65. Lin, P.; Guo, L.D.; Chen, M.; Cai, Y.H. Distribution, partitioning and mixing behavior of phosphorus species in the Jiulong River estuary. Mar. Chem. 2013, 157, 93–105. [Google Scholar] [CrossRef]
  66. Zhang, Y.; Li, H.L.; Wang, X.J.; Zheng, C.M.; Wang, C.Y.; Xiao, K.; Wan, L.; Wang, X.S.; Jiang, X.W.; Guo, H.M. Estimation of submarine groundwater discharge and associated nutrient fluxes in eastern Laizhou Bay, China using 222Rn. J. Hydrol. 2016, 533, 103–113. [Google Scholar] [CrossRef]
  67. Bishop, J.M.; Glenn, C.R.; Amato, D.W.; Dulai, H. Effect of land use and groundwater flow path on submarine groundwater discharge nutrient flux. J. Hydrol. Reg. Stud. 2015, 11, 194–218. [Google Scholar] [CrossRef] [Green Version]
  68. Wu, J.; Tang, J.Y.; Li, Y.L.; Hong, Z.; Zhao, Z.Y. Restudy of constitution and distribution of inorganic nitrogen and the eutrophication in Daya Bay, Shenzhen. Mar. Environ. Sci. 2016, 35, 908–911. [Google Scholar]
  69. Thatoi, H.; Behera, B.C.; Mishra, R.R.; Dutta, S.K. Biodiversity and biotechnological potential of microorganisms from mangrove ecosystems: A review. Ann. Microbiol. 2013, 63, 1–19. [Google Scholar] [CrossRef]
  70. Dan, S.F.; Liu, S.M.; Udoh, E.C.; Ding, S. Nutrient biogeochemistry in the Cross River estuary system and adjacent Gulf of Guinea, South East Nigeria (West Africa). Cont. Shelf Res. 2019, 179, 1–17. [Google Scholar] [CrossRef]
  71. Liu, S.M.; Zhang, J.; Li, D.J. Phosphorus cycling in sediments of the Bohai and Yellow Seas. Estuar. Coast. Shelf Sci. 2004, 59, 209–218. [Google Scholar] [CrossRef]
  72. Liu, S.M.; Hong, G.H.; Zhang, J.; Ye, X.W.; Jiang, X.L. Nutrient budgets for large Chinese estuaries. Biogeosciences 2009, 6, 2245–2263. [Google Scholar] [CrossRef] [Green Version]
  73. Wang, J.J.; Beusen, A.H.W.; Liu, X.C.; Bouwman, A.F. Aquaculture production is a large, spatially concentrated source of nutrients in Chinese freshwater and coastal seas. Environ. Sci. Technol. 2020, 54, 1464–1474. [Google Scholar] [CrossRef]
  74. Wang, Q.; Li, H.; Zhang, Y.; Wang, X.; Xiao, K.; Zhang, X.; Dan, S.F. Submarine groundwater discharge and its implication for nutrient budgets in the western Bohai Bay, China. J. Environ. Radioact. 2020, 212, 106132. [Google Scholar] [CrossRef]
  75. Lan, W.L.; Peng, X.Y. Eutrophication status and its impact on phytoplankton biomass in the Maowei Sea. J. Guangxi Acad. Sci. 2011, 27, 109–112. [Google Scholar]
  76. Yang, B.; Fang, H.Y.; Zong, Q.P.; Zhang, C.X.; Li, S.P. Distribution characteristics of nutrients and eutrophication assessment in summer in Qinzhou Bay. Mar. Sci. Bull. 2012, 31, 640–645. [Google Scholar]
  77. Duan, S.; Liang, T.; Zhang, S.; Wang, L.; Zhang, X.; Chen, X. Seasonal changes in nitrogen and phosphorus transport in the lower Changjiang River before the construction of the Three Gorges Dam. Estuar. Coast. Shelf Sci. 2008, 79, 239–250. [Google Scholar] [CrossRef]
  78. Pan, K.; Wang, W.X. Trace metal contamination in estuarine and coastal environments in China. Sci. Total Environ. 2012, 421, 3–16. [Google Scholar] [CrossRef] [PubMed]
  79. Yan, X.L.; Zhai, W.D.; Hong, H.S.; Guo, W.D.; Huang, X. Distribution, fluxes and decadal changes of nutrients in the Jiulong River Estuary, Southwest Taiwan Strait. Chin. Sci. Bull. 2012, 57, 2307–2318. [Google Scholar] [CrossRef] [Green Version]
  80. Harding, L.W.; Adolf, J.E.; Mallonee, M.E.; Miller, W.D.; Gallegos, C.L.; Perry, E.S.; Johnson, J.M.; Seller, K.G.; Paerl, H.W. Climate effects on phytoplankton floral composition in Chesapeake Bay. Estuar. Coast. Shelf Sci. 2015, 162, 53–68. [Google Scholar] [CrossRef]
  81. Hagy, J.D.; Boynton, W.R.; Keefe, C.W.; Wood, K.V. Hypoxia in Chesapeake Bay, 1950–2001: Long-term change in relation to nutrient loading and river flow. Estuaries 2004, 27, 634–658. [Google Scholar] [CrossRef]
  82. McCoy, C.; Viso, R.; Peterson, R.N.; Libes, S.; Lewis, B.; Ledoux, J.; Voulgaris, G.; Smith, E.; Sanger, D. Radon as an indicator of limited cross-shelf mixing of submarine groundwater discharge along an open ocean beach in the South Atlantic Bight during observed hypoxia. Cont. Shelf Res. 2011, 31, 1306–1317. [Google Scholar] [CrossRef]
  83. Hu, C.; Muller-Karger, F.E.; Swarzenski, P.W. Hurricanes, submarine groundwater discharge, and Florida’s red tides. Geophys. Res. Lett. 2006, 33, L11601. [Google Scholar] [CrossRef]
  84. Lee, Y.W.; Kim, G.; Lim, W.; Hwang, D.W. A relationship between submarine groundwater borne nutrients traced by Ra isotopes and the intensity of dinoflagellate red-tides occurring in the southern sea of Korea. Limnol. Oceanogr. 2010, 55, 1–10. [Google Scholar] [CrossRef]
  85. Luo, X.; Jiao, J.J. Submarine groundwater discharge and nutrient loadings in Tolo Harbor, Hong Kong using multiple geotracer-based models, and their implications of red tide outbreaks. Water Res. 2016, 102, 11–31. [Google Scholar] [CrossRef]
  86. Townsend, A.R.; Howarth, R.W.; Bazzaz, F.A.; Booth, M.S.; Cleveland, C.C.; Collinge, S.K.; Dobson, A.P.; Epstein, P.R.; Holland, E.A.; Keeney, D.R.; et al. Human health effects of a changing global nitrogen cycle. Front. Ecol. Environ. 2003, 1, 240–246. [Google Scholar]
  87. Hwang, D.W.; Lee, Y.W.; Kim, G. Large submarine groundwater discharge and benthic eutrophication in Bangdu Bay on volcanic Jeju Island, Korea. Limnol. Oceanogr. 2005, 50, 1393–1403. [Google Scholar] [CrossRef]
  88. Galloway, J.N.; Townsend, A.R.; Erisman, J.W.; Bekunda, M.; Cai, Z.C.; Freney, J.R.; Martinelli, L.A.; Seitzinger, S.P.; Sutton, M.A. Transformation of the nitrogen cycle: Recent trends, questions, and potential solutions. Science 2008, 320, 889–892. [Google Scholar] [CrossRef] [PubMed] [Green Version]
  89. Slomp, C.P.; Van Cappellen, P. Nutrient inputs to the coastal ocean through submarine groundwater discharge: Controls and potential impact. J. Hydrol. 2004, 295, 64–86. [Google Scholar] [CrossRef] [Green Version]
  90. Justić, D.; Rabalais, N.N.; Turner, R.E.; Dortch, Q. Changes in nutrient structure of river-dominated coastal waters: Stoichiometric nutrient balance and its consequences. Estuar. Coast. Shelf Sci. 1995, 40, 339–356. [Google Scholar] [CrossRef]
  91. Hu, M.; Yang, Y.; Xu, C.; Harrison, P.J. Phosphate limitation of phytoplankton growth in the Changjiang Estuary. Acta Oceanol. Sin. 1990, 9, 405–411. [Google Scholar]
  92. Kahlert, M. C/N/P: Ratios of freshwater benthic algae. Arch. Hydrobiol. Spec. Issue Adv. Limnol. 1998, 51, 105–114. [Google Scholar]
  93. Ke, Z.X.; Tan, Y.H.; Huang, L.M.; Zhang, J.L.; Lian, S.M. Relationship between phytoplankton composition and environmental factors in the surface waters of southern South China Sea in early summer of 2009. Acta Oceanol. Sin. 2012, 31, 109–119. [Google Scholar] [CrossRef] [Green Version]
  94. Tilman, D.; Kilham, S.S.; Kilham, P. Phytoplankton community ecology: The role of limiting nutrients. Annu. Rev. Ecol. Syst. 1982, 13, 349–372. [Google Scholar] [CrossRef]
  95. Levine, S.N.; Schindler, D.W. Influence of nitrogen to phosphorus supply ratios and physicochemical conditions on cyanobacteria and phytoplankton species composition in the Experimental Lakes Area, Canada. Can. J. Fish. Aquat. Sci. 1999, 56, 451–466. [Google Scholar] [CrossRef]
Figure 1. Geographical locations of the Maowei Sea and monitoring stations.
Water 14 02584 g001
Figure 2. Seasonal nitrogen and phosphorus concentration and composition in the estuary of the Maowei Sea.
Water 14 02584 g002
Figure 3. Spatiotemporal flux and contribution patterns of TN and TP in the estuary of the Maowei Sea.
Water 14 02584 g003
Figure 4. Spatiotemporal distributions of TN and TP in the Maowei Sea in dry, wet and normal seasons.
Water 14 02584 g004
Figure 5. Seasonal variation in N/P in estuaries and seawater of the Maowei Sea.
Water 14 02584 g005
Figure 6. Spearman correlation coefficients of influencing factors on TN and TP concentrations in the Maowei Sea (n = 8). Note: * refers to correlations significant at p < 0.05 (two-tailed) and ** refers to correlations significant at p < 0.01 (two-tailed).
Water 14 02584 g006
Figure 7. Seasonal variations of TN and TP fluxes in the estuarine of the Maowei Sea. (a) The relationship between TN flux and monthly river flow. (b) The relationship between TP flux and monthly river flow.
Water 14 02584 g007
Table 1. Seasonal mean and range of TN, TDN, DIN, TP, TDP and DIP concentrations in the MWS (mg/L).
SpeciationParametersDry SeasonWet SeasonNormal Season
TNMean1.071.590.55
Range0.93–1.441.04–3.660.40–0.89
TDNMean1.001.060.46
Range0.85–1.240.62–1.540.31–0.75
DINMean0.740.630.43
Range0.64–0.890.35–1.220.31–0.73
TPMean0.1290.2030.073
Range0.089–0.1920.109–0.3570.061–0.091
TDPMean0.1030.1220.059
Range0.075–0.1720.074–0.2480.050–0.071
DIPMean0.1000.0360.030
Range0.073–0.1680.024–0.0630.020–0.053
Table 2. Comparison of TDN average concentration and composition in different rivers.
LocationSampling Timec(TDN)/(mg/L) c(DIN)/(mg/L)(DIN/TDN)/% References
Delaware River, USAJuly 19980.920.8188[56]
Bass River, USAJuly 19980.090.0442[56]
Savannah River, USAJuly 19980.600.4880[56]
Pocomoke River, USAAugust 19980.520.036[56]
Dagu River, ChinaJuly 20125.805.4694.2[57]
Licun River, ChinaJuly 201213.694.9536.2[57]
Loushan River, ChinaJuly 201221.646.8831.8[57]
Moshui River, ChinaJuly 201211.855.6647.7[57]
Datong station, Yangtze River, ChinaJuly 20132.702.3185.8[58]
Huanghe Outlet, ChinaJune–August 20093.683.1485.3[59]
Zhanjiang Bay Outlet, ChinaJuly 20185.140.8516.6[12]
Maolingjiang River, ChinaAugust 2018–May 20191.391.0474.6This study
Dalanjiang River, ChinaAugust 2018–May 20194.514.1090.9This study
Qinjiang River, ChinaAugust 2018–May 20192.332.1692.4This study
Table 3. Comparison of TDP average concentration and composition in different rivers.
LocationSampling Timec(TDP)/(mg/L) c(DIP)/(mg/L)(DIP/TDP)/% References
Fox River, USAJune, August 20160.0430.02557.1[60]
Maumee River, USAOctober 20090.1070.09387.0[61]
Jourdon River, USAOctober 20090.0060.00115.8[62]
Chena River, USAJuly 20050.0070.00693.3[63]
Scheldt River, NetherlandsApril 1995–January 19960.1240.02217.5[64]
Jiulongjiang River, ChinaMay 20100.0820.06578.9[65]
Dafengjiang River, ChinaDecember 20170.0500.03775.0[66]
Datong station, Yangtze River, ChinaSeptember 20060.0350.01852.7[67]
Huanghe Outlet, ChinaJuly 20090.0190.01472.1[59]
Zhanjiang Bay Outlet, ChinaJuly 20180.8870.62970.9[12]
Maolingjiang River, ChinaAugust 2018–May 20190.1270.11389.5This study
Dalanjiang River, ChinaAugust 2018–May 20190.1770.15788.7This study
Qinjiang River, ChinaAugust 2018–May 20190.0800.05770.8This study
Publisher’s Note: MDPI stays neutral with regard to jurisdictional claims in published maps and institutional affiliations.

