Article

Adsorption of Contaminants of Emerging Concern (CECs) with Varying Hydrophobicity on Macro- and Microplastic Polyvinyl Chloride, Polyethylene, and Polystyrene: Kinetics and Potential Mechanisms

1
Environmental Studies Program, Colgate University, Hamilton, NY 13346, USA
2
Department of Physics and Astronomy, Colgate University, Hamilton, NY 13346, USA
3
Department of Mathematics, Colgate University, Hamilton, NY 13346, USA
4
Department of Chemistry, Colgate University, Hamilton, NY 13346, USA
5
Department of Psychological and Brain Science, Colgate University, Hamilton, NY 13346, USA
6
Department of Civil Engineering and Construction Engineering Management, California State University, Long Beach, CA 90840, USA
7
Department of Public Health, California State University, Fullerton, CA 92834, USA
8
Department of Science and Engineering of Materials, Environment and Urban Planning-SIMAU, Marche Polytechnic University, 60131 Ancona, Italy
9
Department of Life and Environmental Sciences, Marche Polytechnic University, 60131 Ancona, Italy
*
Author to whom correspondence should be addressed.
Water 2022, 14(16), 2581; https://doi.org/10.3390/w14162581
Submission received: 19 July 2022 / Revised: 10 August 2022 / Accepted: 19 August 2022 / Published: 21 August 2022
(This article belongs to the Section Water Quality and Contamination)

Abstract

:
Microplastic particles are of concern to aquatic environments because their size enables them to be easily ingested by animals and they may become vectors of potentially harmful chemicals. This study focused on understanding the impact of plastic size and plastic types on adsorption and adsorption kinetics of commonly found contaminants of emerging concern (CECs). We exposed macro- and micro-sized polyethylene (PE), polystyrene (PS), and polyvinyl chloride (PVC) to six CECs: diclofenac (DCF), atenolol (ATN), ibuprofen (IBU), 4-acetamidophenol (ACE), bisphenol A (BPA), and 2-mercaptobenzothiazole (MBT). Our results showed that the pseudo-first order model described the adsorption kinetics better than the pseudo-second order model. The rate of adsorption ACE onto macro-PS was the fastest rate of adsorption for all CECs and microplastics evaluated. Generally, the mass fraction of CECs sorbed at equilibrium did not depend on the size of the plastic and chemical hydrophobicity. With a relatively low Kow among the CECs studied here, ACE had the most mass fraction sorbed onto all the plastics in this study. DCF was also consistently sorbed onto all the plastics. The mechanism van der Waals interaction may have dominated in all the adsorptions in this study, but π-π interaction could also be a major mechanism in the adsorption of DCF, IBP, and ACE. Fast adsorption of ATN, IBP, and ACE may occur during wastewater treatment, but slow adsorption may still continue in the wastewater effluent. Our study highlights an ecotoxicological concern for plastics being a vector of commonly found CECs that are not highly hydrophobic.

1. Introduction

Made of petrochemicals, plastics are synthetic polymers that are light in weight, durable, strong, and resistant to biodegradation [1]. Due to these versatile properties, the production of plastics has increased greatly during the past 50 years [2,3], now reaching over 368 million metric tons of plastic produced each year worldwide [4]. Approximately a third of the plastic resin produced is used for packaging materials made with polyethylene (PE), polypropylene (PP), polystyrene (PS), polyethylene terephthalate (PET), and polyvinyl chloride (PVC) [4,5]. Despite the extensive production of plastics, the recovery rate hovers just above 7%, which has led to the increase of plastic debris in aquatic environments [6]. Microplastics are commonly defined as plastic pieces with the largest dimension less than 5 mm [5,7,8,9] and are among several sizes of plastic debris that enter the aquatic environment. The relatively small size of microplastics results in many animals ingesting them, particularly aquatic organisms, raising concerns for their health [10,11,12,13,14]. In addition, microplastics may increase the potential of adverse effects in animals. Rubin and Zucker (2022) demonstrated that triclosan on polystyrene microbeads can increase microplastic toxicity to human cells by one order of magnitude [15]. And another study showed that microplastics exposed to the environment are more likely to translocate from the gastrointestinal tract into the tissues [16]. Although there is evidence showing that aged PS may sorb less polybrominated diphenyl ether [17], the aged PS may become less hydrophobic and bind to both polar and nonpolar chemicals, leading to increased contaminant mobility [18]. The fate and effects of microplastics in the ecosystem and their potential physical and chemical risks to animals through ingestion are currently being investigated by many researchers [9,12,19,20,21,22,23,24,25,26,27,28,29,30,31,32,33,34,35,36].
The most commonly found plastics in the marine environments are PE, PP, PVC, PET, and PS, each contributing 38%, 24%, 19%, 7%, and 6% to the total plastic production, respectively [5]. These plastics are readily detected in a variety of sizes and concentrations in different aquatic systems. Microplastics have been found in lakes, rivers, and oceans around the world, and the most commonly detected plastics are PE and PP [37,38,39,40,41,42,43]. Microplastics of PE, PS, PP, and PET have all been found in wastewaters, including in effluents discharged from water resource reclamation facilities (WRRFs) [44,45,46,47,48,49]. In the ocean, approximately 85% of the microplastic litter originates from polyester textiles [50], and PE, PS, PP, and PVC are also commonly found in marine environments, including in marine organisms [51,52]. Thus, because of their ubiquity in the environment, our study focused on three of the most common plastic types: PE, PVC, and PS.
Plastics may accumulate chemicals and pollutants [53] that are commonly found in the environment, such as contaminants of emerging concern (CECs; may include persistent organic pollutants, pharmaceuticals and personal care products, and endocrine-disrupting chemicals) [26,54]. These pollutants, when ingested by organisms, have the potential to desorb or leach out and transfer to the organisms’ tissues, leading to bioaccumulation of CECs, biomagnification of CECs, mortality, oxidative stress, etc. [14,22,24,55,56,57,58,59,60,61] However, few sorption studies focused on CECs that are relatively less hydrophobic but still commonly detected in the environment, such as antibiotics, 17α-ethinyl estradiol, carbamazepine, and sertraline (log Kow −1.37–5.51) [29,62,63,64,65,66,67]. Previous research mostly focused on highly hydrophobic chemicals that are easily sorbed onto plastics, such as polybrominated diphenyl ethers, phenanthrene, fluoranthene, pyrene, poly- or perfluorinated alkyl substances (log Kow 1.85–6.9) [17,25,27,28,34,51,52,68,69,70]. Furthermore, when wastewater enters the WRRFs, CECs and microplastics are both present, but because there are few studies that focus on their kinetics of adsorption [17,64,71], little information is available about the rate of CECs adsorption as wastewater moves through WRRFs and beyond. To understand the potential environmental effects from plastics containing CECs, we must have a better understanding of the interaction between CECs and plastics.
This study aims to address the need for how CECs with varying hydrophobicity interact with plastics. Acknowledging that CECs and microplastics are both present in wastewater effluent, six commonly detected CECs with varying hydrophobicity were selected in this study: diclofenac (DCF), atenolol (ATN), ibuprofen (IBU), 4-acetamidophenol (ACE), bisphenol A (BPA), and 2-mercaptobenzothiazole (MBT) [72,73]. Using the selected CECs, we seek to understand their adsorption and adsorption kinetic rates onto PVC, PE, and PS macroplastics (plastics larger than 5 mm) and microplastics. Moreover, we hypothesize that the relative quantity of CECs sorbed is less on the macroplastics than on the microplastics due to the lower specific surface area [69].

2. Materials and Methods

2.1. Materials

We conducted our experiment on three different types of common plastics: polyvinyl chloride (PVC), polystyrene (PS), and polyethylene (PE). For each type of plastic, we used two general sizes: macro- and microplastics (size details provided in the next paragraph). Here we define microplastics to be plastic particles with the largest dimension being less than 5 mm.
Macro-PVC shavings were obtained from schedule 40 PVC pressure pipe with a nominal inner diameter of 0.5 in (bulk density 0.95 g mL−1, apparent density 1.30 g mL−1). The shavings were cut using a lathe (Clausing-Metosa, Kalamazoo, MI, USA) set to a speed of 275 rpm. A high-speed steel (HSS) bit with a negative rake cut the full radius of the pipe while a longitudinal feed moved the bit at 0.002 inches per revolution along the pipe axis. The shavings were drawn by hand to keep them from coiling around the pipe. At most, only 2 inches of the pipe extended from the lathe chuck. The 0.002-inch thickness of the shavings was confirmed with a micrometer (Supplementary Materials Figure S1). For macro-PE samples, we used commercial packaging films cut into approximately 3 cm × 1 cm (Supplementary Materials Figure S2; bulk density 0.68 g mL−1, apparent density 0.97 g mL−1). For PS, we cut commercial disposable cold drink cups into approximately 3 cm × 1 cm (Supplementary Materials Figure S2). The micro-sized PVC particles (Supplementary Materials Figures S2 and S3; maximum 250 µm, unplasticized, product code CV316010; scanning electron microscope [SEM] measured 82–157 µm, averaged 178 ± 26 µm), PS (Supplementary Materials Figures S2 and S3; maximum 900 μm, density 6 g cm−3, product code ST316003; SEM measured 827–1085 µm, averaged 947 ± 87 µm; measured bulk density 0.95 g mL−1, apparent density 1.09 g mL−1), and PE (Supplementary Materials Figures S2 and S3; maximum 300 μm, bulk density 0.6 g cm−3, product code ET316031; SEM measured 210–712 µm, averaged 414 ± 102 µm) were purchased from Goodfellow (Coraopolis, PA, USA).
The solutions used in the adsorption experiment were made with Milli-Q water from the Millipore Direct-Q 5 (Millipore Sigma, Burlington, MA, USA; ZRQS6005Y) stored in a 9-L Fisher Scientific polypropylene rectangular carboy. The chemicals used for the standard and in the experiment included chemicals purchased from Acros Organics (Morris Plains, NJ, USA), diclofenac sodium 98% (CAS 15307-79-6), atenolol 98% (CAS 29122-68-7), ibuprofen 99% (CAS 15687-27-1), 4-acetamidophenol 98% (CAS 103-90-2), 2-mercaptobenzothiazole 98% (CAS 149-30-4); bisphenol A 97% (CAS 80-05-7), 4-n-nonylphenol 98+% (CAS 104-40-5), and methanol 99.8% (CAS 67-56-1) from Alfa Aesar (Heysham, Lancashire, England); bis(2-ethylhexyl)phthalate 99.9% (CAS 117-81-7) from SPEX CertiPrep; and anthracene-d10 (CAS 1719-06-8) from Sigma Aldrich (St. Louis, MO, USA).
For the pipette tips, we used 0.1–10 µL, 0.1–20 µL, and 5–300 µL SureOne™ Micropoint Pipette Tips and Eppendorf epT.I.P.S. of volume 50–1000 µL and 100–5000 µL. The 20-mL clear serum bottles for (chemical and solvent extract storage) and 100-mL amber serum bottles (for adsorption experiment; Supplementary Materials Figure S2; Wheaton™, Millville, NJ, USA) used in the experiment were capped with 20 mm gray butyl rubber stoppers (Supplementary Materials Figure S2; Thermo Scientific National) and crimped with 20-mm unlined aluminum tear-off seals (Wheaton™, Millville, NJ, USA). All experiment bottles were continuously stirred on the Thermo Scientific MaxQ SHKA2508 Dual Action Orbital Reciprocating Shaker. Sonication extraction was performed with the Fisher Scientific CPXH Series Heated Ultrasonic Cleaning Bath (Hampton, NH, USA). Weighing plastic particles was performed with the weighing paper (Fisherbrand, C/N 09-898-12A) and the Shimadzu AUX220 Analytical Balance. Our solid phase extraction (SPE) setup included Oasis HLB cartridge (6 cc/200 mg 30 μm, Waters Corporation, Milford, MA, USA) attached to Visiprep large volume samplers (Millipore Sigma) in a 24-port glass block vacuum manifold (Thermo Scientific, Waltham, MA, USA).

2.2. Gas Chromatography/Mass Spectrometry (GC/MS)

Sample aliquots were transferred into Thermo Scientific National 8–425 Screw Thread glass 1.5-mL GC vials and capped with 8-mm ivory Teflon/red rubber septa (Waltham, MA, USA).
We analyzed the samples with a Shimadzu gas chromatography-mass spectrometry (GC/MS, QP2010 SE; capillary column SH-Rxi™-5Sil MS, L 30 m, ID 0.25 mm, DF 0.25 um) in the selected ion mode (SIM; masses, limits of detection [LODs], and limits of quantitation [LOQs] are listed in Supplementary Materials Table S1), an AOC-20s autosampler, an AOC-20i auto injector (Columbia, MD, USA), and with column helium flow at 1.00 mL min−1. The injector was operated in splitless mode with glass liner (Shimadzu, P/N 221-48876-03) and HT septum (Shimadzu, P/N 221-48398-91). The temperature program was 50 °C held for 1 min; 50 to 150 °C at 50 °C min−1; 150 to 200 °C at 6 °C min−1; 200 to 280 °C at 16 °C min−1, held for 4 min; 280 to 290 °C at 10 °C min−1, held for 1 min. An injection volume of 1 μL was used for all analyses. The mass spectrometry was performed in selected ion mode with target ions separated into several groups determined by their retention times (Supplementary Materials Table S1). The ion source temperature was at 200 °C, the interface temperature was at 250 °C, and the detector voltage was 0.01 kV.

2.3. Adsorption Experimental Setup

The working solution used in this experiment contained a mix of 40.1 mg L1 DCF, 8.15 mg L−1 ATN, 18.38 mg L−1 IBU, 0.65 mg L−1 ACE, 3.65 mg L−1 BPA, and 10.34 mg L−1 MBT in Milli-Q water. The different concentration of the CECs was due to their solubility, and after preliminary experiments, adjusted according to the extraction procedures and GC/MS analysis. The solutions used in this study were not buffered because buffers can change the ionic strength, and a change of ionic strength appeared to alter the adsorption substantially for the interaction between CECs and plastics [17,64,74]. An aliquot of 100 mL of the working solution was transferred to triplicate 100-mL amber glass serum bottles (acid washed, heated at 500 °C for 2 h) for each sampling time point, then each serum bottle was capped with a gray butyl rubber cap. Triplicate controls contained only 100-mL working solution, and for the adsorption samples about 1 g of macro- and micro-PVC, PE, and PS was weighed and transferred to the amber serum bottles prior to the addition of the working solution. All experiments were performed at average room temperature of 20 °C for time points 0, 1, 2, 4, and 7 days. Each time point had triplicate bottles that were sacrificial at the time of sampling. All samples were continuously stirred on the shaker at about 180 rpm, except the Day 0 samples which immediately went through the extraction procedure. Preliminary experiments were performed to determine the time to reach equilibrium, and equilibrium was determined to be reached within 7 days for all selected CECs (Supplementary Materials Figures S4–S6).
The concentration of CECs in both the solution and the plastic was measured. To separate the macro-sized plastics from the solution for extraction, the solution was poured into a glass beaker or flask while retaining the macro-sized plastics in the amber serum bottle. The amber serum bottle was then rinsed at least three times with Milli-Q water (polypropylene squirt bottle), and each rinse was collected with the solution in the glass beaker or flask, and the combined solution was filtered through an SPE cartridge (conditioned with 10 mL hexane, 10 mL dichloromethane, 10 mL methanol, 5 mL Milli-Q water) at a rate ≤10 mL min−1. To separate the micro-sized plastics, the solution with the micro-sized plastics was vacuum filtered through a 0.45-µm glass microfiber filter (934-AH, diameter 47 mm, Whatman, MA, USA) and a glass filtration apparatus with a stainless-steel mesh (Millipore, Burlington, MA, USA) into a 1-l filtration flask, then the filtration flask and the apparatus were rinsed at least three times with Milli-Q water (polypropylene squirt bottle). The filtered solution and the rinse were collected in a glass beaker or flask and filtered through an SPE cartridge. The filtration flask and apparatus were rinsed with 70% ethanol at least three times in between samples to avoid cross-contaminations of microplastics or chemicals.
To recover the adsorbed chemicals on macro-sized plastics, 100-mL Milli-Q water was transferred into the amber serum bottles with the macro-sized plastics still in there, and the bottles were sonicated for 15 min at room temperature. The sonicated solution was separated from the macro-sized plastics with the same procedures as described above. The micro-sized plastics on the glass microfiber filter were transferred carefully into an Erlenmeyer flask, and any remaining micro-sized plastics on the filtration apparatus were carefully rinsed with Milli-Q water three times into the same Erlenmeyer flask. Then Milli-Q water was filled to the 100-mL mark and sealed with Parafilm (Bemis, Neenah, WI, USA) before the 15 min sonication. The same abovementioned micro-sized plastic separation procedures were followed for the sonicated solution. The solution and rinse were filtered through an SPE cartridge.
The SPE cartridges were dried for at least an hour before elution. The chemicals were eluted from each SPE cartridge with 10 mL acetone:dichloromethane (1:1 v/v) followed by 10 mL hexane:dichloromethane (1:1 v/v) and stored in a 20-mL clear serum bottle capped with a gray butyl rubber cap and aluminum seal. The extracts then went through evaporation under a gentle nitrogen gas stream until dry and were reconstituted with 5 mL of ethyl acetate. An aliquot of 500 µL of each extract was transferred to a GC vial with 10 μL of 200 mg L−1 anthracene-d10 added as internal standard [75]. The extraction recovery for each chemical using this extraction procedure in this study is listed in Supplementary Materials Table S2.

2.4. CECs Concentration Calculation, Kinetic Modeling, and Statistical Analysis

The concentration obtained from GC/MS of a liquid sample was multiplied by the concentrating factor of 20 (original 100 mL concentrated to final 5 mL) to calculate for the original concentration in the original solution, reported as ppm w/v in Supplementary Materials figures. The concentration obtained from a plastic sample was first multiplied by the volume of the eluent extract of 5 mL and divided by the original mass of the plastic, reported as ppm w/w in Supplementary Materials figures.
Where possible, pseudo-first order was assumed for the adsorption of CECs onto plastics using the following model for fitting
ln ( 1 m m 0 ) = k 1 t
where m is the mass of a specific CEC retained by a plastic, m 0 is the total mass of the CEC at each sampling time point, t is the sampling time point in d, and k 1 is the pseudo-first order rate constant in d−1. Then the chi-squared test was performed on the fit and the data to determine the significance of the fit using the pseudo first-order model
X 2 = i = 1 j ( x i m i ) 2 m i
where X 2 is chi-squared value that is to be compared to a chi-squared distribution for a specific degree of freedom, j , of the dataset, x i is the i-th data point in the dataset, and m i is the i-th equivalent point predicted by the model. We also performed the same analysis using the pseudo-second order model
1 m m 0 + 1 m 0 = k 2 t
where k 2 is the pseudo-second order rate constant in μg−1 d−1.
Since we found that the amber glass serum bottles could sorb some of the CECs, we also performed the Student’s t-test to determine how significantly different the CEC concentration detected in the plastics was from that detected in the controls, thus differentiating the adsorption due to the glass serum bottle and due to the plastics. We decided to continue using glass serum bottles because usually adsorption studies on plastics are conducted in glass containers, and only few reported using PP tubes. Moreover, we found that chemicals may also sorb onto PP (see Section 3.5). Therefore, we decided to address the glass sorption with statistical analysis.
The goal of the study was on the kinetics of adsorption, however, as mentioned above, since several preliminary studies were performed at different CECs concentrations to determine the time to reach equilibrium (Supplementary Materials Figures S4–S6), we were able to calculate for the Freundlich constant K F for DCF and ATN on PE and PS according to the equation
q e = K F C e 1 n
where q e is the equilibrium concentration on the adsorbent in mg kg−1, K F is the Freundlich isotherm constant in Ln mg1−n kg−1, C e is the equilibrium concentration in the solution in mg L−1, and n is the Freundlich exponential constant. Both q e and C e were monitored throughout the experimental period as mentioned above. The Freundlich constant K F determined in this study was compared to values available in the literature. We opted for Freundlich isotherm instead of Langmuir due to one of the assumptions of Langmuir being single-layer adsorption, which may not apply in possible π-π interaction in PS.

2.5. Material Characterization: Specific Surface Area and Pore Size Distribution

Specific surface area, pore volume, and average pore diameter were measured using previously established methods on PVC, PE, and PS (nitrogen adsorption; 7-point Brunauer, Emmett, and Teller [BET]; 40-point isotherm; Micromeritics TriStar II 3020; measured by Particle Technology Labs, Downers Grove, IL, USA) [34,69,76,77,78,79]. However, macro-PE, macro-PVC, and micro-PS did not adsorb nitrogen, therefore mercury intrusion porosimetry was performed on them instead (Micromeritics Autopore V 9620; measured by Particle Technology Labs, Downers Grove, IL, USA) (Supplementary Materials Table S3). The two sets of data from the nitrogen adsorption method and mercury porosimetry method are similar but not comparable because the nitrogen adsorption method is more suitable for pore size 1.7 nm to 300 nm, whereas the mercury porosimetry method is more suitable for larger pores (4 nm to 200 µm). Thus, two separate analyses resulted from the two data sets.

3. Results and Discussion

3.1. Control

The results from the controls indicated that there were some CECs retained on the glass serum bottles after rinsing and replacing the original CECs solution with Milli-Q water. The glass serum bottles consistently retained some DCF (0.02–0.9%), ATN (36–53%), and IBP (3–7%) (Figure 1; Supplementary Materials Figures S7, S9 and S10). Sorption of ATN and IBP on glass was previously reported by Magadini et al. (2020) [63]. In particular, ATN was unexpectedly retained because of its high solubility in water and low Kow (Table 1). Sorption of these chemicals was likely due to a weak force such as van der Waals due to the elimination of other potential mechanisms.
To understand the ATN retention on glass serum bottles, additional experiments were performed with similar setup but only with ATN in the solution for 24 h. The results showed that ATN was immediately retained by the glass bottle (Supplementary Materials Figure S8), just as the controls showed. The glass serum bottles retained 49–51% of the ATN upon exposure until sonication (extraction recovery efficiency of 97–104% of total ATN, thus sonication and SPE were effective at extracting ATN), similar to the control experiment with mixed CECs retaining 36–53% ATN on the glass. These results suggest the importance of considering CECs retained on the experiment containers [34,74] because often plastic adsorption experiments only monitored the change of chemical concentration in solution, and then the mass sorbed on plastics was indirectly calculated [17,28,29,64,66,69,80,81,82]. However, when substantial adsorption occurs on the containers, indirect mass calculation may erroneously attribute mass retention solely to the plastics.

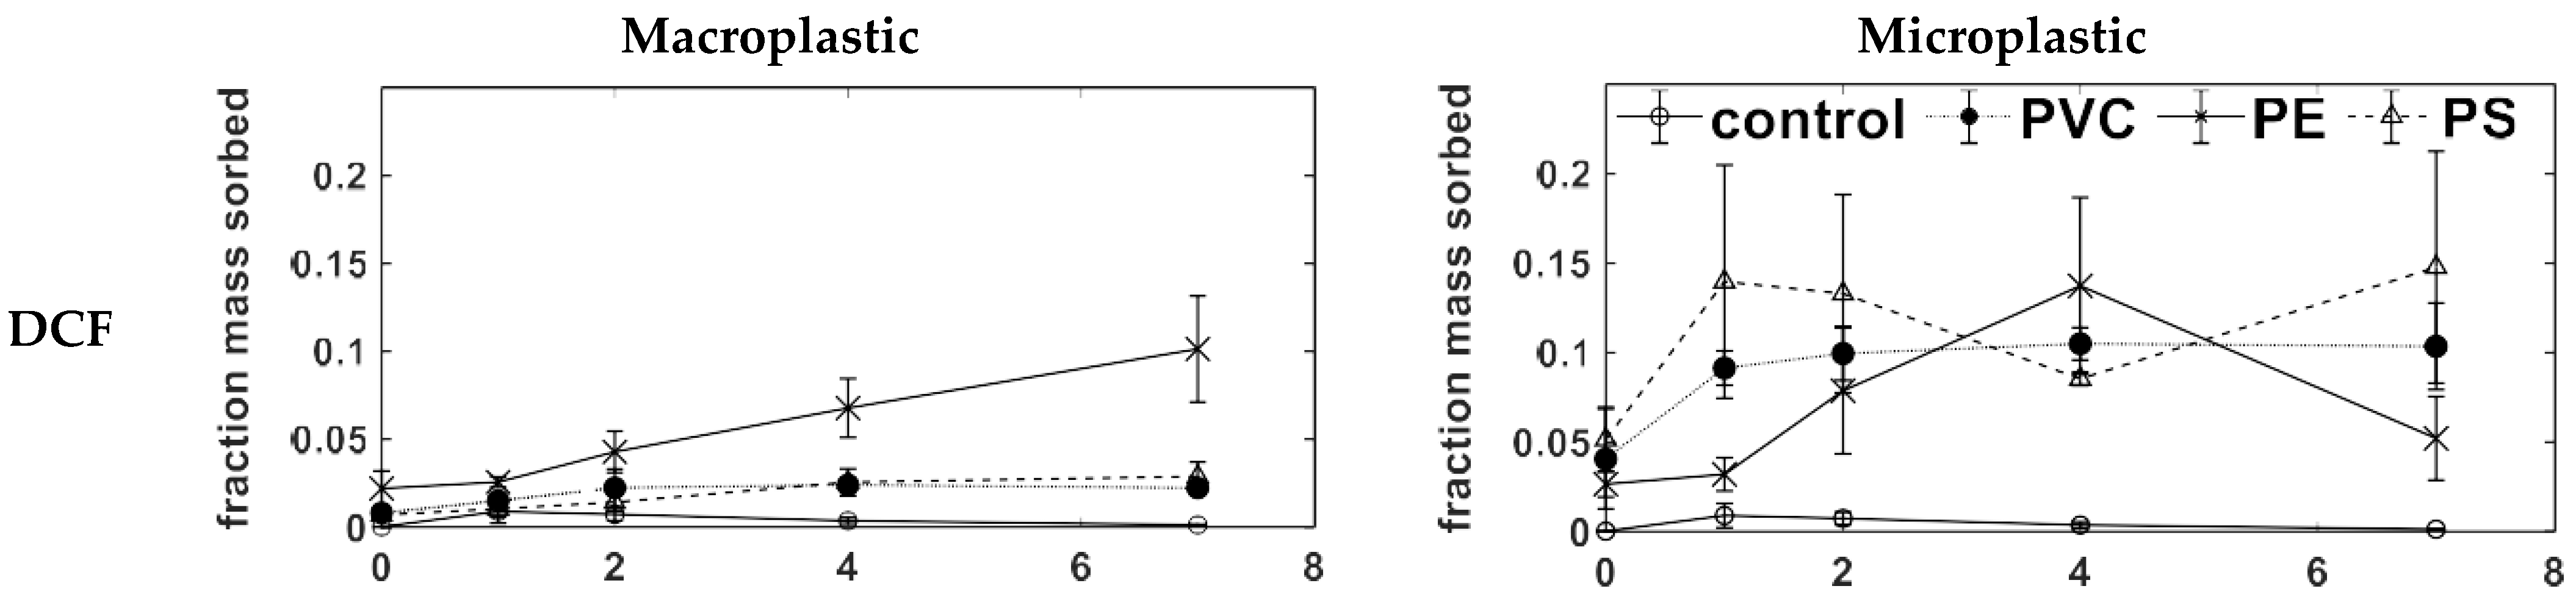
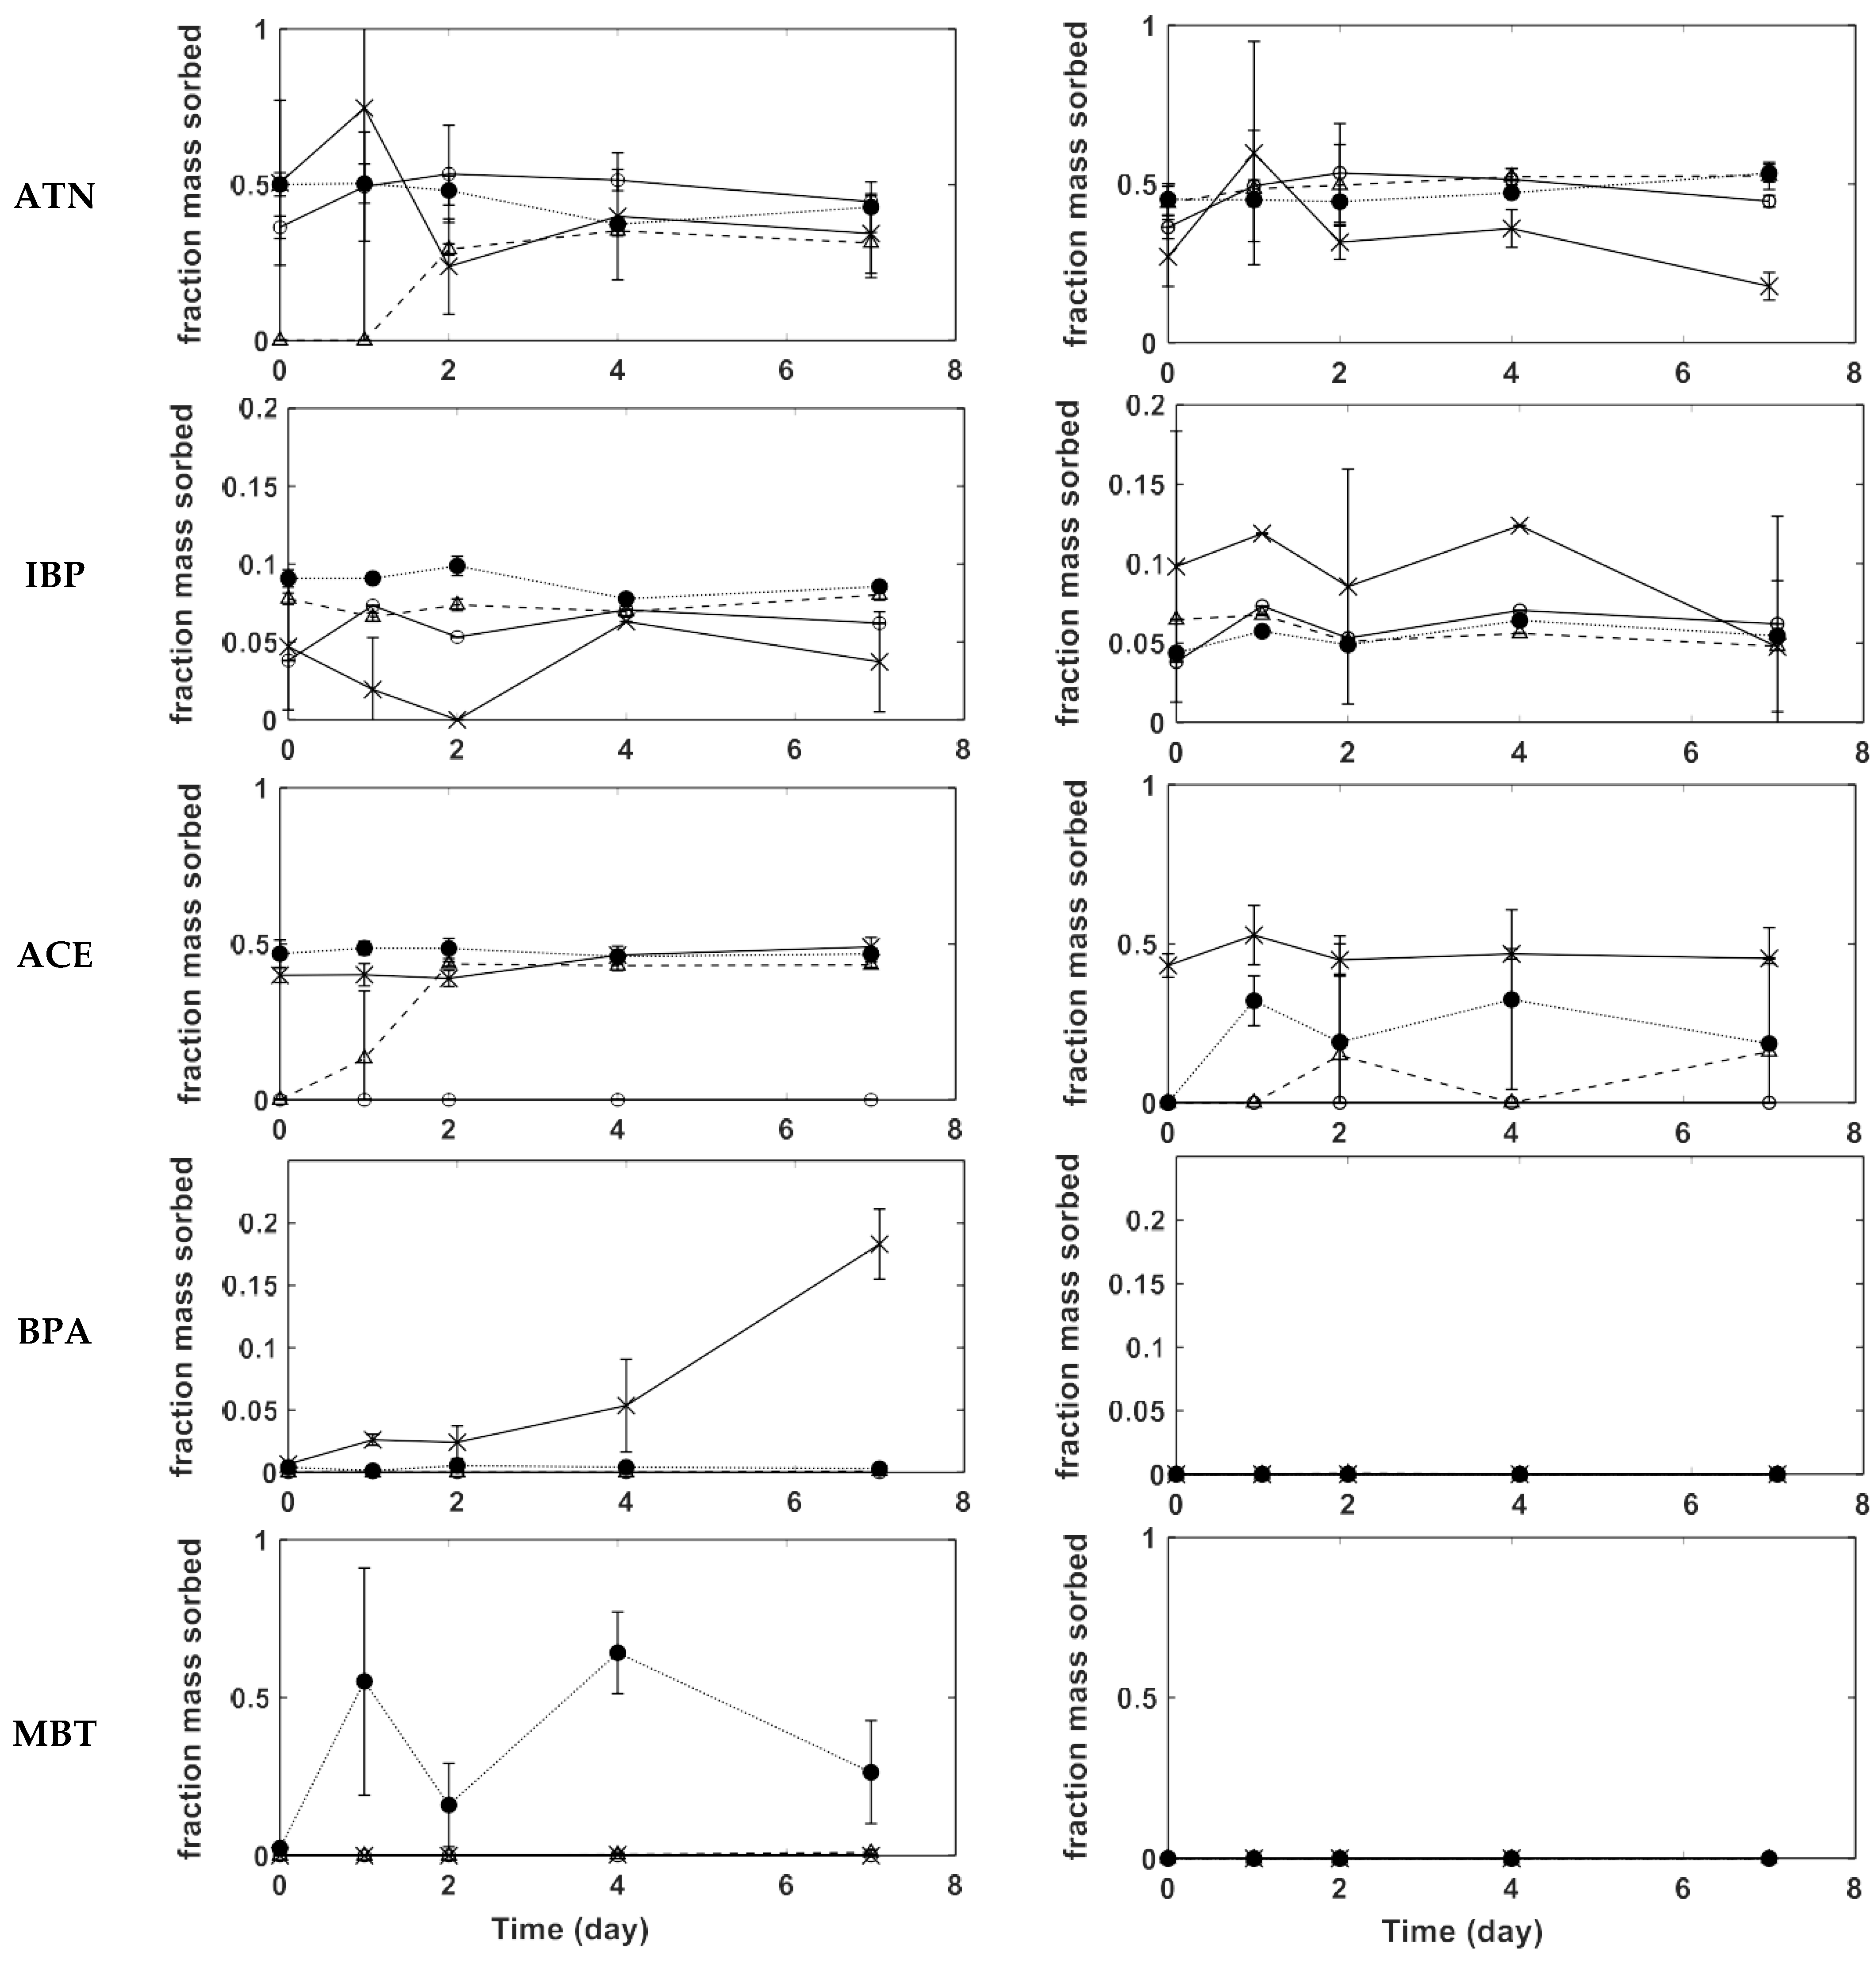
3.2. CECs Adsorption on PVC

The results showed that macro-PVC was able to retain a fraction of each CEC evaluated (Figure 1; Supplementary Materials Figure S7). Although ATN was detected on the macro-PVC, the method of extracting the CECs from macro-PVC (leaving the plastics inside the glass serum bottle during extraction) was unable to distinguish whether ATN was retained by glass or macro-PVC. Given the consistent concentration and similar retention found in the macro-PVC extract (37–50%) and in the control, the recovered ATN likely came from the glass. The IBP levels detected from the macro-PVC extracts (8–10%) were significantly different from the levels in the controls (t-test p < 0.05), thus some IBP retained may be attributed to macro-PVC. Due to the concern for the large amount of plastic additives in PVC, the same sonication extraction was performed on macro-PVC in Milli-Q water, and we found that the plasticizers selected for this study were all below detection (Supplementary Materials Table S4). Therefore, the BPA and MBT (both common plastic additives) found on the macro-PVC were transferred from the solution to the macro-PVC.
All CECs but BPA and MBT were adsorbed onto micro-PVC. Although IBP had a consistent concentration and similar recovery from the micro-PVC (4–6%, respectively) as the control serum bottle, due to the extraction setup (separating the micro-sized plastics from the amber serum bottle before sonication extraction), IBP was determined to be adsorbed onto micro-PVC instead of from the serum bottle (Supplementary Materials Figure S7). Similarly, ATN demonstrated comparable recovery with the control, but the source of ATN was attributed to micro-PVC due to the extraction procedure. Additionally, there was a constant increase of ATN recovered over 7 days (Table 1; Figure 1; Supplementary Materials Figure S7), indicating adsorption of ATN by micro-PVC instead of by the serum bottle.
The retention of DCF, IBP, BPA MBT, ACE by macro-PVC was immediate or the equilibrium was reached quickly, leading to most of their kinetic rate constants either unable to be determined or not significant (Table 1). The results from micro-PVC showed that the adsorption equilibrium of DCF and ACE was also reached quickly (Figure 1; Supplementary Materials Figure S7). Although DCF, IBP, BPA, MBT, ACE, and ATN have very different log Kow values [83] (Table 1), suggestive of different affinity to organic material, the percentage of mass transfer from the solution to macro- and micro-PVC seem to differ from the hydrophobicity trend since there was more mass fraction of ACE (log Kow 0.46) than DCF (log Kow 4.51) retained by macro- and micro-PVC (Figure 1; Supplementary Materials Figure S7). The results also showed that, compared to macro-PVC, micro-PVC retained on average five times more DCF than macro-PVC did (Figure 1; Supplementary Materials Figure S7; both macro- and micro-PVC were completely submerged in solution, Supplementary Materials Figure S2). The higher transfer of DCF from the solution to micro-PVC might be due to the smaller size and the higher specific surface area of the micro-PVC compared to macro-PVC, however, this did not apply to ACE. Micro-PVC retained less than half (average 43%) of the ACE retained by macro-PVC (Figure 1; Supplementary Materials Figure S7).

3.3. CECs Adsorption on PE

The results of CECs adsorption on macro-PE showed that five (DCF, ATN, IBP, ACE, BPA) of the six CECs were detected consistently (Figure 1; Supplementary Materials Figure S9). Similar to the previously stated reasons (macro-sized plastic extraction procedure, consistent concentrations, similar retention as in controls), ATN and IBP were likely retained by glass instead of by macro-PE. Hydrophobicity was also a not a good predictor of the mass fraction of DCF (log Kow 4.51), ACE (log Kow 0.46), and BPA (log Kow 3.32) retained on macro-PE, with the mass fraction of ACE being retained more by macro-PE despite a relatively low Kow (Figure 1; Supplementary Materials Figure S9).
Four (DCF, ATN, IBP, ACE) of the six CECs were detected from micro-PE extracts (Figure 1; Supplementary Materials Figure S9). Although the amount of ATN detected was similar to that of control, it was extracted from the micro-PE due to the micro-sized plastic extraction procedure. Hydrophobicity was again not a good indicator of mass fraction retention, with the mass fraction of ACE being detected higher on micro-PE than DCF (Table 1; Figure 1; Supplementary Materials Figure S9). In addition to the extraction procedure, the consistent concentration of IBP and its higher mass fraction recovered (5–12%) on micro-PE indicates that IBP was retained by micro-PE, rather than by the glass serum bottle, and its adsorption equilibrium was reached very quickly (Figure 1, Supplementary Materials Figure S9). The adsorption equilibrium also was achieved quickly by ACE (Figure 1; Supplementary Materials Figure S9).
Macro-PE retained 1.9 times more mass fraction of DCF than micro-PE at day 7. The difference of mass fraction transfer between the macro- and micro-PE could be due to differences in submersion of the plastic (Supplementary Materials Figure S2). While most of the surface of the macro-PE was submerged in water, micro-PE floated on the water surface aggregated, even while being shaken on the shaker. In contrast, the mass fraction of ACE detected on macro- and micro-PE was similar, but since micro-PE was mostly floating on the surface, we cannot determine for certain whether the surface area was a factor that impacted the adsorption of ACE.

3.4. Adsorption on PS

We detected all of the six CECs in the macro-PS extracts. However, though its pseudo-first order rate constant was significant, IBP was likely transferred from the solution to glass rather than to macro-PS because the rate constant was lower than that from the glass (Table 1) and also because of the same reasons stated above (macro-sized plastic extraction procedure, consistent concentrations, similar retention as in controls; Figure 1; Supplementary Materials Figure S10). The t-test showed that ATN extract from macro-PS was significantly different from the controls (p < 0.05), but since the macro-PS extract on average had less ATN (0–35%) than would be expected from the glass bottle (Figure 1; Supplementary Materials Figure S10), we could not definitively determine whether ATN was retained on the macro-PS. The total adsorption of MBT and BPA was low (mass fraction < 0.01) and occurred slowly, they were only detected toward the end of the monitoring period (days 4 and 7), while ACE reached equilibrium relatively quickly within the first 2 days (Figure 1; Supplementary Materials Figure S10). Both BPA and ACE had a significant pseudo-first order rate constant (Table 1).
All six CECs were detected in micro-PS extracts, with ATN and IBP detected in the micro-PS extracts attributed to only micro-PS rather than to the glass bottle retention (micro-sized plastic extraction procedure, consistent concentrations; Figure 1; Supplementary Materials Figure S10). Although ACE was detected, there was no consistent detection throughout the experimental period, suggesting if ACE was sorbed onto micro-PS, it was mostly below detection (Figure 1; Supplementary Materials Figure S10). A consistent detection and similar mass fraction of DCF on micro-PS after day 0 indicates that DCF reached equilibrium quickly on micro-PS (Figure 1; Supplementary Materials Figure S10).
Micro-PS retained about five times more DCF mass fraction than macro-PS on day 7 (Figure 1; Supplementary Materials Figure S10). This could be attributed to the higher specific surface area of the micro-PS, but micro-PS did not retain more or consistent detectable ACE than macro-PS. Unlike micro-PE, while micro-PS beads floated on the surface, shaking allowed most beads to circulate and submerge in the solution (Supplementary Materials Figure S2), thus, surface area in this case was not a confounding factor. Although DCF has the highest Kow value and its mass fraction was retained the most by micro-PS, ACE was the highest mass fraction retained by macro-PS, again not consistent with the hydrophobicity trend.

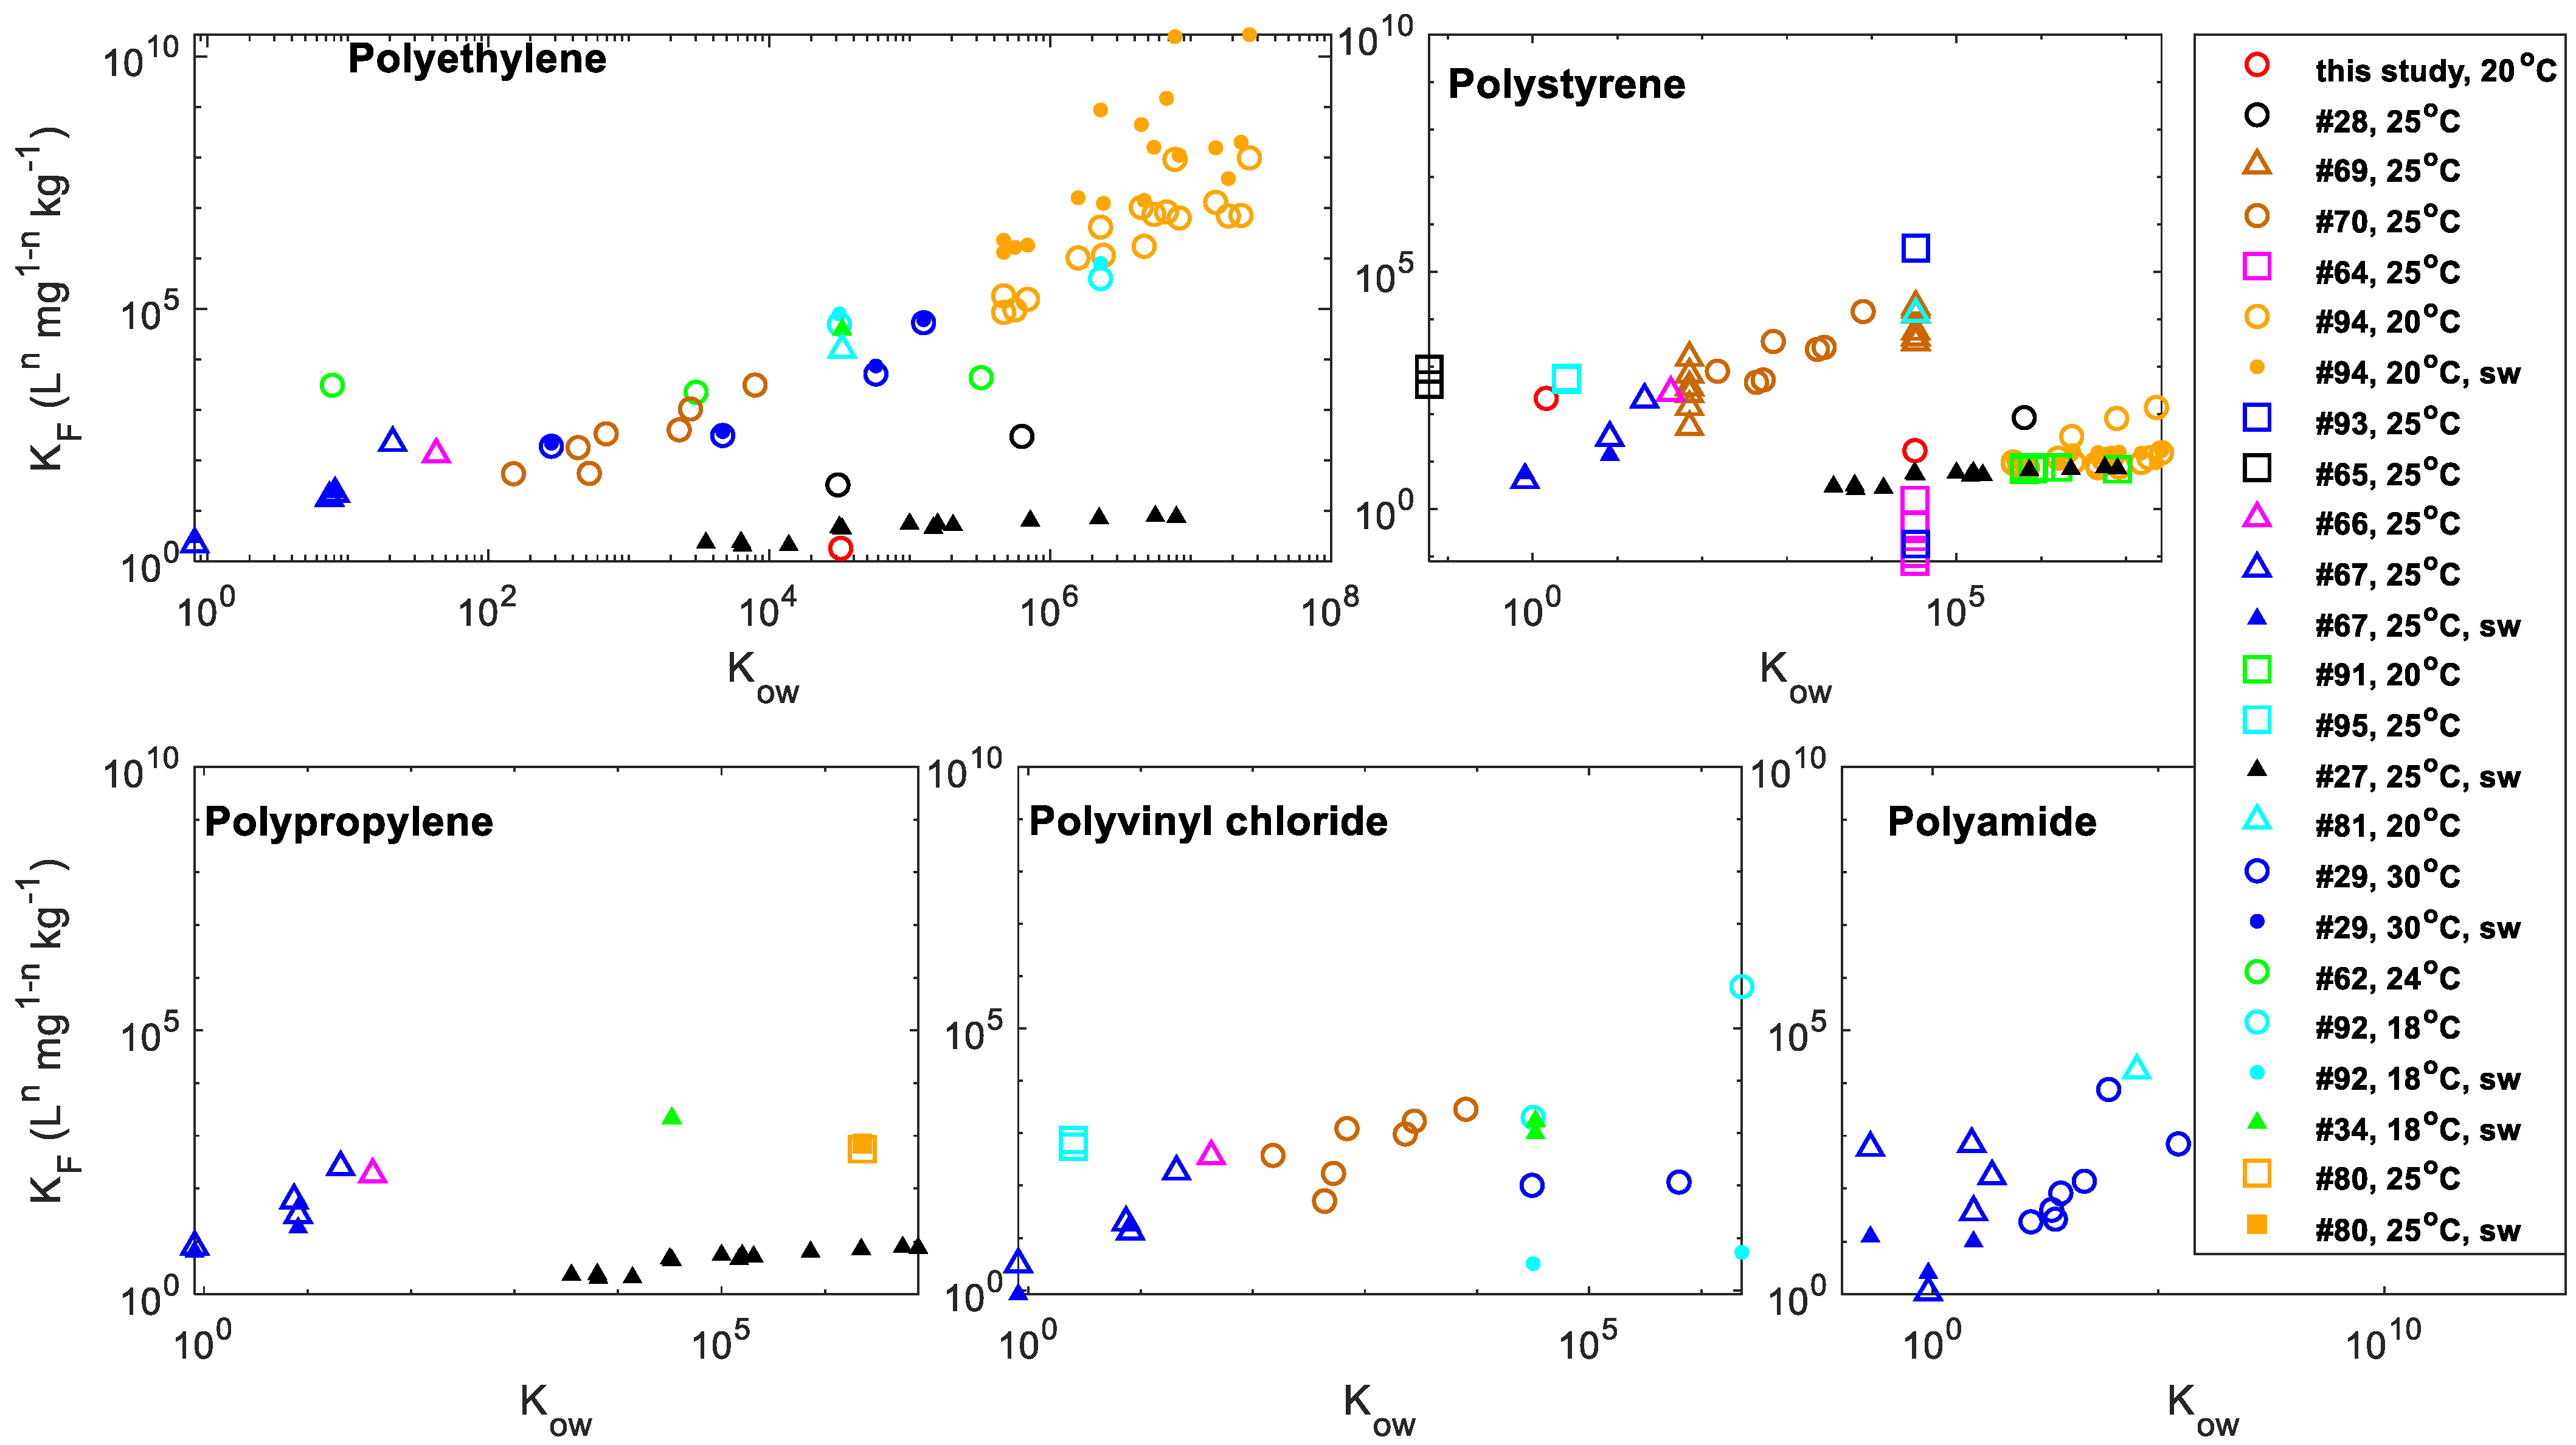
3.5. Kinetics and Adsorption Mechanisms

The pseudo-first order model did not always provide a good fit for all the adsorption of CECs on plastics (Table 1; Supplementary Materials Figure S11) with only ACE and BPA on macro-PS giving a significant fit (p < 0.001). Of the two, ACE had the fastest adsorption rate of 0.0775 d−1. Pseudo-second order kinetic model has been used for adsorption on PS [17,64], and it has been suggested that DCF adsorption on PS follows the pseudo-second order kinetics [64]. However, when we attempted to fit the data with pseudo-second order kinetics, only ACE and ATN on micro-PE had a positive rate constant (g µg−1 d−1) (Supplementary Materials Table S5; Supplementary Materials Figure S12). Additionally, using the chi-squared test to determine the significance of the pseudo-second order fit, none of the fit was significant at p of 0.05. Therefore, pseudo-first order model did not provide a good fit, but it did better than the pseudo-second order model.
We examined the potential mechanisms from the perspective of chemical hydrophobicity and from the plastic surface properties. Although the plastic sizes were not the same within same size category, (i.e., macro- or microplastics in this study), we measured specific surface area and pore volume using the nitrogen adsorption BET method and mercury intrusion porosimetry (Supplementary Materials Table S3) to aid our analysis (Supplementary Materials Figure S13). Since the nitrogen adsorption BET method only worked for micro-PVC, micro-PE, and macro-PS, the alternate method, mercury intrusion, was used for the other plastics. However, we recognize that these methods may not be available to many researchers, and our measurements may not be comparable to other studies that opted to use other methods of measurement, such as calculating the surface area based on assumptions (the geometry of the plastic particles based on observations and theory, e.g., scalene ellipsoid, Legendre ellipse with ellipticity and roundness correction, cylinder) [52,63,79,84,85] and relying on manufactured dimensions and microscopy measurements [79,86]. Chinaglia et al. (2018) have found that the surface area measured by the BET method was 3–5 times higher than the calculated surface area due to the visually invisible small pores [79]. Even with the BET method measurements, it may still underestimate the true surface area and porosity of the material due to capillary condensation [70,87]. We recognize that different methods may produce substantially different measurements due to the barriers of instrument access [79] and cost.
The results showed that adsorption of the selected CECs did not follow their Kow or correspond to plastic size. Only two CECs selected for this study were consistently detected in the plastic extracts: DCF and ACE. However, ACE was immediately retained by macro-PVC, macro-PE, and micro-PE and reached equilibrium (Figure 1), though it does not have a very high log Kow (0.46). This suggests that there were other more dominant adsorption mechanisms for ACE adsorption onto plastics than size (i.e., specific surface area, discussion below) and hydrophobicity. The hydraulic retention time for an activated sludge WRRF is typically within 24 h [88], thus, the CECs that showed immediate affinity to the micro-sized plastics (i.e., ATN, IBP, and ACE) may be more important before entering or during the wastewater treatment. However, these CECs are also frequently detected in the wastewater effluent along with micro-sized plastics, giving them more time to interact with each other. Therefore, even a slow rate of adsorption (e.g., DCF onto micro-PE at 0.0071 d−1) may become important in the subsequent aquatic environment.
The order of relative DCF mass fraction sorbed from the highest to the lowest on day 7 (reaching equilibrium; Supplementary Materials Figures S4–S6) is micro-PS > micro-PVC > macro-PE > micro-PE > macro-PS > macro-PVC, and the order for ACE mass fraction sorbed is macro-PE > macro-PVC > micro-PE > macro-PS > micro-PVC > micro-PS (Figure 1; Supplementary Materials Figures S7, S9 and S10). Overall, the results were not completely consistent with our hypothesis that micro-sized plastics sorb more CECs than macro-sized plastics due to their higher surface area, and also other adsorption mechanisms may be more dominant.
There are several possible adsorption mechanisms outlined by Yu et al. (2021) [26]. Based on the plastic types and the structure of the CECs, adsorption mechanisms including cation ligand, electrostatic, and hydrogen bonding interactions were not likely involved. The adsorption of DCF by plastics generally increased with specific surface area (Supplementary Materials Figure S13; micro-PE had a high adsorbed concentration despite aggregating and floating on the surface and despite a specific surface area of only 0.07 m2 g−1), suggesting adsorption mechanisms generally more consistent with hydrophobic and van der Waals interactions. Also, based on the chemical structure (relatively flat and two rings), it is likely that π-π interaction was also a major mechanism for DCF adsorption onto PS. It has been suggested that DCF sorption onto PS is due to chemisorption [64]. For IBP and ACE, in addition to van der Waals interaction, π-π interaction was also very likely with PS, though their chemical structures suggest that their π-π interaction would not be as strong as in DCF. For the remaining chemicals, ATN, MBT, and BPA, π-π interaction was potentially possible with PS, but their chemical structures may not provide a stronger π-π interaction than in DCF, IBP, and ACE. Therefore, most likely van der Waals interaction was the dominant adsorption mechanism in ATN, MBT, and BPA (Supplementary Materials Figure S14). Finally, there is also a possibility for pore-filling interaction to occur, however, one way to assess the pore-filling interaction is to examine the curve of adsorption potential density vs. adsorption volume [89], and the experimental setup in this study was not suitable to determine whether pore-filling was occurring. Still, when equilibrium adsorption concentration was plotted against pore volume and porosity (Supplementary Materials Figure S13), higher adsorption generally did not correspond to higher porosity. Thus, pore-filling interaction was not a likely mechanism in our experiment.
Li et al. (2022) found higher DCF sorption capacity with increasing PS size [64]. Wang et al. (2019) also explored the size effect on sorption and found some irregularity between the size of the PS and the sorption of phenanthrene and nitrobenzene due to the aggregation of 50-nm PS particles [69]. The low dispersal of these particles and their aggregation then limited the chemicals’ access to sorption sites. While acknowledging the role that hydrophobicity played in sorption, they also found that other mechanisms such as π-π interaction may be also involved in the sorption of phenanthrene and nitrobenzene on PS. Hüffer and Hofmann (2016) found similar lack of correlation between the size of microplastics and sorption [70], and since they found the aromatic phenyl groups had higher sorption onto larger PS particles than smaller PE and PVC particles, they concluded that it was due to strong π-π interactions between PS and aromatic organic compounds [70,90]. In addition, Liu et al. (2016) provided evidence that π-π interaction and the chemical structure (planar vs. nonplanar structure) may be contributing to the sorption difference observed in polycyclic aromatic hydrocarbons [91]. However, some studies focused on hydrophobicity as a way to predict sorption of chemicals, particularly polycyclic aromatic hydrocarbons, onto plastics [27,70]. For example, Hüffer and Hofmann (2016) developed mathematical formulae modeling sorption based on hydrophobicity [70]. These laboratory experiments may not translate directly to environmental situations since biofilms may form on the surface of the plastics. Magadini et al. (2020) found that virgin plastics after 28 days of deployment in the waterways had similar surface area-based sorption coefficients, meaning surface area was the predominant factor of sorption in environmental conditions [63].
Our study indicated that even if the organic chemicals have a low log Kow value (for example, ACE), their mass fraction partition could be higher on plastics than the chemicals with a higher log Kow value (for example, DCF). This suggests that CECs commonly found in the aquatic environment and in the wastewater may interact with plastics commonly found in the same environment, and their interaction may not depend entirely on the hydrophobicity of the CECs [63], and their relevance may still be very high, contrary to the conclusion of Seidenstick et al. (2018) that polar chemicals may not have much relevance for plastics in the environment [81]. Since higher KF means more adsorbate on the adsorbent at equilibrium, in theory, a higher KF should correspond to a higher Kow consistently. To demonstrate the wide range of sorption variations on plastics when only considering log Kow, we plotted values of the Freundlich isotherm constant KF obtained from the scientific literature in Figure 2 [91,92,93,94,95] (the constant n is calculated to be close to 1 or assumed to be 1 in most studies, though n is not always calculated to be 1; rubber-like polymers such as PE have n values of about 1 and glass-like polymers such as PS have n values less than 0.85 [70]). Currently, plastic adsorption studies have mostly focused on hydrophobic chemicals and on polycyclic aromatic hydrocarbons (Figure 2) [25,96], but commonly found CECs in the aquatic environment and in the wastewater have a wide range of hydrophobicity. An overview of the literature revealed that most of the adsorption studies are focused on PE and PS, but there is still not a lot of adsorption information on PVC, PP, and polyamide (Figure 2) given the ubiquity of these plastics in the aquatic environment. While we acknowledge that sorption competition may have occurred in our experimental setup, our study addressed plastic interactions with mixed CECs, as is the condition in the aquatic and wastewater environment.

4. Conclusions

The results of this study highlight an ecotoxicological concern for the presence of microplastics in our environment. Fast adsorption of ATN, IBP, and ACE may be more important for adsorption during wastewater treatment, but slow kinetic rates suggests possible adsorption may occur after treated wastewater is discharged where both CECs and microplastic are still present. While the hydrophobicity of the chemical and the size of the plastic generally predict adsorption of the chemical, they may not always be reliable indicators of adsorption. In our study, we found that chemicals with low hydrophobicity may still be adsorbed onto a variety of plastics. The fastest adsorption rate was from ACE on macro-PS (0.0775 d−1), while the only significant pseudo-first order fits were from ACE and BPA on macro-PS. Pseudo-second order model did not improve the fit of our data. Both ACE and DCF have consistently adsorbed onto all plastic types studied here, with the mass fraction of ACE adsorbed being the highest among the CECs studied, despite DCF having a higher log Kow value.
Our study suggests that future adsorption experiments should monitor both the adsorbed concentration of chemicals and the concentration of chemicals remaining in solution. Using glass bottles to avoid contact with other plastics (and hence avoid leaching of plastic additives to the experiment solution), our results showed that glass bottles may retain substantial mass fractions of ATN and IBP, and DCF to a smaller extent. Thus, when the containers can act as a reservoir for the chemicals in the experiment, indirect adsorption calculation by monitoring only the concentration change in solution may erroneously lead to attributing mass retention solely to the plastic, thus an incorrect interpretation of the plastic adsorption capacity. More adsorption studies should also seek to understand the interactions between different plastics and chemicals with a wider range of hydrophobicity in different water matrices [52,63,65,82], such as in environmental waters and treated wastewater effluent.

Supplementary Materials

The following supporting information can be downloaded at: https://www.mdpi.com/article/10.3390/w14162581/s1, Table S1: Analyte masses monitored in gas chromatography-mass spectrometry (GC/MS) selected ion mode (SIM); Table S2: Extraction recovery from the experimental procedure; Table S3: Surface information of the plastics studied; Table S4: Initial concentrations of plastic additives in the plastics studied; Table S5: The pseudo-second order rate constant, k2 (μg−1 d−1) for each of the CECs on the plastics; Figure S1: The lathe was used to produce coil shavings of polyvinyl chloride (PVC) pipes; Figure S2: Macro- and microplastics in solution; Figure S3: Scanning electron microscope (SEM) images of the macro- and microplastics; Figure S4: Preliminary adsorption study of CECs on macro-PVC; Figure S5: Preliminary adsorption study of CECs on micro-PE; Figure S6: Preliminary adsorption of CECs on micro-PS; Figure S7: Macro- and micro-PVC adsorption experiment with selected CECs; Figure S8: Additional adsorption experiment performed with the ATN solution in glass serum bottles for 24 h; Figure S9: Macro- and micro-PE adsorption experiment with selected CECs; Figure S10: Macro- and micro-PS adsorption experiment with selected CECs; Figure S11: Fraction of mass of CECs on PVC, PE, and PS vs. time and their pseudo-first order fit; Figure S12: Concentration of CECs on PVC, PE, and PS vs. time and their pseudo-second order fit; Figure S13: Sorption concentration normalized to surface area and volume plotted against specific surface area or pore area, pore volume or intrusion volume, and porosity; Figure S14: A schematic of potential adsorption mechanisms involved in this study.

Author Contributions

Conceptualization, L.Y.T.; Formal analysis, L.Y.T.; Funding acquisition, L.Y.T., P.A. and P.B.G.; Investigation, L.Y.T., C.Y., C.V., M.K.C., C.Y.W., K.M. and F.L.; Methodology, L.Y.T.; Project administration, L.Y.T.; Supervision, L.Y.T., P.A., P.B.G., A.L.E., S.G., L.P. and F.F.; Validation, L.Y.T., C.Y., C.V. and C.Y.W.; Visualization, L.Y.T.; Writing—original draft, L.Y.T. and C.Y.; Writing—review & editing, L.Y.T., C.Y., C.V., M.K.C., C.Y.W., K.M., F.L., P.A., P.B.G. and A.L.E. All authors have read and agreed to the published version of the manuscript.

Funding

This research was funded by Picker Interdisciplinary Science Institute at Colgate University.

Institutional Review Board Statement

Not applicable.

Informed Consent Statement

Not applicable.

Data Availability Statement

The data presented in this study are available in this article in full. The data presented in this study are also available on request from the corresponding author.

Acknowledgments

We would like to acknowledge the Picker Interdisciplinary Science Institute and the Research Council at Colgate University for funding this study, and undergraduate and graduate students Jeremy Bonte, Laura Leonard, Ally Shahidi, Megan Martis, Jake Levy, Arsh Mundi, and Anne (Yian) Sun for their help. And we would like to thank Hans Benze, Di Keller, Matthew R. Hudson, and Kahlil A. Amin for their technical insight and support.

Conflicts of Interest

The authors declare no conflict of interest.

References

  1. Artham, T.; Doble, M. Biodegradation of aliphatic and aromatic polycarbonates. Macromol. Biosci. 2008, 8, 14–24. [Google Scholar] [CrossRef] [PubMed]
  2. Discard Studies. Discard Studies Homepage. Available online: discardstudies.com (accessed on 29 September 2021).
  3. PlasticsEurope. Plastics—The Facts 2013: An Analysis of European Lastest Plastics Production, Demand and Waste Data; PlasticsEurope Association of Plastics Manufactures, Ed.; PlasticsEurope: Brussels, Belgium, 2013. [Google Scholar]
  4. PlasticsEurope. Plastics—The Facts 2020: An Analysis of European Lastest Plastics Production, Demand and Waste Data; PlasticsEurope Association of Plastics Manufactures, Ed.; PlasticsEurope: Brussels, Belgium, 2020. [Google Scholar]
  5. Andrady, A.L. Microplastics in the marine environment. Mar. Pollut. Bull. 2011, 62, 1596–1605. [Google Scholar] [CrossRef] [PubMed]
  6. Geyer, R.; Jambeck, J.R.; Law, K.L. Production, use, and fate of all plastics ever made. Sci. Adv. 2017, 3, e1700782. [Google Scholar] [CrossRef] [Green Version]
  7. NOAA. Proceedings of the International Research Workshop on the Occurrence, Effects, and Fate of Microplastics Marine Debris, Tacoma, WA, USA, 9–11 September 2008; National Oceanic and Atmospheric Administration: Washington, DC, USA; University of Washington Tacoma: Tacoma, WA, USA, 2009; 49p.
  8. GESAMP. Sources, Fate and Effects of Microplastics in the Marine Environment: A global Assessment; 1020-4873; International Maritime Organization (IMO): London, UK, 2015; 96p. [Google Scholar]
  9. WHO. Microplastics in Drinking-Water; WHO: Geneva, Switzerland, 2019. [Google Scholar]
  10. Al-Jaibachi, R.; Cuthbert, R.N.; Callaghan, A. Up and away: Ontogenic transference as a pathway for aerial dispersal of microplastics. Biol. Lett. 2018, 14, 20180479. [Google Scholar] [CrossRef] [Green Version]
  11. Fowler, C.W. Marine debris and northern fur seals: A case study. Mar. Pollut. Bull. 1987, 18, 326–335. [Google Scholar] [CrossRef]
  12. Nobre, C.R.; Santana, M.F.M.; Maluf, A.; Cortez, F.S.; Cesar, A.; Pereira, C.D.S.; Turra, A. Assessment of microplastic toxicity to embryonic development of the sea urchin Lytechinus variegatus (Echinodermata: Echinoidea). Mar. Pollut. Bull. 2015, 92, 99–104. [Google Scholar] [CrossRef] [PubMed]
  13. Windsor, F.M.; Tilley, R.M.; Tyler, C.R.; Ormerod, S.J. Microplastic ingestion by riverine macroinvertebrates. Sci. Total Environ. 2019, 646, 68–74. [Google Scholar] [CrossRef]
  14. Batel, A.; Linti, F.; Scherer, M.; Erdinger, L.; Braunbeck, T. Transfer of benzo[a]pyrene from microplastics to Artemia nauplii and further to zebrafish via a trophic food web experiment: CYP1A induction and visual tracking of persistent organic pollutants. Environ. Toxicol. Chem. 2016, 35, 1656–1666. [Google Scholar] [CrossRef]
  15. Rubin, A.E.; Zucker, I. Interactions of microplastics and organic compounds in aquatic environments: A case study of augmented joint toxicity. Chemosphere 2022, 289, 133212. [Google Scholar] [CrossRef]
  16. Ramsperger, A.F.R.M.; Narayana, V.K.B.; Gross, W.; Mohanraj, J.; Thelakkat, M.; Greiner, A.; Schmalz, H.; Kress, H.; Laforsch, C. Environmental exposure enhances the internalization of microplastic particles into cells. Sci. Adv. 2020, 6, eabd1211. [Google Scholar] [CrossRef]
  17. Wu, J.; Xu, P.; Chen, Q.; Ma, D.; Ge, W.; Jiang, T.; Chai, C. Effects of polymer aging on sorption of 2,2′,4,4′-tetrabromodiphenyl ether by polystyrene microplastics. Chemosphere 2020, 253, 126706. [Google Scholar] [CrossRef] [PubMed]
  18. Liu, J.; Zhang, T.; Tian, L.; Liu, X.; Qi, Z.; Ma, Y.; Ji, R.; Chen, W. Aging Significantly Affects Mobility and Contaminant-Mobilizing Ability of Nanoplastics in Saturated Loamy Sand. Environ. Sci. Technol. 2019, 53, 5805–5815. [Google Scholar] [CrossRef] [PubMed]
  19. Wardrop, P.; Shimeta, J.; Nugegoda, D.; Morrison, P.D.; Miranda, A.; Tang, M.; Clarke, B.O. Chemical Pollutants Sorbed to Ingested Microbeads from Personal Care Products Accumulate in Fish. Environ. Sci. Technol. 2016, 50, 4037–4044. [Google Scholar] [CrossRef] [PubMed]
  20. Rochman, C.M. Microplastics research-from sink to source. Science 2018, 360, 28–29. [Google Scholar] [CrossRef]
  21. Chua, E.M.; Shimeta, J.; Nugegoda, D.; Morrison, P.D.; Clarke, B.O. Assimilation of polybrominated diphenyl ethers from microplastics by the marine amphipod, Allorchestes compressa. Environ. Sci. Technol. 2014, 48, 8127–8134. [Google Scholar] [CrossRef]
  22. Tanaka, K.; Takada, H.; Yamashita, R.; Mizukawa, K.; Fukuwaka, M.-A.; Watanuki, Y. Facilitated leaching of additive-derived PBDEs from plastic by seabirds’ stomach oil and accumulation in Tissues. Environ. Sci. Technol. 2015, 49, 11799–11807. [Google Scholar] [CrossRef]
  23. Teuten, E.L.; Saquing, J. M.; Knappe, D.R.; Barlaz, M.A.; Jonsson, S.; Björn, A.; Rowland, S.J.; Thompson, R.C.; Galloway, T.S.; Yamashita, R.; et al. Transport and release of chemicals from plastics to the environment and wildlife. Philos. Trans. R. Soc. B 2009, 364, 2027–2045. [Google Scholar] [CrossRef] [Green Version]
  24. Bakir, A.; O’Connor, I.A.; Rowland, S.J.; Hendriks, A.J.; Thompson, R.C. Relative importance of microplastics as a pathway for the transfer of hydrophobic organic chemicals to marine life. Environ. Pollut. 2016, 219, 56–65. [Google Scholar] [CrossRef] [Green Version]
  25. Ziccardi, L.M.; Edgington, A.; Hentz, K.; Kulacki, K.J.; Kane Driscoll, S. Microplastics as vectors for bioaccumulation of hydrophobic organic chemicals in the marine environment: A state-of-the-science review. Environ. Toxicol. Chem. 2016, 35, 1667–1676. [Google Scholar] [CrossRef]
  26. Yu, Y.; Mo, W.Y.; Luukkonen, T. Adsorption behaviour and interaction of organic micropollutants with nano and microplastics—A review. Sci. Total. Environ. 2021, 797, 149140. [Google Scholar] [CrossRef]
  27. Lee, H.; Shim, W.J.; Kwon, J.H. Sorption capacity of plastic debris for hydrophobic organic chemicals. Sci. Total. Environ. 2014, 470–471, 1545–1552. [Google Scholar] [CrossRef] [PubMed]
  28. Wang, F.; Shih, K.M.; Li, X.Y. The partition behavior of perfluorooctanesulfonate (PFOS) and perfluorooctanesulfonamide (FOSA) on microplastics. Chemosphere 2015, 119, 841–847. [Google Scholar] [CrossRef]
  29. Wu, C.; Zhang, K.; Huang, X.; Liu, J. Sorption of pharmaceuticals and personal care products to polyethylene debris. Environ. Sci. Pollut. Res. Int. 2016, 23, 8819–8826. [Google Scholar] [CrossRef]
  30. Zrimec, J.; Kokina, M.; Jonasson, S.; Zorrilla, F.; Zelezniak, A. Plastic-Degrading Potential across the Global Microbiome Correlates with Recent Pollution Trends. mBio 2021, 12, e0215521. [Google Scholar] [CrossRef] [PubMed]
  31. Besseling, E.; Wegner, A.; Foekema, E.M.; van den Heuvel-Greve, M.J.; Koelmans, A.A. Effects of microplastic on fitness and PCB bioaccumulation by the lugworm Arenicola marina (L.). Environ. Sci. Technol. 2013, 47, 593–600. [Google Scholar] [CrossRef] [PubMed]
  32. Bradney, L.; Wijesekara, H.; Palansooriya, K.N.; Obadamudalige, N.; Bolan, N.S.; Ok, Y.S.; Rinklebe, J.; Kim, K.H.; Kirkham, M.B. Particulate plastics as a vector for toxic trace-element uptake by aquatic and terrestrial organisms and human health risk. Environ. Int. 2019, 131, 104937. [Google Scholar] [CrossRef]
  33. Rochman, C.M.; Hoh, E.; Kurobe, T.; Teh, S.J. Ingested plastic transfers hazardous chemicals to fish and induces hepatic stress. Sci. Rep. 2013, 3, 3263. [Google Scholar] [CrossRef]
  34. Teuten, E.L.; Rowland, S.J.; Galloway, T.S.; Thompson, R.C. Potential for plastics to transport hydrophobic contaminants. Environ. Sci. Technol. 2007, 41, 7759–7764. [Google Scholar] [CrossRef]
  35. Wright, S.L.; Thompson, R.C.; Galloway, T.S. The physical impacts of microplastics on marine organisms: A review. Environ. Pollut. 2013, 178, 483–492. [Google Scholar] [CrossRef]
  36. Pham, D.N.; Clark, L.; Li, M. Microplastics as hubs enriching antibiotic-resistant bacteria and pathogens in municipal activated sludge. J. Hazard. Mater. Lett. 2021, 2, 100014. [Google Scholar] [CrossRef]
  37. Castañeda, R.A.; Avlijas, S.; Simard, M.A.; Ricciardi, A.; Smith, R. Microplastic pollution in St. Lawrence River sediments. Can. J. Fish. Aquat. Sci. 2014, 71, 1767–1771. [Google Scholar] [CrossRef]
  38. Corcoran, P.L.; Norris, T.; Ceccanese, T.; Walzak, M.J.; Helm, P.A.; Marvin, C.H. Hidden plastics of Lake Ontario, Canada and their potential preservation in the sediment record. Environ. Pollut. 2015, 204, 17–25. [Google Scholar] [CrossRef] [PubMed]
  39. Cozar, A.; Echevarria, F.; Gonzalez-Gordillo, J.I.; Irigoien, X.; Ubeda, B.; Hernandez-Leon, S.; Palma, A.T.; Navarro, S.; Garcia-de-Lomas, J.; Ruiz, A.; et al. Plastic debris in the open ocean. Proc. Natl. Acad. Sci. USA 2014, 111, 10239–10244. [Google Scholar] [CrossRef] [PubMed] [Green Version]
  40. Dai, Z.; Zhang, H.; Zhou, Q.; Tian, Y.; Chen, T.; Tu, C.; Fu, C.; Luo, Y. Occurrence of microplastics in the water column and sediment in an inland sea affected by intensive anthropogenic activities. Environ. Pollut. 2018, 242 Pt B, 1557–1565. [Google Scholar] [CrossRef]
  41. Eriksen, M.; Mason, S.; Wilson, S.; Box, C.; Zellers, A.; Edwards, W.; Farley, H.; Amato, S. Microplastic pollution in the surface waters of the Laurentian Great Lakes. Mar. Pollut. Bull. 2013, 77, 177–182. [Google Scholar] [CrossRef]
  42. Tan, X.; Yu, X.; Cai, L.; Wang, J.; Peng, J. Microplastics and associated PAHs in surface water from the Feilaixia Reservoir in the Beijiang River, China. Chemosphere 2019, 221, 834–840. [Google Scholar] [CrossRef]
  43. Frias, J.P.; Sobral, P.; Ferreira, A.M. Organic pollutants in microplastics from two beaches of the Portuguese coast. Mar. Pollut. Bull. 2010, 60, 1988–1992. [Google Scholar] [CrossRef]
  44. Bayo, J.; Olmos, S.; López-Castellanos, J.; Alcolea, A. Microplastics and microfibers in the sludge of a municipal wastewater treatment plant. Int. J. Sustain. Dev. Plan. 2016, 11, 812–821. [Google Scholar] [CrossRef] [Green Version]
  45. Carr, S.A.; Liu, J.; Tesoro, A.G. Transport and fate of microplastic particles in wastewater treatment plants. Water Res. 2016, 91, 174–182. [Google Scholar] [CrossRef]
  46. Magni, S.; Binelli, A.; Pittura, L.; Avio, C.G.; Della Torre, C.; Parenti, C.C.; Gorbi, S.; Regoli, F. The fate of microplastics in an Italian Wastewater Treatment Plant. Sci. Total. Environ. 2019, 652, 602–610. [Google Scholar] [CrossRef]
  47. Talvitie, J.; Mikola, A.; Setälä, O.; Heinonen, M.; Koistinen, A. How well is microlitter purified from wastewater?—A detailed study on the stepwise removal of microlitter in a tertiary level wastewater treatment plant. Water Res. 2017, 109, 164–172. [Google Scholar] [CrossRef] [PubMed] [Green Version]
  48. Mason, S.A.; Garneu, D.; Sutton, R.; Chu, Y.; Ehmann, K.; Barnes, J.; Fink, P.; Papazissimos, D.; Rogers, D. Microplastic pollution is widely detected in US municipal wastewater treatment plant effluent. Environ. Pollut. 2016, 218, 1045–1054. [Google Scholar] [CrossRef] [PubMed]
  49. Mintenig, S.M.; Int-Veen, I.; Loder, M.G.J.; Primpke, S.; Gerdts, G. Identification of microplastic in effluents of waste water treatment plants using focal plane array-based micro-Fourier-transform infrared imaging. Water Res. 2017, 108, 365–372. [Google Scholar] [CrossRef] [PubMed]
  50. Browne, M.A.; Crump, P.; Niven, S.J.; Teuten, E.; Tonkin, A.; Galloway, T.; Thompson, R. Accumulation of microplastic on shorelines woldwide: Sources and sinks. Environ. Sci. Technol. 2011, 45, 9175–9179. [Google Scholar] [CrossRef]
  51. Hirai, H.; Takada, H.; Ogata, Y.; Yamashita, R.; Mizukawa, K.; Saha, M.; Kwan, C.; Moore, C.; Gray, H.; Laursen, D.; et al. Organic micropollutants in marine plastics debris from the open ocean and remote and urban beaches. Mar. Pollut. Bull. 2011, 62, 1683–1692. [Google Scholar] [CrossRef]
  52. Mato, Y.; Isobe, T.; Takada, H.; Kanehiro, H.; Kaminuma, T. Plastic resin pellets as a transport medium for toxic chemicals in the marine environment. Environ. Sci. Technol. 2001, 35, 318–324. [Google Scholar] [CrossRef]
  53. Ashton, K.; Holmes, L.; Turner, A. Association of metals with plastic production pellets in the marine environment. Mar. Pollut. Bull. 2010, 60, 2050–2055. [Google Scholar] [CrossRef]
  54. Rios, L.M.; Moore, C.; Jones, P.R. Persistent organic pollutants carried by synthetic polymers in the ocean environment. Mar. Pollut. Bull. 2007, 54, 1230–1237. [Google Scholar] [CrossRef]
  55. Batel, A.; Borchert, F.; Reinwald, H.; Erdinger, L.; Braunbeck, T. Microplastic accumulation patterns and transfer of benzo[a]pyrene to adult zebrafish (Danio rerio) gills and zebrafish embryos. Environ. Pollut. 2018, 235, 918–930. [Google Scholar] [CrossRef]
  56. Browne, M.A.; Niven, S.J.; Galloway, T.S.; Rowland, S.J.; Thompson, R.C. Microplastic moves pollutants and additives to worms, reducing functions linked to health and biodiversity. Curr. Biol. 2013, 23, 2388–2392. [Google Scholar] [CrossRef] [Green Version]
  57. Tanaka, K.; Takada, H.; Yamashita, R.; Mizukawa, K.; Fukuwaka, M.A.; Watanuki, Y. Accumulation of plastic-derived chemicals in tissues of seabirds ingesting marine plastics. Mar. Pollut. Bull. 2013, 69, 219–222. [Google Scholar] [CrossRef] [PubMed]
  58. Pittura, L.; Avio, C.G.; Giuliani, M.E.; d’Errico, G.; Keiter, S.H.; Cormier, B.; Gorbi, S.; Regoli, F. Microplastics as Vehicles of Environmental PAHs to Marine Organisms: Combined Chemical and Physical Hazards to the Mediterranean Mussels, Mytilus galloprovincialis. Front. Mar. Sci. 2018, 5, 103. [Google Scholar] [CrossRef] [Green Version]
  59. Avio, C.G.; Gorbi, S.; Milan, M.; Benedetti, M.; Fattorini, D.; d’Errico, G.; Pauletto, M.; Bargelloni, L.; Regoli, F. Pollutants bioavailability and toxicological risk from microplastics to marine mussels. Environ. Pollut. 2015, 198, 211–222. [Google Scholar] [CrossRef] [PubMed]
  60. Kleinteich, J.; Seidensticker, S.; Marggrander, N.; Zarfl, C. Microplastics Reduce Short-Term Effects of Environmental Contaminants. Part II: Polyethylene Particles Decrease the Effect of Polycyclic Aromatic Hydrocarbons on Microorganisms. Int. J. Environ. Res. Public Health 2018, 15, 103. [Google Scholar] [CrossRef] [Green Version]
  61. Endo, S.; Yuyama, M.; Takada, H. Desorption kinetics of hydrophobic organic contaminants from marine plastic pellets. Mar. Pollut. Bull. 2013, 74, 125–131. [Google Scholar] [CrossRef] [PubMed]
  62. Razanajatovo, R.M.; Ding, J.; Zhang, S.; Jiang, H.; Zou, H. Sorption and desorption of selected pharmaceuticals by polyethylene microplastics. Mar. Pollut. Bull. 2018, 136, 516–523. [Google Scholar] [CrossRef]
  63. Magadini, D.L.; Goes, J.I.; Ortiz, S.; Lipscomb, J.; Pitiranggon, M.; Yan, B. Assessing the sorption of pharmaceuticals to microplastics through in-situ experiments in New York City waterways. Sci. Total. Environ. 2020, 729, 138766. [Google Scholar] [CrossRef]
  64. Li, J.; Huang, X.; Hou, Z.; Ding, T. Sorption of diclofenac by polystyrene microplastics: Kinetics, isotherms and particle size effects. Chemosphere 2022, 290, 133311. [Google Scholar] [CrossRef]
  65. Zhang, H.; Wang, J.; Zhou, B.; Zhou, Y.; Dai, Z.; Zhou, Q.; Chriestie, P.; Luo, Y. Enhanced adsorption of oxytetracycline to weathered microplastic polystyrene: Kinetics, isotherms and influencing factors. Environ. Pollut. 2018, 243 Pt B, 15501557. [Google Scholar] [CrossRef]
  66. Guo, X.; Pang, J.; Chen, S.; Jia, H. Sorption properties of tylosin on four different microplastics. Chemosphere 2018, 209, 240–245. [Google Scholar] [CrossRef]
  67. Li, J.; Zhang, K.; Zhang, H. Adsorption of antibiotics on microplastics. Environ. Pollut. 2018, 237, 460–467. [Google Scholar] [CrossRef] [PubMed]
  68. Adams, R.G.; Lohmann, R.; Fernandez, L.A.; MacFarlane, J.K.; Gschwend, P.M. Polyethylene devices: Passive samplers for measuring dissolved hydrophobic organic compounds in aquatic environments. Environ. Sci. Technol. 2007, 41, 1317–1323. [Google Scholar] [CrossRef]
  69. Wang, J.; Liu, X.; Liu, G.; Zhang, Z.; Wu, H.; Cui, B.; Bai, J.; Zhang, W. Size effect of polystyrene microplastics on sorption of phenanthrene and nitrobenzene. Ecotoxicol. Environ. Saf. 2019, 173, 331–338. [Google Scholar] [CrossRef] [PubMed]
  70. Hüffer, T.; Hofmann, T. Sorption of non-polar organic compounds by micro-sized plastic particles in aqueous solution. Environ. Pollut. 2016, 214, 194–201. [Google Scholar] [CrossRef] [PubMed]
  71. Seidensticker, S.; Zarfl, C.; Cirpka, O.A.; Grathwohl, P. Microplastic-Contaminant Interactions: Influence of Nonlinearity and Coupled Mass Transfer. Environ. Toxicol. Chem. 2019, 38, 1635–1644. [Google Scholar] [CrossRef] [PubMed]
  72. Oulton, R.L.; Kohn, T.; Cwiertny, D.M. Pharmaceuticals and personal care products in effluent matrices: A survey of transformation and removal during wastewater treatment and implications for wastewater management. J. Environ. Monit. 2010, 12, 1956–1978. [Google Scholar] [CrossRef]
  73. Adeleye, A.S.; Xue, J.; Zhao, Y.; Taylor, A.A.; Zenobio, J.E.; Sun, Y.; Han, Z.; Salawu, O.A.; Zhu, Y. Abundance, fate, and effects of pharmaceuticals and personal care products in aquatic environments. J. Hazard. Mater. 2021, 424, 127284. [Google Scholar] [CrossRef]
  74. Palmgrén, J.J.; Mönkkönen, J.; Korjamo, T.; Hassinen, A.; Auriola, S. Drug adsorption to plastic containers and retention of drugs in cultured cells under in vitro conditions. Eur. J. Pharm. Biopharm. 2006, 64, 369–378. [Google Scholar] [CrossRef]
  75. Guart, A.; Bono-Blay, F.; Borrell, A.; Lacorte, S. Migration of plasticizers phthalates, bisphenol A and alkylphenols from plastic containers and evaluation of risk. Food Addit. Contam. 2011, 28, 676–685. [Google Scholar] [CrossRef]
  76. Garcia, A.E.; Wang, C.S.; Sanderson, R.N.; McDevitt, K.M.; Zhang, Y.; Valdevit, L.; Mumm, D.R.; Mohraz, A.; Ragan, R. Scalable synthesis of gyroid-inspired freestanding three-dimensional graphene architectures. Nanoscale Adv. 2019, 1, 3870–3882. [Google Scholar] [CrossRef] [Green Version]
  77. Sharma, K.K.; Anan, A.; Buckley, R.P.; Ouellette, W.; Asefa, T. Toward efficient nanoporous catalysts: Controlling site-isolation and concentration of grafted catalytic sites on nanoporous materials with solvents and colorimetric elucidation of their site-isolation. J. Am. Chem. Soc. 2008, 130, 218–228. [Google Scholar] [CrossRef] [PubMed]
  78. Fotopoulou, K.N.; Karapanagioti, H.K. Surface properties of beached plastics. Environ. Sci. Pollut. Res. Int. 2015, 22, 11022–11032. [Google Scholar] [CrossRef] [PubMed]
  79. Chinaglia, S.; Tosin, M.; Degli-Innocenti, F. Biodegradation rate of biodegradable plastics at molecular level. Polym. Degrad. Stab. 2018, 147, 237–244. [Google Scholar] [CrossRef]
  80. Zhan, Z.; Wang, J.; Peng, J.; Xie, Q.; Huang, Y.; Gao, Y. Sorption of 3,3′,4,4′-tetrachlorobiphenyl by microplastics: A case study of polypropylene. Mar. Pollut. Bull. 2016, 110, 559–563. [Google Scholar] [CrossRef] [PubMed]
  81. Seidensticker, S.; Grathwohl, P.; Lamprecht, J.; Zarfl, C. A combined experimental and modeling study to evaluate pH-dependent sorption of polar and non-polar compounds to polyethylene and polystyrene microplastics. Environ. Sci. Eur. 2018, 30, 30. [Google Scholar] [CrossRef]
  82. Seidensticker, S.; Zarfl, C.; Cirpka, O.A.; Fellenberg, G.; Grathwohl, P. Shift in Mass Transfer of Wastewater Contaminants from Microplastics in the Presence of Dissolved Substances. Environ. Sci. Technol. 2017, 51, 12254–12263. [Google Scholar] [CrossRef]
  83. PubChem. PubChem Search. Available online: https://pubchem.ncbi.nlm.nih.gov/ (accessed on 12 April 2022).
  84. Pischedda, A.; Tosin, M.; Degli-Innocenti, F. Biodegradation of plastics in soil: The effect of temperature. Polym. Degrad. Stab. 2019, 170, 109017. [Google Scholar] [CrossRef]
  85. Aruniit, A.; Kers, J.; Goljandin, D.; Saarna, M.; Tall, K.; Majak, J.; Herranen, H. Particulate Filled Composite Plastic Materials from Recycled Glass Fibre Reinforced Plastics. Mater. Sci. 2011, 17, 276–281. [Google Scholar] [CrossRef]
  86. Tamada, J.A.; Langer, R. Erosion kinetics of hydrolytically degradable polymers. Proc. Natl. Acad. Sci. USA 1993, 90, 552–556. [Google Scholar] [CrossRef] [Green Version]
  87. Pignatello, J.J. Soil organic matter as a nanoporous sorbent of organic pollutants. Adv. Colloid Interface Sci. 1998, 76–77, 445–467. [Google Scholar] [CrossRef]
  88. Tseng, L.Y.; Gori, R.; Rosso, D. Effects of Activated Sludge Process Conditions on the Production of Extracellular Polymeric Substances: Results of Yearlong Monitoring in a Warm Climate. Environ. Eng. Sci. 2015, 32, 582–592. [Google Scholar] [CrossRef]
  89. Nguyen, T.H.; Cho, H.-H.; Poster, D.L.; Ball, W.P. Evidence for a pore-filling mechanism in the adsorption of aromatic hydrocarbons to a natural wood char. Environ. Sci. Technol. 2007, 41, 1212–1217. [Google Scholar] [CrossRef] [PubMed]
  90. Rochman, C.M.; Manzano, C.; Hentschel, B.T.; Simonich, S.L.; Hoh, E. Polystyrene plastic: A source and sink for polycyclic aromatic hydrocarbons in the marine environment. Environ. Sci. Technol. 2013, 47, 13976–13984. [Google Scholar] [CrossRef] [PubMed] [Green Version]
  91. Liu, L.; Fokkink, R.; Koelmans, A.A. Sorption of polycyclic aromatic hydrocarbons to polystyrene nanoplastic. Environ. Toxicol. Chem. 2016, 35, 1650–1655. [Google Scholar] [CrossRef]
  92. Bakir, A.; Rowland, S.J.; Thompson, R.C. Transport of persistent organic pollutants by microplastics in estuarine conditions. Estuar. Coast. Shelf Sci. 2014, 140, 14–21. [Google Scholar] [CrossRef] [Green Version]
  93. Ma, Y.; Huang, A.; Cao, S.; Sun, F.; Wang, L.; Guo, H.; Ji, R. Effects of nanoplastics and microplastics on toxicity, bioaccumulation, and environmental fate of phenanthrene in fresh water. Environ. Pollut. 2016, 219, 166–173. [Google Scholar] [CrossRef]
  94. Velzeboer, I.; Kwadijk, C.J.; Koelmans, A.A. Strong sorption of PCBs to nanoplastics, microplastics, carbon nanotubes, and fullerenes. Environ. Sci. Technol. 2014, 48, 4869–4876. [Google Scholar] [CrossRef]
  95. Liu, G.; Zhu, Z.; Yang, Y.; Sun, Y.; Yu, F.; Ma, J. Sorption behavior and mechanism of hydrophilic organic chemicals to virgin and aged microplastics in freshwater and seawater. Environ. Pollut. 2019, 246, 26–33. [Google Scholar] [CrossRef]
  96. Rodrigues, J.P.; Duarte, A.C.; Santos-Echeandía, J.; Rocha-Santos, T. Significance of interactions between microplastics and POPs in the marine environment: A critical overview. TrAC Trends Anal. Chem. 2019, 111, 252–260. [Google Scholar] [CrossRef]
Figure 1. Fraction of each CEC sorbed onto macro- and microplastics over the period of 7 days where solid line with ○ is the control, dotted line with ● is PVC, solid line with × is PE, and dashed line with △ is PS. Both DFC (log Kow 4.51) and ACE (log Kow 0.46) were consistently retained by the plastics despite very different hydrophobicities. Adsorption of CECs (both the number of CECs adsorbed and the CEC mass fraction adsorbed) also could not be predicted by the size of the plastics.
Water 14 02581 g001aWater 14 02581 g001b
Figure 2. Literature values of KF vs. the Kow of chemicals examined. The KF values were fit to the Freundlich adsorption model and n values were not always assumed to be 1. sw indicates experiments conducted in filtered or synthetic seawater. Our study determined KF of DCF on PE was 1.82 (n = 1), DCF on PS was 17.13 (n = 1), and ATN on PS was 215.95 Ln mg1−n kg−1 (n = 0.97).
Water 14 02581 g002
Table 1. The log Kow values (obtained from PubChem) and the pseudo-first order rate constant, k1 (d−1) for each of the CECs on the plastics. The significance of the rate constant is indicated by P using the chi-squared test. The CECs that were most likely sorbed onto the plastic are shaded in gray. Some CECs were retained on the plastic or control serum bottle glass immediately after exposure and did not have a rate constant associated with the sorption (NA).
CECLog
Kow
ControlMacro- PVCMicro- PVCMacro- PEMicro- PEMacro- PSMicro- PS
DCF4.51NA0.00220.00800.01230.00710.00470.0077
IBP3.97NANANA0.0017
p < 0.001
NA0.0004NA
BPA3.32NANANA0.02700.00000.0001
p < 0.001
NA
MBT2.41NANANANANA0.0047NA
ACE0.46NANANANANA0.0775
p < 0.001
NA
ATN0.16NANA0.0239NANA0.0545
p < 0.001
0.0233
Publisher’s Note: MDPI stays neutral with regard to jurisdictional claims in published maps and institutional affiliations.

