Article

Investigation of Irrigation Water Requirements for Major Crops Using CROPWAT Model Based on Climate Data

by
Ghulam Shabir Solangi
1,
Sabab Ali Shah
2,*,
Raied Saad Alharbi
3,
Sallahuddin Panhwar
4,
Hareef Ahmed Keerio
5,
Tae-Woong Kim
6,*,
Junaid Ahmed Memon
1 and
Ali Dost Bughio
1
1
Department of Civil Engineering, Mehran University of Engineering and Technology, Shaheed Zulfiqar Ali Bhutto Campus, Khairpur Mir’s 66020, Pakistan
2
Research Institute of Engineering and Technology, Hanyang University (ERICA), Ansan 15588, Korea
3
Department of Civil Engineering, College of Engineering, King Saud University, Riyadh 11451, Saudi Arabia
4
Department of Civil Engineering, National University of Science and Technology, Balochistan Campus, Quetta 87300, Pakistan
5
Department of Environmental Engineering, Quaid-e-Awan University of Engineering Science and Technology, Nawabshah 67459, Pakistan
6
Department of Civil and Environmental Engineering, Hanyang University (ERICA), Ansan 15588, Korea
*
Authors to whom correspondence should be addressed.
Water 2022, 14(16), 2578; https://doi.org/10.3390/w14162578
Submission received: 21 June 2022 / Revised: 14 August 2022 / Accepted: 18 August 2022 / Published: 21 August 2022
(This article belongs to the Special Issue Assessing and Managing Risk of Flood and Drought in a Changing World)

Abstract

:
Water is one of the most important natural resources and is widely used around the globe for various purposes. In fact, the agricultural sector consumes 70% of the world’s accessible water, of which about 60% is wasted. Thus, it needs to be managed scientifically and efficiently to maximize food production to meet the requirements of an ever-increasing population. There is a lack of information on water requirements of crops and irrigation scheduling concerning the Shaheed Benazirabad district, Pakistan. Thus, the present study was conducted to determine the irrigation water requirements (IWR) and irrigation scheduling for the major crops in the Shaheed Benazirabad district, Sindh, Pakistan, using agro-climatic data and the CROPWAT model. Agro-climatic data such as rainfall, maximum and minimum temperature, sunshine hours, humidity, and wind speed were obtained from the NASA website, CLIMWAT 2.0, and world weather However, data about studied crops and soils were obtained from FAO (Food and Agriculture Organization). Analysis revealed that the IWRs per irrigation round for the four major crops—sugarcane, banana, cotton, and wheat—were as 3108.0 mm, 1768.5 mm, 1655.7 mm, and 402.5 mm, respectively. It was observed the IWRs are more sensitive in the hot season because of high temperatures and low relative humidity, and vice versa in the cold season. The use of scientific tools such as CROPWAT is recommended to assess IWRs with a high degree of accuracy and to compute irrigation scheduling. Accordingly, the study results will be helpful for improving food production and supervision of water resources.

1. Introduction

Soil, water, and plants are natural resources that are very important for the survival of human beings and animals [1,2]. Water is a fundamental input influencing guaranteed crop production. Water dissolves mineral nutrients that move in the plant along its stem. At the end of the life cycle of a plant, water is also a constituent of an economic product, which may be a seed, stem, leaf, flower, or fruit. The second-most key environmental issue of the 21st century in the eyes of both scientists and politicians after the issue of climate change is freshwater scarcity [3,4]. In the upcoming years, it seems unlikely that the world water cycle will be able to cope with demands [5,6,7,8]. At present, irrigation purposes account for about 87% of the water consumed and 70% of global water withdrawal [9]. Around 40–45% of the world’s food is produced by irrigated agricultural lands, which comprise less than a fifth of all cropped areas. In the future, it is generally anticipated that irrigated agriculture will have to be significantly extended to feed mounting populations.
One sustainable solution to control demands on water resources and adverse environmental impacts from irrigation is intelligent irrigation, as it can lessen water use without compromising crop yield [10]. Every crop needs specific water, which is why only the optimum quantity of water should be provided to crops for maximum yield [11]. Sufficient information on evapotranspiration, crop water requirements, and net irrigation requirements is essential for the effective planning of these resources [12,13]. The term “net irrigation amount” is basically the difference between actual crop-specific evapotranspiration on the output side and effective precipitation and capillary rise from groundwater (if shallow) on the input side. The term “gross irrigation” considers water losses (e.g., percolation below the root zone and surface runoff from the field in the case of the irrigation water application process) by the efficiency term (e.g., gross irrigation amount at the field border = net irrigation amount/field application efficiency). Numerically, the total irrigation water requirement is the summation of three quantities: consumptive use, losses (conveyance and application), and other exceptional needs. As the world is facing a serious water shortage, concerns about combining water-saving technologies have arisen because of increasing water demand and global scarcity issues [14,15,16]. Every drop of water is important because the existence of life is due to water. Meeting water demand is becoming more and more challenging day by day. Hence, water should be harnessed properly. Using an appropriate irrigation management strategy can shrink the adverse impacts of over-irrigation; on the other hand, equilibrium between a crop’s water requirements and available water can be maintained.
Pakistan, being an agricultural country, highly depends on irrigation, as the amount of precipitation on the agricultural lands in Pakistan is not sufficient. Irrigation provides water to about 18 million hectares of cultivable land [16,17]. Further, the main source of income for 72% of Pakistan’s population is associated with agriculture. Wheat, rice, cotton, banana, and sugarcane are important commercial crops, cultivated to fulfill the sustainable food demands of the country and add great value to the country’s economy. However, increasing demands for freshwater and scouring losses are likely to impact the agricultural water supply. Khan et al. [18] stated that an important strategy for choosing proper water use is to evaluate the current water status around the world. In Pakistan, including the Shaheed Benazirabad district, the farmers normally over-irrigate their fields due to lack of proper knowledge about crop water requirements and with the idea that more water will produce more yield. There are various models available in the literature, e.g., AquaCrop, CROPWAT, APSIM, CropSyst, etc. However, every model has uncertainties and needs desired data as input. However, the CROPWAT model needs less data as input and has universal applicability. Thus, CROPWAT is the best way to develop proper irrigation scheduling for farmers to understand the required quantity of water at the right time for their fields due to changes in climatic conditions. The CROPWAT model is preferred in this study in the determination of the reference evapotranspiration (ETo), as it is reported to deliver very reliable values on actual crop water use data worldwide. Systematic crop water requirements are essential to ensuring efficient scheduling of irrigation and water management, design of canal capacities, planning of water resources, regional drainage, and research in reservoir operations. CROPWAT is a tool that calculates agricultural water needs [12,19,20,21]. Furthermore, Gabr and Fottouth [22] showed that crop water requirement simulation models compute effective rainfall, reference evapotranspiration, crop evapotranspiration, net irrigation water requirement, gross irrigation water requirement, irrigation scheduling, and crop growth. Globally, the optimal amount of irrigation water has been calculated using modeling approaches [18,23,24]. However, in general, various studies in the literature focus on the importance and strong need for the investigation of crop water requirements with the changing climate, considering the importance of estimating crop water requirements especially for major crops, e.g., in Pakistan, wheat, cotton, banana, and sugarcane. However, the accurate crop water requirement for these crops under climate change conditions are still lacking. Specifically, there is no study available to estimate crop water requirement considering the CROPWAT model as a tool; thus, the existing scheduling techniques used by the farmers of the Shaheed Benazirabad district are outdated and inefficient. It is, therefore, time to revolutionize this by using CROPWAT to determine crop water requirements, organize the respective data, carry out modeling of irrigation water using climatic, crop, and soil data, and allow proper scheduling. Thus, the present study was conducted to determine the irrigation water requirement (IWR) and irrigation scheduling for the major crops in the Shaheed Benazirabad district, Sindh, Pakistan using agro-climatic data and the CROPWAT model.

2. Study Area and Data

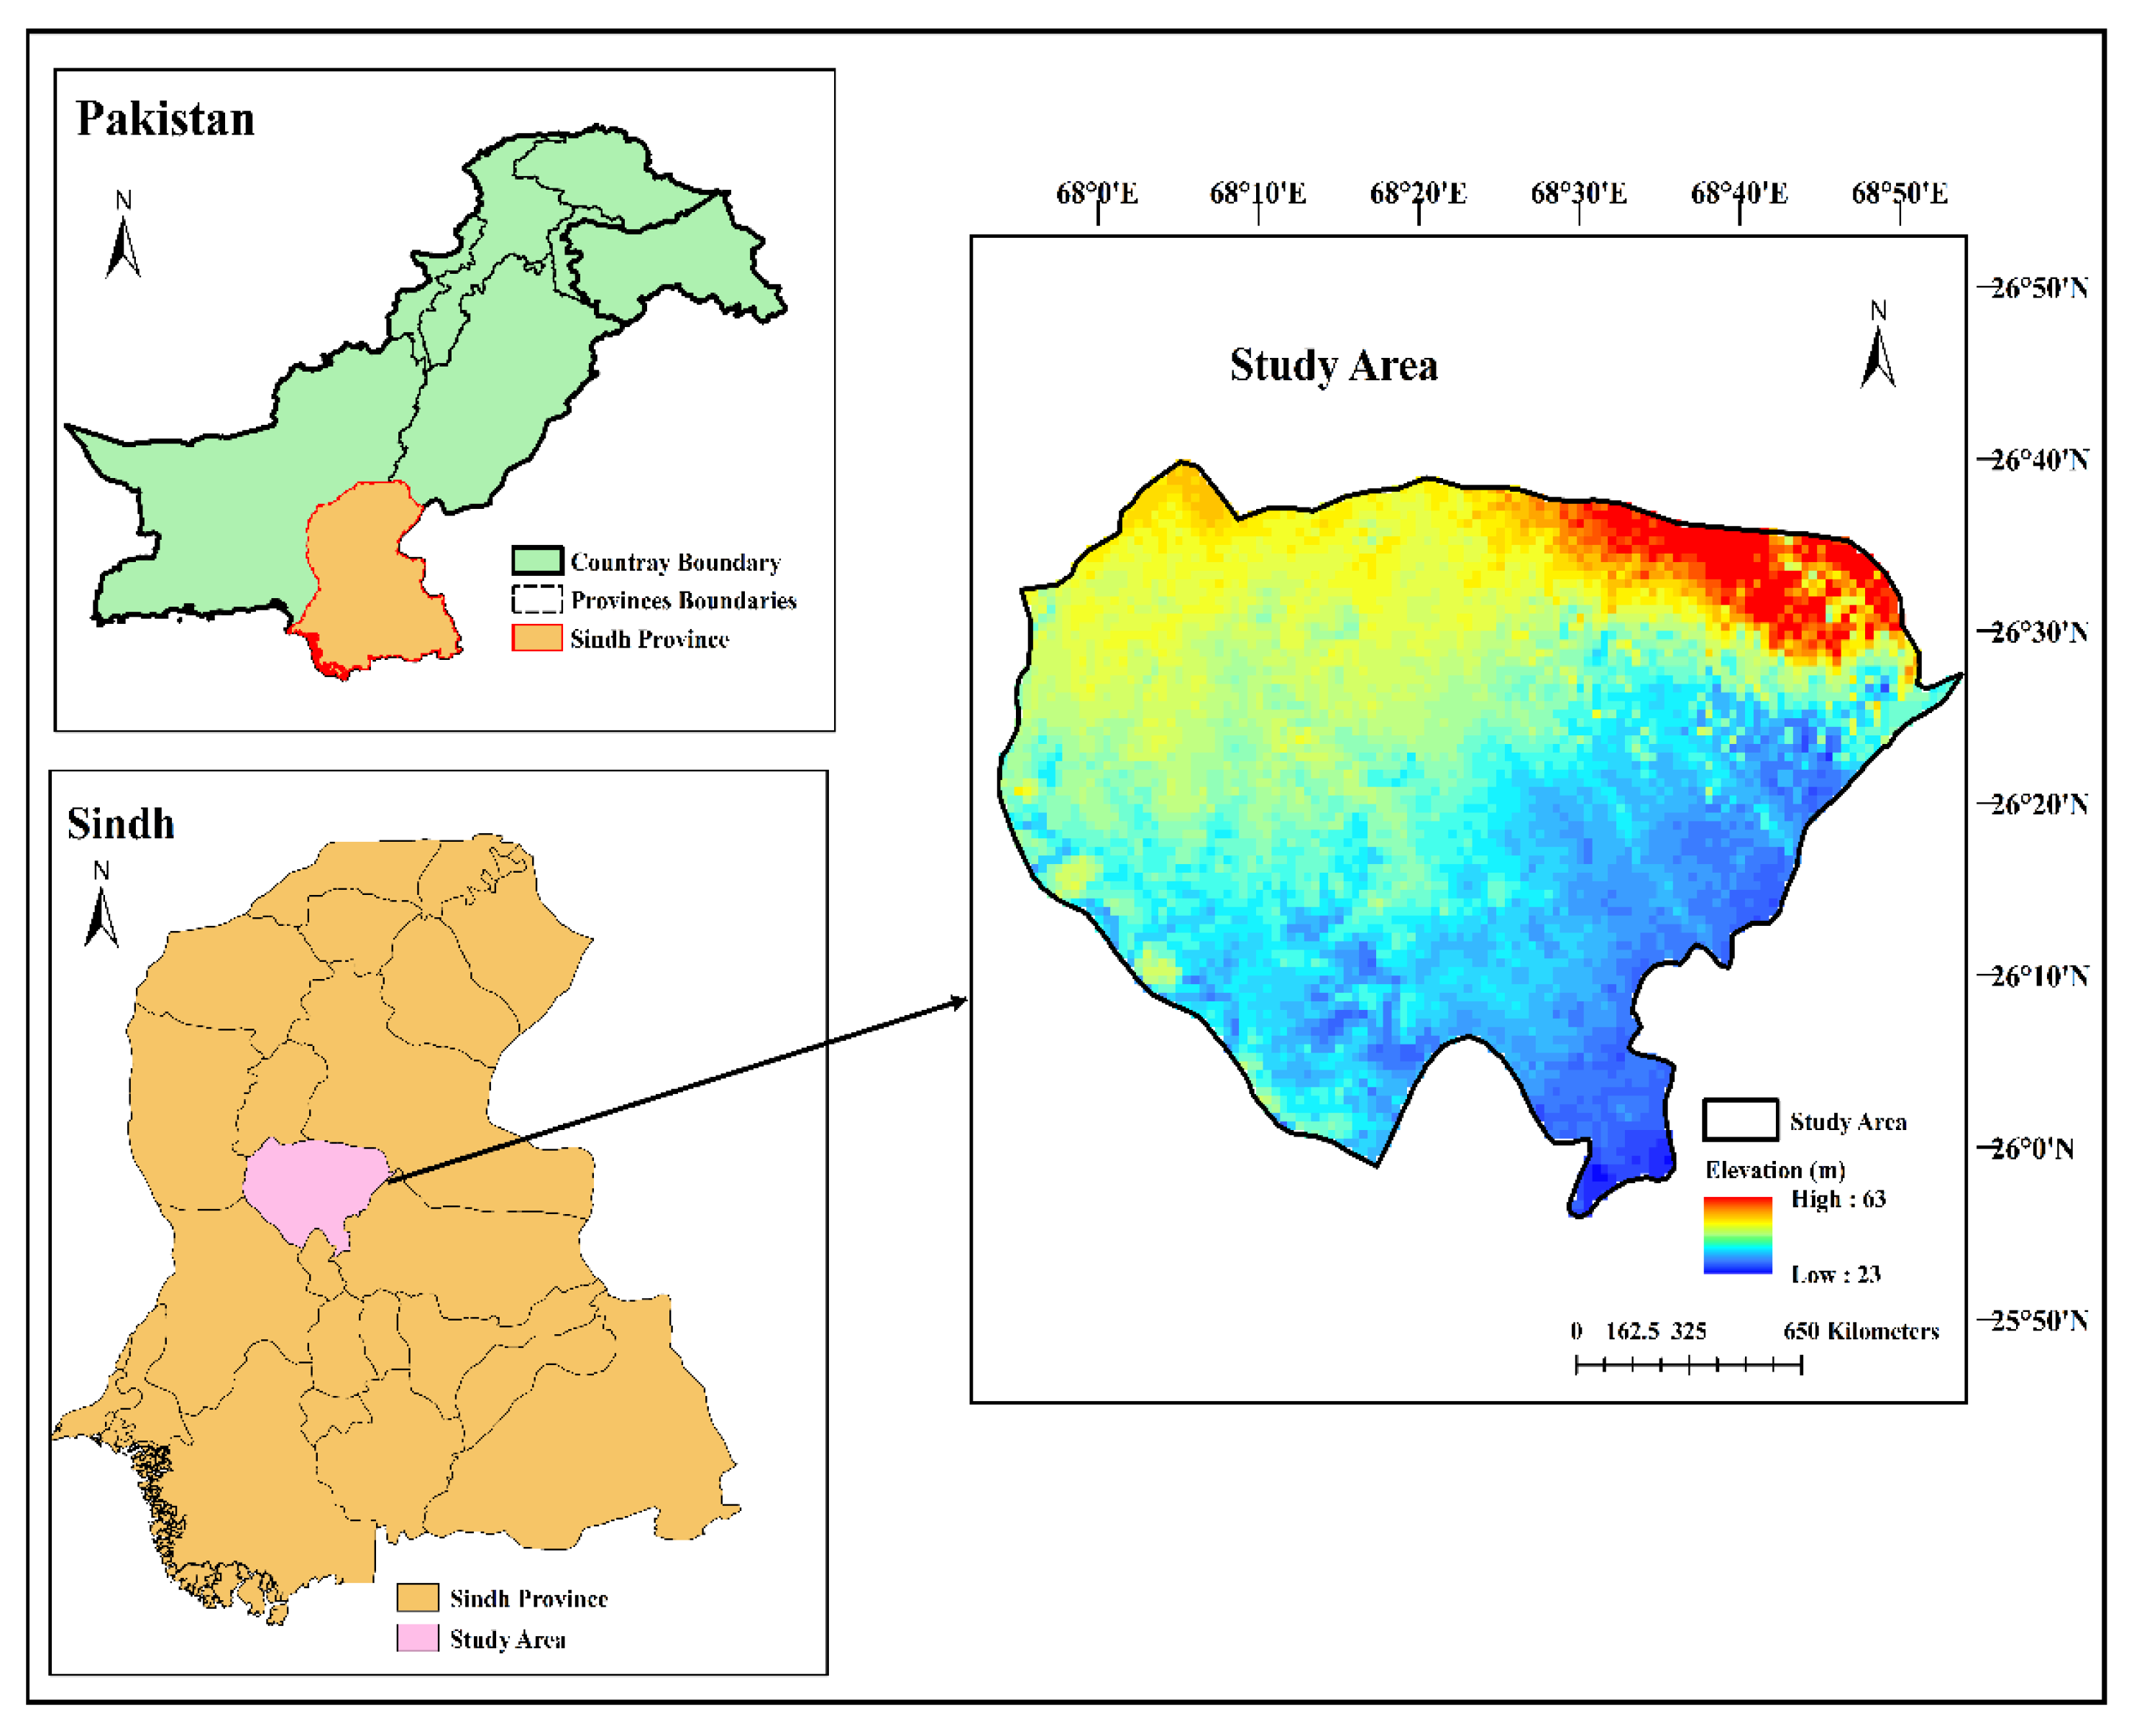
2.1. Description of the Study Area

The study area selected for the present study is the Shaheed Benazirabad district, established by the British government, with a latitude of 26°5′53.99″ N and a longitude of 68°24′34.38″ E. It is also called the Shaheed Benazir Abad district, as presented in Figure 1. Geographically, it is the center of the Sindh province of Pakistan, with an area of 4239 square km and a population of 1,435,130. It is situated 50 km from the left bank of the River Indus. The geographical location of the city makes it a major railway and roadway transportation hub in the province. As a nationwide hub of cotton manufacture and one of the largest producers of bananas in Pakistan, it is also famous for its sugarcane, mango, etc. Climatically, the Shaheed Benazirabad district falls in the arid and semi-arid regions, with a maximum temperature of 52 °C [18]. From a hydrological perspective, the study area belongs to the arid and semi-arid region type, with an average precipitation of more than 100 mm. The quality of underground water is brackish and saline.

2.2. Determination of Irrigation Water Requirements and Irrigation Scheduling

In the present study, irrigation water requirements (IWR), and irrigation scheduling for major crops such as sugarcane, banana, cotton, and wheat cultivated in the Shaheed Benazirabad district, Sindh, Pakistan were determined using respective agro-climatic data and the CROPWAT 8.0 model. CROPWAT is a decision-support computer program developed by the Land and Water Development Division of FAO.

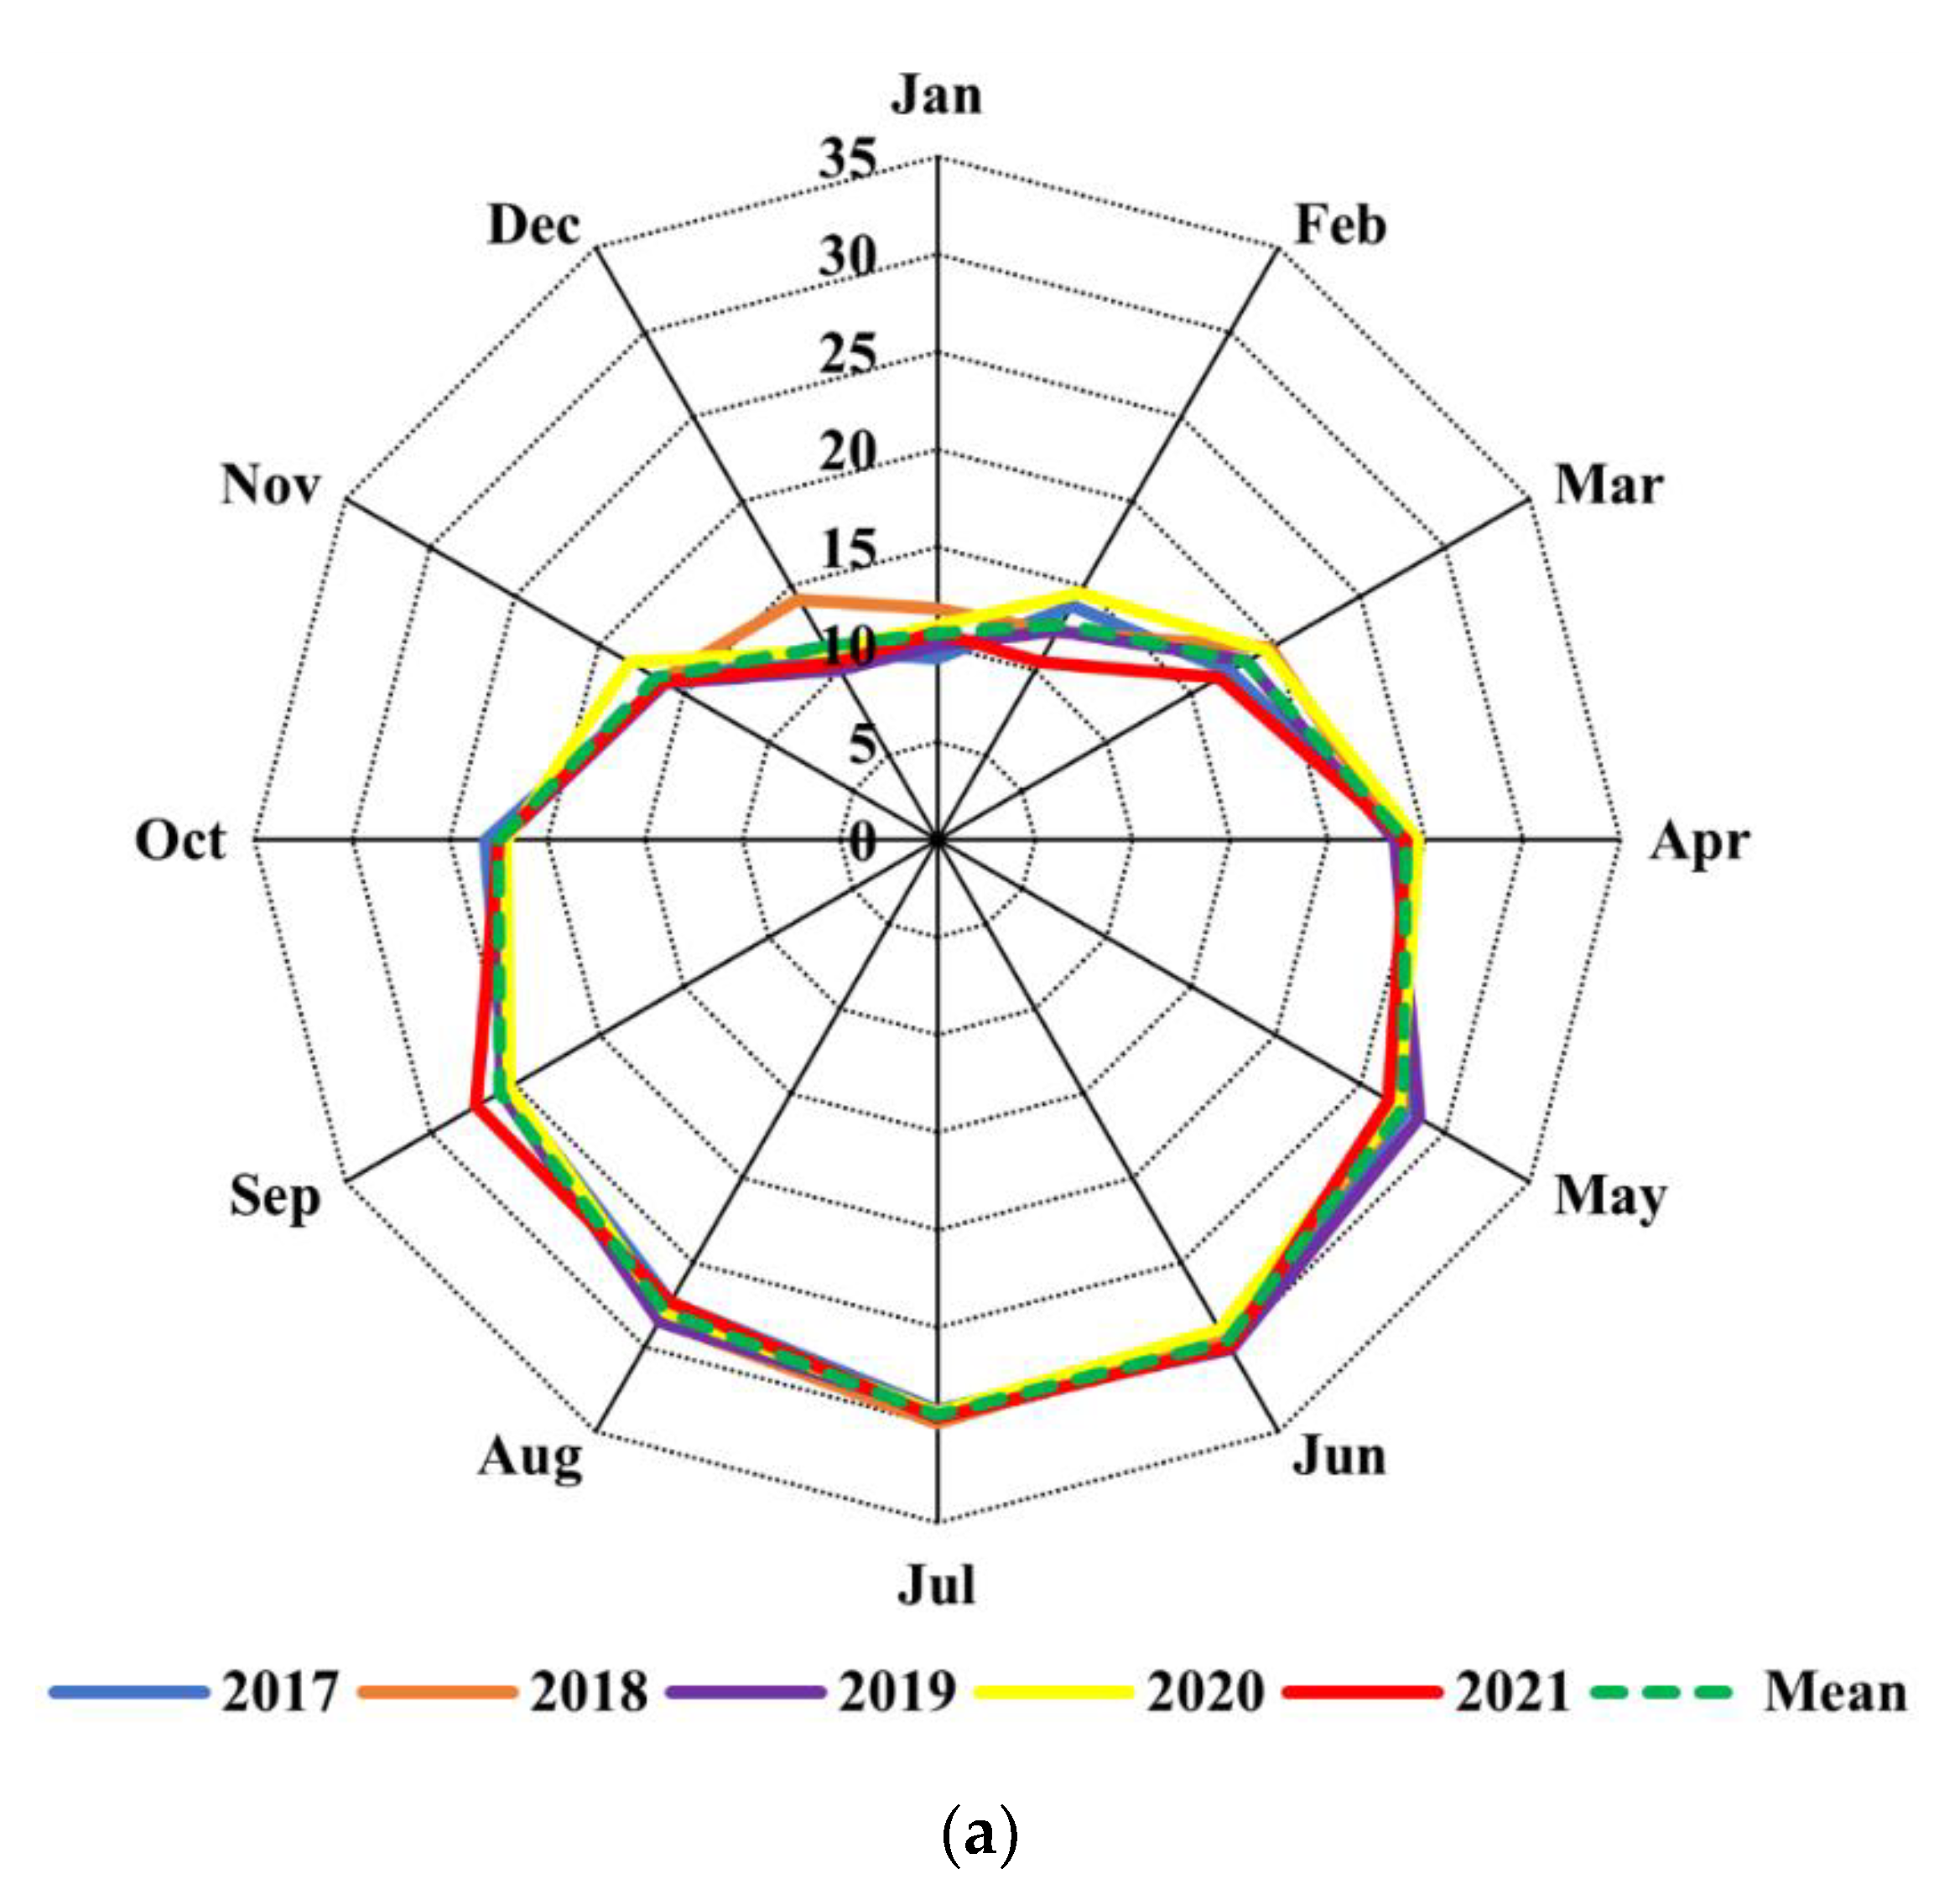
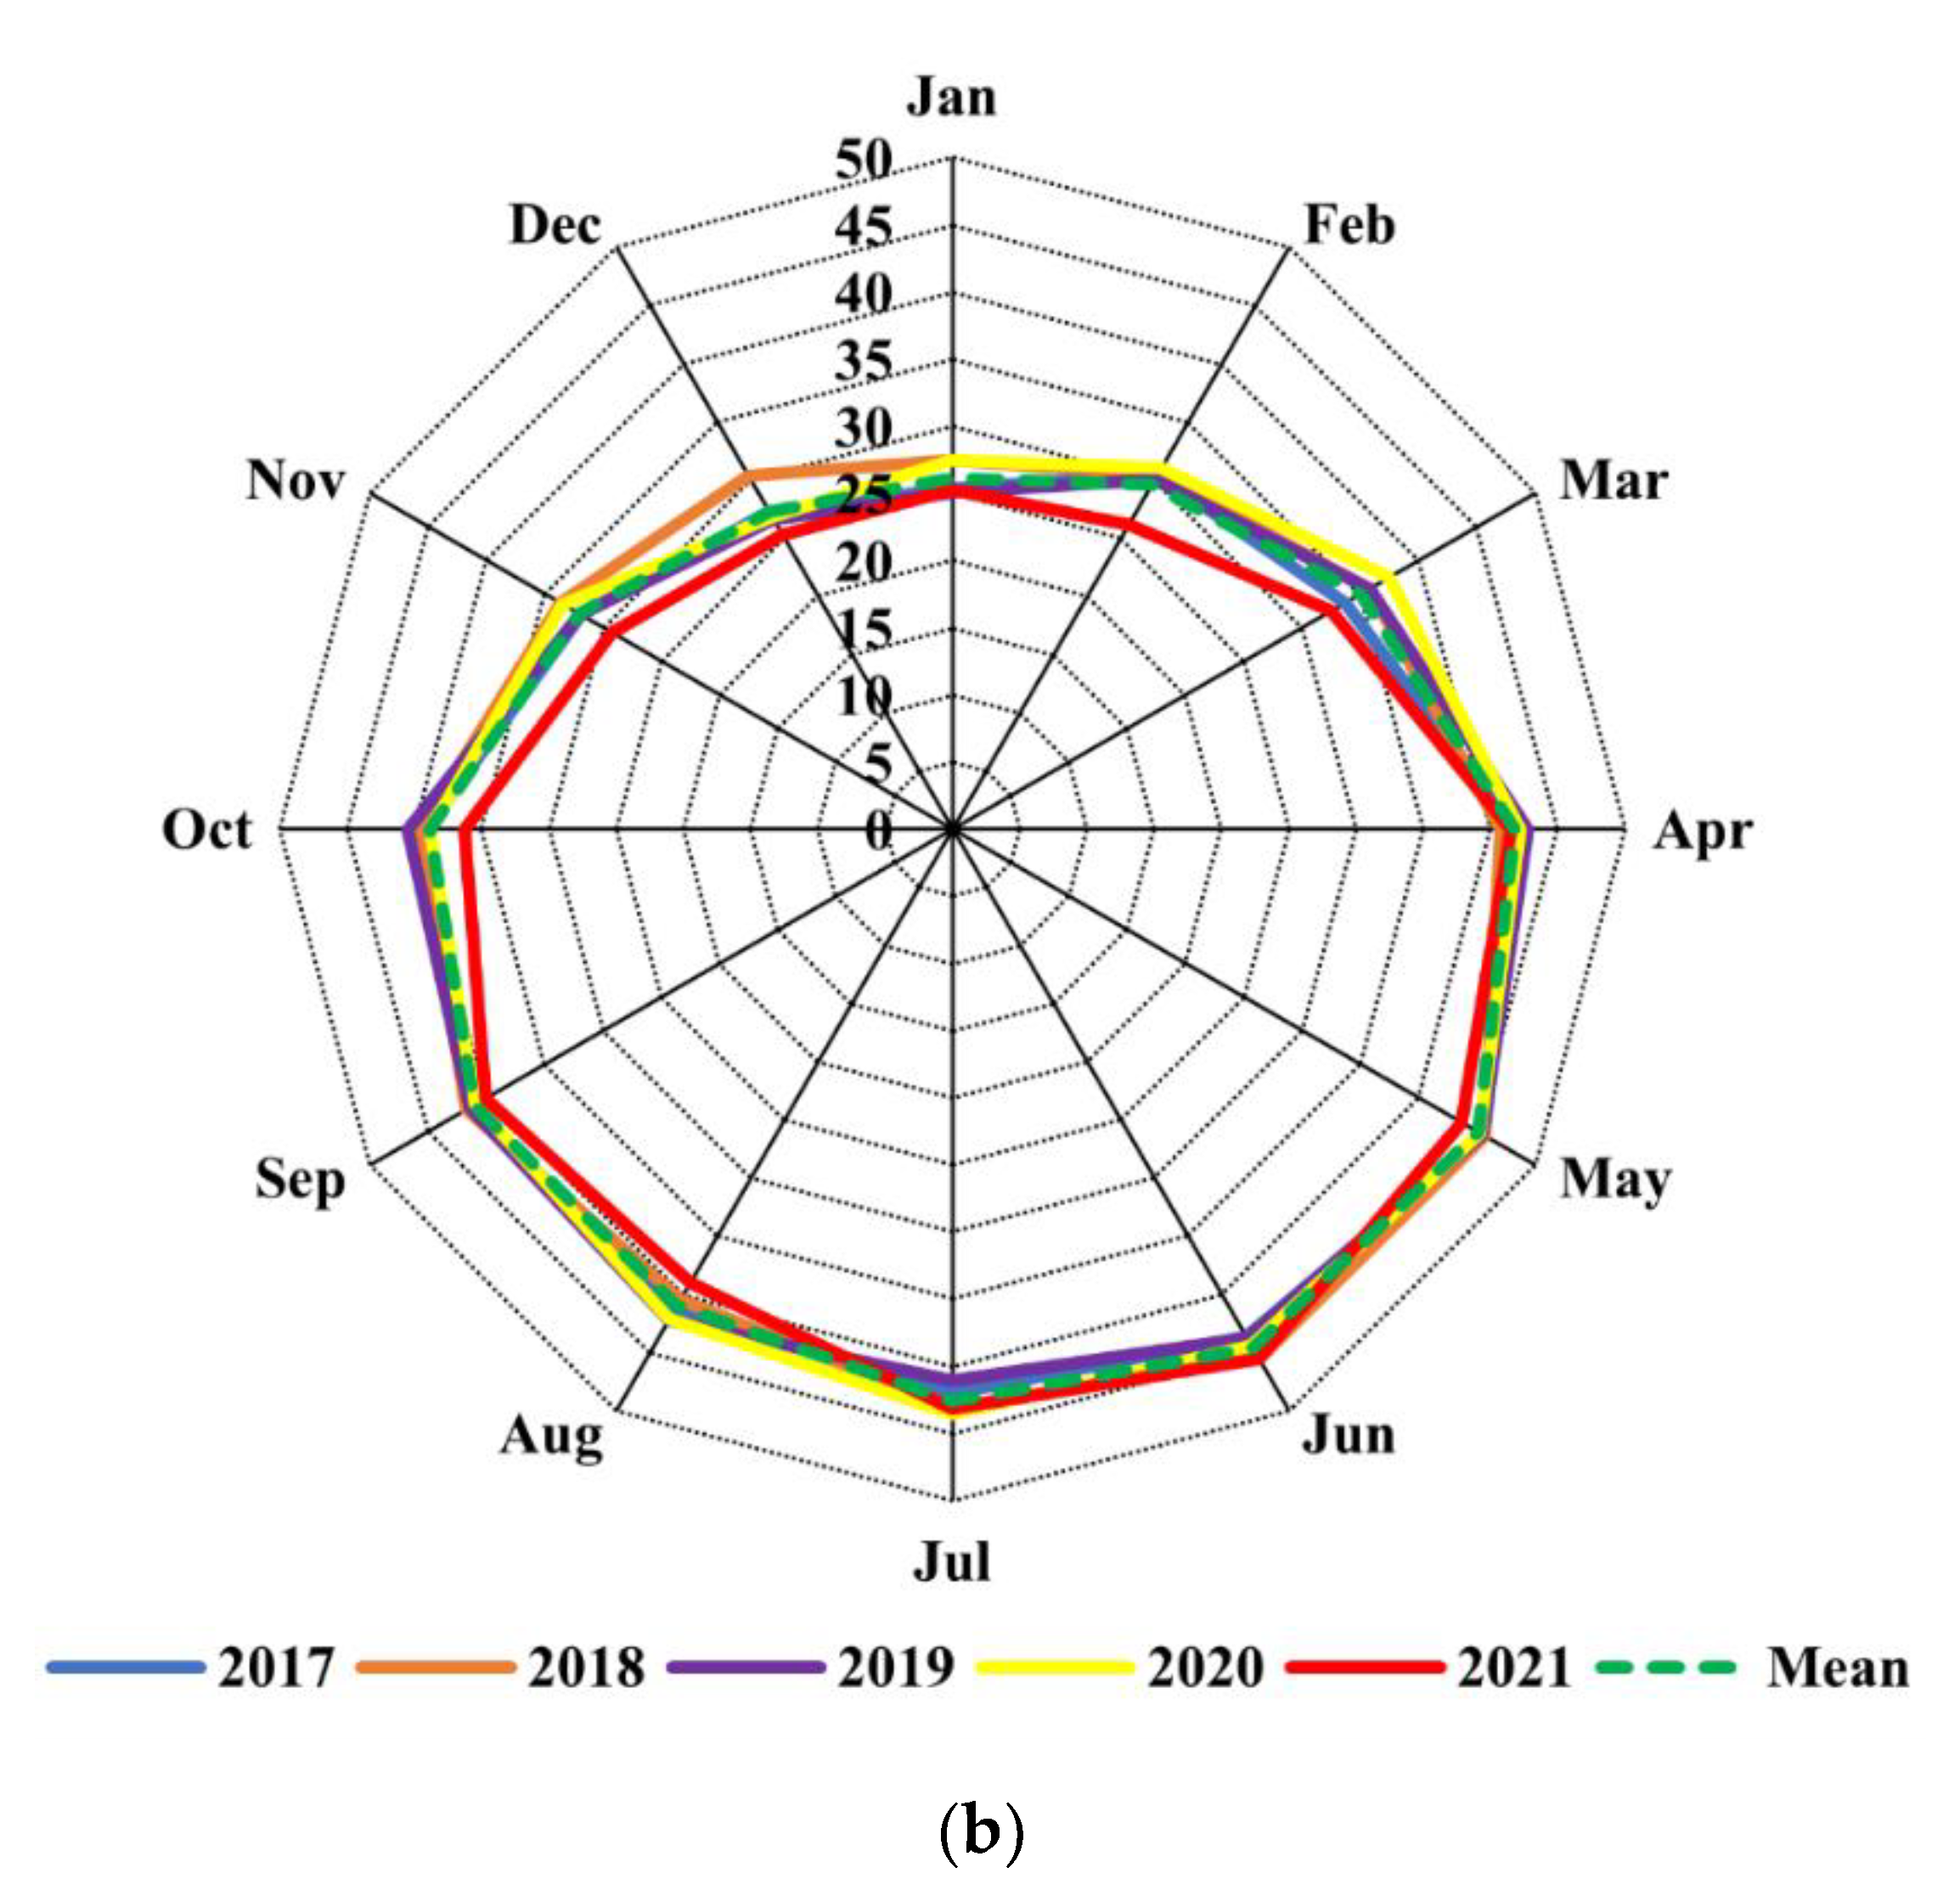
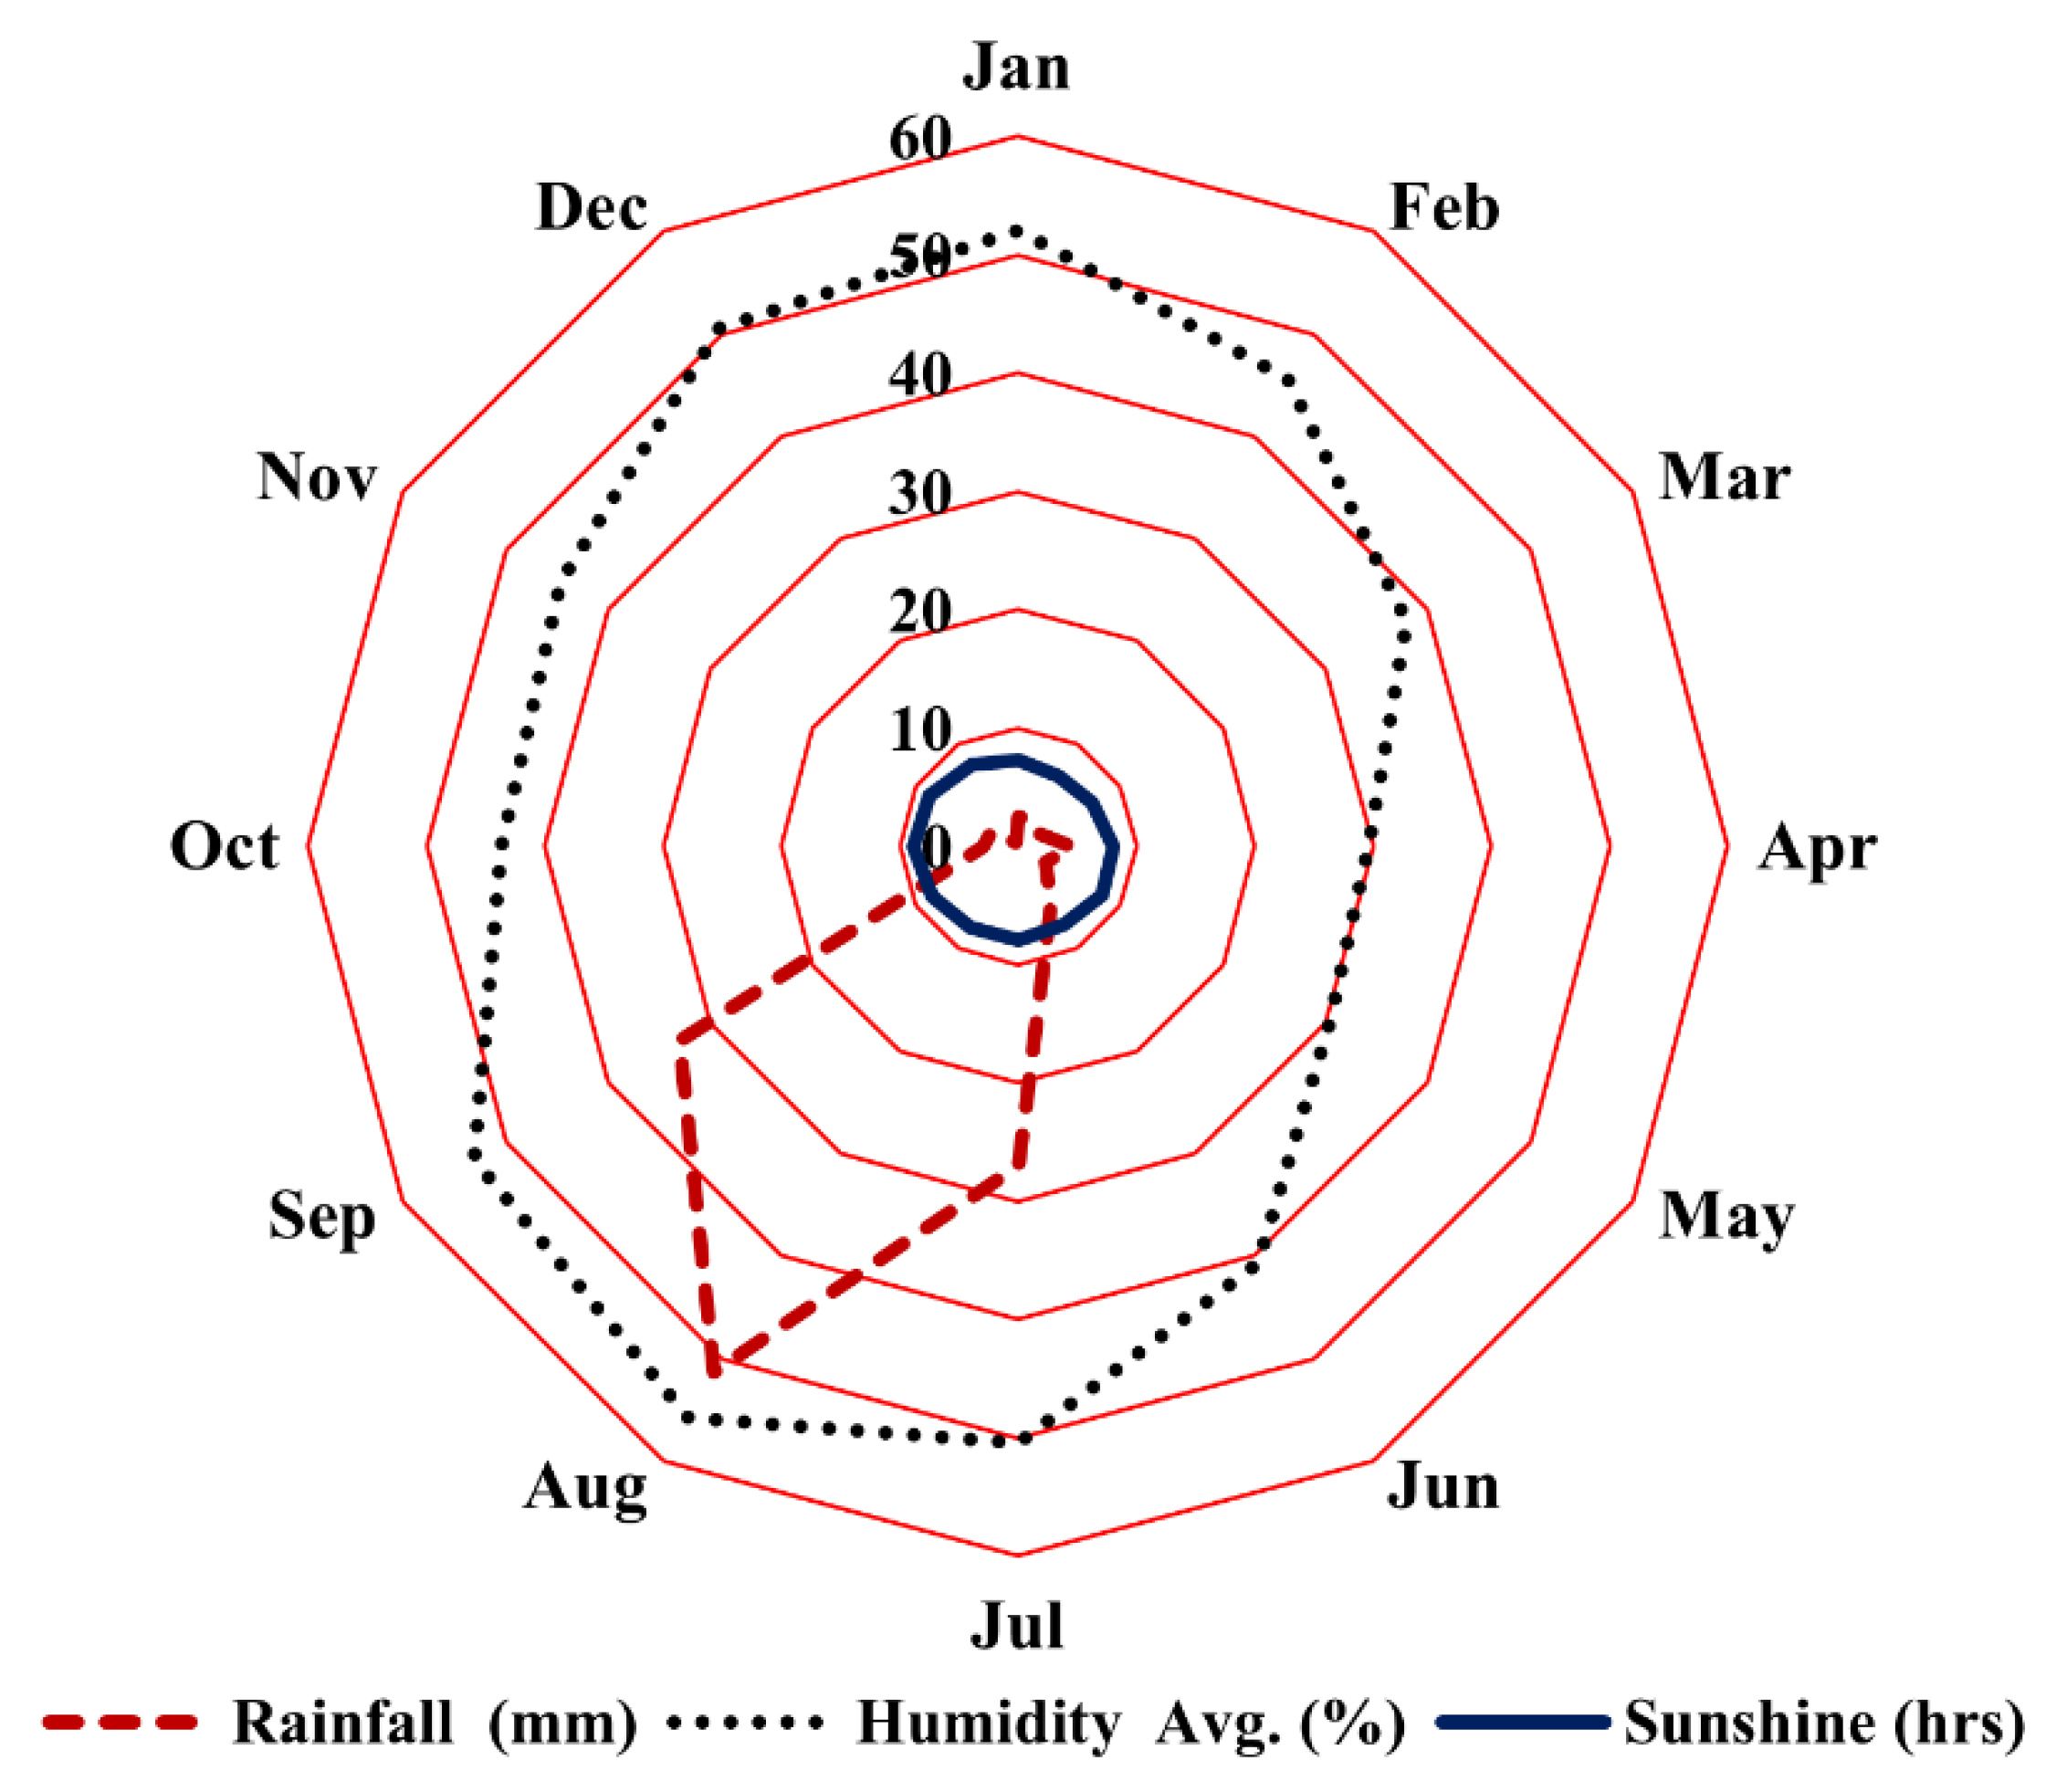
2.3. Temperature, Air Humidity, Sunshine Hours, Wind Speed, and Precipitation

Three types of data are required for the CROPWAT model, namely, climatic data, soil data, and crop data. In the present study, climatic data were obtained from three sources: climatic data through the NASA website, climatic data from FAO software CLIMWAT 2.0 [19,20], and climatic data through worldweatheronline.com. As far as crop and soil data are concerned, these are already available in the software. Only the crop and soil data related to the study area were employed using CROPWAT. Climatic data includes minimum and maximum temperature, relative humidity, wind speed, and sunshine hours. The study area is in the warmest part of Pakistan, where the temperature rarely comes near 0 °C, even in the peak winter season. The observed lowest minimum average temperature and highest minimum temperature are 3.574 °C in November and 8.164 °C in June, respectively. However, the minimum and maximum temperatures, with an average value of temperature in the study area for a period of five years between 2017 and 2021, are shown in Figure 2.
The study area is not generally characterized by high humidity. The maximum average air humidity is (45–55%) and the minimum average air humidity is about (29–35%) Sunshine hours are also the main parameter used for estimation of evaporation. The representative sunshine hours for the Shaheed Benazirabad district were taken from CLIMWAT. The seasonal and annual prevailing winds in the study area are mainly western disturbances in the shape of dust storms and continental air, which are the main factors influencing the weather. The precipitation pattern over the study area shows maximum precipitation in the period of hot summer (June to September), with a low precipitation average of 100 mm to 130 mm annually. The precipitation data used in this study were taken from worldweatheronline.com. The respective data on air humidity, sunshine hours, and precipitation in the study area are exhibited in Figure 3.

2.4. Crop and Soil Data for the Study Area

The major cultivable crops in the study area are wheat, cotton, sugarcane, and banana. The date of planting and harvesting of crops considered for the present study are described in Table 1. The soil in the study area is medium (loam) soil; the same soil is available in the software that was being employed for the present study, as portrayed in Figure 4.

2.5. Reference Evapotranspiration and Effective Rainfall

The reference ETo is the removal of water from a hypothesized plant of 0.12 m, surface tension of 70 s/m, and albedo of 23%, with no water deficit to evaporation from ordinary grasses and covering the soil and watering it appropriately [21,25,26,27]. The CROPWAT model, for the calculation of ETo, employs the FAO Pen Monteith equation with the help of measured weather data (Equation (1)) [20,28].
ETo = 0.408 Δ ( Rn G ) + 900 T + 273 u 2 ( e s e a ) Δ + γ   ( 1 + 0.3442 )
where Rn = net radiation (MJ/m2/day); G = soil heat flux density (MJ/m2/day); T = mean daily air temperature at 2 m height (°C); u 2 = wind speed at 2 m height (m/s); (es − ea) = vapor pressure deficit of the air (kPa); ∆ = slope of the vapor pressure (kPa °C−1); γ = psychometric constant (kPa °C−1).
The fraction of rainfall that is stored in the soil profile and helps in the growth of crops is effective rainfall. In the present study, the USDA Soil Conservation Service method was used to calculate the effective rainfall [20], as described in Equations (2) and (3).
p eff = p tot ( 125 0.2 ×   p tot ) 125   for   p tot < 250   m m   ( per   month )
p eff = 125 + 0.1   p tot   for   p tot   > 250   mm   ( per   month )
where p eff = effective rainfall (mm); p tot = total rainfall (mm).

2.6. Crop Water Requirement, Irrigation Water Requirement, and Irrigation Scheduling

The amount of water equal to what is lost from a cropped field by the evapotranspiration is known as the crop water requirement. It is expressed by the rate of ET in mm/day and can be calculated using Equation (4) [19].
ET c =   K c × ET o
where K c = crop coefficient (the ratio of the ETc to the ETo). This varies by crop and can be obtained from the CROPWAT model.
The irrigation water requirement (IWR) is the amount of water needed to fulfil the crop water requirement after any effective rainfall, for a disease-free crop growing in large fields under non-restricting soil and water conditions and under adequate fertility [29]. Pakistan is an agriculture-based country; agriculture has a remarkable share in the country economy and GDP. However, the country is documented as a water-stressed country by UNO. Thus, it is very imported to evaluate the optimal IWR to enhance crop productivity and boost the country’s economy.
The correct quantity of water to irrigate and the correct moment in time for watering are determined by irrigation scheduling. The development of irrigation scheduling under different administration conditions and water supply plans is performed after the calculation of ETo, and IWR through the CROPWAT model [19,28,30].

3. Results and Discussion

Data such as type of crop, date of cultivation, and soil type medium (loam) were entered into the CROPWAT and CLIMWAT software, including the country Pakistan and climatic station Shaheed Benazirabad. Once all the data were entered into the software, it calculated the irrigation water requirement and crop irrigation scheduling for major crops cultivated in the study area.

3.1. Reference Evapotranspiration (ETo)

The reference evapotranspiration (ETo) for the major cultivated crops—wheat, cotton, sugarcane, and banana—in the district was calculated from the Penman–Monteith equation with the help of agro-climatic data. The reference evapotranspiration ranged from 3.53 mm/day to 11.95 mm/day. The maximum was in June and the minimum was in January, as shown in Figure 5. It was observed that ETo is high in summer due to the high temperature and decreases in winter due to the low temperature. Further, it was seen that increase in radiation value brings an increase in the ETo value, with the direct relation shown in Figure 6. The annual mean ETo was calculated as 7.49 mm. The low relative humidity, high temperatures, and high wind increased evapotranspiration during the dry season [31]. The differences in ETo values reflect the variation in weather parameters in the study area.

3.2. Effective Rainfall

Using the USDA Soil Conservation Service method, which utilizes the total rainfall value, effective rainfall was calculated. The maximum and minimum values of effective rainfall were found to be 47.1 mm in August and 0.4 mm in December, respectively. Further, the results showed that the effective rainfall was the same as the total rainfall for most of the months except June, July, August, and September, due to the high temperatures and wind speeds in these months.

3.3. Crop Water Requirements (ETc) and Irrigation Water Requirements (IWR)

Table 2, Table 3, Table 4 and Table 5 present the irrigation water requirements calculated by the CROPWAT model for the crops included in the study area. The total water requirements for different crops in various agro-ecological zones, obtained after the application of the data of the study area in the CROPWAT model, are given in Table 4, Table 5, Table 6 and Table 7. The total water requirements for wheat, cotton, sugarcane, and banana were 411 mm, 1773.5 mm, 3245.4 mm, and 1895.7 mm, respectively. The results showed that the crop water requirements of all the selected crops of the study area were higher during the dry season than in the rainy season, which reflects that the crops grown in the dry season need more water than those grown during the rainy season and require a large amount of water due to the hot climate of Shaheed Benazirabad [18]. This parallels the FAO report [32], which asserts that crops grown in the rainy season need less water than those grown during the dry season. Further, it was observed that during the developing and growing stages, crops also need a large quantity of water, with the greatest requirements in the growing stage compared to the other three stages, due to the high value of reference evapotranspiration in the months encompassed by the growing stage. Depending upon the place, soil type, climate, effective rain, cultivation technique, etc., crops require different quantities of water. It is also a fact that the total water needed for the growth of a crop is not evenly distributed over its entire life span [30].
The irrigation water requirements (IWRs) for the four crops—sugarcane, banana, cotton, and wheat—for the entire growing season were found as 3108 mm, 1768.5, 1655.7 mm, and 402.5 mm, respectively. However, the findings of the present study cannot be compared in a complete manner due to the unavailability of similar studies in the same region. However, the results of this study are comparable to other studies conducted in various parts of the world [18,28,33]. Khan et al. [33] conducted a study to investigate the crop water requirement for the wheat and cotton in Sudan; the results of that study are similar to the results of for wheat and cotton in the present study. This similarity of the results gives strength to our finding. Moreover, the estimated IWR for wheat in this study is similar to recent studies conducted by Khan et al. [12] for Peshawar. Moreover, the results of banana and other crops also parallel recent studies conducted in the same region, Kerala, India [28]. The combined IWRs of selected crops with planting and harvesting dates are described in Table 6.
From analysis of the results obtained through the CROPWAT model, it was observed that the crops with a longer period of growth, such as sugarcane and banana, which employ almost all the months of the year, required a greater amount of water. On the other hand, crops with a shorter period of growth showed a lower irrigation water requirement. Further, the elevated irrigation requirements in the months of the hot season may be explained by the lack of rain combined with high temperatures, which lead to increased evapotranspiration. Additionally, high evaporation and shrinkage in soil moisture during the hottest period with the highest temperature imply the highest agricultural water requirement. Water losses throughout Shaheed Benazirabad district are substantial in irrigation schemes, as water is generally transported to the farmers’ fields through very poorly maintained distribution systems made of earthen canals and ditches, which suffer substantial water loss due to infiltration and seepage.

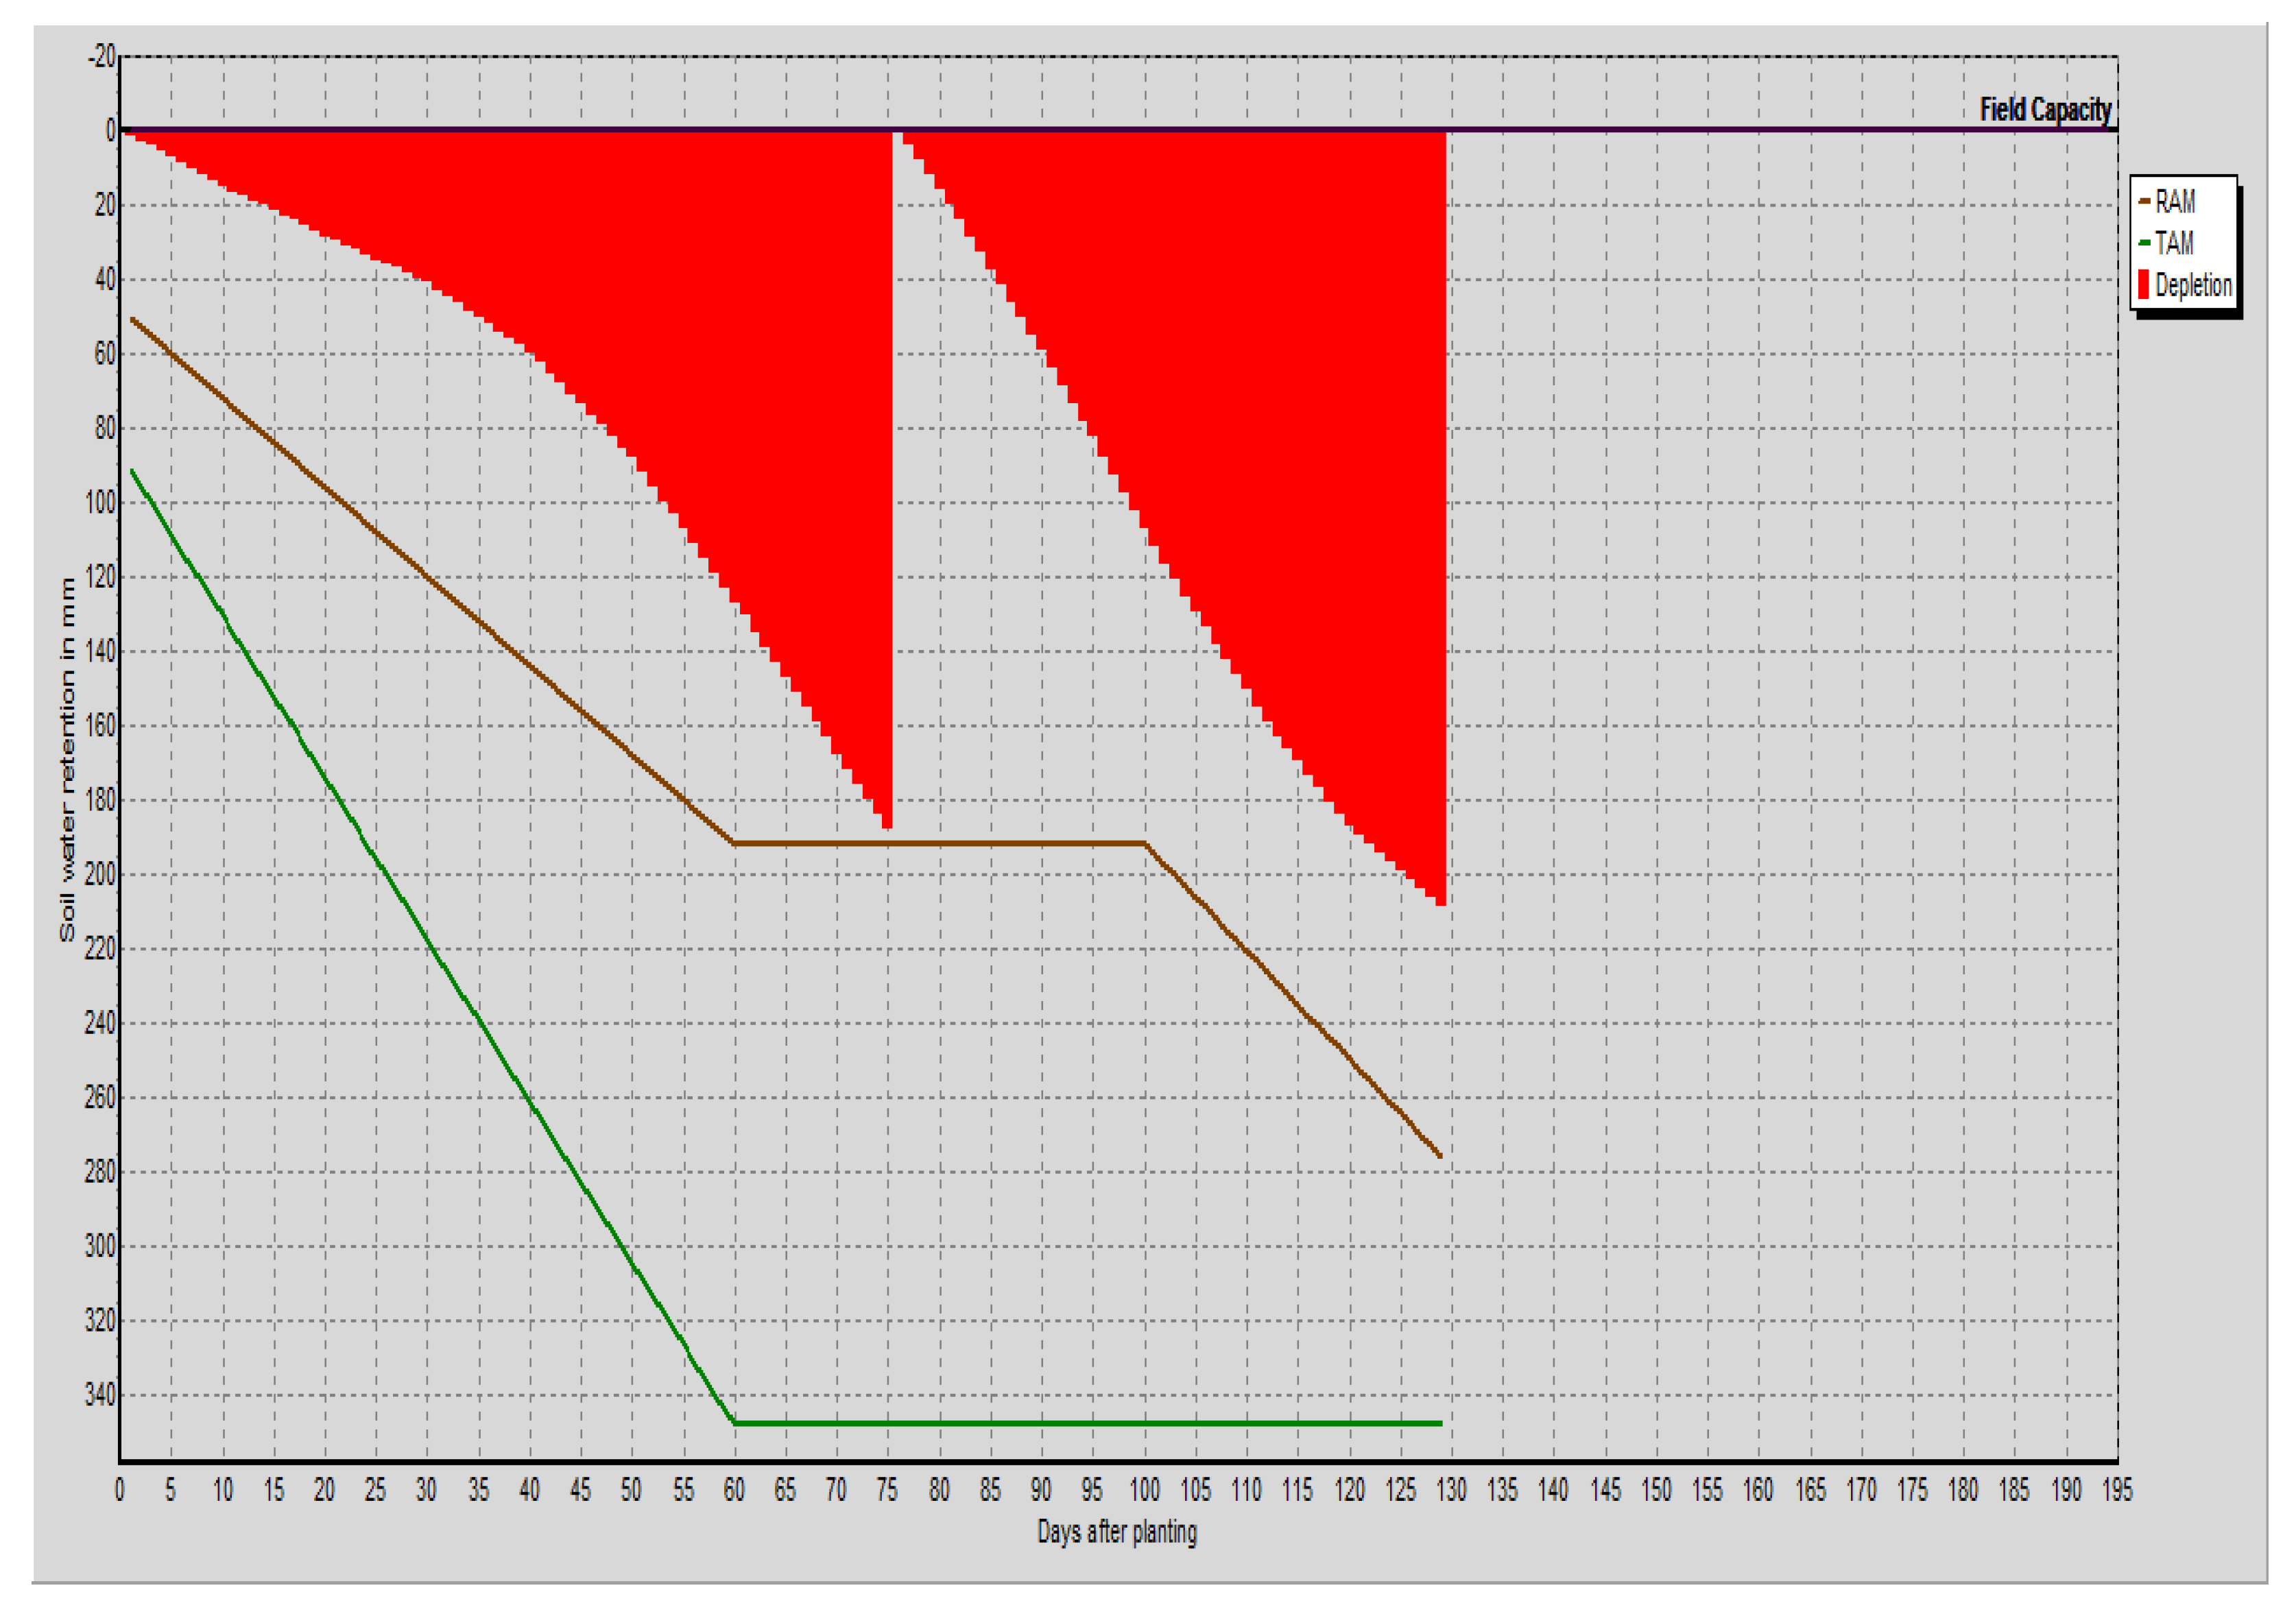
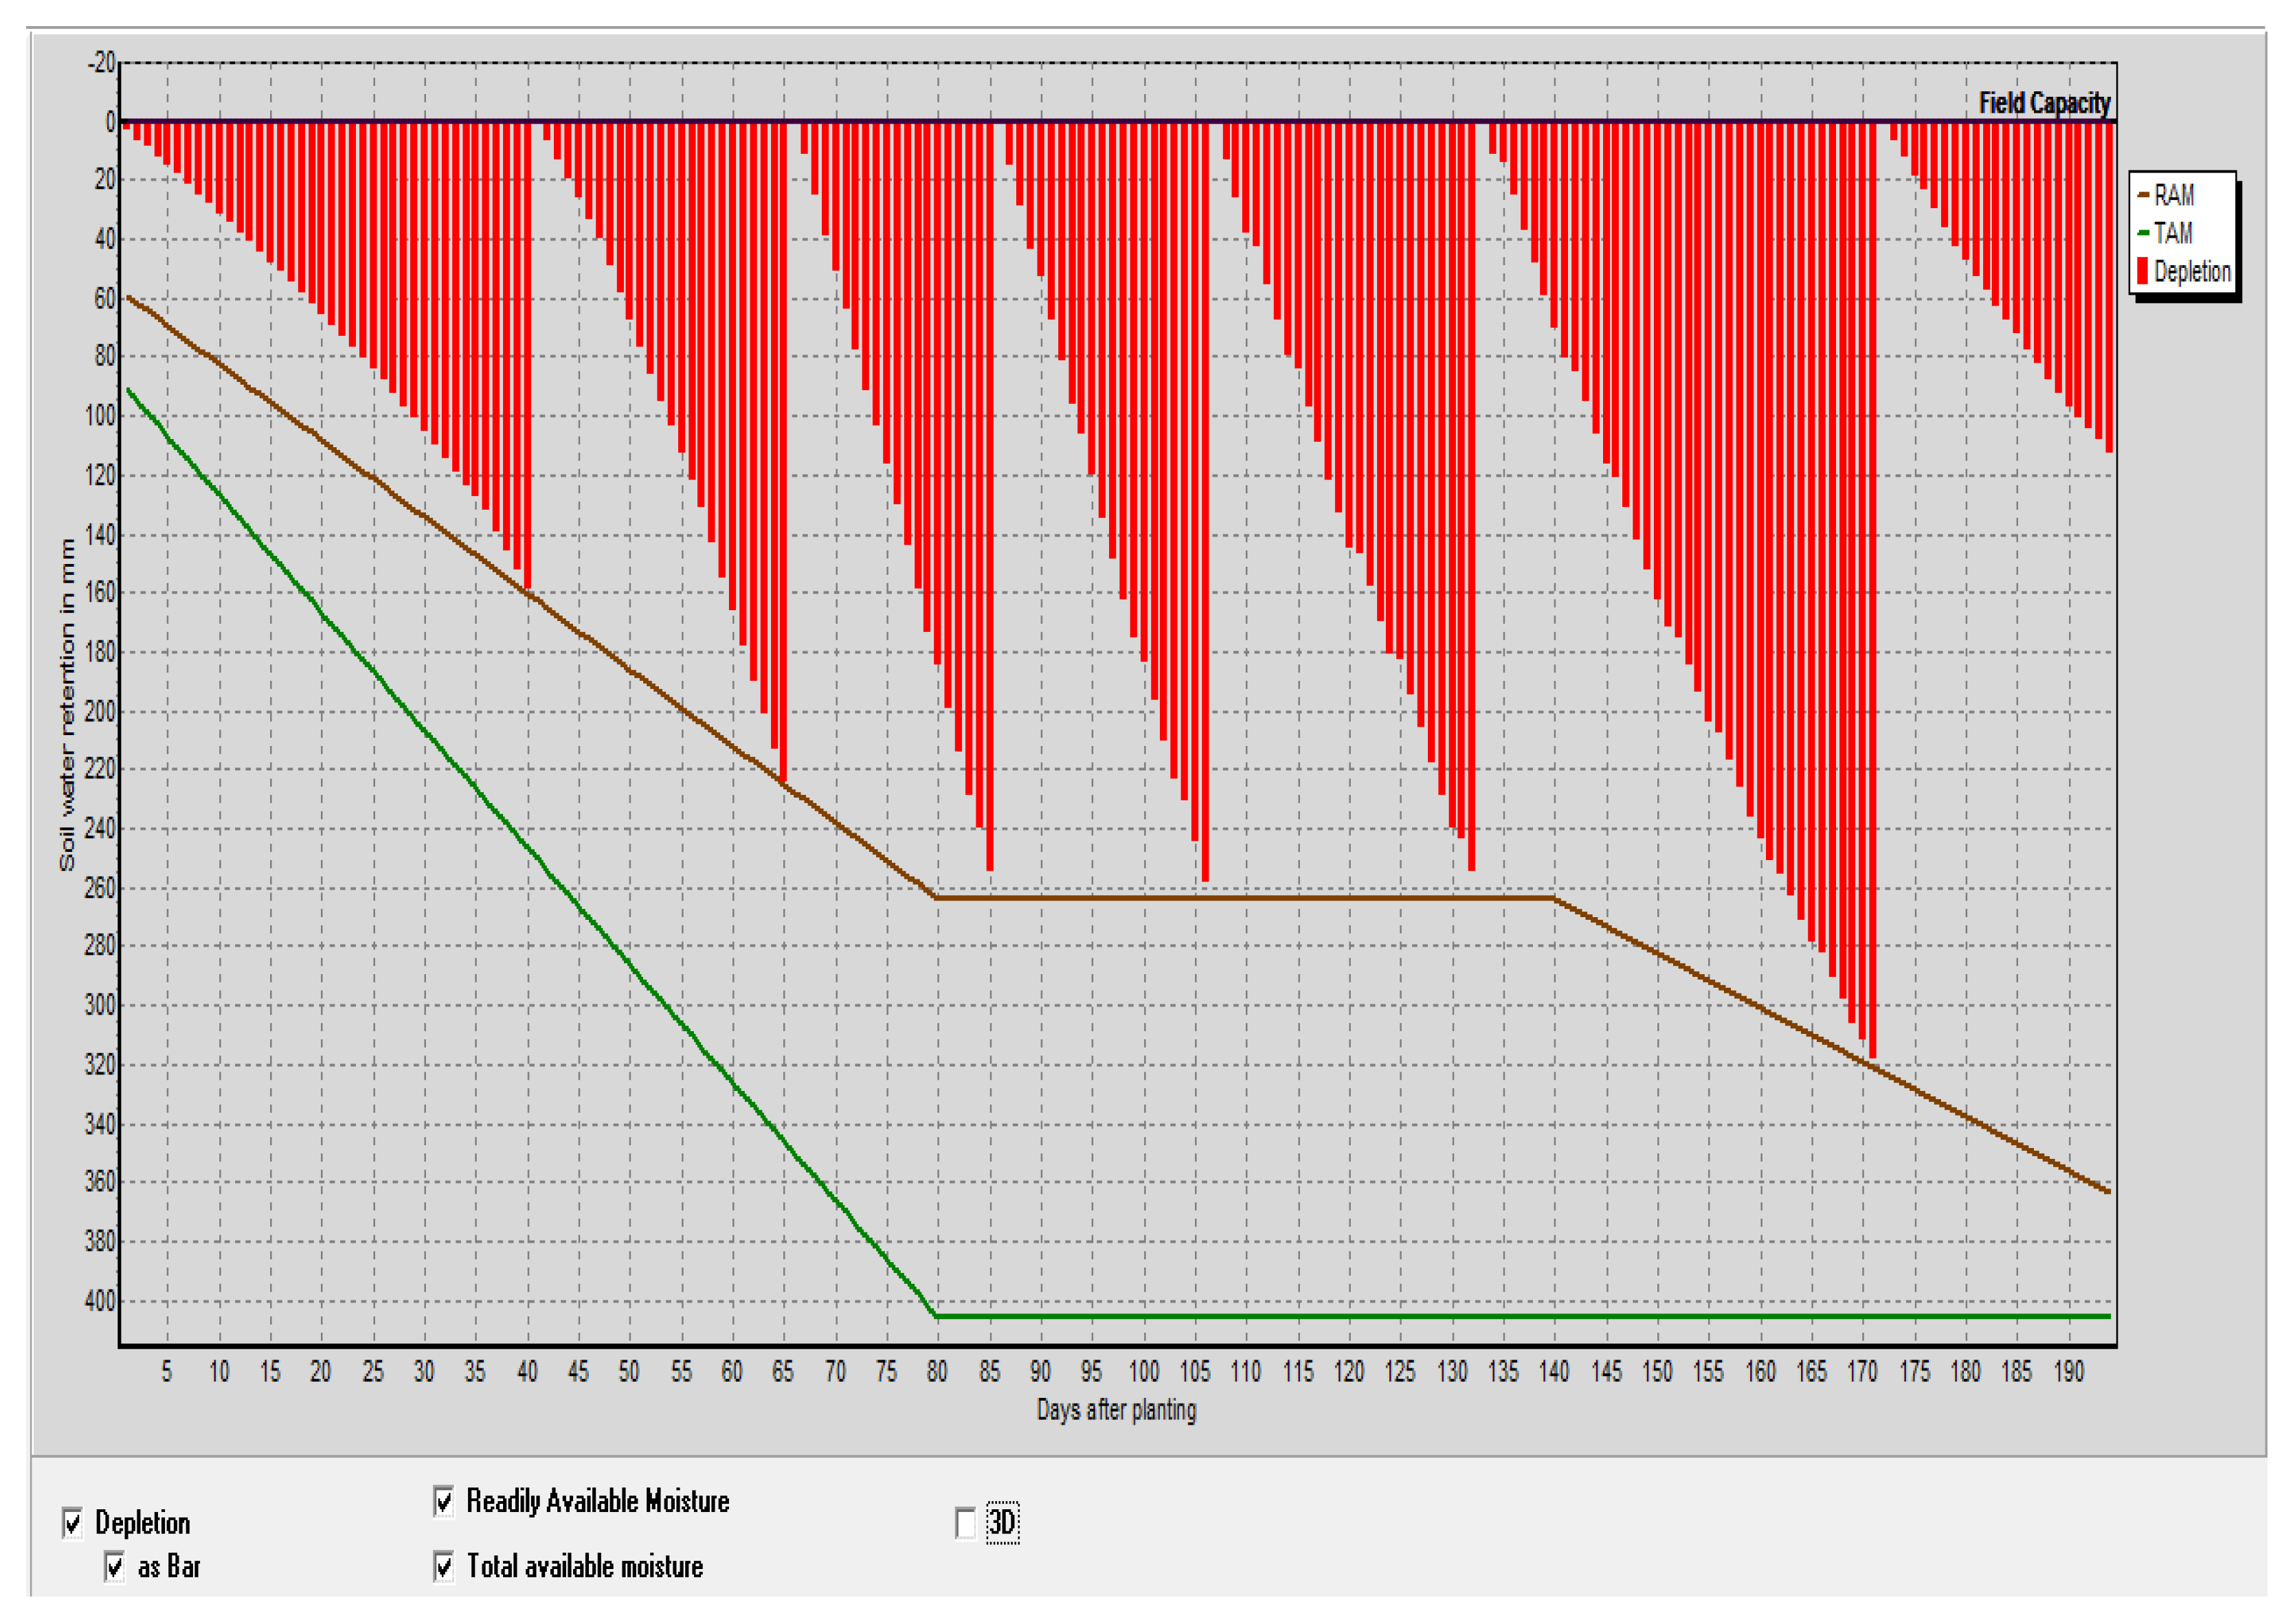
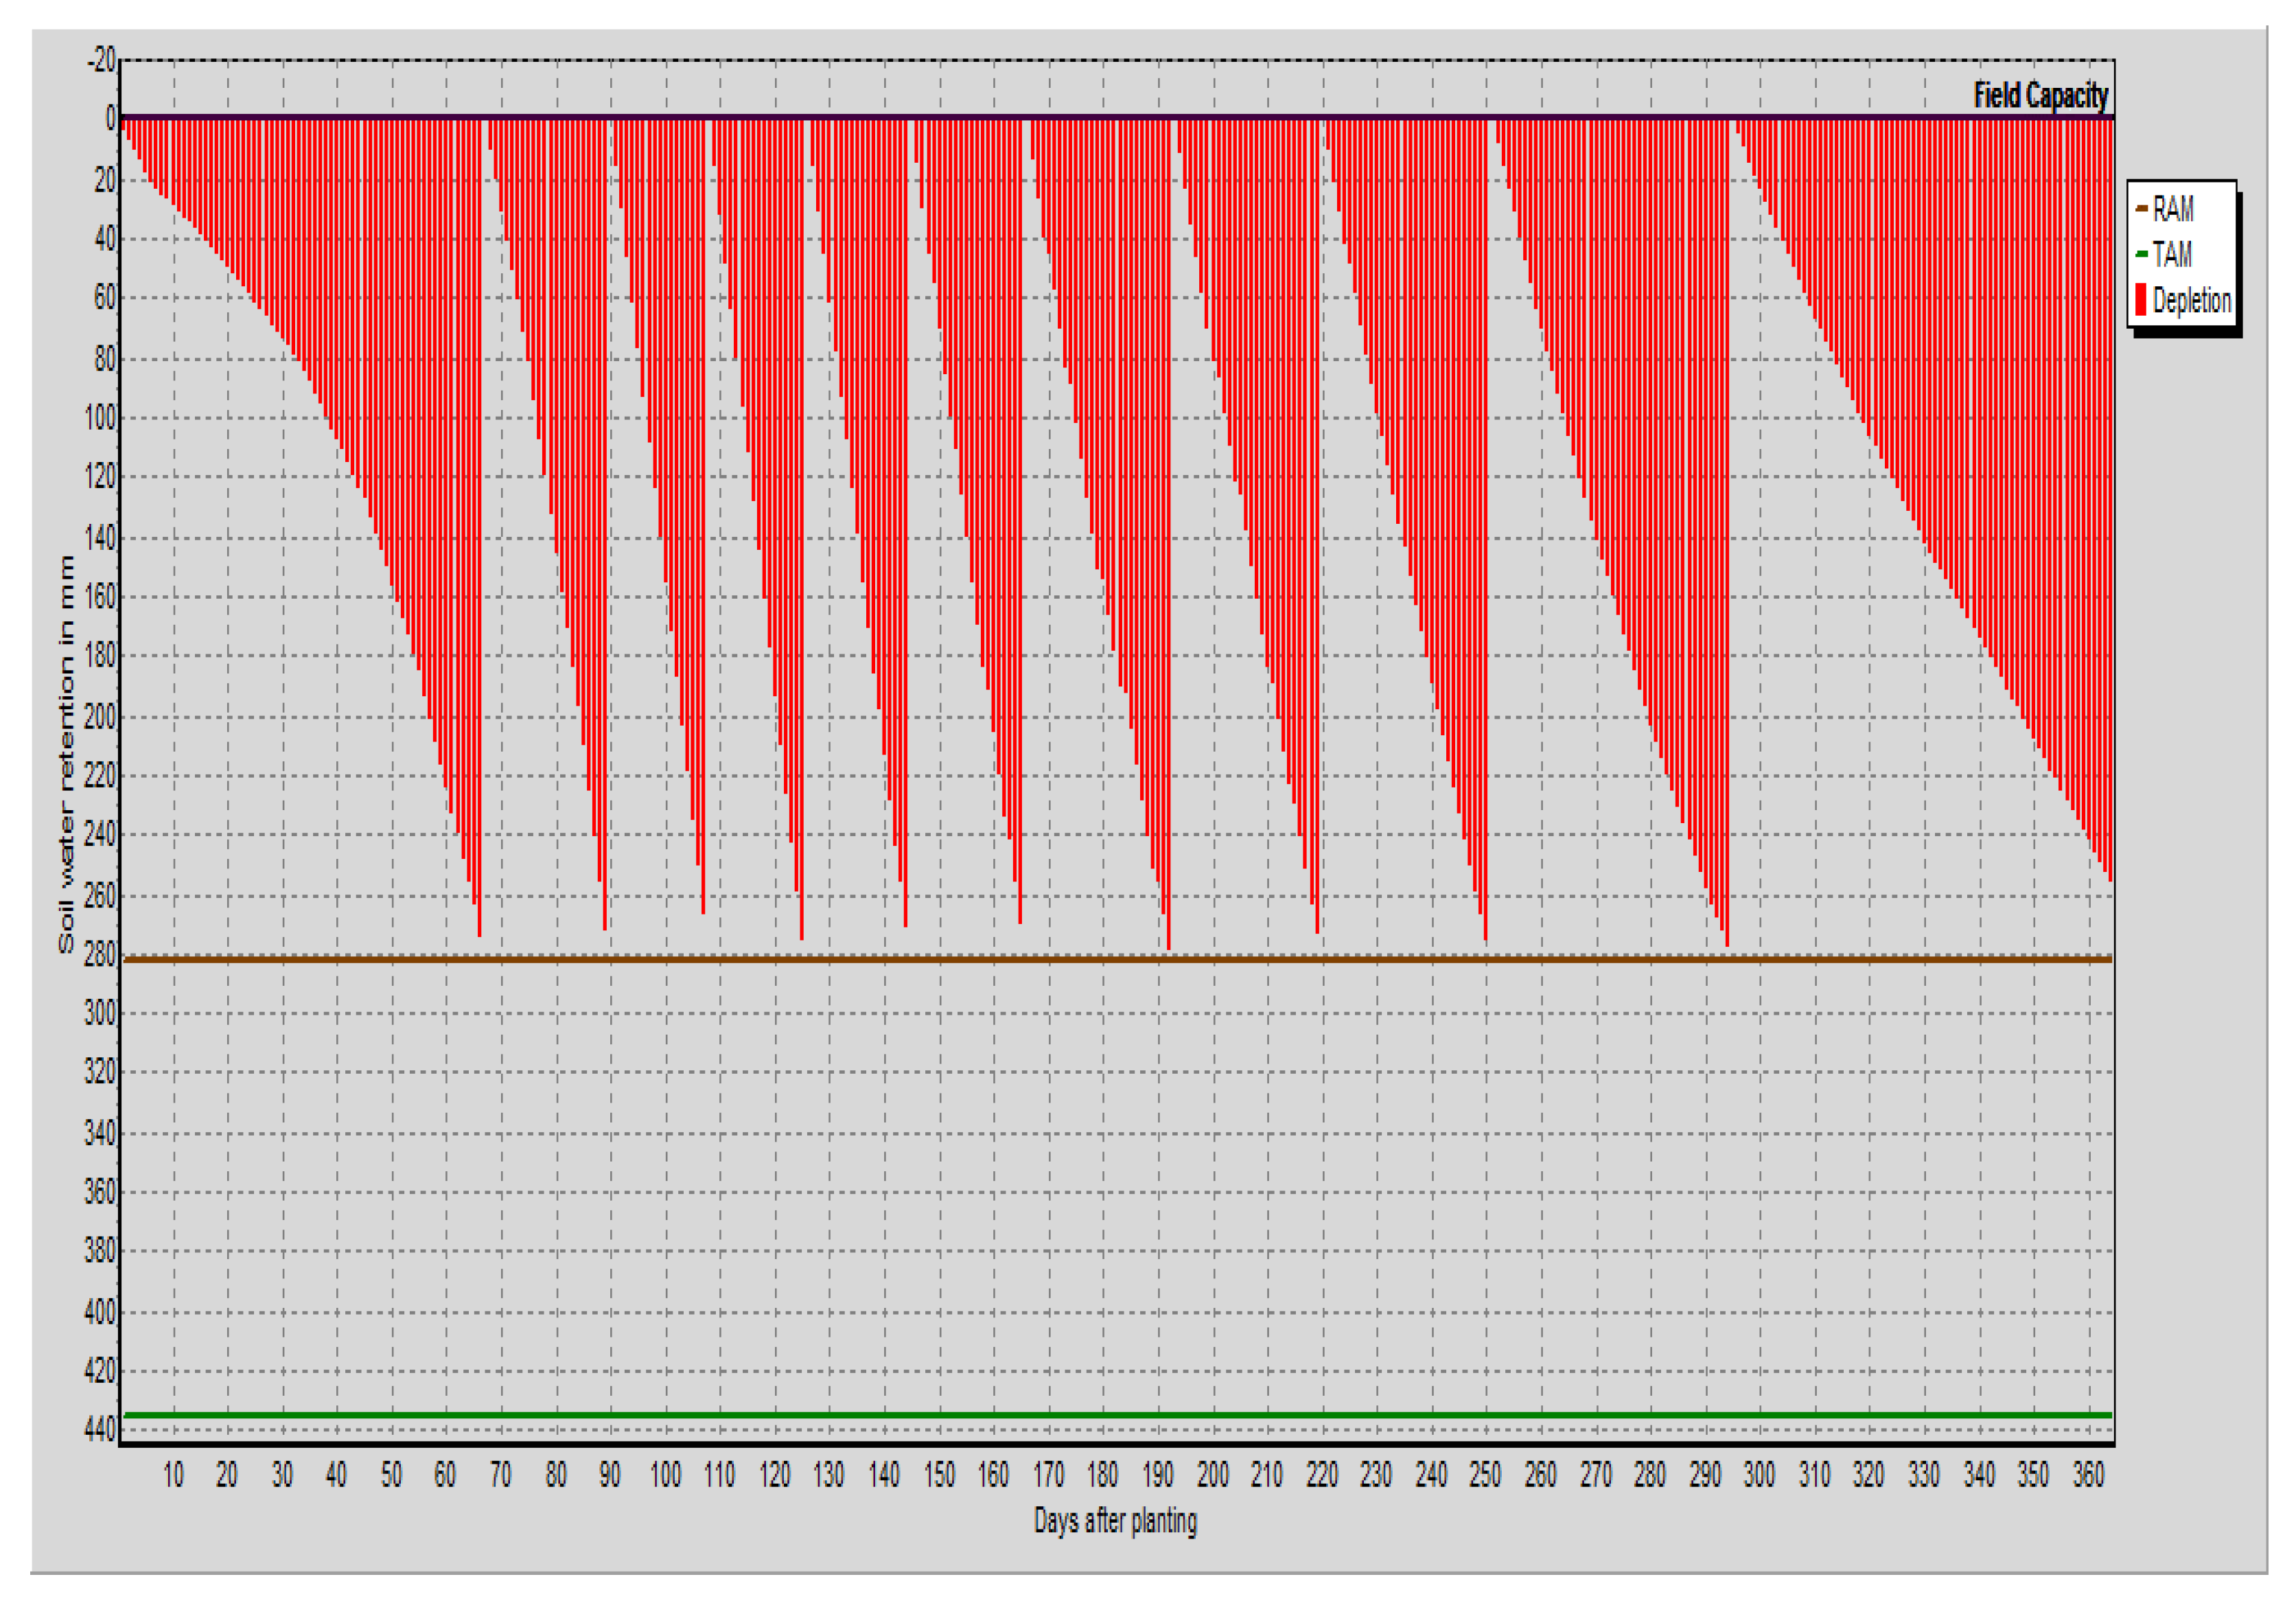
3.4. Irrigation Scheduling

Knowledge of irrigation schedules improves irrigation management in the field, which includes controlling the amount, timing, and rate of irrigation in an efficient and planned manner. Table 7, Table 8, Table 9and Table 10 and Figure 7, Figure 8, Figure 9 and Figure 10 illustrate the field crop irrigation schedules for the wheat, cotton, sugarcane, and banana crops cultivated in the study area.
Table 7 and Figure 7, created by CROPWAT show that the gross irrigation requirement for wheat is 273.7 mm and the net irrigation requirement is 191.6 mm. TAM is the total available moisture or the total amount of water available to the crop and RAM is the readily available moisture or the portion of TAM that the plant can extract from the root zone without facing water stress.
Table 8 and Figure 8 show that the gross irrigation requirement for cotton is 2188.6 mm and the net irrigation requirement is 1532.0 mm.
Table 9 and Figure 9 show that the gross irrigation requirement and the net irrigation requirements for sugarcane are 4087.9 mm and 2861.6 mm, respectively.
Table 10 and Figure 10 show the gross irrigation requirement and the net irrigation requirements for banana in the study area as 2469.9 mm and 1728.9 mm, respectively.

4. Conclusions

Analysis revealed that for the entire growing season for the four major crops—wheat, cotton, banana, and sugarcane—IWR was observed as 402.5 mm, 1655.7 mm, 1768.5 mm, and 3108.0 mm, respectively. The findings of the study show that since all crops except the wheat crop (with IWR of 402.2 mm/dec) incorporate the hot season in their life cycle, the irrigation water requirements are high due to the unfavorable value of the parameters that influence reference evapotranspiration (ETo). Further, an increase in the value of the irrigation water requirements was seen for the crops that have a lifecycle throughout the year, such as sugarcane, with its IWR of 3108.0 mm. Moreover, it was observed that rainfall reduces the irrigation water requirement by a considerable amount. The IWRs for the four main crops investigated in this study will add valuable insights for implementing a water conservation policy for this region. Consequently, by calculating the IWR of crops as well as the scheduling of irrigation, and by recognizing the behavior of weather, this study will be helpful for future researchers and can be used as a guide for farmers to decide the frequency and amount of irrigation for the studied crops.
The present study is based on 5 years of climatic data from the study area. It is recommended that higher accuracy be achieved by using a period of at least 10–20 years. The present study is based on the soil and climatic data of Shaheed Benazirabad district, Sindh, Pakistan; thus, identical studies can be carried out using the different climactic locations of the country.

Author Contributions

Conceptualization, G.S.S. and S.A.S.; methodology, G.S.S., H.A.K., and S.P.; validation, R.S.A., J.A.M., and A.D.B.; formal analysis, G.S.S., H.A.K., and S.A.S.; investigation, S.P. and J.A.M.; resources, A.D.B.; data curation, G.S.S. and S.A.S.; writing—original draft preparation, G.S.S. and S.A.S.; writing—review and editing, T.-W.K. and R.S.A. visualization, H.A.K. and S.P.; supervision, T.-W.K.; project administration, R.S.A. All authors have read and agreed to the published version of the manuscript.

Funding

This research was supported by Researcher Supporting Project number 275 P(RSP-2021/310), King Saud University, Riyadh, Saudi Arabia. This research was also supported by the Korea Environment Industry & Technology Institute (KEITI) through Water Management Innovation Program for Drought (No.2022003610001) funded by Korea Ministry of Environment.

Institutional Review Board Statement

Not applicable.

Informed Consent Statement

Not applicable.

Data Availability Statement

Data set available from the first author.

Acknowledgments

The authors are highly thankful to NASA and CLIMWAT 2.0, and highly grateful to the Food and Agriculture Organization (FAO) for developing and providing the CROPWAT model employed in the present study to determine IWR and irrigation scheduling.

Conflicts of Interest

The authors declare no conflict of interest.

References

  1. IPCC. Climate change 2007: Impacts, adaptation and vulnerability. In Contribution of Working Group II to the Fourth Assessment Report of the Intergovernmental Panel on Climate Change; Cambridge University Press: Cambridge, UK, 2007. [Google Scholar]
  2. Shah, S.A.; Jehanzaib, M.; Yoo, J.; Hong, S.; Kim, T.-W. Investigation of the Effects of Climate Variability, Anthropogenic Activities, and Climate Change on Streamflow Using Multi-Model Ensembles. Water 2022, 14, 512. [Google Scholar] [CrossRef]
  3. Shah, S.A.; Jehanzaib, M.; Lee, J.-H.; Kim, T.-W. Exploring the Factors Affecting Streamflow Conditions in the Han River Basin from a Regional Perspective. KSCE J. Civ. Eng. 2021, 25, 4931–4941. [Google Scholar] [CrossRef]
  4. IPCC. Summary for policymakers. Climate change 2013. The science of climate change. In Contribution of Working Group I to the Fifth Assessment Report of Intergovermental Panel on Climate Change; Cambridge University Press: Cambridge, UK, 2013. [Google Scholar]
  5. Panhwar, M.Y.; Panhwar, S.; Keerio, H.A.; Khokhar, N.H.; Shah, S.A.; Pathan, N. Water quality analysis of old and new Phuleli Canal for irrigation purpose in the vicinity of Hyderabad, Pakistan. Water Pract. Technol. 2022, 17, 529–536. [Google Scholar] [CrossRef]
  6. Abdo, K.S.; Fiseha, B.M.; Rientjes, T.H.M.; Gieske, A.S.M.; Haile, A.T. Assessment of climate change impacts on the hydrology of Gilgel Abay catchment in Lake Tana basin, Ethiopia. Hydrol. Process. 2009, 23, 3661–3669. [Google Scholar] [CrossRef]
  7. Schaake, J.S. From climate to flow. In Climate Change and US Water Resources; Waggoner, P.E., Ed.; John Wiley: New York, NY, USA, 1990. [Google Scholar]
  8. United Nations Environmental Program (UNEP). Global Environmental Outlook 2000; UNEP: London, UK, 1990. [Google Scholar]
  9. Taye, M.T.; Haile, M.T.; Fekadu, A.G.; Nakawuka, P. Effect of irrigation water withdrawal on the hydrology of the LakeTana sub-basin. J. Hydrol. Reg. Stud. 2021, 38, 100961. [Google Scholar] [CrossRef]
  10. Ahmadi, M.; Motamedvaziri, B.; Ahmadi, H.; Moeini, A.; Zehtabiyan, G.R. Assessment of climate change impact on surface runoff, statistical downscaling and hydrological modeling. Phys. Chem. Earth Parts A/B/C 2019, 114, 102800. [Google Scholar] [CrossRef]
  11. Jamal, Q.K.; Shanthasheela, M.; Sureshverma, R.; Vasanthapriya, S. Factors Influencing the Knowledge and Adoption of Sustainable Sugarcane Initiative (SSI) by the Sugarcane Farmers of Villupuram District. Int. J. Appl. Res. Technol. 2017, 2, 106–112. [Google Scholar]
  12. Khan, M.J.; Malik, A.; Rahman, M.; Afzaal, M.; Mulk, S. Assessment of Crop Water Requirement for Various Crops in Peshawar, Pakistan Using CROPWAT Model. Irrig. Drain. Syst. 2019, 10, 9. [Google Scholar]
  13. Dingre, S.K.; Gorantiwar, S.D. Determination of the water requirement and crop coefficient values of sugarcane by field water balance method in semiarid region. Agric. Water Manag. 2020, 232, 106042. [Google Scholar] [CrossRef]
  14. Pedro-Monzonís, M.; Solera, A.; Ferrer, J.; Estrela, T.; Paredes-Arquiola, J. A review of water scarcity and drought indexes in water resources planning and management. J. Hydrol. 2015, 527, 482–493. [Google Scholar] [CrossRef] [Green Version]
  15. Martín-Carrasco, F.; Garrote, L.; Iglesias, A.; Mediero, L. Diagnosing causes of water scarcity in complex water resources systems and identifying risk management actions. Water Resour. Manag. 2013, 27, 1693–1705. [Google Scholar] [CrossRef] [Green Version]
  16. Janjua, S.; Hassan, I.; Muhammad, S.; Ahmed, S.; Ahmed, A. Water management in Pakistan’s Indus Basin: Challenges and opportunities. Water Policy 2021, 23, 1329–1343. [Google Scholar] [CrossRef]
  17. Yasmeen, A. Irrigation System of Pakistan World’s Largest Irrigation Source Indus Basin of Pakistan; 2021. [Google Scholar]
  18. Khan, S.; Hasan, M. Climate Classification of Pakistan. Int. J. Econ. Environ. Geol. 2019, 10, 60–71. [Google Scholar]
  19. Allen, R.G.; Pereira, L.S.; Raes, D.; Smith, M. Crop Evapotranspiration: Guidelines for Computing Crop Water Requirements. In United Nations FAO, Irrigation and Drainage Paper 56; FAO: Rome, Italy, 1998. [Google Scholar]
  20. Allen, R.G.; Pereira, L.S.; Simth, M.; Raes, D.; Wright, J.L. FAO-56 Dual Crop Coefficient Method for Estimating Evaporation from Soil and Application Extensions. J. Irrig. Drain. Eng. 2005, 131, 2–13. [Google Scholar] [CrossRef] [Green Version]
  21. Allen, R.G.; Pruitt, W.O.; Wright, J.L.; Howell, T.A.; Ventura, F.; Snyder, R.; Itenfisu, D.; Steduto, P.; Berengena, J.; Yrisarry, J.B.; et al. A recommendation on standardized surface resistance for hourly calculation of reference ETo by the FAO56 Penman-Monteith method. Agric. Water Manag. 2006, 81, 1–22. [Google Scholar] [CrossRef]
  22. Gabr, M.E.; Fattouh., E.M. Assessment of irrigation management practices using FAO-CROPWAT 8, case studies: Tina Plain and East South El-Kantara, Sinai, Egypt. Ain Shams Eng. J. 2021, 12, 1623–1636. [Google Scholar] [CrossRef]
  23. Bartolomeu, F.T.; Chimene, C. Efficiency of empirical methods for reference evapotranspiration estimation in the district of Vilankulo, Mozambique. Int. J. Water Res. Environ. Eng. 2019, 11, 76–82. [Google Scholar] [CrossRef]
  24. Saber, M.; Mokhtar, M.; Bakheit, A.; Elfeky, A.M.; Gameh, M.; Mostafa, A.; Sefelnasr, A.; Kantous, S.A.; Sumi, T.; Hori, T.; et al. An integrated assessment approach for fossil groundwater quality and crop water requirements in the El-Kharga Oasis, Western Desert, Egypt. J. Hydrol. Reg. Stud. 2022, 40, 101016. [Google Scholar] [CrossRef]
  25. Imrak, S.; Dorota, H. “Evapotranspiration: Potential or Reference”. IFAS Extension. Agric. Biol. Eng. 2017, 256. [Google Scholar]
  26. Ahmed, H.I.; Liu, J. Evaluating Reference Crop Evapotranspiration (ETo) in the Centre of Guanzhong Basin—Case of Xingping & Wugong, Shaanxi, China. Engineering 2013, 5, 459–468. [Google Scholar]
  27. Raziei, T.; Pereira, L.S. Estimation of ETo with Hargreaves-Samani and FAO-PM temperature methods for a wide range of climates in Iran. Agric. Water Manag. 2013, 121, 1–18. [Google Scholar] [CrossRef]
  28. Surendran, U.; Sushanth, C.M.; Joseph, E.J.; Al-Ansari, N.; Yaseen, Z.M. FAO CROPWAT model-based irrigation requirements for coconut to improve crop and water productivity in Kerala, India. Sustainability 2019, 18, 5132. [Google Scholar] [CrossRef] [Green Version]
  29. Alemayehu, Y.A.; Steyn, J.M.; Annandale, J.G. FAO-type crop factor determination for irrigation scheduling of hot pepper (capsicum annuum L.) cultivars. S. Afr. J. Plant Soil 2009, 26, 186–194. [Google Scholar] [CrossRef] [Green Version]
  30. de Azevedo, P.V.; de Souza, C.B.; da Silva, B.B.; da Silva, V.P.R. Water requirements of pineapple crop grown in a tropical environment, Brazil. Agric. Water Manag. 2007, 88, 201–208. [Google Scholar] [CrossRef]
  31. Zhong, S.Q.; Zhang, W.H.; Lv, J.K.; Wei, C.F. Temporal variation of soil water and its influencing factors in hilly area of Chongqing, China. Int. J. Agric. Biol. Eng. 2017, 7, 47–59. [Google Scholar]
  32. FAO. Handbook on Climate Information for Farming Communities: What Farmers Need and What Is Available; FAO: Rome, Italy, 2019. [Google Scholar]
  33. Khan, Z.A.; Imran, M.; Umer, J.; Ahmed, S.; Diemuodeke, O.E.; Abdelatif, A.O. Assessing Crop Water Requirements and a Case for Renewable Energy Powered Pumping System for Wheat, Cotton and Sorghum Crops in Sudan. Energies 2021, 14, 8133. [Google Scholar] [CrossRef]
Figure 1. Geographical feature and location of the study area.
Water 14 02578 g001
Figure 2. (a) Minimum and (b) maximum temperatures from 2017 to 2021 in the study area.
Water 14 02578 g002aWater 14 02578 g002b
Figure 3. Monthly rainfall, humidity, and sunshine hours in the study area.
Water 14 02578 g003
Figure 4. Soil data in the study area.
Water 14 02578 g004
Figure 5. Reference evapotranspiration in the study area.
Water 14 02578 g005
Figure 6. Graphical representation of the climatic parameters Eto and Peff. in the study area.
Water 14 02578 g006
Figure 7. Irrigation schedule for wheat.
Water 14 02578 g007
Figure 8. Irrigation schedule for cotton.
Water 14 02578 g008
Figure 9. Irrigation schedule for sugarcane.
Water 14 02578 g009
Figure 10. Irrigation schedule for banana.
Water 14 02578 g010
Table 1. Dates of sowing and harvesting of crops recommended by Department of Agriculture, Government of Sindh.
CropDate of SowingDate of Harvesting
(Date/Month)(Date/Month)
Wheat01/1110/03
Cotton15/0426/10
Sugarcane15/0214/02
Banana01/0324/01
Table 2. Irrigation water requirement of wheat.
MonthDecadeStageKc CoefficientETcETcEffective RainfallIrrigation
Required
(mm/day)mmmmmm
November1Initial0.31.6160.915.1
November2Initial0.31.4414.40.913.5
November3Initial0.31.3313.30.712.6
December1Development0.461.8918.90.318.6
December2Development0.762.8228.2028.2
December3Mid1.064.2842.80.242.6
January1Mid1.184.1841.80.641.2
January2Mid1.184.0640.60.939.7
January3Mid1.184.9449.40.948.5
February1Late1.174.9149.10.848.3
February2Late0.964.3543.50.842.6
February3Late0.73.5728.60.827.8
March1Late0.432.4524.50.723.8
Total 4118.5402.5 mm/
crop season
Table 3. Irrigation water requirement of cotton.
MonthDecadeStageKc CoefficientETcETcEffective RainfallIrrigation
Required
(mm/Day)mmmmmm
April2Initial0.351.9119.1118.2
April3Initial0.353.4534.51.433.1
May1Initial0.353.7637.6136.6
May2Development0.394.5245.20.744.5
May3Development0.587.4574.51.173.4
June1Development0.789.2592.5191.5
June2Development0.9711.75117.51116.5
June3Development1.1613.58135.83.6132.2
July1Mid1.2914.65146.56.4140.2
July2Mid1.314.31143.18.6134.5
July3Mid1.314.76147.611136.6
August1Mid1.312.412414.5109.5
August2Mid1.311.51115.117.497.7
August3Mid1.312.39123.915.1108.8
September1Late1.2510.68106.812.594.3
September2Late1.139.4694.61183.6
September3Late1.017.8178.17.670.5
October1Late0.896.3632.960.1
October2Late0.784.9949.9049.9
October3Late0.682.4124.10.124
Total 1773.5117.91655.7 mm/
crop season
Table 4. Irrigation water requirement of sugarcane.
MonthDecadeStageKc CoefficientETcETcEffective RainfallIrrigation
Required
(mm/day)mmmmmm
February2Init0.81.4614.60.514.1
February3Init0.41.6416.40.815.6
March1Init0.42.2722.70.722
March2Development0.422.6260.625.4
March3Development0.564.4244.20.943.3
April1Development0.735.9359.31.358
April2Development0.898.0480.41.778.7
April3Development1.0510.31031.4101.6
May1Development1.212.96129.61128.6
May2Mid1.3415.54155.40.7154.7
May3Mid1.3617.48174.81.1173.7
June1Mid1.3616.14161.41160.4
June2Mid1.3616.48164.81163.8
June3Mid1.3615.92159.23.6155.6
July1Mid1.3615.36153.66.4147.2
July2Mid1.3614.93149.38.6140.7
July3Mid1.3615.41154.111143.1
August1Mid1.3612.94129.414.5114.9
August2Mid1.3612.01120.117.4102.7
August3Mid1.3612.93129.315.1114.2
September1Mid1.3611.61116.112.5103.6
September2Mid1.3611.35113.511102.5
September3Mid1.3610.47104.77.697.1
October1Mid1.369.5595.52.992.6
October2Mid1.368.7187.1087.1
October3Mid1.368.7787.70.387.4
November1Mid1.367.2372.30.971.4
November2Mid1.366.3763.70.962.8
November3Late1.275.6356.30.755.6
December1Late1.214.9549.50.349.2
December2Late1.154.343043
December3Late1.094440.243.8
January1Late1.033.6336.30.635.7
January2Late0.973.3233.20.932.3
January3Late0.913.7937.90.937
February1Late0.843.5435.40.834.6
February2Late0.81.4314.30.314.0
Total 3245.4130.13108 mm/
crop season
Table 5. Irrigation water requirement of banana.
MonthDecadeStageKc CoefficientETcETcEffective RainfallIrrigation
Required
(mm/Day)mmmmmm
March1Initial0.52.8428.40.727.7
March2Initial0.53.1231.20.630.6
March3Initial0.53.5939.50.938.6
April1Initial0.54.0840.81.339.5
April2Initial0.54.5445.41.743.7
April3Initial0.54.9249.21.447.8
May1Initial0.55.3853.8152.8
May2Initial0.55.8580.757.3
May3Development0.56.4664.61.163.5
June1Development0.536.363162
June2Development0.576.969168
June3Development0.617.1271.23.667.6
July1Development0.657.3173.16.466.7
July2Development0.687.5375.38.666.7
July3Development0.728.2482.41171.4
August1Development0.777.3173.114.558.6
August2Development0.87.1371.317.453.9
August3Development0.858.0580.515.165.4
September1Development0.897.5975.912.563.4
September2Development0.927.7477.41166.4
September3Development0.967.4474.47.666.8
October1Development17.0570.52.967.6
October2Development1.046.6966.9066.9
October3Development1.086.6969.90.369.6
November1Development1.125.9859.80.958.9
November2Mid1.145.4554.50.953.6
November3Mid1.145.0550.50.749.8
December1Mid1.144.6546.50.346.2
December2Mid1.144.2642.6042.6
December3Late1.134.5745.70.245.5
January1Late1.13.8938.90.638.3
January2Late1.073.6736.70.935.8
January3Late1.051.5615.60.315.3
Total 1895.7127.11768.5 mm/
crop season
Table 6. Combined irrigation water requirements.
CropDate of SowingDate of HarvestingIrrigation Required
(Date/Month)(Date/Month)(mm)
Wheat01/1110/03402.5
Cotton15/0426/101655.7
Sugarcane15/0214/023108
Banana01/0324/011768.5
Note: The dates of sowing and harvesting are recommended by the Agriculture Department, Government of Sindh.
Table 7. Irrigation schedule for wheat.
Date15 January10 March
Day76End
StageMidEnd
Rainfall (mm)00
Ks (fraction)11
ETa (%)100100
Depletion (%)5560
Net Irrigation (mm)191.6--
Gross Irrigation273.7--
Table 8. Irrigation schedule for cotton.
Date25-May19-June9-July30-July25-August3-October26-October
Day416686107133172End
StageDevDevMidMidMidEndEnd
Rainfall (mm)000001.40
Ks (fraction)1111111
ETa (%)1001001001001001000
Depletion (%)66686667658028
Net Irrigation (mm)165.7236.4269.2271.4265.9323.4--
Gross Irrigation236.8337.7384.6387.7379.8462
Table 9. Irrigation schedule for sugarcane.
Date22-April15-May2-June20-June9-July30-July26-August22-September23-October6-December14-February
Day6790108126145166193220251295End
StageDevDevMidMidMidMidMidMidMidEndEnd
Rainfall (mm)000000000.100
Ks (fraction)11111111111
ETa (%)1001001001001001001001001001000
Depl. (%)6566656766656765656559
Net Irrigation (mm)284.9287.6283.3292.4287.2284.2291.1284.5283.3282.9--
Gross Irrigation 407410.9404.8417.8410.3406415.9406.5404.8404.2--
Table 10. Irrigation schedule for banana.
Date19-March5-April21-April6-May20-May4-June18-June2-July16-July31-July19-August6-September22-September9-October27-October17-November12-December10-January24-January
Day193652678196110124138153172190206223241262287316End
StageInitInitInitInitInitDevDevDevDevDevDevDevDevDevDevMidMidEndEnd
Rainfall (mm)000000000000000.10.5000
Ks (fraction)1111111111111111111
ETa (%)100100100100100100100100100100100100100100100100100100100
Depl. (%)55555656555856565353505149494747464518
Net Irrigation (mm)556268757988929696100102110111116118121121117
Deficit (mm)000000000000000000
Loss (mm)000000000000000000
Gross Irrigation 788797100112126131137137144146157158165169174173168
Flow (l/s/ha)0.40.60.70.820.90.91.11.11.11.110.891.011.151.131.090.960.80.67
Publisher’s Note: MDPI stays neutral with regard to jurisdictional claims in published maps and institutional affiliations.

