Article

Vulnerability Mapping of Groundwater Resources of Mekelle City and Surroundings, Tigray Region, Ethiopia

by
Kaleab Adhena Abera
1,2,3,*,
Tesfamichael Gebreyohannes
2,
Berhane Abrha
2,
Miruts Hagos
2,
Gebremedhin Berhane
2,
Abdelwassie Hussien
2,
Ashebir Sewale Belay
1,
Marc Van Camp
1 and
Kristine Walraevens
1
1
Laboratory for Applied Geology and Hydrogeology, Department of Geology, Ghent University, 9000 Ghent, Belgium
2
Department of Geology, School of Earth Sciences, Mekelle University, Mekelle P.O. Box 231, Ethiopia
3
Department of Geology, Faculty of Mines, Shire Campus, Aksum University, Aksum P.O. Box. 314, Ethiopia
*
Author to whom correspondence should be addressed.
Water 2022, 14(16), 2577; https://doi.org/10.3390/w14162577
Submission received: 21 July 2022 / Revised: 17 August 2022 / Accepted: 17 August 2022 / Published: 21 August 2022
(This article belongs to the Section Water Resources Management, Policy and Governance)

Abstract

:
The management and monitoring of the quality of water resources in the Mekelle area are challenging, due to both geogenic and anthropogenic impacts. The extent of these impacts and the sources of pollution in this area have not been thoroughly investigated. In this article, a mapping of water resources vulnerability was carried out using the DRASTIC method and a modified DRASTIC vulnerability map was produced. Single-parameter and map-removal sensitivity analyses were performed on the relevant rates and weights. A final DRASTIC vulnerability index, varying from 54 to 140, was divided into four vulnerability classes: low (225.7 km2), medium (302.8 km2), high (307.2 km2), and very high (187.6 km2); the values in the parentheses indicate the corresponding areal coverage of each class. Similarly, a modified DRASTIC vulnerability index, ranging from 91 to 192, was divided into four vulnerability classes: low (166.4 km2), medium (266.8 km2), high (338.0 km2), and very high (252.2 km2) Nitrates were used to validate both models. in which moderate positive correlations (with Pearson’s correlation coefficient, r) of 0.681 and 0.702 were calculated for the DRASTIC and modified DRASTIC indices, respectively. A comparison of the two maps showed that significant sources of pollution are located in areas with high to very high vulnerability. The results of this research work can be used for the protection and monitoring of groundwater resources in the Mekelle area.

1. Introduction

The contamination of water resources is a serious issue of environmental degradation. Groundwater resources contribute significantly to the global realization of human rights to water [1,2,3]. However, agriculture and the rapid growth of urbanization and industrialization have resulted in a high rate of water resource consumption and an over-abstraction of groundwater [4,5]. In addition to overexploitation, groundwater is vulnerable to anthropogenic and geogenic (natural) sources of pollution [6,7]. The rates of mortality and illness in many parts of Africa, due to water-borne diseases, i.e., from contaminated water, is very high [8].
Geogenic contamination is the main cause of an elevated concentration of chloride, sulfate, uranium, and other trace elements in groundwater [1,9,10,11]. In general, geology, topography, and climate are the major influencing factors for the overall flow dynamics and quality of groundwater. The geological and hydrogeological nature of groundwater reservoirs is controlled by geological environments [12]. Specifically, water-rock interactions have direct impacts on groundwater quality [13]. To determine the quantitative status of the groundwater resource, regional studies of groundwater recharge are crucial [14].
The hydrogeological setting of this article’s study area, the Mekelle area in Ethiopia, is strongly controlled by geology and by associated tectonic and non-tectonic geological structures [15]. Faults, joints of varying orientation and spacing, and beddings are the main geological structures in the area. These structures play a major role in the inflow and outflow of water resources, as most fractures are reflections of subsurface structures. The fractures, including joints and fault zones, could increase the porosity and permeability of water-bearing formations [16].
Granular and weathered volcanic aquifers are the main sources of fresh groundwater in arid and semi-arid areas [17]. For example, in Ethiopia, around 90% of fractured, volcanic aquifer-hosted, fresh groundwater is used for domestic and industrial purposes [18]. The aquifers in the Mekelle area are characterized by both sedimentary and fractured volcanic (dolerite) aquifers. The dolerites, which cover a very large area and range from 4 m to 113 m in thickness [19], are found in the form of a swarm of dikes and sills. These aquifers serve as shallow-depth groundwater-bearing formations. The fractured zones are secondary weak planes that are usually networked, resulting in high permeability [20,21].
In addition to the possible natural influences described above, such as geology and structural features, various anthropogenic factors can degrade the quality of groundwater, usually after untreated domestic or industrial wastewater or irrigation water comes into contact and mixes with natural water resources [22,23]. Generally, the contaminants that are triggered by anthropogenic impacts can directly or indirectly influence groundwater quality. While the geogenic impact on water resources depends mainly on aquifer chemistry, the anthropogenic impact stems from nonpoint agricultural sources and wastes from households, municipalities, industries, and other human activities [24]. Because groundwater pollution is a slow process that can affect water quality on a local or regional scale [25], the planning and management of water resources are very essential in protecting and using water for different purposes [26].
To protect and manage groundwater resources, various scientific tools and hydrogeological maps have been applied [27]. Vulnerability mapping is one of the tools used for groundwater management and protection [28]. The approaches in vulnerability mapping are either physical-process-based, statistical, or overlay-and-index methods [29,30,31].Water quality assessment can be carried out on both a large scale and a small scale in a given catchment, with the main focus on identifying the pollutant type, the pollutant source, and the pollution levels [32]. Knowing and classifying the kinds and the levels of geogenic and anthropogenic threats to the quality of water resources helps to prevent further deterioration and potentially promotes treatment and remediation measures [33]. The quality status of water is normally determined after in situ physicochemical characteristics are measured and further analyses in the laboratory are conducted. However, prior to water sampling, geological and hydrogeological mapping, structural and fracture parameter evaluation, and assessing the actual vulnerability of water to pollution are required so that the samples may be compared with inventoried sources of possible pollution.
Vulnerability mapping of groundwater resources using the DRASTIC method, or its modified versions, is now a widely used map overlay-and-indexing method [34,35,36,37,38]. The DRASTIC method was developed for the United States Environmental Protection Agency (EPA) by the American Water Well Association. [39]. It uses seven basic evaluation parameters: depth to water table (D), recharge rate (R), aquifer media (A), soil type (S), topography (T), vadose zone (I), and hydraulic conductivity (C). With these seven parameters and their cumulative output, the DRASTIC method is universally accepted for mapping aquifer vulnerability to pollution, and it has been used in many countries [16,39,40,41,42,43]. There have been few vulnerability studies concerning the contamination of groundwater in the city of Mekelle and its environs. Berhe Zenebe et al. [44] established four vulnerability zones of the Ellala-Aynalem catchments in the Mekelle area, using the DRASTIC and modified DRASTIC methods with an additional land use layer. However, their study was limited to an area of approximately 493 km2 and lineament density, an important hydrogeological parameter, was not considered in their assessment.
Therefore, the objective of the current study is to investigate the vulnerability of the groundwater resources of the city of Mekelle and its surroundings, an area of approximately 1023.4 km2, using the DRASTIC and modified DRASTIC methods to identify the parts of the area that are most susceptible to anthropogenic pollution, with the goal of preventing further deterioration. We added two parameters (lineament and land use maps) to the seven parameters of the classical DRASTIC method, to include their possible influence on the vulnerability of groundwater resources in our study of the area. Moreover, we aimed to validate the generated vulnerability maps using nitrates that were measured in the groundwaters of the research area.

2. Materials and Methods
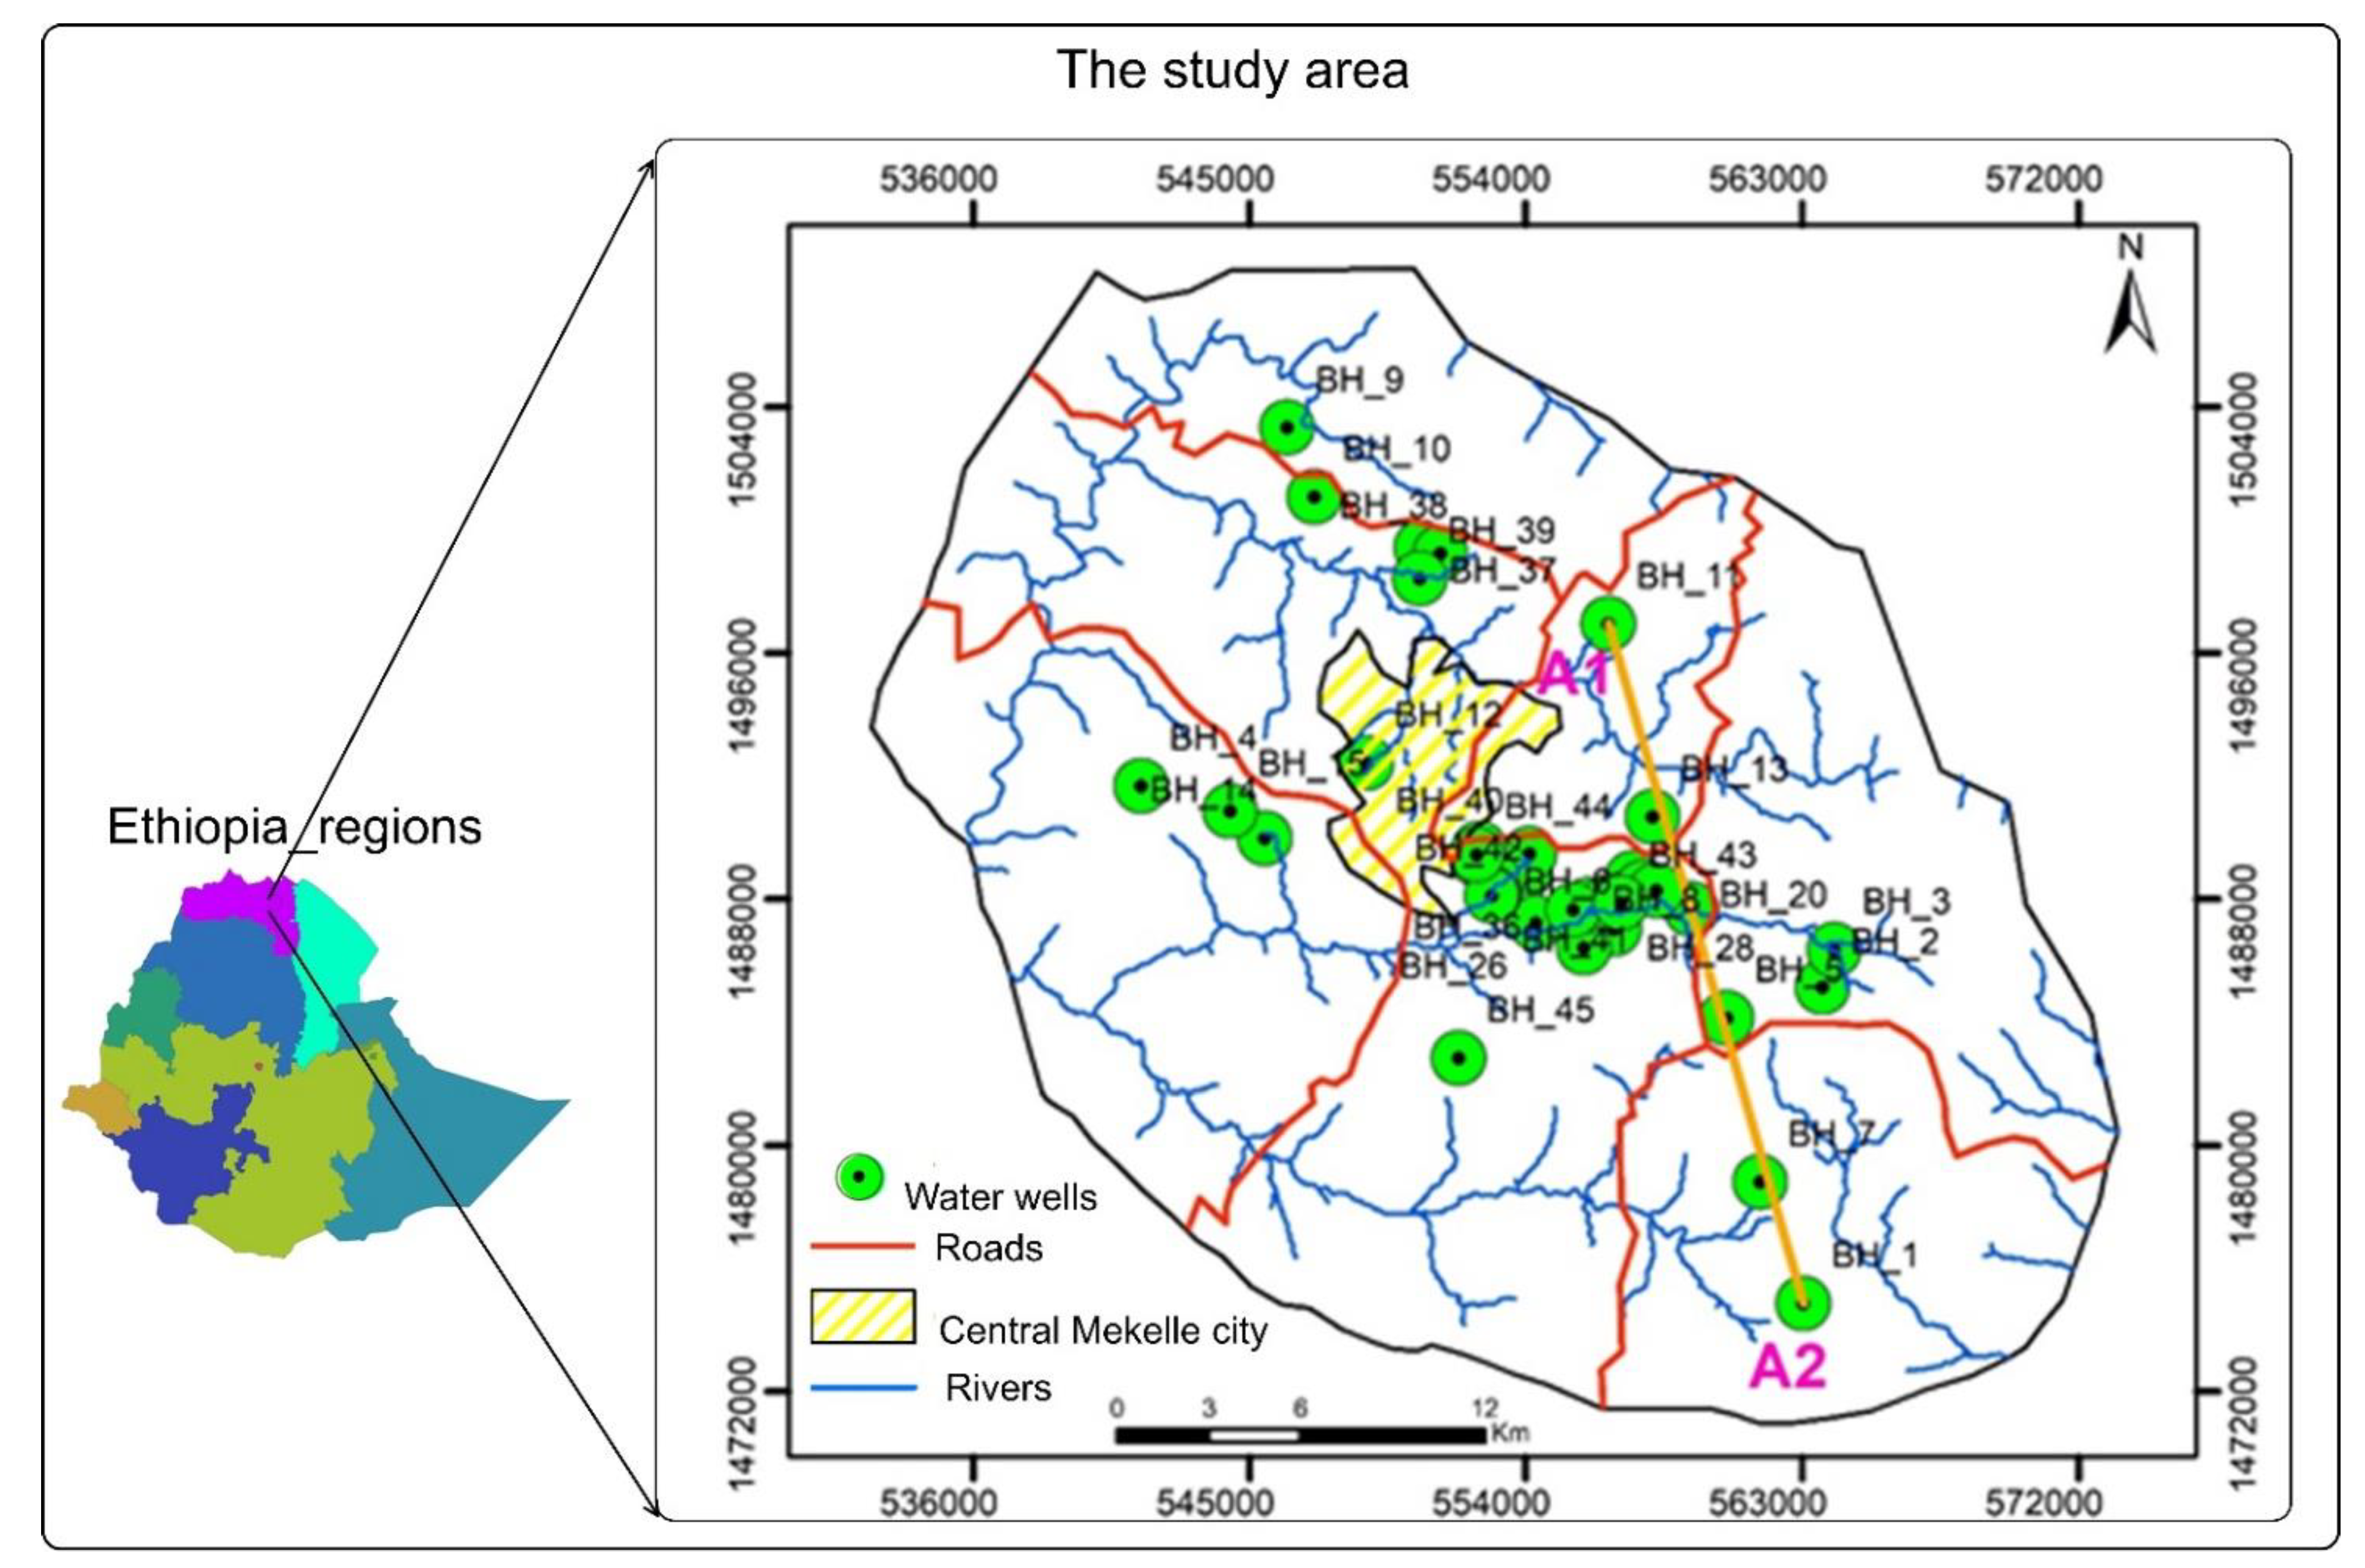
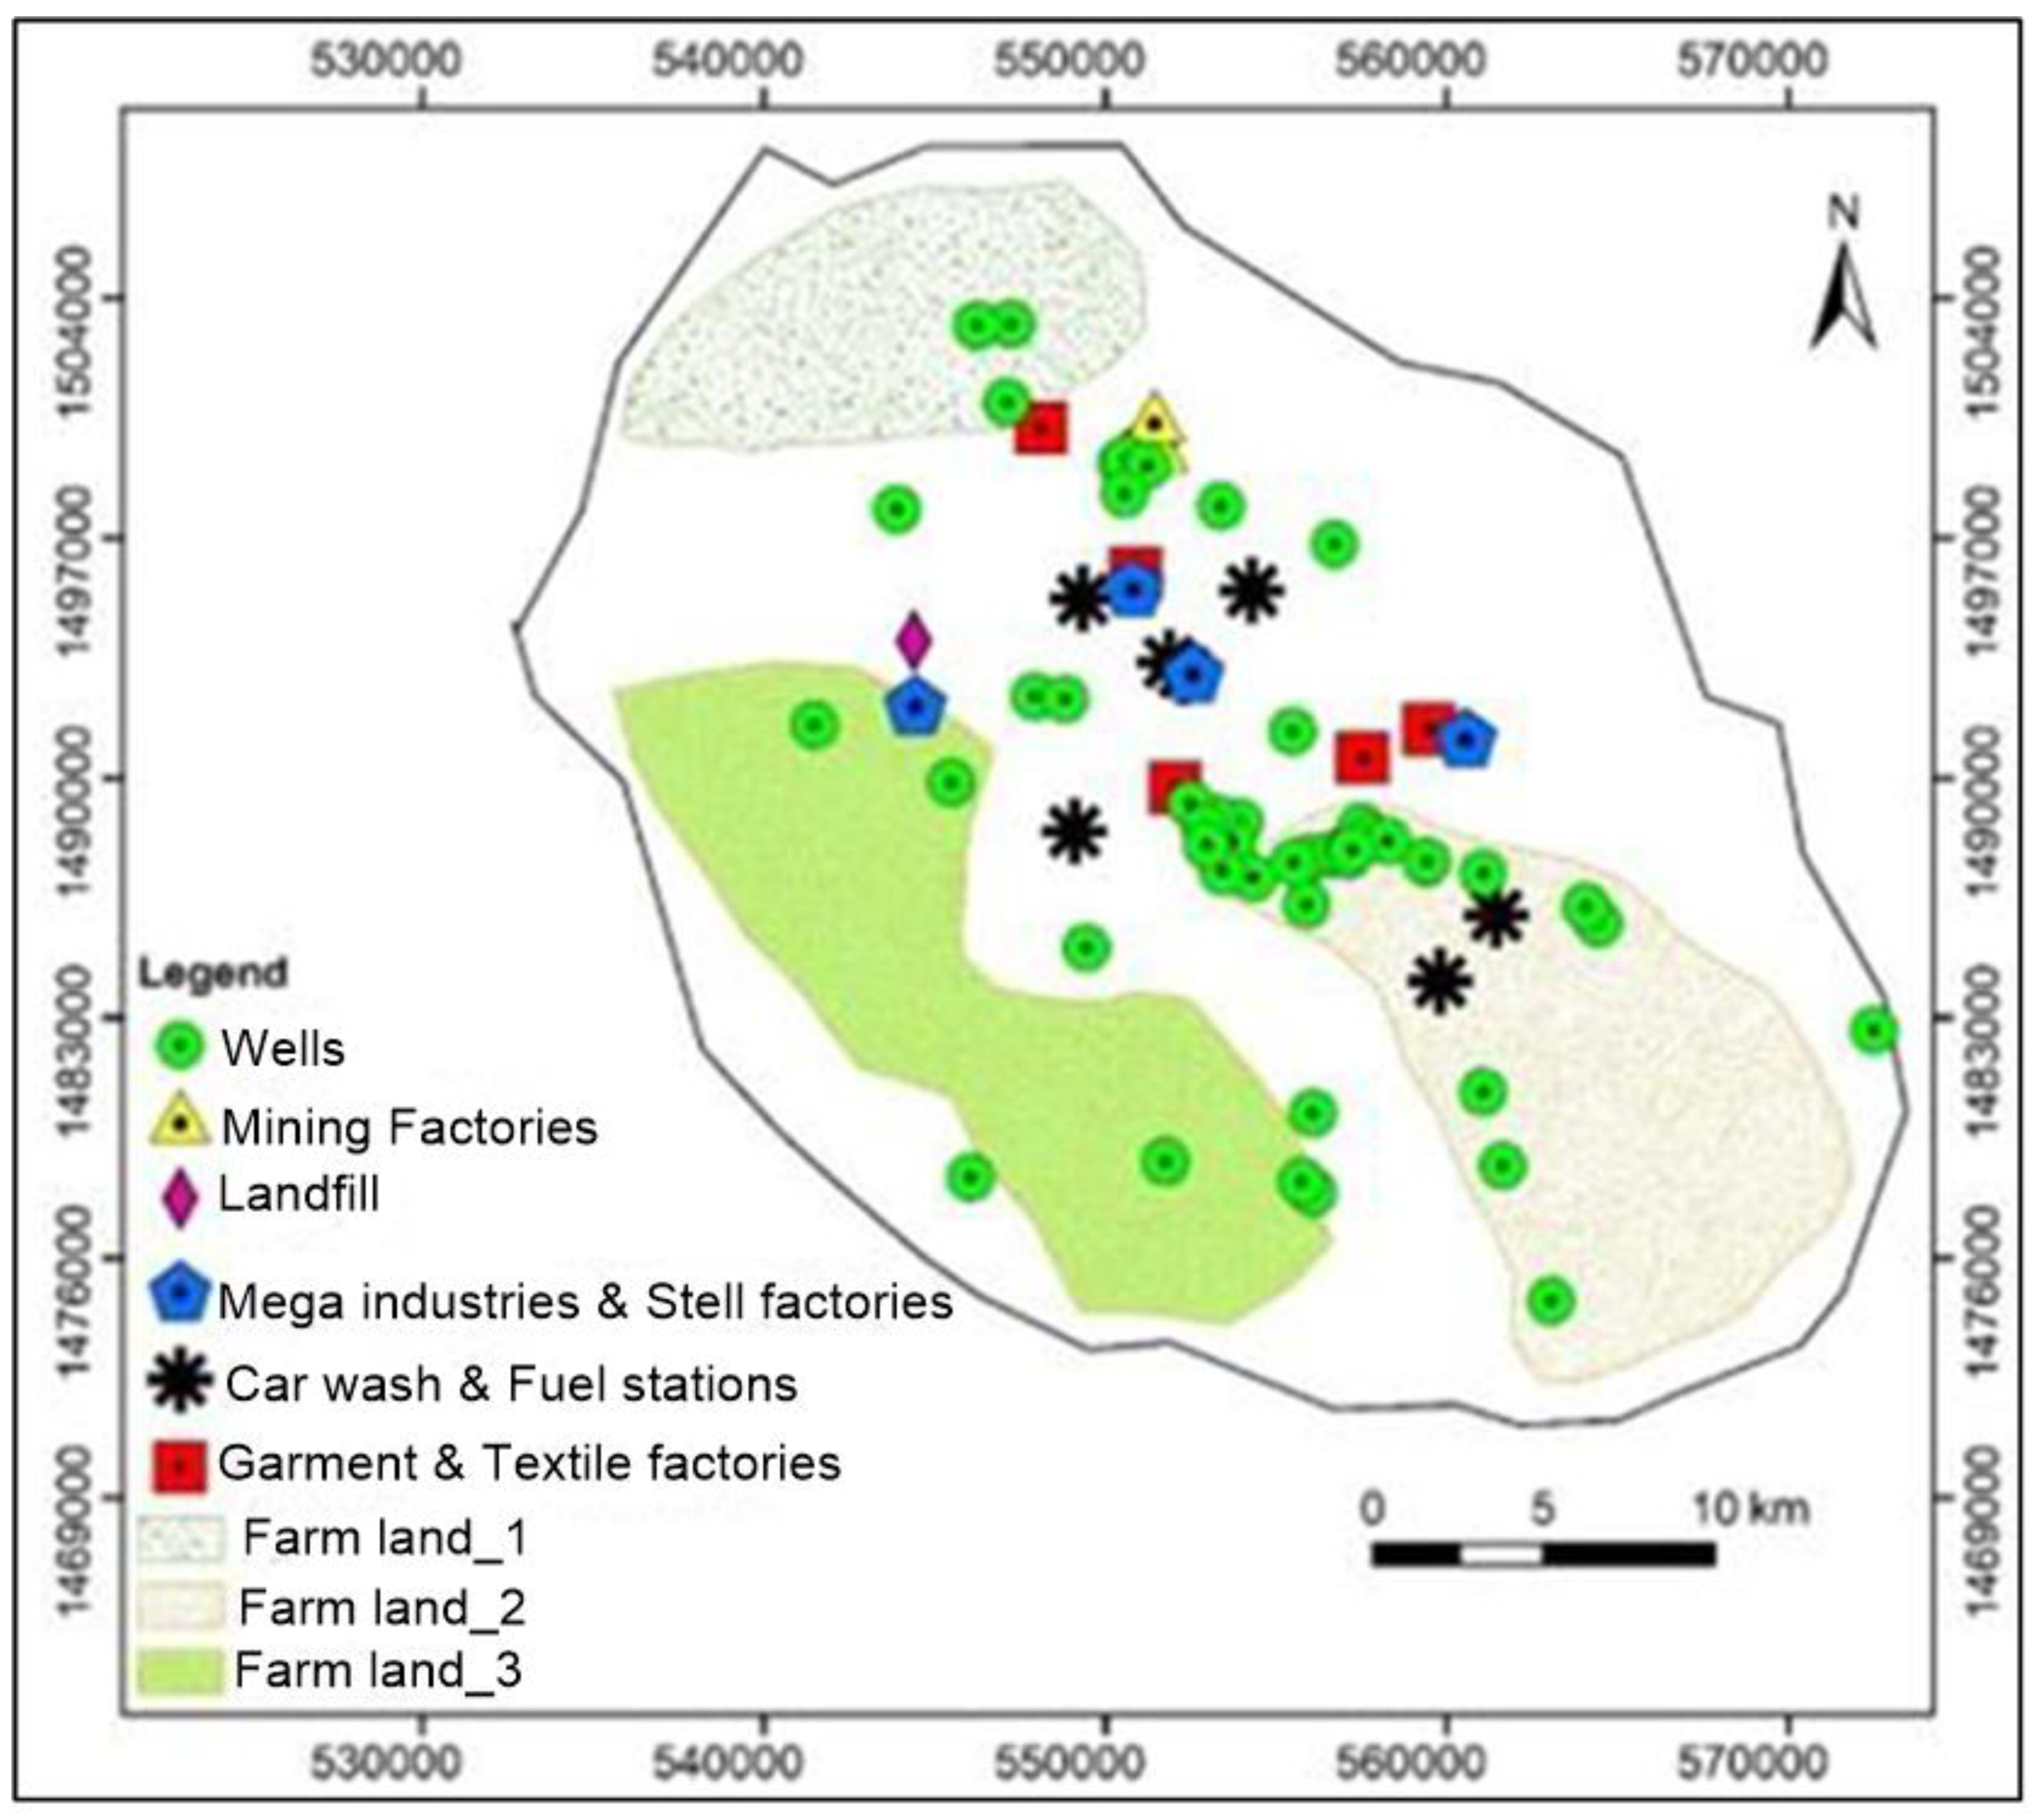
2.1. Study Area

2.1.1. Location, Climate, and Topography

The study area, Mekelle, is the capital city of Tigray region and is located around 780 km north of Addis Ababa, Ethiopia (Figure 1). In addition to its dense population, many industries are found within and around the area. A semi-arid climate and a unimodal type of rainfall (the rainy months are June, July, and August) characterize the region. Topographically, the Mekelle basin is surrounded by undulating ridges with different ranges of elevation.

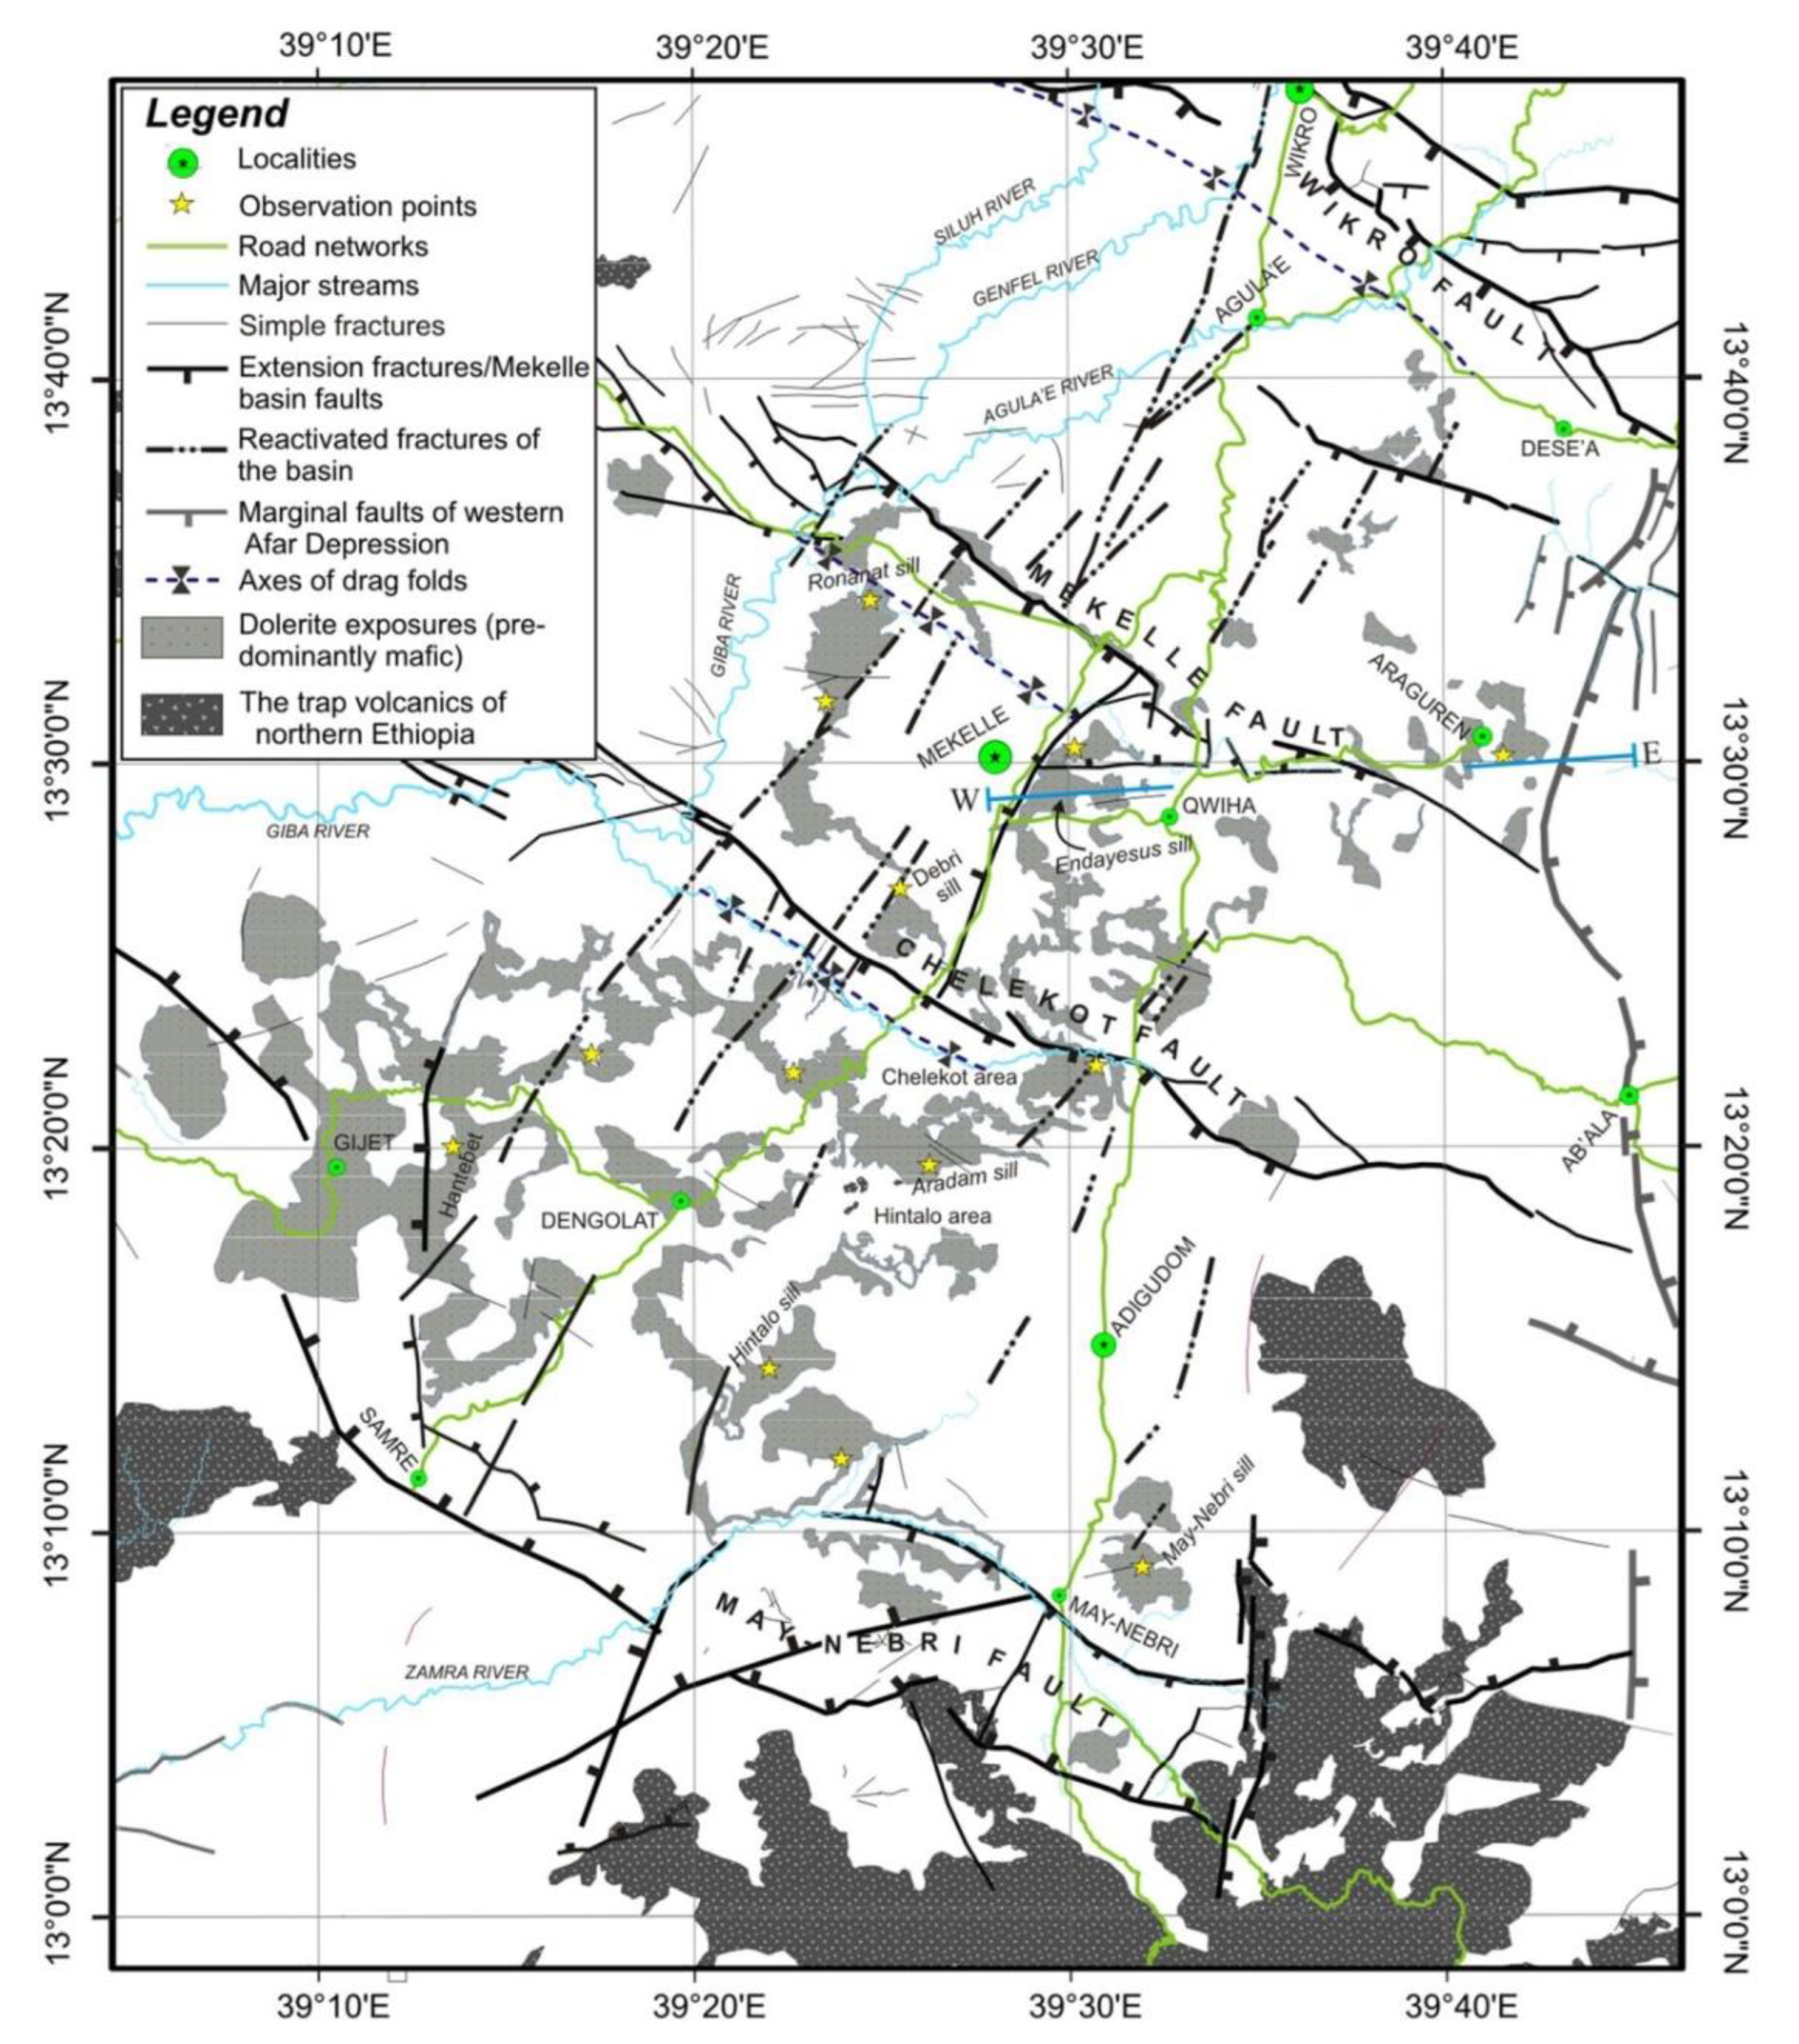
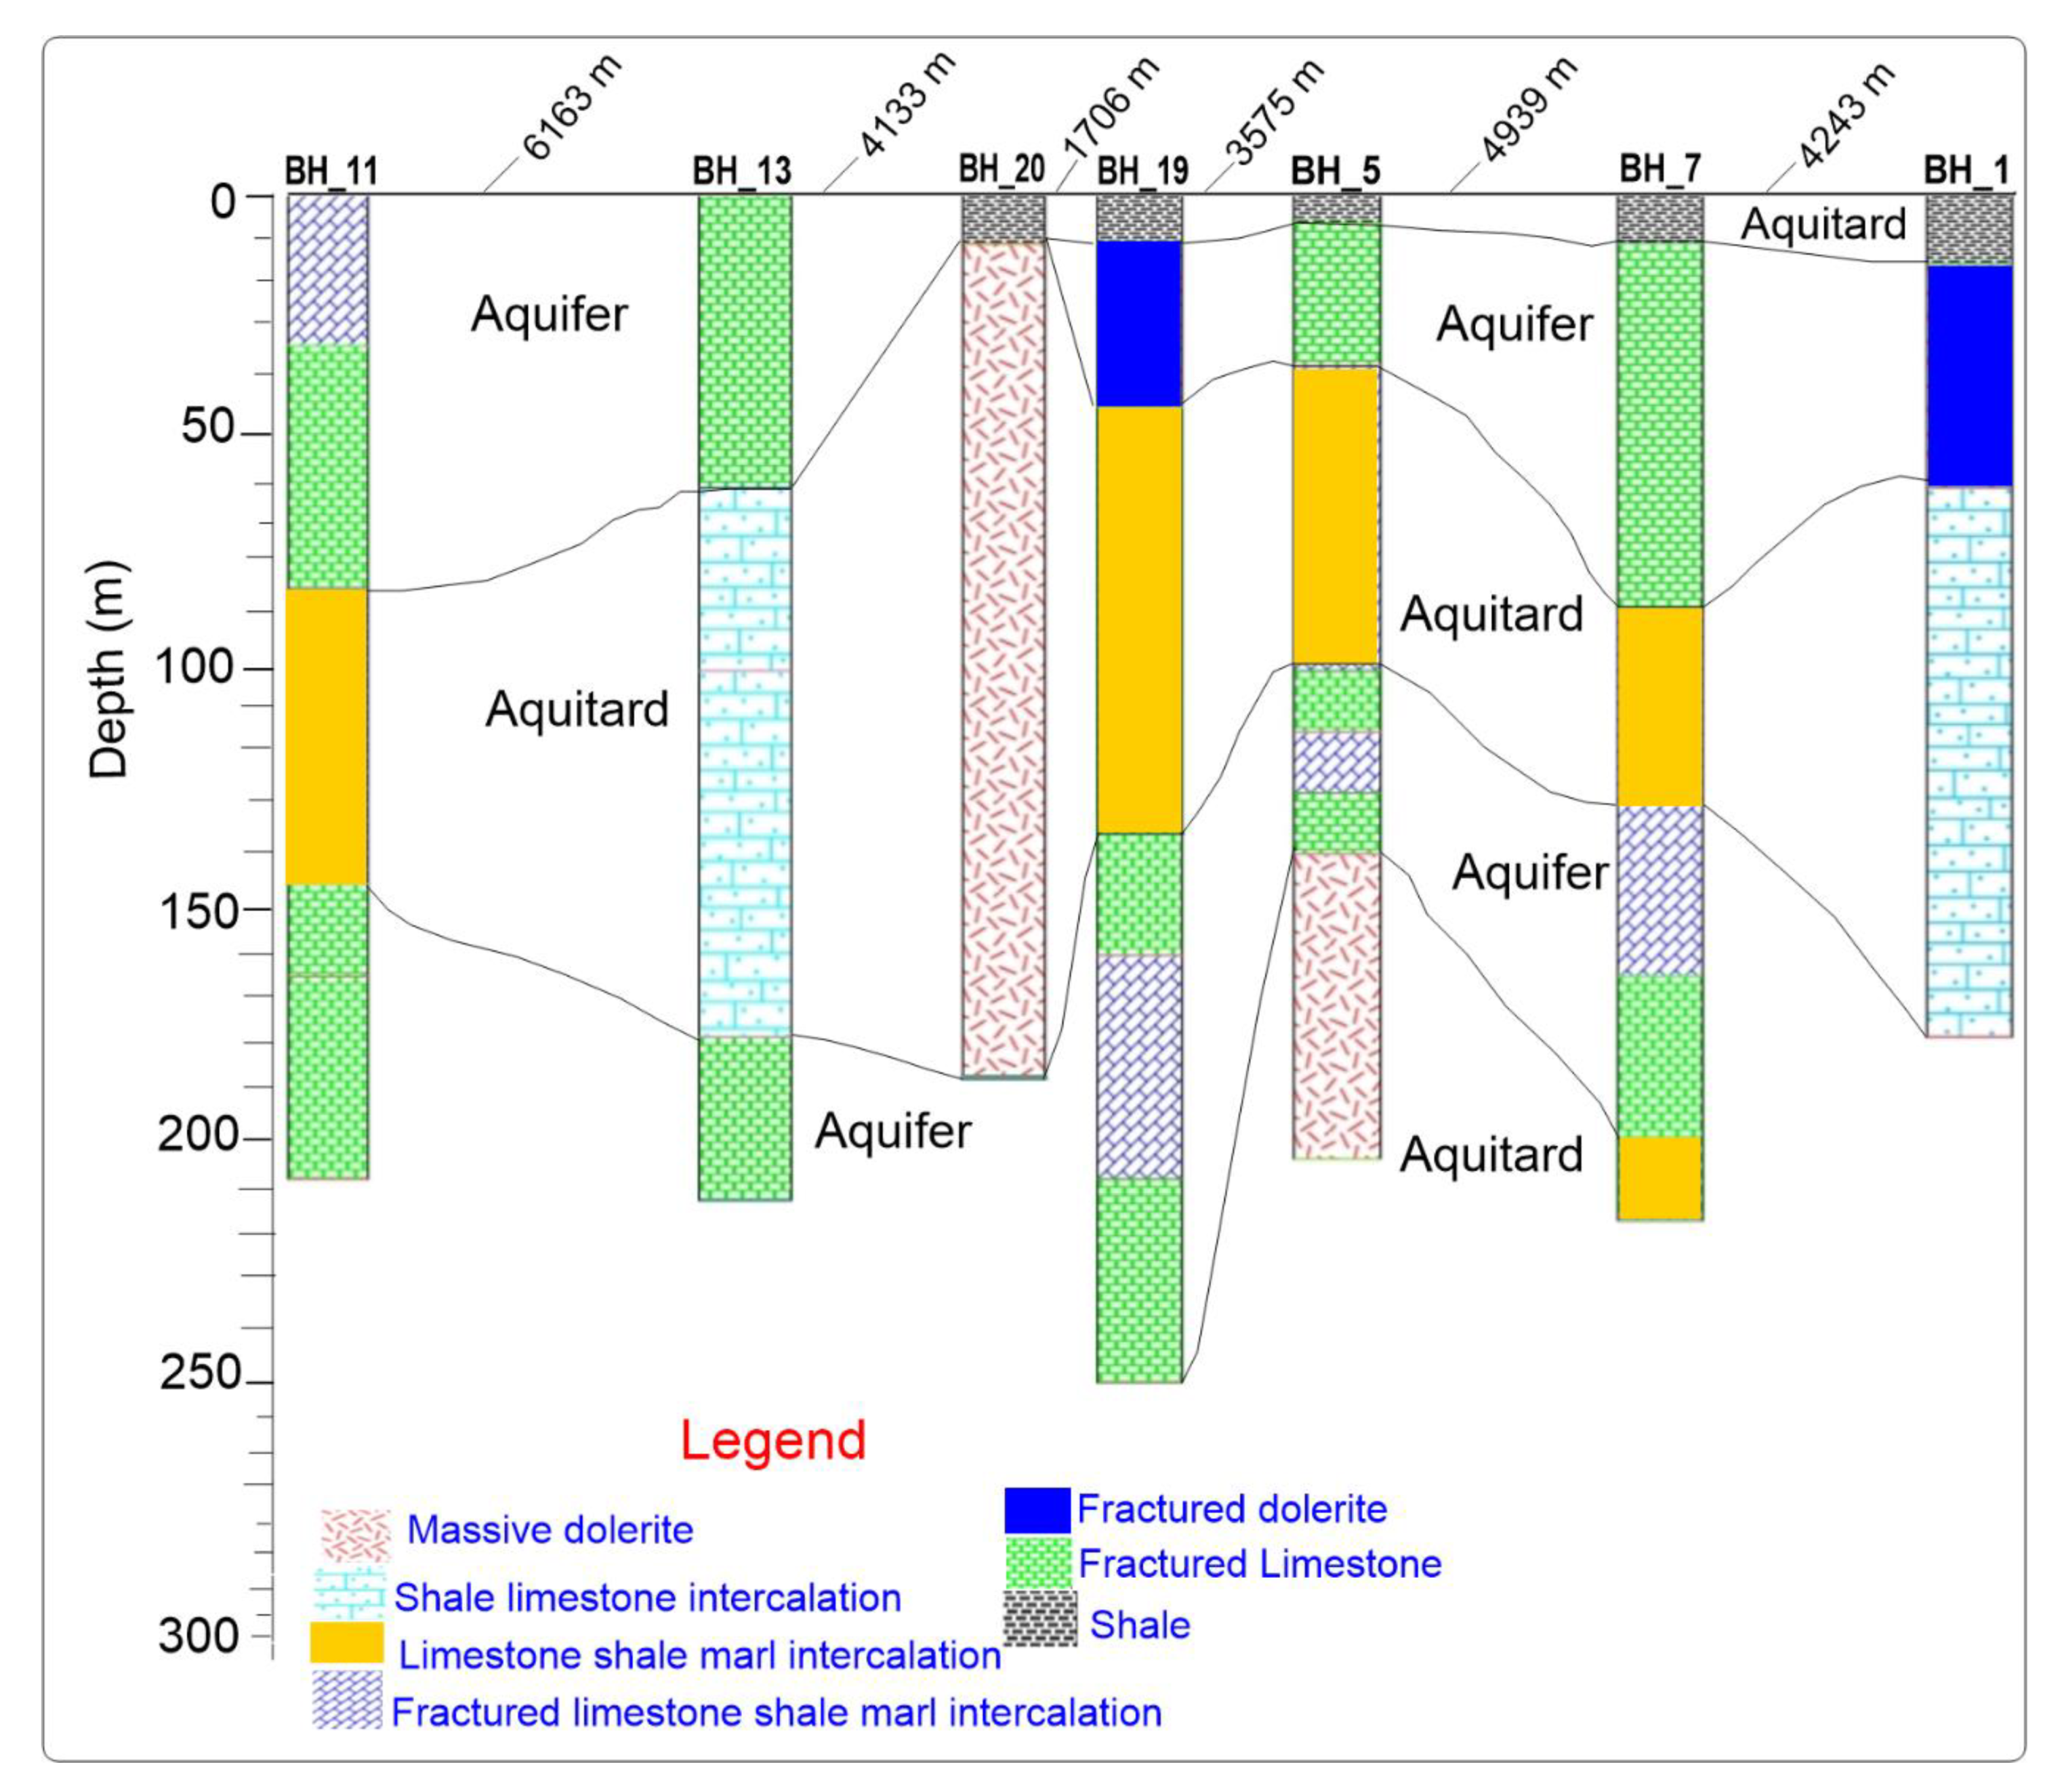
2.1.2. Geological and Hydrogeological Settings

The Mekelle basin is one of the five identified sedimentary basins in Ethiopia; the others are the Abay basin, the Southern Region Rift basin, the Gambella basin, and the Ogaden basin. The Mekelle basin has been affected by multi-tectonic activity, resulting in many intrusions of swarms of sills and dikes. The presence of those hypabasal dolerite intrusions has been reported by different authors since 1938 [45,46,47,48].The dolerite intrusion creates several fractures and faults from millimeter to kilometer range, on the entire basin [45]. The dolerite intrusion is followed by four main faults [45], three of which, the Mekelle fault, the Wukro fault, and the Chelekot fault (Figure 2), dip in a south-southwest (SSW) direction in a parallel-to-subparallel pattern. The fourth fault is the May Nebri fault, which has a length of 117 km and dips in the north-northeast (NNE) direction. The Mekelle basin is surrounded by metamorphic rocks (metasedimentary and metavolcanic) in the north and northwest, and by continental flood basalts in the southern to southwestern directions of the central basin. The basin contains a very large volume of magmatic intrusions, i.e., the dolerite sills and dikes, which range in thickness from several meters to several kilometers [19,45].
The hydrogeological setting of the area is quite complex, due to the presence of different water-bearing geological formations and associated dolerite intrusions, as well as geological structures. Fractured dolerite rock units can serve as an aquifer in the Mekelle area, but when the dolerites are massive, they could act as aquicludes [49]. Depending on the vertical and lateral extent of the geological structures, the fractured zones have a direct relation with water percolation from surface to groundwater [15]. The dolerites are mainly fractured at their contact zones with the limestone into which they have intruded, resulting in the fracturing and assimilation of the limestone. The cooling of the dolerites occurred quickly in these contact zones, leading to fracturing. These contact zones are particularly water-bearing [50,51]. Based on borehole logs data, geological field mapping, and a review of hydrogeological investigation works, fractured limestone, fractured dolerite, and fractured limestone-shale-marl intercalation rock units are the main identified aquifer types in the study area [15,19,46,48,49,52].
Mekelle is a semi-arid area in which the actual water recharge rate is very small. The water supply to almost the entire population of Mekelle is from groundwater, resulting in stress upon the groundwater resource. The Ilala catchment is one of the largest catchment areas that is exploited by Mekelle city residents and different industries within the central city.. A geological and hydrogeological investigation of the Ilala catchment revealed that the aquifer consists of 29.91% limestone, 27.90% limestone-shale-marl intercalation, 21.85% dolerite intrusion, and 20.33% quaternary sediments, respectively [53]. The aquifer nature of the catchment and associated properties have impacted the quality of the groundwater resource. The reactions that occur during travel time result in quite different water chemistry from place to place. The limestone aquifer of the Mekelle area has gypsum lenses, which could be the main source of geogenic groundwater pollution [15]. The fractured limestone is capable of storing and transmitting large volumes of water, due to its permeability. However, at the same time, it is extremely vulnerable to pollution, primarily due to surface and groundwater mixing [54]. The fractured limestone and limestone-shale-marl intercalation aquifers mainly cover the central part of the city. The limestone-shale-marl intercalation unit has large porosity and permeability as a result of fracturing, due to the magmatic (dolerite) intrusions. As reported following the drilling of wells, the average transmissivity was 730.4 m2/day and 820 m2/day for limestone-shale-marl intercalations and dolerite, respectively [15,55]. Water strike records, at the time of drilling, indicated that the depth of water varies from 2.5 m to 25 m. As the dolerite intrusion and associated geological structures are dominantly found within the Mekelle basin, the hydrogeological cross-section (Figure 3) is made from boreholes aligned from A1 to A2 (Figure 1) to determine the subsurface outlook and distribution of the intrusions and the water-bearing geological formations. The existing borehole logs and pump test data were evaluated to further check and confirm whether the listed geological formations, reported by several researchers, have aquifer characteristics.

2.1.3. Data Sources

Primary data for assessing vulnerability and determining the possible sources of pollution were gathered during field visits. Various secondary data were also collected from the Tigray Water Resources Bureau, Mekelle University, Ezana Mining company (a non-governmental organization), and the Food and Agriculture Organization of the United Nations (FAO). The input data for the depth to the water table, the impact of the vadose zone, aquifer media, and hydraulic conductivity were obtained from piezometric measurements, lithological well logs, and pump test data from the Tigray Region Water Resources, Mines and Energy Bureau and from geological field mapping of the study area. Rainfall data for recharge estimation were collected from the Tigray region meteorological station, Mekelle branch. Soil media were downloaded from the FAO website and cross-checked with soil types that were identified in the area during a hydrogeological investigation by Mekelle University and the Tigray Water Resources Office. Topographic maps were generated from a digital elevation model of the study area. Lineament maps were prepared from satellite images and geological field mapping. The land use and landcover maps were downloaded from the ESA CCI website. The location of the water wells and the possible anthropogenic pollution sources were inventoried during fieldwork.

2.2. Analysis and Evaluation Technique

Spot and Landsat satellite image interpretation, to identify the regional and local faults, fractures, beddings, foldings, and all geological discontinuities, was performed. The cross-section (Figure 3) and thematic layers for the vulnerability map of the area were prepared using existing borehole data. The water resource vulnerability mapping was carried out via both the DRASTIC and modified DRASTIC methods. Seven parameters (Table 1) for the DRASTIC method [39] and two additional parameters (Table 2) for the modified DRASTIC method, each having different ratings and weight factors, were used. A total of 45 items of borehole description data collected by the Tigray Region Water Resources, Mines, and Energy Bureau were analyzed for depth to the water table, impact of the vadose zone, and aquifer media description; 53 items of hydraulic conductivity data were deduced from a pumping test, and 52 items of recharge estimation data, based on various methods and researchers, were used to generate the corresponding maps. All of the maps and associated models, for each parameter, were prepared in ArcGIS. The input data for each of the parameters were interpolated using the Inverse Distance Weighting (IDW) technique, which was applied due to its accuracy and consistency [56]. There were no significant differences when other methods, such as spline and kriging, were used for the study area with the available data. The DRASTIC vulnerability index values were calculated using Equation (1) [39]:
Drastic index (Di) = Dr Dw + RrRw + ArAw + SrSw + TrTw + IrIw + CrCw
where D is the depth to the water table, R is the net recharge, A is the aquifer media, S is the soil media, T is the topography, I is the impact of vadose zone, C is the hydraulic conductivity, r stands for the rating values, and w; stands for weighting values.
The evaluation of groundwater vulnerability by the classical DRASTIC method used only the seven parameters stated in Table 1. However, lineaments and land use data, which were not considered in the DRASTIC method, could have impacts. As the Mekelle area is characterized by tectonic and nontectonic fractured zones, many industries, and agricultural activities, those two additional parameters (lineaments and land use maps) were taken into account (Table 2) to produce a vulnerability map and to assess their impacts on the water resource quality.

2.2.1. Lineaments

The lineaments, defined as the linear features in a landscape identified via satellite images and aerial photographs, most likely have a geological origin [57]. When subsurface fractures are exposed on the surface of the earth, they are lineaments [58]. Fractures can be penetrative or non-penetrative, based on the total depth and overall distance they cover. The basic triggering factor of the lineaments could be geomorphological and/or structural [16,59]. Nearly all of the lineaments can serve as a conduit for the infiltration of water into the subsurface [60]. The rate of water infiltration depends on the lineaments’ density and penetration characteristics. Areas in which dense and penetrative lineaments are found have excess infiltration. Table 2 presents the rates and weights for the lineaments in the study area.

2.2.2. Land Use Map

Land use/land cover is an essential parameter for the assessment of groundwater vulnerabilities. Land uses are classified as industrial zones, urban areas, and agricultural areas, based on their impacts on water resources [61]. The rating value used for each category was from 1 to 8, multiplied by a weight of 3, as shown in Table 2. The land use map of the Mekelle area was divided into five classes, from minimum to maximum ratings as follows: bare lands, natural vegetation areas, water bodies, built-up areas, and agricultural areas. The final vulnerability index was then calculated using Equation (2):
Modified DRASTIC index = DRASTIC index (Di) + Linr Linw + Lur Luw
where Linr is the lineament density rating, Linw is the lineament density weight, Lur is the land use and land cover change rating, and Luw is the land use and land cover change weight.

2.2.3. Rating and Weight Assigning

The rating and weights assigned for all parameters were adopted from different reference sources, such as research works that were carried out in several countries, including Kenya, Iraq, Morocco, and Tunisia [16,40,41,42], each of which has geomorphological, geological, and climatic conditions similar to those in the Mekelle area. A previous study [44] of the region was also considered.

2.2.4. Sensitivity Analysis

A sensitivity analysis was carried out to evaluate the influence of the ratings and weights applied for each parameter on the final groundwater vulnerability map [38,62,63]. The sensitivity analysis was divided into two parts: a single-parameter sensitivity analysis and a map-removal sensitivity analysis [62,64].

Single-Parameter Sensitivity Analysis

The single-parameter sensitivity analysis (SPSA) compared the theoretical weight and effective weight of each polygon [62]. That comparison helped in analyzing the impact of a specific polygon on the aquifer vulnerability index [65,66,67].
The effective weight of the polygons was obtained using Equation (3) [62].
W = P r P w D i 100
where W refers to the “effective” weight, Pr and Pw are the rating value and weight of each parameter, respectively, and Di is the overall vulnerability index.

Map-Removal Sensitivity Analysis

The map-removal sensitivity analysis (MRSA) showed the change in the output of the groundwater vulnerability map after removing either one or more parameters that were used to generate the map [63,64]. This index was calculated using Equation (4) [64].
S = ( D i N M D i n D i ) 100
where S is the sensitivity measure, Di and MDi′ are the unperturbed and the perturbed vulnerability indices, respectively, and N and n are the numbers of parameters that were used to compute Di and MDi′, respectively.

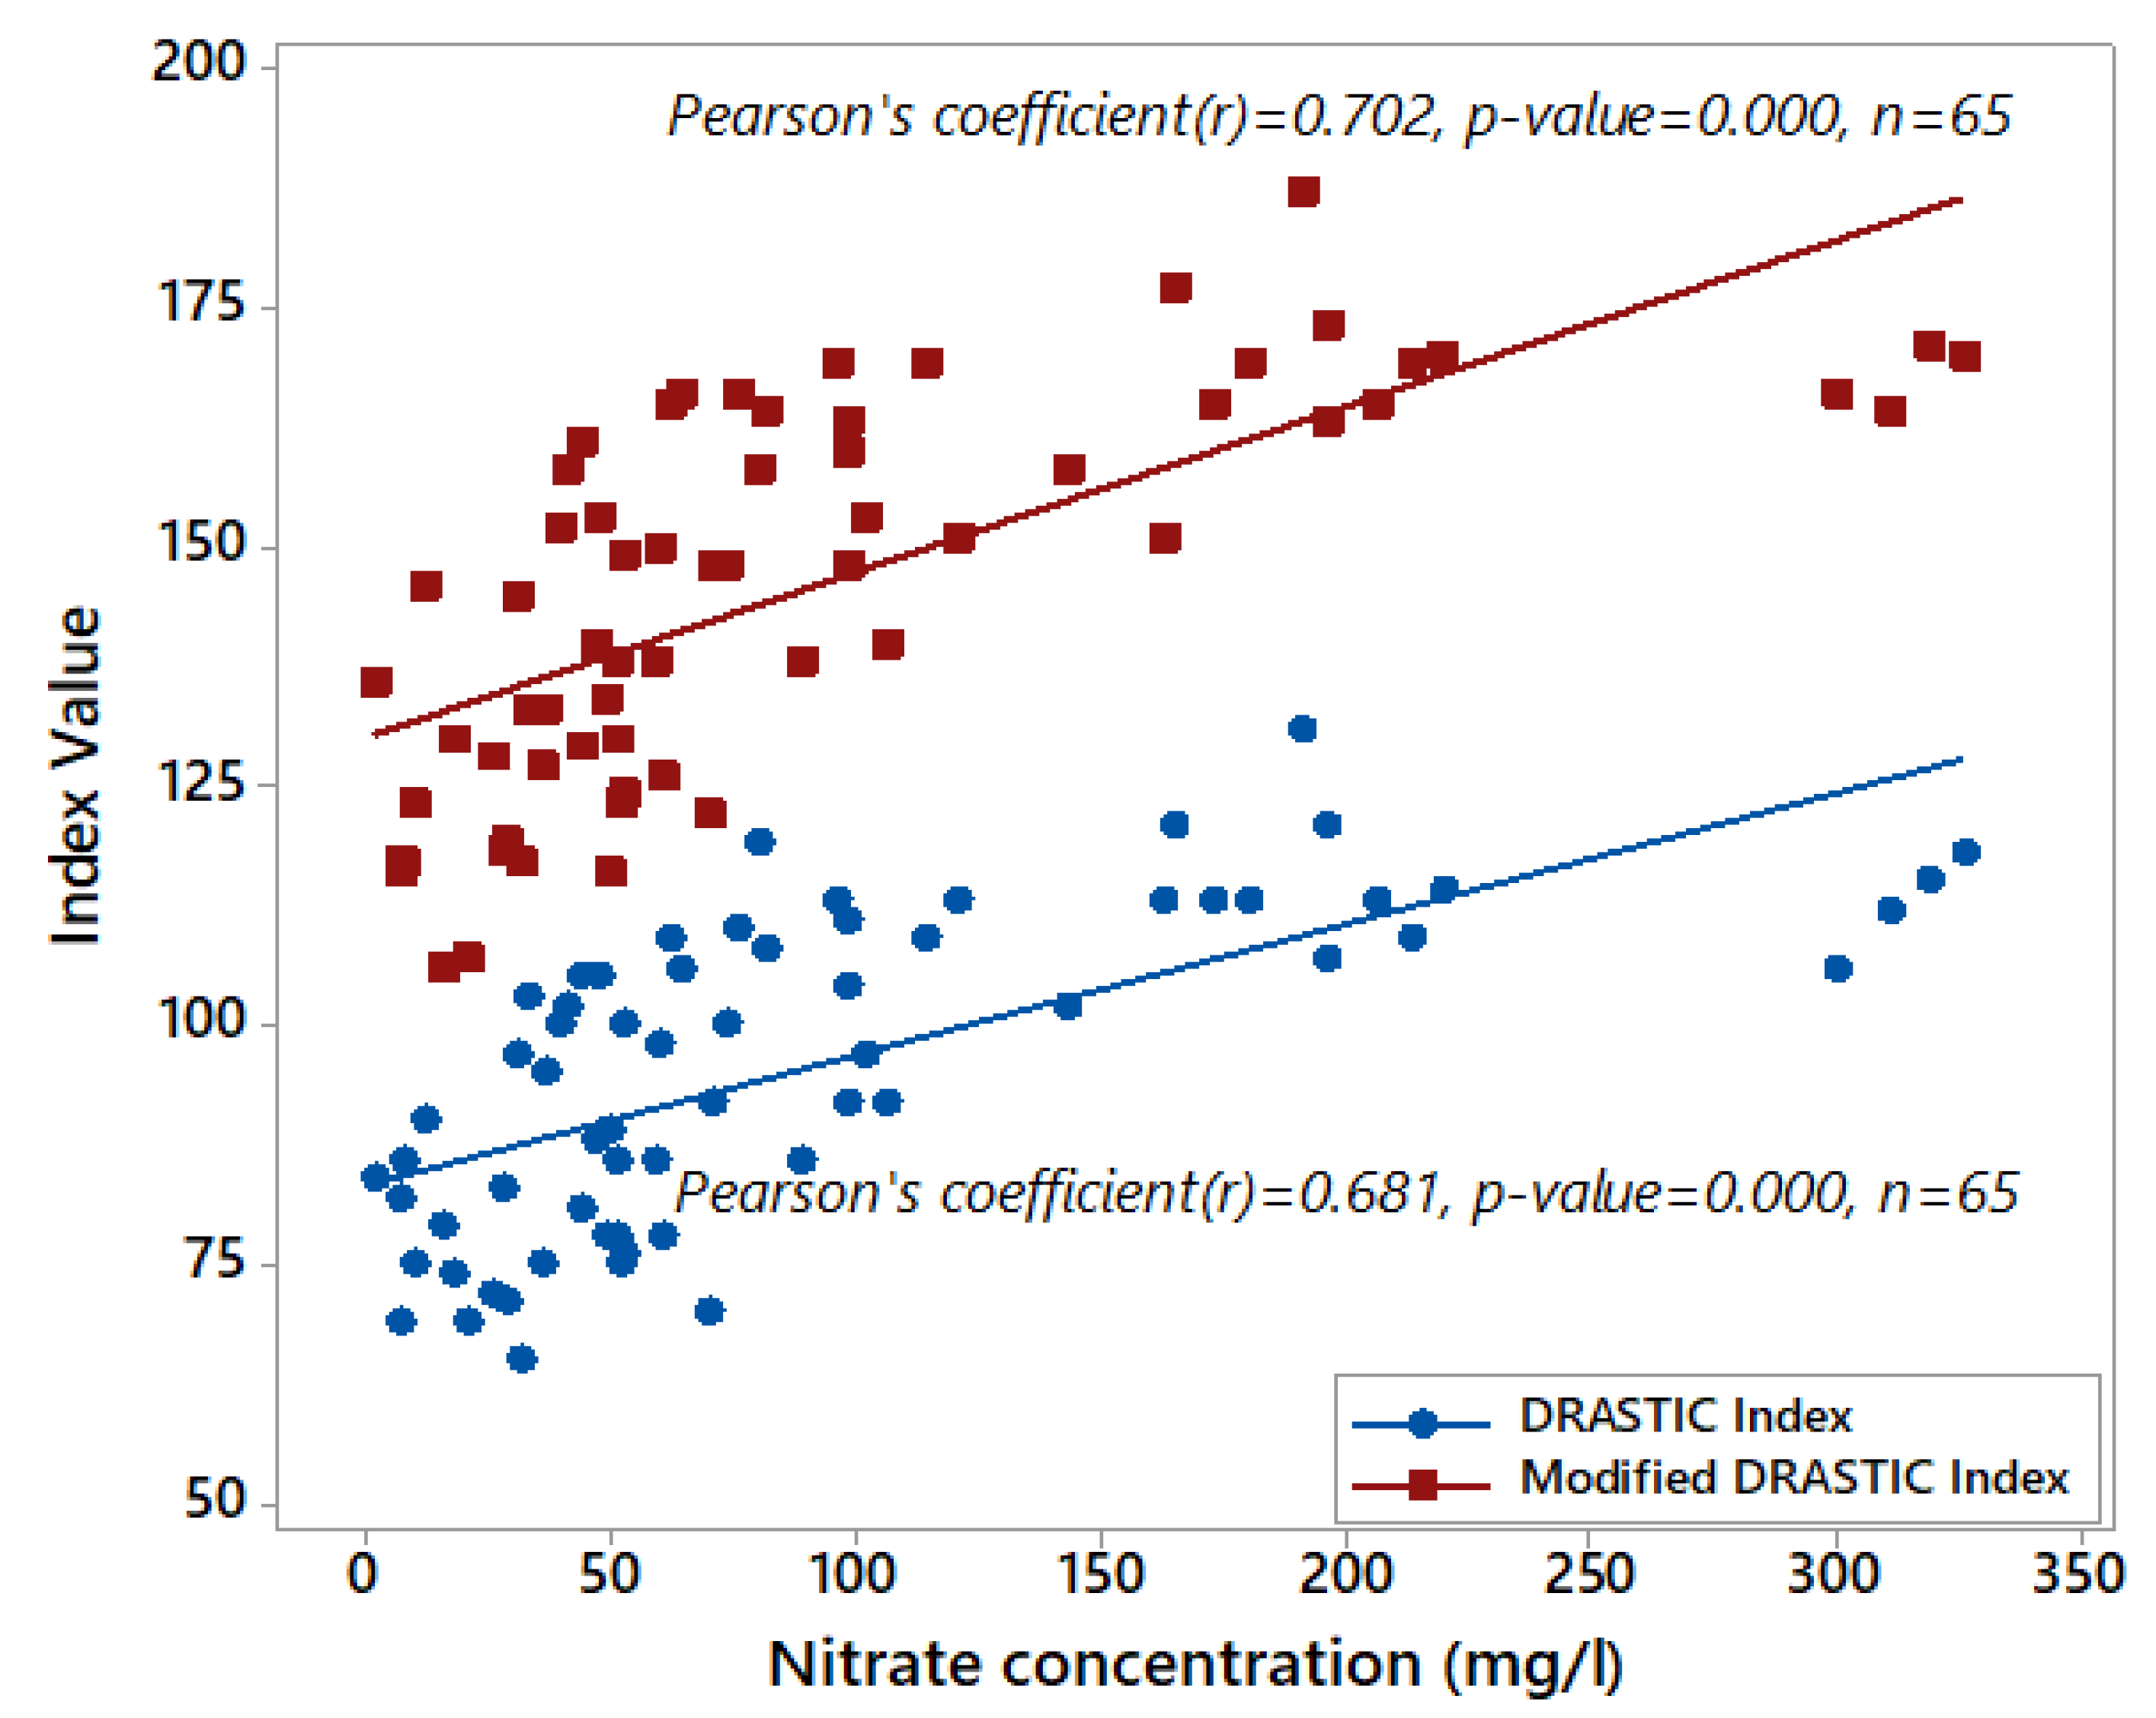
2.3. Validation Using Nitrate Concentration

Validation is very important in preventing a researcher from drawing erroneous conclusions and making subjective assessments [68]. The presence of nitrate concentration in elevated concentrations in groundwater is not natural. Therefore, nitrate is an important indicator of pollution distribution, as well as movement [69]. Nitrate concentration data are very helpful in generating a validation model for DRASTIC vulnerability mapping [30,70,71,72]. In this research, 65 groundwater samples with a range of nitrate concentrations were collected from Mekelle University and the Tigray Water Resource Bureau. We used these data to validate both the DRASTIC and modified DRASTIC models.

3. Results and Discussion

The model inputs, interpolated thematic layers, and main outputs of our research are presented in the following sub-sections.

3.1. Depth to the Water Table

The rated depth-to-water-table map that was generated from piezometric measurements of 45 boreholes is shown in Figure 4A. The flat plains in the northeastern, southeastern, southern, and northern parts of the area have shallow groundwater tables. The total time and distance required for infiltration of water and associated possible pollutants to reach the groundwater is very short (and depends on other factors, such as the general characteristics of the unsaturated zone). Such conditions promote high risk of pollution [36,38]. The location of the city of Mekelle is in a flat plain where, most of the time, the water table is found at a relatively shallow depth. This corresponds to a rating of 5, indicating relatively vulnerable conditions. The ratings used for the depth-to-the-water table were adopted from various sources [16,32,41,42,57]. It must be emphasized that in the Mekelle area, the aquifer is multilayered and characterized by both confined and unconfined conditions, with high lateral variability. Moreover, the recharge-discharge relationships are not taken into account in the DRASTIC method.

3.2. Recharge

Recharge is the total amount of water that percolates from the ground surface to the water table [73,74]. It is the primary source of groundwater. The aquifers in the Mekelle area are recharged from both rainfall and surface water, as seepage from micro-dams, rivers, and streams [75]. The rated map of net recharge is presented in Figure 4B. Recharge, based on the calculations by various researchers [43,76], is low in the southern part of the area, resulting in a low vulnerability rating. Recharge increases toward the north, as does the vulnerability rating for this parameter. Considering the semi-arid climate of the study area, recharge remains relatively limited, in general. Rainwater, seasonal floods generated due to topographic elevation differences, and sparsely distributed rivers are the main sources of recharge in the area. Several researchers estimated the recharge for the Mekelle area and its surroundings. As calculated by the chloride mass balance method, the estimated recharge is 30 mm/year to 40 mm/year and 4.5% to 6% of the average annual rainfall [55]. Using the WetSpass estimation model, the groundwater recharge of the area varies from 0 mm to 163 mm, with a 66 mm mean value [43,76]. In addition to rainfall, micro–dams, and river water, wastewater that is discharged from industries and from every household infiltrates the subsurface and joins the groundwater, leading to water quality deterioration. However, the DRASTIC method considers only rainfall as an input for infiltration. Therefore, the amount of recharge from wastewater is not taken into account in this study.

3.3. Aquifer Media

As shown in the rated aquifer media map, Figure 4C, fractured limestone, fractured limestone-shale-marl intercalation, and fractured dolerite are the major identified aquifer types in our study area [15,49,52,53].The ratings used in this paper were from highest potential for pollution to lowest potential for pollution, as follows: 6 for fractured limestone, 5 for fractured dolerites, and 4 for limestone-shale-marl intercalation. These ratings were assigned based on rock type, nature, and associated geological structures, such as fracturing (faults and joints). In the peripheral parts of the study area, fractured limestone, with higher vulnerability, forms the upper aquifer. The central parts of the study focus on areas where fractured limestone-shale-marl intercalation and fractured dolerite dominate; those areas are assumed to have lower vulnerability. The actual water flow path, hydraulic conductivity, and gradients are controlled by the nature of the aquifer [73]. As fracturing helps in creating openings in hard rocks, creating conduits for surface water to infiltrate groundwater, there is a potential threat that pollutants may also infiltrate the groundwater.

3.4. Soil Rating

The soil types—clay, clay loam, silt loam, and sandy loam—were collected from the FAO and were verified during the hydrogeological and soil mapping phase of water well site selection [44]. As part of the DRASTIC parameters, soil textures and their overall grain sizes are among the main governing factors in determining groundwater vulnerability. When the soil is coarse, such as sand, it is more vulnerable to pollution than are fine-grained soils, such as clay or silt [36,77,78]. Most of the eastern, southern, and central parts of the Mekelle area, as shown in the rated map in Figure 4D, are covered by sandy loam soil, for which vulnerability and the chance of water resource pollution are high. With respect to hydrogeological properties, sands are permeable and serve primarily as an aquifer [78], while clays are porous but not permeable. Therefore, the ratings we used in this research were based on permeability, as follows: 6 for sandy loam, 4 for silty loam, 3 for clay loam, and 1 for clay.

3.5. Topography

The Mekelle basin is surrounded by rugged and undulating topography. Messebo, Chomiea, and Endayesus are ridges with very high elevation, compared with the other ridges that encircle the basin. Pollutant transport and infiltration directly depend on the degree of slope, due to the extent of runoff and total surface settling time [35]. In the flat plains and areas of very low slope (Figure 4E), the chance of infiltration increases. The ratings were assigned on the basis of slope differences (steep and gentle slopes). The flat plain surface is represented by a gentle slope and the highest DRASTIC rating value (10, the maximum); the mountainous areas are represented by steep slopes and the lowest DRASTIC rating value (1, the minimum). The rated topography map is presented in Figure 4E.

3.6. Impact of Vadose Zone

Sand, gravel, and the uppermost parts of fractured rocks form the unsaturated zone, i.e., the vadose zone, of the area. This zone has a direct role in pollution attenuation and groundwater recharge [79]. The ease or difficulty for pollutants to be transported and to join the groundwater resource, or to be filtered out by materials in the unsaturated zone, before reaching the water table, depends on the type and nature of the geological material found in the unsaturated zone. The rated map for the vadose zone, derived from the lithological description of boreholes, is shown in Figure 4F. The ratings assigned, on the basis of the geological materials found above the water table and their physical characteristics, are 3 for shale and clay (which offer the best protection for groundwater and thus resulting in lower vulnerability), 4 for the limestone-shale intercalation, and 6 for dolerite.

3.7. Hydraulic Conductivity

The aquifers in the Mekelle area are not homogenous; the hydraulic conductivity depends on the different aquifer units [79]. The 53 hydraulic conductivity values used in this stud, were deduced from pumping tests; hydraulic conductivity values were determined using different models, such as the groundwater flow model MODFLOW [80]. The analyzed pumping test data indicated that the area is characterized by an extremely high and wide range of hydraulic conductivities and transmissivities. The actual range for the hydraulic conductivity was extremely varied. The wide variation in the hydraulic conductivity values implied that the subsurface water-bearing geological formations, as well as the aquifer types in the area, are not uniform [55]. The hydraulic conductivity values were divided into 5 classes (with ratings 1, 2, 4, 6, and 8) in response to the high variation. Hydraulic conductivity was high in the central part of the study area (with a high vulnerability rating), and decreased toward the periphery, Figure 4G.

3.8. Sensitivity Analysis

3.8.1. Single-Parameter Sensitivity Analysis

The SPSA result (Table 3) showed some deviation in the effective weightings of the parameters, compared with the theoretical weightings. The impact of the vadose zone, the depth-to-the-water table, and aquifer media revealed higher effective weightings (mean effective weightings of 23.7%, 22.9%, and 16.9%, respectively) for our study area. In contrast, soil media, hydraulic conductivity, and topography tended to be less effective (with mean effective weightings of 8.7%, 7.8%, and 7.0%, respectively).

3.8.2. Map-Removal Sensitivity Analysis

The map removal sensitivity analysis (MRSA) result is provided in Table 4. MRSA showed the consistency of the analytical results in obtaining an efficient interpretation of the vulnerability index [65,67,81]. High variation of the vulnerability index was expected due to the removal of the impacts of the vadose zone (1.5%) and the depth-to-the-water table (1.4%), respectively. This variation can be attributed to the high theoretical weight assigned to those parameters [66] and the tectonically disturbed and fractured vadose zones, as well as to the shallow depth groundwater in the area.
The vulnerability index can also be evaluated by the removal of additional parameters, one at a time, from the DRASTIC model computation [66]. Table 5 shows the variation index of the aquifer vulnerability, after removing one or more of the selected parameters at a time. The result for this example showed the highest variations for soil media, topography, and hydraulic conductivities (4.8%) removal.

3.8.3. Lineament and Land Use Parameters

Land use and lineament parameters were added to the original DRASTIC model to establish a modified DRASTIC version. Other researchers have used such an approach [82]. As described in the hydrogeological section of this paper, the study area is characterized by intense fractures. Therefore, the lineament density parameter was added to the DRASTIC method to evaluate the influence of lineaments. The agriculture and urbanization impacts in the area were also evaluated, using the land use and landcover parameter (Figure 5).
Like the weight deviations found in the sensitivity analysis for the seven parameters of the DRASTIC index, some deviations in the effective weightings of all parameters were observed, compared with their theoretical weightings, after the two new parameters were added (Table 6). Lineaments (20%), the impact of the vadose zone (15.4%), and the depth-to-the-water table (14.9%) showed the highest mean effective weightings.

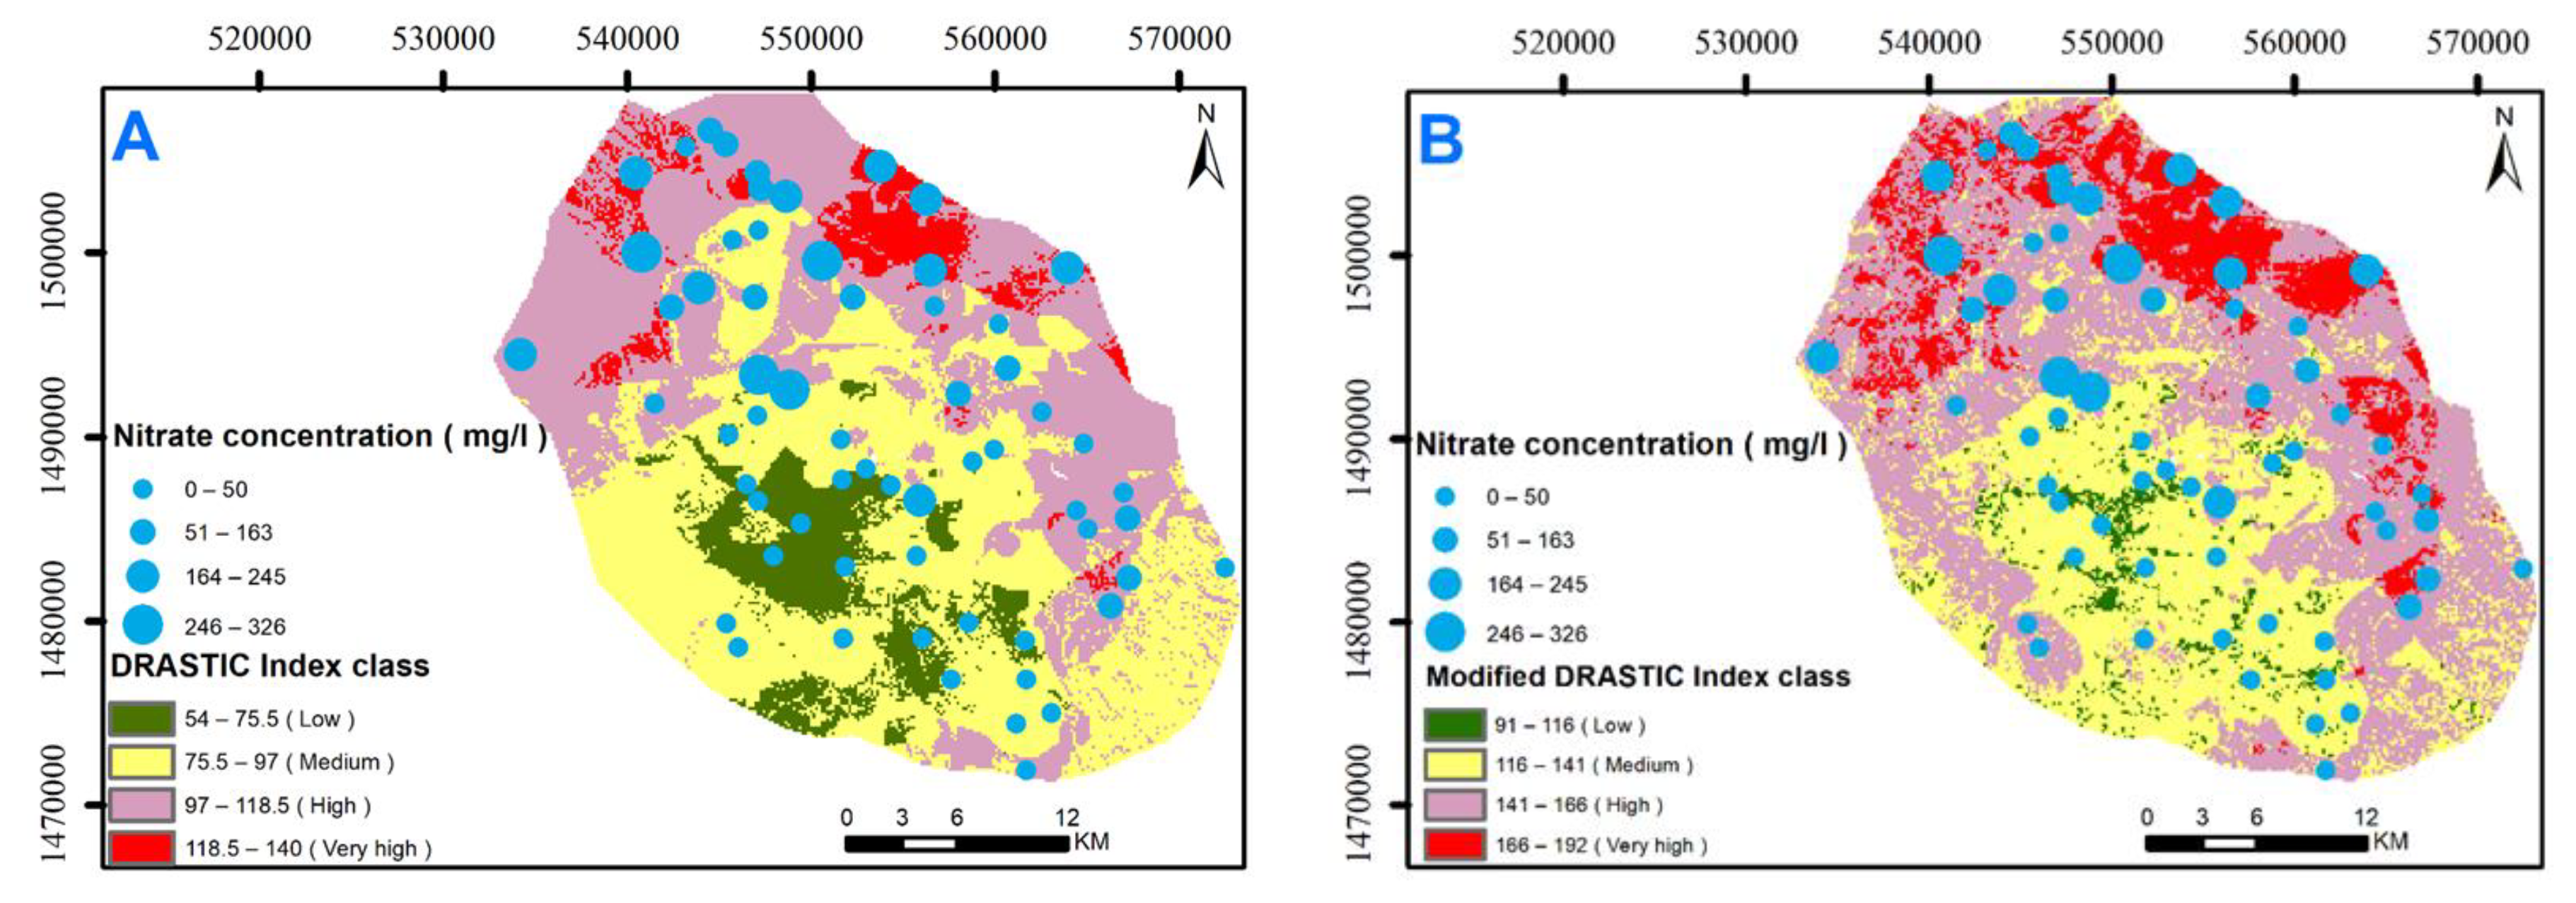
3.9. Aquifer Vulnerability Based on the DRASTIC and Modified DRASTIC Indices

The final groundwater vulnerability maps of the Mekelle area were generated based on Equations (1) and (2). The values were divided into four DRASTIC and four modified DRASTIC index classes (Figure 6), as follows: low (54–75.5), medium (75.5–97), high (97–118.5), and very high (118.5–140) for the DRASTIC vulnerability, and low (99–116), medium (116–141), high (141–166), and very high (166–192) for the modified DRASTIC vulnerability, respectively. The northern, northeastern, northwestern, and some central eastern parts of the study area were characterized by high to very high vulnerability, under both methods. Those areas are broadly characterized by rugged, rough, and undulating topography, while relatively flat plains, found mostly in the northern, central, southeastern, and northeastern parts, are places in which rainwater, flood, and surface water () drain from all of the surrounding catchments. This is related to the shallow water table in most of the flat plain areas. Moreover, the presence of the regional and local fracture zones found within the study area greatly facilitates the chance of pollutant infiltration, either directly or when the fractures serve as conduits of infiltration, primarily during seasonal flooding from catchments of different localities and river flows.
As shown in Figure 6 and Table 7, nearly half (48.3% on the DRASTIC method) and a little more than half (57.6% on the modified DRASTIC method) of the mapped area is characterized by high to very high vulnerability.

3.10. Validation of the Vulnerability Index Maps Using Nitrate

The available nitrate concentration data in the study area, which were collected from the Tigray Water Resources Bureau, ranged from nearly 0 mg/L to 326 mg/L. These data were overlain on the vulnerability index maps and were divided into four classes: low, medium, high, and very high (Figure 7). The nitrate concentration classes showed a correlation with both the DRASTIC and modified DRASTIC vulnerability maps. Very high concentrations correlated mainly with very high and high vulnerability, and the less vulnerable areas (medium and low) correlated with mainly low nitrate concentrations.
A scatter plot of both indices was plotted against the nitrate concentration (Figure 8). Statistically, using Pearson’s correlation coefficient (r), both the DRASTIC and modified DRASTIC index values showed positive and moderate correlations with the nitrate concentrations, of 0.681 and 0.702, respectively. Moreover, the modified DRASTIC model, which includes lineament and land use layers, was slightly better correlated (r = 0.702) than the conventional DRASTIC model. Therefore, the validation analysis revealed that the modified DRASTIC method accounted for nearly 50% (r = 0.702) of the relationship in the variation of the index values and nitrate concentrations in the groundwaters of the study area.

3.11. Water Well Locations and Potential Risks of Anthropogenic Pollution

Agricultural and mining activities, landfill sites, fuel and gas stations, health centers, car wash stations, garment and textile factories, and mega industries are among the identified possible sources of water resource contamination in the area. Most of the wells are located either within or around the agricultural lands. Agricultural and domestic wastes are among the potential sources that impact groundwater quality [83,84]. Classifying the overall characteristics of strata overlying the vadose zone or the fractured beds are among the basic objectives of aquifer vulnerability assessment [85]. Groundwater vulnerability is also determined by land use parameters, environmental issues, and soil parameters from place to place [86]. In addition, the vertical and horizontal extents of pollution can be determined by assessing the comprehensive vulnerability of aquifers [87]. We divided the farmlands of the city of Mekelle and the surroundings into three groups, based on their locations: farmland 1, farmland 2, and farmland 3 (Figure 9). Farmlands 3 and 2 are more susceptible to pollution than farmland 1, because many of the water wells are found within those two farmlands. The downstream groundwater quality is more affected than upstream groundwater quality, due to surface runoff and the chemicals used as fertilizers in the agricultural areas [88,89].
Mining, landfill sites, garages and fuel stations may also have impacts on water quality. The potential threat of the Messebo cement factory, which is the largest limestone mining area in Mekelle, is that it mainly disrupts the existing river flow paths and influences the aquifer’s natural setup because of the deep excavation and blastings. Lubricants and fuel spills from heavy-duty types of machinery in the quarries may also challenge the quality of water resources. Furthermore, as per our field observations, a landfill site that is currently in use by the Mekelle municipality is an open-air dumping site, in which solid and liquid wastes of different sorts are spread. Laboratory analyses of surface and groundwater samples collected from the vicinity of this landfill site showed very high TDS, bicarbonate, sulfate, chloride, and nitrate concentrations [51]. Car washes and fuel stations also cause direct water resource pollution, either directly to the nearby rivers or to the groundwater via the fractured zones, as a result of their association with heavy metals and oils [90].
Other anthropogenic sources of pollution in the area are the garment and textile factories that may have an adverse impact on water resources by discharging environmentally toxic elements that are used in the factories and then released as effluents. People living near the garment and textile factories are more exposed to health risks, due to the heavy metal discharges that subsequently become mixed with river water [91]. In this research, the mega-industries referred to are Mesfin industrial engineering, Mekelle industry zones, steel and nail factories, the Moha soft drink factory, and the Desta alcohol and brewery factory. These industrial operations discharge different chemicals into the environment as effluents. Very high concentrations of zinc (Zn) and copper (Cu) are common in alcohol and brewery factories [92], and those elements are very toxic to human health when they are in high concentrations. Therefore, appropriate attention must be paid to the sources of pollution that are mentioned in this article, in relation to the generated groundwater vulnerability zones.

4. Conclusions

This study investigated the vulnerability to pollution of groundwater in the Mekelle area, using the DRASTIC model. In addition to the seven parameters in the model, two additional parameters, accounting for lineament density and land use, were used to modify the model. The performances of both the DRASTIC model and the modified DRASTIC model were assessed in relation to actual nitrate concentration data concerning the groundwaters of the area. From the 1023.4 km2 study area, four groundwater vulnerability zones were generated with the DRASTIC model: low (22.1% of the surface area), medium (29.6% of the surface area), high (30% of the surface area), and very high (18.3% of the surface area). Similarly, four vulnerability classes for the modified DRASTIC model were generated: low (16.3% of the surface area), medium (26.1% of the surface area), high (30% of the surface area), and very high (24.6% of the surface area). Based on our single-parameter sensitivity analysis, the impact of the vadose zone, the depth to the water table, and aquifer media indicated higher mean effective weightings of 23.7%, 22.9%, and 16.9%, respectively. In contrast, soil media, hydraulic conductivity, and topography tended to be less effective, with mean effective weightings of 8.7%, 7.8%, and 7.0%, respectively. The map removal sensitivity analysis showed high variation in the vulnerability index from the removal of the impact of the vadose zone (1.5%) and the depth to the water table (1.4%). The result showed the highest variation (4.8%) for soil media, topography, and hydraulic conductivities removal. In the modified DRASTIC model, lineaments (20%), the impact of the vadose zone (15.4%), and depth to the water table (14.9%), respectively, had higher effective weightings.
Both the DRASTIC and the modified DRASTIC indices showed a moderate positive correlation to the nitrate concentration in the groundwaters of the study area. The final findings, on both vulnerability index maps, showed that the northern, northeastern, and northwestern regions are characterized by very high to high vulnerability; most parts of the central area have medium vulnerability; and the southern and southeastern parts have low to medium vulnerability. In addition, this study inventoried and mapped the major potential sources of pollution in the area. The major polluting industrial activities are located in the high to very high vulnerability zones, resulting in a high risk for groundwater pollution. Therefore, to protect and monitor the resource, we recommend that managers and planners of groundwater resources in the region consider such information in the future. In addition, other organic and inorganic pollutants should be studied in the aquifers, and related vulnerability tools should be used to optimize the model outputs of this study.

Author Contributions

Conceptualization, K.A.A. and K.W.; methodology, K.A.A., B.A. and K.W.; software, K.A.A., B.A., K.W., A.S.B. and M.V.C.; validation, K.A.A., K.W., B.A., G.B., T.G., A.H. and M.H.; formal analysis, K.A.A., K.W., M.V.C., B.A. and T.G.; investigation, K.A.A., K.W., T.G., M.V.C., A.H., B.A., G.B. and M.H.; resources, K.A.A.; data curation, K.A.A.; writing—original draft preparation, K.A.A.; writing—review and editing, K.A.A., K.W., M.V.C., T.G., B.A., G.B., A.H. and M.H.; visualization, K.A.A. and K.W.; supervision, K.W.; project administration, K.W.; funding acquisition, K.A.A. and K.W. All authors have read and agreed to the published version of the manuscript.

Funding

Since November 2020, this research was funded by BOF-UGent (the Special Research Fund from Ghent University, Belgium).

Institutional Review Board Statement

Not applicable.

Informed Consent Statement

Not applicable.

Data Availability Statement

The data used in this research work are available upon request.

Acknowledgments

The authors thank BOF-UGent from Ghent University, Belgium, for the financial support and overall PhD scholarship sponsorship. Thanks are also due to the Tigray Region Water Resources Bureau and Mekelle University for providing secondary data and guidelines to complete this work. Finally, the authors would like to thank the editor and three anonymous reviewers for their valuable feedback and constructive comments, which greatly improved the quality of the manuscript.

Conflicts of Interest

The authors declare no conflict of interest.

References

  1. Smedley, P.L.; Smith, B.; Abesser, C.; Lapworth, D. Uranium Occurrence and Behaviour in British Groundwater; British Geological Survey Commissioned Report, CR/06/050N; Natural Enviromental Research Council: Swindon, UK, 2006; 60p. [Google Scholar]
  2. Burchi, S.; Mechlem, K. Groundwater in International Law Compilation of Treaties and Other Legal Instuments; United Nations Educational, Scientific and Cultural Organization Food and Agriculture Organization of the United Nations: Rome, Italy, 2005. [Google Scholar]
  3. Mirumachi, N.; Duda, A.; Gregulska, J.; Smetek, J. The Human Right to Drinking Water: Impact of Large-Scale Agriculture and Industry. Policy Department for External Relations, Directorate General for External Policies of the Union, European Parliament. 2021. Available online: https://www.europarl.europa.eu/RegData/etudes/IDAN/2021/653649/EXPO_IDA(2021)653649_EN.pdf (accessed on 2 July 2022).
  4. Aljawzi, A.A.; Fang, H.; Abbas, A.A.; Khailah, E.Y. Assessment of Water Resources in Sana’a Region, Yemen Republic (Case Study). Water 2022, 14, 1039. [Google Scholar] [CrossRef]
  5. Burayu, D.G. Identification of Groundwater Potential Zones Using AHP, GIS and RS Integration: A Case Study of Didessa Sub-Basin, Western Ethiopia. Remote Sens. Land 2022, 6, 1–15. [Google Scholar] [CrossRef]
  6. Mays, D.; Scheibe, T. Groundwater Contamination, Subsurface Processes, and Remediation Methods: Overview of the Special Issue of Water on Groundwater Contamination and Remediation. Water 2018, 10, 1708. [Google Scholar] [CrossRef] [Green Version]
  7. Vasileiou, E.; Papazotos, P.; Dimitrakopoulos, D.; Perraki, M. Hydrogeochemical Processes and Natural Background Levels of Chromium in an Ultramafic Environment. The Case Study of Vermio Mountain, Western Macedonia, Greece. Water 2021, 13, 2809. [Google Scholar] [CrossRef]
  8. Hirji, R.; Ibrekk, H.O. Environmental and Water Resources Management; International Bank for Reconstruction and Development: Washington, DC, USA, 2001; Available online: https://www.academia.edu/27649090/Environmental_and_water_ resources_management (accessed on 28 June 2022).
  9. Stalder, E.; Blanc, A.; Haldimann, M.; Dudler, V. Occurrence of Uranium in Swiss Drinking Water. Chemosphere 2012, 86, 672–679. [Google Scholar] [CrossRef] [PubMed]
  10. Panno, S.V.; Hackley, K.C.; Hwang, H.H.; Greenberg, S.E.; Krapac, I.G.; Landsberger, S.; O’Kelly, D.J. Characterization and Identification of Na-Cl Sources in Ground Water. Ground Water 2006, 44, 176–187. [Google Scholar] [CrossRef] [PubMed]
  11. Li, P.; Karunanidhi, D.; Subramani, T.; Srinivasamoorthy, K. Sources and Consequences of Groundwater Contamination. Arch. Environ. Contam. Toxicol. 2021, 80, 1–10. [Google Scholar] [CrossRef]
  12. Behera, A.K.; Pradhan, R.M.; Kumar, S.; Chakrapani, G.J.; Kumar, P. Assessment of Groundwater Flow Dynamics Using MODFLOW in Shallow Aquifer System of Mahanadi Delta (East Coast), India. Water 2022, 14, 611. [Google Scholar] [CrossRef]
  13. Vasileiou, E.; Papazotos, P.; Dimitrakopoulos, D.; Perraki, M. Expounding the Origin of Chromium in Groundwater of the Sarigkiol Basin, Western Macedonia, Greece: A Cohesive Statistical Approach and Hydrochemical Study. Environ. Monit. Assess. 2019, 191, 509. [Google Scholar] [CrossRef]
  14. Rukundo, E.; Doğan, A. Dominant Influencing Factors of Groundwater Recharge Spatial Patterns in Ergene River Catchment, Turkey. Water 2019, 11, 653. [Google Scholar] [CrossRef] [Green Version]
  15. Girmay, E.H. Litho–Structural Controls on the Groundwater Flow System and Hydrogeochemical Setup of the Mekelle Outlier and Surrounding Areas, Northern Ethiopia. Ph.D. Thesis, Addis Ababa University, Addis Ababa, Ethiopia, 2015. [Google Scholar]
  16. Salih, A.O.; Al-Manmi, D.A. DRASTIC Model Adjusted with Lineament Density to Map Groundwater Vulnerability: A Case Study in Rania Basin, Kurdistan, Iraq. Environ. Sci. Pollut. Res. 2021, 28, 59731–59744. [Google Scholar] [CrossRef]
  17. Sosa, J.I.M.; Gutiérrez Anguamea, G.A.; Monreal, R.; Grijalva Noriega, F.J.; Tapia-Villaseñor, E.M. Hydrogeomorphologic Mapping of the Transboundary San Pedro Aquifer: A Tool for Groundwater Characterization. Water 2022, 14, 906. [Google Scholar] [CrossRef]
  18. Fenta, M.C.; Anteneh, Z.L.; Szanyi, J.; Walker, D. Hydrogeological Framework of the Volcanic Aquifers and Groundwater Quality in Dangila Town and the Surrounding Area, Northwest Ethiopia. Groundw. Sustain. Dev. 2020, 11, 100408. [Google Scholar] [CrossRef]
  19. Van den Broeck, S. The Sustainability of the Aynalem Well Field, Mekelle, Ethiopia. Master’s Thesis, Ghent University, Ghent, Belgium, 2018. [Google Scholar]
  20. Lin, J.-J.; Liou, Y.-A. Integrating In-Situ Data and RS-GIS Techniques to Identify Groundwater Potential Sites in Mountainous Regions of Taiwan. Appl. Sci. 2020, 10, 4119. [Google Scholar] [CrossRef]
  21. Chandra, S.; Rao, V.A.; Krishnamurthy, N.S.; Dutta, S.; Ahmed, S. Integrated Studies for Characterization of Lineaments Used to Locate Groundwater Potential Zones in a Hard Rock Region of Karnataka, India. Hydrogeol. J. 2006, 14, 1042–1051. [Google Scholar] [CrossRef] [Green Version]
  22. Song, Y.; Song, X.; Shao, G.; Hu, T. Effects of Land Use on Stream Water Quality in the Rapidly Urbanized Areas: A Multiscale Analysis. Water 2020, 12, 1123. [Google Scholar] [CrossRef] [Green Version]
  23. Bundschuh, M.; Gessner, M.O.; Fink, G.; Ternes, T.A.; Sögding, C.; Schulz, R. Ecotoxicologial Evaluation of Wastewater Ozonation Based on Detritus–Detritivore Interactions. Chemosphere 2011, 82, 355–361. [Google Scholar] [CrossRef]
  24. Stellato, L.; Coda, S.; Arienzo, M.; de Vita, P.; di Rienzo, B.; D’Onofrio, A.; Ferrara, L.; Marzaioli, F.; Trifuoggi, M.; Allocca, V. Natural and Anthropogenic Groundwater Contamination in a Coastal Volcanic-Sedimentary Aquifer: The Case of the Archaeological Site of Cumae (Phlegraean Fields, Southern Italy). Water 2020, 12, 3463. [Google Scholar] [CrossRef]
  25. Vigliotti, M.; Busico, G.; Ruberti, D. Assessment of the Vulnerability to Agricultural Nitrate in Two Highly Diversified Environmental Settings. Environments 2020, 7, 80. [Google Scholar] [CrossRef]
  26. Goonetilleke, A.; Vithanage, M. Water Resources Management: Innovation and Challenges in a Changing World. Water 2017, 9, 281. [Google Scholar] [CrossRef]
  27. Terrone, M.; Paliaga, G.; Bazzurro, N.; Marchese, A.; Faccini, F. Groundwater Resources in a Fractured-Rock Aquifer, Conglomerate of Portofino. J. Maps 2021, 17, 268–278. [Google Scholar] [CrossRef]
  28. Voudouris, K.; Kazakis, N. Groundwater Quality and Groundwater Vulnerability Assessment. Environments 2021, 8, 100. [Google Scholar] [CrossRef]
  29. Ground Water Vulnerability Assessment: Predicting Relative Contamination Potential Under Conditions of Uncertainty; National Academies Press: Washington, DC, USA, 1993; p. 2050. ISBN 978-0-309-04799-9.
  30. Huan, H.; Wang, J.; Teng, Y. Assessment and Validation of Groundwater Vulnerability to Nitrate Based on a Modified DRASTIC Model: A Case Study in Jilin City of Northeast China. Sci. Total Environ. 2012, 440, 14–23. [Google Scholar] [CrossRef] [PubMed]
  31. Machiwal, D.; Cloutier, V.; Güler, C.; Kazakis, N. A Review of GIS-Integrated Statistical Techniques for Groundwater Quality Evaluation and Protection. Environ. Earth Sci. 2018, 77, 681. [Google Scholar] [CrossRef]
  32. Yan, C.-A.; Zhang, W.; Zhang, Z.; Liu, Y.; Deng, C.; Nie, N. Assessment of Water Quality and Identification of Polluted Risky Regions Based on Field Observations & GIS in the Honghe River Watershed, China. PLoS ONE 2015, 10, e0119130. [Google Scholar] [CrossRef]
  33. Lee, H.; Suk, H.; Chen, J.-S.; Park, E. Application of a Developed Numerical Model for Surfactant Flushing Combined with Intermittent Air Injection at Field Scale. Water 2022, 14, 316. [Google Scholar] [CrossRef]
  34. Barbulescu, A. Assessing Groundwater Vulnerability: DRASTIC and DRASTIC-Like Methods: A Review. Water 2020, 12, 1356. [Google Scholar] [CrossRef]
  35. Ersoy, A.F.; Gültekin, F. DRASTIC-Based Methodology for Assessing Groundwater Vulnerability in the Gümüşhacıköy and Merzifon Basin (Amasya, Turkey). Earth Sci. Res. J. 2013, 17, 33–40. [Google Scholar]
  36. Voudouris, K. Assessment of Intrinsic Vulnerability Using the DRASTIC Model and GIS in the Kiti Aquifer, Cyprus. Eur. Water 2010, 30, 13–24. [Google Scholar]
  37. Shah, S.H.I.A.; Yan, J.; Ullah, I.; Aslam, B.; Tariq, A.; Zhang, L.; Mumtaz, F. Classification of Aquifer Vulnerability by Using the DRASTIC Index and Geo-Electrical Techniques. Water 2021, 13, 2144. [Google Scholar] [CrossRef]
  38. Babiker, I.S.; Mohamed, M.A.A.; Hiyama, T.; Kato, K. A GIS-Based DRASTIC Model for Assessing Aquifer Vulnerability in Kakamigahara Heights, Gifu Prefecture, Central Japan. Sci. Total Environ. 2005, 345, 127–140. [Google Scholar] [CrossRef] [PubMed]
  39. Aller, L.; Bennett, T.; Lehr, J.H.; Petty, R.; Hackett, G. DRASTIC: A Standardized System for Evaluating Groundwater Pollution Potential Using Hydrogeological Settings; U.S. Environment Protection Agency/600/2-87/035: Washington, DC, USA, 1987.
  40. Ouedraogo, I.; Defourny, P.; Vanclooster, M. Mapping the Groundwater Vulnerability for Pollution at the Pan African Scale. Sci. Total Environ. 2016, 544, 939–953. [Google Scholar] [CrossRef] [PubMed]
  41. Heiß, L.; Bouchaou, L.; Tadoumant, S.; Reichert, B. Index-Based Groundwater Vulnerability and Water Quality Assessment in the Arid Region of Tata City (Morocco). Groundw. Sustain. Dev. 2020, 10, 100344. [Google Scholar] [CrossRef]
  42. Zghibi, A.; Merzougui, A.; Chenini, I.; Ergaieg, K.; Zouhri, L.; Tarhouni, J. Groundwater Vulnerability Analysis of Tunisian Coastal Aquifer: An Application of DRASTIC Index Method in GIS Environment. Groundw. Sustain. Dev. 2016, 2–3, 169–181. [Google Scholar] [CrossRef]
  43. Gebreyohannes, T.; de Smedt, F.; Walraevens, K.; Gebresilassie, S.; Hussien, A.; Hagos, M.; Amare, K.; Deckers, J.; Gebrehiwot, K. Application of a Spatially Distributed Water Balance Model for Assessing Surface Water and Groundwater Resources in the Geba Basin, Tigray, Ethiopia. J. Hydrol. 2013, 499, 110–123. [Google Scholar] [CrossRef]
  44. Berhe Zenebe, G.; Hussien, A.; Girmay, A.; Hailu, G. Spatial Analysis of Groundwater Vulnerability to Contamination and Human Activity Impact Using a Modified DRASTIC Model in Elalla-Aynalem Catchment, Northern Ethiopia. Sustain. Water Resour. Manag. 2020, 6, 51. [Google Scholar] [CrossRef]
  45. Hagos, M.; Gebreyohannes, T.; Amare, K.; Hussien, A.; Berhane, G.; Walraevens, K.; Koeberl, C.; van Wyk de Vries, B.; Cavalazzi, B. Tectonic Link between the Neoproterozoic Dextral Shear Fabrics and Cenozoic Extension Structures of the Mekelle Basin, Northern Ethiopia. Int. J. Earth Sci. 2020, 109, 1957–1974. [Google Scholar] [CrossRef]
  46. Arkin, Y.; Levitte, D.; Beyth, M. Geological Map of Mekele Sheet Area ND 37-11; Ministry of Mines Geological Survey of Ethiopia: Addis Ababa, Ethiopia, 1971; p. 3.
  47. Gebreyohannes, T.; Smedt, F.D.; Hagos, M.; Gebresilassie, S.; Amare, K.; Kabeto, K.; Hussein, A.; Nyssen, J.; Bauer, H.; Moeyersons, J.; et al. Large-Scale Geological Mapping of the Geba Basin, Northern Ethiopia. VLIR - Mekelle University IUC Program. 2010. Available online: https://www.academia.edu/en/71310929/Large_Scale_Geological_mapping_of_the_Geba_basin_northern_Ethiopia (accessed on 2 July 2022).
  48. Küster, D.; Dwivedi, S.B.; Kabeto, K.; Mehari, K.; Matheis, G. Petrogenetic Reconnaissance Investigation of Mafic Sills Associated with Flood Basalts, Mekelle Basin, Northern Ethiopia: Implications for Ni–Cu Exploration. J. Geochem. Explor. 2005, 85, 63–79. [Google Scholar] [CrossRef]
  49. Seyoum, H. Hydraulic and Chemical Characterization of Aquifer System of the Aynalem Wellfield, Northern Ethiopia. Master’s Thesis, Ghent University, Ghent, Belgium, 2017. [Google Scholar]
  50. Matter, J.M.; Goldberg, D.S.; Morin, R.H.; Stute, M. Contact Zone Permeability at Intrusion Boundaries: New Results from Hydraulic Testing and Geophysical Logging in the Newark Rift Basin, New York, USA. Hydrogeol. J. 2006, 14, 689–699. [Google Scholar] [CrossRef] [Green Version]
  51. Alemayehu, T.; Mebrahtu, G.; Hadera, A.; Bekele, D.N. Assessment of the Impact of Landfill Leachate on Groundwater and Surrounding Surface Water: A Case Study of Mekelle City, Northern Ethiopia. Sustain. Water Resour. Manag. 2019, 5, 1641–1649. [Google Scholar] [CrossRef]
  52. Gebreyohannes, T.; de Smedt, F.; Walraevens, K.; Gebresilassie, S.; Hussien, A.; Hagos, M.; Amare, K.; Deckers, J.; Gebrehiwot, K. Regional Groundwater Flow Modeling of the Geba Basin, Northern Ethiopia. Hydrogeol. J. 2017, 25, 639–655. [Google Scholar] [CrossRef]
  53. Kassa, G.; Tadesse, N.; Yohannes, T.G. Aquifers Characterization and Productivity in Ellala Catchment, Tigray, Northern Ethiopia. Momona Ethiop. J. Sci. 2015, 7, 203. [Google Scholar] [CrossRef] [Green Version]
  54. Kalhor, K.; Ghasemizadeh, R.; Rajic, L.; Alshawabkeh, A. Assessment of Groundwater Quality and Remediation in Karst Aquifers: A Review. Groundw. Sustain. Dev. 2019, 8, 104–121. [Google Scholar] [CrossRef]
  55. Kahsay, G.H. Groundwater Resource Assessment through Distributed Steady-State Flow Modeling, Aynalem Wellfield (Mekele, Ethiopia). Master’s Thesis, International Institute for Geoinformation Science and Earth Observation Enschede, Enschede, The Netherlands, 2008. [Google Scholar]
  56. Burrough, P.A.; McDonnell, R.A. Principles of Geographical Information Systems; Spatial Information Systems and Geostatistics; Oxford University Press: Oxford, UK, 2000. [Google Scholar]
  57. Abdullah, T.O.; Ali, S.S.; Al-Ansari, N.A.; Knutsson, S. Groundwater Vulnerability Mapping Using Lineament Density on Standard DRASTIC Model: Case Study in Halabja Saidsadiq Basin, Kurdistan Region, Iraq. Engineering 2015, 7, 644–667. [Google Scholar] [CrossRef] [Green Version]
  58. Pradhan, B.; Youssef, A.M. Manifestation of Remote Sensing Data and GIS on Landslide Hazard Analysis Using Spatial-Based Statistical Models. Arab. J. Geosci. 2010, 3, 319–326. [Google Scholar] [CrossRef]
  59. Hamza, S.M.; Ahsan, A.; Imteaz, M.A.; Ghazali, A.H.; Mohammed, T.A. GIS-Based FRASTIC Model for Pollution Vulnerability Assessment of Fractured-Rock Aquifer Systems. Environ. Earth Sci. 2017, 76, 197. [Google Scholar] [CrossRef]
  60. Pinto, D.; Shrestha, S.; Babel, M.S.; Ninsawat, S. Delineation of Groundwater Potential Zones in the Comoro Watershed, Timor Leste Using GIS, Remote Sensing and Analytic Hierarchy Process (AHP) Technique. Appl. Water Sci. 2017, 7, 503–519. [Google Scholar] [CrossRef] [Green Version]
  61. Shirazi, S.M.; Imran, H.M.; Akib, S. GIS-Based DRASTIC Method for Groundwater Vulnerability Assessment: A Review. J. Risk Res. 2012, 15, 991–1011. [Google Scholar] [CrossRef]
  62. Napolitano, P.; Fabbri, A.G. Single parameter sensitivity analysis for aquifer vulnerability assessment using DRASTIC and SINTACS. In Proceedings of the 2nd HydroGIS Conference: International Association of Hydrological Sciences; IAHS Publications: Wallingford, UK, 1996; p. 235. [Google Scholar]
  63. Al-Rawabdeh, A.; Al-Ansari, N.; Al-Taani, A.; Al-Khateeb, F.; Knutsson, S. Modeling the Risk of Groundwater Contamination Using Modified DRASTIC and GIS in Amman-Zerqa Basin, Jordan. Open Eng. 2014, 4, 264–280. [Google Scholar] [CrossRef]
  64. Lodwick, W.A.; Monson, W.; Svoboda, L. Attribute Error and Sensitivity Analysis of Map Operations in Geographical Informations Systems: Suitability Analysis. Int. J. Geogr. Inf. Syst. 1990, 4, 413–428. [Google Scholar] [CrossRef]
  65. Tomer, T.; Katyal, D.; Joshi, V. Sensitivity Analysis of Groundwater Vulnerability Using DRASTIC Method: A Case Study of National Capital Territory, Delhi, India. Groundw. Sustain. Dev. 2019, 9, 100271. [Google Scholar] [CrossRef]
  66. Saidi, S.; Bouri, S.; Ben Dhia, H. Sensitivity Analysis in Groundwater Vulnerability Assessment Based on GIS in the Mahdia-Ksour Essaf Aquifer, Tunisia: A Validation Study. Hydrol. Sci. J. 2011, 56, 288–304. [Google Scholar] [CrossRef]
  67. Oke, S.A. Regional Aquifer Vulnerability and Pollution Sensitivity Analysis of Drastic Application to Dahomey Basin of Nigeria. Int. J. Environ. Res. Public Health 2020, 17, 2609. [Google Scholar] [CrossRef] [Green Version]
  68. Ramos Leal, J.A.; Rodríguez Castillo, R. Aquifer Vulnerability Mapping in the Turbio River Valley, Mexico: A Validation Study. Geofísica Int. 2003, 42, 141–156. [Google Scholar] [CrossRef]
  69. Assaf, H.; Saadeh, M. Geostatistical Assessment of Groundwater Nitrate Contamination with Reflection on DRASTIC Vulnerability Assessment: The Case of the Upper Litani Basin, Lebanon. Water Resour. Manag. 2009, 23, 775–796. [Google Scholar] [CrossRef]
  70. Voutchkova, D.D.; Schullehner, J.; Rasmussen, P.; Hansen, B. A High-Resolution Nitrate Vulnerability Assessment of Sandy Aquifers (DRASTIC-N). J. Environ. Manag. 2021, 277, 111330. [Google Scholar] [CrossRef]
  71. Khosravi, K.; Sartaj, M.; Tsai, F.T.-C.; Singh, V.P.; Kazakis, N.; Melesse, A.M.; Prakash, I.; Tien Bui, D.; Pham, B.T. A Comparison Study of DRASTIC Methods with Various Objective Methods for Groundwater Vulnerability Assessment. Sci. Total Environ. 2018, 642, 1032–1049. [Google Scholar] [CrossRef]
  72. Vithanage, M.; Mikunthan, T.; Pathmarajah, S.; Arasalingam, S.; Manthrithilake, H. Assessment of Nitrate-N Contamination in the Chunnakam Aquifer System, Jaffna Peninsula, Sri Lanka. SpringerPlus 2014, 3, 271. [Google Scholar] [CrossRef] [Green Version]
  73. Jasrotia, A.S.; Singh, R. groundwater pollution vulnerability using the drastic model in a gis environment, devak-rui watersheds, India. J. Environ. Hydrol. 2005, 13, 11. [Google Scholar]
  74. El Baba, M.; Kayastha, P.; Huysmans, M.; De Smedt, F. Groundwater Vulnerability and Nitrate Contamination Assessment and Mapping Using DRASTIC and Geostatistical Analysis. Water 2020, 12, 2022. [Google Scholar] [CrossRef]
  75. Yenehun, A.; Walraevens, K.; Batelaan, O. Spatial and Temporal Variability of Groundwater Recharge in Geba Basin, Northern Ethiopia. J. Afr. Earth Sci. 2017, 134, 198–212. [Google Scholar] [CrossRef] [Green Version]
  76. Teklebirhan, A.; Dessie, N.; Tesfamichael, G. Groundwater Recharge, Evapotranspiration and Surface Runoff Estimation Using WetSpass Modeling Method in Illala Catchment, Northern Ethiopia. Momona Ethiop. J. Sci. 2012, 4, 96. [Google Scholar] [CrossRef] [Green Version]
  77. Cook, P.G.; Edmunds, W.M.; Gaye, C.B. Estimating Paleorecharge and Paleoclimate from Unsaturated Zone Profiles. Water Resour. Res. 1992, 28, 2721–2731. [Google Scholar] [CrossRef]
  78. Piscopo, G. Groundwater Vulnerability Map, Explanatory Notes, Castlereagh Catchment, NSW. Department of Land and Water Conservation, Parramatta. 2001. Available online: http://www.water.nsw.gov.au/__data/assets/pdf_file/0008/549377/quality_groundwater_castlereagh_map_notes.pdf (accessed on 25 May 2022).
  79. Ahmed, I.; Nazzal, Y.; Zaidi, F. Groundwater Pollution Risk Mapping Using Modified DRASTIC Model in Parts of Hail Region of Saudi Arabia. Environ. Eng. Res. 2017, 23, 84–91. [Google Scholar] [CrossRef] [Green Version]
  80. Tesfagiorgis, K.; Gebreyohannes, T.; de Smedt, F.; Moeyersons, J.; Hagos, M.; Nyssen, J.; Deckers, J. Evaluation of Groundwater Resources in the Geba Basin, Ethiopia. Bull. Eng. Geol. Environ. 2011, 70, 461–466. [Google Scholar] [CrossRef]
  81. Pathak, D.R.; Hiratsuka, A.; Awata, I.; Chen, L. Groundwater Vulnerability Assessment in Shallow Aquifer of Kathmandu Valley Using GIS-Based DRASTIC Model. Environ. Geol. 2009, 57, 1569–1578. [Google Scholar] [CrossRef]
  82. Goodarzi, M.R. Aquifer Vulnerability Identification Using DRASTIC-LU Model Modification by Fuzzy Analytic Hierarchy Process. Modeling Earth Syst. Environ. 2022, 8, 1–16. [Google Scholar] [CrossRef]
  83. Meng, L.; Zhang, Q.; Liu, P.; He, H.; Xu, W. Influence of Agricultural Irrigation Activity on the Potential Risk of Groundwater Pollution: A Study with Drastic Method in a Semi-Arid Agricultural Region of China. Sustainability 2020, 12, 1954. [Google Scholar] [CrossRef] [Green Version]
  84. Busico, G.; Kazakis, N.; Colombani, N.; Khosravi, K.; Voudouris, K.; Mastrocicco, M. The Importance of Incorporating Denitrification in the Assessment of Groundwater Vulnerability. Appl. Sci. 2020, 10, 2328. [Google Scholar] [CrossRef] [Green Version]
  85. Witkowski, A.J.; Kowalczyk, A.; Vrba, J. Groundwater Vulnerability Assessment and Mapping; IAH Selected Papers, Taylor & Francis: London, UK, 2007; Volume 11, p. 86. [Google Scholar]
  86. Vrba, J.; Zaporozec, A. Guidebook on Mapping Groundwater Vulnerability—IAH International Contributions to Hydrogeology; Heise Publication: Hanover, Germany, 1994; Volume 16, p. 131. [Google Scholar]
  87. Groundwater Vulnerability and Pollution Risk Assessment; IAH-SP Series; Witkowski, A.J.; Jakóbczyk-Karpierz, S.; Czekaj, J.; Grabala, D. (Eds.) CRC Press: Bota Raton, FL, USA, 2020; Volume 24, 212p. [Google Scholar]
  88. Adhena, K.; Estifanos, S.; Hagos, M.; Abr, B. physico-chemical characterization of stream water in maichew area, southern tigray, ethiopia. GSJ 2020, 8, 15. [Google Scholar]
  89. Pradhan, U.K.; Shirodkar, P.V.; Sahu, B.K. Physico-Chemical Characteristics of the Coastal Water off Devi Estuary, Orissa and Evaluation of Its Seasonal Changes Using Chemometric Techniques. Curr. Sci. 2009, 96, 7. [Google Scholar]
  90. Rai, R.; Sharma, S.; Gurung, D.B.; Sitaula, B.K.; Shah, R.D.T. Assessing the Impacts of Vehicle Wash Wastewater on Surface Water Quality through Physico-Chemical and Benthic Macroinvertebrates Analyses. Water Sci. 2020, 34, 39–49. [Google Scholar] [CrossRef] [Green Version]
  91. Sakamoto, M.; Ahmed, T.; Begum, S.; Huq, H. Water Pollution and the Textile Industry in Bangladesh: Flawed Corporate Practices or Restrictive Opportunities? Sustainability 2019, 11, 1951. [Google Scholar] [CrossRef] [Green Version]
  92. Kowsalya, R.; Noorjahan, C.M.; Karrunakaran, C.M.; Deecaraman, M.; Vijayalakshmi, M. physico-chemical characterisation of brewery effluent and its degradation using native fungus aspergillus niger. J. Ind. Pollut. Control. 2010, 26, 171–176. [Google Scholar]
Figure 1. Location map of the study area.
Water 14 02577 g001
Figure 2. A map of the dolerite outcrops and cogenetic volcanic rocks of the Mekelle basin, modified on the basis of a prior study with permission from [45].
Water 14 02577 g002
Figure 3. Hydrogeological cross-section in the study area along A1 to A2, as shown in Figure 1.
Water 14 02577 g003
Figure 4. The seven input thematic layers of the DRASTIC model and their ratings for the study area: (A) depth-to-water table; (B) net recharge; (C) aquifer media; (D) soil media; (E) topography; (F) vadose zone; and (G) hydraulic conductivity.
Water 14 02577 g004
Figure 5. Two additional input thematic layers and their ratings to modify the conventional DRASTIC model: (A) lineament density; (B) land use map.
Water 14 02577 g005
Figure 6. Vulnerability index maps of the study area using the DRASTIC (A), and the modified DRASTIC (B) methods.
Water 14 02577 g006
Figure 7. The distribution of the concentration of nitrates in groundwater are shown on the conventional DRASTIC index map (A) and the modified DRASTIC index map (B).
Water 14 02577 g007
Figure 8. Index values plotted against nitrate concentrations to examine the correlations. A significant (p-value = 0.000) correlation with a moderate and positive Pearson’s correlation (r) was observed for the study area in both the DRASTIC and modified DRASTIC approaches (0.681 and 0.702, respectively) for the nitrate concentration (n = 65).
Water 14 02577 g008
Figure 9. Water wells and potential sources of anthropogenic pollution.
Water 14 02577 g009
Table 1. The DRASTIC method parameters [34], together with the ratings and weights for the study area.
ParameterDescriptionRangeRatingWeight
Depth to water table (D)The unsaturated and partially saturated zone; the depth from the upper part of the ground to the water table.<5 (m)105
5–10 (m)8
10–15 (m)6
15–20 (m)4
>20 (m)2
Recharge (R)The amount of water per unit area of land that further gets infiltrated.<34 (mm/year)14
34–64 (mm/year)4
>64 (mm/year)6
Aquifer media (A)Porous, permeable and groundwater saturated geological formation.Limestone-shale-marl intercalation43
Fractured dolerite5
Fractured limestone6
Soil media (S)The upper very loose and weathered part of the subsoil.Clay12
Clay loam3
Silty loam4
Sandy loam6
Topography (T)The slope of the land surface representing the plain and mountainous area.0–2 (%)101
2–6 (%)9
6–12 (%)5
12–18 (%)3
>18 (%)1
Impact of vadose zone (I)The upper and unsaturated zone as well as the confining part of the earth materials overlaying the water table.Shale and clay35
Limestone-shale intercalation4
Fractured dolerite6
Hydraulic conductivity (C)The movement nature of water within the aquifer, based on the hydraulic gradients and permeabilities.<4.1 (m/day)13
4.1–12.2 (m/day)2
12.2–25 (m/day)4
25–76 (m/day)6
>76 (m/day)8
Table 2. Ratings and weights of lineaments and land use in the study area.
ParameterDescriptionRangeRatingWeight
Lineament densityAll tectonic and non- tectonic fractures0.15–0.3774
0.37–0.588
0.58–1.099
Land use and land cover Human activities regarding land useBare land13
Natural vegetation2
Water bodies3
Built-up area7
Agricultural area8
Table 3. Statistical summary of the single-parameter sensitivity analysis of DRASTIC.
ParameterTheoretical WeightTheoretical Weight (%)Effective Weight (%)
MinMaxMeanSD
D521.79.044.922.96.7
R417.43.230.012.77.5
A313.010.129.016.92.8
S28.616.619.68.74.2
T14.30.716.67.03.4
I521.711.941.623.75.8
C313.02.227.27.84.1
Table 4. Statistical summary of one-map-removal sensitivity analysis.
ParametersVariation Index (%)
MinMaxMeanSD
D0.85.11.41.1
R1.82.60.21.2
A0.62.40.40.4
S2.10.80.90.7
T2.20.21.20.5
I0.34.51.50.9
C1.92.11.00.6
Table 5. Statistics of the multi-map-removal sensitivity analysis.
ParametersVariation Index (%)
MinMaxMeanSD
DRASTIC
DRASIC2.20.21.20.5
DRASI4.91.72.71.1
DRAI9.21.64.82.1
RAI9.94.43.52.9
RA11.97.00.53.3
R15.7111.57.5
Table 6. Statistical summary of the single-parameter sensitivity analysis of modified DRASTIC.
ParameterTheoretical WeightTheoretical Weight (%)Effective Weight (%)
MinMaxMeanSD
D516.65.834.414.94.5
R413.32.2218.45.2
A3106.717.810.91.7
S26.61.113.15.62.6
T13.30.510.54.52.1
I516.68.22815.44.0
C3101.619.65.02.6
LU3101.526.314.35.1
Lina413.313.336202.9
Table 7. Areal coverage of DRASTIC and modified DRASTIC vulnerability index classes.
Vulnerability Index ClassDRASTICModified DRASTIC
Area (km2)Percent (%)Area (km2)Percent (%)
Low225.722.1166.416.3
Medium302.829.6266.826.1
High307.230.0338.033.0
Very high187.618.3252.224.6
Publisher’s Note: MDPI stays neutral with regard to jurisdictional claims in published maps and institutional affiliations.

