Article

Hydrogeochemistry of Shallow Groundwater and Suitability to Irrigation: The Case of the Karfiguéla Paddy Field in Burkina Faso

by
Sauret Élie Serge Gaëtan
1,
Compaoré Hillary Marie Michelle
1,2,*,
Kissou Ouindinboudé Jacques
1,3,
Yaméogo Poulouma Louis
1 and
Sermé Idriss
1
1
Centre National de Recherche Scientifique et Technologique, Institut de l’Environnement et de Recherches Agricoles–Département Gestion des Ressources Naturelles/Systèmes de Productions, DRREA-Ouest, Station de Farako-bâ, Bobo-Dioulasso 01 BP 910, Burkina Faso
2
Institut International d’Ingénierie de l’Eau et de l’Environnement, Rue de la Science, Ouagadougou 01 BP 594, Burkina Faso
3
Institut du Développement Rural-Université Nazi Boni, Bobo-Dioulasso 01 BP 109, Burkina Faso
*
Author to whom correspondence should be addressed.
Water 2022, 14(16), 2574; https://doi.org/10.3390/w14162574
Submission received: 15 July 2022 / Revised: 5 August 2022 / Accepted: 11 August 2022 / Published: 20 August 2022

Abstract

:
Shallow groundwater is often exposed to multiple sources of pollution that can make it unsuitable for certain uses. Complete hydrogeochemical studies are necessary for the better management of these resources. Well water samples were collected on the extent of Karfiguéla paddy field for physico-chemical parameters, such as pH, EC, TDS, Na+, Ca2+, Mg2+, K+, NH4+, NO3, NO2, SO42−, CO32−, Cl, and HCO3, and metallic trace elements analyses as a case study. Due to the alluvial nature of aquifer deposits and the short residence time of groundwater, physical parameters and ion concentrations are low and within the recommended guideline values for irrigation water of the Food and Agriculture Organization (FAO) of the United Nations. However, Cd presents concentrations above 10 µg/L, the limit recommended by the FAO, while NO3 presents a slight to moderate risk. Piper and Stiff diagrams showed two types of water, Ca·Mg·HCO3 and Ca·Mg·SO4·Cl. Saturation indices revealed the under mineralization of natural minerals. Gibbs and bivariate diagrams, correlations and factorial analyses indicated that groundwater mineralization is mainly controlled by anthropogenic agricultural activities (60.05%), calcite and magnesite alteration (15.01%) and CO2 dissolution process (9.05%). Irrigation water suitability parameters, such as sodium adsorption ratio (SAR), sodium percentage (%Na), potential salinity (PS), the Kelly ratio (KR), residual sodium carbonate (RSC) and irrigation coefficient (Ka), confirmed that the shallow groundwater is 100% good for irrigation, while NO3 and permeability index (PI) indicated that it is permissible. However, according to magnesium hazard (MH), the groundwater is 100% unsuitable for irrigation and could lead to soil alkalinity.

1. Introduction

Groundwater reserves are being depleted over times. According to Wada and al. (2010) [1], the total depletion of groundwater around the world has increased from 126 (±32) km3 in 1960 to 283 (±40) km3 in 2000, corresponding to 39 (±10) % of the amount of groundwater withdrawn in the world and (±0.6) % of the direct recharges that feed the groundwater tables. This depletion highlights, at present, the significant groundwater stress whose causes are explained by the increases in irrigated agricultural areas, galloping industrialization, world population growth and drinking water needs, livestock, mining activities and the impact of climate change [2,3,4,5,6,7,8].
In this context, the renewable groundwater reserves available for irrigation in Africa seem important but are fairly underestimated [9,10], while they could largely contribute to the achievement of food and nutritional self-sufficiency and substantially of more than 40% of farmers’ incomes in some countries [11,12]).
To this end, in semi-arid and low-income countries such as Burkina Faso, the use of easily accessible shallow groundwater for irrigation is very important for poor people and this does not require complex and expensive treatment systems [13]. Thus, there is a clear trend towards the exploitation of fairly deep aquifers because of their lesser vulnerability to external pollution. Shallow groundwater, more vulnerable to climatic hazards, overexploitation and external pollution, is then neglected and underestimated.
However, these aquifers, which are generally porous and unconsolidated, are full of significant potential that can be used for various uses, including irrigation. This could contribute to an increase in agricultural productivity and the achievement of food self-sufficiency for semi-arid countries. Indeed, for several decades, the development of irrigated agriculture has been seen a means to face the food and nutritional insecurity of developing countries. Thus, in Burkina Faso, following the food crisis caused by the severe droughts of the 1970s and 1980s, several dams were built in order to overcome water shortages and allow the development of irrigation [14].
Unfortunately, the harmful effects of climate change are all the more glaring as some water reservoirs are disappearing [14,15]. This situation has a direct impact on the performance of the agricultural developments that are now facing serious water deficits [14,16]. This is the case of the Karfiguéla paddy field, taken as a case study, which is facing a lack of water both during the wet and dry seasons [17,18]. The lack of water is such that the users have been forced to divide the Karfiguéla perimeter into two parts and practice an alternating system of exploitation during the dry season [19]. However, the perimeter was developed on an alluvial plain whose thickness is estimated between 19 and 37 m with an annual extraction percentage of less than 10% of the renewable water resource estimated at 1,885,000 m3 [20]. It is therefore obvious that the shallow aquifer constitutes a non-negligible resource for irrigation.
Assessing the capacity of a water resource to meet a need, whether it be drinking water supply for the population, agricultural, industrial or energy production, necessarily requires to assess its quantity and its quality. Thus, the characterization of processes that control aquifer chemistry and the identification of probable sources of ions and pollution are important for groundwater resource sustainable management [13]. Specifically, for irrigation, water quality directly affects soils and crops quality and productivity through salinity evaluated by total dissolved solids (TDS) or electrical conductivity (EC) and the toxicity due to chloride, sodium, magnesium, or heavy metals (Orou et al., 2016; Scheiber et al., 2020). The suitability of water for irrigation can also be evaluated through indices and ratios widely used throughout the world. These include sodium adsorption ratio (SAR), sodium percentage (%Na), potential salinity (PS), the Kelly ratio (KR), residual sodium carbonate (RSC), magnesium hazard (MH), permeability index (PI), and irrigation coefficient (Ka) [21,22,23,24,25,26].
To our knowledge, hydrogeochemical characterization has not yet been carried out on the scale of the Karfiguéla alluvial plain. Thus, the aim of this study is to identify and assess processes that control the shallow groundwater chemistry in an agricultural context and assess the suitability of these waters for agricultural use. The results provide essential information for the management and protection of the shallow aquifer that unfolds under the Karfiguéla paddy field.

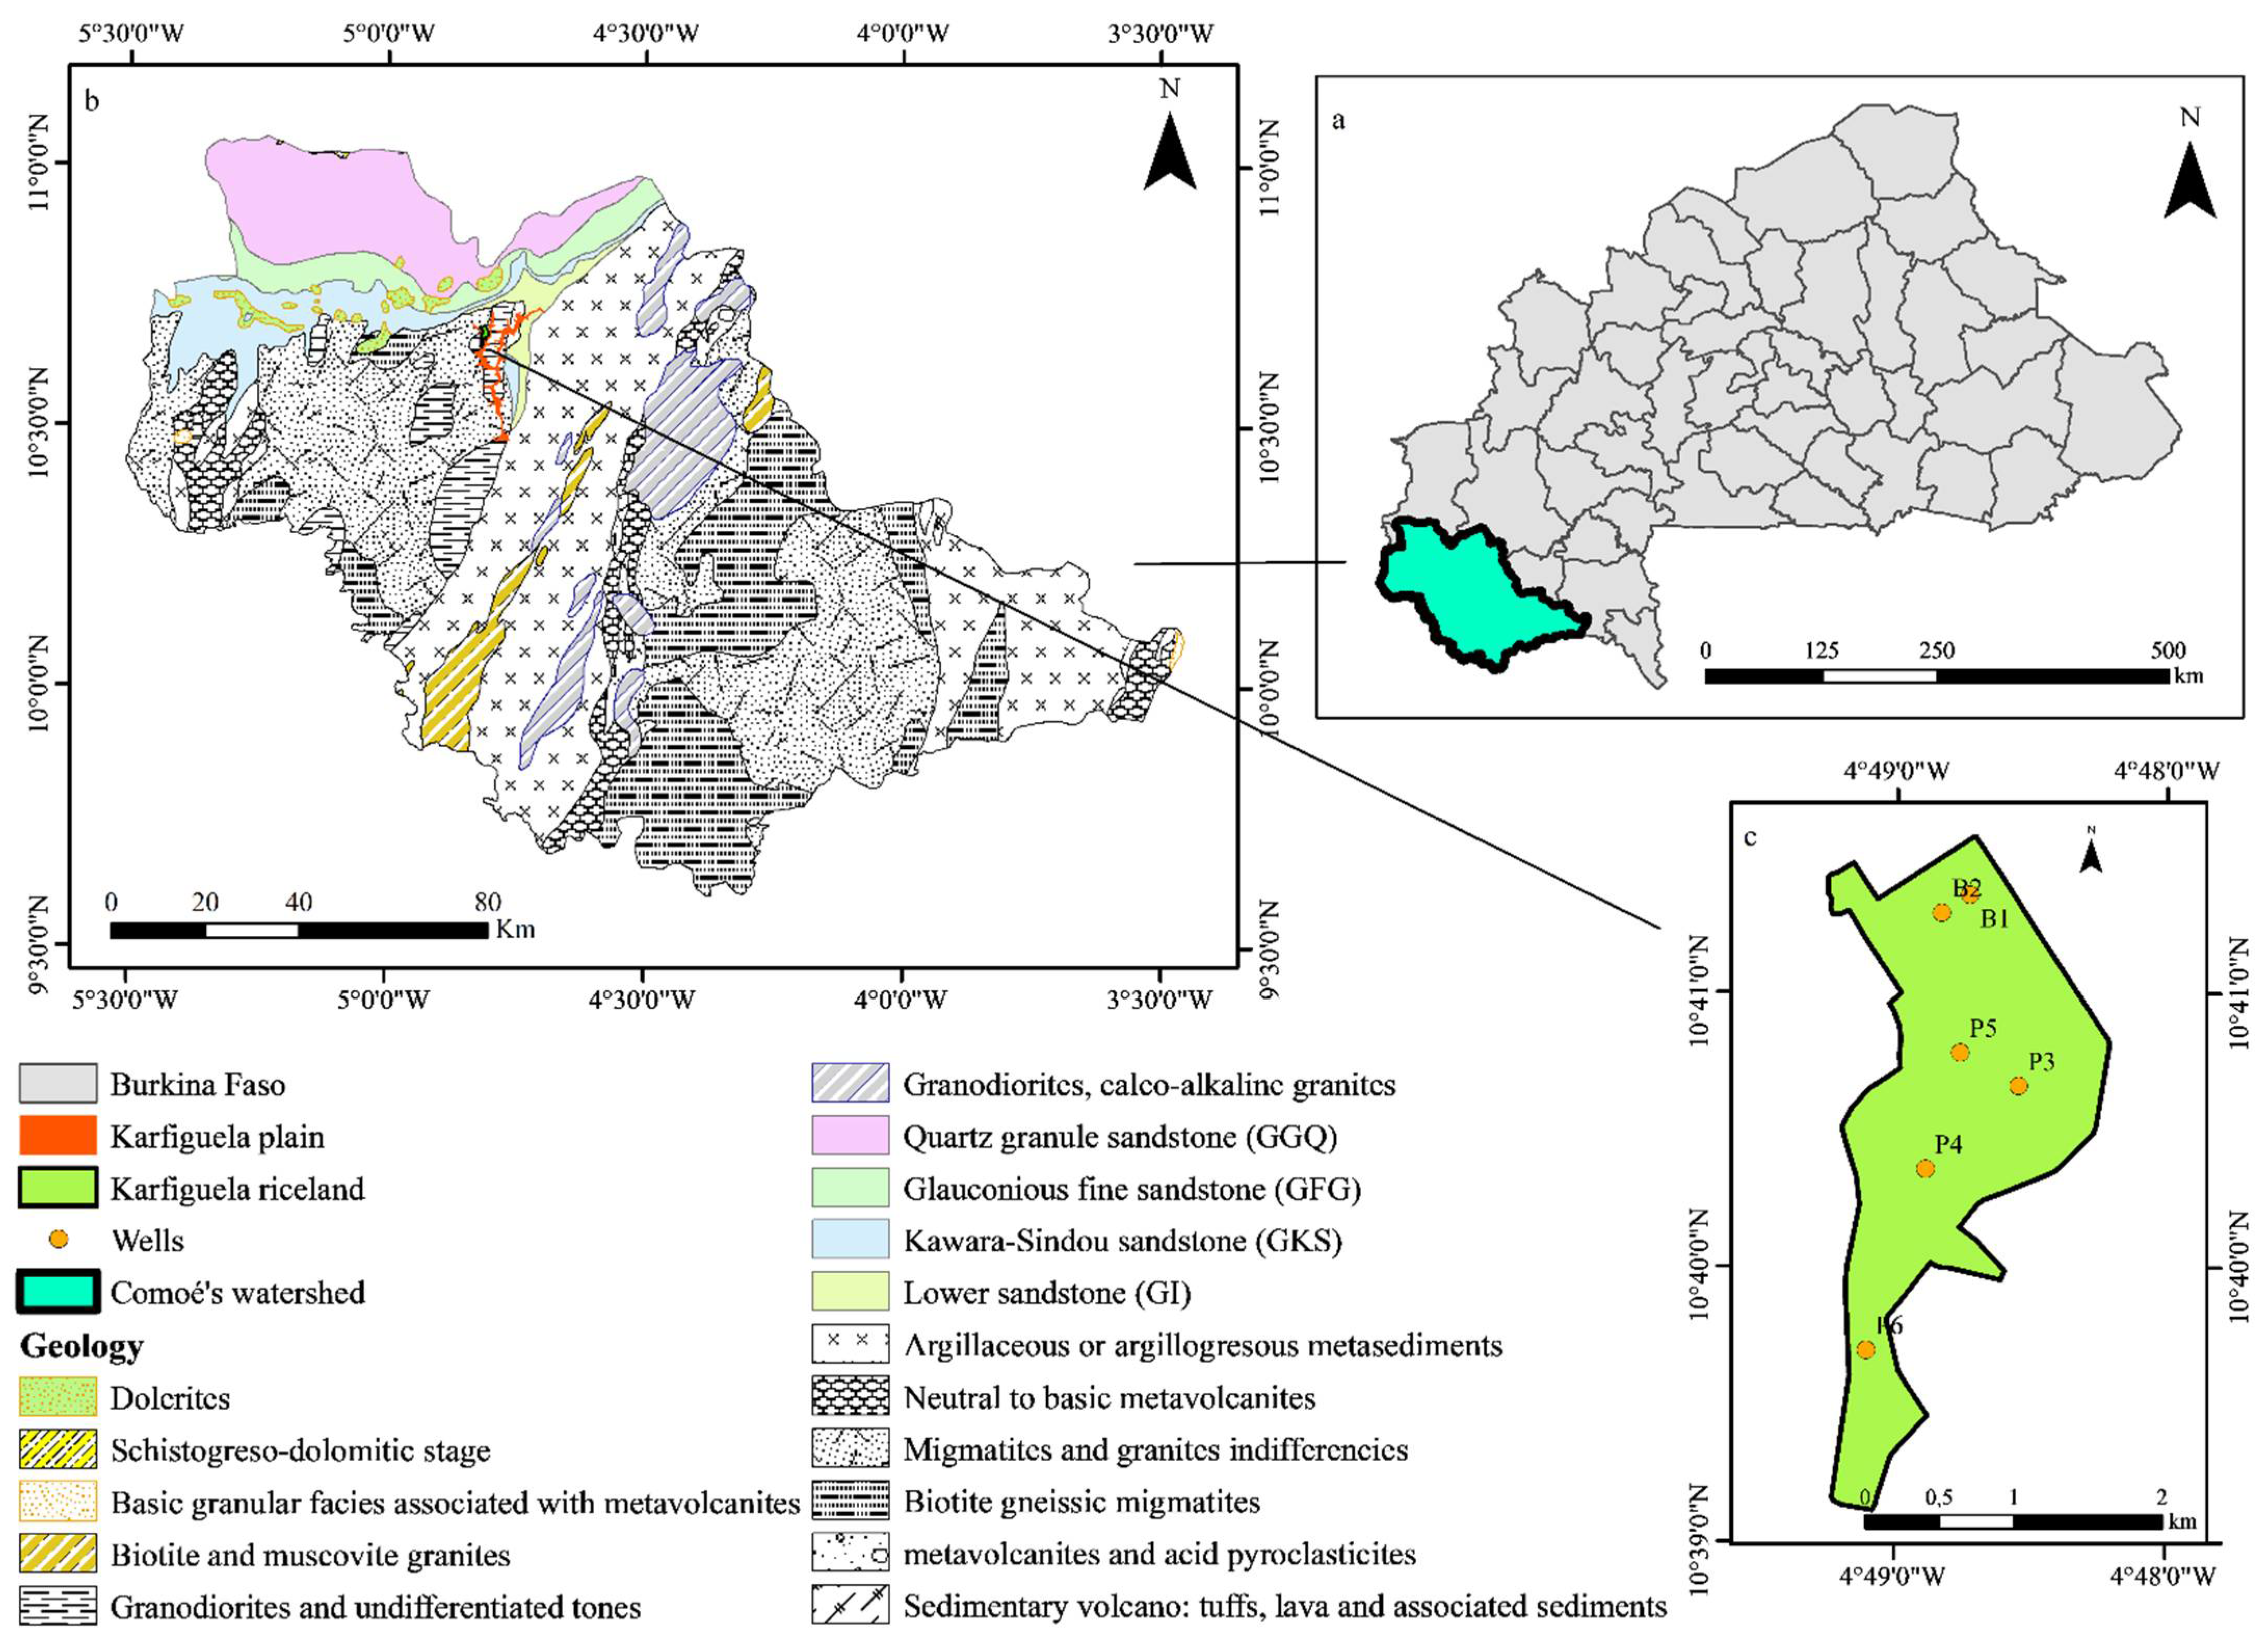
2. Presentation of the Study Area

2.1. Location and Climate

This study was conducted in the Karfiguéla paddy field, located in the southwest of Burkina Faso, in the upper Comoé’s watershed. It extends between the longitudes 4°50′ W and 4°48′ W and the latitudes 10°38′ N and 10°42′ N in the northwestern part of the Karfiguéla alluvial plain. The study area has a southern Sudanese climate with an average annual rainfall of 1040 mm and temperatures between 17 °C and 36 °C, marked by a low annual thermal amplitude [27]. According to data from the weather station closest to the paddy field, the average annual potential evapotranspiration is around 1990 mm. This area is mainly composed of plains and plateaus and has one of the most rugged reliefs of Burkina Faso in which stands in particular Mount Ténakourou, the highest peak in the country, culminating at a height of 747 m [27].
It has a well-developed hydrographic network with many streams, lakes, perennial ponds, waterfalls, and springs [27].

2.2. Hydrological Features

The study area rests on moderately deep soils of the leached tropical ferruginous type with a predominantly sandy or sandy–clayey texture [28]. It straddles basement formations and sedimentary formations of the Upper Precambrian, which is a southeastern extension of the Taoudeni Basin in Burkina Faso (Figure 1) [20,29,30]. From a hydrogeological point of view, we distinguish two types of aquifers. Basement aquifers, made up of crystalline formations with granite dominance with shales, green rocks, and dolerite, which are very variable from the point of view of their nature and the presence of fractures. There are also aquifers with variable flow rates: amphibolite (0.7 m3/h to 94 m3/h), migmatites (1 m3/h to 12 m3/h), volcano-basics (0.5 m3/h to 31 m3/h), schists (0.5 m3/h at 22 m3/h), metavolcanites (2 m3/h to 36 m3/h), and alterations (0.6 m3/h to 12 m3/h). The entity of the sedimentary basin is made up of essentially continuous and unconfined aquifers with some artesian zones as Quartz Granule Sandstone aquifer (QGS) in particular. They present a low risk of salinity and a fairly low dissolved iron content [18,31,32]. The Kawara Sindou Sandstone (KSS) aquifer can be distinguished with flows in the order of 10 m3/h to 20 m3/h at 50 m depth and more than 150 m3/h at great depths; the GGQ aquifer with a flow varying according to the depth, i.e., 10 m3/h to 30 m3/h at shallow depths, 120 m3/h to more than 300 m3/h between 130 m and 200 m and 300 m3/h to 800 m3/h at 200 m; the Basement Sandstone (BS) aquifer with flow rates in the order of 10 m3/h to 40 m3/h at 50 m; and the Fine Glauconitic Sandstone (FGS) aquifer with average flow rates from 10 m3/h to 45 m3/h up to 100 m3/h in the deep horizons [18]. The shallow aquifer subject of this study extends over the entire rice-growing area; it is made up of alluvial, sandy, gravelly, and clayey materials.
It has transmissivity, storage coefficients, and average specific flow values, respectively, in the order of 10−3 m2/s, 10−1, and 17 m3/h. In the wet season, a single artisanal well can sustain the water deficit for 17.21 ha of paddy fields.
The piezometry shows preferential flows from the north to the south part of the perimeter. The soils in the Karfiguéla paddy field are loamy and clayey in the north, sandy in the center, and clayey with a silty tendency to the south. This heterogeneous texture is a consequence of the processes of storage/concentration, percolation, and drainage of the surface water towards the deep horizons. The textural heterogeneity of soils is due to leaching, the lack of crop rotations, and the rice monoculture, which are not very conservative of the mineral elements of the soil.

3. Material and Methods

3.1. Sample Collection and Analysis

In order to determine the physicochemical characteristics of the alluvial aquifer, six water samples were collected in July 2020 in wells and sumps after pumping tests carried out for 6 h. At each structure, two samples were collected in 1.5 L plastic bottles that were washed, rinsed with distilled water, and then rinsed several times with the sampled water. The samples were then immediately taken to two laboratories for analysis: the water–soil–plant laboratory of INERA and the Laboratory of Burkina Mines and Geology Office (BUMIGEB). The pH, TDS, and electrical conductivity are measured in situ using AQUAREAD AP-2000 material. Chemical parameters, such as major ions (Na+, Ca2+, Mg2+, K+, NH4+, NO3, NO2, SO42−, CO32−, Cl, and HCO3), minor ions, and metallic trace elements (Fe, Zn, Cu, Mn, Pb, Al, Cr, Ni, and Cd) were analyzed by EDTA titration, atomic absorption, photometry, and spectrometry.
Before processing and interpreting the results of the various analyses, it was necessary to ensure the reliability of the results. The charge balance error percentage based on the principle that natural water is electrically neutral was calculated.
C B =   A n i o n s   C a t i o n s   A n i o n s +   C a t i o n s × 100
In Equation (1), all cations and anions are expressed in meq/L. It is generally accepted that a test is considered qualified if the charge balance error percentage (%CB) < 5%. In the present study, the %CBs of all the samples were less than 5%.

3.2. Hydrogeochemical Interpretation

Piper [33] and Stiff [34] diagrams were used for the determination of water type and hydrogeochemical processes. Processes that control groundwater chemistry are typically evaporation, geochemical weathering, cation exchange, and anthropogenic activities [35,36]. These processes are very complex and generally require analytical and geochemical techniques to be elucidated [37,38]. Thus, the Gibbs diagram [39] was used in this study to understand and differentiate the influences of evaporation, interactions with aquifer minerals, and precipitation.
The most commonly used approach for understanding the interactions between rock and water is the determination of geological minerals’ saturation indices [36]. Saturation indices permit evaluating minerals present in the water dissolution and precipitation phenomena [38]. Saturation state is usually defined by values between −1 and 1, while oversaturation and undersaturation are, respectively, determined by values greater than 1 and less than −1 [38,40]. For this study, the saturation indices of minerals such as dolomite, calcite, anhydrite, gypsum, halite, and aragonite were calculated using the geochemical module PHREEQC. Dissolution processes are governed by the following relationships (Table 1).
Cation exchanges are also a natural phenomenon that greatly influences the mechanism of groundwater chemistry evolution. Clay minerals capable of fixing or releasing ions are generally implicated in these exchanges. The chloroalkaline indices (CAI-1 and CAI-2) proposed by Schoeller (1965) are generally used for cation exchange process determination [36,41]
CAI-1 = Cl ( Na + + K + ) Cl
CAI-2 = Cl ( Na + + K + ) HCO 3 + SO 4 2 + CO 3 2 + NO 3
When CAI-1 and CAI-2 values are negative, it means that there is an exchange of Ca2+ and Mg2+ ions with Na+ and K+ ions in the groundwater following reaction R1 [41]. This phenomenon generally occurs when water is diluted with softer water [42].
Ca 2 + + 2 NaX   2 Na + + CaX 2
In the case of a reverse reaction, the values of chloroalkaline indices are positive. This reaction occurs during a supply of saline minerals following the R2 reaction [36,41].
2 Na + + CaX 2 Ca 2 + + 2 NaX
In the context of agricultural activities, the organic pollution index OPI [43] was used to determine the influence of anthropogenic activities on groundwater chemistry.
The relationship between the physicochemical parameters as well as their sources were determined through a combination of correlation coefficient analysis, factor analyses, and bivariate plots. The spatial distribution of the physicochemical parameters was modeled using the inverse distance interpolation method (IDW) of ArcGis geospatial tools.

3.3. Water Quality for Irrigation

Water quality for irrigation is of paramount importance in the quality, health, and productivity of soils and crops [44,45]. Generally, when these parameters are not evaluated, the condition of irrigated soils can gradually deteriorate until complete sterilization [21,46].
The most recurrent problems of irrigated systems are related to salinity, toxicity, impact on infiltration capacity, and soil fertility [22,45]. In this study, to assess groundwater quality for irrigation, parameters such as electrical conductivity (EC), sodium adsorption ratio (SAR), sodium percentage (%Na), potential salinity (PS), Kelly ratio (KR), residual sodium carbonate (RSC), magnesium hazard (MH), permeability index (PI), and irrigation coefficient (Ka) were assessed [21,22,23,24,25,26]. These parameters are obtained using the following formulas for concentrations in meq/L:
MH = Mg 2 + Ca 2 + + Mg 2 + × 100  
% Na = 100 Na + K Ca + Mg + Na + K
SAR = Na + Ca 2 + + Mg 2 + 2
PI = ( Na + + HCO 3 ) Ca 2 + + Mg 2 + + Na + + K + × 100
Ka = { 288 5 Cl   s i   Na + < Cl 288 Na + + 4 Cl   s i   Cl < Na + < Cl + 2 SO 4 2 288 10 Na + 5 Cl 9 SO 4 2   s i   Na + > Cl + 2 SO 4 2

4. Results

4.1. Groundwater Hydrogeochemistry

4.1.1. Physicochemical Parameters and Their Spatial Variability

With an average of 6.42 ± 0.29, the pH values indicate that the groundwater is slightly acidic. EC and TDS are weakly correlated (r = 0.58) with low concentrations, i.e., respectively between 33.7 µS/cm and 80.0 μS/cm and 91 mg/L and 134 mg/L.
This situation effectively results in low concentrations of the chemical parameters as illustrated in Table 2 and Figure 2. Mg2+ is the most abundant of the major cations with an average concentration of 10.83 ± 2.20 mg/L, followed by Ca2+ (5.75 ± 1.56 mg/L), Na+ (2.90 ± 1.44 mg/L), and K+ (1.08 ± 0.67 mg/L).
The order of the major anions is HCO3 > SO42− > NO3 > PO43− > Cl with, respectively, mean concentration values of 42.7 ± 15.78 mg/L, 26.34 ± 17.66 mg/L, 9.01 ± 9.51 mg/L, 3.68 ± 3.94 mg/L, and 3.45 ± 2.95 mg/L.
The percentages of the coefficients of variation remain very high and the large spatial variability (Figure 2) of the physicochemical parameters shows a large hydrochemistry heterogeneity. Indeed, while Ca2+, Zn2+, Cl, K+, HCO3, EC, pH, and PO43− generally decrease from the upstream of the perimeter to downstream (north–east to southwest), the other chemical parameters such as Mg2+, Na+, NH4+, Fe2+, NO3, NO2, and SO42− evolve in the opposite direction.
Although the concentrations of the parameters are very variable, they respect almost all the standards established by the FAO concerning irrigation water quality, except 50% of the samples that do not comply with the guideline values for nitrate concentrations. Indeed, the ion concentrations NO3 in will P4, P5, and P6 are 2 to 4.6 times higher than the lower limit of the standard; nevertheless, they remain within the limit of tolerable quantity [47].

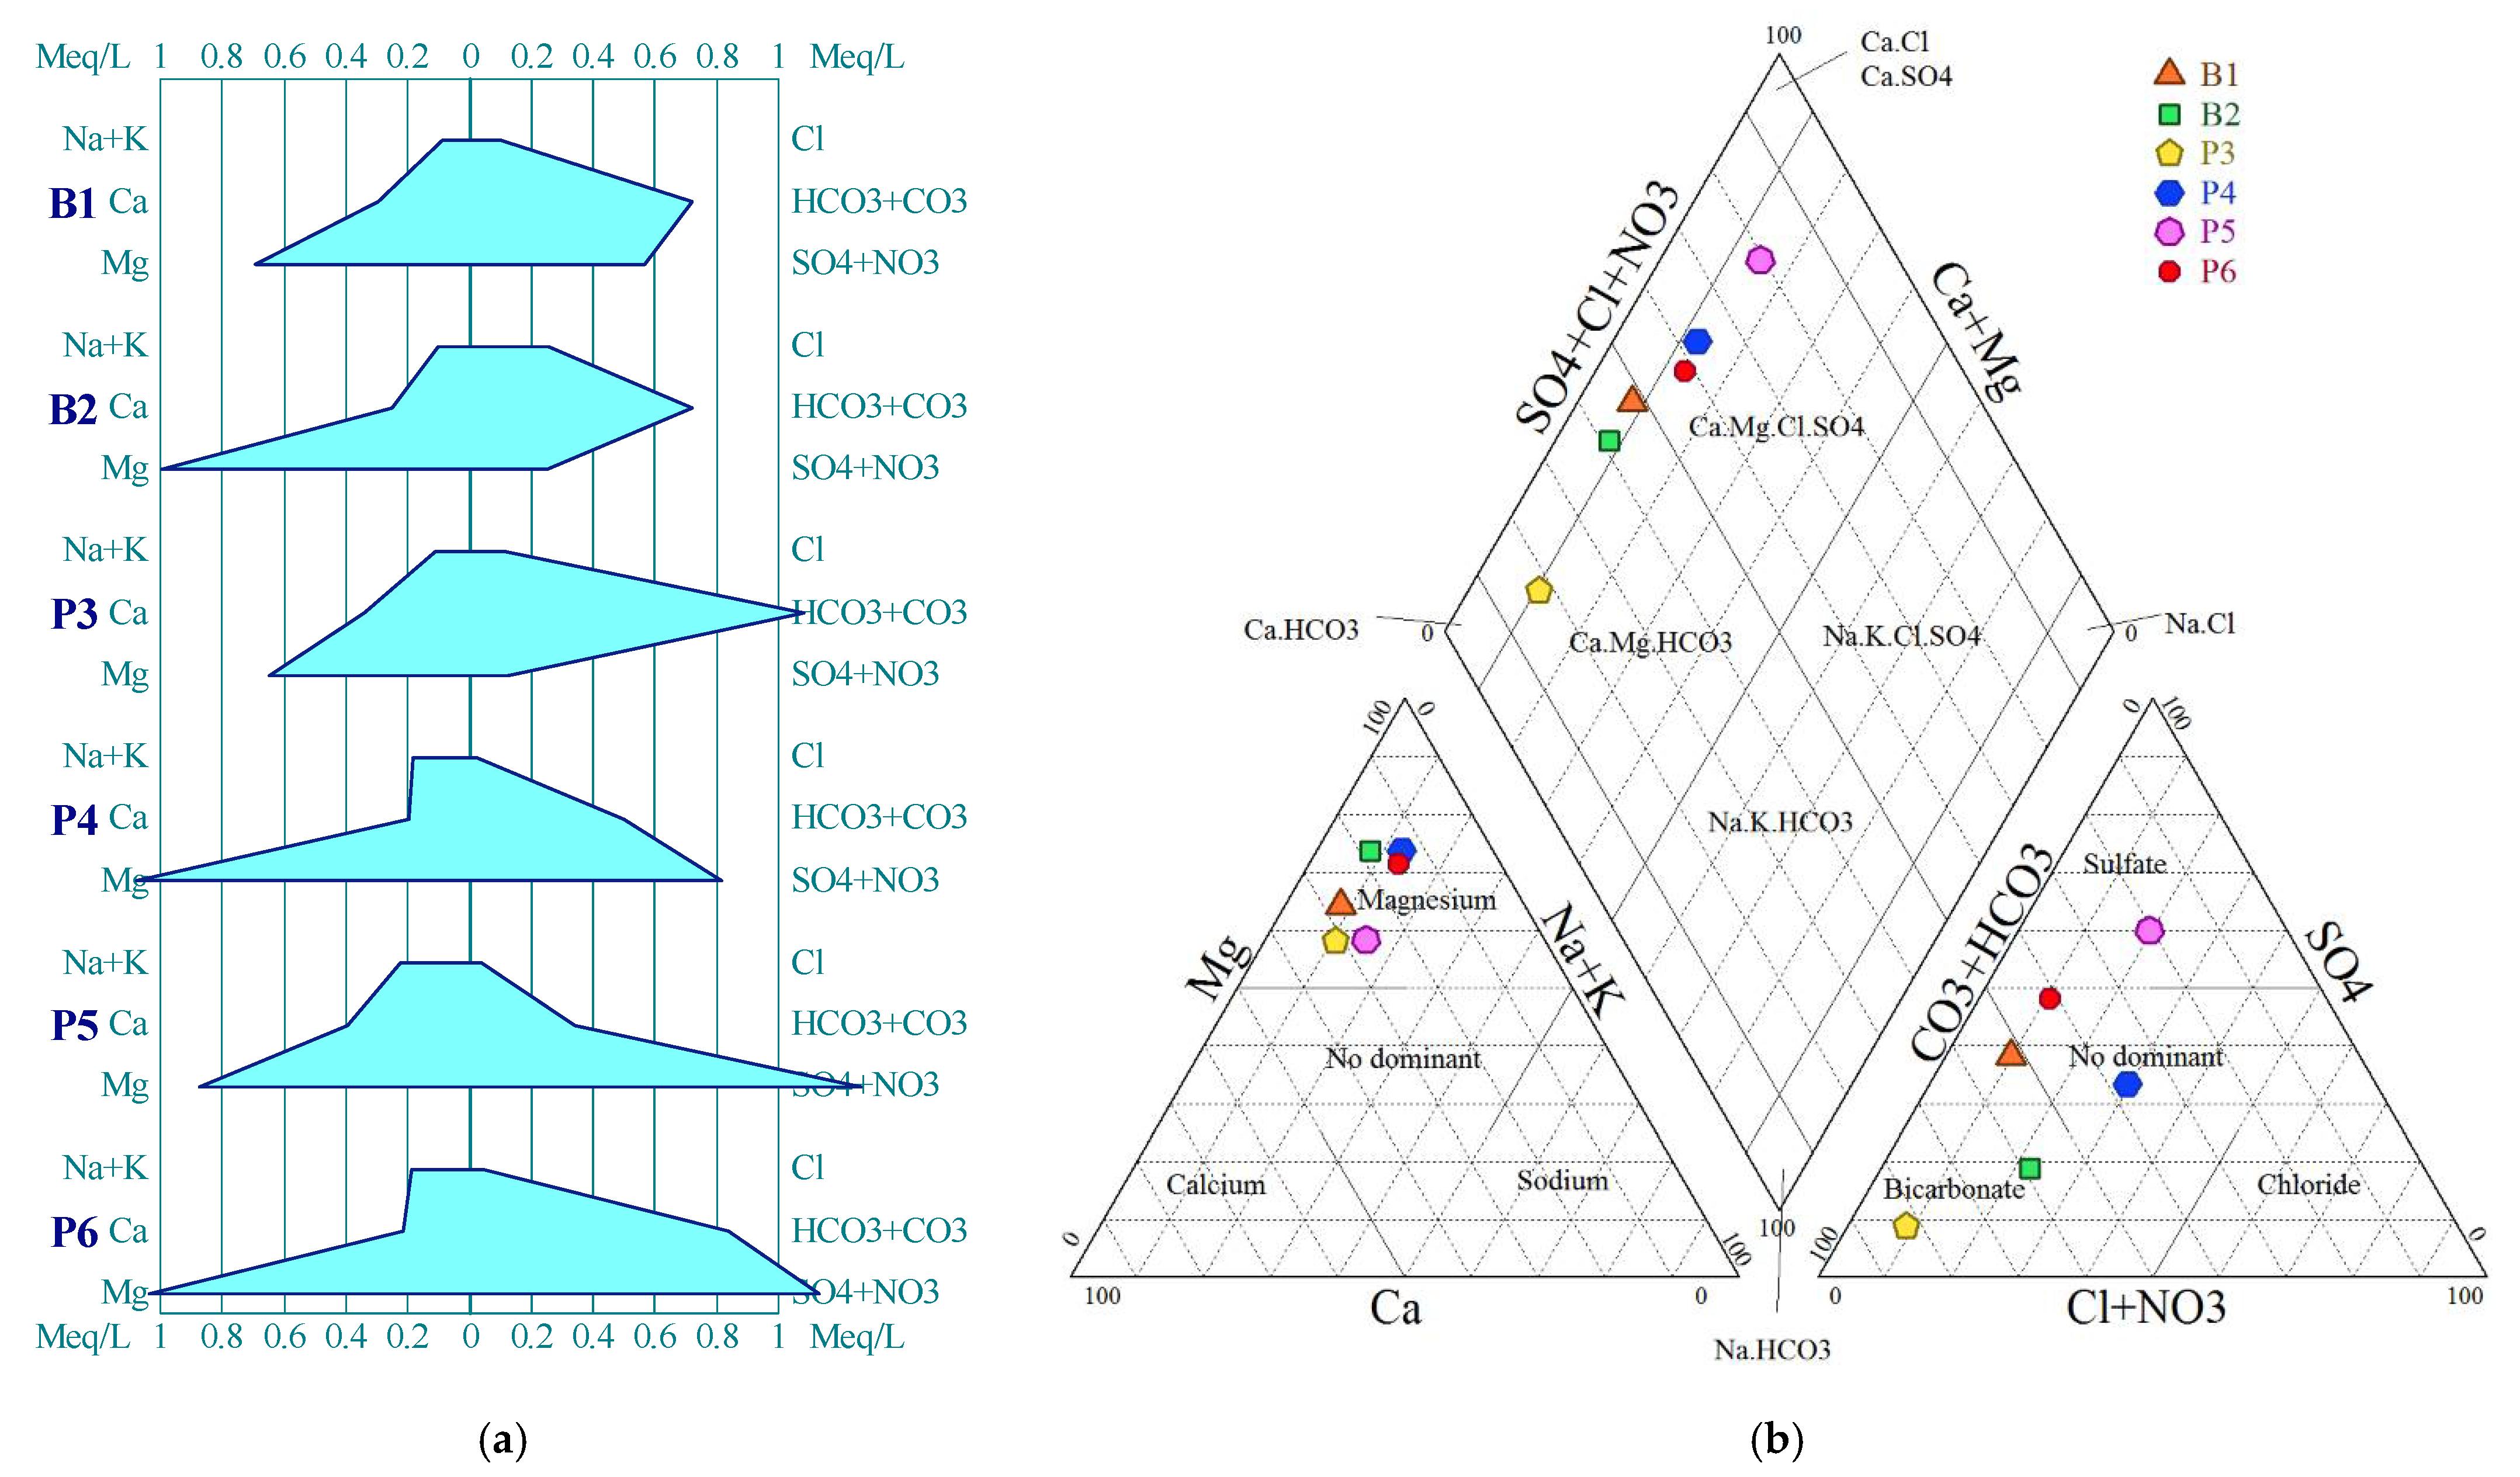
4.1.2. Hydrochemical Facies

Classification and interpretation of hydrochemical analyses are very complex and are generally carried out by graphical methods [34]. Several graphical and analytical methods are used in hydrochemistry depending on the study objectives [34]. Thus, Tiff (Figure 3a) and Piper (Figure 3b) diagrams were used in this study for the groundwater evolution mechanisms understanding. Two types of water were identified, 50% of calcium and magnesium bicarbonate type (Ca-Mg-HCO3) and the rest of calcium and magnesium chloride and sulfate type (Ca-Mg-Cl-SO4).

4.2. Processes Controlling the Chemistry of the Shallow Aquifer

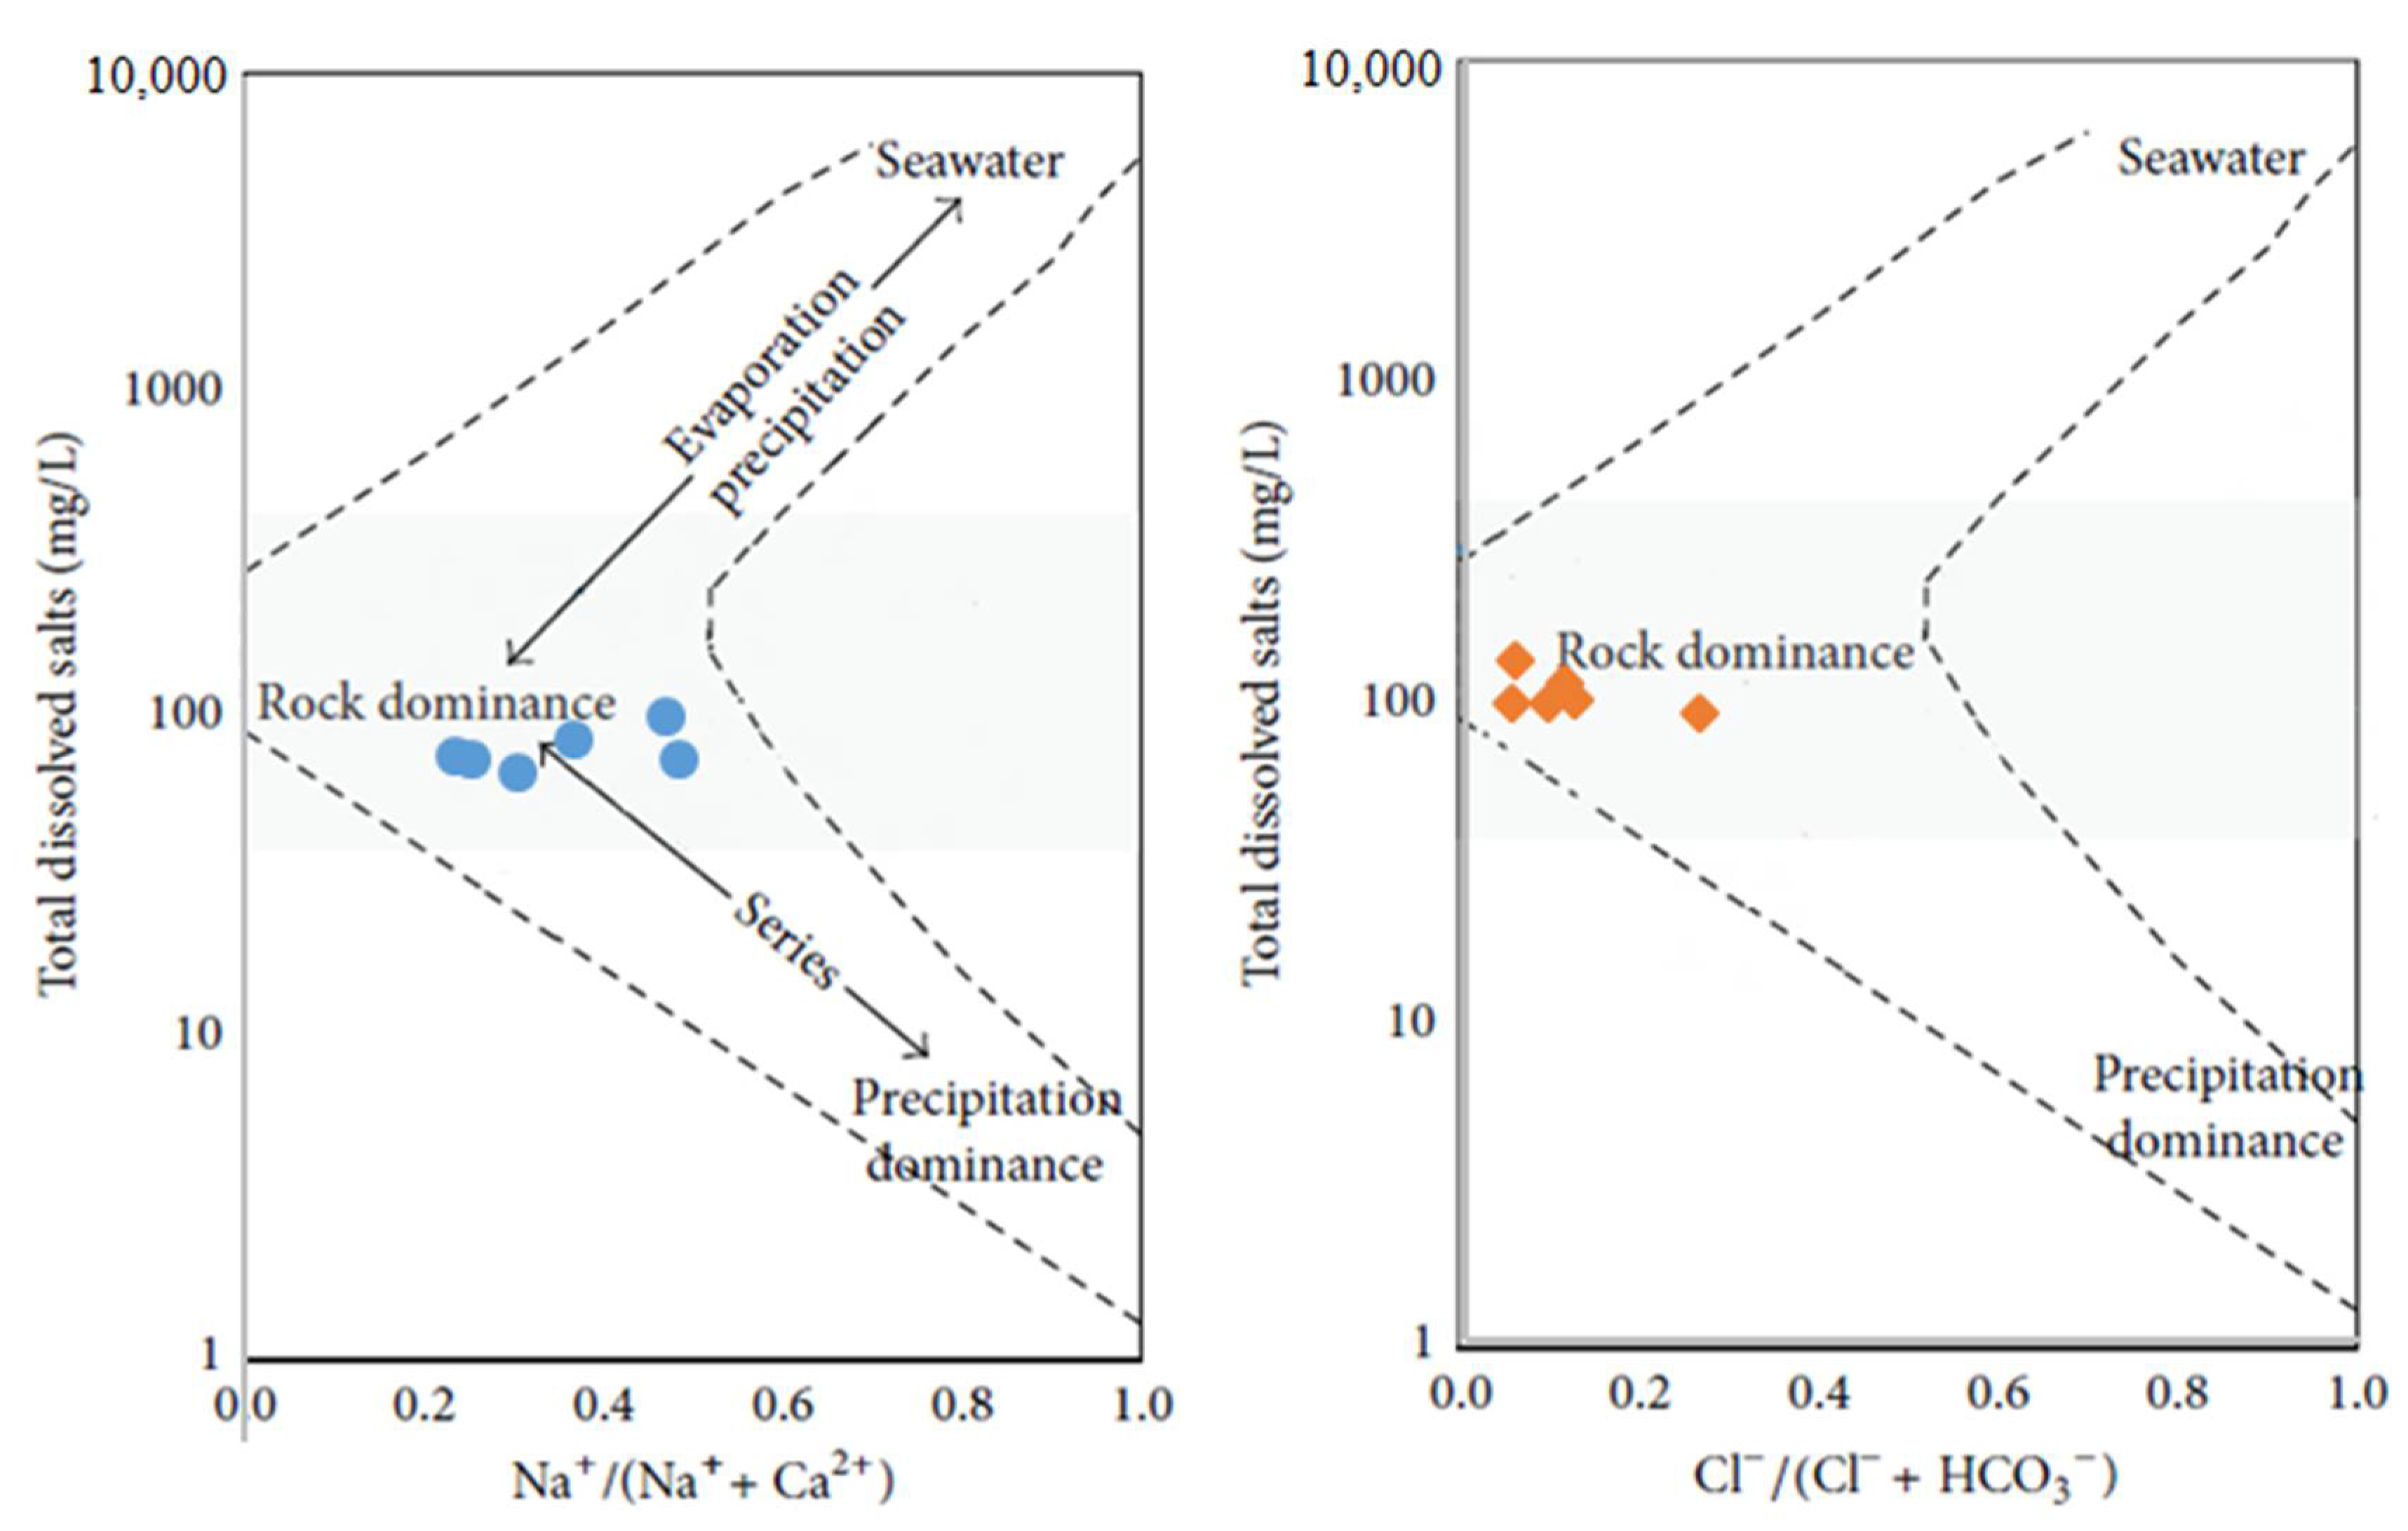
4.2.1. Gibbs Diagram and Multi-Criteria Analysis

Gibbs diagram (Figure 4) illustrates that the chemistry of the analyzed waters is mainly governed by water–rock interactions [39]. In theory, this phenomenon suggests that the mineral components of the rock and the chemical reactions and exchanges in the matrix mainly control the chemistry of the shallow groundwater. In the present study, the sandy, clayey, and alluvial nature of the aquifer cannot greatly contribute to the mineralization of the waters it stores. Other processes would influence groundwater mineralization and could be linked to anthropogenic activities, geochemical alteration, or cation exchanges.
These different processes were studied in order to determine the source of ions in groundwater. PCA results (Table 3) as well as the Pearson correlation matrix (Figure 5) were used for a better interpretation of these processes. Three principal components with variances, respectively, expressed at 60%, 15%, and 9%, explaining 84% of the total variance extracted (Figure 5). Thus, each main axis represents a process or a group of processes that explain the chemistry of the groundwater with a percentage of involvement represented by its explanatory variable.

4.2.2. Anthropogenic Activities

Gibbs diagram is a very important tool in the study of the mechanisms governing groundwater chemistry, but it is incapable of analyzing the impact of anthropogenic activities on hydrochemistry [41]. The PCA results show that 84% of the variables are correlated (r ≥ 0.5) to the first component. Positive correlations are defined by Na+, Cd2+, Fe2+, Pb2+, SO42−, and NH4+ with values greater than 0.9, NO2, NO3, and TDS with values greater than 0.7 and Mg2+ with a value of 0.504. Moreover, the strong correlation between all these variables is an indicator of their common sources [13]. Generally, very high concentrations of NO3, SO42+, Cd2+, and Pb2+ can be recognized as a sign of anthropogenic contamination due to agricultural fertilizers and pesticides using [13,48]. Overall, a high index of organic pollution (OPI) values in almost the sumps also shows the strong contribution of organic pollution in the water chemistry (Table 4). The strong correlations between Cl and K+ (r = 0.8) and PO43+ (r = 0.55) can also be explained by the use of KCl-type fertilizers for agriculture [49]. Thus, anthropogenic activities represent the main source of groundwater mineralization with an explanation percentage of 60.05%. This is all the more obvious for an alluvial aquifer that unfolds under an agricultural perimeter whose main human activity is agriculture. On the other hand, the strong correlations between TDS and Na+ (r = 0.69), NH4+ (r = 0.9), Fe2+ (r = 0.74), NO2 (r = 0.92), SO42− (r = 0.85), Cd2+ (r = 0.83), and Pb2+ (r = 0.53) show that these ions contribute significantly to the saline load of groundwater [40].

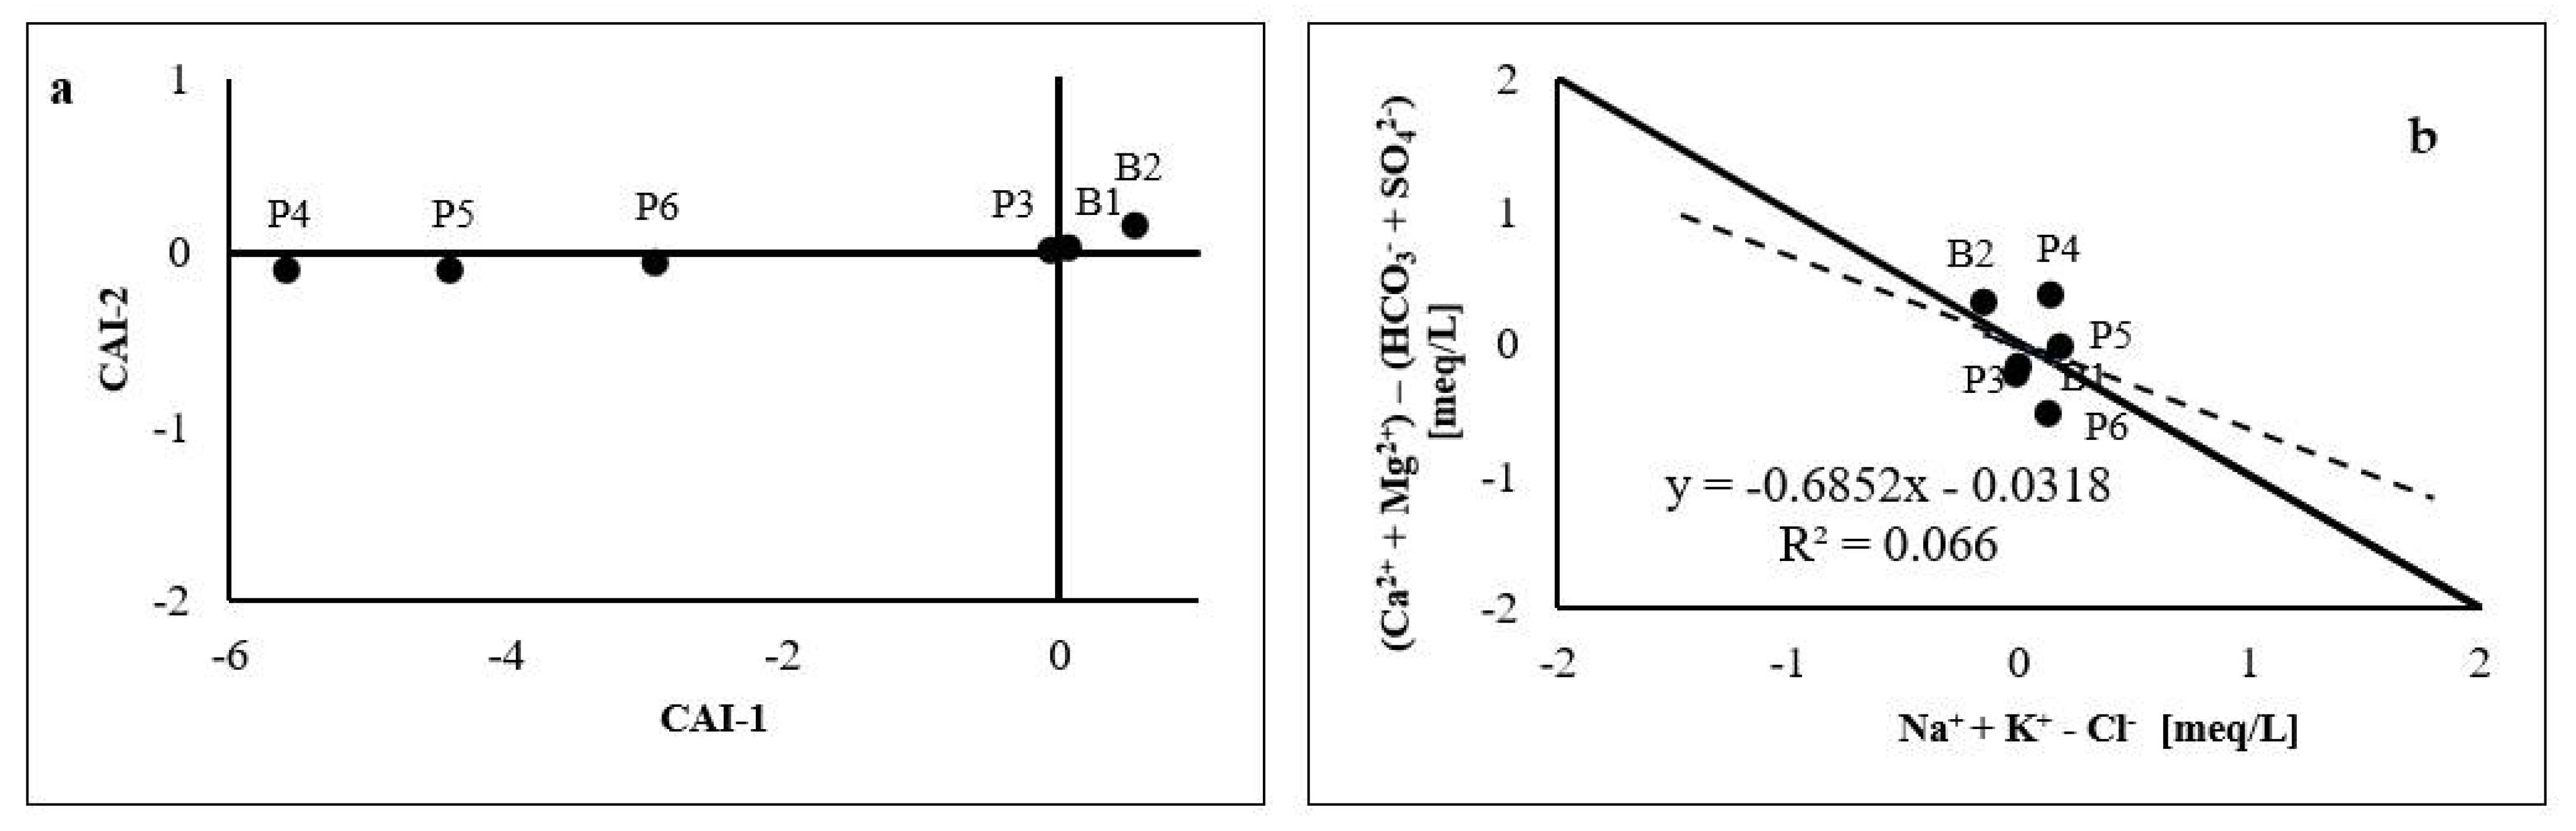
4.2.3. Cation Exchanges

Figure 6a shows that 67% of the wells are grouped together in the lower left quadrant, indicating that these waters have undergone an ion exchange following the R1 reaction, while 33% are in the upper right quadrant, but close to the origin of the graph, indicating a reverse reaction following reaction R2.
The binary diagram (Ca2+ + Mg2+) − (HCO32− + SO42−) = f (Na+ + K+ − Cl) is also widely used to highlight the base exchanges that characterize groundwater [36,40]. It permits focusing only on the exchanges between solution and clay minerals, while excluding dissolution/precipitation reactions linked to carbonate and evaporites minerals [36,40]. If cation exchange is the only process governing water chemistry, the points should end up on the line with slope −1 [36,38]. As shown in Figure 6b, the points are close to the line with a trend represented by the equation: y = −0.6852x − 0.0318, hence a slope of −0.6852. However, the difference between the trend and theoretical curve and the coefficient of determination much lower than 1 indicates that the cation exchanges do not influence so much the chemistry of the aquifer [41]. In addition, the very weak correlation (r = 0.075) between Ca2+ and Na+ show that they do not come from the same source.

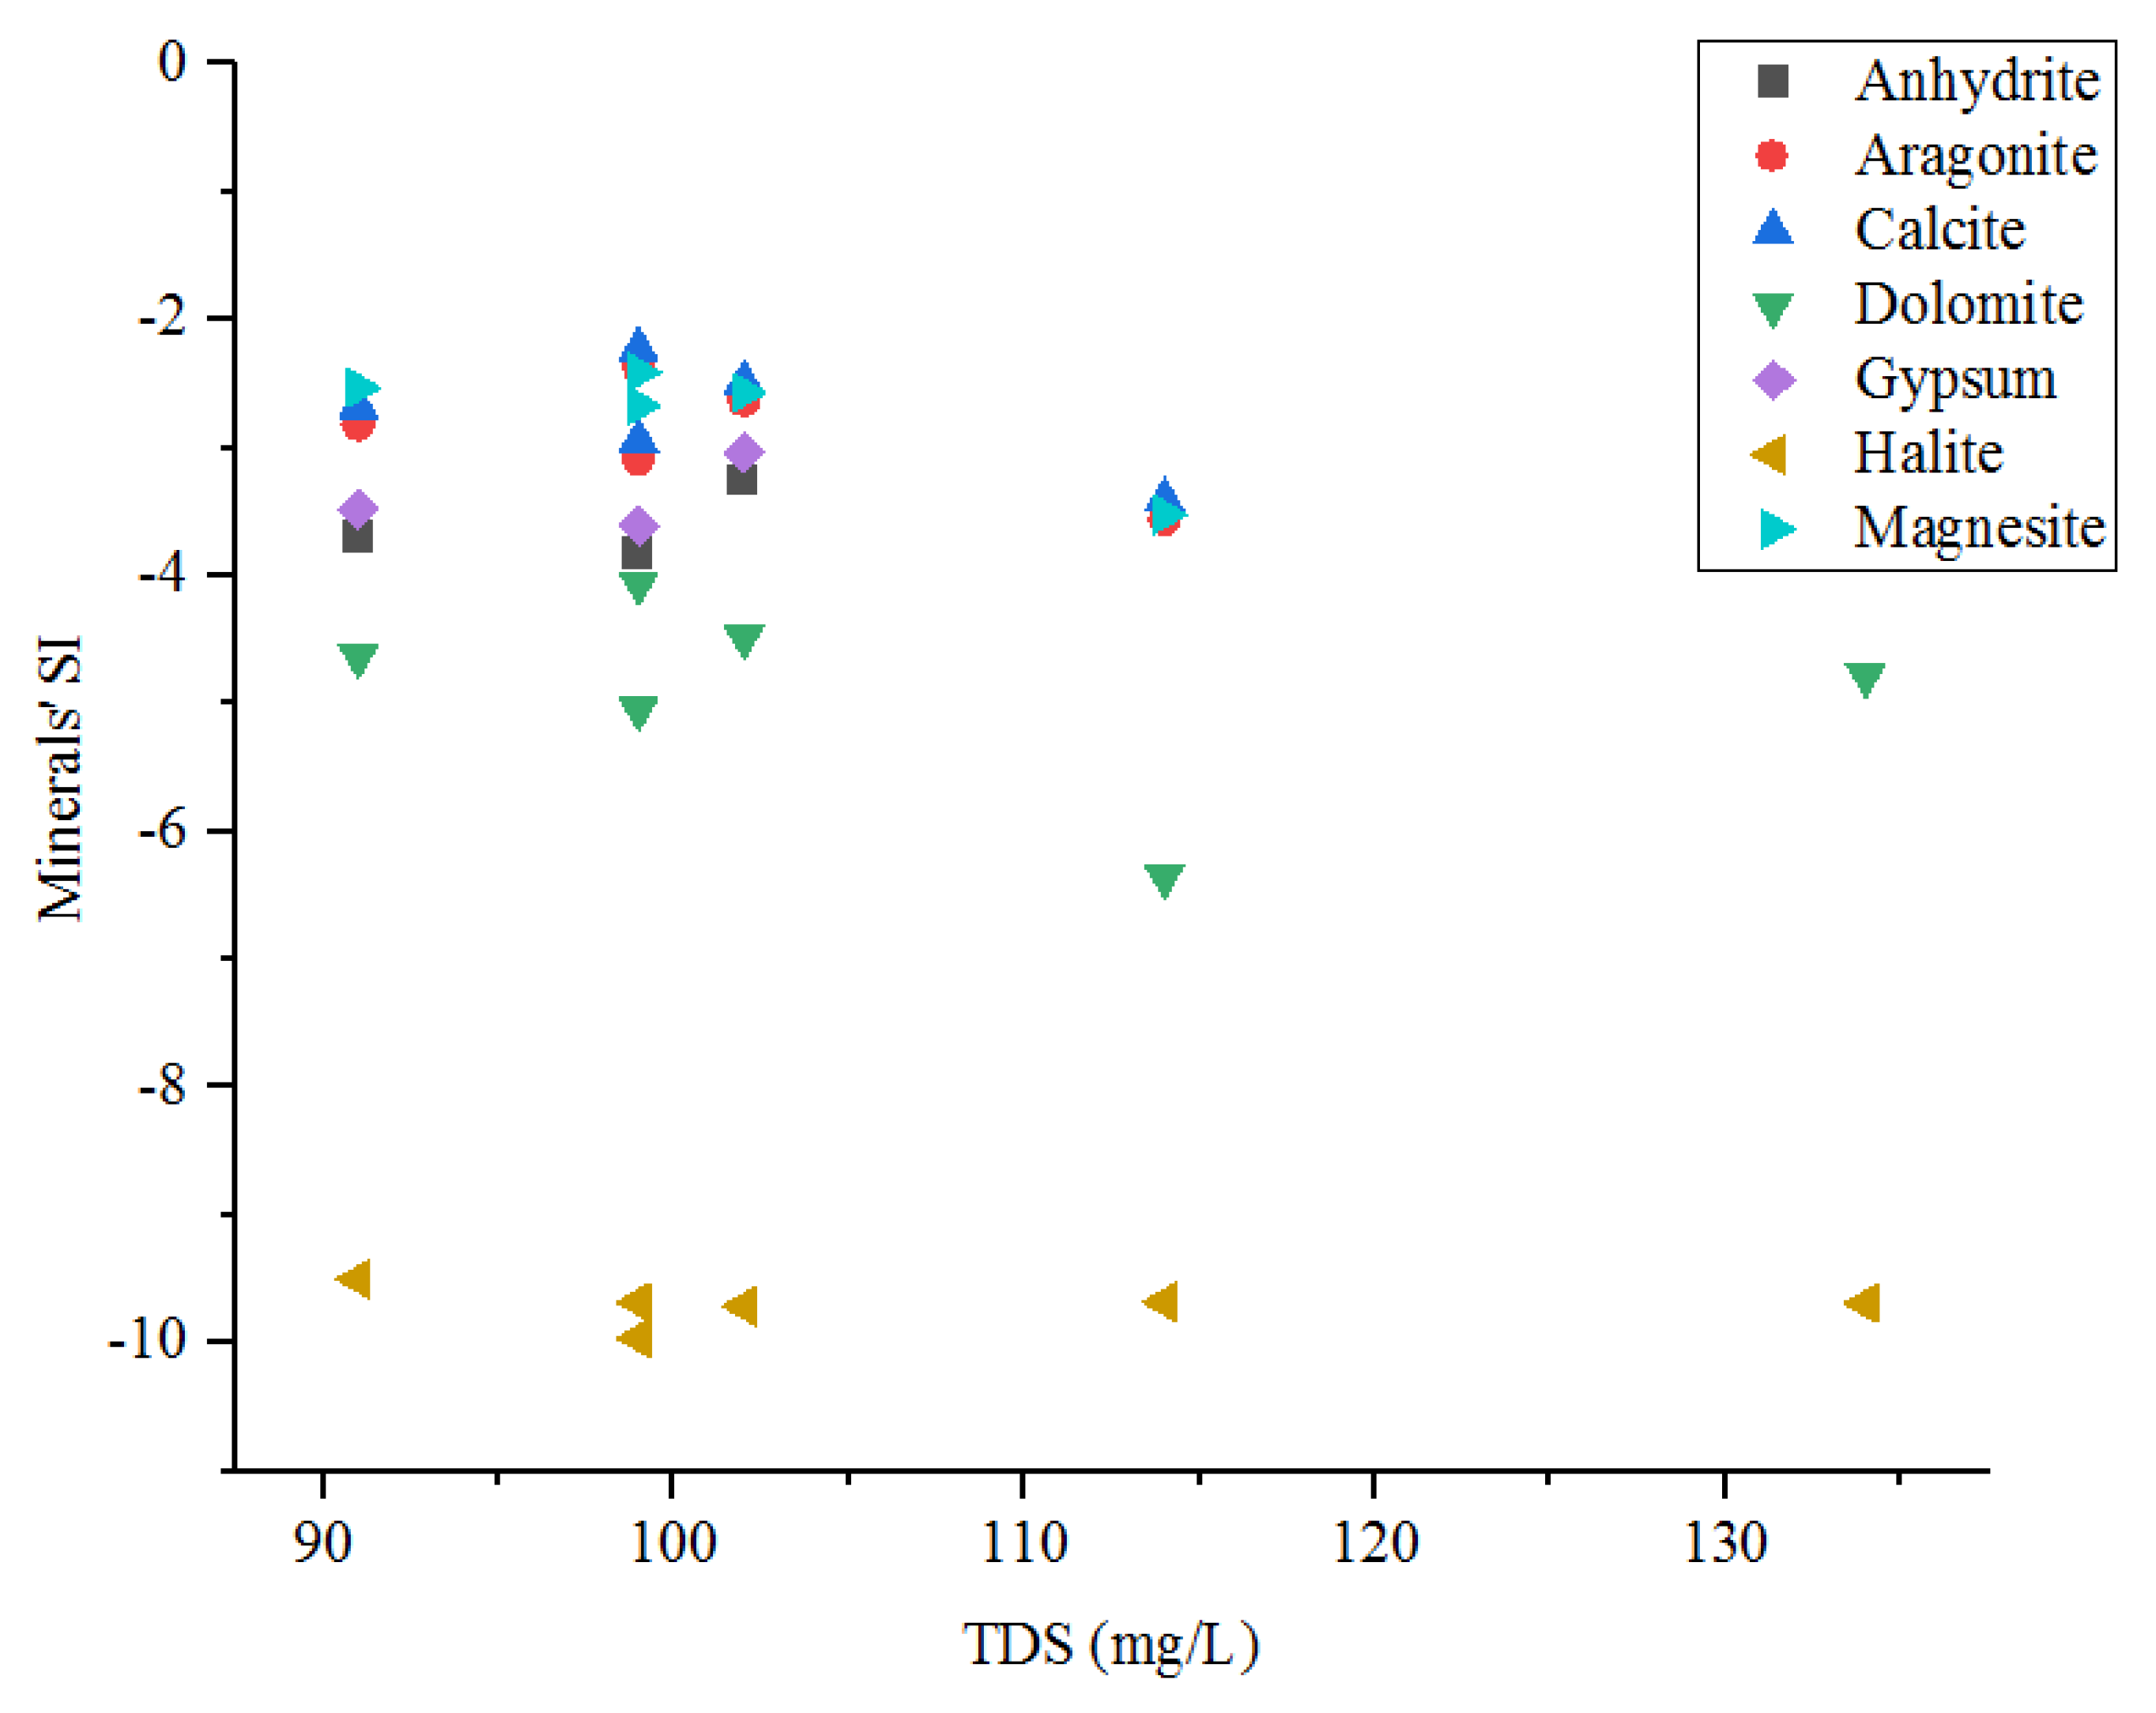
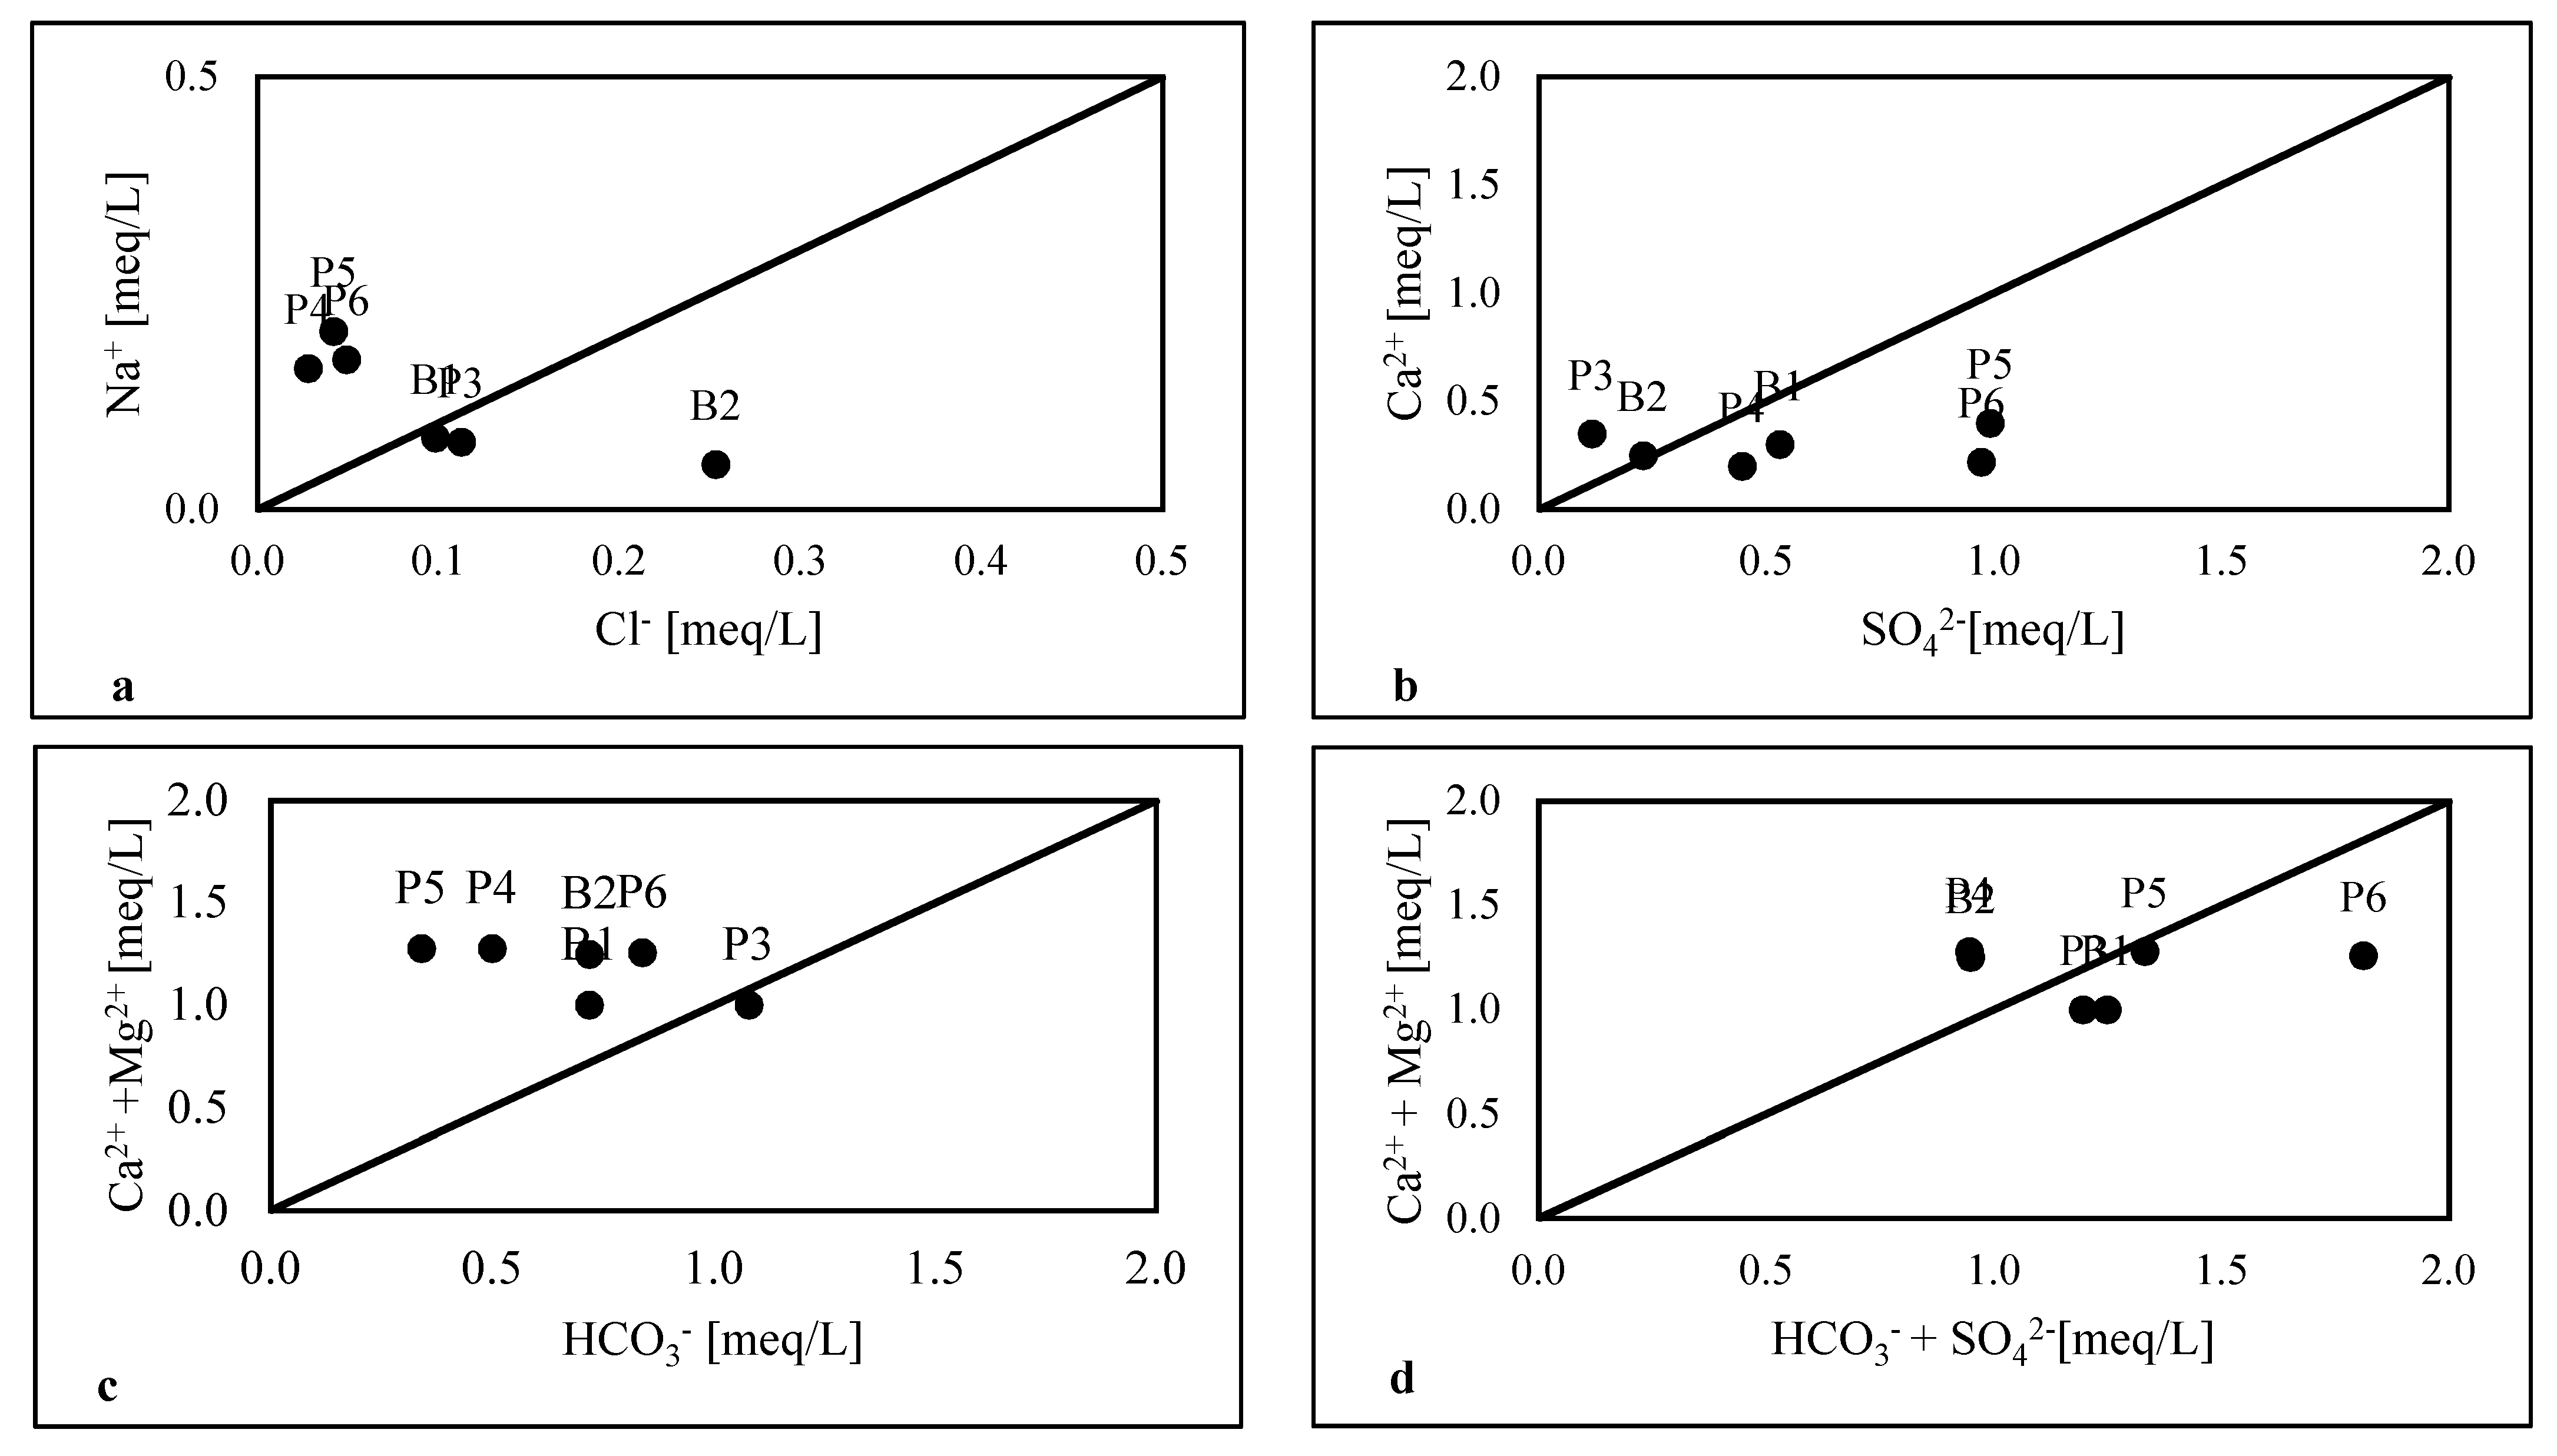
4.2.4. Water–Rock Interactions

Saturation index values (Figure 7) are negative (˂−1) for the selected minerals (Table 5) show that the waters are undersaturated. These results are consistent with the results obtained by Kouanda (2019) [30] concerning the sedimentary aquifer of the Taoudeni Basin in Burkina Faso.
For a better understanding of the dominant water–rock interactions and ions sources, in addition to the saturation indices, geochemical interpretation was also carried out through bivariate diagrams and correlation analyses. The Figure 8a shows that only samples B1 and P3 are close to the 1:1 line, indicating that halite dissolution is not the source of Na+ and Cl. The negative correlation (r = −0.83) between these two ions (Figure 5) supports this interpretation. Similarly, anhydrite and gypsum are generally sources of Ca2+ and SO42−, but the correlation (Figure 5) is very low (0.11) between Ca2+ and SO42− and the position of samples on the graph Ca2+ = f [SO42−] (Figure 8b) suggests that these dissolution processes are not the main source of these ions in the water. The binary dissolution diagram, Ca2+ + Mg2+ = f [HCO3 + SO42−], generally permits highlighting bicarbonate and sulfate minerals’ dissolution. Figure 8d shows that the points are only slightly close to the 1:1 line, also called the theoretical line of clay minerals’ dissolution. This implies that dissolution phenomena and other anthropogenic phenomena participate in the mineralization of groundwater.
Indeed, the PC2 explaining 15.10% of the groundwater chemistry has a strong positive correlation with Mg2+ (r = 0.777) and negative with Ca2+ (r = −0.836) and EC (r = −0.817). This axis represents the water–rock interaction process, which is also a source of Mg2+ and Ca2+ in groundwater. However, the strong negative correlation between Mg2+ and Ca2+ (r = −0.70) shows that they do not have the same source. The ions Ca2+ could therefore come from calcite (CaCO3) dissolution, while Mg2+ comes from the magnesite (MgCO3) dissolution process.

4.2.5. CO2 Dissolution Process

PC3 explains 9.05% of groundwater chemistry and is strongly correlated with pH, TDS, and HCO3. This axis certainly represents CO2 dissolution process in water depending on the pH. The decomposition of organic matter is an oxidation reaction of the matter by soil micro-organisms, which is producing CO2, water, and energy. Thus, in the presence of water, CO2 dissolves in water and leads to the following reaction chain [31]:
CO 2 ( gazeous )   CO 2   ( liquid )
CO 2   ( liquide ) + H 2 O     H 2 CO 3
H 2 CO 3     H + + HCO 3
Thus, Figure 9 summarizes the different processes responsible for the water chemistry of the Karfiguéla shallow groundwater and their contribution.

4.3. Shallow Groundwater Suitability for Irrigation

Irrigation water quality is a very important parameter that influences the physicochemical and biological quality of agricultural soils. The assessment of the Karfiguéla groundwater suitability for agricultural use was carried out using several indices and ratios, which are electrical conductivity (EC), sodium adsorption ratio (SAR), sodium percentage (%Na), chloride and nitrate hazard (NO3N), potential salinity (PS), Kelly ratio (KR), residual sodium carbonate (RSC), magnesium hazard (MH), permeability index (PI), and irrigation coefficient (Ka). The results of the statistical analysis of these parameters are reported in Table 6.
The analysis of shallow groundwater suitability for irrigation is the basis on the classification purposed by many authors [24,25,37,45].

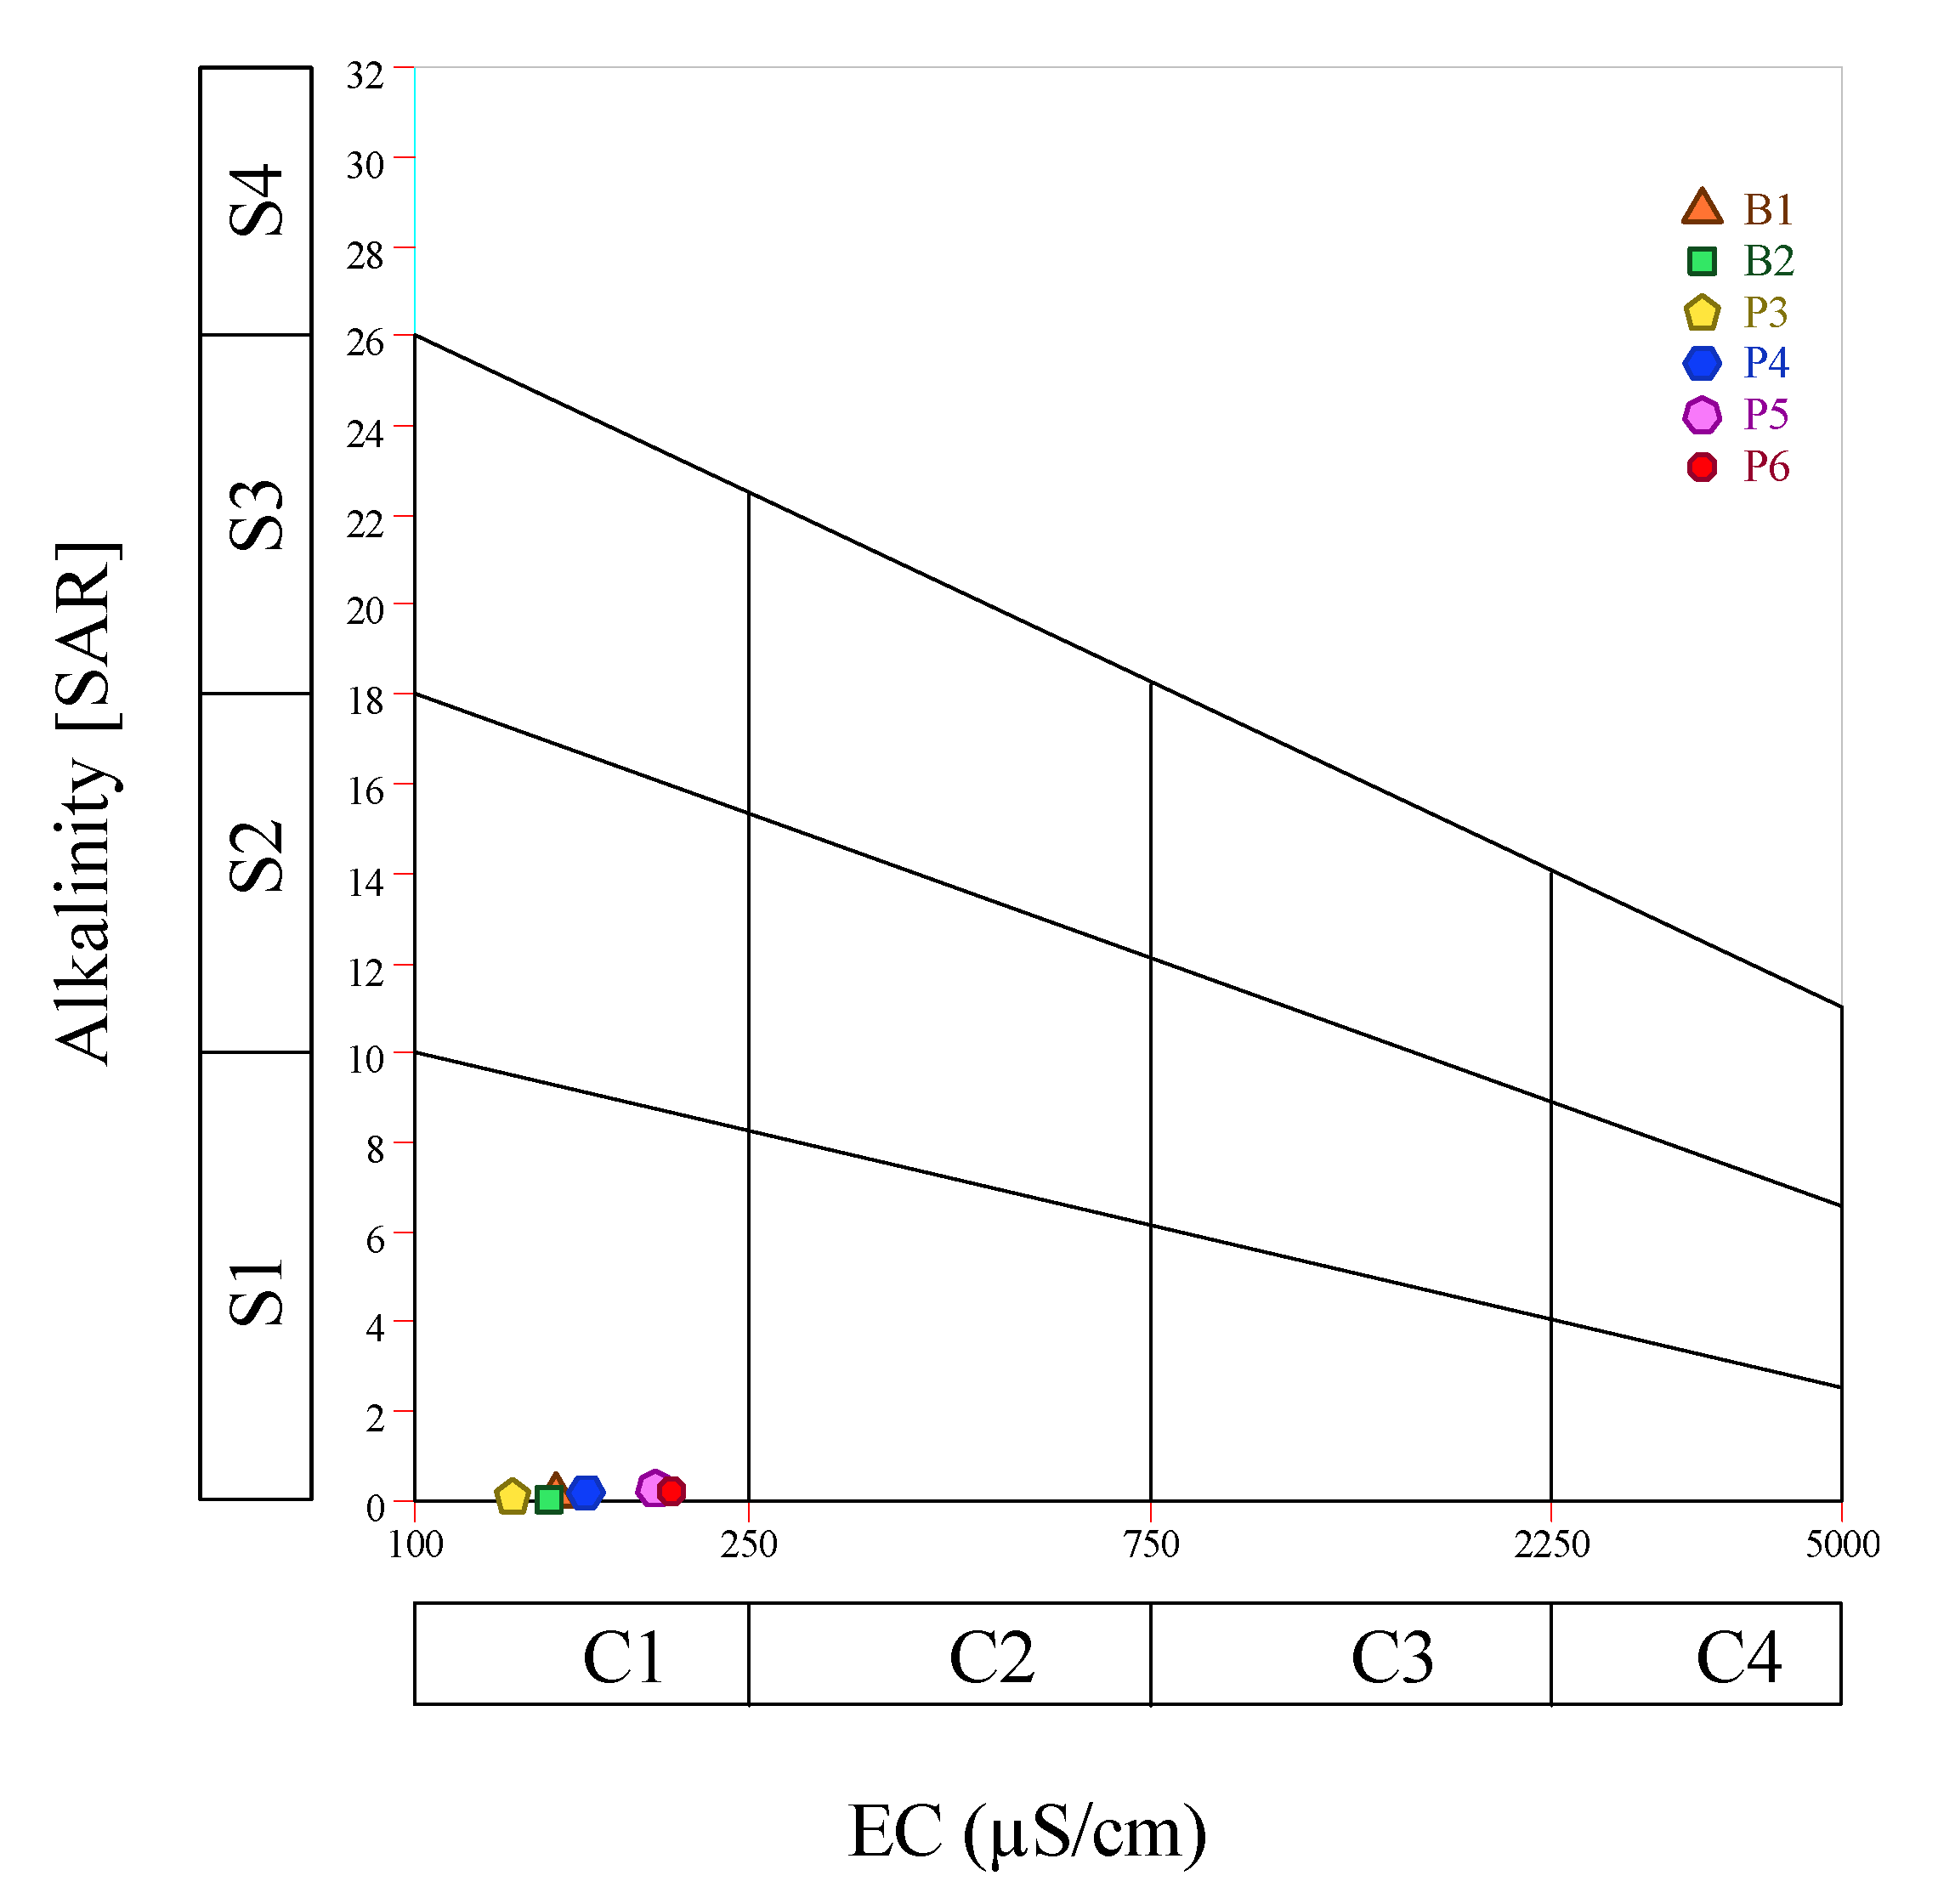
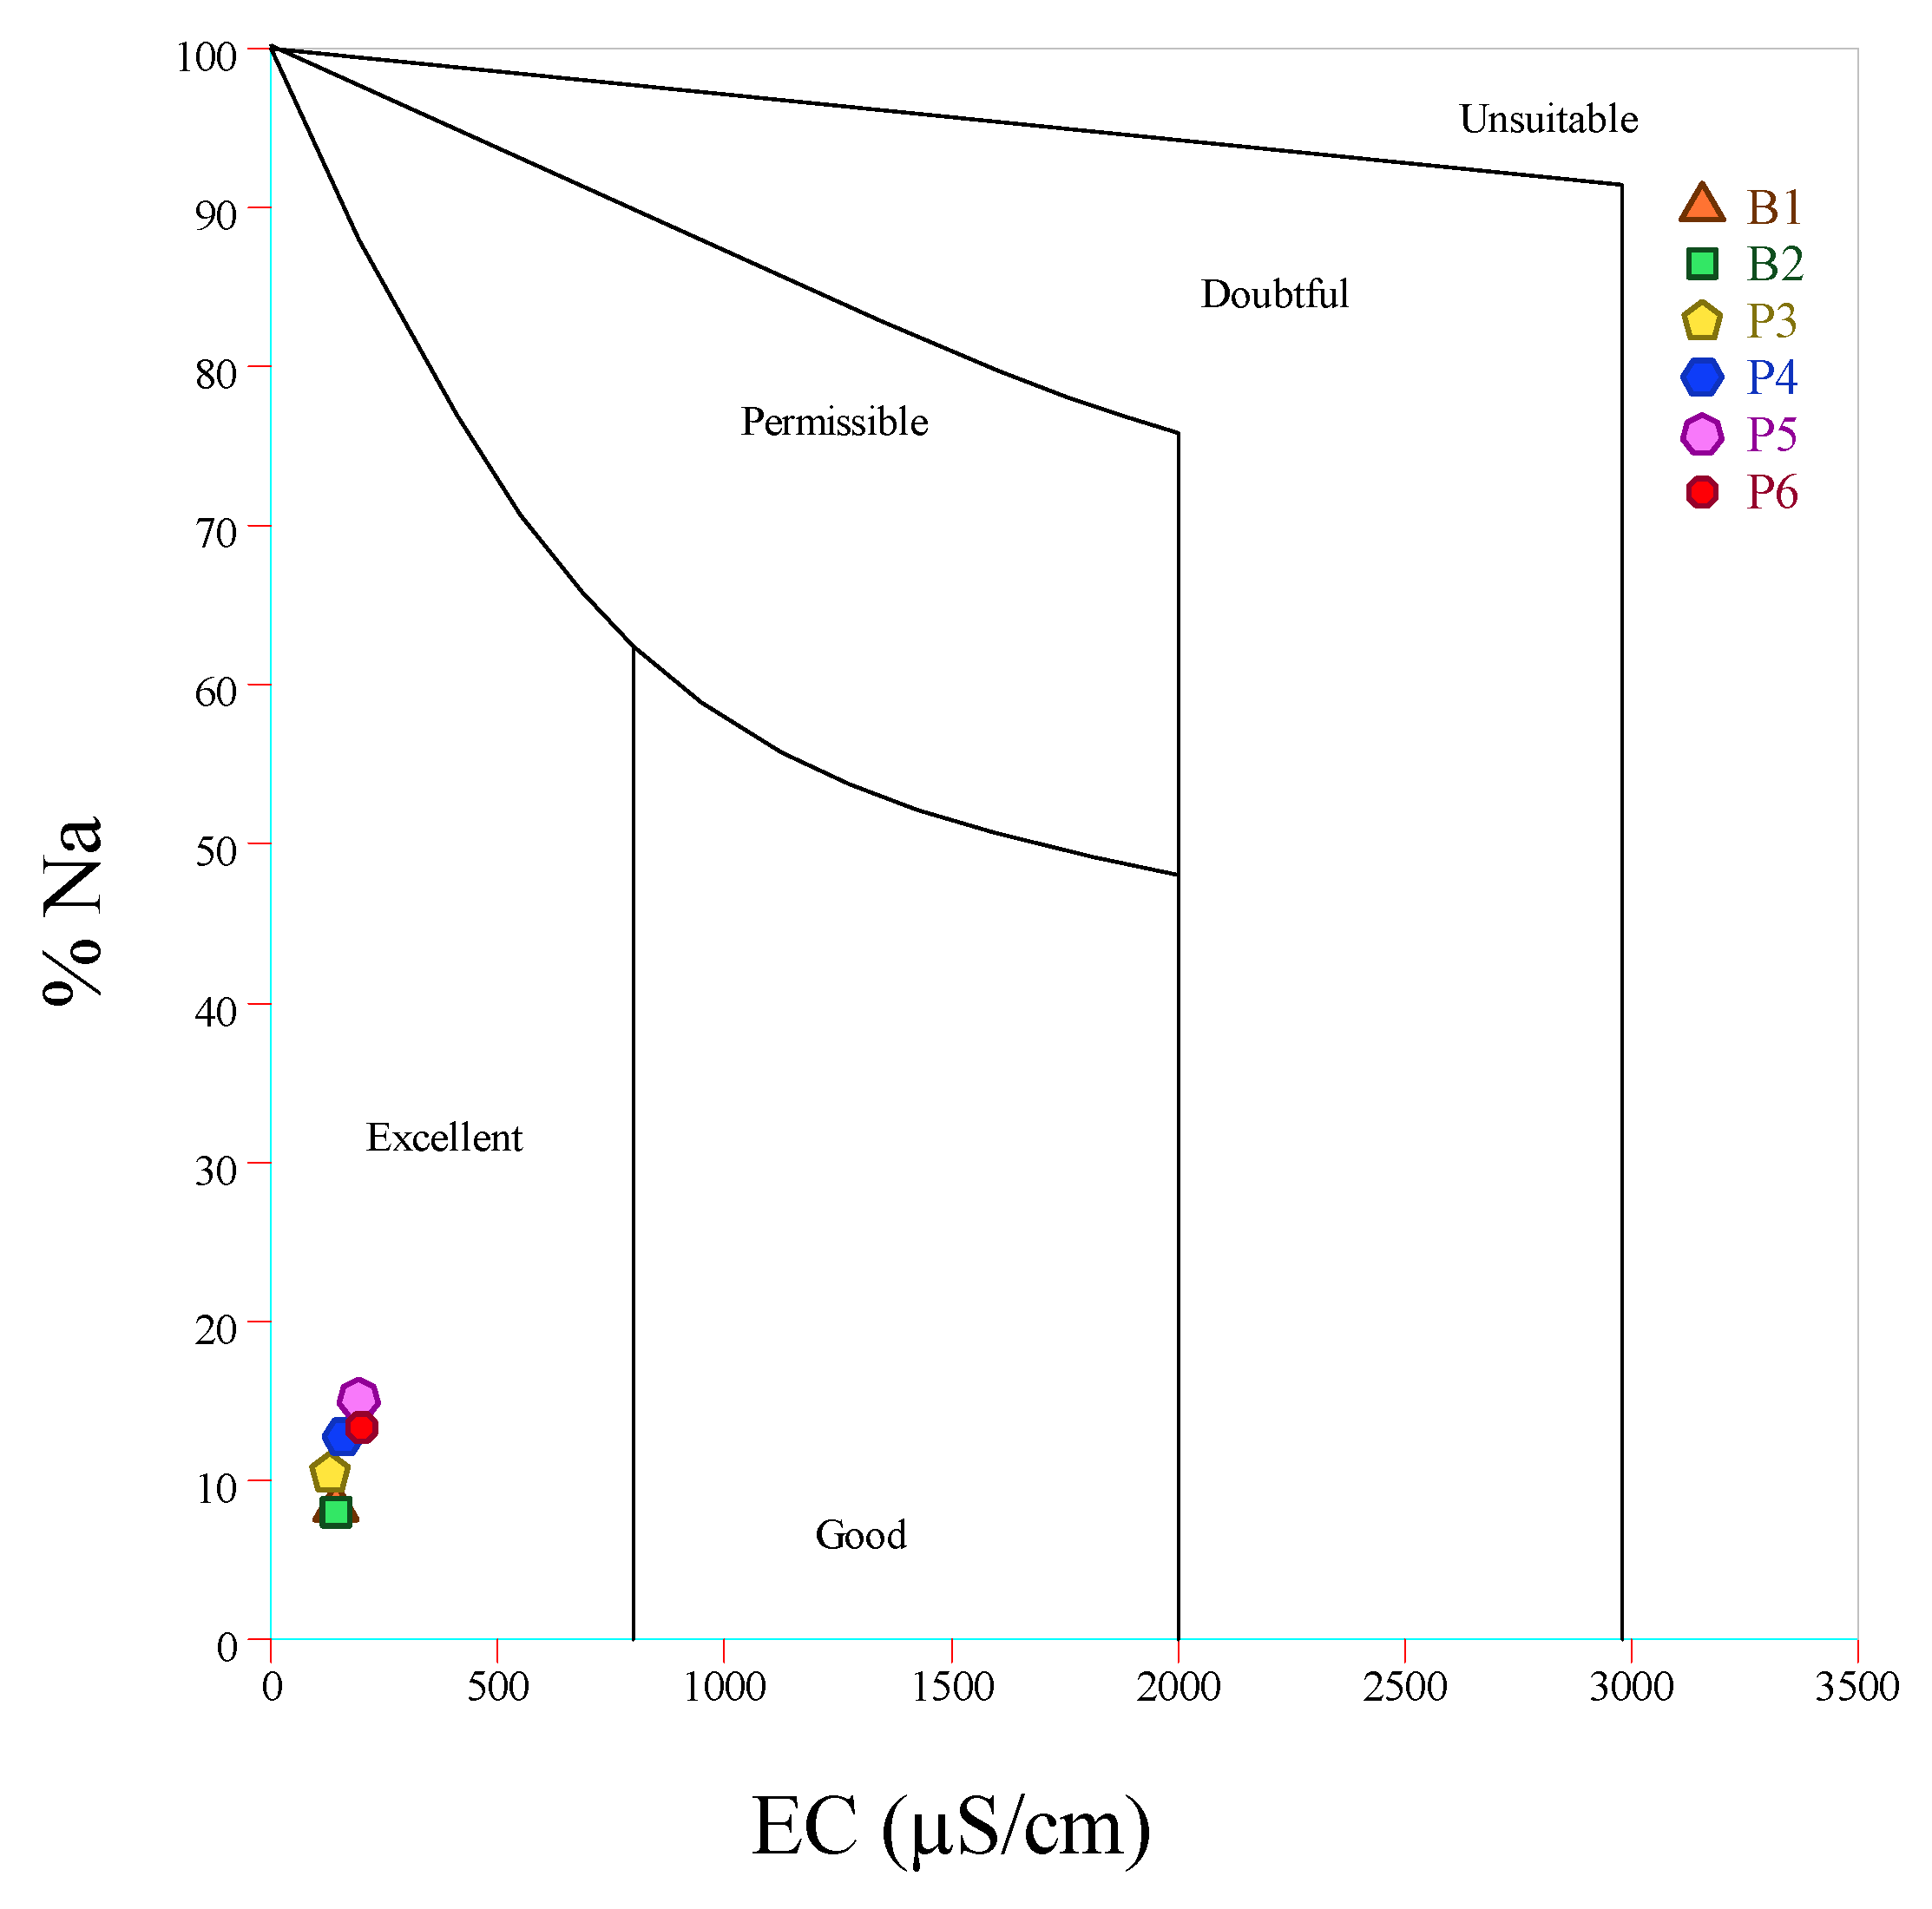
4.3.1. Electrical Conductivity, Sodium Adsorption Ratio, and Sodium Percentage

Problems frequently encountered in the evolution of soils under irrigation are, among others, salinity, toxicity, and the speed of water infiltration [50,51,52]. In arid and semi-arid regions, soils trend to suffer from salinity due to low rainfall and high evaporation. Salts contained in irrigation water tend to reduce the quantity of water that plants can absorb to the point of affecting their yield. Generally, irrigation water salinity is evaluated through three parameters: EC, SAR, and %Na. The results of the shallow aquifers hydrochemistry show low electrical conductivity between 33.70 µS/cm and 80.00 µS/cm for an average of 58.7 µS/cm (<250 µS/cm), which correspond to class C1 (Table 6). Thus, based on the EC, the analyzed waters can be considered excellent for irrigation. Concerning the SAR, it has values below 9, between 0.07 and 0.26: the water can then be used without precautions on crops that are not sensitive to sodium. Wilcox diagram (Figure 10), generally used to determine the suitability of irrigation water, is a compromise between sodicity (SAR) and salinity (EC) parameters. Thus, on the Wilcox diagram, the Karfiguéla shallow groundwater is of the C1S1 type corresponding to good quality water for irrigation, to be used with caution for plants sensitive to sodium. The sodium percentage also accounts for the risk of salinization. High sodium concentration reduces soil permeability and leads to plant damage by limiting water and nutrient absorption capacity through altered osmosis process and metabolic reactions. The calculated %Na values are all less than 20%, i.e., between 7.95% and 15.11% for an average of 11.30%. Thus, based on the %Na also, the shallow groundwater can be considered excellent for irrigation. The USSL diagram (US Salinity Lab), which offers a classification of water through %Na and EC (Figure 11), provides the same results.

4.3.2. Chloride and Nitrate (NO3-N) Hazard

The common cause of toxicity in irrigation water is usually chlorides [47]. This is because chloride is not adsorbed or retained by soils, so it moves easily with soil water, is absorbed by the crop, moves in the transpiration stream, and accumulates in the leaves [47]. If chloride concentration in the leaves exceeds crop tolerance, symptoms of damage, such as leaf scorch or the drying out of leaf tissue [47], appear. Along with soil and added fertilizers as the usual sources, nitrogen is a nutrient that boosts crop growth. Regardless of its source, nitrogen has the same effect on the plant and an excess will cause problems, just as an excess of fertilizer would. This excess can cause an excessive stimulation of growth, which will consequently lead to delayed or poor maturity quality [47]. Nitrogen usually occurs in four forms, including nitrate (NO3−-N), nitrite (NO2−-N), ammonium (NH4+-N), and organic nitrogen (N-org). The recommendations (Table 1 and Table 5) generally relate to the risk of nitrogen in the form of nitrate (NO3−-N), as this is the usual form found in natural water. Thus, 50% of the samples, namely P4, P5, and P6, present moderate risks in for agriculture, while B1, B2, and P3 are harmless (Table 1 and Table 5).

4.3.3. Potential Salinity (PS) and Kelly Ratio (KR)

Potential salinity and Kelly ratio (1941) [53] also permit assessing water suitability for agricultural use [21,26,54]. The standards for interpreting these parameters are reported in Table 7. For 100% of the samples analyzed, the PS is <3 meq/L, while the KR is <1. With regard to these two parameters, the Karfiguéla shallow groundwater is 100% suitable for agricultural use.

4.3.4. Residual Sodium Carbonate (RSC)

Alkaline soils (Ca2+ + Mg2+) tend to react with waters containing high concentrations of carbonate ions (CO32− + HCO3) [21,26,54]. When the carbonate ion is larger than the alkaline earth metal, the excess carbonate ion combines with Na2+ to form deposits of sodium carbonate (NaHCO3), thus affecting the structure (RSC) and fertility of soils [54,55]. Irrigation water classification according to RSC values, provided in Table 7, shows that 100% of the Karfiguéla shallow groundwater has an RSC < 1.25 and can therefore be considered suitable for irrigation.

4.3.5. Magnesium (MH) Hazard

Proposed by Szabolcs and Darab (1964) [56] and later redefined by Raghunath (1987) [57], magnesium risk is a ratio used to assess groundwater suitability for irrigation [21,54,58]. In most groundwater, there is a balance between magnesium and calcium ions [54,58]. In a soil system, a high concentration of magnesium leads to soil alkalinity, water adsorption, and the deterioration of the soil structure, particularly when the irrigation water contains a lot of sodium [54,58].
A MH value > 50 indicates that the water can be considered harmful and unsuitable for irrigation, as it adversely affects crop yield (Table 7). With regard to this ratio, 100% of the Karfiguéla shallow groundwater is unsuitable for irrigation considering the high magnesium mineralization of the water.

4.3.6. Permeability Index (PI)

Soil permeability is strongly affected by the total concentration of ions (Na2+, Ca2+, Mg2+, and HCO3) in the soil [26,54]. Irrigation water then has a direct impact on the long-term infiltration capacity of the soil and, therefore, on crop development [26,54]. The PI classification of Donen (1964), represents the suitability rate of irrigation water. According to PI, groundwater can be divided into three classes (Table 7): class I (100% maximum permeability), suitable for irrigation; class II (75% maximum permeability), slightly suitable; and class III (25% maximum permeability), not suitable for irrigation. For the shallow groundwater samples analyzed, 50% are categories I and 50% category II.

4.3.7. Irrigation Coefficient (Ka)

Originally developed in Soviet Russia, the Ka is a traditional method of assessing water suitability for irrigation [59]. It is obtained by studying the maximum damage of alkaline solutions and the relative damage of sodium salt on 40 types of crops [21,60].
In accordance with the classification of waters according to Ka, Table 7 shows that 100% of water is usable in agriculture.

4.3.8. Toxicity and Trace Elements

Since the study area is an agricultural perimeter where chemical fertilizers and pesticides are usually used, trace elements such as Fe, Zn, Cu, Mn, Pb, Al, Cr, Ni, and Cd were analyzed. Although some trace elements (Fe, Mn, and Zn) in small quantities are good for the development of crops, in the case of an excess, they can delay plant development and accumulate in their tissues [47]. Table 8 shows a total absence of Cu, Ni, Cr, and Ni in the Karfiguéla shallow groundwater.
In this study, while Mn, Zn, and Pb concentrations remained within the FAO standard for irrigation water, Cd concentrations in wells P4, P5, and P6 were, respectively, three, four, and five times higher than the standard.
This could be explained by the comparison between the dates of sampling and the use of pesticides around these sumps. Nevertheless, the monitoring of their occurrence and trend into groundwater is necessary to ensure that their concentration will not exceed tolerable limits.

5. Discussion

The analysis of the waters of the Karfiguéla shallow groundwater reveals a low concentration of ions. This suggests a low mineralization of the groundwater and a limited concentration of salt in the water that recharges it [35,61]. This situation was also evidenced by minerals such as dolomite, calcite, anhydrite, gypsum, halite, and aragonite and their saturation indices, which show an undersaturation of all the minerals. These results are consistent with the results obtained by Kouanda (2019) [30] concerning the sedimentary aquifer of the Taoudeni Basin in Burkina Faso. The low mineralization is then due to the superficial and alluvial nature of the aquifer. According to Huneau and al. (2011) [61] and Sako and al. (2018) [35], the drainage and percolation of water on intensively leached soils explain why shallow aquifers are generally less mineralized than deep ones. The spatial distribution of the ions, correlated with land use on the perimeter, is also an indicator of the aquifer mineralization processes that evolve following the direction of subsurface water flow in the study area [20].
The analysis of the hydrochemical facies shows that the analyzed waters belong to the Ca-Mg-HCO3 and Ca-Mg-Cl-SO4 types. According to Huneau and al. (2011) [61] and Kouanda (2019) [30], the Ca-Mg-HCO3 facies is the most encountered in the tabular Infracambrian groundwater of Burkina Faso, which unfolds under the study area.
The Ca-Mg-Cl-SO4 type is the most important in the study area, characterized by the presence of numerous agricultural, industrial, and mining developments. Chloride presence in the groundwater is the result of water contaminated by anthropogenic chloride infiltration [13,35]. This interpretation is supported by the high values of the anthropogenic pollution index, revealing a strong anthropogenic pollution of groundwater.
The shallow groundwater major ion analysis indicated that groundwater mineralization is mainly controlled by anthropogenic activities (60.05%), calcite and magnesite alteration (15.01%), and CO2 dissolution process (9.05%). Anthropogenic activities are generally the main process that governs the chemistry of shallow groundwater [13,21,35]. This is due to the nature of these aquifers, which allows surface pollution to seep through the permeable fringe into the aquifer. The second process is due to the residence time favoring chemical exchanges between the water and the rock [13,21,36,41]. The low percentage of this process is precisely due to the alluvial nature of the aquifer, which promotes flow and a seasonal recharge. As for the third process, it seems due to the biological activity of plants as well as the decomposition of organic matter, which produce carbon dioxide that, when dissolved in water, produces bicarbonate. This process has also been highlighted by Dakoure (2003) [31] in the sedimentary aquifer formations of western Burkina Faso.
The shallow groundwater suitability analysis reveals that its quality is good for irrigation, despite its vulnerability to pollution. Several studies around the world on the quality of shallow aquifers for irrigation lead to the same result [21,24,62,63]. However, the presence of heavy metals was identified in the water. Trace elements are generally found in very low quantities (less than 100 µg/L) in natural waters [47]. They are therefore generally not analyzed, unless there is a suspicion of its presence [47].
The presence of traces of Mn, Zn, Cd, and Pb in certain wells suggests contamination due to a localized use of pesticides and chemical fertilizers [13,48]. According to FAO standards, all analyzed elements is in an acceptable concentration for irrigation, excepted cadmium, whose concentration is high in one well, certainly due to point source pollution.
As the water quality is suitable for irrigation, it can be used as a supplementary irrigation water. Therefore, it will increase crop productivity. The shallow aquifer is easily accessible by rudimentary sumps and wells, which reduces the cost of implementing complex irrigation systems. It also mitigates the need to build drainage structures to aerate the subsoil to the recommended depth below the root zone of the plan.

6. Conclusions

The analysis and processing of physicochemical data provided an overview of the hydrochemistry of the shallow groundwater that unfolds under the Karfiguéla paddy field in Burkina Faso. Groundwater belongs to the Ca·Mg·HCO3 and Ca·Mg·SO4·Cl types, suggesting the existence of water–rock interactions, on the one hand, and the presence of chloride pollution, on the other. Considering the alluvial and superficial nature of the shallow aquifer, water is characterized by a relatively limited residence time and low mineralization, which lead to relatively low ion concentrations. Although almost all of the parameters analyzed comply with FAO standards for irrigation water, the high concentrations of NO3− and the presence of Pb and Cd above the standards suggest that the aquifer is highly exposed to anthropogenic activities. Then, PCA revealed that anthropogenic activities, chemical weathering of minerals, and dissolution of CO2 are the major processes controlling groundwater chemistry. The correlation matrix showed that the most important factor that contributes to the presence of ions in general and metallic trace elements in particular are anthropogenic activities. However, the Karfiguéla shallow groundwater can be considered suitable for irrigation, but keeping an eye on its quality in order to avoid any inconvenience on the permeability and alkalinity of the soil.
This study thus showed that hydrogeochemical characterization can be a robust tool to assess groundwater evolution and its state of pollution under multiple anthropogenic sources influence. With a good control over human activities, types of inputs as well as their use on the perimeter, the Karfiguéla shallow groundwater could be a good solution for supplementary irrigation and the increase in the Karfiguéla paddy field productivity.

Author Contributions

Investigation, Methodology, C.H.M.M., S.É.S.G. and K.O.J.; Conceptualization, Formal analysis, Data curation, Software, Draft preparation, Visualization, Writing—original draft, Writing—review and editing C.H.M.M. and S.É.S.G.; Validation, Supervision, Resources, Project administration in Burkina Faso, S.I. and Y.P.L. All authors have read and agreed to the published version of the manuscript.

Funding

This research was funded by the French Development Agency (AFD).

Institutional Review Board Statement

Not applicable.

Acknowledgments

These results were achieved within the framework of the Era-Net LEAP-Agri call on sustainable agriculture and aquaculture and on food and nutrition security, with funding from the National Agencies concerned, in particular, the Agence Française de Développement (AFD).

Conflicts of Interest

The authors declare no conflict of interest.

References

  1. Wada, Y.; Van Beek, L.P.; Van Kempen, C.M.; Reckman, J.W.; Vasak, S.; Bierkens, M.F. Global Depletion of Groundwater Resources. Geophys. Res. Lett. 2010, 37. [Google Scholar] [CrossRef] [Green Version]
  2. Ashraf, B.; AghaKouchak, A.; Alizadeh, A.; Mousavi Baygi, M.; R Moftakhari, H.; Mirchi, A.; Anjileli, H.; Madani, K. Quantifying Anthropogenic Stress on Groundwater Resources. Sci. Rep. 2017, 7, 12910. [Google Scholar] [CrossRef] [Green Version]
  3. Ashraf, S.; Nazemi, A.; AghaKouchak, A. Anthropogenic Drought Dominates Groundwater Depletion in Iran. Sci. Rep. 2021, 11, 9135. [Google Scholar] [CrossRef] [PubMed]
  4. Gleeson, T.; Wada, Y. Assessing Regional Groundwater Stress for Nations Using Multiple Data Sources with the Groundwater Footprint. Environ. Res. Lett. 2013, 8, 044010. [Google Scholar] [CrossRef]
  5. Herbert, C.; Döll, P. Global Assessment of Current and Future Groundwater Stress with a Focus on Transboundary Aquifers. Water Resour. Res. 2019, 55, 4760–4784. [Google Scholar] [CrossRef]
  6. Richey, A.S.; Thomas, B.F.; Lo, M.-H.; Reager, J.T.; Famiglietti, J.S.; Voss, K.; Swenson, S.; Rodell, M. Quantifying Renewable Groundwater Stress with GRACE. Water Resour. Res. 2015, 51, 5217–5238. [Google Scholar] [CrossRef]
  7. Ritchie, H.; Roser, M. Water Use and Stress. Our World Data 2017. Available online: https://ourworldindata.org/water-use-stress (accessed on 1 July 2022).
  8. Thomas, B.F.; Famiglietti, J.S. Identifying Climate-Induced Groundwater Depletion in GRACE Observations. Sci. Rep. 2019, 9, 1–9. [Google Scholar]
  9. Altchenko, Y.; Villholth, K.G. Mapping Irrigation Potential from Renewable Groundwater in Africa–a Quantitative Hydrological Approach. Hydrol. Earth Syst. Sci. 2015, 19, 1055–1067. [Google Scholar] [CrossRef] [Green Version]
  10. MacDonald, A.M.; Bonsor, H.C.; Dochartaigh, B.É.Ó.; Taylor, R.G. Quantitative Maps of Groundwater Resources in Africa. Environ. Res. Lett. 2012, 7, 024009. [Google Scholar] [CrossRef]
  11. Gowing, J.; Walker, D.; Parkin, G.; Forsythe, N.; Haile, A.T.; Ayenew, D.A. Can Shallow Groundwater Sustain Small-Scale Irrigated Agriculture in Sub-Saharan Africa? Evidence from NW Ethiopia. Groundw. Sustain. Dev. 2020, 10, 100290. [Google Scholar] [CrossRef]
  12. Pavelic, P.; Giordano, M.; Keraita, B.N.; Ramesh, V.; Rao, T. Groundwater Availability and Use in Sub-Saharan Africa: A Review of 15 Countries; International Water Management Institute, 2012; p. 289. Available online: https://www.iwmi.cgiar.org/Publications/Books/PDF/groundwater_availability_and_use_in_sub-saharan_africa_a_review_of_15_countries.pdf (accessed on 1 July 2022).
  13. Sako, A.; Sawadogo, S.; Nimi, M.; Ouédraogo, M. Hydrogeochemical and Pollution Characterization of a Shallow Glauconitic Sandstone Aquifer in a Peri-Urban Setting of Bobo-Dioulasso, Southwestern Burkina Faso. Environ. Earth Sci. 2020, 79, 1–18. [Google Scholar] [CrossRef]
  14. Kambou, D. Évaluation Des Performances Techniques de l’irrigation Au Burkina Faso; Université de Liège: Liège, Belgique, 2019. [Google Scholar]
  15. COWI. Rapport de l’étude de La Stratégie de Suivi et d’évaluation Des Ressources En Eau-Rapport Diagnostic; Le Comité National des Irrigations et du Drainage du Burkina: Ouagadougou, Burkina Faso, 2019. [Google Scholar]
  16. Daré, W.; Venot, J.-P.; Kaboré, É.; Tapsoba, A.; Traoré, F.; Gérard, F.; Carboni, S.; Idani, D.; Kambiré, H.; Napon, K. Grands Aménagements Hydroagricoles, Inégalités Environnementales et Participation: Le Cas de Bagré Au Burkina Faso. VertigO Rev. Électronique En Sci. L’environnement 2019, 19. [Google Scholar] [CrossRef]
  17. Dembele, Y.; Yacouba, H.; Keïta, A.; Sally, H. Assessment of Irrigation System Performance in South-western Burkina Faso. Irrig. Drain. 2011, 61, 306–315. [Google Scholar] [CrossRef]
  18. AEM; AEC; Compaoré, N.F. Rapport de l’étude d’identification, de Localisation et de Caractérisation Physique Des Sources d’eau Dans Les Espaces de Compétence Des Agences de l’eau Du Mouhoun et Des Cascades–Etape 1; Burkina Faso, 2014; p. 88. Available online: http://eaumouhoun.bf/wp-content/uploads/2015/09/Rapport-final-%C3%A9tude-sources-%C3%A9tape-1.pdf (accessed on 1 July 2022).
  19. Berase. Rapport Etude Diagnostique de l’état Des Lieux Du Périmètre Rizicole de Karfiguéla; Le Comité National des Irrigations et du Drainage du Burkina: Ouagadougou, Burkina Faso, 2018. [Google Scholar]
  20. Compaoré, N.F.; Dara, A.E.; Koïta, M.; Dao, D.M.; Yonli, H.F. Assessment of the Exploitation Rate and Sustainability of an Alluvial Plain in Southwestern Burkina Faso. J. Nat. Sci. 2017, 5, 16–22. [Google Scholar] [CrossRef] [Green Version]
  21. Xu, P.; Feng, W.; Qian, H.; Zhang, Q. Hydrogeochemical Characterization and Irrigation Quality Assessment of Shallow Groundwater in the Central-Western Guanzhong Basin, China. Int. J. Environ. Res. Public. Health 2019, 16, 1492. [Google Scholar] [CrossRef] [Green Version]
  22. Khalid, S. An Assessment of Groundwater Quality for Irrigation and Drinking Purposes around Brick Kilns in Three Districts of Balochistan Province, Pakistan, through Water Quality Index and Multivariate Statistical Approaches. J. Geochem. Explor. 2019, 197, 14–26. [Google Scholar]
  23. Aher, K.R.; Gaikwad, S.G. Irrigation Groundwater Quality Based on Hydrochemical Analysis of Nandgaon Block, Nashik District in Maharashtra. Int. J. Adv. Geosci. 2017, 5, 7116. [Google Scholar] [CrossRef] [Green Version]
  24. Ahmed, M.T.; Hasan, M.Y.; Monir, M.U.; Samad, M.A.; Rahman, M.M.; Islam Rifat, M.S.; Islam, M.N.; Khan, A.A.S.; Biswas, P.K.; Jamil, A.H.M.N. Evaluation of Hydrochemical Properties and Groundwater Suitability for Irrigation Uses in Southwestern Zones of Jashore, Bangladesh. Groundw. Sustain. Dev. 2020, 11, 100441. [Google Scholar] [CrossRef]
  25. Dash, S.; Kalamdhad, A.S. Hydrochemical Dynamics of Water Quality for Irrigation Use and Introducing a New Water Quality Index Incorporating Multivariate Statistics. Environ. Earth Sci. 2021, 80, 1–21. [Google Scholar] [CrossRef]
  26. Verma, A.; Yadav, B.K.; Singh, N.B. Hydrochemical Monitoring of Groundwater Quality for Drinking and Irrigation Use in Rapti Basin. SN Appl. Sci. 2020, 2, 460. [Google Scholar] [CrossRef] [Green Version]
  27. Loye, A.S.; Tingueri, R.K.; Zida, Y.; Zoma, L. Monographie de La Région Des Cascades; 2009; p. 180. Available online: https://ireda.ceped.org/inventaire/ressources/bfa-2006-rec-o5_region_cascades.pdf (accessed on 1 July 2022).
  28. Dembele, Y.; Some, L. Propriétés Hydrodynamiques Des Principaux Types de Sol Du Burkina Faso. In Proceedings of the Niamey, Niger, Workshop, February 1991; IAHS Publ: Niamey, Niger, 1991; Volume 199, pp. 217–227. Available online: https://dokumen.tips/documents/proprietes-hydrodynamiques-des-principaux-types-de-sol-du-burkina-.html?page=1 (accessed on 1 July 2022).
  29. Hugot, G. A La Recherche Du Gondwana Perdu: Aux Origines Du Monde. 2002, p. 311. Available online: http://www.mgm.fr/UMR/Gondwana.pdf (accessed on 1 July 2022).
  30. Kouanda, B. Modélisation Intégrée Du Complexe Mouhoun Supérieur-Sourou Dans Le Contexte Des Changements Climatiques; Institut International d’Ingénierie de l’Eau et de l’Environnement: Ouagadougou, Burkina Faso, 2019. [Google Scholar]
  31. Dakoure, D. Etude Hydrogéologique et Géochimique de La Bordure Sud-Est Du Bassin Sédimentaire de Taoudéni (Burkina Faso-Mali)-Essai de Modélisation. Ph.D. Thesis, Université Pierre et Marie Curie-Paris, Paris, France, 2003. [Google Scholar]
  32. Sauret, E. Caractérisation Hydrochimique et Qualité Des Eaux Souterraines Du Projet Hydraulique Villageoise 310 Forages, Dans La Boucle Du Mouhoun: Provinces Des Banwa, Des Balés, Du Mouhoun et de La Kossi (Burkina Faso); Mémoire d’Ingénieur, Université Cheikh Anta Diop, Institut des Sciences de la Terre: Dakar, Sénégal, 2005; p. 63. Available online: https://hdl.handle.net/2268/155417 (accessed on 1 July 2022).
  33. Piper, A.M. A Graphic Procedure in the Geochemical Interpretation of Water-Analyses. Eos Trans. Am. Geophys. Union 1944, 25, 914–928. [Google Scholar] [CrossRef]
  34. Stiff, H.A., Jr. The Interpretation of Chemical Water Analysis by Means of Patterns. J. Pet. Technol. 1951, 3, 15. [Google Scholar] [CrossRef]
  35. Sako, A.; Yaro, J.M.; Bamba, O. Impacts of Hydrogeochemical Processes and Anthropogenic Activities on Groundwater Quality in the Upper Precambrian Sedimentary Aquifer of Northwestern Burkina Faso. Appl. Water Sci. 2018, 8, 88. [Google Scholar] [CrossRef] [Green Version]
  36. Li, P.; Wu, J.; Qian, H.; Zhang, Y.; Yang, N.; Jing, L.; Yu, P. Hydrogeochemical Characterization of Groundwater in and around a Wastewater Irrigated Forest in the Southeastern Edge of the Tengger Desert, Northwest China. Expo. Health 2016, 8, 331–348. [Google Scholar] [CrossRef]
  37. Kumar, M.; Ramanathan, A.L.; Rao, M.S.; Kumar, B. Identification and Evaluation of Hydrogeochemical Processes in the Groundwater Environment of Delhi, India. Environ. Geol. 2006, 50, 1025–1039. [Google Scholar] [CrossRef]
  38. Yang, Q.; Li, Z.; Ma, H.; Wang, L.; Martín, J.D. Identification of the Hydrogeochemical Processes and Assessment of Groundwater Quality Using Classic Integrated Geochemical Methods in the Southeastern Part of Ordos Basin, China. Environ. Pollut. 2016, 218, 879–888. [Google Scholar] [CrossRef]
  39. Gibbs, R.J. Mechanisms Controlling World Water Chemistry. Science 1970, 170, 1088–1090. [Google Scholar] [CrossRef]
  40. Essouli, O.F. Hydrochimie des eaux de surface et souterraines de la partie nord de Brazzaville: Origine et processus de minéralisation. Sci. Appliquées Ing. 2021, 2, 1–15. [Google Scholar]
  41. Subramani, T.; Rajmohan, N.; Elango, L. Groundwater Geochemistry and Identification of Hydrogeochemical Processes in a Hard Rock Region, Southern India. Environ. Monit. Assess. 2010, 162, 123–137. [Google Scholar] [CrossRef]
  42. Appelo, C.A.J.; Postma, D. Ion Exchange. In Geochemistry, Groundwater and Pollution; CRC Press: London, UK, 2005; Volume 2, pp. 241–309. [Google Scholar]
  43. Leclercq, L.; Maquet, B. Deux Nouveaux Indices Diatomique et de Qualité Chimique Des Eaux Courantes. Comparaison Avec Différents Indices Existants. Cah. Biol. Mar. 1987, 28, 303–310. [Google Scholar]
  44. Orou, R.K.; Soro, G.; Traoré, A.; Fossou, R.M.N.; Soro, N. Aptitude à l’irrigation Des Eaux Souterraines Du Département d’Agboville (Sud-Est de La Côte d’Ivoire). Eur. Sci. J. 2016, 21, 20. Available online: https://eujournal.org/index.php/esj/article/view/7746/7508 (accessed on 1 July 2022).
  45. Scheiber, L.; Cendón, D.I.; Iverach, C.P.; Hankin, S.I.; Vázquez-Suñé, E.; Kelly, B.F.J. Hydrochemical Apportioning of Irrigation Groundwater Sources in an Alluvial Aquifer. Sci. Total Environ. 2020, 744, 140506. [Google Scholar] [CrossRef]
  46. Rhoades, J.D. Quality of water for irrigation. Soil Sci. 1972, 113, 277–284. [Google Scholar] [CrossRef]
  47. Ayers, R.S.; Westcot, D.W. Water Quality for Agriculture; FAO irrigation and drainage paper, 29 Rev.1; FAO Rome: Rome, Italy, 1985; Available online: https://www.fao.org/3/t0234e/t0234e00.htm (accessed on 1 July 2022).
  48. Senou, I.; Nimi, M.; Sanogo, S.B.; Nacro, H.; Some, A.N. Study of Physicochemical Parameters and Level of Cadmium and Lead Contamination in Irrigation Water in Market Garden Areas in West Burkina Faso. Int. J. Environ. Agric. Biotechnol. 2020, 5, 10. [Google Scholar] [CrossRef]
  49. Penant, P.; Brouyere, S. Caractérisation Des Sources de Nitrate Dans Les Aquifères Cristallins Du Centre Du Bénin. Mémoire de Master, Université de Liège, Belgique. 2016. Available online: https://matheo.uliege.be/bitstream/2268.2/1650/1/PPENANT_m%C3%A9moire_FINAL.pdf (accessed on 1 July 2022).
  50. Murray, R.S.; Grant, C.D. The Impact of Irrigation on Soil Structure; National Program for Sustainable Irrigation, Land & Water Australia, 2007; pp. 1–31. Available online: https://citeseerx.ist.psu.edu/viewdoc/download?doi=10.1.1.460.5683&rep=rep1&type=pdf#:~:text=Irrigation%2C%20even%20with%20water%20of,structure%20and%20to%20raise%20the (accessed on 1 July 2022).
  51. Hillel, D.; Braimoh, A.K.; Vlek, P.L. Soil Degradation under Irrigation. In Land Use and Soil Resources; Springer: Dordrecht, The Netherlands, 2008; pp. 101–119. [Google Scholar] [CrossRef]
  52. Mohanavelu, A.; Naganna, S.R.; Al-Ansari, N. Irrigation Induced Salinity and Sodicity Hazards on Soil and Groundwater: An Overview of Its Causes, Impacts and Mitigation Strategies. Agriculture 2021, 11, 983. [Google Scholar] [CrossRef]
  53. Kelley, W.P. Permissible Composition and Concentration of Irrigation Water. Trans. Am. Soc. Civ. Eng. 1941, 106, 849–855. [Google Scholar] [CrossRef]
  54. Yang, Q.; Li, Z.; Xie, C.; Liang, J.; Ma, H. Risk Assessment of Groundwater Hydrochemistry for Irrigation Suitability in Ordos Basin, China. Nat. Hazards 2018, 101, 309–325. [Google Scholar] [CrossRef]
  55. Eaton, F.M. Significance of carbonates in irrigation waters. Soil Sci. 1950, 69, 123–134. [Google Scholar] [CrossRef]
  56. Szabolcs, I.; Darab, K. Radio-Active Technique for Examining the Improving Effect of CaCO3 on Alkali (Szik) Soils. Acta Agron Hung 1964, 13, 93–101. [Google Scholar]
  57. Raghunath, H.M. Ground Water: Hydrogeology, Ground Water Survey and Pumping Tests, Rural Water Supply and Irrigation Systems, 2nd ed.; Wiley Eastern: New Delhi, India, 1987. [Google Scholar]
  58. Tahmasebi, P.; Mahmudy-Gharaie, M.H.; Ghassemzadeh, F.; Karouyeh, A.K. Assessment of Groundwater Suitability for Irrigation in a Gold Mine Surrounding Area, NE Iran. Environ. Earth Sci. 2018, 77, 1–12. [Google Scholar] [CrossRef]
  59. Li, P.; Wu, J.; Qian, H. Assessment of Groundwater Quality for Irrigation Purposes and Identification of Hydrogeochemical Evolution Mechanisms in Pengyang County, China. Environ. Earth Sci. 2013, 69, 2211–2225. [Google Scholar] [CrossRef]
  60. Zhou, J.L.; Wu, B.; Wang, Y.P.; Guo, X.-J. Distribution and Quality Assessment of Medium Salinity Groundwater in Plain Areas in Tarim Basin, Xinjiang. China Rural Water Hydropower 2009, 9, 32–36. [Google Scholar]
  61. Huneau, F.; Dakoure, D.; Celle-Jeanton, H.; Vitvar, T.; Ito, M.; Traore, S.; Compaore, N.F.; Jirakova, H.; Le Coustumer, P. Flow Pattern and Residence Time of Groundwater within the South-Eastern Taoudeni Sedimentary Basin (Burkina Faso, Mali). J. Hydrol. 2011, 409, 423–439. [Google Scholar] [CrossRef]
  62. Dinka, M.O.; Tadesse, K.B. Suitability of Shallow Groundwater for Irrigation: The Case of the Wonji Shoa Sugar Estate (Ethiopia). Irrig. Drain. 2019, 68, 857–866. [Google Scholar] [CrossRef]
  63. Kim, J.H.; Kim, R.H.; Lee, J.; Chang, H.W. Hydrogeochemical Characterization of Major Factors Affecting the Quality of Shallow Groundwater in the Coastal Area at Kimje in South Korea. Environ. Geol. 2003, 44, 478–489. [Google Scholar] [CrossRef]
Figure 1. Location of the study area: (a) the Comoé watershed in Burkina Faso, (b) geology of the upper Comoé watershed, and (c) the monitoring network of the Karfiguéla paddy field.
Water 14 02574 g001
Figure 2. Spatial distribution of physicochemical parameters.
Water 14 02574 g002
Figure 3. Stiff (a) and Piper (b) diagrams showing the classification of the water type of the shallow groundwater.
Water 14 02574 g003
Figure 4. Gibbs diagram indicating the groundwater natural evolution mechanisms.
Water 14 02574 g004
Figure 5. Matrix of the correlation coefficients of the physicochemical parameters of the alluvial aquifer.
Water 14 02574 g005
Figure 6. Bivariate diagrams for cation exchange. (a) CAI-2 versus CAI-1 correlation diagram; (b) basis exchange process diagram.
Water 14 02574 g006
Figure 7. Variation of the saturation indices of different minerals.
Water 14 02574 g007
Figure 8. Relationship between ions: (a) Na+ versus Cl; (b) Ca2+ versus SO42−; (c) Ca2+ + Mg2+ versus HCO3; and (d) Ca2++Mg2+ versus HCO3 + SO42−.
Water 14 02574 g008
Figure 9. Aquifer chemistry control process.
Water 14 02574 g009
Figure 10. Wilcox diagram for irrigation water quality assessment.
Water 14 02574 g010
Figure 11. USSL diagram for assessing irrigation water quality.
Water 14 02574 g011
Table 1. Dissolution process of calcareous minerals.
AnhydriteCaSO4 ↔ Ca2+ + SO42−
AragoniteCaCO3 + CO2 + H2O ↔ Ca2+ + 2 HCO3
calciteCaCO3 ↔ Ca2+ + CO32−
DolomiteCaMg(CO3)2 + 2CO2+2H2O ↔ Ca2+ + Mg2+ + 4HCO3
GypsumCaSO4:2H2O ↔ Ca2+ + SO42− + 2 H2O
haliteNaCl ↔ Na+ + Cl
MagnesiteMgCO3 ↔ Mg2+ + CO32−
Table 2. Physicochemical parameters of groundwater (July 2020).
ParameterUnitsB1B2P3P4P5P6MeanVC [%]FAO Standards
NoneSlight to ModerateSevere
pH6.56.36.56.35.76.26.25%6.5–8.4
ECμS/cm65.152.153.233.780.068.158.727%<700700–3000350
TDSmg·L−1102.091.099.099.0114.0134.0106.514%<450450–20002000
TACmg·L−136.036.054.025.017.042.035.037%
Ca2+mg·L−16.05.07.04.08.04.45.727%
Mg2+mg·L−18.512.27.913.110.712.610.820%
Na+mg·L−11.91.21.83.84.74.02.950%7070–200200
K+mg·L−10.32.21.50.90.80.81.162%
NH4+mg·L−10.00.00.00.81.71.80.7120%
Fe2+mg·L−10.00.00.01.34.53.11.5130%
Zn2+mg·L−10.00.00.00.00.00.00.0112%<2
HCO3mg·L−143.943.965.930.520.751.242.737%9090–500500
CO32−mg·L−10.00.00.00.00.00.00.0
Clmg·L−13.59.04.01.01.51.83.586%<140140–355355
NO3mg·L−12.21.10.223.017.410.19.0106%55–3030
NO2mg·L−10.10.10.00.20.30.40.273%
PO43−mg·L−19.95.75.20.50.70.13.7107%
SO42−mg·L−125.511.05.621.547.746.726.367%
Mn2+mg·L−10.000.000.010.000.000.000.0245%
Cd2+mg·L−10.00.00.00.00.00.10.0114%
Pb2+mg·L−10.00.00.00.10.10.10.0120%
Table 3. Principal components of the physicochemical parameters.
AttributePC1PC2PC3
Na+0.9770.0180.025
Cd2+0.9640.123−0.185
Fe2+0.956−0.2010.143
Pb2+0.9400.0320.291
SO42−0.921−0.245−0.099
Zn2+−0.920−0.1830.117
NH4+0.918−0.230−0.121
NO2-N0.899−0.101−0.275
pH−0.8140.233−0.502
PO43−−0.804−0.3410.015
NO3-N0.7830.4500.206
TDS0.764−0.267−0.540
Cl−0.7320.0620.278
HCO3−0.624−0.216−0.643
K+−0.5050.2530.357
Mg2+0.5040.7770.019
Ca2+0.025−0.8360.477
EC0.439−0.8170.066
Mn2+−0.499−0.354−0.171
Eigen value11.412.871.72
Var. Expl.60.05% (60%)15.10% (75%)9.05% (84%)
Table 4. Index of the organic pollution of groundwater.
B1B2P3P4P5P6
NH4+mg·L−10.00.00.00.81.71.790
Index555433
NO2μg/L1428427150280370
Index223111
PO43−μg/L99065735521450070050
Index111224
OPI2.72.73.02.32.02.7
Organic pollutionHighHighModerateHighHighHigh
Table 5. Saturation indices calculated by PHREEQ.
PhasisIFChem.
Formula
B1B2P3P4P5P6
Anhydrite−3.26−3.7−3.83CaSO4
Aragonite−2.63−2.82−2.37−3.09−3.56−2.93CaCO3
calcite−2.49−2.68−2.23−2.95−3.41−2.79CaCO3
Dolomite−4.48−4.63−4.06−5.04−6.35−4.78CaMg (CO3)2
Gypsum−3.04−3.48−3.61CaSO4:2H2O
halite−9.71−9.5−9.68−9.96−9.68−9.69NaCl
Magnesite−2.57−2.53−2.41−2.67−3.52−2.57MgCO3
Table 6. Results of the different water quality parameters for agricultural use (July 2020).
UnitsB1B2P3P4P5P6AverageStandard. Deviation
EC[dS/m]65.1052.1053.2033.7080.0068.1058.7016.01
SAR0.120.070.110.200.260.220.160.07
NO3-N[mg/L]2.241.120.2222.9817.4210.109.019.51
%Na[%]8.28%7.98%10.44%12.66%15.11%13.30%11.30%2.87%
PS[meq/L]0.360.370.170.250.540.540.370.15
KR0.080.040.080.130.160.140.100.04
RSC[meq/L]−0.28−0.530.08−0.78−0.94−0.42−0.480.36
MH[%]70.01%80.01%65.01%84.35%68.71%82.51%75.10%8.16%
IP[%]85.37%66.27%100.04%59.43%52.38%75.10%73.10%17.57%
Ka584.57227.33511.501043.67767.12776.25651.74278.11
Table 7. Classification of groundwater quality for irrigation based on EC, Na%, RSC, MH, PI, KR, PS, and Ka.
ClassValue RangeWater Quality% Sample
EC [µS/cm]C1<250Excellent100%
C2250–750Good0%
C3750–2250Doubtful0%
C4>2250Unsuitable0%
SARLow0–9Use with caution on sodium sensitives crops100%
Medium10–17Amendments and leaching need0%
High18–25Unsuitable for continuous use0%
Very high>26Unsuitable for use0%
NO3[mg/L] ≤2Excellent33.33%
2–5Good16.67%
5–20Permissible33.33%
20–30Doubtful16.67%
>30Unsuitable0%
%Na <20Excellent100%
20–40Good0%
40–60Permissible0%
60–80Doubtful0%
>80Unsuitable0%
PS <3.0Excellent to good100%
3.0–5.0Good to injurious0%
>5.0Injurious to unsatisfactory0%
KR <1Suitable100%
>1Unsuitable0%
RSC [meq/L] <1.25Good100%
1.25–2.50Doubtful0%
>2.50Unsuitable0%
MH <50Suitable0%
>50Unsuitable100%
PIClass I>75Suitable50%
Class II25–75Marginally suitable50%
Class III<25Unsuitable0%
Ka >18Excellent100%
6–18Permissible0%
1.2–6Doubtful0%
<1.2Unsuitable0%
Table 8. Metallic trace elements in groundwater.
UnitsB1B2P3P4P5P6Recommended Maximum Concentration (R.S. and Westcot, 1985)
Cumg·L−10.000.000.000.000.000.000.2
Nimg·L−10.000.000.000.000.000.000.2
Crmg·L−10.000.000.000.000.000.000.1
Mnmg·L−10.000.000.010.000.000.000.2
Cdmg·L−10.000.000.000.030.040.050.01
Pbmg·L−10.000.000.000.070.120.065
Almg·L−10.000.000.000.000.000.005
Znmg·L−10.040.050.030.000.000.002
Publisher’s Note: MDPI stays neutral with regard to jurisdictional claims in published maps and institutional affiliations.

