Article

Characteristic Analysis of the Spatio-Temporal Distribution of Key Variables of the Soil Freeze–Thaw Processes over Heilongjiang Province, China

1
Institute of Groundwater in Cold Region, Heilongjiang University, Harbin 150080, China
2
School of Hydraulic and Electric-Power, Heilongjiang University, Harbin 150080, China
3
China and Russian Cold Region Hydrology and Water Conservancy Engineering Joint Laboratory, Heilongjiang University, Harbin 150080, China
4
Faculty of Geology and Survey, North-Eastern Federal University, 677000 Yakutsk, Russia
5
Melnikov Permafrost Institute of the Siberian Branch of the Russian Academy of Science, 677000 Yakutsk, Russia
*
Author to whom correspondence should be addressed.
Water 2022, 14(16), 2573; https://doi.org/10.3390/w14162573
Submission received: 20 July 2022 / Revised: 12 August 2022 / Accepted: 18 August 2022 / Published: 20 August 2022
(This article belongs to the Section Soil and Water)

Abstract

:
The soil freeze–thaw phenomenon is one of the most outstanding characteristics of the soil in Heilongjiang Province. Quantitative analysis of the characteristics of changes in key variables of the soil freeze–thaw processes is of great scientific importance for understanding climate change, as well as ecological and hydrological processes. Based on the daily surface temperature and air temperature data in Heilongjiang Province for the past 50 years, the spatial–temporal distribution characteristics of key variables and their correlations with air temperature and latitude in the freeze–thaw process of soil were analyzed using linear regression, the Mann–Kendall test, the local thin disk smooth spline function interpolation method, and correlation analysis; additionally, the spatial–temporal distribution of key variables and the changes in the surface temperature during the freeze–thaw process are discussed under different vegetation types. The results show that there is a trend of delayed freezing and early melting of key variables of the soil freeze–thaw process from north to south. From 1971 to 2019 a, the freezing start date (FSD) was delayed at a rate of 1.66 d/10 a, the freezing end date (FED) advanced at a rate of 3.17 d/10 a, and the freezing days (FD) were shortened at a rate of 4.79 d/10 a; with each 1 °C increase in temperature, the FSD was delayed by about 1.6 d, the FED was advanced by about 3 d, and the FD was shortened by about 4.6 d; with each 1° increase in latitude, the FSD was delayed by about 2.6 d, the FED was advanced by about 2.8 d, and the FD was shortened by about 5.6 d. The spatial variation in key variables of the soil freeze–thaw process under the same vegetation cover was closely related to latitude and altitude, where the lower the latitude and altitude, the more obvious the variation trend; among them, the interannual variation trend of key variables of soil freeze–thaw under meadow cover was the most obvious, which varied by 9.65, 16.86, and 26.51 d, respectively. In addition, the trends of ground temperature under different vegetation types were generally consistent, with the longest period of unstable freeze–thaw and the shortest period of stable freeze in coniferous forests, compared to the shortest period of unstable freeze–thaw and the longest period of stable freeze in meadows. The results of the study are important for our understanding of soil freeze–thaw processes and changes in Heilongjiang Province, as well as the evolution of high-latitude permafrost; they also promote further exploration of the impact of soil freeze–thaw on agricultural production and climate change.

1. Introduction

Frozen ground, a variety of rocks and soils with temperatures at or below 0 °C and containing ice, is a product of heat exchange between the atmosphere and the land, and is known as an indicator of climate change [1], and its distribution is mainly at high altitudes and high latitudes [2]. In middle and high latitudes, the repeated freezing and thawing process of liquid water produced in the soil in late autumn or early spring, in the near ground layer and below a certain depth, is called the soil freeze–thaw process, which occurs due to diurnal and seasonal variations in temperature [3]. The freeze–thaw process is one of the typical surface features in cold regions and is an important indicator of the existence and development of frozen ground and climate change [4,5,6]. In addition, freeze–thaw processes affect the hydrological cycle [7,8,9], construction of infrastructure in cold regions [10,11], the balance of ecosystems, etc. [4,12,13].
Many studies addressed freeze–thaw processes; traditionally, studies of soil freeze–thaw processes were conducted mainly through station monitoring and finite-scale numerical simulations [14,15]. Wang et al. [16] used surface temperature (0 cm) data from 634 meteorological stations across the country to analyze soil freezing times near the surface in China, and the results show that the freezing days (FD) differed significantly between eastern and western China, mainly influenced by latitude in the east and elevation in the west. Rong et al. [17] used data from 58 meteorological stations to analyze the variation pattern of the soil freezing period in the Qinghai–Tibet Plateau, concluding that the freezing start date (FSD) was early and the freezing end date (FED) was late in the 1980s, while the FSD was late and the FED was early in the 1990s. Peng et al. [18] investigated the response of the seasonal freezing depth to climate change during 1950–2010, using Stefan’s empirical formula based on daily air and surface temperature data from 839 meteorological stations in China. Rong et al. [17] and Menzel et al. [19] analyzed the changes in the freezing and thawing state of soils with data from 41 meteorological stations in Germany and concluded that the FD of near-surface soils in Germany decreased with increasing temperatures. Henry [20] analyzed data from 31 meteorological stations in Canada and found a decreasing trend in the number of days of soil freezing near the surface. Wu et al. [21] analyzed the spatial and temporal trends of the freezing and thawing indices of 20 meteorological stations in Mongolia, and the results show that 70% of the stations showed an increasing trend of freezing and thawing indices. However, in many areas, for environmental reasons, monitoring stations are scarce, and so the time and range of monitoring are limited, which necessitates that studies focus on one point or a small area [22], meaning a numerical model must be applied. Guo et al. [23] combined the CLM4.0 model and high-resolution meteorological data to study the response of the freeze–thaw process to climate warming on the Qinghai–Tibet Plateau from 1981 to 2010, and they concluded that the FSD was delayed and the FED was advanced. In recent years, with the development of remote sensing technology, large-scale soil freeze–thaw studies were carried out [24]. Jin et al. [25] and Li et al. [26] developed a decision algorithm to study the spatial and temporal variability of near-surface soil freeze–thaw conditions in China and the plateau using SSM/I bright temperature data, and they concluded that the FD on the Qinghai–Tibet Plateau was delayed by about 10 days and the melting time was advanced by about 14 days. McDonald et al. [27] used SSM/I bright temperature data from 1988 to 2001 to identify major thaw transition events in Arctic and Alaskan springs using a step edge detection algorithm. Zhao et al. [28] combined AMSR-E bright temperature data with river MODIS LST data to develop high-resolution near-surface freeze–thaw state data, and they obtained good results in the Qinghai–Tibet Plateau region. Remote sensing technology has some degree of advantage over site monitoring, but some of the remote sensing data also have low spatial resolution and accuracy, and there are certain errors at smaller scales [29]. Therefore, each of the three methods, site monitoring, numerical simulation and remote sensing inversion, has its own advantages and disadvantages, and only by making full use of the advantages of all three can we achieve better research results in soil freezing and thawing studies.
Currently, studies on freeze–thaw processes are mainly focused on the northern hemisphere, among which in China, most focus on the Qinghai–Tibet Plateau region [16,18,30,31], mostly on the distribution characteristics of permafrost and freeze–thaw processes [32,33], while there are relatively few studies on soil freeze–thaw processes in the high-latitude permafrost region of northeast China. Of those that can be found, Chen et al. [34] studied freeze–thaw processes in two agricultural fields in northeast China during the winter of 2011–2012 using field monitoring, and they concluded that the freeze–thaw characteristics of paddy fields were different from those of drylands. Dong et al. [35] analyzed the freeze–thaw process in the active layer using soil temperature and humidity data collected from wetland observation sites in Daxinganling, and they concluded that the thawing process in the active layer is unidirectional, while freezing is bidirectional, and the thawing process takes longer time than the freezing process. Xu et al. [36] analyzed the characteristics of soil freezing and the thawing status of different land use types using Mann–Kendall trend analysis, the Sen slope, and Hurst index based on daily soil freezing and thawing depth data from various meteorological stations in Heilongjiang Province for the past 60 years, and the results show that the maximum seasonal freezing depth was reduced by about 48 cm, the FSD was advanced by about 6 d, and the FD was shortened by 21 d. Xu et al. [37], based on daily soil freezing depth and temperature data from 31 meteorological stations in Heilongjiang Province combined with CMIP6, analyzed the spatial and temporal evolution of permafrost continuity and the maximum freezing depth of seasonally frozen ground (SFG) in Heilongjiang Province from 1960 to 2014 and 2015 to 2100. Cui et al. [38] evaluated and analyzed the application of AMSR-2, SMOS, and SMAP soil moisture products in the Genhe region of China. The freezing and thawing process of soil is not only affected by climatic factors, but also closely related to latitude and longitude, altitude, vegetation cover type, and human activities. Chang et al. [39] analyzed the characteristics of soil freezing and thawing at different latitudes in the Changbai Mountains, and concluded that the higher the latitude, the greater the freezing depth, the longer the freezing and thawing cycle, the earlier the freezing, and the later the thawing. Xu et al. [36] explored the change characteristics of soil freezing and thawing under different land use types, and the results show that in woodland and grassland, vegetation coverage reduced the impact of climate warming on soil freezing and thawing. Ouyang et al. [40] found that soil freezing and thawing changes in farmland were more obvious than those in woodland and grassland. Yu et al. [41] analyzed that due to the heat island effect, soil freeze-thaw changes in urban areas were more pronounced than in other areas. However, there are limited studies on the effects of non-climatic factors on soil freezing and thawing [42].
Therefore, this paper takes Heilongjiang Province as the study area and uses the daily surface temperature data of 34 meteorological stations in Heilongjiang Province. The objectives of the study are (1) to analyze the spatial and temporal distribution characteristics of the first day of freezing, the last day of freezing, and the freezing time; (2) to explore the effects of temperature and latitude on the key variables of the soil freezing and thawing process; (3) to analyze the variation characteristics of the key variables of soil freezing and thawing under different vegetation cover types; and (4) to explore the effects of different vegetation cover types on the soil freezing and thawing process. The research results are not only of great significance for understanding the soil freezing and thawing process and its changes in Heilongjiang Province; in addition, Heilongjiang Province, as the province with the highest latitude and the most eastern longitude in China, is the distribution area of high-latitude permafrost in China, and is very sensitive to climate. At the same time, Heilongjiang Province is also the largest grain producing area. To explore the spatial differences of key variables in the soil freezing and thawing process and the sensitivity of the freezing and thawing process in different regions to climate change and other factors, for the research on basic engineering construction, agricultural production and climate change in Heilongjiang Province are all significant.

2. Study Area, Data Sources, and Methods
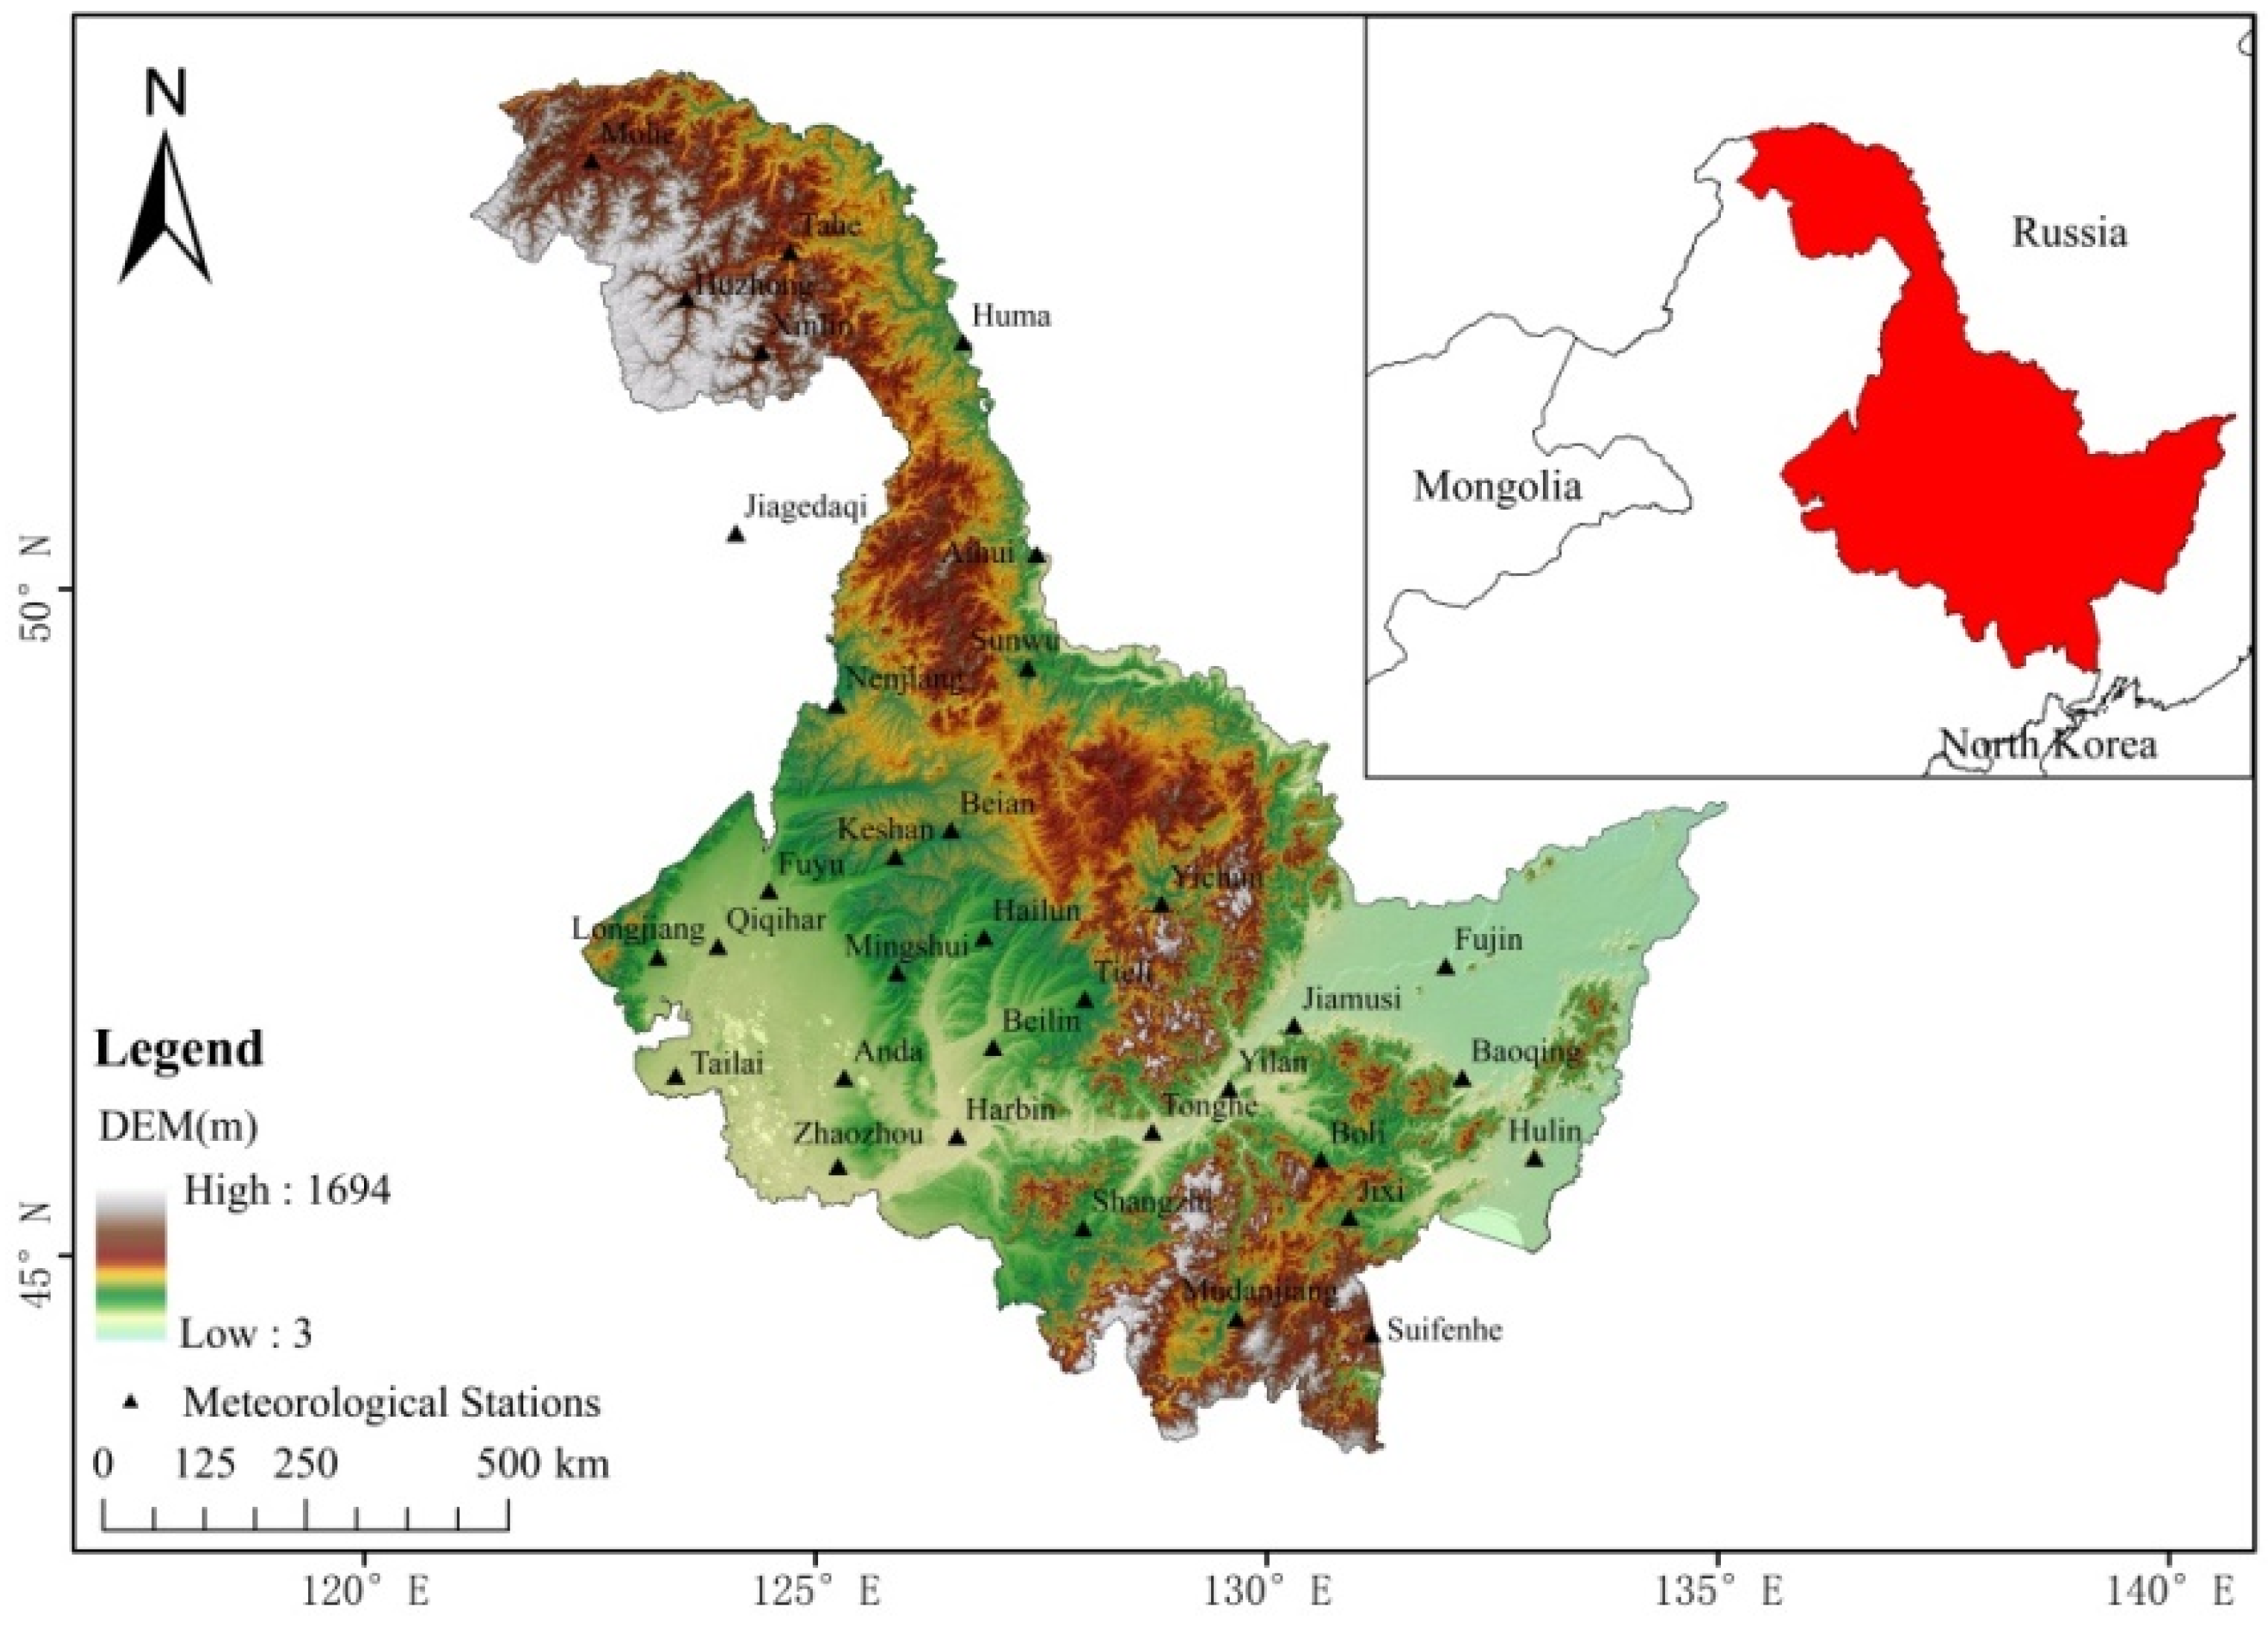
2.1. Study Area

Heilongjiang Province is located in northeastern China, at the southern edge of the permafrost zone in eastern Eurasia [43], between 121°11′ E–135°05′ E and 43°26′ N–53°33′ N (Figure 1). The area is 473,000 km2 (including the Jiagedaqi and Songling districts), with Russia to the north and east, Inner Mongolia to the west, and Jilin Province to the south. The terrain is roughly high in the northwest, north, and southeast and low in the northeast and southwest, consisting of mountains, terraces, plains, and water; it spans four major water systems: the Heilongjiang River, the Ussuri River, the Songhua River, and the Suifen River. The area has a cold temperate and temperate continental monsoon climate, and the main characteristics of the climate are low temperatures and aridity in spring, warm and rainy weather in summer, easy flooding and early frost in autumn, a cold and long winter, a short frost-free period, and large regional differences in climate [44]. It is also one of the largest forestry provinces in China [45,46] and one of the important grain-producing areas, among the highest grain-yielding provinces in China [47]. Meanwhile, Heilongjiang Province is also where high-latitude frozen ground can be found in China [48,49].

2.2. Data Sources

The meteorological data used in this paper were for the 0 cm surface temperature of 34 stations in Heilongjiang Province, provided by the National Meteorological Science Data Center of China (http://data.cma.cn/, accessed on 21 February 2022), including the daily maximum, daily minimum, daily average, and daily temperature data, with the time series from 1 January 1971 to 31 December 2020. The data used in this study were subjected to strict quality control before release, and a small number of outliers were excluded; the excluded data were interpolated with data from the same year (R2 > 0.95) from the nearby stations. The digital elevation data (DEM) of Heilongjiang Province were obtained from a digital surface model with a 30 m spatial resolution, provided by the Japan Aerospace Exploration Agency (JAXA). The vegetation types of Heilongjiang Province were extracted from the China 1:1 million vegetation dataset (https://www.resdc.cn/Default.aspx, accessed on 5 March 2022).

2.3. Analytical Methods

Since the freeze–thaw process of soils mostly starts in late autumn and ends in early spring, taking into account the actual climatic and geological characteristics of Heilongjiang Province, the complete year of the freeze–thaw cycle is defined in this paper as 9 September of one year to 31 August of the following year [30,36,50], meaning 1971–2020 forms 49 years of data. Regarding the definition of the soil freeze–thaw status, it is mainly judged based on the daily minimum and daily maximum temperatures of the surface or soil. Some scholars use the daily minimum temperature of the surface or soil below 0 °C as the basis for determining the freezing state of soil [16,51]. Some scholars also define the freezing state of soil by the criterion that the surface or soil daily minimum temperature is below 0 °C for 2 d [51] or 3 d [26] in a row [25,52]. Therefore, in this paper, the surface temperature of 0 °C is used as the threshold value for determining soil freezing and thawing. The key variables of the soil freeze–thaw process covered in this paper are the FSD, FED, and FD. The date when the minimum surface temperature falls below 0 °C for the first time is the FSD, the last time when the minimum surface temperature falls below 0 °C is the freeze end date, and the number of days between the FSD and the FED is the FD [16,51].
Linear trend fitting was used to analyze the trend of key variables, the Mann–Kendall trend analysis method was used to test the significance of the change trend of key variables, and the sliding t-test was used to test the authenticity of mutation points [45,53,54]. The spatial interpolation adopts the local thin-disk smooth spline function interpolation method to interpolate the key variables of the freezing and thawing process from the point scale to the regional scale [55,56]. When analyzing the spatial distribution of meteorological elements, this method fully considers the influence of altitude on meteorological elements, and uses altitude as a covariate, thereby improving the accuracy of the interpolation [57,58]. The Pearson correlation coefficient was deployed to examine the correlation between the soil F/T key variables and air temperature/altitude. Pearson’s correlation coefficient was deployed to examine the correlation between the soil F/T key variables and air temperature/altitude.

3. Results

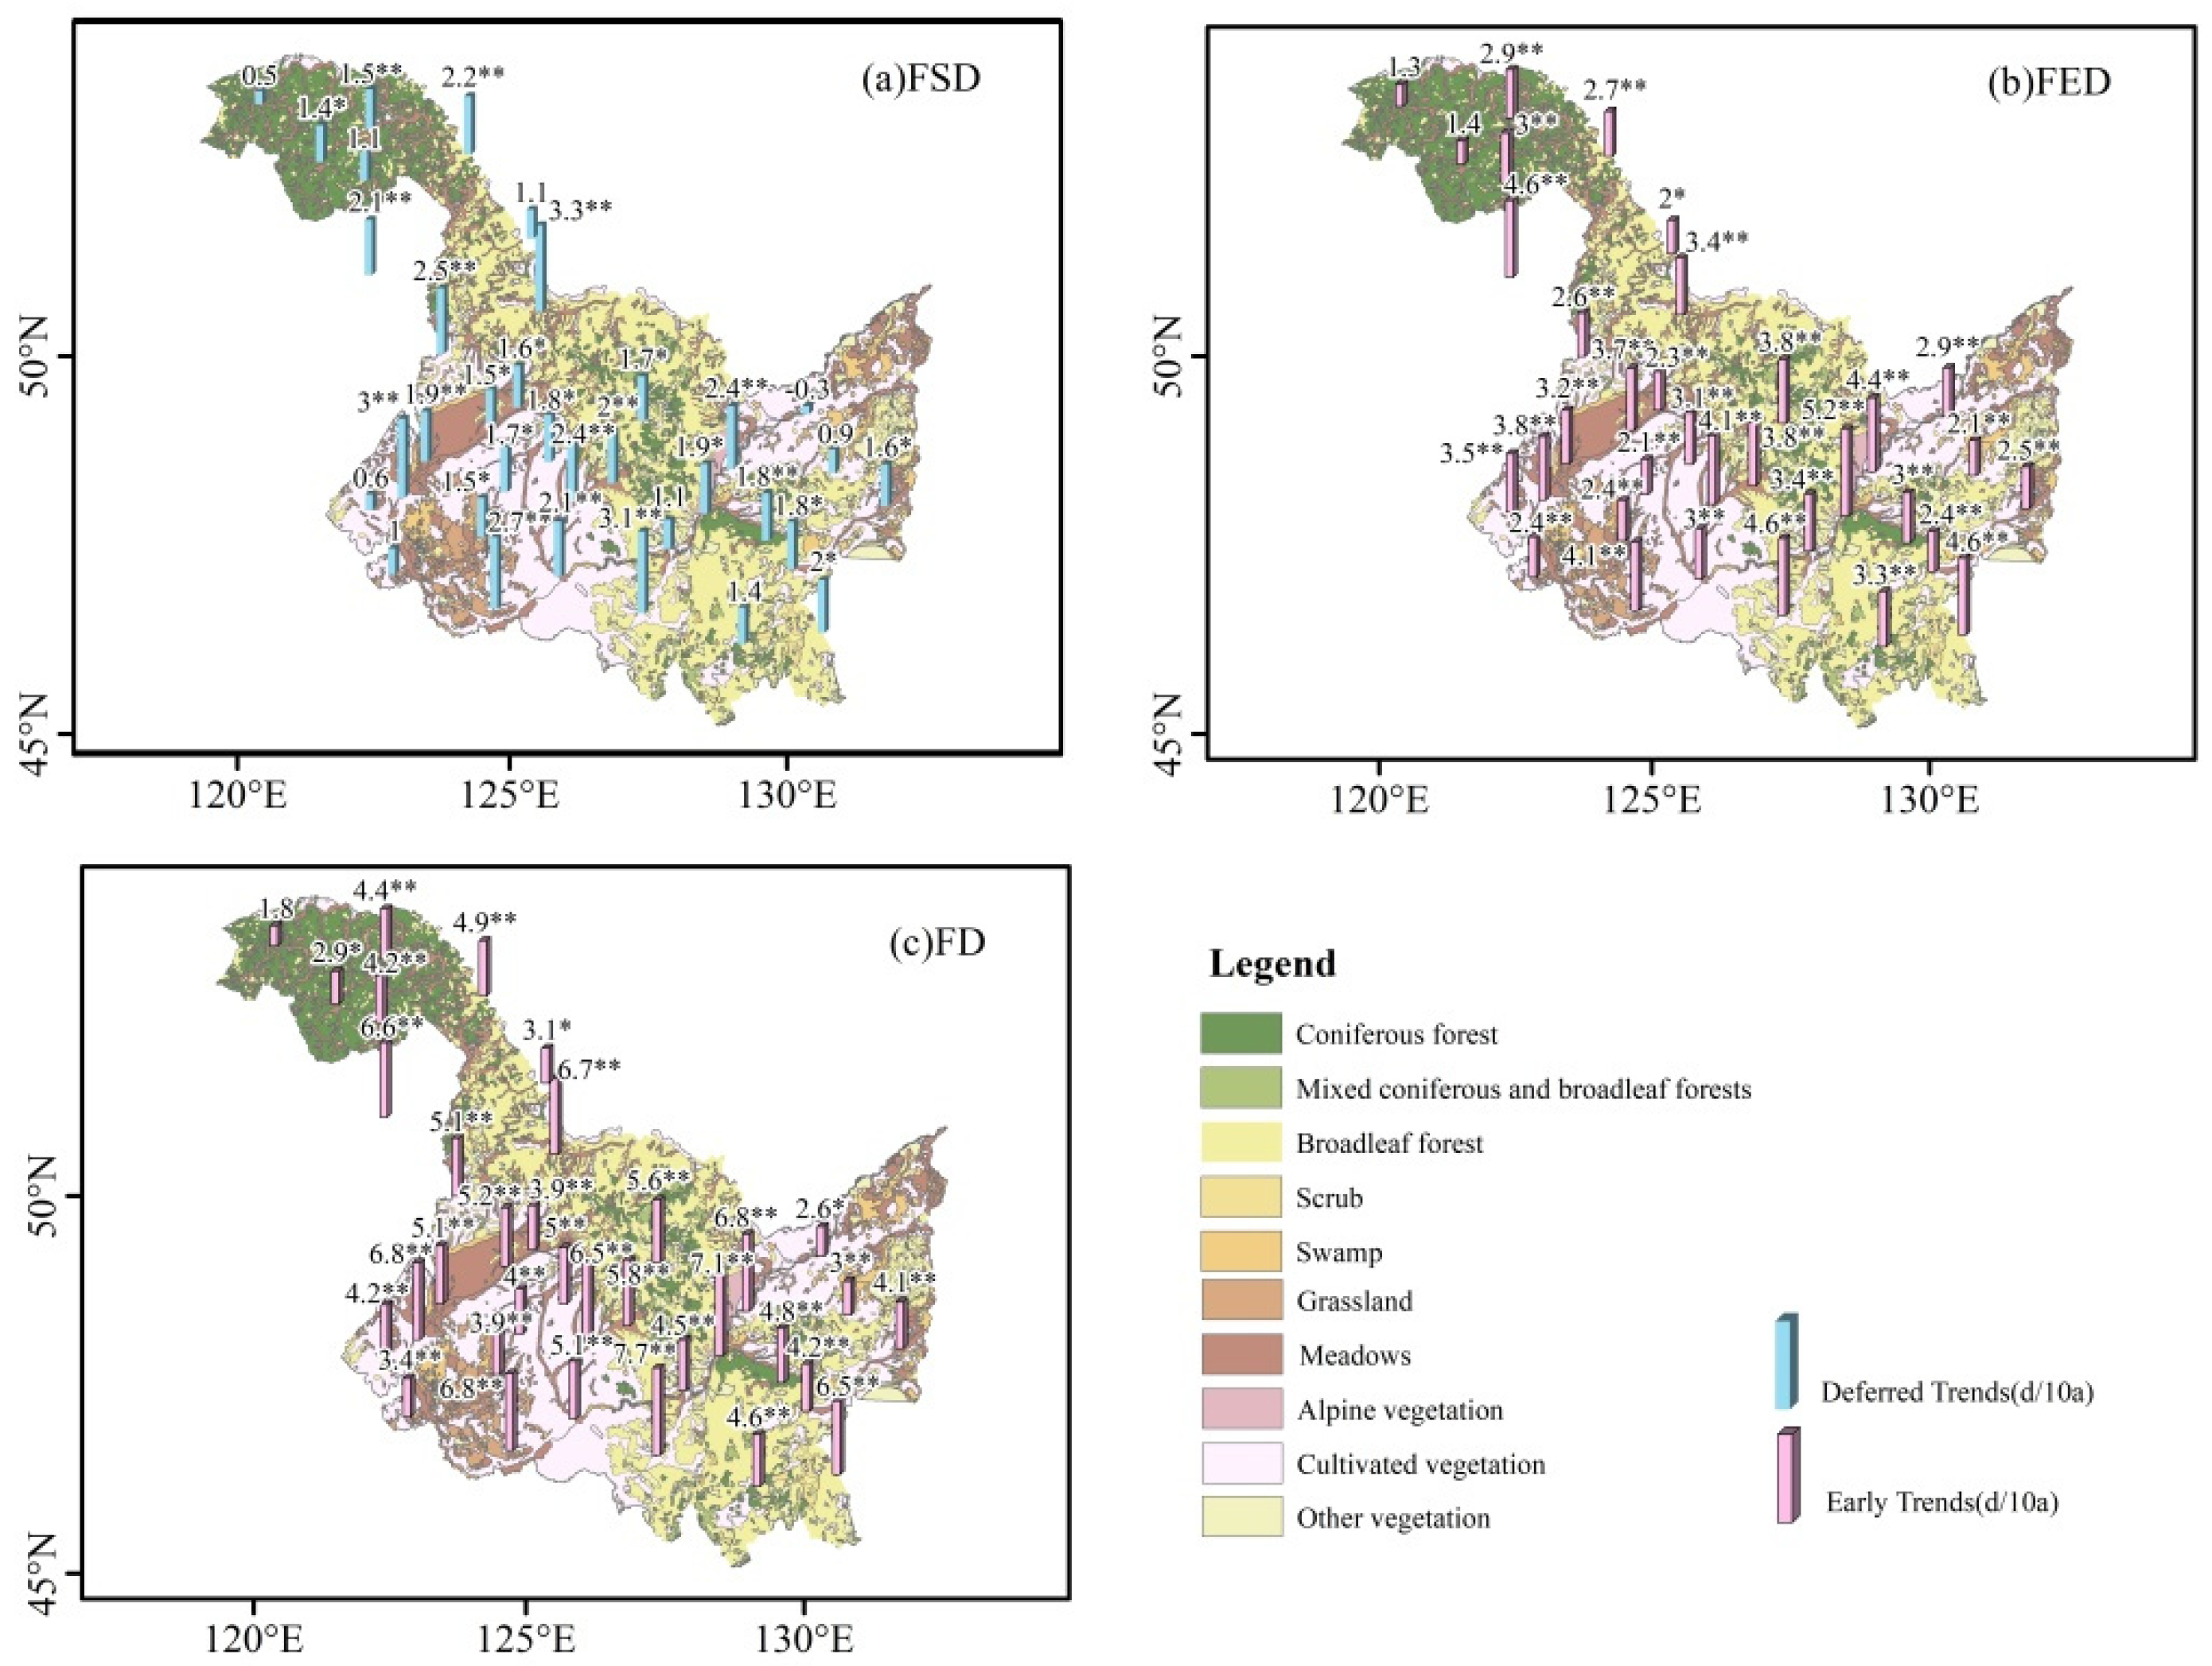
3.1. Spatial Distribution Characteristics of Key Variables of Soil Freezing and Thawing

Figure 2 shows the spatial distribution of key variables of the soil freezing and thawing process in Heilongjiang Province from 1971 to 2020. From Figure 2, it can be seen that freezing starts early, ends late, and lasts long in the Daxinganling area in northern Heilongjiang Province, mostly between 250 and 300 days. In the plain areas of the southwest and southeast, freezing starts late, concentrated in late September, and melting starts early, mostly in mid and early May, with a short duration, mostly between 206 and 230 days. In addition, in the multi-year permafrost area, there is a trend of early freezing on the first day, late freezing on the last day, and a long freezing time, meaning the number of freezing days is more than 240 days; in the seasonally frozen area, meanwhile, the trend is opposite. Accordingly, the FD is between 206 and 240 days. In general, there is a trend of delayed FSD, earlier FED, and shorter FD from north to south in Heilongjiang Province, with an obvious latitudinal trend. This is consistent with the findings of previous studies that freezing was delayed and melting was advanced in the Changbai Mountain area [39]. The main reason is due to the high latitude and altitude of the northern mountainous areas, which are mostly permafrost, while the southern areas also have relatively low latitudes and altitudes, low air and soil temperatures, and mainly SFG [25,59].

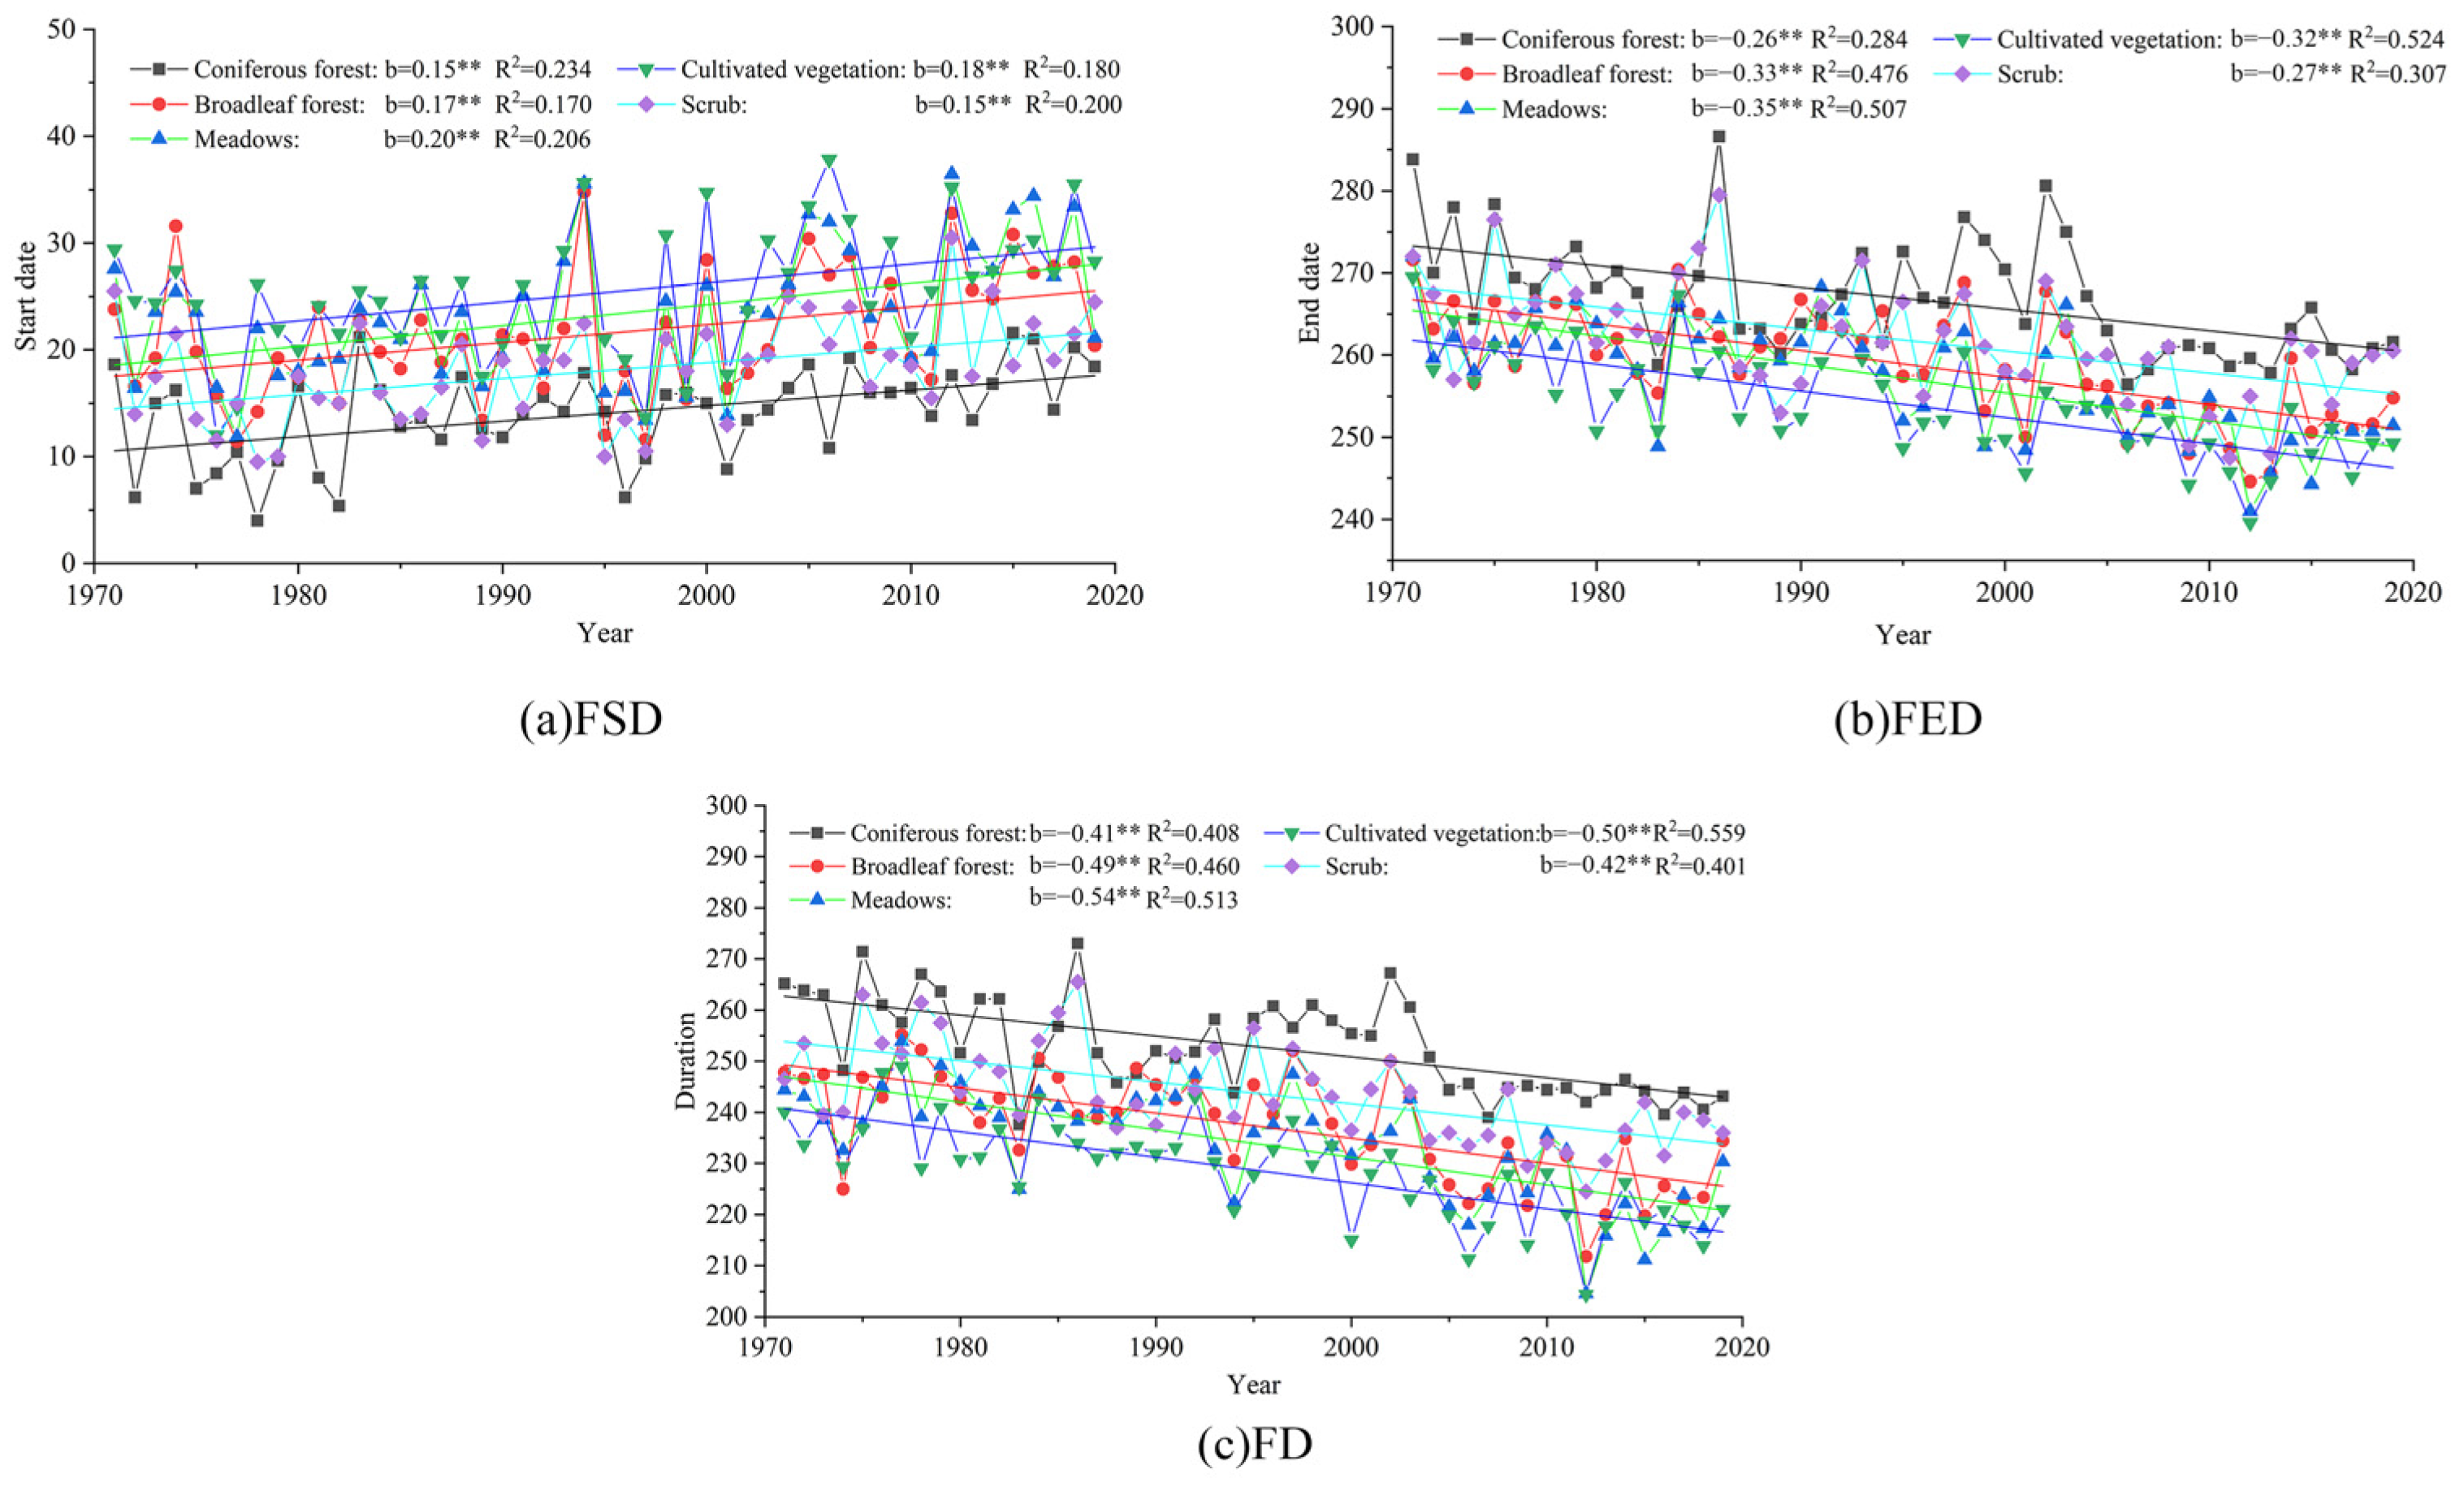
3.2. Interannual Distribution Characteristics of Key Variables of Soil Freezing and Thawing

The key variables of the soil freezing and thawing process in Heilongjiang Province were averaged across the overall area to determine their interannual variation, as shown in Figure 3. From 1971 to 2019, the three key variables of the soil freezing and thawing process in Heilongjiang Province showed significant trends with time. The earliest FSD was 18 August 1976, and the latest was 27 October 2016, with the average FSD around 21 September. The earliest last freezing date was 12 April 2016, and the latest was 28 June 1987, with the average freeze end date around 15 May. The average FD in Heilongjiang Province from 1971 to 2019 was 232.6 d. During the entire study period, the FSD was delayed by 8.1 d at a rate of 1.66 d/10 a, the FED advanced by 15.5 d at a rate of 3.17 d/10 a, and the FD was reduced by 23.6 d at a rate of 4.79 d/10 a. We used the M–K mutation test and the sliding t-test method to identify abrupt changes in key variables of the soil freeze–thaw process from 1971 to 2019, as shown in Figure 4. The annual trends of key variables were the same as above, and the results of the M–K test show that there was a sudden change in the FSD in 2002, as shown in Figure 4a; meanwhile, there was no sudden change in the FED and FD, as shown in Figure 4b–f. The mutation point of the FSD was tested by different steps of the sliding t-test method, but the mutation point did not pass the significance test of α = 0.05, as shown in Figure 4b, indicating it was a spurious mutation point. From the results of the M–K test and sliding t co-test, it was concluded that the trends of delayed FSD, early FSD, and a decrease in FD changed significantly from 1971 to 2019. This is consistent with the trends of permafrost changes in other regions [60,61].

4. Discussion

4.1. Correlation of Key Variables of Soil Freezing and Thawing with Temperature and Latitude

To further explore the influence of soil freeze–thaw-related factors and the climate on the soil freeze–thaw process in Heilongjiang Province, the correlations between key variables and the annual mean temperature and latitude were analyzed (Figure 5). To ensure the consistency between the changes to the soil freeze–thaw process and the changes in temperature, the annual mean temperature statistical period was from September to August of the following year. The results show that the soil freeze–thaw process in Heilongjiang Province was closely related to temperature and latitude. The correlations of the three key variables of the freeze–thaw process with the annual mean air temperature and latitude passed the 95% significance test; there were significant correlations with air temperature and latitude. The FSD was positively correlated with the annual mean temperature, and the FED and FD were negatively correlated with the annual mean temperature. Latitude is an important factor in determining the vertical distribution of mean temperature from north to south, which further determines the variation in the soil freezing and thawing process. In Heilongjiang Province, for each 1° increase in latitude, the FSD was 2.6 d earlier, the FED was 2.8 d later, and the FD was 5.4 d later. This was consistent with previous findings that permafrost changes in northeast China have a significant latitudinal effect [39], but the trends in the key variables differed. We propose that the main reason for this is that there are differences in the selection of meteorological stations, as well as the factors for judging the soil freezing and thawing thresholds.
Figure 6 shows the spatial distribution of the correlation coefficients between the key variables and the annual mean temperature for the soil freeze–thaw process at each site. The absolute values of the correlation coefficients between the key variables and the mean annual temperature ranged from 0.03 to 0.6, indicating that the key variables had a relatively significant correlation with the mean annual temperature. The proportions of stations passing the 0.05 significance test were 23.5, 47.1, and 64.7%, all concentrated in the southern region; the change in the annual mean temperature had the most significant effect on the FSD and the least effect on the FED; the FSD was positively correlated with the annual mean temperature, and the FED and the FD were negatively correlated with the annual mean temperature. The reason for this phenomenon is mainly the different bases for judging the FSD in terms of the freezing and thawing thresholds of soil, which can be difficult to determine, given that soils in SFG areas experience repeated freezing and thawing cycles during freezing [51,52].

4.2. Characteristics of Changes in Key Variables of Soil Freezing and Thawing Processes under Different Vegetation Types

To further investigate the changes in key variables of soil freezing and thawing processes under different vegetation cover types, the main vegetation types in Heilongjiang Province were extracted based on the 1:1 million vegetation dataset in China, as shown in Table 1. The main vegetation types in Heilongjiang Province are coniferous forest (13.3%), broadleaf forest (27.37%), meadow (15.97%), and cultivated vegetation (28.27%).
Figure 7a shows the trend of FSD under different vegetation cover types in Heilongjiang Province, which was significantly delayed (α = 0.01) under five vegetation types. During the study period, the FD was delayed by 7.15, 8.23, 9.65, 7.11, and 8.67 d for coniferous forest, broadleaf forest, meadow, scrub, and cultivated vegetation, respectively, with the least change in scrub and the greatest in meadows. As shown in Figure 7b,c, FED and FD varied significantly (α = 0.01) under all five vegetation types, with the FED 12.94, 16.07, 16.86, 13.23, and 15.83 d earlier, and the FD 19.6, 24.3, 26.51, 20.58, and 24.5 d shorter, respectively. Compared to coniferous forest and scrub, the trend of advancement was more obvious in broadleaf forest, meadow, and cultivated vegetation. Figure 8 shows the spatial distribution of key variables of the soil freezing and thawing process under different vegetation cover types. Most of the stations passed the significance test of 0.05; only the trends of the three key variables at Mohe station were not obvious and failed to pass the significance test. Under the same vegetation type, the variation in the FSD showed a trend where the lower the latitude, the more obvious the delay; the FED and the FD showed a trend where the lower the latitude, the more obvious the variation. Due to the latitudinal differences in vegetation distribution, the trends in the key variables of the freeze–thaw process also showed differences under the same vegetation type. Meanwhile, in the Songnen Plain and Sanjiang Plain, due to the low altitude, the change trends of the three key variables were all more significant than those in the northern and central mountainous areas. The main reason for these changes is that the vegetation layer has heat insulation, wind and snow blocking, and root water absorption properties [62,63], which can prevent cold airflow from entering the soil and impede soil heat dissipation during the cold season, delaying soil freezing [64,65,66]; in the warm season when the temperature rises, the vegetation reflects a lot of solar radiation, and the melting of snow and ice in the upper part of the soil layer in the forest consumes a lot of heat energy and hinders soil melting [67]. At the same time, the insulation effect and the weakening effect on solar radiation are obvious in coniferous forests compared to broadleaf forests, meadows, and cultivated vegetation due to the tall trees and the high-level structure of coniferous forests, along with thickets’ heavy branches and high vegetation cover [68].

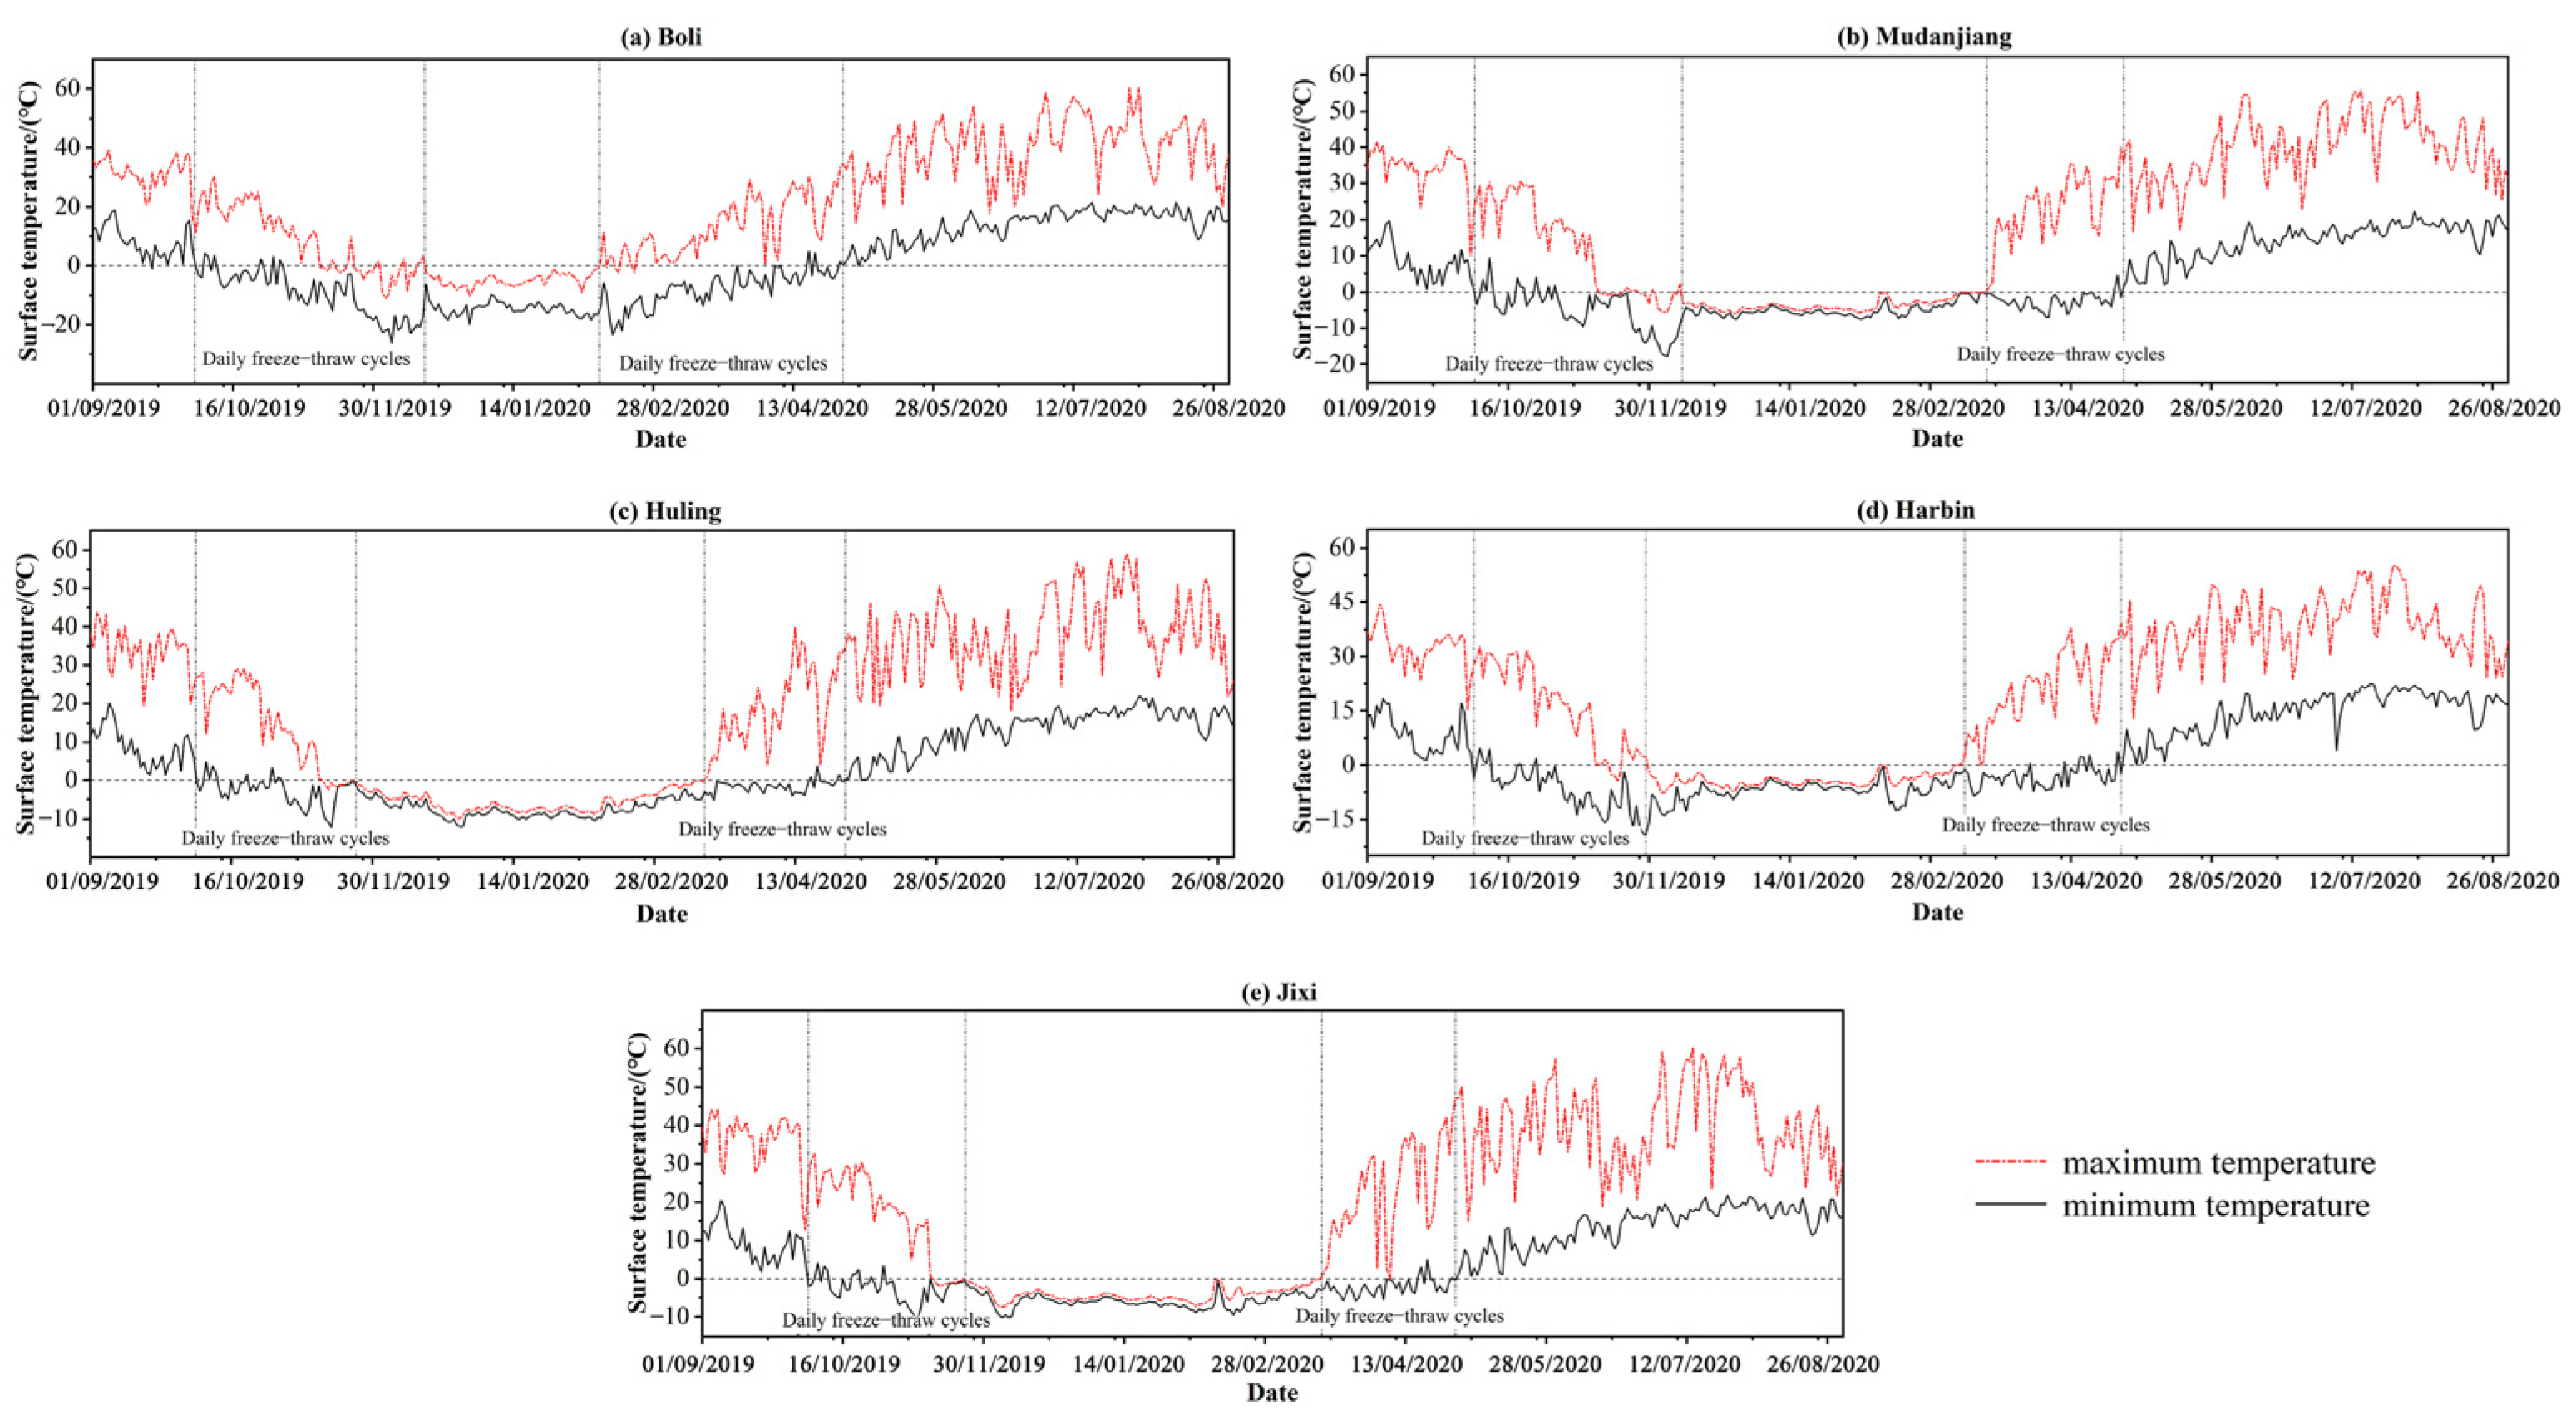
4.3. Changes in Surface Temperature during Freeze–Thaw Cycles at Representative Sites

To further explore the influence of different vegetation types on the surface temperature during the freeze–thaw process of the soil, five stations with similar latitudes and located in five different vegetation types were selected as representative stations to analyze the changes in the surface temperature during the freeze–thaw cycle. Considering the continuity and accuracy of the station data, the daily surface maximum and minimum temperatures for a complete freeze–thaw cycle year from 1 September 2019 to 31 August 2020 were selected and their variation curves were plotted, as shown in Figure 9.
According to the trends of surface maximum and minimum temperatures, the soil freeze–thaw process at all five stations in the whole freeze–thaw cycle year can be divided into three stages: a non-freezing period, unstable freeze–thaw period, and stable freeze–thaw period, where the unstable freeze–thaw period can be divided into an unstable freeze–thaw period and unstable thaw period [39,69], as shown in Table 2. It can be seen that the freezing start of the five sites is at the beginning of October and the freezing end is at the end of April or the beginning of May; as well as this, the timing of the whole freezing period tends to be consistent. The main reason is that the latitudes of the selected sites are similar, and latitude has an important influence on the soil freezing and thawing process, which is consistent with the conclusion obtained from the above analysis that the key variables of the soil freezing and thawing process have a large correlation with latitude. The longest period of unstable freezing was in coniferous forests, where soils ended their daily freeze–thaw cycle in mid-December; the shortest was in meadows and scrub, where the stable freezing period was reached in mid-November. The longest stable freeze period was 125 d for scrub, and the shortest was 56 d for coniferous forests. The longest unstable thaw period was 84 d for coniferous forests, where the daily freeze–thaw cycle began on 11 February and ended on 4 May. The shortest was 43 d for broadleaf forests and scrub. The unstable freezing period was the shortest and the stable freezing period was the longest in meadows. At the same time, the minimum negative temperature of coniferous forests was the largest and that of meadows was the smallest. The main reason for these characteristics is that coniferous forests, because of their high cover, reduce the rate of cold air entering the soil during the freezing period and reduce solar radiation during the thawing period, resulting in an increase in the time taken to complete freezing and then complete thawing [65,70,71]. With low cover and poor insulation, the soil quickly falls below zero degrees during the freezing period due to the decrease in temperature; then, the thawing period steadily shortens as the surface temperature also increases rapidly [64,66,71,72].

5. Conclusions

Heilongjiang Province is a high-latitude permafrost distribution area in China, rich in vegetation types. In this paper, using ground temperature and air temperature data from 34 meteorological stations in Heilongjiang Province, we studied the spatial distribution characteristics, interannual variation trends and correlation with air temperature and latitude of key variables of the soil freeze–thaw processes in Heilongjiang Province, analyzed the interannual and spatial variation trends of key variables under different vegetation types, and further explored the surface temperature variation in different vegetation types at the same latitude. The main conclusions drawn are as follows:
  • The spatial distribution of key variables of the soil permafrost process in Heilongjiang Province showed a trend of delayed FSD, earlier FED, and shorter FD from north to south, with a clear latitudinal trend. During the study period, the FSD was postponed by 8.1 d at a rate of 1.66 d/10 a, the FED was advanced by 15.5 d at a rate of 3.17 d/10 a, and the FD was shortened by 23.6 d at a rate of 4.79 d/10 a;
  • The soil freeze–thaw processes in Heilongjiang Province are significantly correlated with temperature and latitude. For every 1 °C rise in temperature, the FSD is delayed by about 1.6 d, the FED is advanced by about 3 d, and the FD is shortened by about 4.6 d; for every 1° rise in latitude, the FSD is advanced by 2.6 d, the FED is delayed by 2.8 d, and the FD is shortened by 5.4 d;
  • The trends in soil key variables under meadow cover were the most obvious, changing by 9.65, 16.86, and 26.51 d, respectively. The spatial variation in key variables of the soil freeze–thaw processes under the same vegetation was closely related to latitude and altitude; the lower the latitude and altitude, the more obvious the variation trend was, among which, the variation in key variables of soil freezing and thawing was the most significant in Sanjiang Plain and Songnen Plain of Heilongjiang Province;
  • The freeze–thaw process under all five vegetation types can be divided into a non-freezing period, unstable freeze–thaw period, and stable freeze–thaw period. Due to the different heat insulation and thermal insulation effects of different vegetation types, the unstable freeze–thaw period of coniferous forest is the longest and the stable freeze–thaw period is the shortest, while the unstable freeze–thaw period of meadows is the shortest and the stable freeze–thaw period is the longest. Correspondingly, the minimum negative temperature of coniferous forest is the highest, and that of meadows is the lowest.

Author Contributions

Conceptualization, C.S. and C.D.; methodology, C.S.; software, C.W.; validation, C.D., Y.G. and W.T.; formal analysis, M.Y.; investigation, Y.G. and W.T.; resources, C.D.; data curation, C.S.; writing—original draft preparation, C.S.; writing—review and editing, M.Y. and C.W.; visualization, C.S. and C.W.; funding acquisition, C.D. All authors have read and agreed to the published version of the manuscript.

Funding

This work was funded by the National Natural Science Foundation of China and the State Key Laboratory of Permafrost Engineering Open Fund Grant, and numbers are as follows: National Natural Science Foundation of China, No. 41202171, The State Key Laboratory of Permafrost Engineering Open Fund Grant, No. SKLFSE201310.

Institutional Review Board Statement

Not applicable.

Informed Consent Statement

Not applicable.

Data Availability Statement

The data presented in this study are openly available in (http://data.cma.cn/, accessed on 21 February 2022, https://www.resdc.cn/Default.aspx, accessed on 5 March 2022).

Conflicts of Interest

The authors declare that they have no conflict of interest.

References

  1. Pavlova, V. Current changes of climate and permafrost in the arctic and sub-arctic of Russia. Permafr. Periglac. Processes 1994, 5, 101–110. [Google Scholar]
  2. Obu, J.; Westermann, S.; Bartsch, A.; Berdnikov, N.; Christiansen, H.H.; Dashtseren, A.; Delaloye, R.; Elberling, B.; Etzelmüller, B.; Kholodov, A.; et al. Northern Hemisphere permafrost map based on TTOP modelling for 2000–2016 at 1 km2 scale. Earth-Sci. Rev. 2019, 193, 299–316. [Google Scholar]
  3. Chen, R.; Yang, M.; Wan, G.; Wang, X. Soil freezing-thawing processes on the Tibetan Plateau, A review based on hydrothermal dynamics. Prog. Geogr. 2020, 39, 1944–1958. [Google Scholar]
  4. Saito, K.; Zhang, T.; Yang, D.; Marchenko, S.; Barry, R.G.; Romanovsky, V.; Hinzman, L. Influence of the physical terrestrial Arctic in the eco-climate system. Ecol. Appl. 2013, 23, 1778–1797. [Google Scholar] [CrossRef] [PubMed]
  5. Zhang, T.; Armstrong, R.L.; Smith, J. Investigation of the near-surface soil freeze-thaw cycle in the contiguous United States, Algorithm development and validation. J. Geophys. Res. Atmos. 2003, 108, 8860. [Google Scholar] [CrossRef] [Green Version]
  6. Yang, M.; Yao, T.; Gou, X.; Koike, T.; He, Y. The soil moisture distribution, thawing–freezing processes and their effects on the seasonal transition on the Qinghai–Xizang (Tibetan) plateau. J. Asian Earth Sci. 2003, 21, 457–465. [Google Scholar] [CrossRef]
  7. Guo, D.; Yang, M.; Wang, H. Characteristics of land surface heat and water exchange under different soil freeze/thaw conditions over the central Tibetan Plateau. Hydrol. Processes 2011, 25, 2531–2541. [Google Scholar] [CrossRef]
  8. Genxu, W.; Tianxu, M.; Juan, C.; Chunlin, S.; Kewei, H. Processes of runoff generation operating during the spring and autumn seasons in a permafrost catchment on semi-arid plateaus. J. Hydrol. 2017, 550, 307–317. [Google Scholar]
  9. Chang, J.; Wang, G.; Li, C.; Mao, T. Seasonal dynamics of suprapermafrost groundwater and its response to the freeing-thawing processes of soil in the permafrost region of Qinghai-Tibet Plateau. Sci. China Earth Sci. 2015, 58, 727–738. [Google Scholar] [CrossRef]
  10. Hinkel, K.M.; Paetzold, F.; Nelson, F.E.; Bockheim, J.G. Patterns of soil temperature and moisture in the active layer and upper permafrost at Barrow, Alaska, 1993–1999. Glob. Planet. Chang. 2001, 29, 293–309. [Google Scholar] [CrossRef]
  11. Henry, H.A.L. Climate change and soil freezing dynamics, historical trends and projected changes. Clim. Chang. 2008, 87, 421–434. [Google Scholar] [CrossRef]
  12. Genxu, W.; Guangsheng, L.; Chunjie, L.; Yan, Y. The variability of soil thermal and hydrological dynamics with vegetation cover in a permafrost region. Agric. For. Meteorol. 2012, 162, 44–57. [Google Scholar] [CrossRef]
  13. Kreyling, J.; Beierkuhnlein, C.; Jentsch, A. Effects of soil freeze–thaw cycles differ between experimental plant communities. Basic Appl. Ecol. 2010, 11, 65–75. [Google Scholar] [CrossRef]
  14. Xie, Z.; Song, L.; Feng, X. A moving boundary problem derived from heat and water transfer processes in frozen and thawed soils and its numerical simulation. Science in China Series A, Mathematics. Sci. China Ser. A Math. 2008, 51, 1510–1521. [Google Scholar] [CrossRef]
  15. Sinha, T.; Cherkauer, K.A. Time Series Analysis of Soil Freeze and Thaw Processes in Indiana. J. Hydrometeorol. 2008, 9, 936–950. [Google Scholar] [CrossRef] [Green Version]
  16. Wang, K.; Zhang, T.; Zhong, X. Changes in the timing and duration of the near-surface soil freeze/thaw status from 1956 to 2006 across China. Cryosphere 2015, 9, 1321–1331. [Google Scholar] [CrossRef] [Green Version]
  17. Gao, R.; Wei, Z.; Dong, W. Interannual Variation of the Beginning Date and the Ending Date of Soil Freezing in the Tibetan Plateau. J. Glaciol. Geocryol. 2003, 25, 49–54. [Google Scholar]
  18. Peng, X.; Frauenfeld, O.W.; Cao, B.; Wang, K.; Wang, H.; Su, H.; Huang, Z.; Yue, D.; Zhang, T. Response of changes in seasonal soil freeze/thaw state to climate change from 1950 to 2010 across china. J. Geophys. Res. Earth Surf. 2016, 121, 1984–2000. [Google Scholar] [CrossRef]
  19. Menzel, A.; Jakobi, G.; Ahas, R.; Scheifinger, H.; Estrella, N. Variations of the climatological growing season (1951–2000) in Germany compared with other countries. Int. J. Climatol. 2003, 23, 793–812. [Google Scholar] [CrossRef]
  20. Henry, H.A.L. Soil Freezing Dynamics in a Changing Climate, Implications for Agriculture. In Proceedings of the Plant and Microbe Adaptations to Cold in a Changing World, New York, NY, USA, 14 September 2013; Springer: New York, NY, USA, 2013. [Google Scholar]
  21. Wu, T.; Wang, Q.; Zhao, L.; Batkhishig, O.; Watanabe, M. Observed trends in surface freezing/thawing index over the period 1987–2005 in Mongolia. Cold Reg. Sci. Technol. 2011, 69, 105–111. [Google Scholar] [CrossRef]
  22. Yang, M.; Yao, T.; Gou, X.; Hirose, N.; Fujii, H.Y.; Hao, L.; Levia, D.F. Diurnal freeze/thaw cycles of the ground surface on the Tibetan Plateau. Chin. Sci. Bull. 2007, 52, 136–139. [Google Scholar] [CrossRef]
  23. Guo, D.; Wang, H. Simulated change in the near-surface soil freeze/thaw cycle on the Tibetan Plateau from 1981 to 2010. Chin. Sci. Bull. 2014, 59, 2439–2448. [Google Scholar] [CrossRef]
  24. Zhang, T. Historical Overview of Permafrost Studies in China. Phys. Geogr. 2005, 26, 279–298. [Google Scholar] [CrossRef]
  25. Jin, R.; Li, X.; Che, T. A decision tree algorithm for surface soil freeze/thaw classification over China using SSM/I brightness temperature. Remote Sens. Environ. 2009, 113, 2651–2660. [Google Scholar] [CrossRef]
  26. Li, X.; Jin, R.; Pan, X.; Zhang, T.; Guo, J. Changes in the near-surface soil freeze–thaw cycle on the Qinghai-Tibetan Plateau. Int. J. Appl. Earth Obs. Geoinf. 2012, 17, 33–42. [Google Scholar] [CrossRef]
  27. Mcdonald, K.; Kimball, J.; Njoku, E.; Zimmermann, R.; Zhao, M. Variability in Springtime Thaw in the Terrestrial High Latitudes, Monitoring a Major Control on the Biospheric Assimilation of Atmospheric CO2 with Spaceborne Microwave Remote Sensing. Earth Interact. 2004, 8, 1–23. [Google Scholar] [CrossRef] [Green Version]
  28. Zhao, T.; Shi, J.; Hu, T.; Zhao, L.; Zou, D.; Wang, T.; Ji, D.; Li, R.; Wang, P. Estimation of high-resolution near-surface freeze/thaw state by the integration of microwave and thermal infrared remote sensing data on the Tibetan Plateau. Earth Space Sci. 2017, 4, 472–484. [Google Scholar] [CrossRef]
  29. Jin, R.; Zhang, T.; Li, X.; Yang, X.; Ran, Y. Mapping Surface Soil Freeze-Thaw Cycles in China Based on SMMR and SSM/I Brightness Temperatures from 1978 to 2008. Arct. Antarct. Alp. Res. 2015, 47, 213–229. [Google Scholar] [CrossRef] [Green Version]
  30. Frauenfeld, O.W.; Zhang, T.; Mccreight, J.L. Northern Hemisphere freezing/thawing index variations over the twentieth century. Int. J. Climatol. 2007, 27, 47–63. [Google Scholar] [CrossRef]
  31. Liu, W.; Wen, J.; Chen, J.; Wang, Z.; Lu, X.; Wu, Y.; Jiang, Y. Characteristic analysis of the spatio-temporal distribution of key variables of the soil freeze-thaw processes over the Qinghai-Tibetan Plateau. Cold Reg. Sci. Technol. 2022, 197, 103526. [Google Scholar] [CrossRef]
  32. Han, L.; Tsunekawa, A.; Tsubo, M. Monitoring near-surface soil freeze–thaw cycles in northern China and Mongolia from 1998 to 2007. Int. J. Appl. Earth Obs. Geoinf. 2010, 12, 375–384. [Google Scholar] [CrossRef]
  33. Gao, H.; Nie, N.; Zhang, W.; Chen, H. Monitoring the spatial distribution and changes in permafrost with passive microwave remote sensing. ISPRS J. Photogramm. Remote Sens. 2020, 170, 142–155. [Google Scholar] [CrossRef]
  34. Chen, S.; Ouyang, W.; Hao, F.; Zhao, X. Combined impacts of freeze–thaw processes on paddy land and dry land in Northeast China. Sci. Total Environ. 2013, 456–457, 24–33. [Google Scholar] [CrossRef]
  35. Dong, X.; Liu, C.; Li, M.; Ma, D.; Chen, Q.; Zang, S. Variations in active layer soil hydrothermal dynamics of typical wetlands in permafrost region in the Great Hing’an Mountains, northeast China. Ecol. Indic. 2021, 129, 107880. [Google Scholar] [CrossRef]
  36. Xu, S.; Fu, Q.; Li, T.; Meng, F.; Liu, D.; Hou, R.; Li, M.; Li, Q. Spatiotemporal characteristics of the soil freeze-thaw state and its variation under different land use types—A case study in Northeast China. Agric. For. Meteorol. 2022, 312, 108737. [Google Scholar] [CrossRef]
  37. Xu, S.; Liu, D.; Li, T.; Fu, Q.; Liu, D.; Hou, R.; Meng, F.; Li, M.; Li, Q. Spatiotemporal evolution of the maximum freezing depth of seasonally frozen ground and permafrost continuity in historical and future periods in Heilongjiang Province, China. Atmos. Res. 2022, 274, 106195. [Google Scholar] [CrossRef]
  38. Cui, H.; Jiang, L.; Du, J.; Zhao, S.; Wang, G.; Lu, Z.; Wang, J. Evaluation and analysis of AMSR-2, SMOS, and SMAP soil moisture products in the Genhe area of China. J. Geophys. Res. Atmos. 2017, 122, 8650–8666. [Google Scholar] [CrossRef]
  39. Chang, Z.; Qi, P.; Zhang, G.; Sun, Y.; Tang, X.; Jiang, M.; Sun, J.; Li, Z. Latitudinal characteristics of frozen soil degradation and their response to climate change in a high-latitude water tower. Catena 2022, 214, 106272. [Google Scholar] [CrossRef]
  40. Ouyang, W.; Wu, Y.; Hao, Z.; Zhang, Q.; Bu, Q.; Gao, X. Combined impacts of land use and soil property changes on soil erosion in a mollisol area under long-term agricultural development. Sci. Total Environ. 2018, 613–614, 798–809. [Google Scholar] [CrossRef]
  41. Yu, Z.; Guo, X.; Zeng, Y.; Koga, M.; Vejre, H. Variations in land surface temperature and cooling efficiency of green space in rapid urbanization, The case of Fuzhou city, China. Urban For. Urban Green. 2018, 29, 113–121. [Google Scholar] [CrossRef]
  42. Shiklomanov, N.I. Non-climatic factors and long-term, continental-scale changes in seasonally frozen ground. Environ. Res. Lett. 2012, 7, 011003. [Google Scholar] [CrossRef] [Green Version]
  43. Wei, Z.; Jin, H.; Zhang, J.; Yu, S.; Han, X.; Ji, Y.; He, R.; Chang, X. Prediction of permafrost changes in Northeastern China under a changing climate. Sci. China Earth Sci. 2011, 54, 924–935. [Google Scholar] [CrossRef]
  44. Fu, Q.; Zhou, Z.; Li, T.; Liu, D.; Hou, R.; Cui, S.; Yan, P. Spatiotemporal characteristics of droughts and floods in northeastern China and their impacts on agriculture. Stoch. Environ. Res. Risk Assess. 2018, 32, 2913–2931. [Google Scholar] [CrossRef]
  45. Zhou, Z.; Ding, Y.; Shi, H.; Cai, H.; Fu, Q.; Liu, S.; Li, T. Analysis and prediction of vegetation dynamic changes in China, Past, present and future. Ecol. Indic. 2020, 117, 106642. [Google Scholar] [CrossRef]
  46. Liu, C.; Zhang, L.; Li, F.; Jin, X. Spatial modeling of the carbon stock of forest trees in Heilongjiang Province, China. J. For. Res. 2014, 25, 269–280. [Google Scholar] [CrossRef]
  47. Pei, W.; Fu, Q.; Liu, D.; Li, T.-x.; Cheng, K.; Cui, S. Spatiotemporal analysis of the agricultural drought risk in Heilongjiang Province, China. Theor. Appl. Climatol. 2018, 133, 151–164. [Google Scholar] [CrossRef]
  48. Zhou, Z.; Shi, H.; Fu, Q.; Li, T.; Gan, T.Y.; Liu, S.; Liu, K. Is the cold region in Northeast China still getting warmer under climate change impact? Atmos. Res. 2020, 237, 104864. [Google Scholar] [CrossRef]
  49. Jin, H.; Li, S.; Cheng, G.; Shaoling, W.; Li, X. Permafrost and climatic change in China. Glob. Planet. Chang. 2000, 26, 387–404. [Google Scholar] [CrossRef]
  50. Wang, X.; Sun, J.; Tong, J.; Guan, X.; Bian, C.; Xia, S. Paper-Based Sensor Chip for Heavy Metal Ion Detection by SWSV. Micromachines 2018, 9, 150. [Google Scholar] [CrossRef] [Green Version]
  51. Anandhi, A.; Perumal, S.; Gowda, P.H.; Knapp, M.; Hutchinson, S.; Harrington, J.; Murray, L.; Kirkham, M.B.; Rice, C.W. Long-term spatial and temporal trends in frost indices in Kansas, USA. Clim. Chang. 2013, 120, 169–181. [Google Scholar] [CrossRef] [Green Version]
  52. Wang, Y.; Liu, H.; Chung, H.; Yu, L.; Mi, Z.; Geng, Y.; Jing, X.; Wang, S.; Zeng, H.; Cao, G.; et al. Non-growing-season soil respiration is controlled by freezing and thawing processes in the summer monsoon-dominated Tibetan alpine grassland. Glob. Biogeochem. Cycles 2014, 28, 1081–1095. [Google Scholar] [CrossRef]
  53. Shi, Y.; Niu, F.; Lin, Z.; Luo, J. Freezing/thawing index variations over the circum-Arctic from 1901 to 2015 and the permafrost extent. Sci. Total Environ. 2019, 660, 1294–1305. [Google Scholar] [CrossRef]
  54. Gocic, M.; Trajkovic, S. Analysis of changes in meteorological variables using Mann-Kendall and Sen’s slope estimator statistical tests in Serbia. Glob. Planet. Chang. 2013, 100, 172–182. [Google Scholar] [CrossRef]
  55. Ly, S.; Charles, C.; Degre, A. Different methods for spatial interpolation of rainfall data for operational hydrology and hydrological modeling at watershed scale. A review. Biotechnol. Agron. Soc. Environ. 2013, 17, 392–406. [Google Scholar]
  56. Longo-Minnolo, G.; Vanella, D.; Consoli, S.; Pappalardo, S.; Ramírez-Cuesta, J.M. Assessing the use of ERA5-Land reanalysis and spatial interpolation methods for retrieving precipitation estimates at basin scale. Atmos. Res. 2022, 271, 106131. [Google Scholar] [CrossRef]
  57. Hijmans, R.J.; Cameron, S.E.; Parra, J.L.; Jones, P.G.; Jarvis, A. Very high resolution interpolated climate surfaces for global land areas. Int. J. Climatol. 2005, 25, 1965–1978. [Google Scholar] [CrossRef]
  58. Hutchinson, M.F. Interpolating mean rainfall using thin plate smoothing splines. Int. J. Geogr. Inf. Syst. 1995, 9, 385–403. [Google Scholar] [CrossRef]
  59. Zhang, Z.; Hou, M.; Wu, Q.; Gao, S. Historical changes in the depth of seasonal freezing of “Xing’anling-Baikal” permafrost in China. Reg. Environ. Chang. 2019, 19, 451–460. [Google Scholar] [CrossRef]
  60. Liu, L.; Luo, D.; Wang, L.; Huang, Y.; Chen, F. Variability of soil freeze depth in association with climate change from 1901 to 2016 in the upper Brahmaputra River Basin, Tibetan Plateau. Theor. Appl. Climatol. 2020, 142, 19–28. [Google Scholar] [CrossRef]
  61. Alamusa Niu, C.; Zong, Q. Temporal and Spatial Changes of Freeze-Thaw Cycles in Ulan’aodu Region of Horqin Sandy Land, Northern China in a Changing Climate. Sci. Soc. Am. J. 2014, 78, 89–96. [Google Scholar] [CrossRef]
  62. Cannone, N.; Ellis Evansj, C.; Strachan, R.; Guglielmin, M. Interactions between climate, vegetation and the active layer in soils at two Maritime Antarctic sites. Antarct. Sci. 2006, 18, 323–333. [Google Scholar] [CrossRef]
  63. Kelley, A.M.; Epstein, H.E.; Walker, D.A. Role of vegetation and climate in permafrost active layer depth in arctic tundra of northern Alaska and Canada. J. Glaciol. Geocryol. 2004, 26, 269–274. [Google Scholar]
  64. Fedorov, A.N.; Konstantinov, P.Y.; Vasilyev, N.F.; Shestakova, A.A. The influence of boreal forest dynamics on the current state of permafrost in Central Yakutia. Polar Sci. 2019, 22, 100483. [Google Scholar] [CrossRef]
  65. Anderson, J.E.; Douglas, T.A.; Barbato, R.A.; Saari, S.; Edwards, J.D.; Jones, R.M. Linking vegetation cover and seasonal thaw depths in interior Alaska permafrost terrains using remote sensing. Remote Sens. Environ. 2019, 233, 111363. [Google Scholar] [CrossRef]
  66. Li, Y.N.; Guan, D.G.; Zhao, L.; Gu, S.; Zhao, X.Q. Seasonal frozen soil and its effect on vegetation production in Haibei alpine meadow. J. Glaciol. Geocryol. 2005, 27, 311–319. [Google Scholar]
  67. Cannone, N.; Guglielmin, M. Influence of vegetation on the ground thermal regime in continental Antarctica. Geoderma 2009, 151, 215–223. [Google Scholar] [CrossRef]
  68. Guglielmin, M.; Ellis Evans, C.J.; Cannone, N. Active layer thermal regime under different vegetation conditions in permafrost areas. A case study at Signy Island (Maritime Antarctica). Geoderma 2008, 144, 73–85. [Google Scholar]
  69. Guo, D.; Yang, M.; Wang, H. Sensible and latent heat flux response to diurnal variation in soil surface temperature and moisture under different freeze/thaw soil conditions in the seasonal frozen soil region of the central Tibetan Plateau. Environ. Earth Sci. 2011, 63, 97–107. [Google Scholar] [CrossRef]
  70. Jorgenson, M.; Romanovsky, V.; Harden, J.; Shur, Y.; O’Donnell, J.; Schuur, E.; Kanevskiy, M.; Marchenko, S. Resilience and Vulnerability of Permafrost to Climate Change. Can. J. For. Res. 2010, 40, 1219–1236. [Google Scholar] [CrossRef] [Green Version]
  71. Qin, Y.; Bai, Y.; Chen, G.; Liang, Y.; Li, X.; Wen, B.; Lu, X.; Li, X. The effects of soil freeze–thaw processes on water and salt migrations in the western Songnen Plain, China. Sci. Rep. 2021, 11, 3888. [Google Scholar] [CrossRef]
  72. Gao, Z.; Hu, X.; Li, X.-Y.; Li, Z.-C. Effects of freeze-thaw cycles on soil macropores and its implications on formation of hummocks in alpine meadows in the Qinghai Lake watershed, northeastern Qinghai-Tibet Plateau. J. Soils Sediments 2021, 21, 245–256. [Google Scholar] [CrossRef]
Figure 1. Study area and distribution of meteorological stations.
Water 14 02573 g001
Figure 2. Spatial distribution of FSD (a), FED (b) and FD (c) of the soil freeze–thaw processes in Heilongjiang Province from 1971 to 2020.
Water 14 02573 g002
Figure 3. Interannual variation in FSD (a), FED (b) and FD (c) of the soil freeze–thaw processes in Heilongjiang Province (** indicates reaching the significance level of α = 0.01).
Water 14 02573 g003
Figure 4. M–K mutation and sliding t-test of interannual variation in key variables of the soil freeze–thaw processes in Heilongjiang Province.
Water 14 02573 g004
Figure 5. Correlation analysis of the key variables with temperature (ac) and latitude (df) (** indicates reaching a significance level of α = 0.01, * indicates reaching a significance level of α = 0.05).
Water 14 02573 g005
Figure 6. Spatial distribution of correlation coefficients between annual mean temperature and key variables in Heilongjiang Province (* indicates reaching a significance level of α = 0.05 and ** indicates reaching a significance level of α = 0.01).
Water 14 02573 g006
Figure 7. Trends in key variables of the soil freeze–thaw processes under different vegetation cover types (** indicates reaching a significance level of α = 0.01).
Water 14 02573 g007
Figure 8. Spatial distribution of key variables of the soil freeze–thaw processes under different vegetation cover types (** indicates reaching a significance level of α = 0.01, * indicates reaching a significance level of α = 0.05).
Water 14 02573 g008
Figure 9. Changes in ground temperature during freeze–thaw cycles at representative sites of different vegetation types.
Water 14 02573 g009
Table 1. Classification of vegetation types at each station.
Vegetation TypeStation
Coniferous forestBoli, Jiagedaqi, Huzhong, Tahe, Mohe
Broadleaf forestSuifenhe, Mudanjiang, Yichun, Aihui, Huma
MeadowsHulin, Yilan, Tieli, Fuyu, Keshan, Beian, Sunwu
ScrubJixi, Xinlin
Cultivated vegetationShangzhi, Zhaozhou, Tonghe, Harbin, Anda, Baoqing, Tailai, Beilin, Jiamusi, Minshui, Fujin, Qiqihar, Hailun, Longjiang, Nengjiang
Table 2. Soil freeze–thaw process segments for the representative stations of the freeze–thaw cycle period of 2019–2020.
StationVegetation TypeLatitude/°Unstable Freeze PeriodStable Freeze PeriodUnstable Melting Period
HoursTime/dHoursTime/dHoursTime/d
BuriConiferous forest45.7510.40–12.167412.17–2.10562.11–5.4084
MudanjiangBroadleaf forest44.510.60–12.106612.11–3.17983.18–4.2943
HulinMeadow45.7710.50–11.144111.15–3.141213.15–4.2845
HarbinCultivated vegetation45.9310.50–11.295611.30–3.091013.10–4.2951
JixiScrub45.310.50–11.154211.15–3.141213.14–4.2945
Publisher’s Note: MDPI stays neutral with regard to jurisdictional claims in published maps and institutional affiliations.

