
Integrated Evaluation of Rivers Based upon the River Happiness Index (RHI): Happy Rivers in China

State Key Laboratory of Simulation and Regulation of Water Cycle in River Basin, China Institute of Water Resources and Hydropower Research, Beijing 100038, China
*
Author to whom correspondence should be addressed.
Water 2022, 14(16), 2568; https://doi.org/10.3390/w14162568
Submission received: 30 June 2022
/
Revised: 10 August 2022
/
Accepted: 15 August 2022
/
Published: 20 August 2022
(This article belongs to the Special Issue China Water Forum 2022)
Abstract
:How to better harmonize the relationship between humans and rivers is a global issue of widespread concern at home and abroad, and science-based and integrated evaluation of rivers themselves is crucial to river management. Based on Maslow’s hierarchy of needs and according to the World Happiness Report and the 2030 Agenda for Sustainable Development, this paper argues that a happy river is a river that can maintain its own health, support high-quality economic and social development in the river basin and the region, reflect harmony between humans and water, and give people in the river basin a high sense of security and the ability to gain and satisfaction. This paper also analyzes happy rivers at five levels, including water security, water resources, water environment, water ecology, and water culture, and develops the River Happiness Index (RHI) and its indicator system, as well as assesses the overall river happiness in China’s 10 first-grade water resource zones. The results show that China’s RHI is at a medium level, with flood control capacity at a near-good level. On the grounds of the RHI evaluation results, the paper puts forward targeted measures for river basin governance, and provides a systematic solution to national river protection and governance.
1. Introduction
Rivers nurtured material and spiritual civilizations of mankind, as well as played a decisive role in the origin, spread, and development of the world’s civilizations [1]. As the ecological health of rivers is closely linked to society, economy and environment, river protection and restoration is a hot area of domestic and international research. What is the relationship between humans and rivers, how to evaluate it, and how to better harmonize the relationship between human and rivers is a global issue of widespread concern at home and abroad.
European and American countries were the first to realize the importance of river governance in the middle of the 20th century. The United States set up the River Restoration Centre in the 1990s [2], which proposed the evaluation criteria for successful ecological restoration of rivers [3]. European countries established the European Centre for River Restoration (ECRR) and carried out a lot of work for river improvement and restoration, such as in the Rhine, the Mississippi, and the Colorado [4,5,6]. The 2030 Agenda for Sustainable Development, adopted in 2015, sets the goal of “ensuring availability and sustainable management of water and sanitation for all”, calling on countries to take action to protect and restore water-related ecosystems including rivers and lakes.
The Chinese government also attaches great importance to river basin governance and ecological protection and restoration. China fully implemented the river and lake chief system, and achieved initial results in six areas, including water resource conservation, water shoreline management, water pollution control, water environment management, water ecology restoration, and law enforcement [7,8,9,10]. On this basis, Beijing voiced the call to “make the Yellow River a happy river that benefits the people” in September 2019 [11]. The “Happy River” call, which builds itself upon a major national strategy and takes into account the bigger picture, has higher requirements and rich connotations. It is a new direction and requirement for river and lake governance in China, and also the outcome of China’s long-standing experience, practices, theories, and techniques in water management. It is not only of special importance to the Yellow River, but also of significant reference value for other river basins [12]. The call is a Chinese approach to the sustainable development agenda and a new path for river governance under the guidance of sustainable development.
Most of the studies on rivers at home and abroad focus on the evaluation of river health [13,14], and the indicators characterizing the health of rivers mainly measure water quality, aquatic life, and water environment. At present, the main methods for river health evaluation are predictive models and multimetrics. Predictive models, such as the River Invertebrate Prediction and Classification System (RIVPACS) [15] and the Australian River Assessment System (AUSRIVAS) [16], are river status evaluation models that monitor the biodiversity and functionality of river invertebrates. As for multimetrics, the US Index of Biological Integrity (IBI) [17] evaluates river health based on 12 indicators of river fish species, such as richness, diversity, and nutrition types; the Index of Stream Condition (ISCO) [18], developed by the Australian Department of Natural Resources and Environment, evaluates river health and the long-term effectiveness of restoration using 19 specific indicators in five categories, namely hydrology, physical form, riparian zone, water quality, and aquatic life; the UK River Habitat Survey (RHS) [19] evaluates the characteristics and habitat quality of a river by investigating channel data, the type of vegetation structure, riparian zone characteristics, land use, and other indicators based on the physical structure of the river. However, few of the indicators for river health evaluation involve socioeconomic dimensions, and the evaluation criteria can hardly be determined. Based on the concept of river health, the idea of building harmony between humans and water was gradually formed in the research on Chinese river evaluation starting in 2004, which posits that the human-water harmony is a well-coordinated virtuous cycle, and these two systems influence and adapt to each other over time, and jointly promote the overall harmonious development of human-water system [20]. Furthermore, an indicator system following the Health-Development-Harmony (H-D-H) principle was developed to measure the Human–Water Harmony Degree (HWHD) [21] and evaluate the effectiveness of river governance by integrating water resources with economic and social indicators.
Therefore, the objective of this paper is to establish a more integrated river evaluation system and clarify the complex relationship between human happiness and rivers. To this end, based on the existing river evaluation methods, the paper analyzes the happy river from the five levels of security, resources, environment, ecology, and culture, clarifies the scientific connotation of the happy river, develops the River Happiness Index (RHI) and its evaluation system, evaluates the overall situation of river happiness in 10 first-class water resource zones in China, and puts forward suggestions for the popularization and application of the RHI.
2. What Is a Happy River?
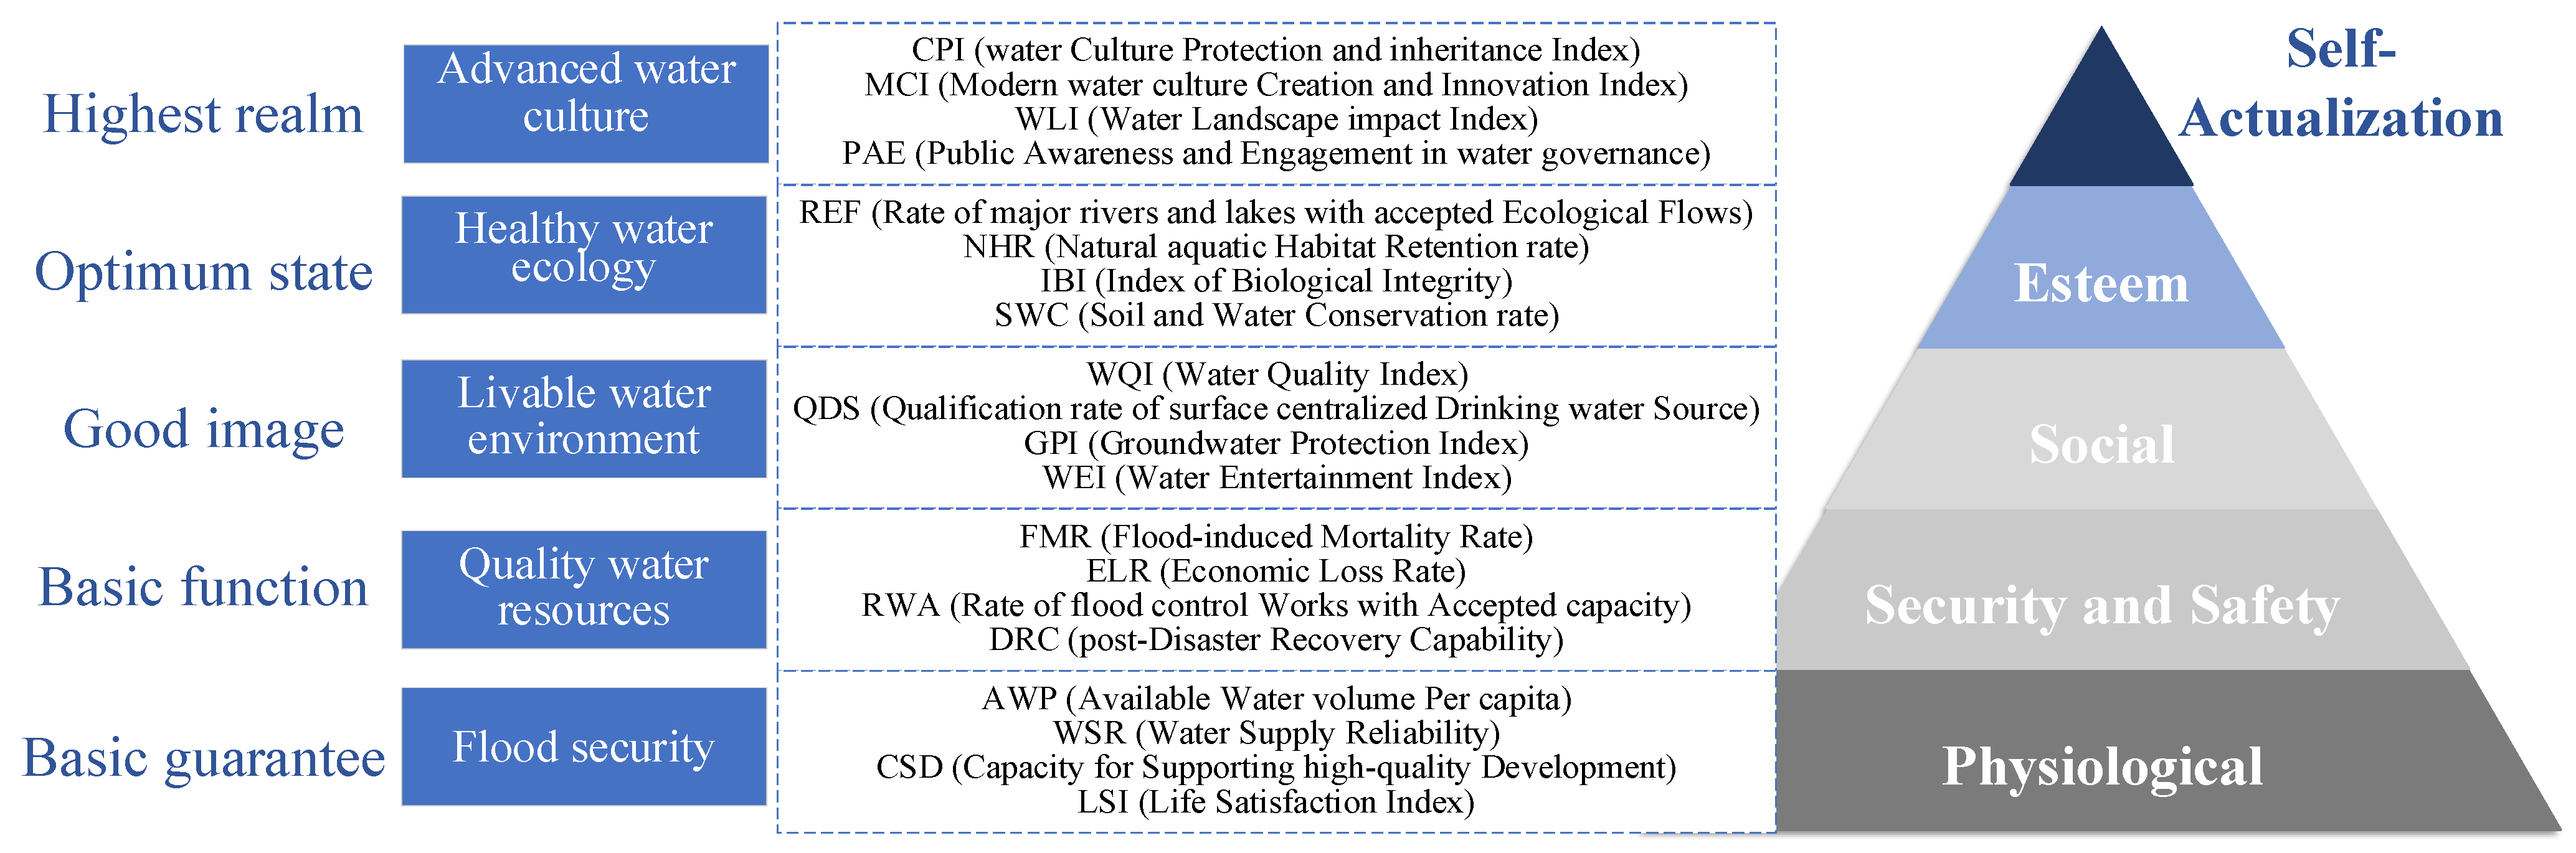
According to Maslow’s hierarchy of needs, humans have five levels of needs, namely physiological needs, security and safety needs, social belonging needs, esteem needs, and self-actualization needs, ranked from low to high [22]. A happy river is a river for the benefit of the people, which matches the hierarchy of human needs (Table 1).
In the light of factors influencing and measuring human happiness in the first World Happiness Report [23] released by the United Nations in 2012, the definition of a happy river, which is “a river that can maintain its own health, support high-quality economic and social development in the river basin and the region, reflect harmony between human and water and give people in the river basin a high sense of security, gain and satisfaction”, imposes stricter and more requirements on rivers [24]. A happy river is a river that meets the five needs of the people, including flood security, quality water resources, livable water environment, healthy water ecology, and advanced water culture, as well as achieves the unity of security, prosperity, livability, ecology, and culture [25,26].
In 2015, the United Nations Sustainable Development Summit officially adopted Transforming our world: the 2030 Agenda for Sustainable Development [27]. The agenda is composed of 17 Sustainable Development Goals (SGDs) and 169 targets, among which Goals 6, 9, 11, 13, and 15 are related to rivers (Table 2). As an integrated program for sustainable development in the area of river protection and restoration, the happy river indicator system is essentially consistent with the agenda.
Based on natural conditions and human needs, rivers that make humans happy should be people-centered and observe the concept of respecting, living in harmony with, and protecting nature; in other words, these rivers can maintain their own health, support high-quality economic and social development in corresponding river basins, reflect harmony between humans and water, and give people a high sense of security, gain, and satisfaction. The RHI evaluation system is more integrated than previous river evaluation indicators and theoretically innovative.
3. Materials and Methods
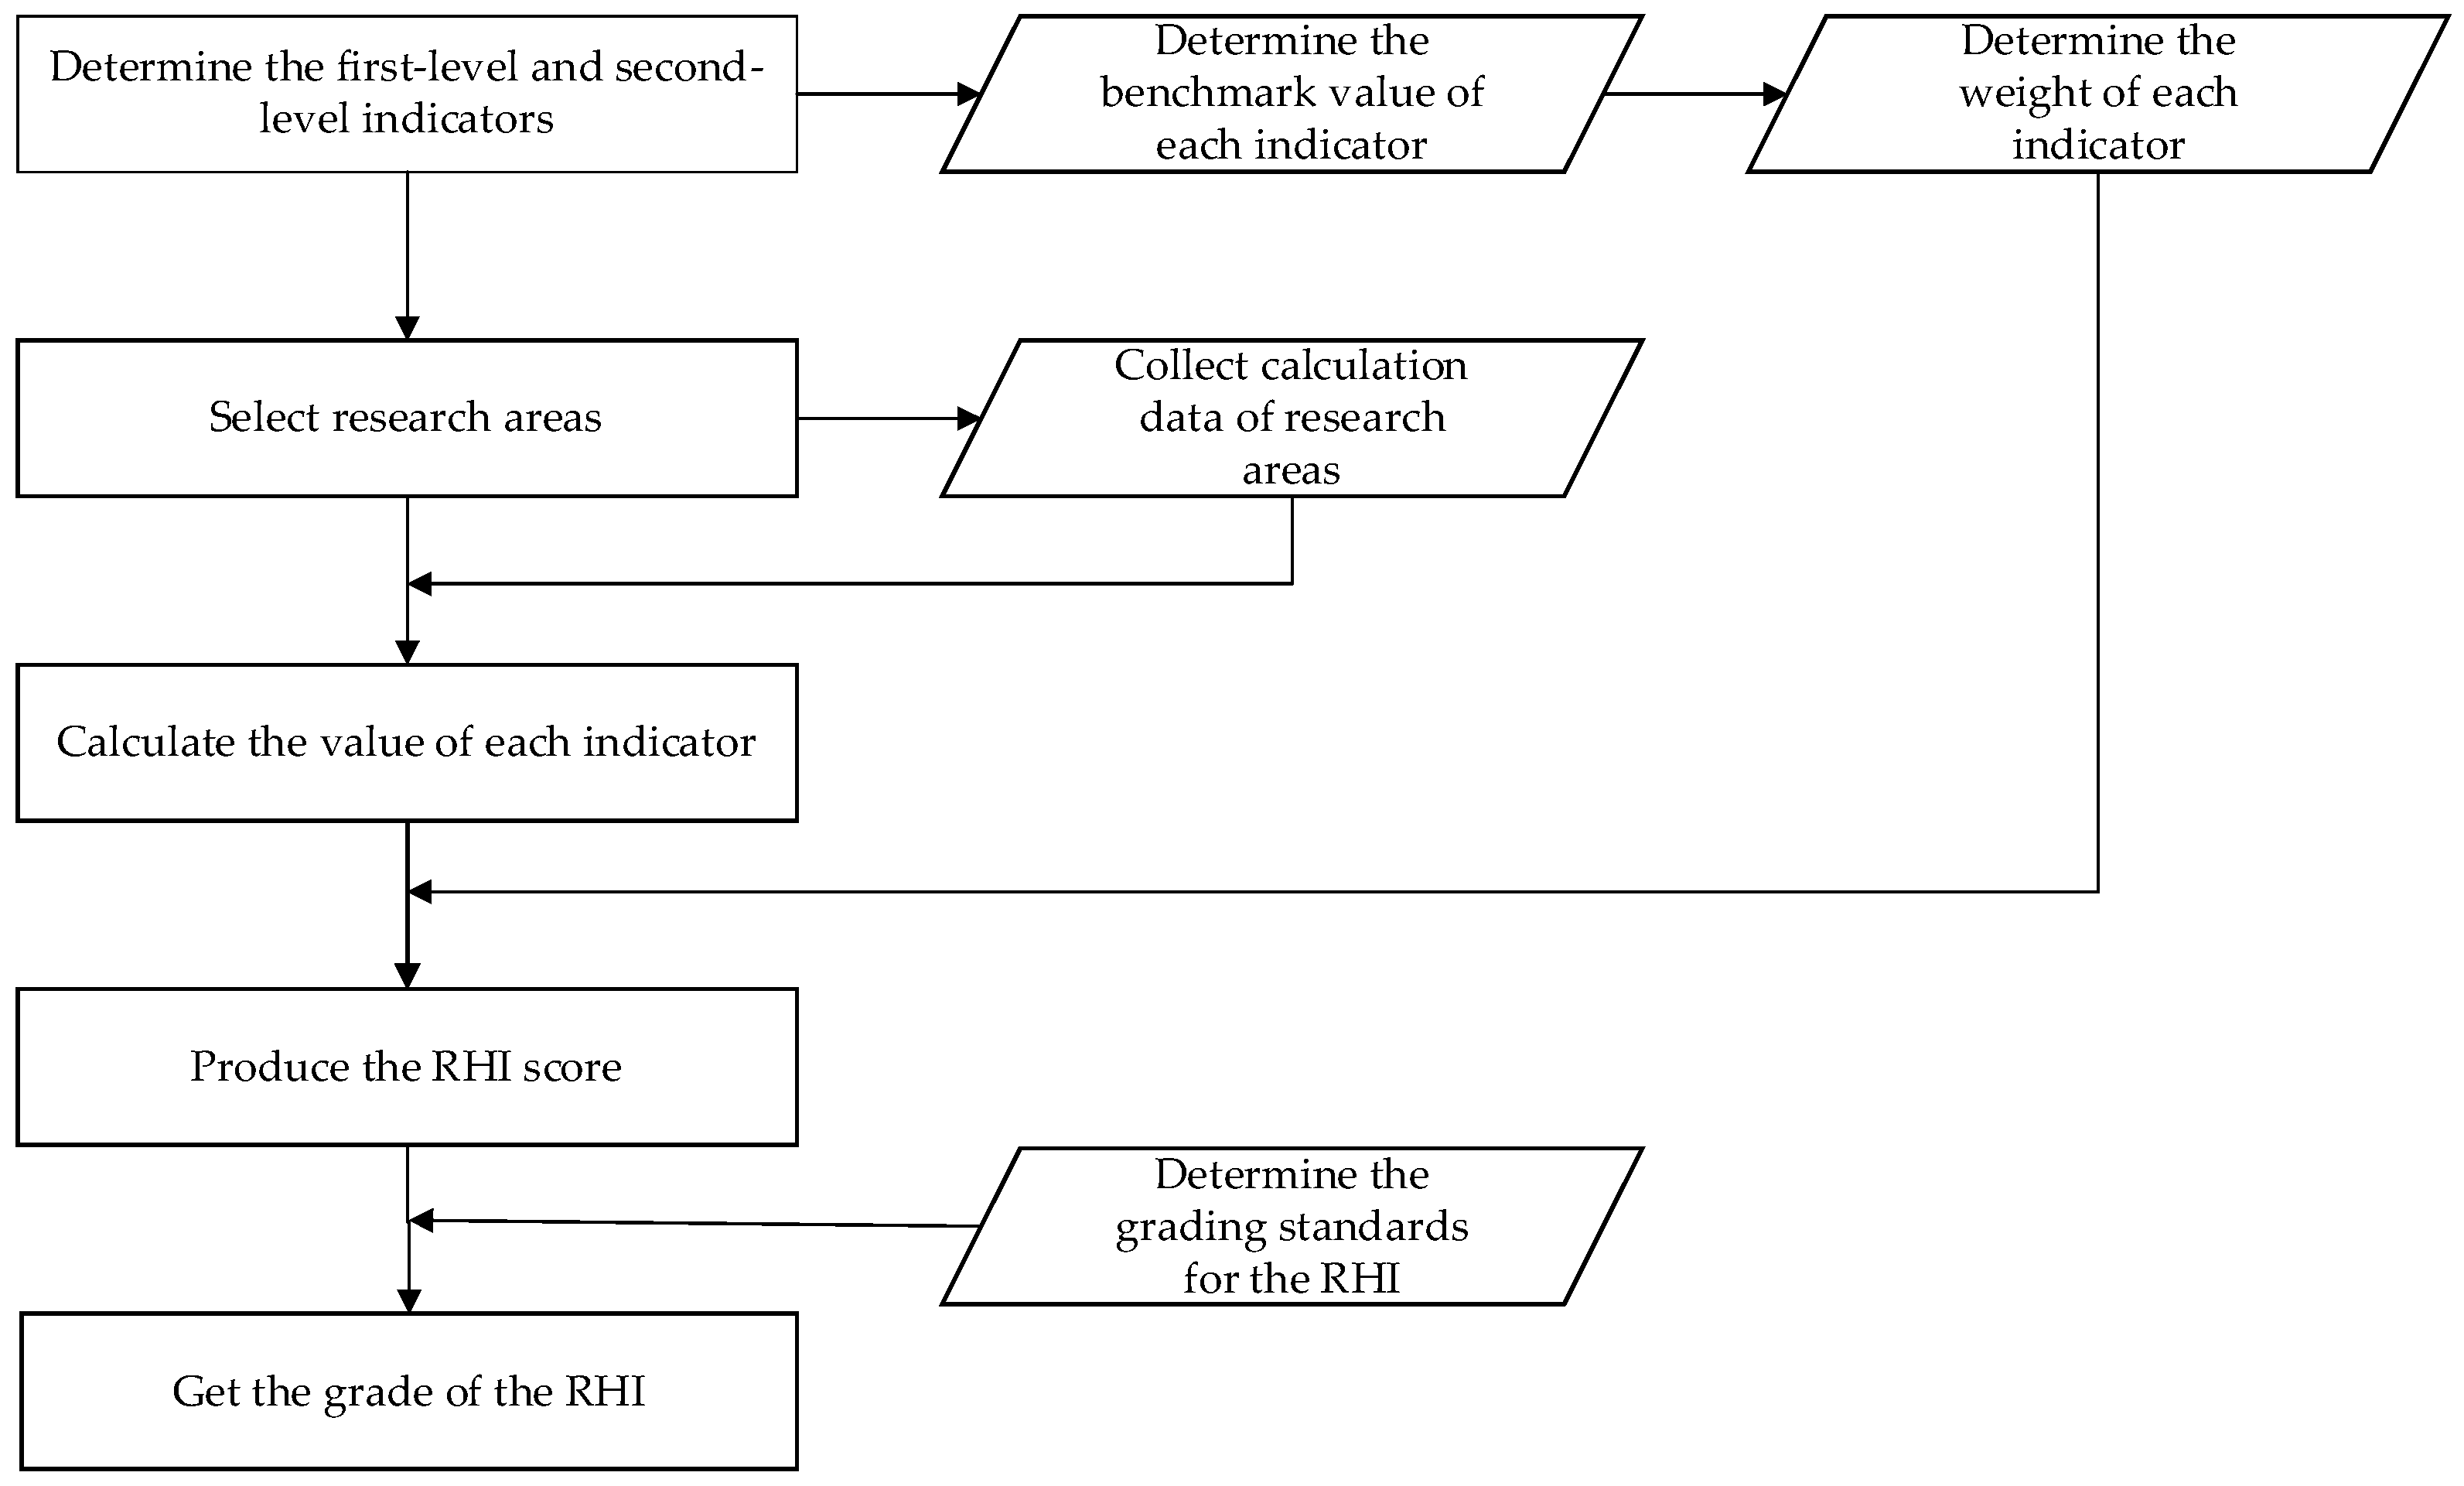
Figure 1 shows the calculation process of the River Happiness Index evaluation system.
3.1. Indicator System
A happy river is a river of security, prosperity, livability, ecology, and culture. Hence, this paper develops evaluation indicators from these five perspectives to give a more complete and accurate evaluation of rivers, and proposes state indicators that characterize human experience of happiness and river health, as well as indicators of capacity for achieving or maintaining a good state (Figure 2).
- Flood Control Capacity (FCC): FCC means the extent to which water disasters are prevented and controlled. In line with the vision of “a peaceful life with secure rivers”, FCC is characterized by state indicators, such as Flood-induced Mortality Rate (FMR), Economic Loss Rate (ELR), and engineering and management capacity indicators, such as Rate of flood control Works with Accepted capacity (RWA) and post-Disaster Recovery Capability (DRC).
- Water Resources Reliability (WRR): WRR means the capacity of water resources for supporting sustainable economic and social development. In line with the vision of “an affluent life with reliable water supply”, indicators such as Available Water volume Per capita (AWP) and Water Supply Reliability (WSR) are selected to characterize the condition of water resources and the availability of water resources; indicators such as Capacity for Supporting high-quality Development (CSD) and the Life Satisfaction Index (LSI) are selected to characterize the extent to which development and happiness are constrained by water resources.
- Water Environment Livability (WEL): WEL refers to the degree of protection and improvement of the water environment of natural rivers and lakes in urban and rural areas. In line with the vision of “a livable environment with clear waters and green banks”, WEL is characterized by state indicators, such as the Water Quality Index (WQI), Qualification rate of surface centralized Drinking water Source (QDS), and the Groundwater Protection Index (GPI), and experience indicators, such as the Water Entertainment Index (WEI).
- Aquatic Ecosystem Health (AEH): AEH refers to the extent to which the health of river ecosystems is maintained and the quality and stability of river ecosystems is improved. Given the vision of “a symbiotic harmony with fish swimming in shallows”, shrinking rivers and lakes, wetland degradation and biodiversity decline remain weak links. In this sense, AEH is characterized by indicators, such as the Rate of major rivers and lakes with accepted Ecological Flow (REF), Natural aquatic Habitat Retention rate (NHR), Index of Biological Integrity (IBI), and Soil and Water Conservation rate (SWC) in terms of flow, habitat, biology and land area, respectively.
- Water Culture Prosperity (WCP): WCP means the extent to which water culture is promoted. In line with the vision of “a spiritual homeland with river civilizations”, WCP is characterized by capacity indicators, such as the water Culture Protection and inheritance Index (CPI) and the Modern water culture Creation and Innovation Index (MCI), as well as human experience indicators, such as the Water Landscape impact Index (WLI) and Public Awareness and Engagement in water governance (PAE).
In summary, indicators in the five dimensions, such as water security, water resources, water environment, water ecology, and water culture are broken down into 20 second-level indicators and 18 third-level indicators. See Table 3 for the framework of the RHI indicator system.
3.2. Assessment Criteria
The River Happiness Index (RHI) is an integrated index that reflects the capacity and level of rivers and lakes to stay in good condition, meet human needs, or provide services, and is specifically measured by five indicators, namely water security, water resources, water environment, water ecology, and water culture. The RHI is calculated through the following formulas:
where, RHI means River Happiness Index; Fi is the score of the first-level indicator i, i is the subscript of the first-level indicator, which ranges from 1 to 5, indicating FCC, WRR, WEL, AEH, and WCP, respectively; is the weight of the first-level indicator i; Si,j is the score of the second-level indicator j of the first-level indicator i, j is the subscript of the second-level indicator, which ranges from 1 to 4; is the weight of the second-level indicator j of the first-level indicator i; Ti,j,k is the score of the third-level indicator k of the second-level indicator j of the first-level indicator i, and k is the subscript of the third-level indicator, which ranges from 1 to K; and is the weight of the third-level indicator k of the second-level indicator j of the first-level indicator i.
3.3. Indicator Weight Calculation and Evaluation Method
The evaluation method involves five steps:
- Determine the benchmark value of each indicator. The benchmark values are determined in line with national policies, economic and social development plans, spatial plans of national land, and technical standards; comprehensive and special plans for river basins; advanced levels at home and abroad; and research results of authoritative organizations and research institutes at home and abroad.
- Calculate the value of each indicator. The values are calculated according to relevant statistical yearbooks, field survey data, and plans.
- Determine the weight of each indicator. The weights are determined by taking into account the characteristics of river basins, socioeconomic conditions, and the opinions of the people. Weights of first-level and second-level indicators are listed in Table 6, which are mainly determined by the expert comprehensive evaluation method. The weights were initially determined by 24 experts and scholars present through a questionnaire, then validated by another 35 experts.
- Produce the RHI score. The score of each indicator is calculated by multiplying the value of each indicator by its weight and the sum of the scores of all indicators is the RHI score.
- Determine the grade of the RHI according to the grading standards for the RHI.
3.4. Data
With 2019 selected as the research year, this paper studies China’s 10 first-grade water resource zones, including the Songhua River, the Liaohe River, the Haihe River, the Yellow River, the Huaihe River, the Yangtze River, the Taihu Lake, southeastern rivers, the Pearl River, southwestern rivers, and northwestern rivers, and calculates the values of the indicators by reference to relevant statistical yearbooks, field survey data, and plans (Table 7).
4. Results
4.1. Flood Control Capacity (FCC)
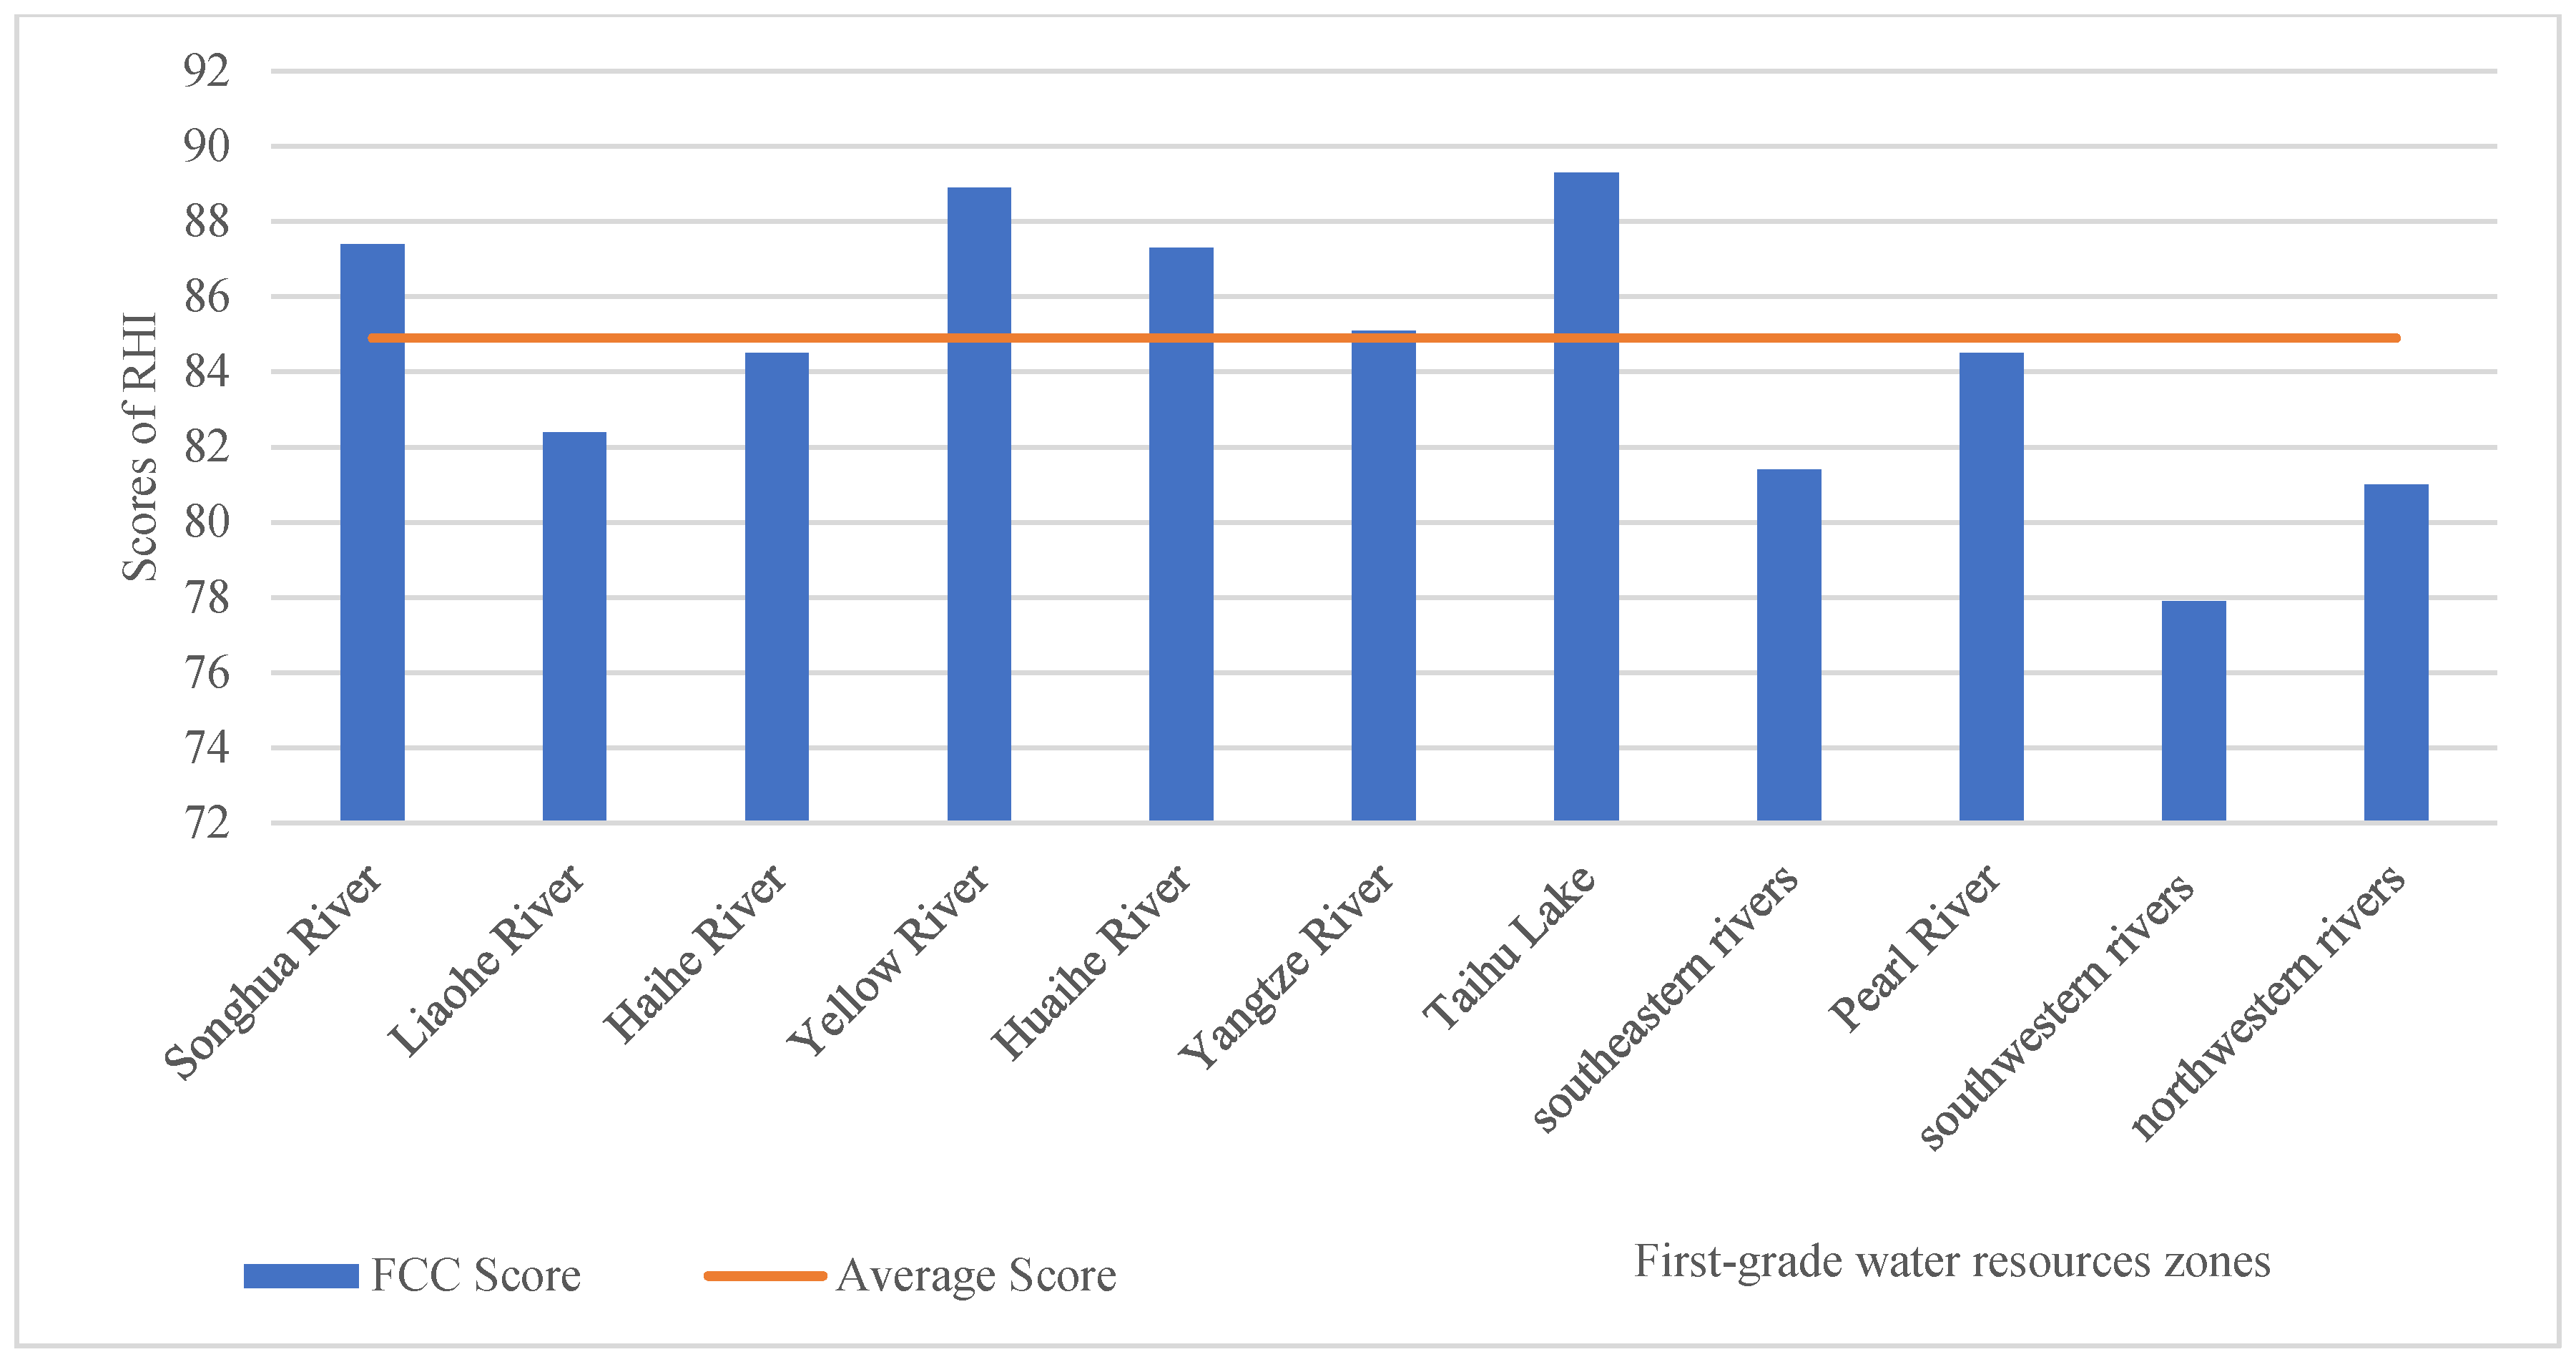
FCC scores 84.9 points nationwide, which is at a medium-high level. The overall flood control capacity nationwide is: the overall RWA reached a medium-high level, and although DRC is still at a medium level, the impact of floods on the security of lives and properties of the people along the rivers was significantly reduced. Nationally, the sense of security of the people along the rivers was effectively guaranteed, laying a foundation for achieving the vision of “a peaceful life with secure rivers”.
FCC evaluation results for the first-grade water resource zones are shown in Figure 3. Specifically, FCC scores for the Taihu Lake, the Yellow River, the Huaihe River, the Songhua River, and the Yangtze River all exceed 85 points, reaching a good level, and exceed 80 points for the Pearl River, the Haihe River, the Liaohe River, southeastern rivers, and northwestern rivers, staying at a medium-high level. Southwestern rivers score less than 80 points on FCC, representing a medium level.
4.2. Water Resources Reliability (WRR)
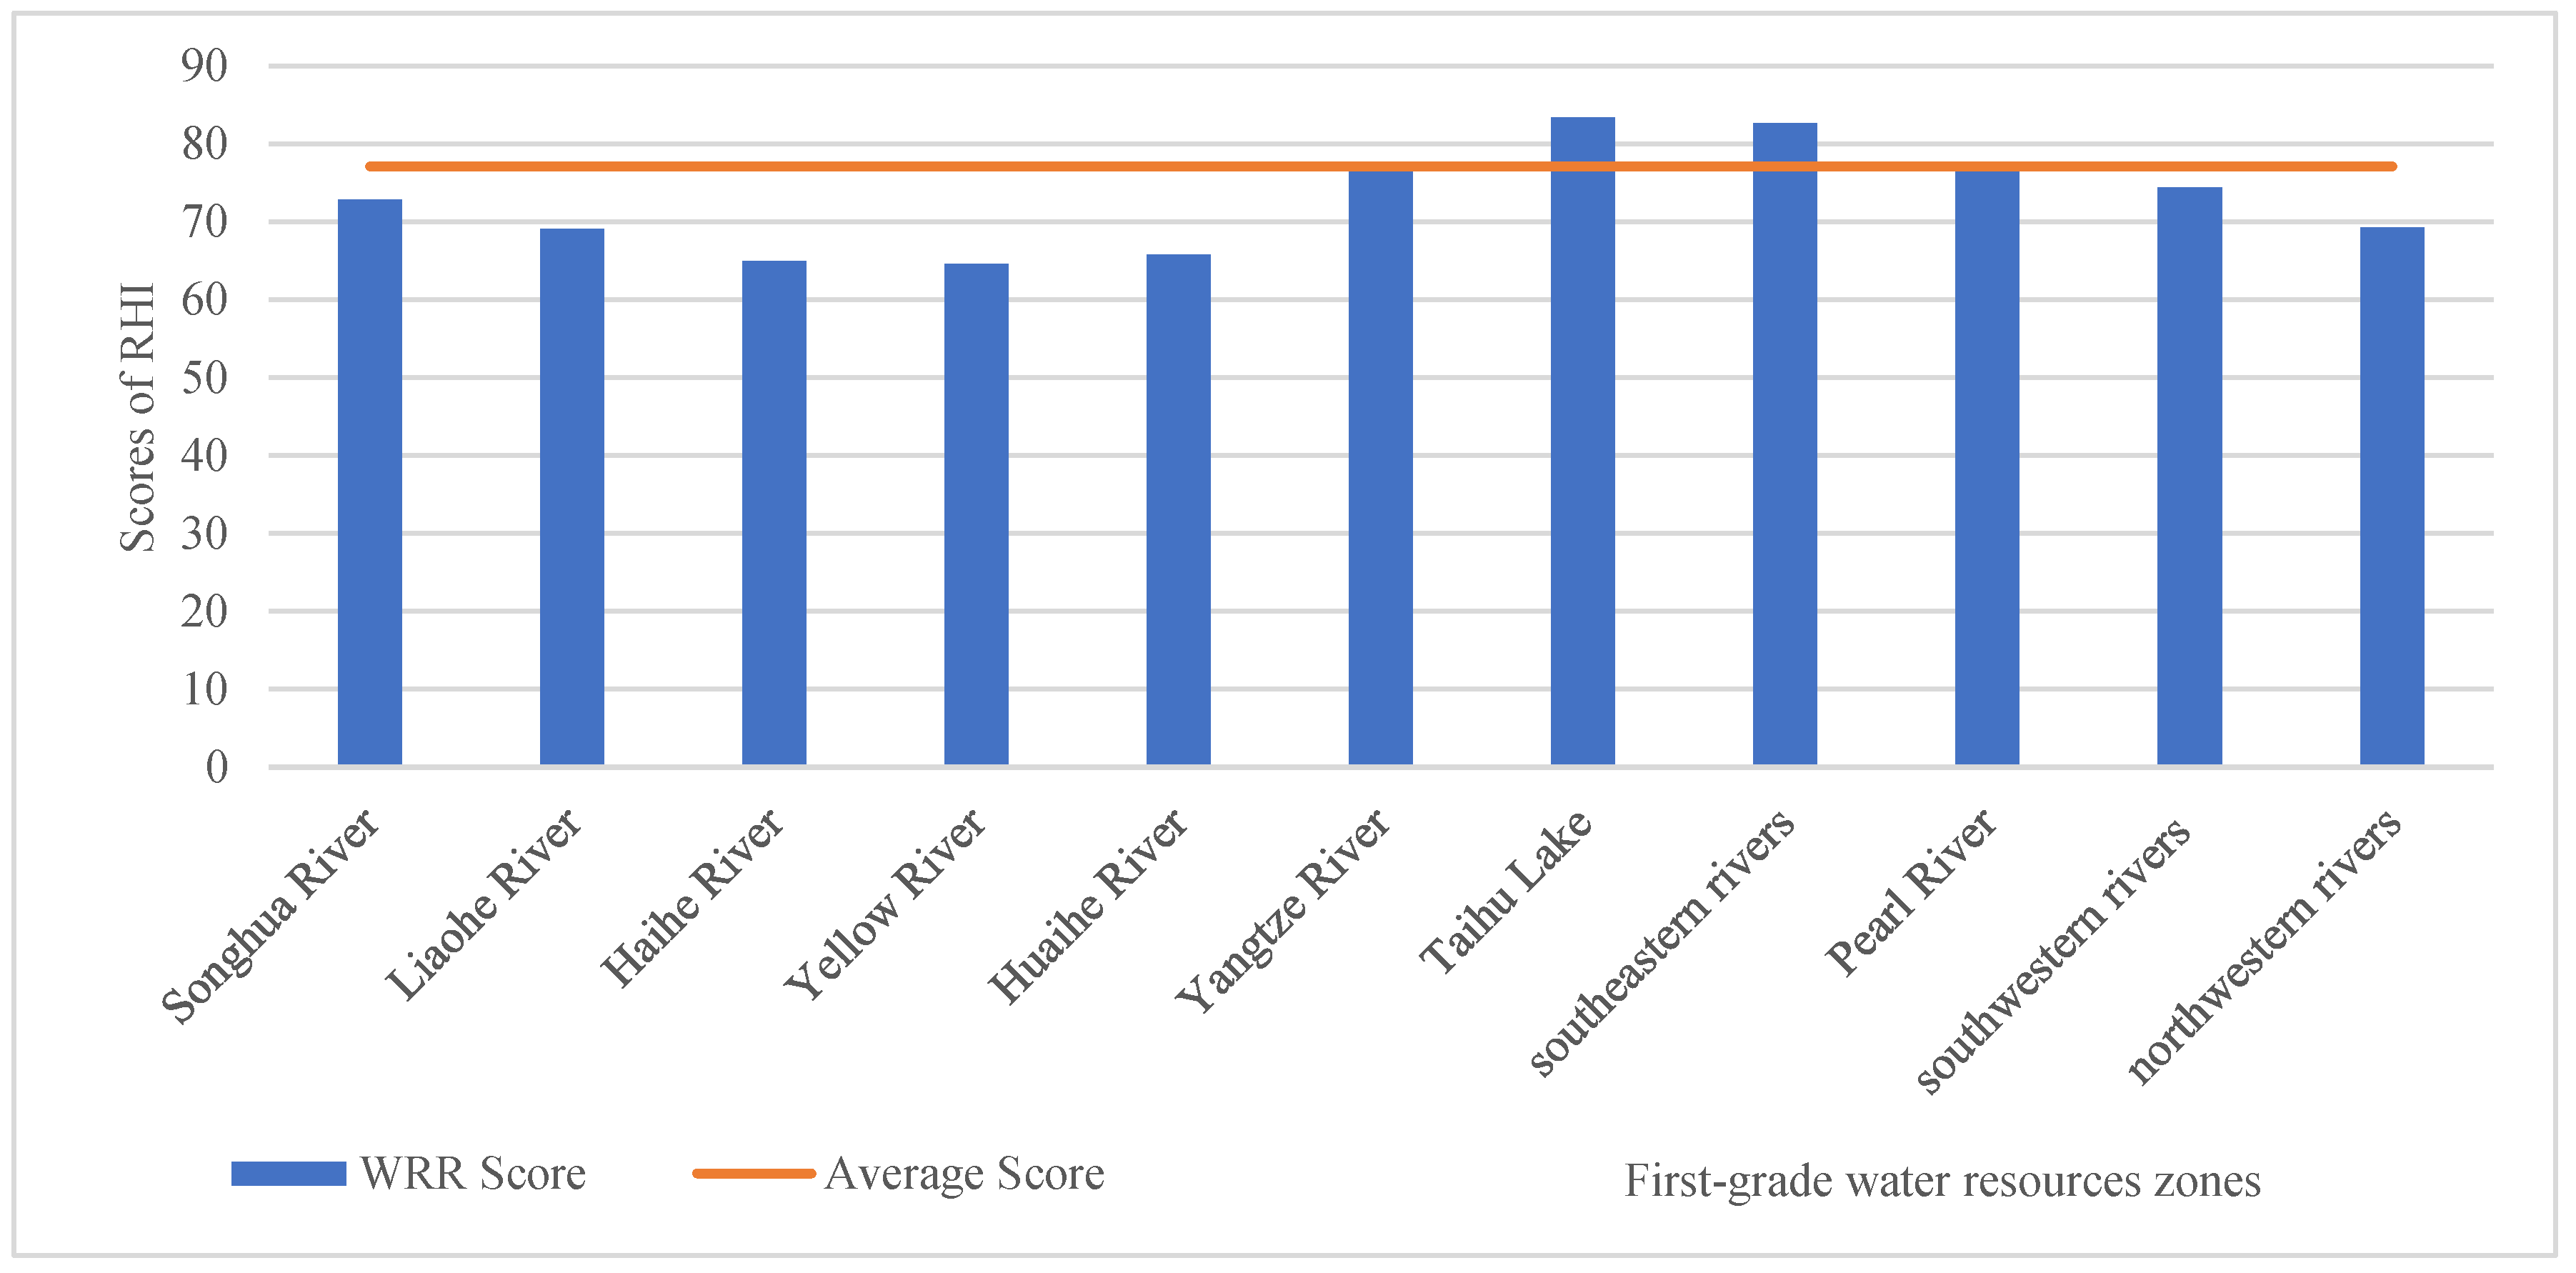
WRR scores 77.1 points nationwide, which is generally at a medium level. The overall water resource reliability nationwide is: AWP stands at a medium-high level against the international warning line for water shortage, WSR is at a good level, and WUR is well below 40%, but water resources are unevenly distributed across regions, which is incompatible with population distribution and allocation of productive forces; the level of water conservancy is yet to be further improved, and there is a clear gap in GDP Output per cubic meter of Water use (GOW) compared with high-income countries; and CSD is generally at a medium-low level. Continuing to play the basic role of happy rivers and lakes to achieve the vision of “an affluent life with reliable water supply” is still on the way.
WRR evaluation results for the first-grade water resource zones are shown in Figure 4. In general, scores in the north are lower than in the south. Specifically, scores for the Yellow River, the Haihe River, the Huaihe River, northwestern rivers, and the Liaohe River are all below 70 points, at a medium-low level. Scores for southeastern rivers and the Taihu Lake are higher than 80 points, reaching a medium-high level.
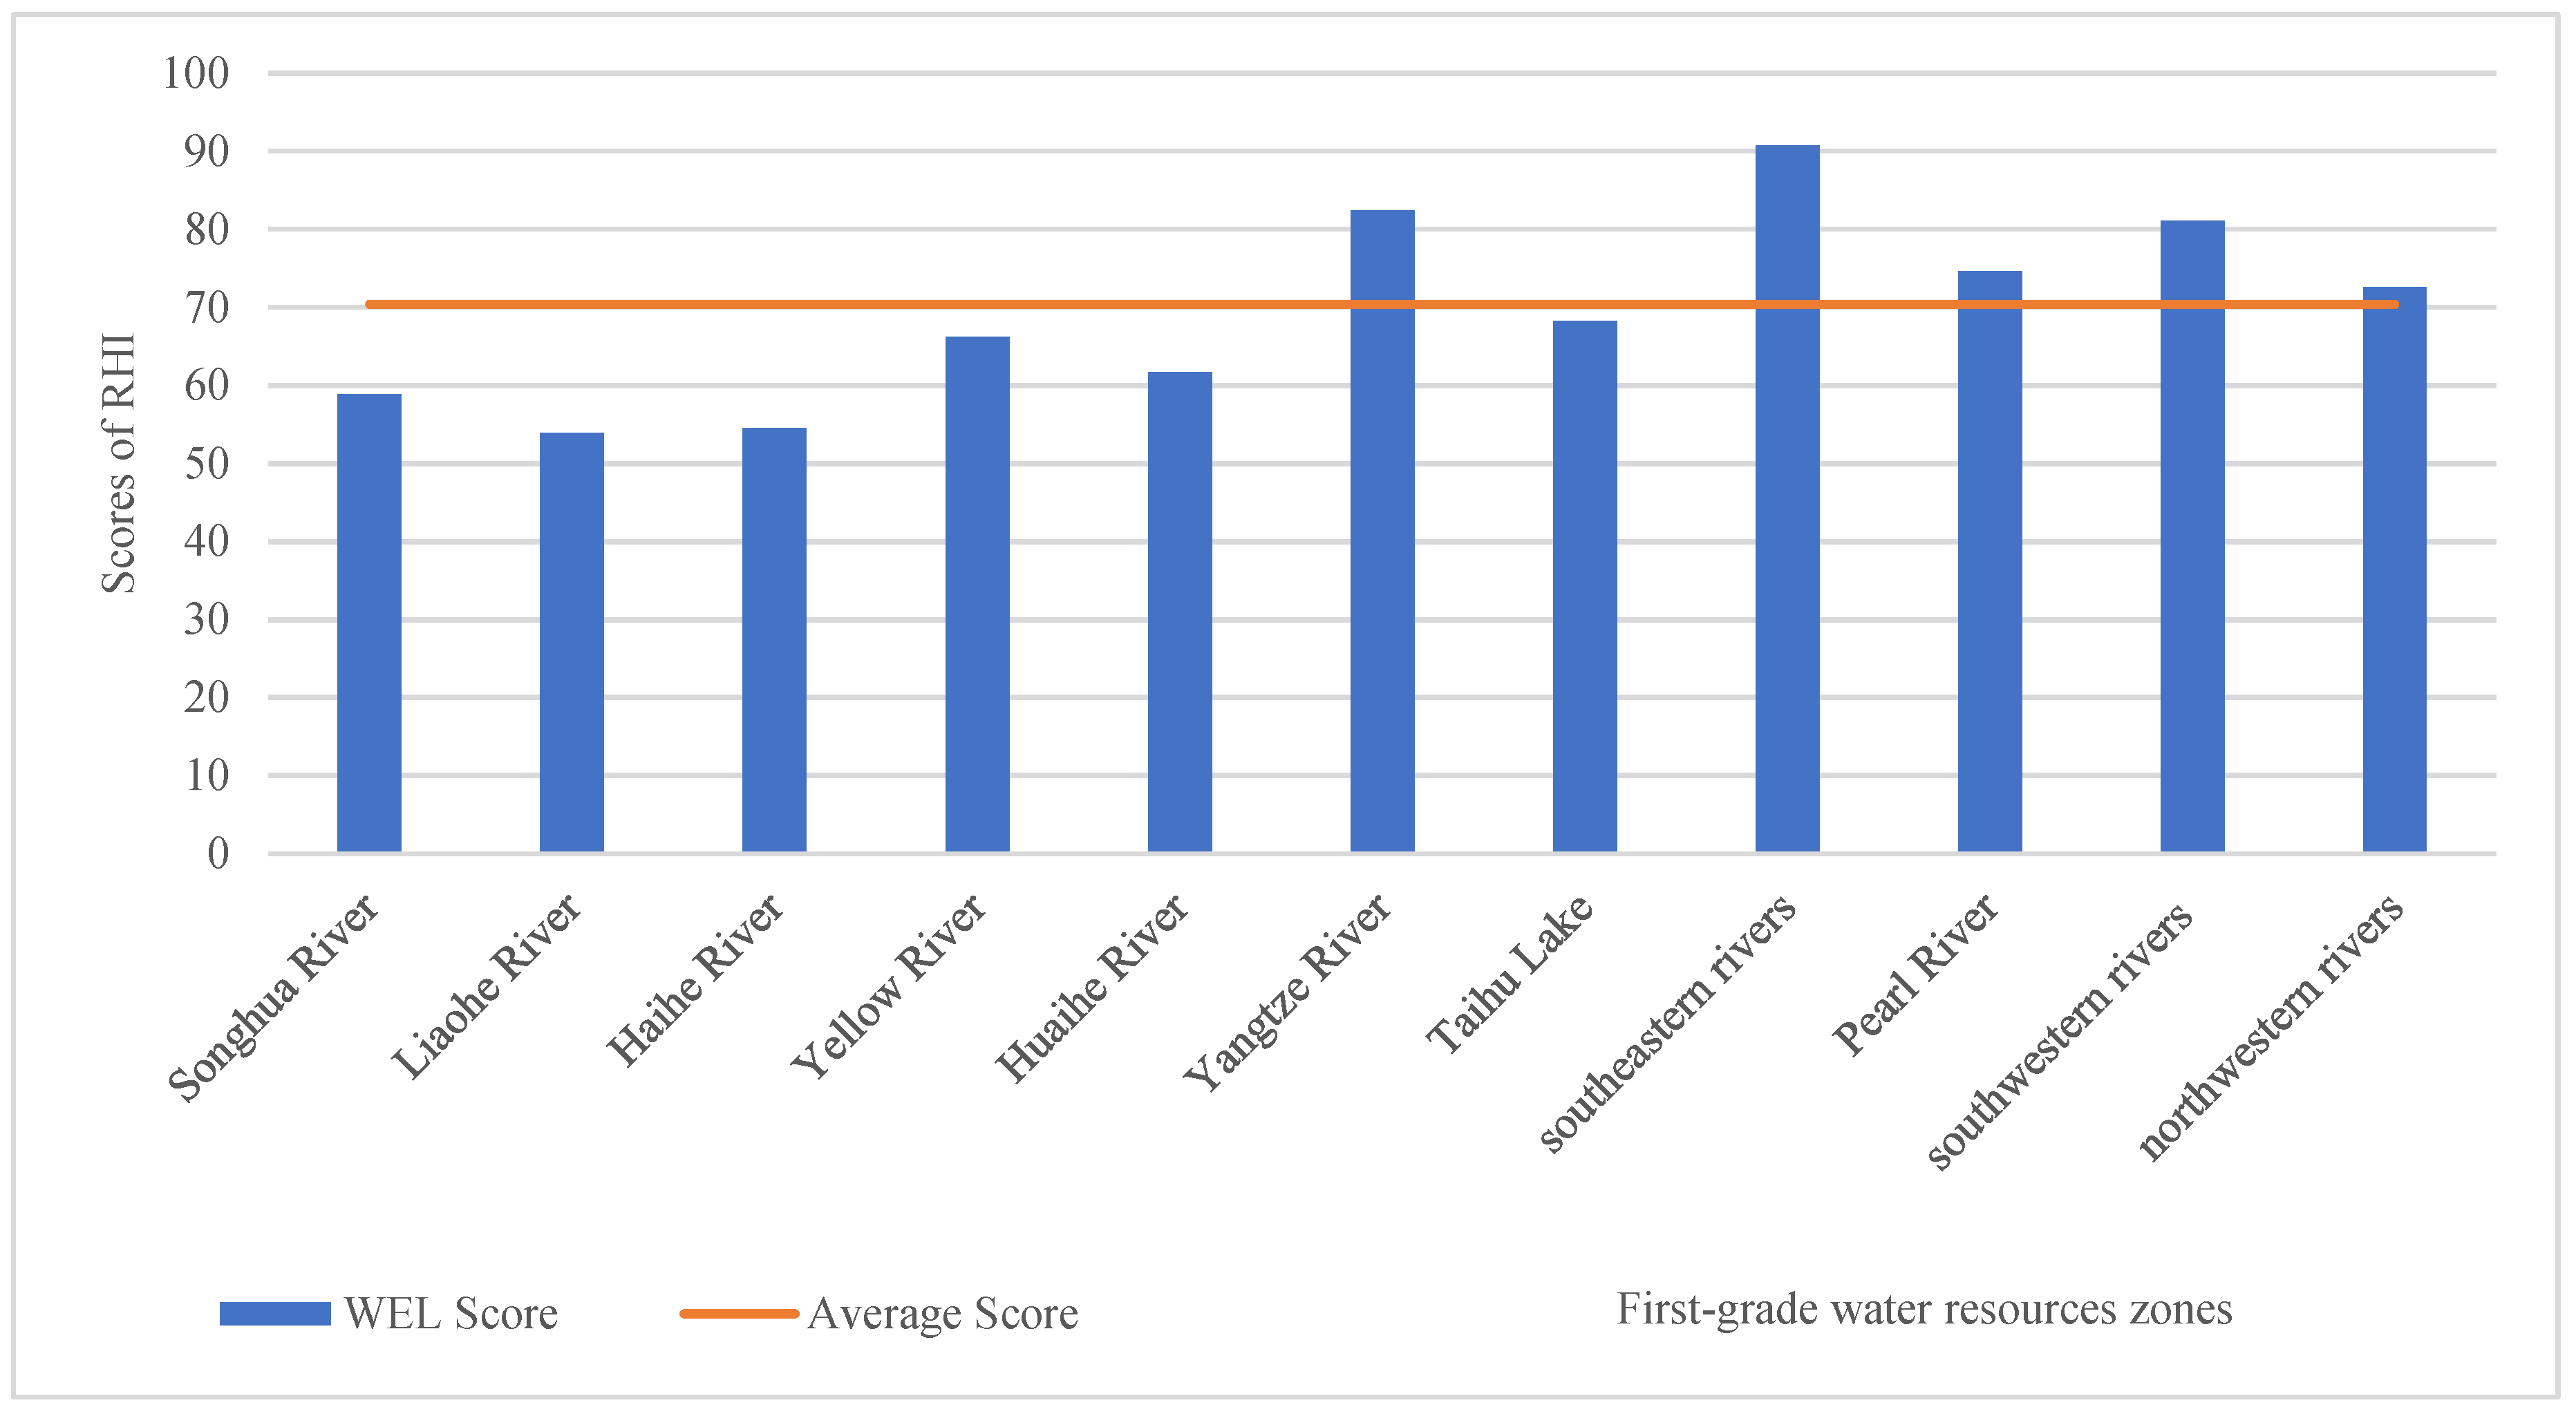
4.3. Water Environment Livability (WEL)
WEL scores 70.4 points nationwide, which is generally at a medium level. The overall water environment livability nationwide is: the water quality of rivers generally reaches a good level and QDS is at a near-good level, but groundwater resources are poorly conserved, lakes and reservoirs are seriously eutrophic and there is a gap between the environment of urban and rural waters closely related to people’s daily life and their water entertainment demand. The vision of “a livable environment with clear waters and green banks” is still far away.
WEL evaluation results for the first-grade water resource zones are shown in Figure 5. Specifically, southeastern rivers score 90.7 points, performing best and reaching a good level; both the Yangtze River and southwestern rivers score 80+ points, staying at a medium-high level; the Pearl River and northwestern rivers score 70–80 points, at a medium level; the Taihu Lake, the Yellow River and the Huaihe River score 60–70 points, at a medium-low level; while the Songhua River, the Haihe River, and the Liaohe River score less than 60 points, at a poor level.
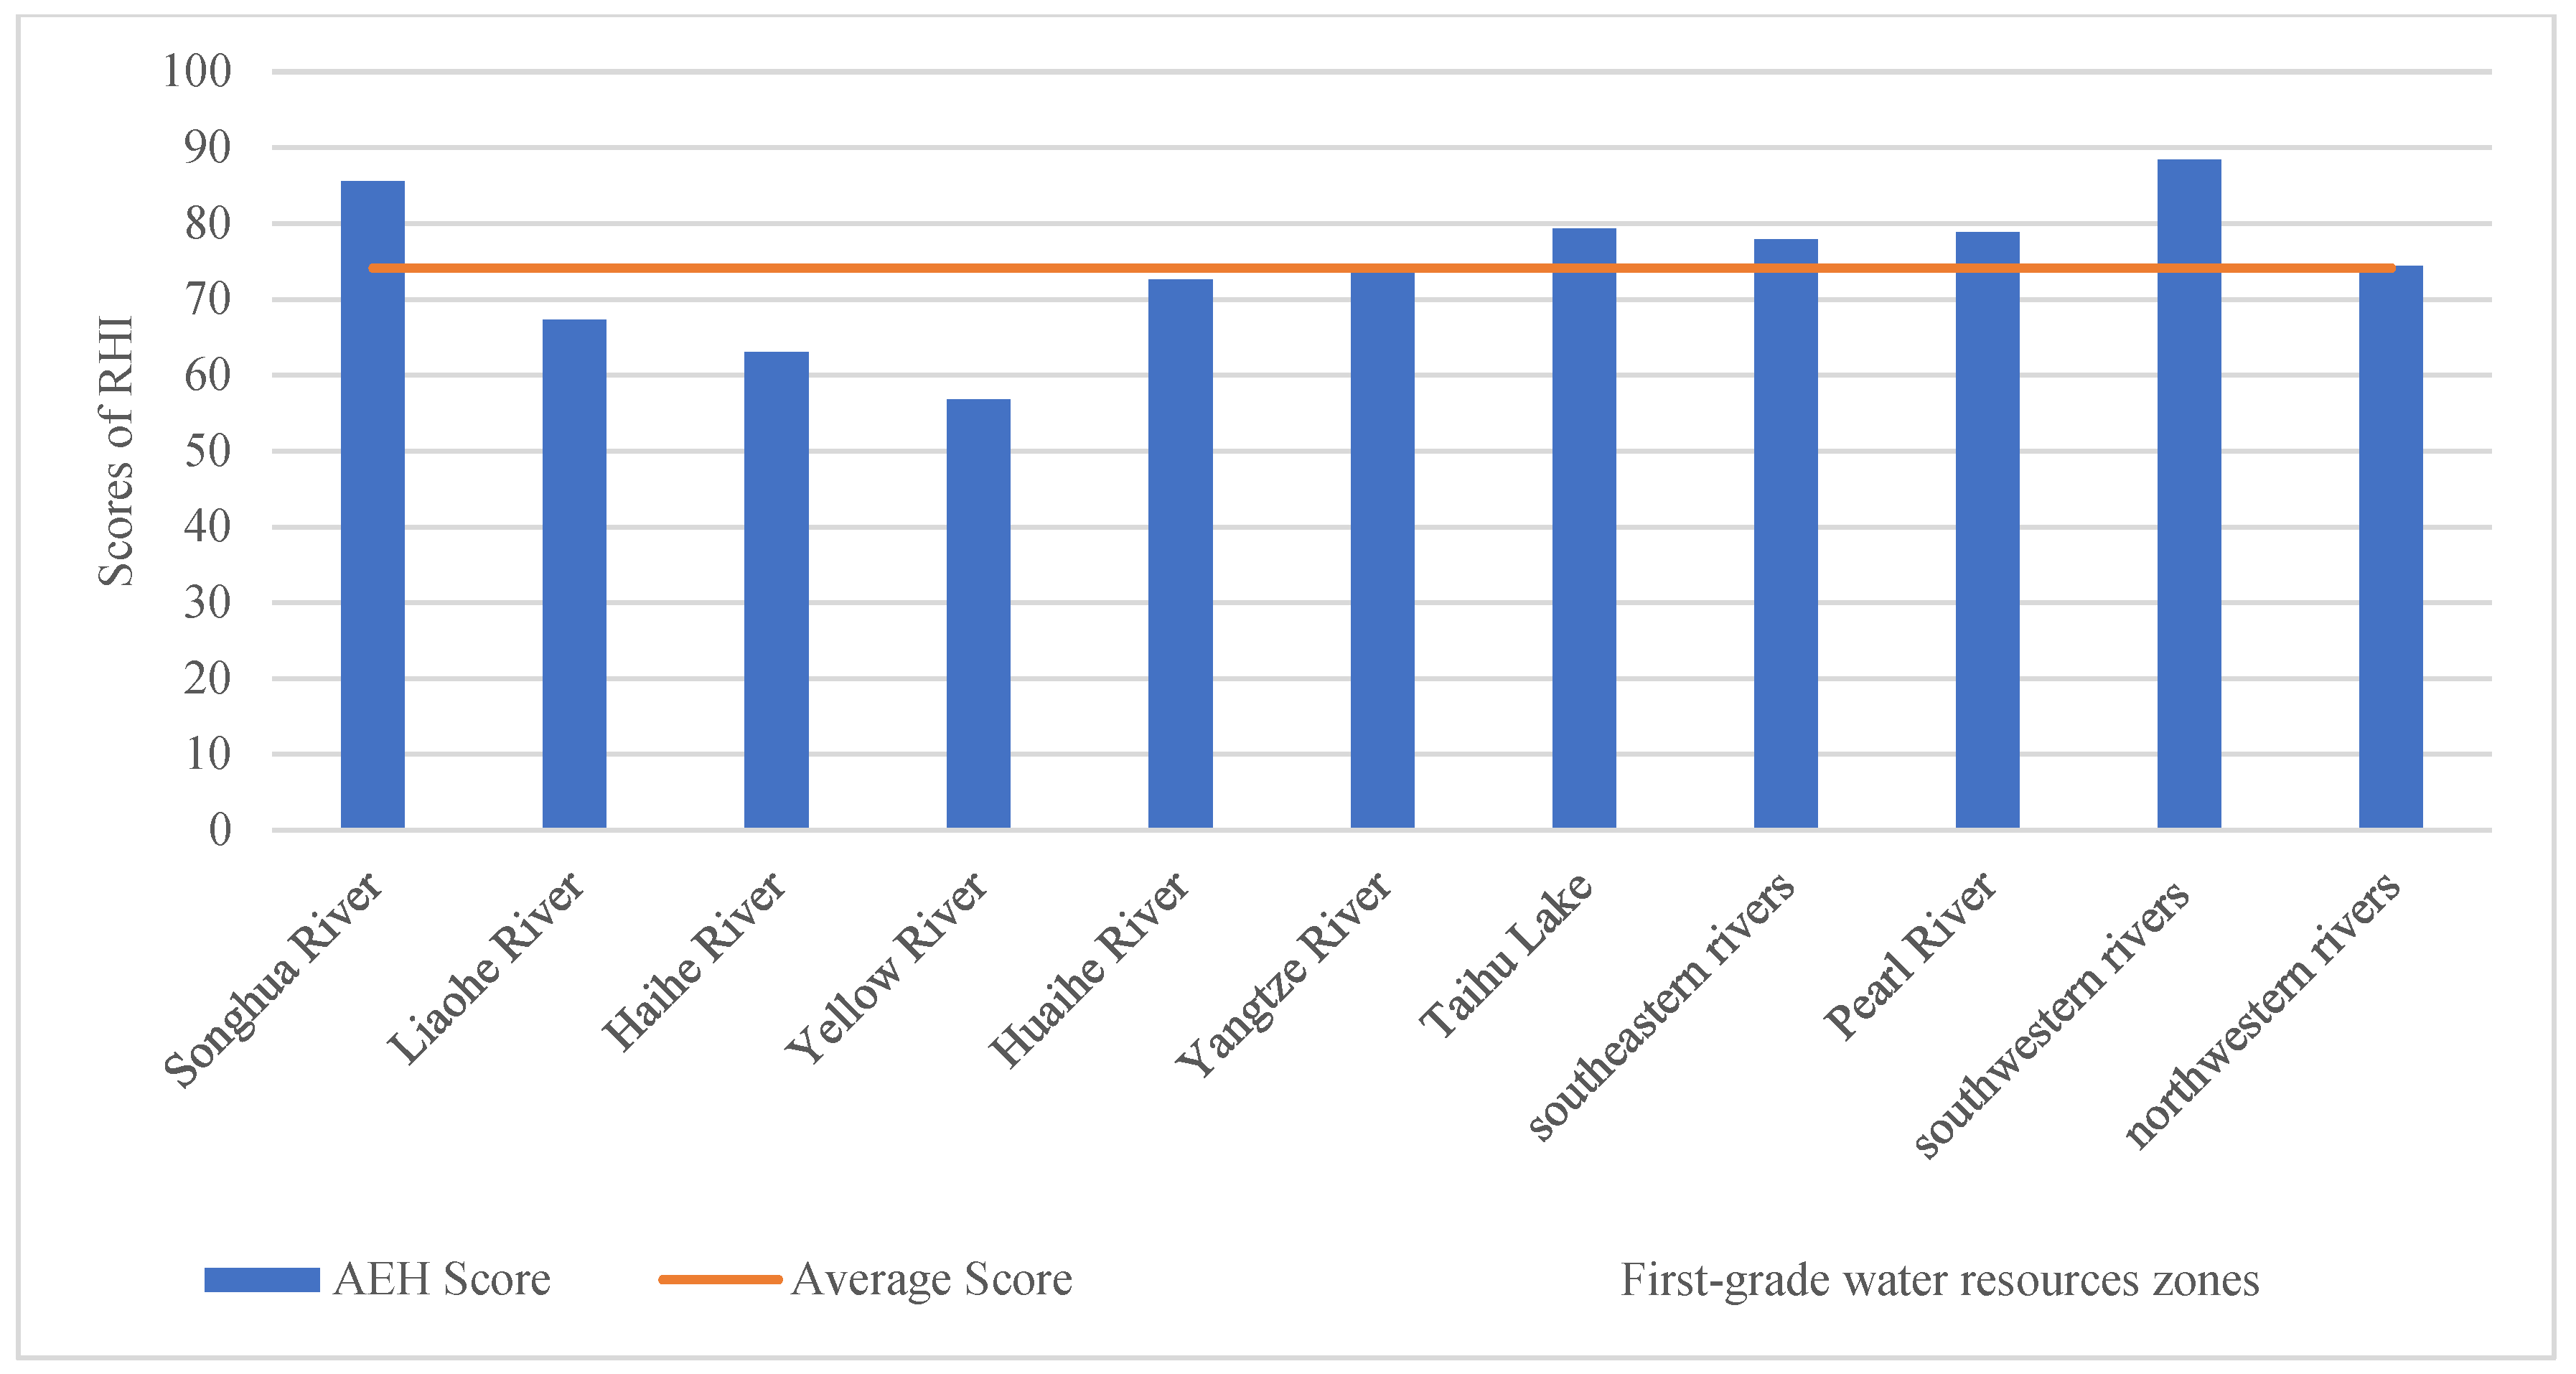
4.4. Aquatic Ecosystem Health (AEH)
AEH scores 74.1 points nationwide, which is generally at a medium level. The overall aquatic ecosystem health nationwide is: owing to fruitful water and soil conservation efforts, SWC reaches a good level, and under the support of steady guarantee for ecological flows and management through the river/lake chief system, REF generally improved to a medium level; however, both NHR and IBI are still at a medium-low level. The quality and stability of river and lake ecosystems should be systematically improved before the vision of “a symbiotic harmony with fish swimming in shallows” can be achieved.
AEH evaluation results for the first-grade water resource zones are shown in Figure 6. Southwestern rivers and the Songhua River score 85+ points, the highest among the first-class water resource zones, reaching a good level; scores for the Taihu Lake, the Pearl River, the Yangtze River, southeastern rivers, the Huaihe River, and northwestern rivers fall between 70 and 80 points, all at a medium level; the Liaohe River and the Haihe River score 60–70 points, both at a medium-low level; the Yellow River scores 56.8 points, the lowest, at a poor level.
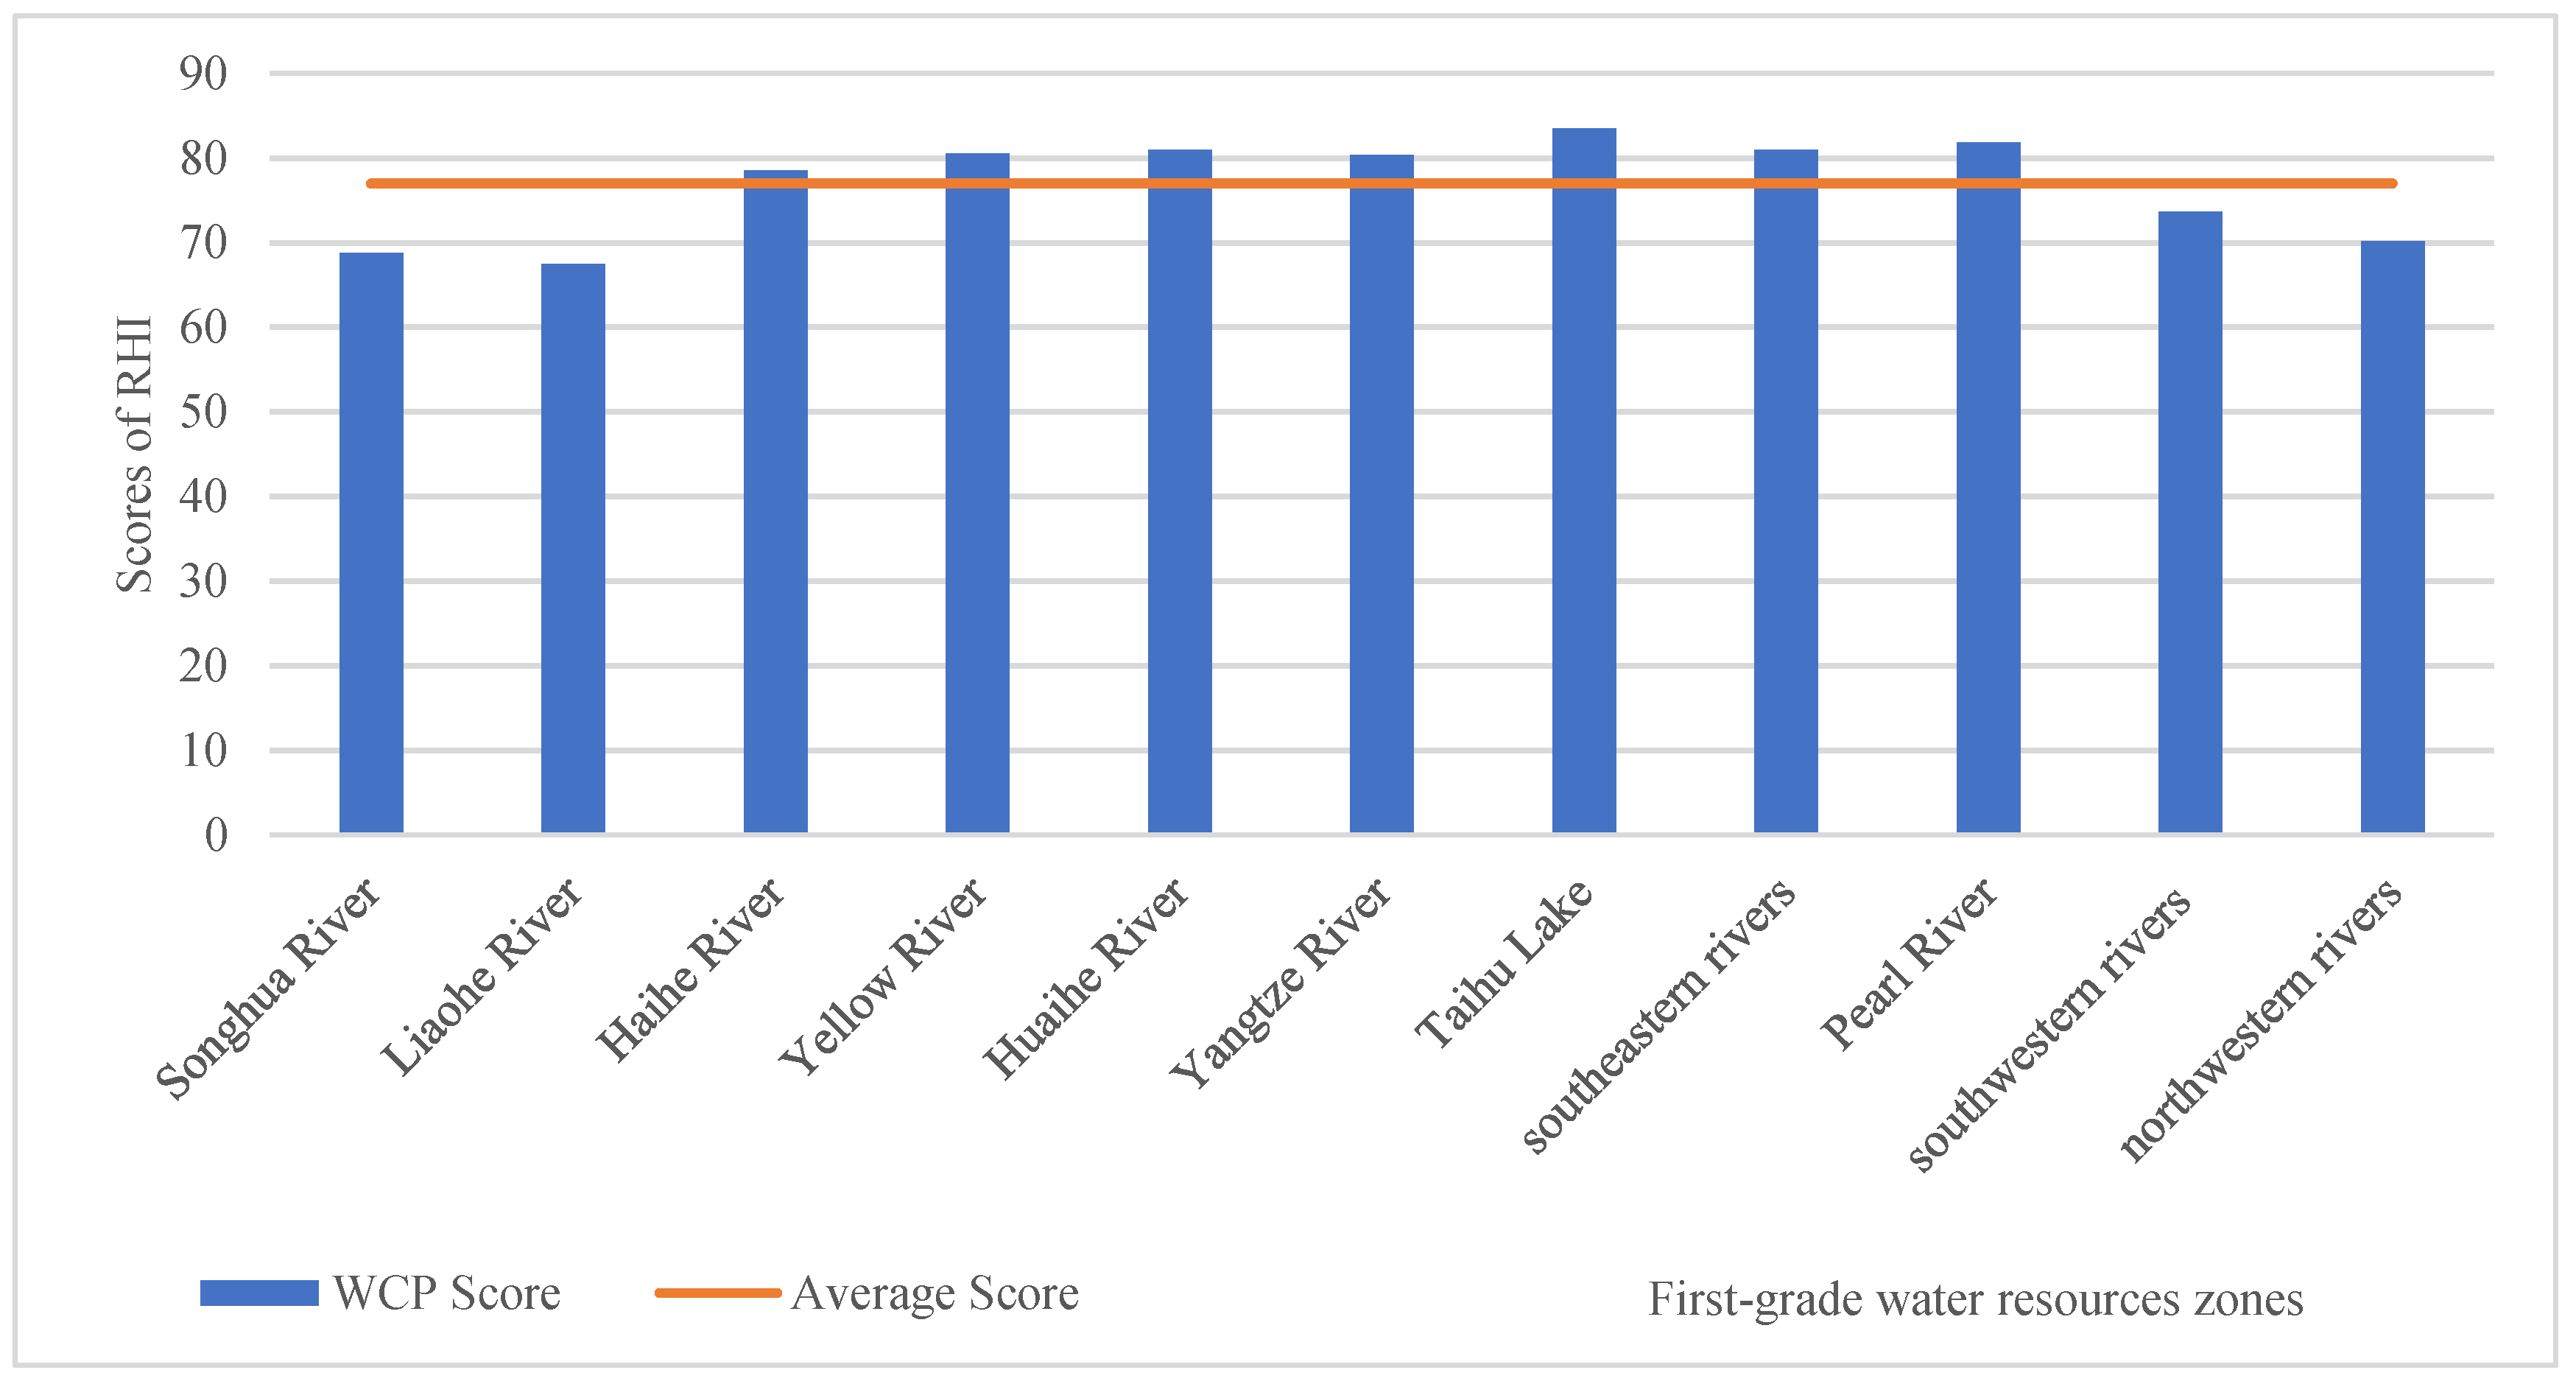
4.5. Water Culture Prosperity (WCP)
WCP scores 77.0 points nationwide, which is generally at a medium level. The overall water culture prosperity nationwide is: China boasts a profound historical background of water culture, which represents a precious treasure for achieving the vision of “a spiritual homeland with river civilizations”; however, both CPI and MCI are low, and PAE, which indicates the respect for and protection of rivers, is generally low and still at a medium level relative to people’s increasing demand for cultural life, which is yet to improve.
WCP evaluation results are shown in Figure 7. Scores for the Yangtze River, the Yellow River, the Huaihe River, southeastern rivers, the Pearl River, and the Taihu Lake all exceed 80 points, reaching a medium-high level; the Haihe River, southwestern rivers, and northwestern rivers score 70–80 points on WCP at a medium level; scores for the Songhua River and the Liaohe River are relatively low, which are 68.8 and 67.5 points, respectively, at a medium-low level.
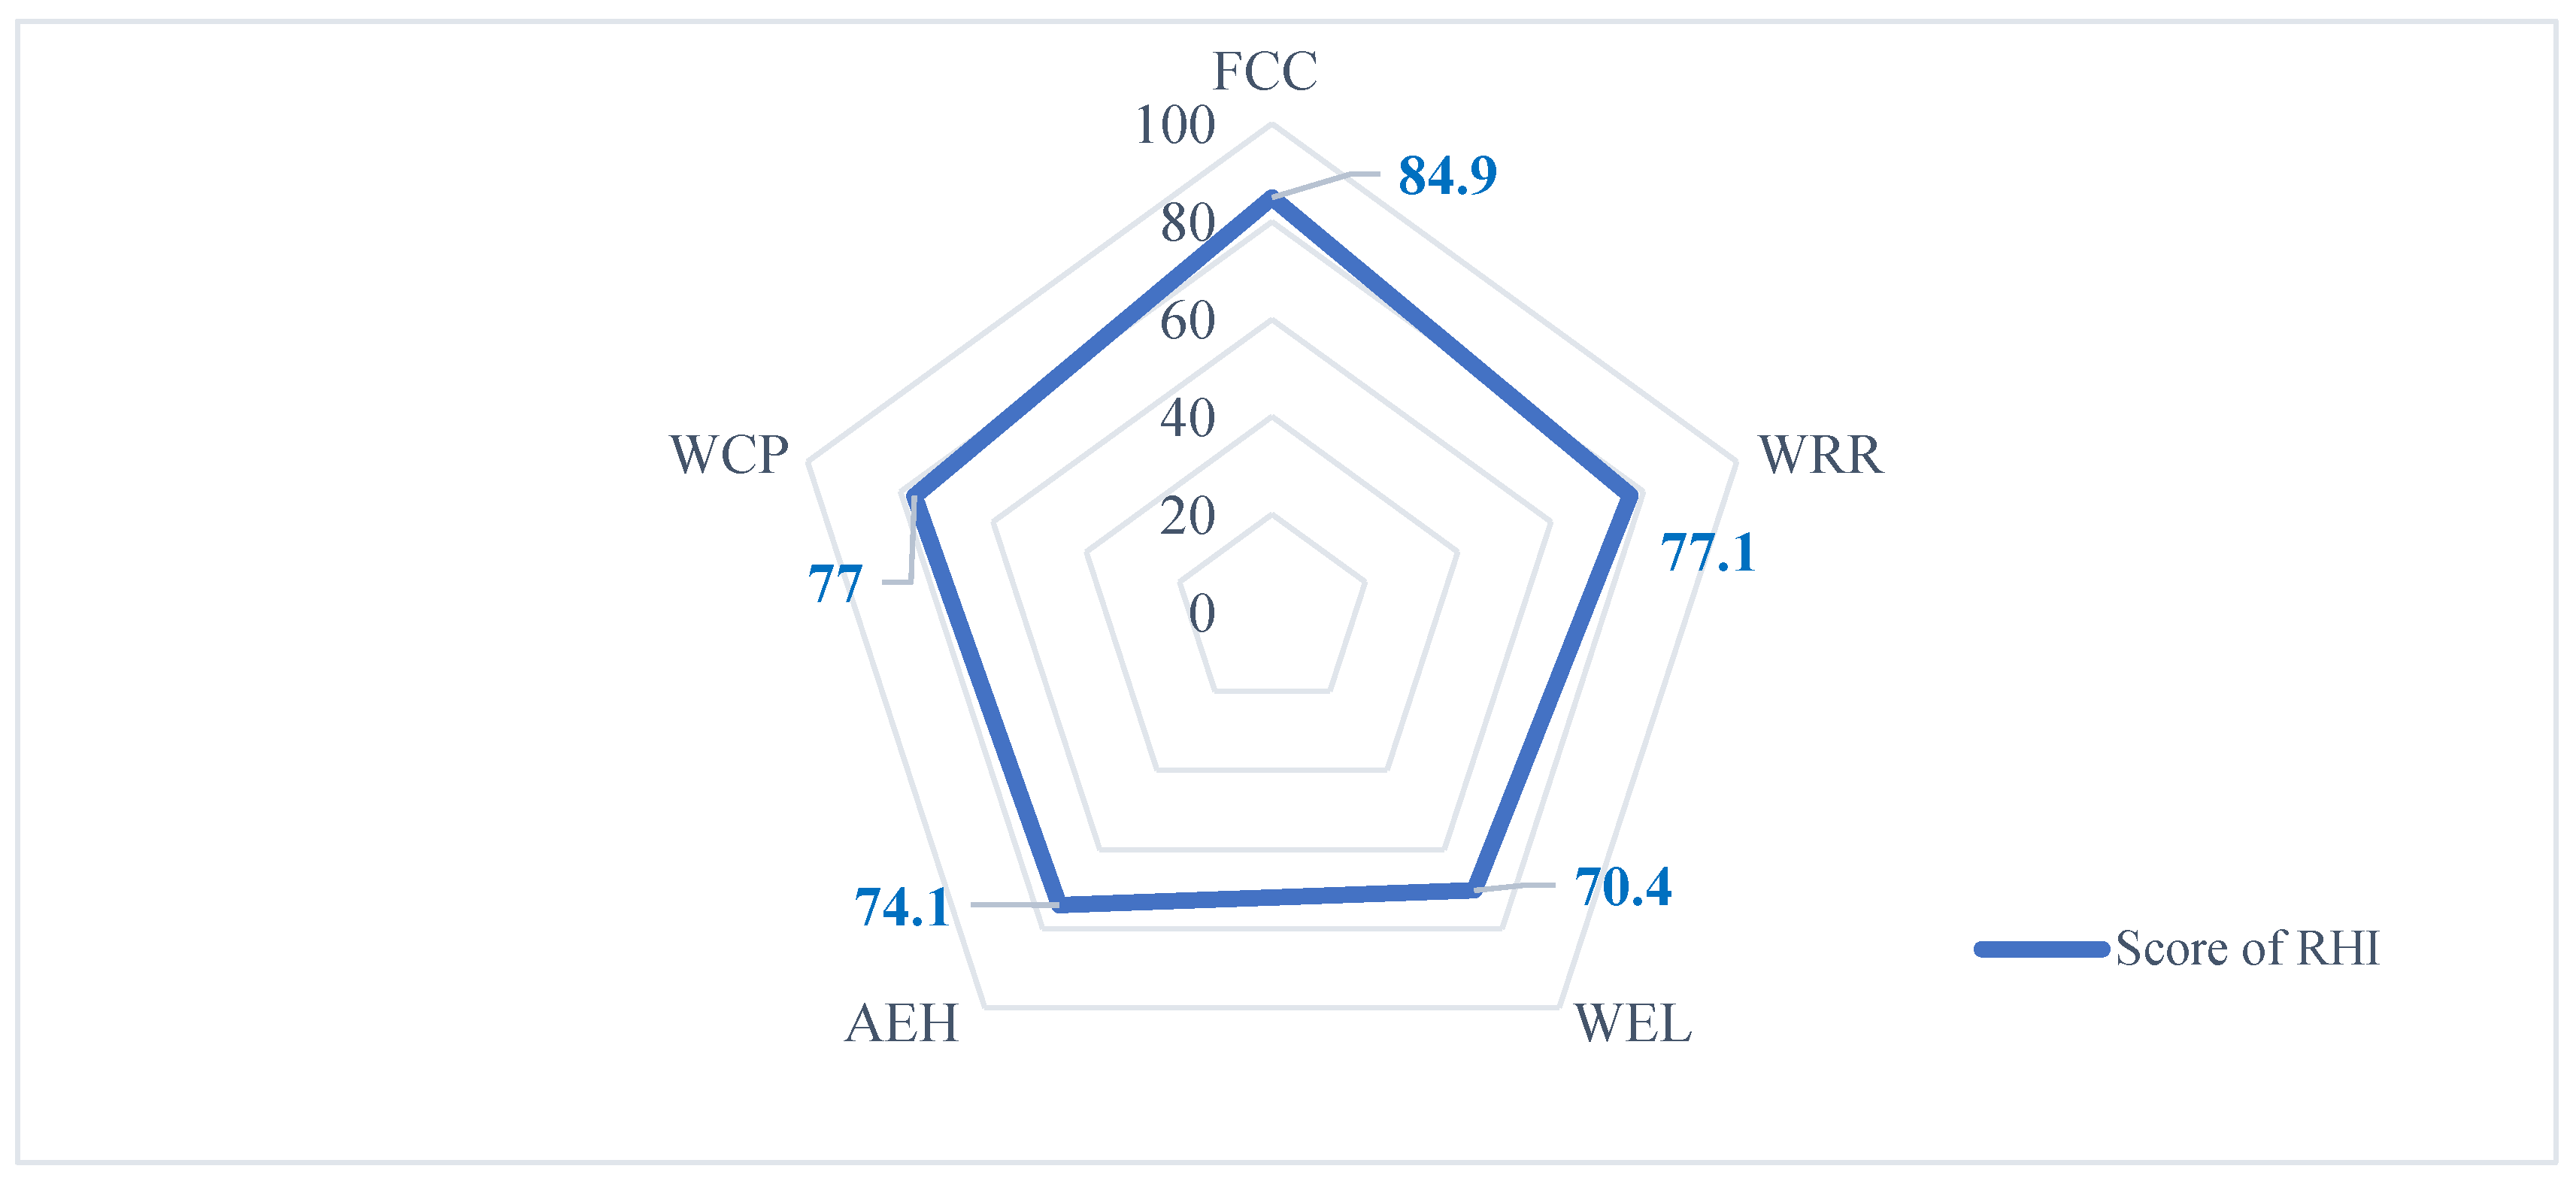
4.6. Overall Evaluation
In 2019, the FCC score was the highest nationwide, reaching a near-good level, while scores of WRR, WEL, AEH, and WCP fell between 70 and 80 points, all at a medium level (Figure 8).
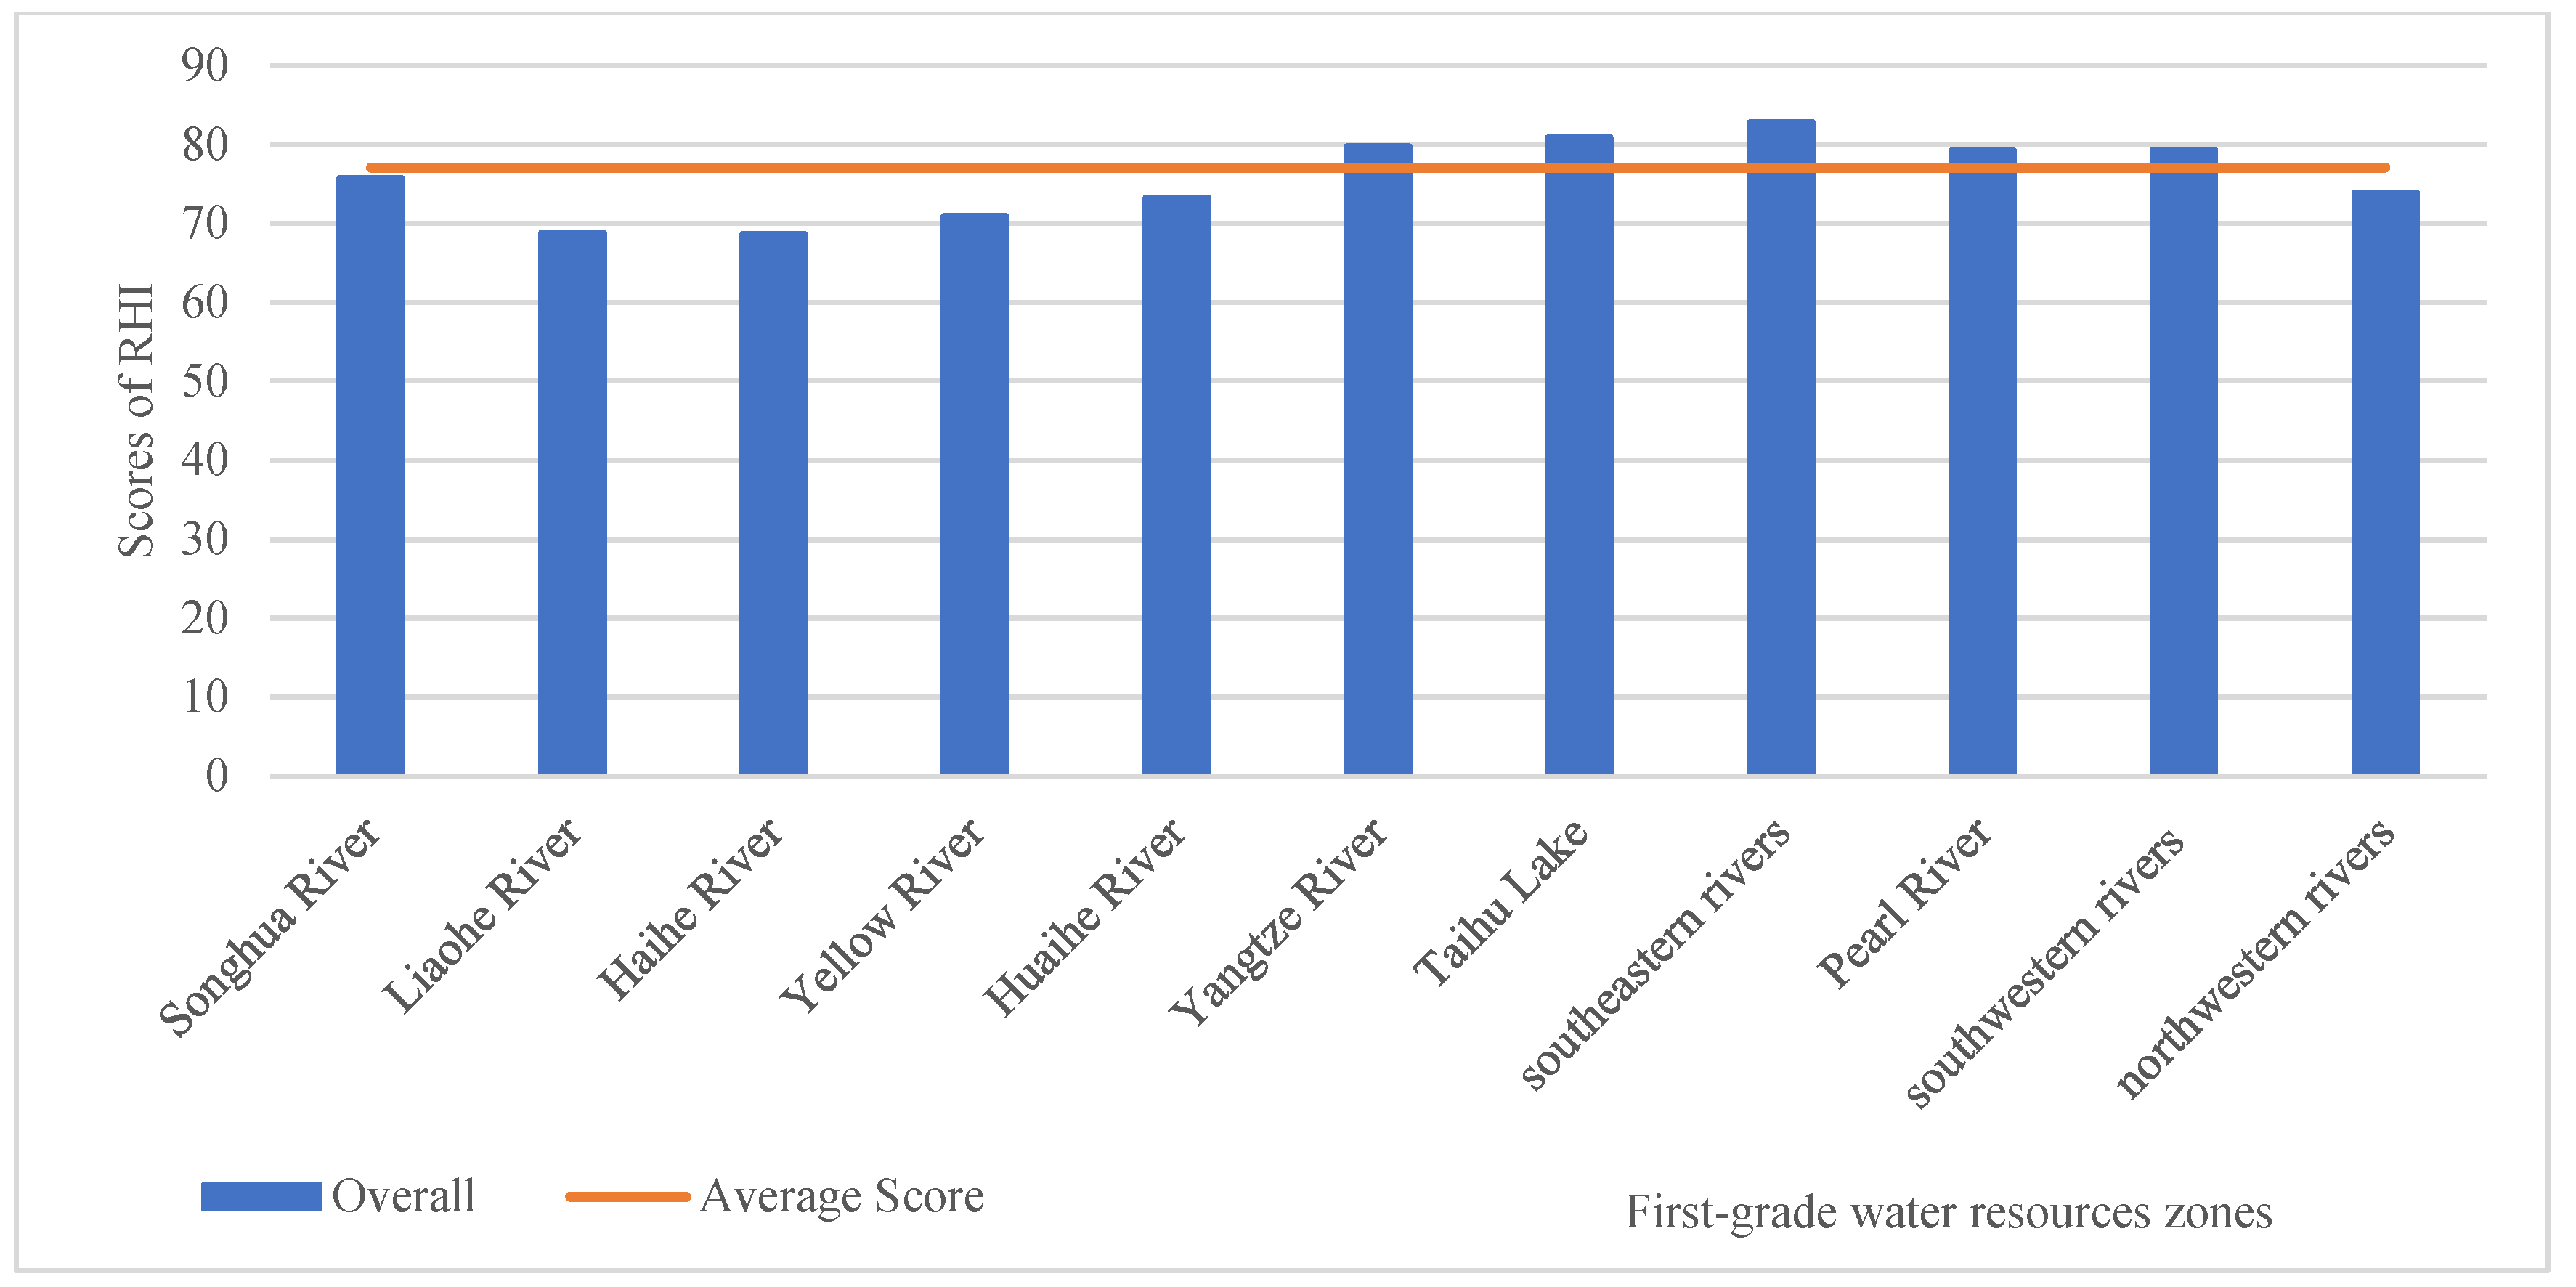
In 2019, China’s RHI scored 77.1 points at a medium level. On the whole, among the secondary indicators, the mortality rate, water supply rate, and soil and water conservation rate of flood disaster were relatively the highest, reaching a good grade. The economic loss rate of flood disasters, the standard rate of flood control projects, the per capita water resources availability, and the river and lake water quality index scored the second highest, which belonged to the medium-high grade. The degree of protection of groundwater resources and the degree of water entertainment score was low, and the evaluation grade was poor. The score for water resources supporting development ability, natural habitat retention rate, and aquatic biological integrity was the second lowest, which was medium-low level. The conditions of rivers and lakes in China calculated by RHI are consistent with the actual situation. The overall RHI evaluation results are shown in Figure 9. Specifically, RHI scores for southeastern rivers and the Taihu Lake were the highest, at a medium-high level, and RHI scores for the Yangtze River, southwestern rivers, and the Pearl River were 79.9, 79.4, and 79.3 points, respectively, all at a medium level. RHI scores for these southern first-grade water resource zones were higher than the national average. In the north, the Songhua River had the highest RHI score, which was 75.8 points (close to the national average), while the Yellow River, the Huaihe River, and northwestern rivers scored a little more than 70 points, indicating a medium level of river happiness. Scores for the Liaohe River and the Haihe River lay between 60 and 70 points, indicating a medium-low level of river happiness.
4.7. Evaluation of a Typical River Basin
The Yellow River, having nurtured and bred the Chinese civilization, is also an important economic zone in China, with the Huang-Huai-Hai Plain, the Fenwei Plain, and the Hetao Irrigation Area being major agricultural production areas, which contribute to around one third of the country’s food and meat production. The Yellow River Basin, also known as the “Energy Basin”, boasts abundant coal, oil, gas, and nonferrous metal resources, with coal reserves there accounting for more than half of the national total. It is an important base for energy, chemicals, raw materials, and basic industries in China.
The RHI scores 71.0 points in the Yellow River Basin, staying at a medium level and putting the river basin in eighth place among the 10 first-grade water resource zones nationwide. The evaluation results of the first-level indicators of the RHI are listed in Table 8. As shown in the table, the FCC score is the highest, reaching a good level; WCP is at a medium-high level; the AEH score is the lowest, at a poor level; and other indicators are at a medium-low level.
FCC. FCC scores 88.9 points in the Yellow River Basin, generally at a good level. Rate of Accepted Dikes (RAD) is 87.7%, the Rate of Accepted Reservoirs for medium-sized and large reservoirs (RAR), and the Rate of Accepted flood detention Basins (RAB) are 100% and RAR (for small reservoirs) is 98%, so RWA scores 94.7 points, reaching a near-excellent level. FMR (0.4 per million people) scores 91.9 points and ELR is 0.22%, which scores 85.3 points, both at a good level. DRC scores 73.7 points, at a medium level, indicating relatively weak resilience.
WRR. WRR scores 64.6 points in the Yellow River Basin, generally at a medium-low level. Water Supply Coverage (WSC) is 91.3% and the Rate of actual Irrigated Areas (RIA) is 79.9%, so WSR scores 86.3 points, reaching a good level; LSI scores 77.0 points, at a medium level; AWP is 620.2 m3, scoring 44.8 points, and as Water resources Utilization Rate (WUR) exceeds 70% and GDP Output per cubic meter of Water use (GOW) is RMB 180.5/m3, CSD scores 42.0, both at a poor level that is still a long way from the medium level.
WEL. WEL scores 66.2 points in the Yellow River Basin, generally at a medium-low level. To be specific, the groundwater exploitation coefficient is 1.04 and GPI scores 26.0 points, staying at a very poor level; WEI scores 69.8 points, standing at a medium-low level; QDS scores 74.5 points, at a medium level; the length of rivers with Class I~III water quality accounts for 80.3% and that of rivers with water quality inferior to Class V accounts for 9.2%, and the Rate of Eutrophic Lakes and reservoirs (REL) is 25%, so WQI scores 82.2 points, at a medium-high level.
AEH. AEH scores 56.8 points in the Yellow River Basin, generally at a poor level. SWC scores 85.7 points, at a medium-high level, the highest among the second-level indicators, followed by NHR, which scores 77.2 points, at a medium level; IBI scores 42.9 points, at a poor level; and REF scores 25.0 points, at a very poor level.
WCP. WCP scores 80.6 points in the Yellow River Basin, generally at a medium-high level. CPI scores 86.8 points, reaching a good level; MCI scores 81.0 points, at a medium-high level; and PAE scores 76.3 points and WLI scores 78.4 points, both at a medium level.
The RHI evaluation results for the Yellow River Basin suggest that the main problems are in the following areas: first, inadequate post-disaster recovery capability is the main risk affecting water security in the Yangtze River Basin; second, an inherent shortage of water resources and a high rate of water resource exploitation and utilization remain the biggest restrictions on high-quality economic and social development; third, serious groundwater overdraft in some areas and heavy pollution of tributaries are major problems to be solved as early as possible in order to create a livable water environment in the river basin; fourth, the low rate of rivers with accepted ecological flows is a weak link to be addressed in order to maintain healthy water ecology; and fifth, the brand effect of water culture is yet to be enhanced and the water landscape impact is yet to be improved.
5. Discussion
5.1. Uncertainty of the Evaluation Method
Happiness is a subjective feeling for people, and rivers that make people feel happy should have common objective characteristics in terms of water security, water resources, water environment, water ecology, and water culture. Based on the five dimensions, the RHI is composed of altogether 30 indicators, including five first-level indicators, namely FCC, WRR, WEL, AEH, and WCP, each of which consist of four second-level indicators and corresponding third-level indicators. In the process of evaluation, the determination of weight coefficients is crucial. At present, research on evaluation indicators more often employs entropy weight, standard deviation, and Criteria Importance Through Intercriteria Correlation (CRITIC) methods, which can calculate indicator weights through mathematical methods based on original data, but render the scope of application limited, as they fully reflect the characteristics of selected data. Since the degree of flood control construction, water environment protection, utilization, and demand varies greatly from river to river due to the complexity of each river, selecting a universal indicator system that takes into account the characteristics of different rivers is vital to the evaluation of rivers.
5.2. Applicability of the Evaluation Method
Current evaluation of rivers mainly deals with the hydrological condition of natural attributes, ecosystems, and social functions of rivers, with focus on the health of rivers and different indicator systems established for different rivers. For instance, the Upper Mississippi River Restoration Program (UMRRP) assessed the ecosystem health of the Upper Mississippi River using seven categories of indicators, such as hydrology, sedimentation, water quality, land cover, aquatic vegetation, invertebrate and fish, and 25 specific monitoring indicators. The status and trend reports published indicate that most indicators remain relatively stable, with ecosystems being healthy in the north and relatively unhealthy in the south [28,29]. With a growing demand for quality of life, healthy evaluation of a river’s happiness should adopt a people-centered approach that not only assesses the general social and economic functions of the river by systematically measuring its water security, water supply, and water environment services, but also scientifically examines its aquatic ecosystem quality and water culture prosperity in the light of the natural endowments and cultural background of the river basin [30]. Therefore, in the case of the Mississippi River, the RHI scores 80.1 points, at a medium-high level. To break it down, FCC scores 90+ points, which is at a good level; WRR and WEL score 80+ points, both at a medium-high level; and AEH and WCP score less than 80 points, both at a medium level. The evaluation results show the following characteristics of the Mississippi: first, the river basin is generally well managed and reaches a medium-high level in terms of water security, water resources, and water environment, indicating that the long-term systematic governance of the river basin produced desirable results and a high level of public awareness and engagement in water governance; second, low scores on the eco-hydrological process variation index and the longitudinal connectivity index imply the great impact of human activity on natural habitats and a high rate of water resource development; and third, historical and cultural inheritance and protection is inadequate in the river basin. From the perspective of the evaluation results, the RHI performs better in comprehensively describing the overall situation of a large river.
5.3. Policy Recommendations
River health, as a comprehensive concept, is increasingly embodied in domestic and foreign water resource management systems, but there are no specific rules for the implementation of river evaluation indicator systems, and the indicator systems selected for a single river may vary. In order to scientifically assess the status of rivers and lakes in different regions, an international guideline for river and lake evaluation should be introduced, which can take into account the differences and commonalities of river ecosystems and provide a unified, standardized technical system for evaluation. This requires a unified indicator system, under which proper adjustments can be made to indicators according to the situation of a specific river basin, but such adjustments should meet scientific cognition, assessment standards, and other requirements. Major rivers and lakes should be assessed on a regular basis. In response to underperforming indicators, such as RWA, GPI, and REF, the problem of unbalanced spatial distribution of water resources should be addressed as early as possible. For underperforming indicators, such as AWP and WUR, the principle of giving priority to saving water must be put into practice. For underperforming indicators such as WEI, IBI, and CPI, scientific sector-specific decisions should be made.
6. Conclusions
As social and economic development needs and anthropogenic threats grow, countries around the world are suffering from numerous river and lake problems, such as altered hydrological processes, damaged physical structures, polluted water, and declining aquatic biodiversity, and the evaluation of rivers and lakes is changing from purely water quality evaluation to a more comprehensive one. This paper gives a new definition of a happy river, which enriches the new connotation of water management. A happy river refers to a river that can maintain its own health, support high-quality economic and social development in the river basin, as well as reflect human–water harmony, thus give people a high sense of security, gain, and satisfaction. The RHI method is based on Maslow’s hierarchy of needs theory and draws lessons from the World Happiness Report and SDG Report. Compared with the previous studies, the study insisted on a people-centered approach, and takes the river culture into consideration. This paper develops evaluation indicators, such as FCC, WRR, WEL, AEH, and WCP in terms of water resources, security, ecology, environment, and culture, and assesses the overall river happiness of major rivers and lakes nationwide by examining the situation of China’s 10 first-grade water resource zones and the Taihu Lake Basin in 2019.
The analysis of the evaluation indicators suggests that China’s RHI scores 77.1 points, which is at a medium level, with FCC at a near-good level and WRR, WEL, AEH, and WCP all at a medium level. Meanwhile, the RHI in first-grade water resource zones in southern China stands above the national average, in contrast to the situation in the north, mainly because WRR and WEL are lower in the north than in the south.
The analysis of the river basins evaluated supports that WEL for the Songhua River, the Liaohe River, and the Haihe River in the north is at a poor level, restricting the quality and stability of aquatic ecosystems; AEH for the Yangtze River, the Taihu Lake, and southeastern rivers in the south is at a below-average level, indicating the poor condition of important aquatic organisms, which is a major problem that requires attention in order to maintain healthy aquatic ecosystems in these regions. Problems in the Yellow River Basin, which involves 340 counties (county-level cities, districts, or banners) in 66 prefectures (prefecture-level cities, autonomous prefectures, or leagues) in nine provinces and autonomous regions, are more complex, with FCC reaching a good level, WCP at an above-average level, AEH at a poor level, and WRR and WEL at a below-average level. Based on the evaluation results, we therefore propose targeted basin governance measures: more attention should be paid to the intensive and economical use of water resources in northern China, and ecological flows of rivers must be effectively ensured in southern.
On the whole, happy rivers should be built in a way that seeks to maintain the health of rivers while pursuing greater benefits for the people by following the basic principle of human–water harmony on the premise of maintaining river health. With regard to the perspective of the future work, except the expert comprehensive evaluation method applied in the current study, the index weights can also be determined by the Analytic Hierarchy Process (AHP), considering the characteristics of the river basin, social and economic conditions, or people’s opinions. Secondly, at present the model may not include all aspects of a river, such as its hydrodynamics, transport, and species migration, so more relevant aspects can be supplemented and studied in subsequent work. Furthermore, building happy rivers and lakes is not only applicable to those in China, but also in the rest of the world. To this end, a guideline must be developed as soon as possible to provide technical support for the building of happy rivers and lakes. We will continue to select more representative world rivers to verify the accuracy and adaptability of the RHI evaluation method.
Author Contributions
Conceptualization, C.L.; methodology, C.L. and S.J.; formal analysis, C.L. and Q.J.; writing—original draft preparation, Q.J.; writing—review and editing, C.L. and S.J.; visualization, Q.J.; supervision, C.L.; All authors have read and agreed to the published version of the manuscript.
Funding
This research was funded by the National High Technology Research and Development Program of China (No.2021YFC3200205); and the Cooperation Project of Shandong Water Transfer Operation and Maintenance Center (No.37000000025002920210100001).
Institutional Review Board Statement
Not applicable.
Informed Consent Statement
Not applicable.
Data Availability Statement
The data that support the finding of this study are available from the corresponding author upon reasonable request.
Conflicts of Interest
The happy river research group of the China Institute of Water Resources and Hydropower Research is involved in relevant work.
References
- GE, J.X. Rivers and Human Civilizations. Folk. Stud. 2021, 6. 5–13+158 (In Chinese) [Google Scholar]
- Carpenter, D.; Schwartz, J.; Slate, L.; Sinha, S.; Brennan, K.; MacBroom, J. The Status of Urban Stream Restoration in the United States. In Critical Transitions in Water and Environmental Resources Management; American Society of Civil Engineers: Reston, VA, USA, 2004; pp. 1–13. [Google Scholar]
- Palmer, M.A.; Bernhardt, E.S.; Allan, J.D.; Lake, P.S.; Alexander, G.; Brooks, S. Standards for Ecologically Successful River Restoration. J. Appl. Ecol. 2005, 42, 208–217. [Google Scholar] [CrossRef]
- Denneman, W.D.; De Pree, A.; Reininga, G.A.O.; Van Der Braak, J. Environmental Aspects of the Restoration of River Ecosystems in the Netherlands. Water Sci. Technol. 1995, 31, 147–150. [Google Scholar] [CrossRef]
- Chick, J.H.; Ickes, B.S.; Pegg, M.A.; Barko, V.A.; Hrabik, R.A.; Herzog, D.P. Spatial Structure and Temporal Variation of Fish Communities in the Upper Mississippi River System; Geological Survey La Crosse Wi Upper Midwest Environmental Sciences Center: La Crosse, WI, USA, 2005. [Google Scholar]
- Gloss, S.; Lovich, J.E.; Melis, T.S. The State of the Colorado River Ecosystem in Grand Canyon: A Report of the Grand Canyon Monitoring and Research Center 1991–2004; US Department of the Interior, US Geological Survey: Washington, DC, USA, 2005; Volume 1282.
- Zuo, Q.T.; Han, C.H.; Han, C.H. Study on the Theoretical Basis and Support System of River Governor System. Yellow River 2017, 39. 1–6+15 (In Chinese) [Google Scholar]
- Peng, H.; Han, Q.; Cao, J.P. Study on Evaluation Index System of River Chief System and Lake Chief System for Taihu Basin. China Water Resour. 2019, 06. 11–15+5 (In Chinese) [Google Scholar]
- Yu, X.B.; Tang, D.S. Comprehensive Implementation of River Chief System Effectiveness Evaluation in Jiangsu Province Based on AHP-EVM. Yellow River 2020, 42. 63–68+73 (In Chinese) [Google Scholar]
- Wang, G.J.; Liu, Z.; Lang, M.X. Performance Evaluation of River-Lake Chief System and its Implications. China Water Resour. 2021, 02, 15–18. (In Chinese) [Google Scholar]
- Speech at the Symposium on Ecological Protection and High-Quality Development of the Yellow River Basin. Available online: http://www.gov.cn/xinwen/2019-10/15/content_5440023.htm (accessed on 2 August 2022).
- To Write a New Chapter in River Protection and Management in the New Era. Available online: http://www.mwr.gov.cn/xw/slyw/201912/t20191205_1373783.html (accessed on 2 August 2022).
- Wu, E.N.; Yang, K.; Che, Y.; Yuan, W. Characterization of Rivers Health Status and its Assessment. Adv. Water Sci. 2005, 16, 602–608. [Google Scholar]
- Scrimgeour, G.J.; Wicklum, D. Aquatic Ecosystem Health and Integrity: Problems and Potential Solutions. J. N. Am. Benthol. Soc. 1996, 15, 254–261. [Google Scholar] [CrossRef]
- Wright, J.F.; Sutcliffe, D.W.; Furse, M.T. Assessing the Biological Quality of Freshwaters: RIVPACS and Other Techniques; Freshwater Biological Association: Ambleside, UK, 2000; pp. 1–24. [Google Scholar]
- Smith, M.J.; Kay, W.R.; Edward, D.H.D.; Papas, P.J.; Richardson, K.S.J.; Simpson, J.C. AusRivAS: Using Macroinvertebrates to Assess Ecological Condition of Rivers in Western Australia. Freshw. Biol. 1999, 41, 269–282. [Google Scholar] [CrossRef]
- Karr, J.R. Assessments of Biotic Integrity Using Fish Communities. Fisheries 1981, 6, 21–27. [Google Scholar] [CrossRef]
- Ladson, A.R.; White, L.J.; Doolan, J.A.; Finlayson, B.L.; Hart, B.T.; Lake, P.S.; Tilleard, J.W. Development and Testing of an Index of Stream Condition for Waterway Management in Australia. Freshw. Biol. 1999, 41, 453–468. [Google Scholar] [CrossRef]
- Raven, P.J.; Holmes, N.T.H.; Dawson, F.H.; Everard, M. Quality Assessment Using River Habitat Survey Data. Aquat. Conserv. Mar. Freshw. Ecosyst. 1998, 8, 477–499. [Google Scholar] [CrossRef]
- Zuo, Q.T. Human-Water Harmony Theory: From Idea to Theory System. Water Resour. Hydropower Eng. 2009, 40, 25–30. (In Chinese) [Google Scholar]
- Zuo, Q.T.; Zhang, Y.; Lin, P. Index System and Quantification Method for Human-Water Harmony. J. Hydraul. Eng. 2008, 4, 440–447. (In Chinese) [Google Scholar]
- Maslow, A.H. Motivation and Personality, 3rd ed.; China Renmin University Press: Beijing, China, 2012. (In Chinese) [Google Scholar]
- Helliwell, J.F.; Layard, R.; Sachs, J. World Happiness Report 2012. New York: UN Sustainable Development Solutions Network. Available online: https://worldhappiness.report/ed/2012/ (accessed on 2 August 2022).
- Research Group of the Happy River. Analysis of the Connotation and Index System for the Happy River. China Water Resour. 2020, 23, 1–4. (In Chinese) [Google Scholar]
- Liu, C.S.; Wang, J.H.; Jiang, Y.Z.; Qiu, Y.Q.; Zhang, H.T.; Guan, X.Y. River Happiness Index: The Evaluation System of River to Enriching the People. J. China Inst. Water Resour. Hydropower Res. 2021, 19, 441–448. (In Chinese) [Google Scholar]
- China Institute of Water Resources and Hydropower Research. China River Happiness Report 2020; China Water Resources and Hydropower Press: Beijing, China, 2021. (In Chinese) [Google Scholar]
- Transforming our World: The 2030 Agenda for Sustainable Development. Available online: https://sdgs.un.org/2030agenda (accessed on 2 August 2022).
- Upper Mississippi River Restoration Program. Available online: https://www.mvr.usace.army.mil/Missions/Environmental-Stewardship/Upper-Mississippi-River-Restoration/ (accessed on 2 August 2022).
- Johnson, B.L.; Hagerty, K.H. Status and Trends of Selected Resources of the Upper Mississippi River System: A Synthesis Report of the Long Term Resource Monitoring Program; US Geological Survey, Upper Midwest Environmental Sciences Center: La Crosse, WI, USA, 2008.
- Pietrucha-Urbanik, K. Assessment Model Application of Water Supply System Management in Crisis Situations. Global NEST J. 2014, 16, 893–900. [Google Scholar]
Figure 1.
Flowchart of the RHI evaluation system.

Figure 2.
Framework of the RHI.

Figure 3.
FCC evaluation results for China’s first-grade water resource zones.

Figure 4.
WRR evaluation results for China’s first-grade water resource zone.

Figure 5.
WEL evaluation results for China’s first-grade water resource zones.

Figure 6.
AEH evaluation results for China’s first-grade water resource zones.

Figure 7.
WCP evaluation results for China’s first-grade water resource zones.

Figure 8.
Evaluation results of the first-level indicators of the RHI in China.

Figure 9.
RHI evaluation results for China’s first-grade water resource zones.


Table 1.
Hierarchical framework of a happy river.
| Happy River Indicators | Happy River Objectives | Hierarchy of Needs | Maslow’s Hierarchy of Needs | |
|---|---|---|---|---|
| Vision | Target | |||
| river of security | A peaceful life with secure rivers | Low disaster losses, strong defense and high resilience | Basic level | Security and safety needs |
| river of prosperity | An affluent life with reliable water supply | Good water resource endowment, effectively guaranteed water use, development not restricted by water shortage, an affluent life | Physiological needs | |
| river of livability | A livable environment with clear waters and green banks | Improving the water environment of natural rivers and lakes; increasing the environmental quality of urban and rural water | Higher level | Social belonging needs |
| river of ecology | A symbiotic harmony with fish swimming in shallows | Maintaining river health; achieving human–water harmony | ||
| river of culture | A spiritual homeland with river civilizations | Respecting and protecting rivers; promoting the prosperity, flourishing and development of water culture, passing on historical water culture, and enriching the connotation of modern water culture | Highest level | Esteem needs |
| Self-actualization needs | ||||
Table 2.
A comparison between happy river indicators and the SDGs.
| Happy River Indicators | SDGs | |
|---|---|---|
| Goal | Target | |
| river of security | Goal 9. | 9.1 Develop quality, reliable, sustainable, and resilient infrastructure. |
| Goal 11. | 11.5 Significantly reduce the number of deaths and the number of people affected and substantially decrease the direct economic losses caused by disasters, including water-related disasters. | |
| Goal 13. | 13.1 Strengthen resilience and the adaptive capacity to climate-related hazards and natural disasters. | |
| river of prosperity | Goal 6. | 6.1 Achieve universal and equitable access to safe and affordable drinking water for all. |
| 6.4 Substantially increase water use efficiency across all sectors and ensure sustainable withdrawals and supply of freshwater to address water scarcity and substantially reduce the number of people suffering from water scarcity. | ||
| 6.5 Substantially increase water use efficiency across all sectors and ensure sustainable withdrawals and supply of freshwater to address water scarcity and substantially reduce the number of people suffering from water scarcity. | ||
| river of livability | Goal 6. | 6.3 Improve water quality by reducing pollution, eliminating dumping, and minimizing the release of hazardous chemicals and materials, halving the proportion of untreated wastewater and substantially increasing recycling and safe reuse globally. |
| river of ecology | Goal 6. | 6.6 Protect and restore water-related ecosystems, including mountains, forests, wetlands, rivers, aquifers, and lakes. |
| Goal 15. | 15.1 Ensure the conservation, restoration and sustainable use of terrestrial and inland freshwater ecosystems and their services, in particular forests, wetlands, mountains, and drylands. | |
| 15.5 Take urgent and significant action to reduce the degradation of natural habitats, halt the loss of biodiversity, and protect threatened species | ||
| A river of culture | Goal 6. | 6.b Support and strengthen the participation of local communities in improving water and sanitation management. |
| Goal 11. | 11.4 Strengthen efforts to protect and safeguard the world’s cultural and natural heritage. | |
Table 3.
Indicator system of the RHI.
| First-Level Indicator | Second-Level Indicator | Third-Level Indicator | Nature of Indicator | ||
|---|---|---|---|---|---|
| State Indicator | Capacity Indicator | ||||
| River Health | Human Experience | ||||
| Security of Flood Control (SFC) | 1. Flood-induced Mortality Rate (FMR) | - | √ | ||
| 2. Economic Loss Rate (ELR) | - | √ | |||
| 3. Rate of flood control Works with Accepted capacity (RWA) | Rate of Accepted Dikes (RAD) | √ | |||
| Rate of Accepted Reservoirs (RAR) | |||||
| Rate of Accepted flood detention Basins (RAB) | |||||
| 4. post-Disaster Recovery Capability (DRC) | - | √ | |||
| Water Resources Reliability (WRR) | 5. Available Water volume Per capita (AWP) | - | √ | ||
| 6. Water Supply Reliability (WSR) | Water Supply Coverage (WSC) | √ | |||
| Rate of actual Irrigated Areas (RIA) | |||||
| 7. Capacity for Supporting high-quality Development (CSD) | Water resources Utilization Rate (WUR) | √ | |||
| GDP Output per cubic meter of Water use (GOW | |||||
| 8. Life Satisfaction Index (LSI) | GDP Per Capita (GPC) | √ | |||
| Engel’s Coefficient (ENC) | |||||
| Average Life Expectancy (ALE) | |||||
| Water Environment Livability (WEL) | 9. Water Quality Index (WQI) | (River water Quality Index (RQI) | √ | ||
| Rate of Eutrophic Lakes and reservoirs (REL) | |||||
| 10. Qualification rate of surface centralized Drinking water Source (QDS) | - | √ | |||
| 11. Groundwater Protection Index (GPI) | - | √ | |||
| 12. Water Entertainment Index (WEI) | - | √ | |||
| Aquatic Ecosystem Health (AEH) | 13. Rate of major rivers and lakes with accepted Ecological Flows (REF) | - | √ | ||
| 14. Natural aquatic Habitat Retention rate (NHR) | Retention Rate of Waters (RRW) | √ | |||
| River longitudinal Connectivity Index (RCI) | |||||
| 15. Index of Biological Integrity (IBI) | - | √ | |||
| 16. Soil and Water Conservation rate (SWC) | - | √ | |||
| Water Culture Prosperity (WCP) | 17. water Culture Protection and inheritance Index (CPI) | water Heritage Protection capacity Index (HPI) | √ | ||
| Historical water culture Communication Capacity (HCC) | |||||
| 18. Modern water culture Creation and Innovation Index (MCI) | - | √ | |||
| 19. Water Landscape impact Index (WLI) | - | √ | |||
| 20. Public Awareness and Engagement in water governance (PAE) | public Awareness Rate of Water (ARW) | √ | |||
| public Engagement Rate in Water governance (ERW) | |||||
Table 4.
Grading standard for the RHI.
| RHI | Grade | ||
|---|---|---|---|
| RHI ≥ 95 | Very happy | ||
| 95 > RHI ≥ 85 | Happy | ||
| 85 > RHI ≥ 60 | Medium | 85 > RHI ≥ 80 | Medium high |
| 80 > RHI ≥ 70 | Middle medium | ||
| 70 > RHI ≥ 60 | Medium low | ||
| RHI < 60 | Unhappy | ||
Table 5.
Grading standard for evaluation indicators of the RHI.
| Score of Indicator V * | Grade | ||
|---|---|---|---|
| V ≥ 95 | Excellent | ||
| 95 > V ≥ 85 | Good | ||
| 85 > V ≥ 60 | Medium | 85 > V ≥ 80 | Medium high |
| 80 > V ≥ 70 | Middle medium | ||
| 70 > V ≥ 60 | Medium low | ||
| V < 60 | Poor | 60 > V ≥ 30 | Poor |
| V < 30 | Very poor | ||
* V indicates Fi, Si,j or Ti,j,k.
Table 6.
Weights of first-level and second-level indicators of the RHI.
| First-Level Indicator | Second-Level Indicator | Weight | |
|---|---|---|---|
| Security of Flood Control (SFC) | 1. Flood-induced Mortality Rate (FMR) | 0.25 | 0.30 |
| 2. Economic Loss Rate (ELR) | 0.30 | ||
| 3. Rate of flood control Works with Accepted capacity (RWA) | 0.30 | ||
| 4. post-Disaster Recovery Capability (DRC) | 0.10 | ||
| Water Resources Reliability (WRR) | 5. Available Water volume Per capita (AWP) | 0.25 | 0.20 |
| 6. Water Supply Reliability (WSR) | 0.30 | ||
| 7. Capacity for Supporting high-quality Development (CSD) | 0.25 | ||
| 8. Life Satisfaction Index (LSI) | 0.25 | ||
| Water Environment Livability (WEL) | 9. Water Quality Index (WQI) | 0.20 | 0.30 |
| 10. Qualification rate of surface centralized Drinking water Source (QDS) | 0.30 | ||
| 11. Groundwater Protection Index (GPI) | 0.20 | ||
| 12. Water Entertainment Index (WEI) | 0.20 | ||
| Aquatic Ecosystem Health (AEH) | 13. Rate of major rivers and lakes with accepted Ecological Flows (REF) | 0.20 | 0.30 |
| 14. Natural aquatic Habitat Retention rate (NHR) | 0.25 | ||
| 15. Index of Biological Integrity (IBI) | 0.20 | ||
| 16. Soil and Water Conservation rate (SWC) | 0.25 | ||
| Water Culture Prosperity (WCP) | 17. water Culture Protection and inheritance Index (CPI) | 0.10 | 0.25 |
| 18. Modern water culture Creation and Innovation Index (MCI) | 0.25 | ||
| 19. Water Landscape impact Index (WLI) | 0.25 | ||
| 20. Public Awareness and Engagement in water governance (PAE) | 0.25 | ||
Table 7.
Indicator calculation methods and sources of data.
| Criterion Layer | Indicator Layer | Calculation Method | Source | |
|---|---|---|---|---|
| FDS | FMR | The number of flood-induced deaths and missings/total population, ppm | Bulletin of Flood and Drought Disasters in China | |
| ELR | Direct economic losses from flood disasters/regional GDP during the same period, % | |||
| RWA | RAL | The length of main stream dikes that meet flood control standards set forth in relevant plans/total length of planned main stream dikes, % | Reports on comprehensive planning for river basins | |
| PAR | The number of reservoirs working well in flood control/total number of planned reservoirs, % | |||
| PAD | The number of flood detention basins working well in flood discharging, storage and detention/total number of planned flood detention basins in the river basin, % | |||
| DRC | The capacity for restoring post-disaster production and life to an orderly state according to experts | River basin authorities | ||
| RWR | AWP | Water resources per capita, m3/per | China Water Resources Bulletin | |
| WSR | WSC | The number of population having access to tap water/total population, % | China Urban-Rural Construction Statistical Yearbook | |
| PIA | Actual irrigation area/farmland irrigation area, % | China Water Statistical Yearbook | ||
| CSD | WER | Water supply/total water resources, % | China Water Resources Bulletin | |
| GOW | GDP/water consumption, RMB/m3 | |||
| LSI | GDP | GDP in the river basin/population in the river basin, % | ||
| ENC | Total food expenditures/total personal consumption expenditures, % | China Statistical Yearbook | ||
| ALE | The average age at death of the entire live-born population, year | China Health Statistical Yearbook | ||
| LWE | WQI | RQI | The length of rivers with Class III water quality and above/the length of rivers evaluated, % | China Water Resources Bulletin |
| PEL | The number of eutrophic lakes and reservoirs/the number of lakes and reservoirs evaluated, % | |||
| QDS | The number of qualified surface centralized drinking water sources/total number of surface centralized drinking water sources, % | |||
| GPI | Total regional shallow groundwater withdrawal/total regional allowable groundwater withdrawal, % | Data from national water resources survey and evaluation | ||
| WEI | The number of national water parks per 100,000 km2 of area | |||
| HAE | REF | The number of control sections (points) meeting the ecological flow target/the number of sections (points) evaluated, % | Comprehensive planning of water resources | |
| NHR | SAR | Water space area/historical reference area, % | Results of remote sensing interpretation of land use | |
| LCI | Barrier coefficient × position correction factor/the length of the river | Outcomes of national water censuses | ||
| IBI | Index of Biological Integrity (IBI)/the number of cases | National river and lake health assessment | ||
| SWC | Land area of mild soil erosion or below/land area evaluated, % | National dynamic monitoring of water and soil loss | ||
| PWC | CPI | HPC | (The number of provincial heritage sites + 2 × the number of national heritage sites + 5 × the number of world heritage sites)/drainage area/100,000 km2 | Relevant heritage lists |
| CDC | (2 × the number of national museums or bases + the number of provincial museums or bases)/drainage area/100,000 km2 | |||
| MCI | (2 × the number of national (laws and regulations + standards + awards + patents for invention) + the number of provincial (laws and regulations + standards + awards + patents for invention))/drainage area/100,000 km2 | |||
| WLI | (5 × (the number of world-class) + 2 × (the number of national) natural heritage water parks + the number of provincial (wetland parks + national parks))/population in the river basin | Natural heritage lists | ||
| PAE | ARW | public Awareness Rate of Water (ARW)/reference value | Public water awareness questionnaires | |
| PER | public Engagement Rate in Water governance (ERW)/reference value | Special survey reports on public engagement in water governance | ||
Table 8.
RHI evaluation results for the Yellow River Basin.
| Criterion Layer | Indicator Layer | Benchmark Value | Status Quo Value | Score | Weight | Subtotal | |
|---|---|---|---|---|---|---|---|
| FDS | FMR | 0% | 0.40% | 91.9 | 0.30 | 88.9 | |
| ELR | 0% | 0.22% | 85.3 | 0.30 | |||
| RWA | RAL | 100% | 87.5% | 87.5 | 0.12 | ||
| PAR | 100% | Medium-sized and large reservoirs: 100%, small reservoirs: 98% | 99.2 | 0.12 | |||
| PAD | 100 | 100.00 | 100.0 | 0.06 | |||
| DRC | 100 | 73.7 | 73.7 | 0.10 | |||
| RWR | AWP | 10,000 m3/per | 620.21m3/per | 44.8 | 0.20 | 64.6 | |
| WSR | WSC | 100% | 91.31% | 91.3 | 0.17 | ||
| PIA | 100% | 79.86% | 79.9 | 0.13 | |||
| CSD | WER | 40% | 70.76% | 50.6 | 0.12 | ||
| GOW | 509 m3 | 180.51 m3 | 34.0 | 0.13 | |||
| LSI | GDP | 132,400 (RMB) | 59,502.17 (RMB) | 43.1 | 0.08 | ||
| ENC | 25% | 26.58% | 94.1 | 0.09 | |||
| ALE | 81 | 74.16 | 91.6 | 0.08 | |||
| LWE | WQI | RQI | The proportion of the length of river with Class I~III water quality ≥ 90% | The proportion of the length of rivers with Class I~III water quality: 80.3%, the proportion of the length of rivers with water quality inferior to Class V: 9.2% | 87.1 | 0.18 | 66.2 |
| PEL | 0% | 25.00% | 75.0 | 0.12 | |||
| QDS | 100% | 74.50% | 74.5 | 0.30 | |||
| GPI | 0.3 | 1.04 | 26.0 | 0.20 | |||
| WEI | 100 | 14.90 | 69.8 | 0.20 | |||
| HAE | REF | 100% | 25.00% | 25.0 | 0.30 | 56.8 | |
| NHR | SAR | 100% | 79.02% | 79.0 | 0.125 | ||
| LCI | - | 0.61% | 75.4 | 0.125 | |||
| IBI | 1 | 0.429 | 42.9 | 0.20 | |||
| SWC | - | - | 85.7 | 0.25 | |||
| PWC | CPI | HPC | 10 | 9 | 90.0 | 0.15 | 80.6 |
| CDC | 6 | 4.92 | 82.0 | 0.10 | |||
| MCI | 6 | 4.86 | 81.0 | 0.25 | |||
| WLI | 6 | 3.84 | 78.4 | 0.25 | |||
| PAE | ARW | - | - | 0.00 | |||
| PER | 100% | 76.3% | 76.3 | 0.25 | |||
Publisher’s Note: MDPI stays neutral with regard to jurisdictional claims in published maps and institutional affiliations. |
© 2022 by the authors. Licensee MDPI, Basel, Switzerland. This article is an open access article distributed under the terms and conditions of the Creative Commons Attribution (CC BY) license (https://creativecommons.org/licenses/by/4.0/).
Share and Cite
MDPI and ACS Style
Ju, Q.; Liu, C.; Jiang, S. Integrated Evaluation of Rivers Based upon the River Happiness Index (RHI): Happy Rivers in China. Water 2022, 14, 2568. https://doi.org/10.3390/w14162568
AMA Style
Ju Q, Liu C, Jiang S. Integrated Evaluation of Rivers Based upon the River Happiness Index (RHI): Happy Rivers in China. Water. 2022; 14(16):2568. https://doi.org/10.3390/w14162568
Chicago/Turabian StyleJu, Qianqian, Changshun Liu, and Shan Jiang. 2022. "Integrated Evaluation of Rivers Based upon the River Happiness Index (RHI): Happy Rivers in China" Water 14, no. 16: 2568. https://doi.org/10.3390/w14162568
Note that from the first issue of 2016, this journal uses article numbers instead of page numbers. See further details here.