Article

Spatiotemporal Changes in the Supply and Demand of Ecosystem Services in China’s Huai River Basin and Their Influencing Factors

1
School of Architecture and Design, China University of Mining and Technology, Xuzhou 221000, China
2
School of Civil Engineering, Jiaying University, Meizhou 514015, China
3
School of Architecture and Urban Planning, Nanjing University, Nanjing 210093, China
4
School of Urban and Environmental Science, Huaiyin Normal University, Huai’an 223300, China
5
Key Research Base of Philosophy and Social Sciences of Colleges & Universities in Jiangsu Province, Research Institute of Huai River Eco-Economic Belt, Huai’an 223300, China
*
Author to whom correspondence should be addressed.
Water 2022, 14(16), 2559; https://doi.org/10.3390/w14162559
Submission received: 30 June 2022 / Revised: 6 August 2022 / Accepted: 17 August 2022 / Published: 19 August 2022

Abstract

:
An imbalance between the supply and demand of ecosystem services can cause ecological problems. By determining the spatiotemporal changes in the supply and demand and the factors underlying these changes, the ecosystem service supply in river basins can be increased to match the demand; this information has great significance for the sustainable development of the basin. By focusing on the cities in China’s Huai River Basin, the data on ecosystem service supply and demand from 2010 to 2020 were measured using supply–demand matrices, and the spatiotemporal characteristics of the supply–demand balance were analyzed using the supply–demand index and Moran’s I statistics. Next, geographical detectors and multiscale geographically weighted regression models were used to examine the factors influencing the spatiotemporal changes in ecosystem service supply and demand and their spatial effects. The results indicated the following: (1) From 2010 to 2020, ecosystem service supply in the Huai River Basin decreased by 2.51 × 10⁸, whereas the ecosystem service demand increased by 4.43 × 10⁸; in general, the demand exceeded the supply, and 69.74% cities were in a state of deficit. (2) The Moran’s I index of the ecosystem service supply and demand was greater than 0.4, which means that there was a strong spatial clustering, and the characteristics of high–high clusters gradually weakened and those of low–low clusters enhanced in the northern and eastern cities. (3) The q values of the ecological-use land area, construction-use land area, rain, and temperature were greater than 0.3, indicating a significant effect on the supply and demand. These findings can provide a targeted reference and basis for the ecological management of the Huai River Basin.

1. Introduction

Ecosystem service refers to the products and services directly or indirectly obtained through the ecosystem to maintain human survival [1]. Ecosystem service supply refers to the services that ecosystems provide to human societies, while ecosystem service demands are the services that human societies acquire from ecosystems for their survival and development [2,3]. The relationship between ecosystem service supply and demand reflects the quality of the region’s ecological environments, and coordination between this supply and demand can drive sustainable socioeconomic development and enhance human well-being. An imbalanced supply and demand of ecosystem services will harm the ecological balance, severely affecting the functions of ecosystem services and endangering ecological environments [4]. Rapid urban expansion and deteriorating ecological environments have been increasingly deteriorating the ecosystem supply–demand imbalances [5] in many cities and regions.
Research on ecosystem service supply and demand began with research on the bearing capacities [6] and values [7] of ecosystem services. The earliest research on ecosystem service supply and demand introduced these concepts and constructed the theoretical frameworks [8]. Since then, many scholars have engaged in case studies quantifying ecosystem service supply and demand. These studies mainly involved empirical discriminations by experts, equivalents of ecological value, and modeling. For example, Burkhard et al. evaluated the supply and demand of ecosystem services in eastern Germany using the expert experience discrimination method [2]. This semi-quantitative and semi-qualitative research method, to evaluate supply and demand, is easy to operate, as well as applicable, but it is also subjective, and its accuracy is affected by expert knowledge. Costanza used the value equivalent factor method to evaluate the value of global ecosystem services [1]. This method refers to a large number of economic and social data, and to some extent avoids the influence of subjectivity on the calculation results. However, due to the multiplicity of values and the complexity of ecosystem services, the supply and demand values of ecosystem services are difficult to comprehensively measure. Boithias et al. assessed the supply–demand ratio of water supply capacity in the Ebro River Basin by simulating the water production module in the InVEST model [9]. The model simulation method can simulate the formation mechanism and process of ecosystem services, and the results of the research on the supply and demand of ecosystem services are more objective and reliable, but it requires the organic combination of various disciplines, the process is complicated, and the data requirements are high. Focusing on ecologically fragile regions, such as the Loess Plateau [10]; the South China Karst [11]; and Northwest China [8] and economic development regions, such as the Yangtze Delta [12], Jingjinji Metropolitan Region [13], and Barcelona [14], these studies range in scale from individual administrative units [15,16,17] to watersheds that span multiple administrative units [18]. A comprehensive quantitative model that includes ecosystem service indicators, such as food supply, carbon sequestration services, and water production services, was gradually developed [19]. Although an increasing number of studies have examined the factors influencing ecosystem service supply and demand, there is still insufficient research on the relationship and spatial heterogeneity of influencing factors. Chen and Gong argued that socioeconomic and natural environmental factors have effects on supply and demand, but failed to demonstrate the mechanisms underlying each factor’s effects [20]. Zhao et al. used a geographical detector to study the effects of natural and social factors on ecosystem service supply and demand but did not obtain spatial heterogeneity information on the factors’ effects on the supply–demand relationship [21]. Furthermore, few studies on ecosystem service supply and demand have compared the quantification of supply and demand across multiple time series, considered economically underdeveloped or developing regions, or analyzed the underlying mechanisms.
The Huai River Basin is located between the Yangtze River Basin and the Yellow River Basin. Although the economic development in this region has been lagging, it is one of the regions with the most development potential in central-eastern China [22]. Many scholars have studied the Huai River Basin. For example, Wang, K, et al. summarized the previous flood management modes in the Huai River Basin and introduced flood management measures in the Yangtze River Basin in order to provide experience and reference for flood management in the Huai River Basin [23]; Liang, JL, et al. analyzed the degree of Cultivated Land Fragmentation and its spatiotemporal distribution characteristics, along with the influencing factors in the Huai River Basin. This study has important implications for maintaining food security [24]; Wang, HR discussed the impact of landscape patterns evolution on ecosystem services in Huai River Basin [25]. However, most of these studies start from a single ecosystem service, lacking collaborative management research. In 2018, China initiated the Huai River Ecological and Economic Belt Development Project [26], accelerating development in the Huai River Basin. This region thus urgently requires a coordinated ecological environment management solution to maintain the sustainability of a composite social–economic–natural ecosystem.
Consequently, the main research purposes of this paper are as follows: (1) Taking the developing Huai River Basin urban agglomeration as the research sample area, the multi-time series land use data between 2010 and 2020 were selected, and the supply–demand matrix method was used to determine the matching situation of the supply and demand of ecosystem services in the period 2010–2020. (2) Spatial autocorrelation analysis was used to clarify the temporal and spatial evolution characteristics of the supply and demand relationship. (3) The geographic detector model and multi-scale geographic weighted regression model (MGWR) were used to reveal the influence of economic, social, and natural factors on the evolution of the supply and demand relationship and spatial heterogeneity information. (4) The research results provide a scientific basis and reference for promoting sustainable development and the well-being of residents in the Huai River Basin.

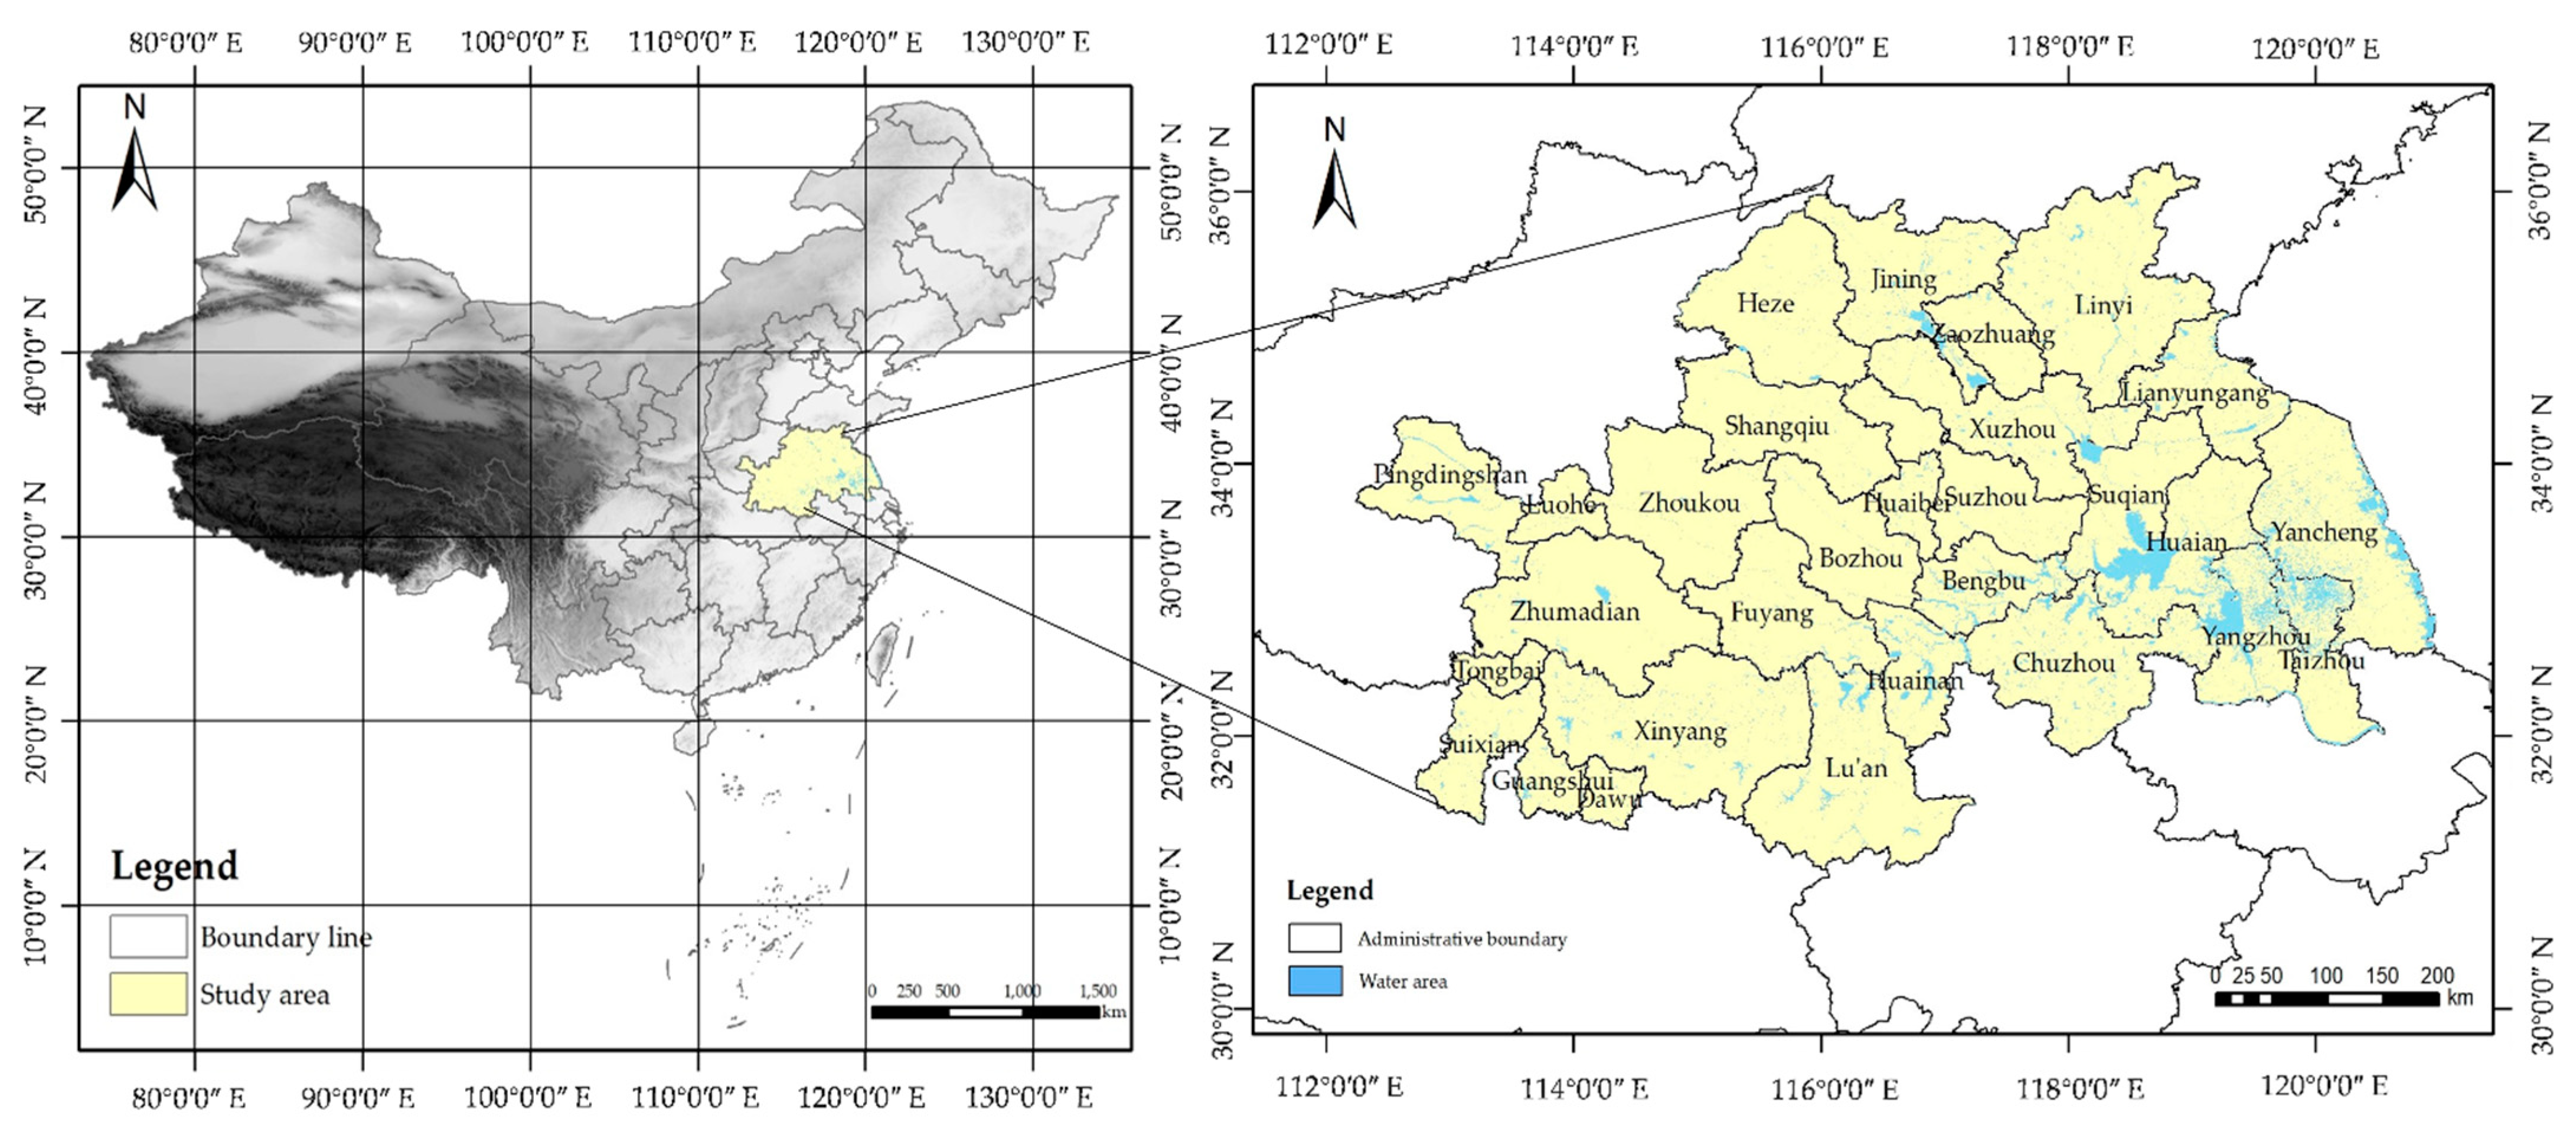
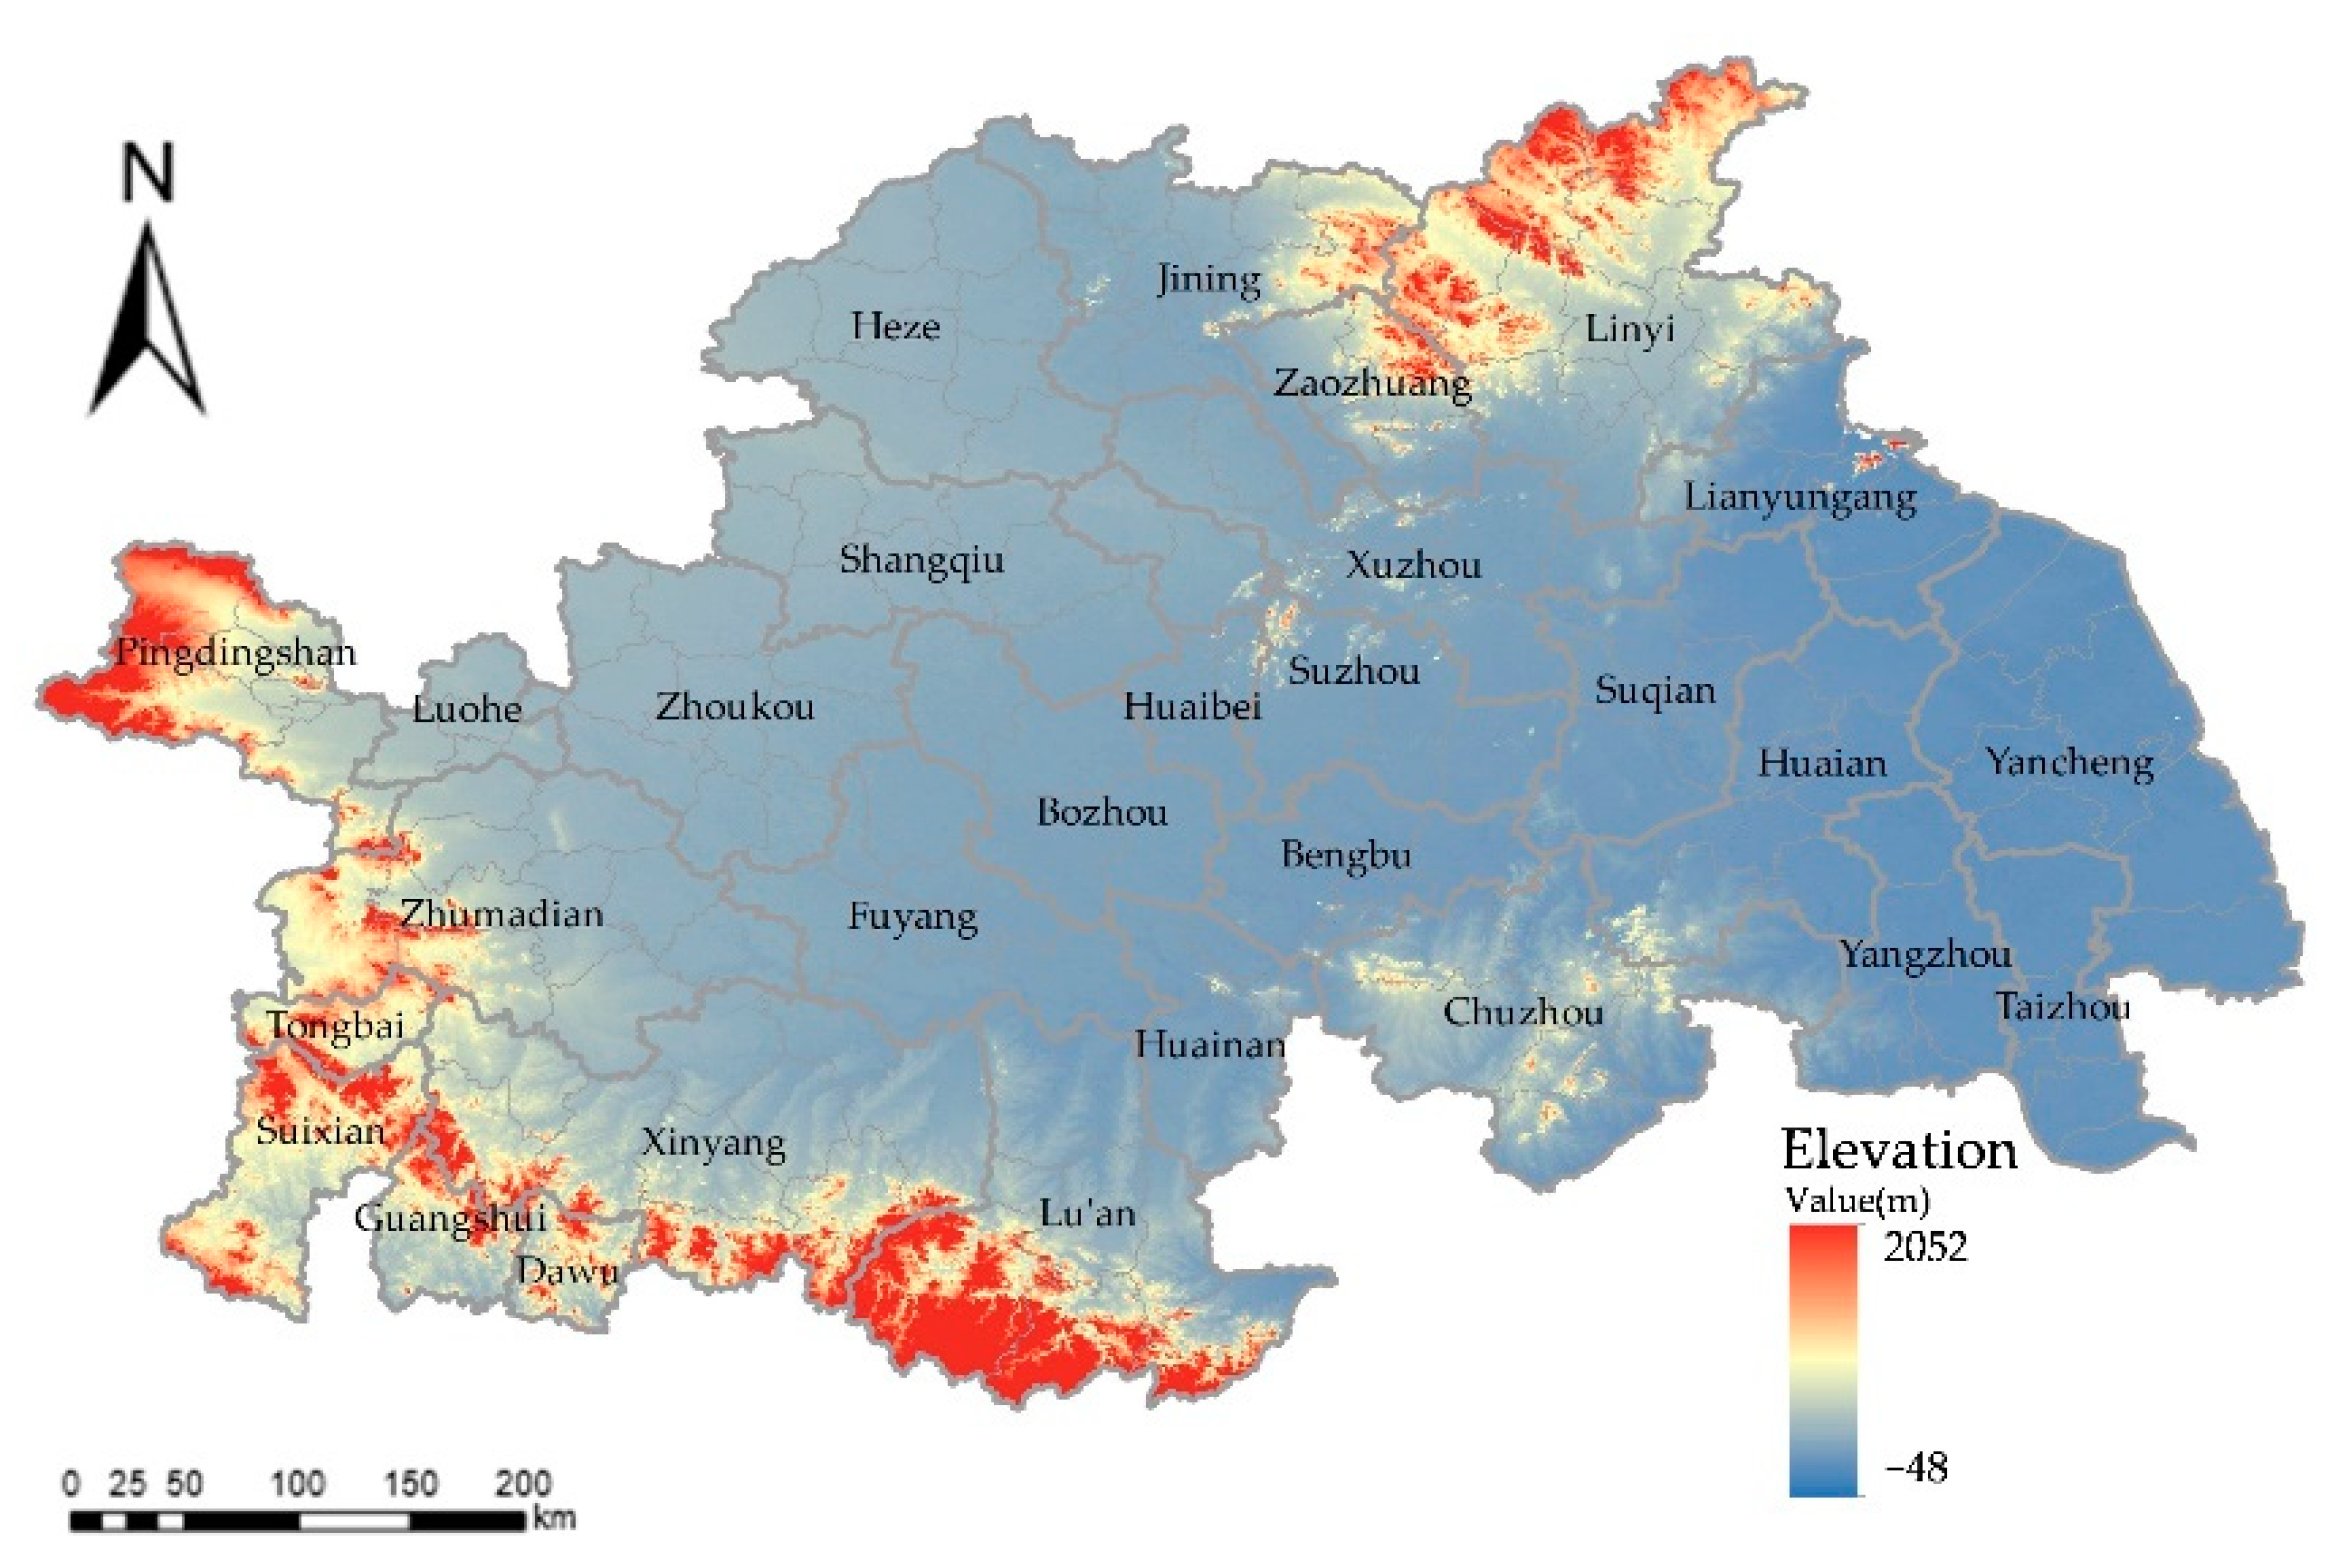
2. Research Area and Data

In accordance with the Huai River Ecological and Economic Development Plan approved by the State Council of the People’s Republic of China [24], as depicted in Figure 1, the Huai River Basin ranges from 112.24° E to 120.96° E and 31.01° N to 36.21° N (overall area: 24.3 km2). It has 25 prefecture-level cities (including Huaian, Xuzhou, Huainan, Jining, and Xinyang) and 4 county-level cities (including Suizhou and Guangshui). This region is situated in China’s North-South Transitional Zone, with the region north of the river belonging to the warm temperate zone and the region south of the river belonging to the subtropical zone; both regions are characterized by monsoons. The geomorphology of the Huai River Basin is complex and diverse. It has a block mountain in the northeast; mountains and hills in the west and south; and alluvial, diluvial, lacustrine, and marine plains in the middle. The mountainous and hilly areas account for approximately one-third of the total area, and the plain area accounts for approximately two-thirds of the total area. The Huai River Basin demonstrates massive development potential due to its rich biodiversity and abundant natural resources. At the end of 2020, the population of this region was 162 million and the regional GDP was CNY 8.76 trillion. In recent years, urbanization in the Huai River Basin has accelerated, leading to contradictions in development, such as environmental pollution and limited resource capacities [27], which severely constrain the sustainable development of the region, necessitating measures for promoting harmonious socioeconomic and natural growth.

3. Materials and Methods

3.1. Materials

This study used data on (1) land use in 2010 and 2020 (Figure 2), obtained from GlobeLand30 (http://www.globallandcover.com/ (accessed on 10 January 2022)) [28] at a spatial resolution of 30 m, and analyzed them using mapping and analytics software ArcGis10.5 (GeoScene Information Technolog Co., Ltd., Beijing, China); (2) topographical data in the form of a digital elevation model (Figure 3) obtained from Geospatial Data Cloud (http://www.gscoud.cn/ (accessed on 16 January 2022)) [29] at a spatial resolution of 30 m and analyzed them using ArcGis10.5; (3) weather data obtained from the Resource and Environment Science and Data Center (https://www.resdc.cn/ (accessed on 23 January 2022)) [30], specifically spatial interpolation data on annual rainfall and annual average temperatures, at a spatial resolution of 1 km between 2010 and 2020; and (4) socioeconomic data on the 29 cities in the Huai River Basin obtained from the 2011 and 2011 publications of the China City Statistical Yearbook [31] and the seventh national census report [32].

3.2. Methods

This study considered the ecological and socioeconomic background of the Huai River Basin, features of the region’s ecosystem service demand, and data availability to measure the supply and demand of Huai River Basin ecosystem services in terms of supply, regulation, and cultural services by using the ecosystem services supply and demand assessment matrix proposed by Burkhard et al. [2].
(1) Six experts with a strong understanding of the natural and social environment research and backgrounds in landscape ecology and geography were invited to assess ecosystem service supply and demand for six types of land use. The first edition of the ecosystem service supply matrix and demand matrix for the study area was formed after rounding the arithmetic average of the first round of results calculated by the experts, the results were fed back to the experts for correction, and, finally, the supply and demand matrices were determined (Table 1 and Table 2) [33,34]. The values in the demand and supply matrix indicate the following: 0 = no relevant supply/demand from people within the particular land cover type for the selected ecosystem service; 1 = low relevant demand or supply; 2 = relevant demand or supply; 3 = medium relevant demand or supply; 4 red = high relevant demand or supply; and 5 = very high relevant demand or supply [35]. On the basis of these scores, an ecosystem service supply matrix and an ecosystem service demand matrix for the region were developed to measure the supply and ecosystem service demand in the Huai River Basin. The ecosystem services supply matrix determines the capacity of specific services provided by different types of land use, and the demand matrix demonstrates the ecosystem service demand for specific types of land use.
The formula for calculating ecosystem service supply is as follows:
E S s x = i = 1 6 L A i × S i
Here, E S s is the supply of ecosystem service x , L A i is the area for land use i , and S i is the level of supply for land use type i ; the values are between 0 and 5.
The formula for calculating the demand of ecosystem services is as follows:
E S D x = i = 1 6 L A i × D i
Here, E S D is the supply of ecosystem service x , L A i is the area for land use i , and D i is the level of supply for land use type i ; the values are between 0 and 5.
(2) Determining the match between ecosystem service supply and demand
The degree to which ecosystem service supply matches the demand was calculated using a supply and demand index (SDI):
SDI = E S s E S D E S D
where SDI is the degree to which ecosystem service supply matches the demand, E S s is ecosystem service supply, and E S D is ecosystem service demand. When S D I > 0 , the supply is greater than the demand, indicating a state of abundance. S D I = 0 indicates that the supply matches the demand, indicating a state of equilibrium. S D I < 0 indicates that the supply is less than the demand, indicating a state of deficit.
(3) Spatiotemporal characteristics of the ecosystem services SDI
Tobler’s First Law of Geography holds that everything is related to everything else, but near things are more related to one another. Spatial autocorrelation measures the spatial correlation between spatial objects and their corresponding attribute values [36]. Moran’s I was used to measure the spatial autocorrelation of the degree to which ecosystem service supply in the Huai River Basin matched the demands within the region. Moran’s I was further distinguished into global and local Moran’s I. The global Moran’s I was used to describe the overall distribution of the SDI in the Huai River Basin and judge whether SDI exists as an aggregation phenomenon in space. The local Moran’s I is useful for determining the type of spatial aggregation and its location [37]. Their formulas are as follows.
Global Moran’s I:
I = n i = 1 n j = 1 n W i j ( x i x ¯ ) ( x j x ¯ ) i = 1 n j = 1 n W i j ( x i x ¯ ) 2
Local Moran’s I:
I = n 2 i j w i j × ( x i x ¯ ) j w i j ( x j x ¯ ) j ( x j x ¯ ) 2
In these formulas, n is the number of spatial unit samples in the research area; x i and x j are the properties of spatial units i and j , respectively; and x ¯ is the mean value of the property. The sum W i j represents the weight matrix of each spatial unit i and spatial unit j within the research scope.
Global autocorrelation is mainly determined using the positive or negative size of the Z -score and the P value. Whether Moran’s I is positive or negative determines whether the global autocorrelation is scattered or clustered overall. When Moran’s I is >0, the spatial distribution is positively correlated; the greater the value, the more evident the spatial correlation, indicating that the research objects are characterized by spatial dispersion. When Moran’s I is equal to 0, the spatial distribution is random; this means that the research objects are distributed randomly. Local autocorrelation is mainly calculated using cluster and outlier analysis (Anselin Local Moran’s I) in ArcGIS; the resulting Moran’s I reflects the correlation of attributes between the research regions.
(4) Analyzing the influencing factors in the evolution of ecosystem service supply and demand
To calculate the ecosystem service supply and demand and consider the natural and socioeconomic state of the Huai River Basin and data availability, the social factors in this study were GDP, population, area of farmland, ecological-use land area, and construction-use land area, and the natural factors were elevation, slope, temperature, and rain [21]. The factor detector of the geographical detector model was used to calculate the explanatory power of each influencing factor in regard to the spatial distribution of ecosystem services SDI, revealing the main social and natural factors influencing the spatiotemporal differentiations in ecosystem service supply and demand.
Factor detection involves determining whether changes in a certain influencing factor and the SDI demonstrated a significant and spatial consistency; if the changes demonstrate consistency, then the factor has decisive meaning in the spatial differentiation of the SDI [38]; the formula is as follows:
q = 1 1 N σ 2 i = 1 m n σ i 2
where q is the influence of the explanatory power of the factor on the supply–demand index and has a value range of 0–1; the greater the value, the stronger the influence of the explanatory power of the factor. N and n are the number of units in the i layer and the whole region, respectively, and σ i 2 and σ 2 are the SDI variance for the i layer and the whole region, respectively.
(5) Multiscale geographically weighted regression
Multiscale geographically weighted regression (MGWR) models can be used to examine the spatial relationships between dependent variables and explanatory variables. On the basis of the adaptive selection of bandwidths, these models explore the main driving factors under different spatial scales and are an optimized version of geographically weighted regression models [39]. A MGWR model is expressed as follows:
y i = j = 1 n a j x i j + j = n + 1 m β j ( μ i , γ i ) x i j + ε i
where ( μ i , γ i ) is the geographical coordinates of the city, j is the number of cities, a j is the regression coefficient of the global variable, x i j is the observed value of the jth variable at position i, β j is the regression coefficient of the local variable, and ε i is the random error term. In this paper, a bandwidth search was performed using golden-section search and Gaussian models; optimal bandwidths were identified using AICc [40].

4. Results

The supply and demand of ecosystem services in the Huai River Basin were calculated using ecosystem service supply and demand matrices. Next, using the ArcGIS spatial distribution module, the calculation results were presented by county to determine the spatiotemporal distribution of ecosystem service supply and demand in the Huai River Basin.

4.1. Ecosystem Services Supply

Overall, the ecosystem service supply in the Huai River Basin declined from 2010 to 2020, decreasing from 60.63 × 10⁸ in 2010 to 58.12 × 10⁸ in 2020. Weishan County, Jining, showed the greatest decline (0.91 × 10⁷), followed by the Lianyun District of Lianyungang City (0.65 × 10⁷) and the Xiangshui District of Yancheng City (0.52 × 10⁷). The cities with the highest declines were concentrated in the Jiangsu and Shandong provinces. This is mainly due to the rapid urbanization in these two provinces over the past 10 years, as massive amounts of construction-use land have eroded the amounts of agricultural-use land and ecological-use land, leading to the declining supply of ecosystem services. Furthermore, between 2010 and 2020, an increase in ecosystem service supply was noted in Xinghua City, of 0.43 × 10⁷; Dongtai City, of 0.37 × 10⁷; and Gaoyou City, of 0.12 × 10⁷. The supply increase in Xinghua City was due to the depollute lakes project, which restored the free water surfaces of rivers and lakes. Improvements to water environments increase biodiversity and enhance the functions of ecosystem services, thus increasing ecosystem service supply.
As depicted in Figure 4, spatial differentiations were observed in the ecosystem service supply in the Huai River Basin, with a greater supply in the south and a lower supply in the north. Cities south of the Huai River—such as Lu’An City, Xinyang City, Guangshui City, and Sui County under the administration of Suizhou City, and Dawu County of Xiaogan City—have large amounts of ecological-use lands, such as forests and plains, which have large supplies of regulating services and cultural services. Furthermore, Yangzhou City and Huai’An City have large bodies of water, such as Gaoyou Lake and Hongze Lake, and, therefore, have larger supplies of aquatic products and cultural services. These cities also have higher supply levels for regulating services. Cities in the northern region of the Huai River Basin have higher rates of urbanization and greater proportions of construction-use land; consequently, their overall supply levels are not high.

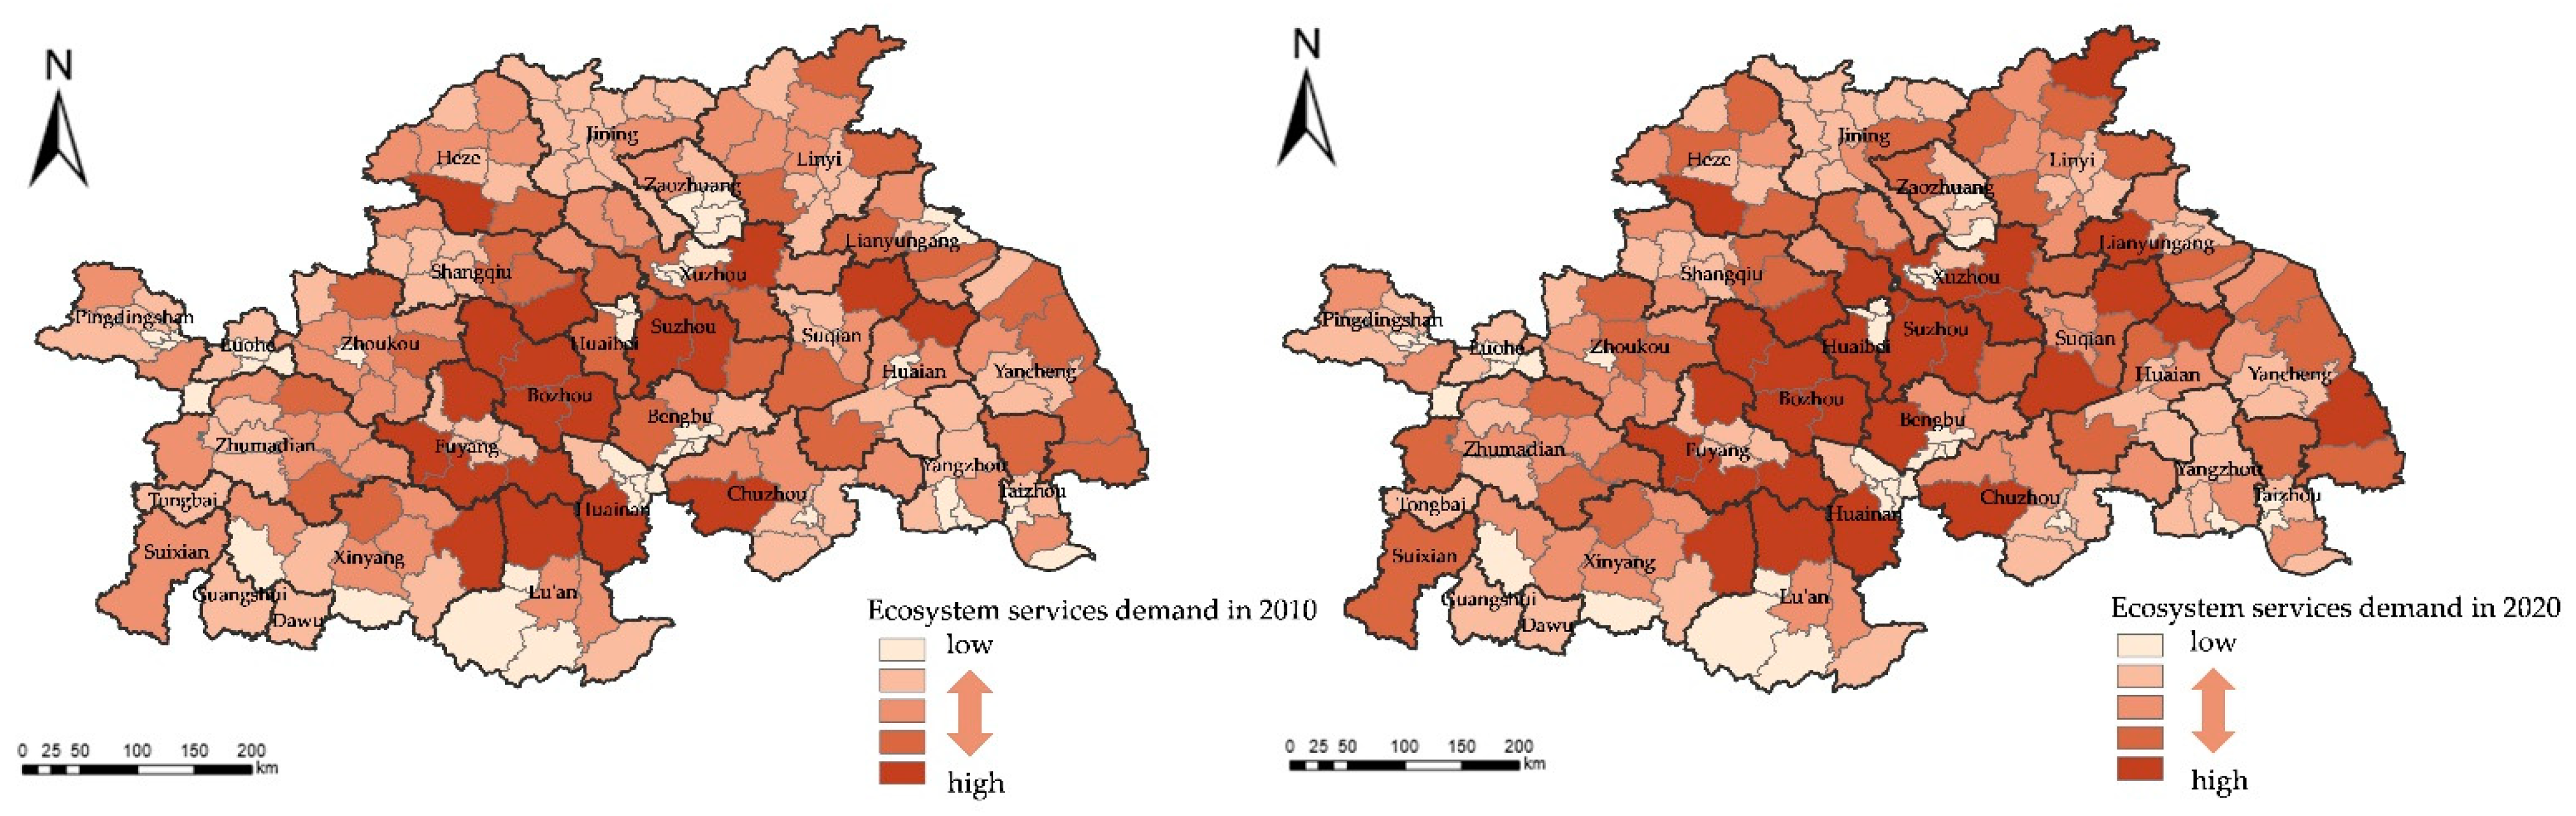
4.2. Ecosystem Services Demand

Ecosystem service demand in the Huai River Basin increased from 56.68 × 10⁸ 2010 to 61.11 × 10⁸ in 2020. Weishan County demonstrated the highest increase in demand, from 0.19 × 10⁸ in 2010 to 0.32 × 10⁸ in 2020, a growth of 0.13 × 10⁸ in 10 years. This is mainly due to Nanshi Lake, situated in the county, drastically shrinking in the surface area as a result of the cultivation of farmlands and aquaculture farms around the lake. This increase in agricultural-use land, coupled with the increase in construction-use land due to rapid urbanization [41], further increased the ecosystem service demand.
As depicted in Figure 5, the ecosystem service demand in the Huai River Basin is higher in the center of the region and lower in the peripheries. The high-value zones are concentrated in Bozhou City in Anhui Province and the junctions between Fuyang City and Lu’An City and Huainan City; middle and low-value zones are mostly distributed among Jiangsu, Shandong, and Henan. As of 2020, the high-value zones in the Huai River Basin were spread out toward the boundaries of the region, from Anhui Province toward Jiangsu, Shandong, and Henan provinces; the number of medium- and high-value zones also increased significantly.

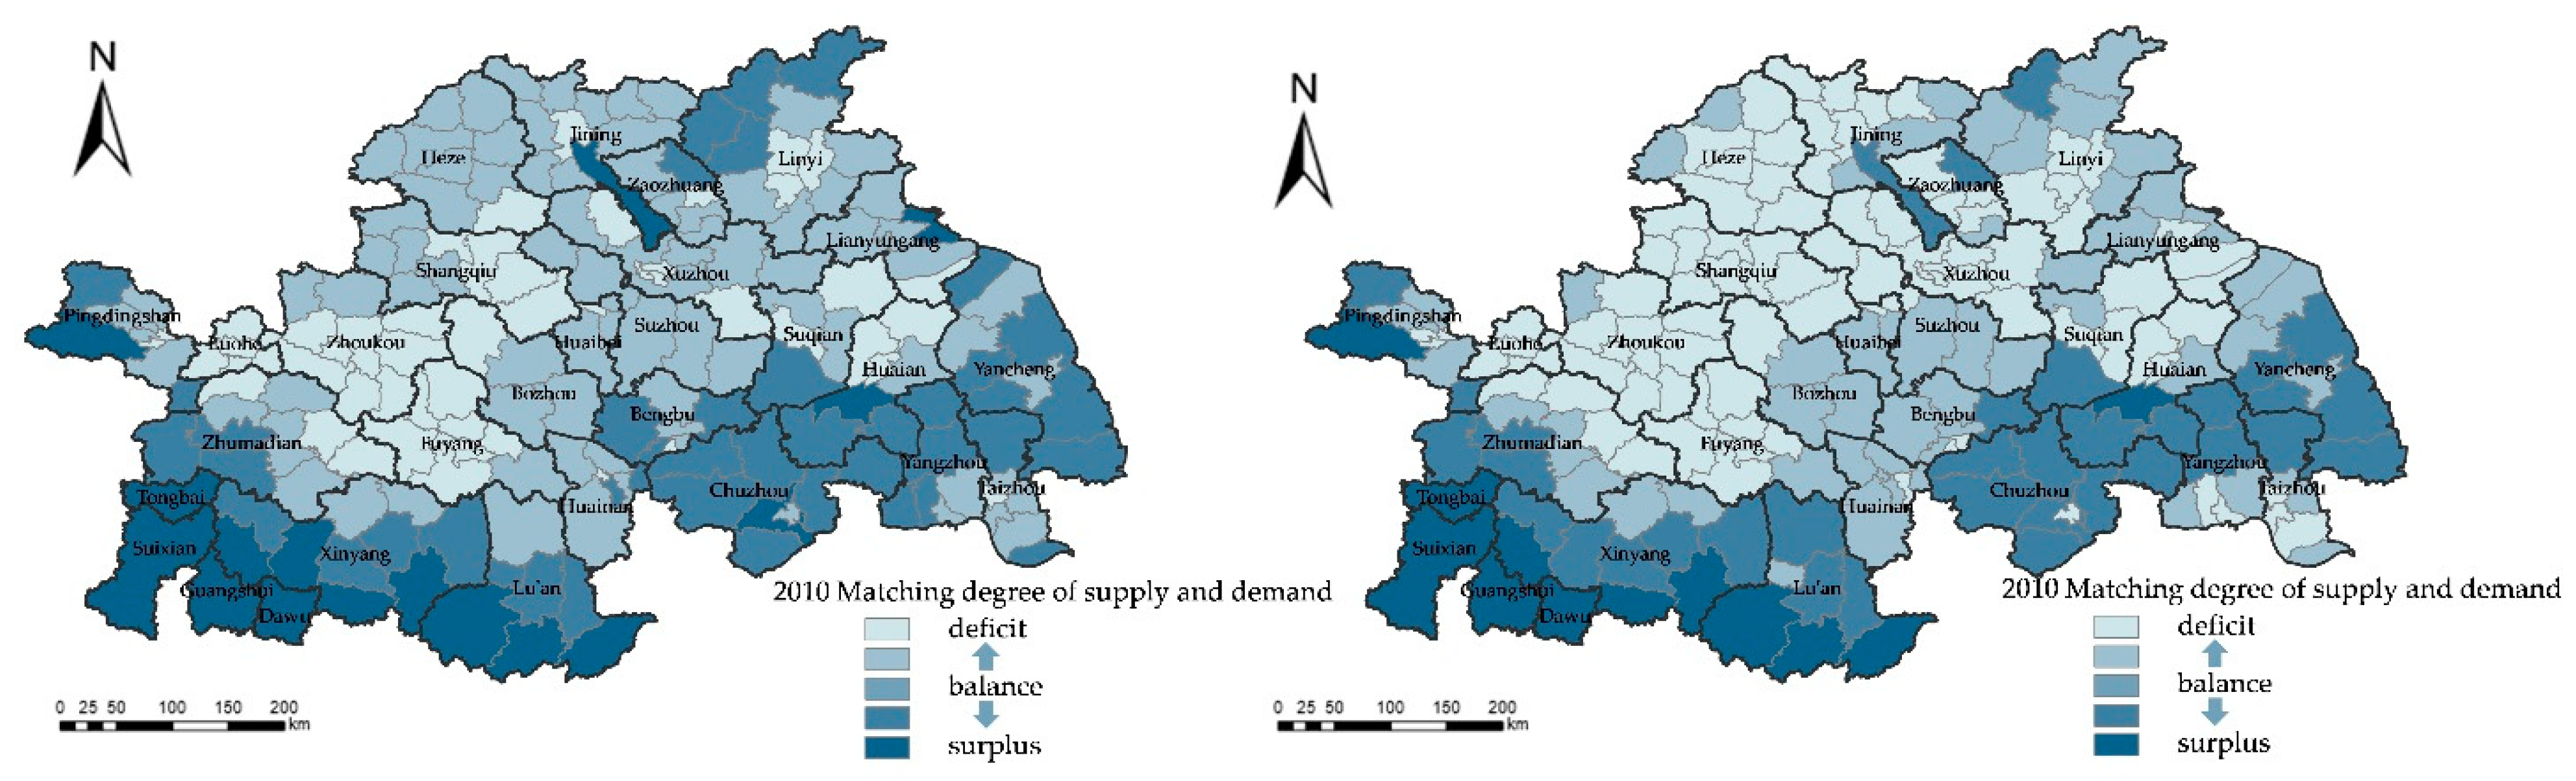
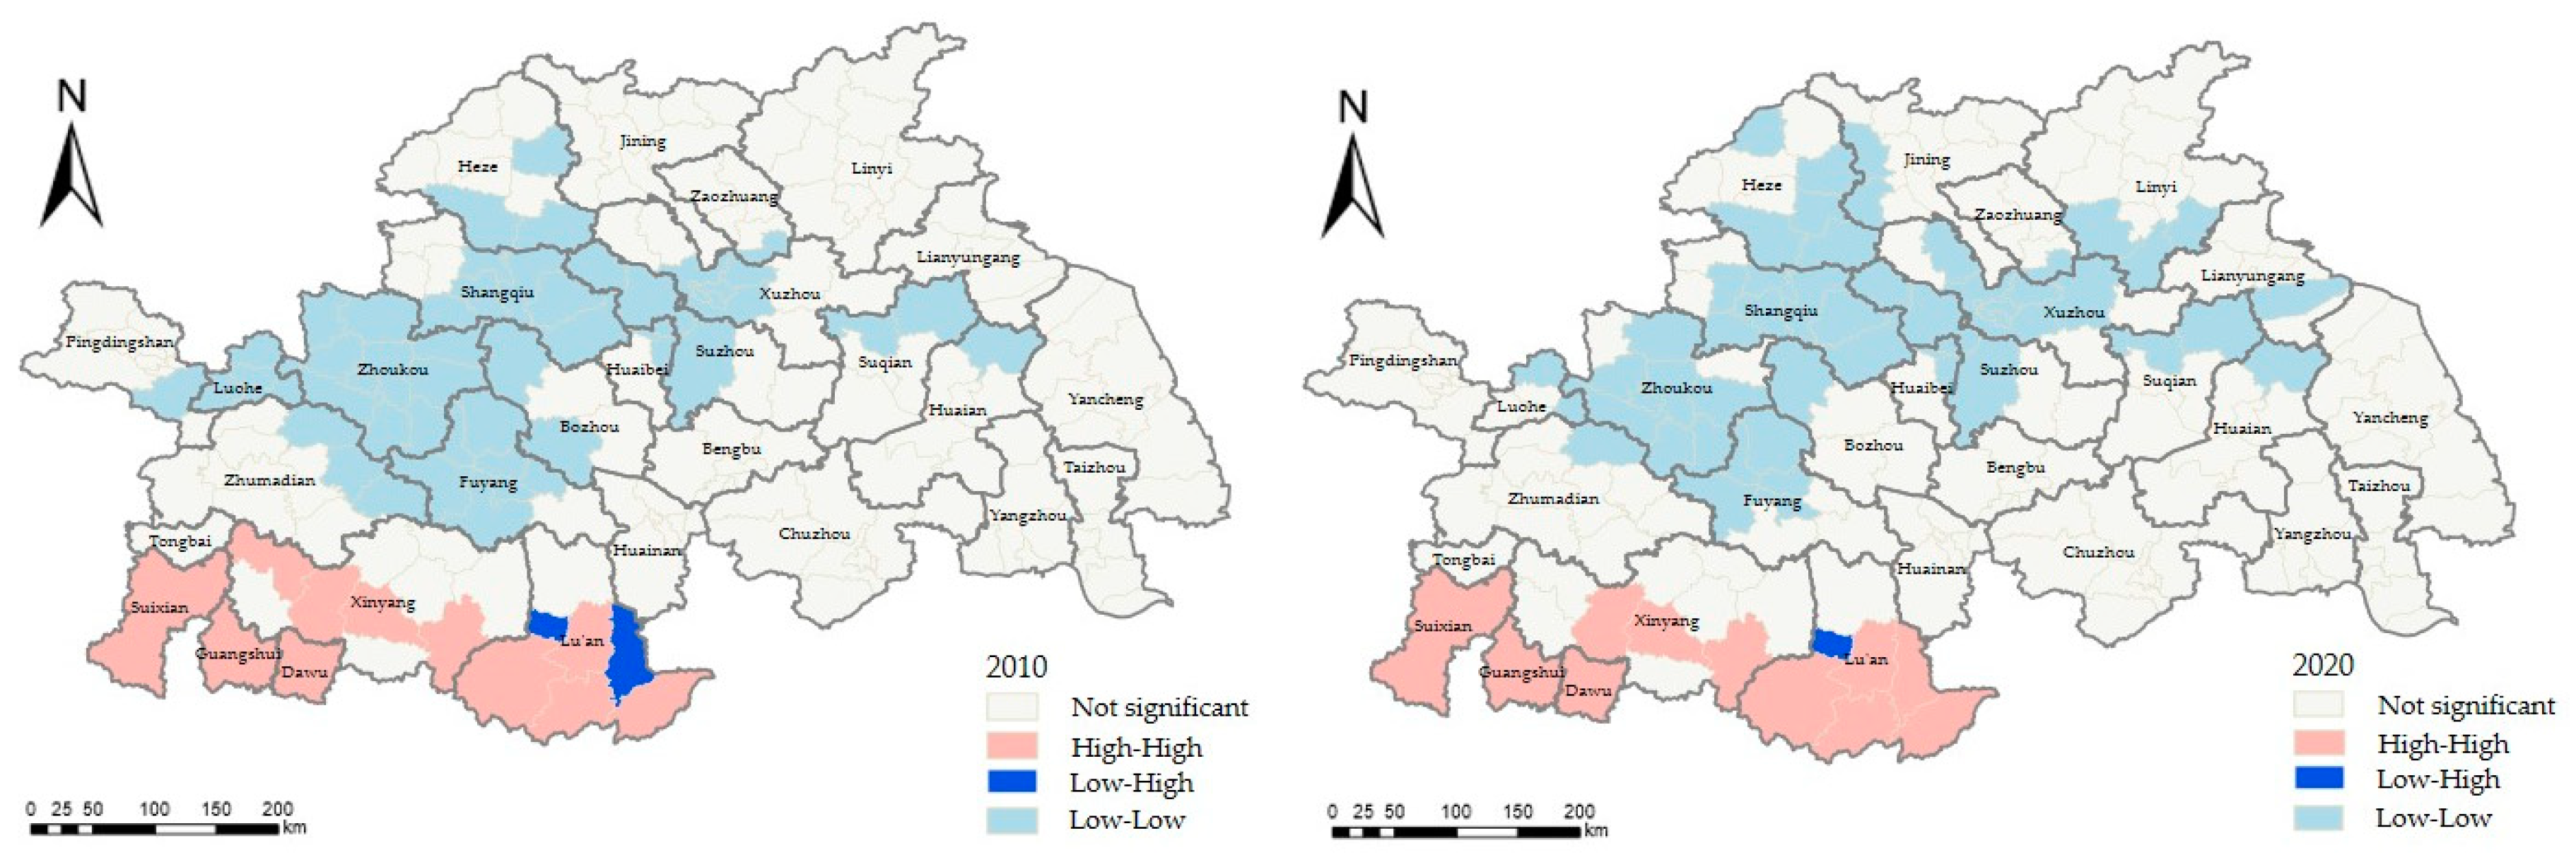
4.3. Supply and Demand of Ecosystem Services

As depicted in Figure 6, the demand exceeded the supply of ecosystem services in the Huai River Basin. The supply–demand balance was higher in the south and lower in the north, specifically, the central-northern cities in the Basin, which include Shangqiu City, Zhoukou City, and Luohe City. The Huai River Basin has 195 districts and counties, and in 136 of them (69.74%), the SDI was lower than 0. The supply–demand balance continued to worsen, and as of 2020, the severe supply–demand imbalance had spread from the central and northern cities toward the north, with severe deficits appearing in cities such as Xuzhou, Heze, and Jining.
The areas with SDI > 1 were concentrated in the southwest region of the Huai River Basin: Sui County and Guangshui within Suizhou City; Dawu County within Xiaogan; Xin County and Shangcheng County in the south of Xinyang City; and Jinzhai County, Huoshan County, and Shucheng County in Lu’An City. This region has abundant ecological resources and is a critical green and ecological barrier in the basin with abundant forest resources; the better the forest resource maintenance, the higher the ecosystem service supply. Furthermore, this region has smaller urban construction zones, resulting in lower ecosystem service demand and, consequently, a greater state of surplus.
Moran’s I indices and local indicators of spatial association (LISA) were used to analyze the global and local autocorrelations of the SDI of ecosystem services among the city clusters in the Huai River Basin. The Moran’s I indices between 2010 and 2020 were 0.411 and 0.425, respectively, indicating that the SDI demonstrated significant and positive spatial correlations and that the spatial clusters were significant. The Moran’s I indices increased somewhat in 2020, indicating that spatial clustering in the SDI in the basin was reinforced.
A LISA diagram was generated by using the Anselin Local Moran’s I function in the Spatial Statistics Tools of ArcGIS. As depicted in Figure 7, on the basis of the LISAs of the SDI, the city clusters were spatially distinguished into high–high clusters, low–low clusters, low–higher clusters, and nonsignificant clusters. High–high clusters indicate that the high–value point of the SDI is surrounded by other high–value points. The surplus of ecosystem service supply is high in this area, and the degree of spatial variation is small, showing an aggregated state. Low–low clusters indicate that the low–value point of the SDI is surrounded by other low–value points, and the regional ecosystem has a serious deficit of supply and demand, a small degree of spatial variation, and an aggregated state. Low–higher clusters indicate that the low–value point of the SDI is surrounded by high-value points, and the matching degree between the supply and demand of ecosystem services in this region is high as a whole, but there are low–value abnormal points, and the spatial variation degree is large, showing a low–high discrete state. Nonsignificant clusters refer to the sample points without statistical significance.
The high–high clusters were mainly concentrated in the southern region of the basin, which has a well-established ecological foundation with comprehensive ecological functions; the sparse population distribution is also subject to greater natural environment restrictions, and socioeconomic development in this region is, therefore, slower. Low–low clusters are concentrated around Zhoukou City, Shangqiu City, and Fuyang City, which have lower matching degrees of ecosystem services supply and demand. In 2020, the low–low clusters began to spread to the northern and eastern cities, such as Xuchou, Suzhou, and Heze. This indicates that the ecosystem service supply–demand balance deteriorated and that ecological risks continue to increase.

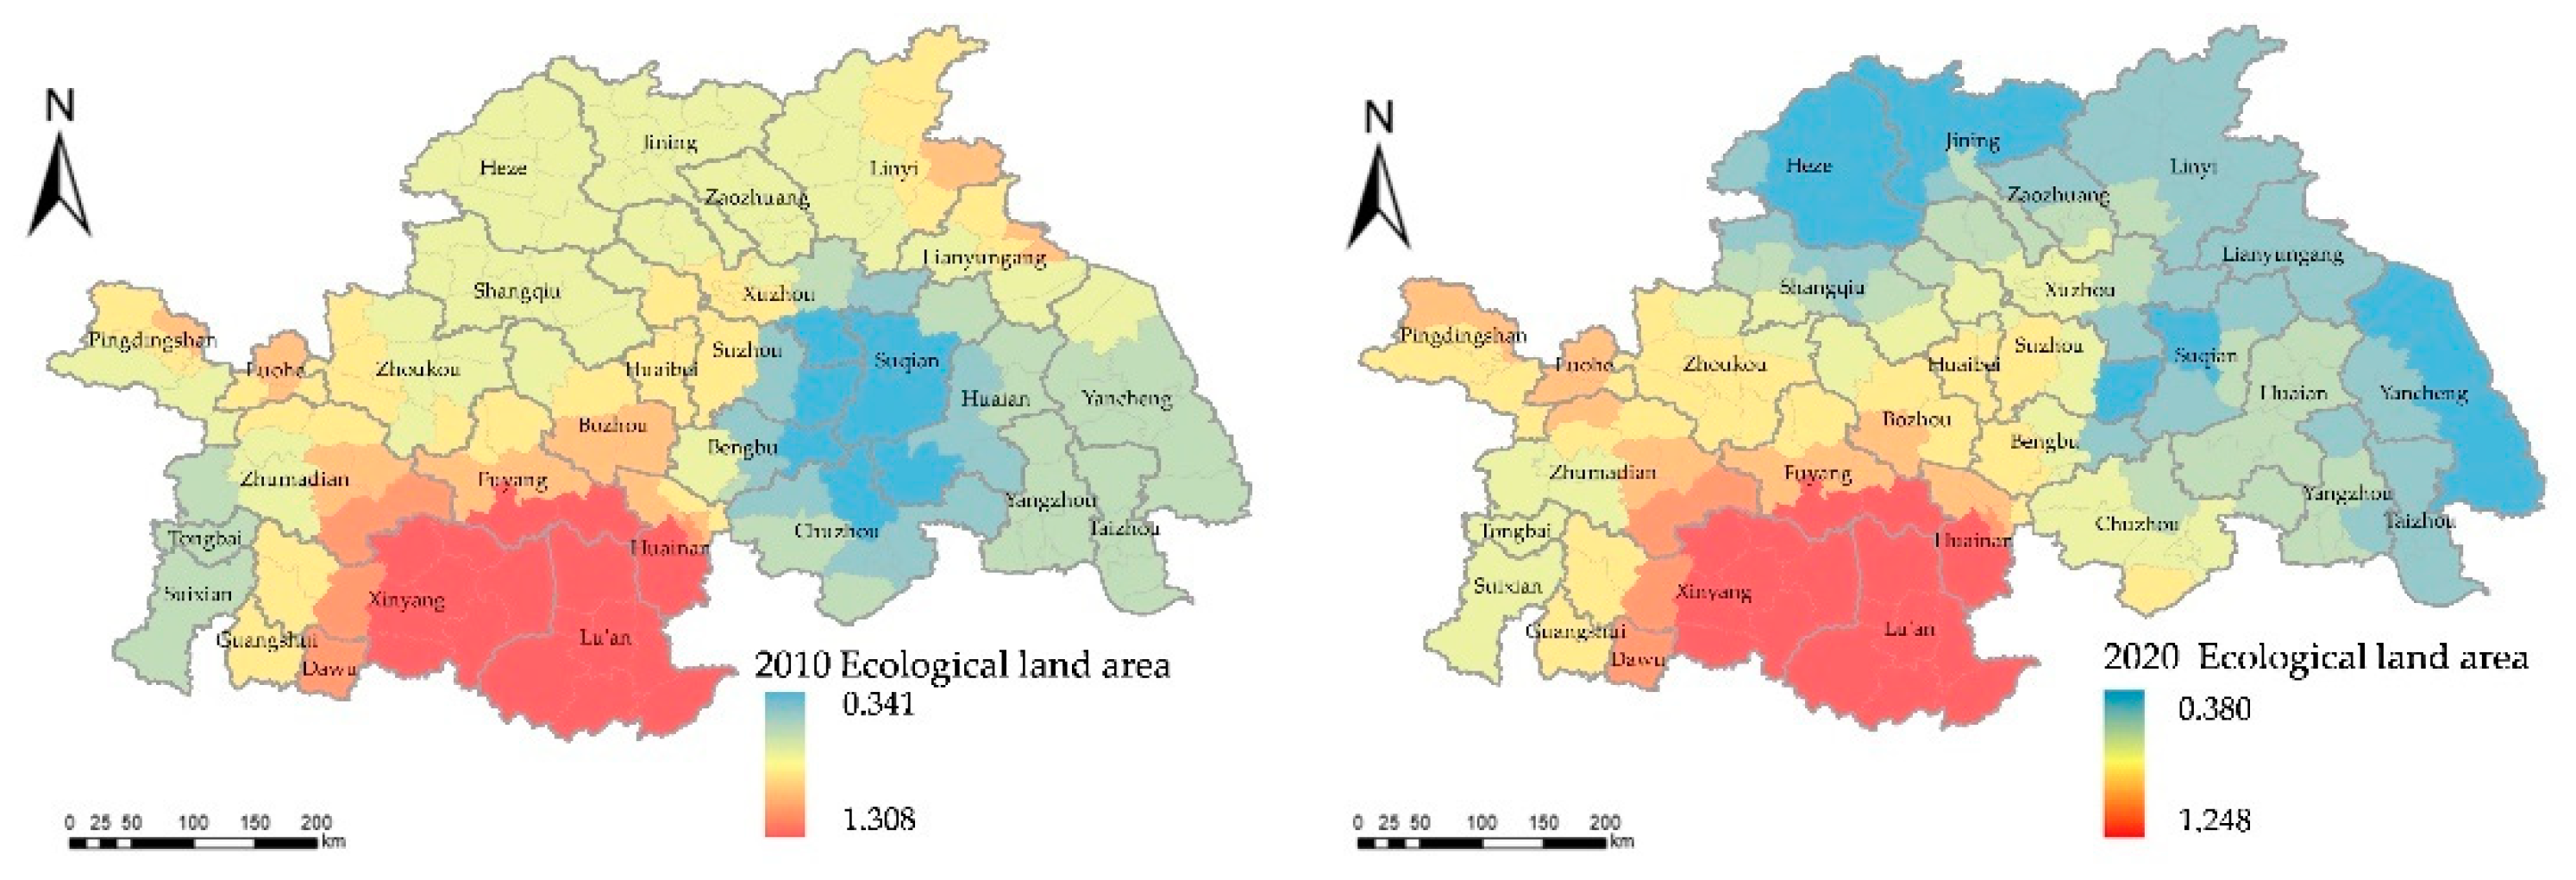
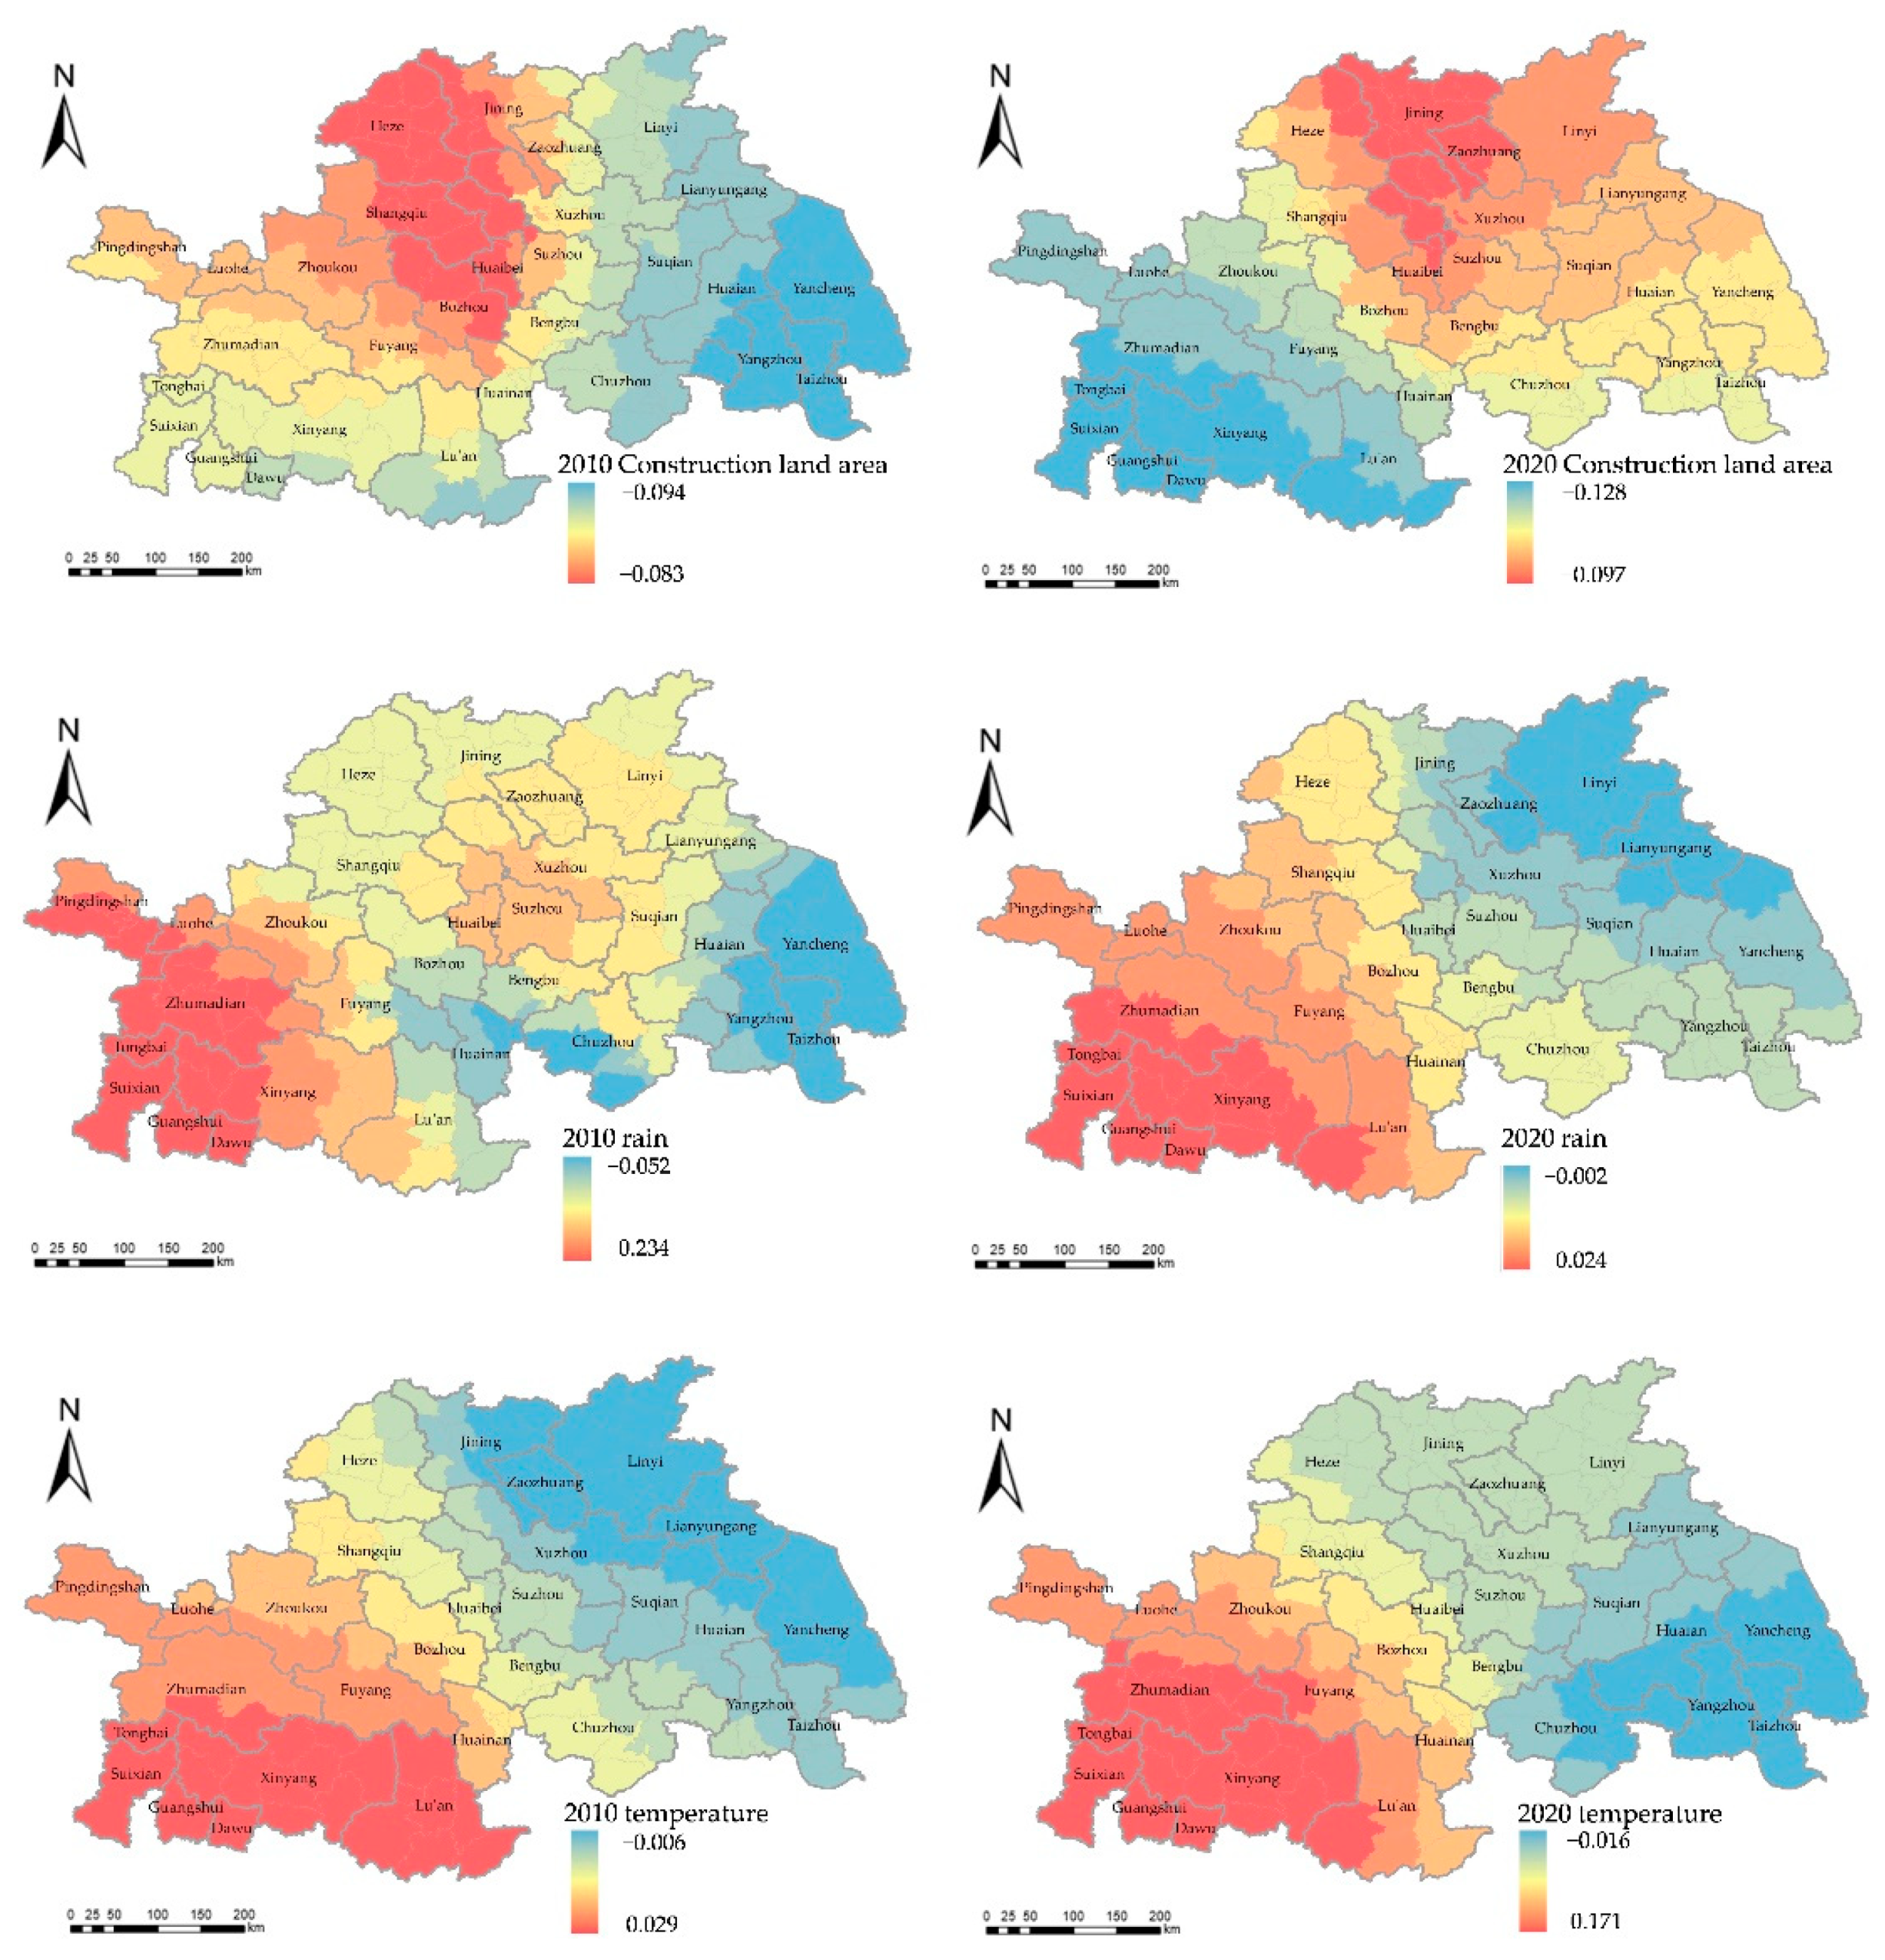
4.4. Factors in Ecosystem Service Supply and Demand

According to the factor detection analysis in the geographical detector model, as shown in Table 3, the SDI in the Huai River Basin was affected by both natural factors, particularly rain and temperature, and social factors, particularly ecological-use and construction-use land areas. The social factors generally had higher q values, indicating their leading role in affecting ecosystem service supply and demand.
In 2010, the influencing factors in order of q value were ecological-use land area (0.870), construction-use land area (0.537), rain (0.413), temperature (0.389), elevation (0.271), GDP (0.227), population (0.214), slope (0.077), and area of farmland (0.029). Among these, the ecological-use land area and construction-use land area had q > 0.5, indicating that land use was the main factor in ecosystem service supply and demand in 2010. Rain and temperature (both q > 0.3) were also major factors. Therefore, the management of ecosystem services should focus on controlling rapid urban expansion and conserving ecological-use land to reduce the effects of human activity on ecosystem services while also paying attention to the effects of climate change.
In 2020, the order of factors according to q values was ecological-use land area (0.871), construction-use land area (0.507), rain (0.412), temperature (0.364), elevation (0.251), population (0.263), GDP (0.123), slope (0.074), and area of farmland (0.065). The order of factors did not change to a great extent much between 2010 and 2020. Although the contribution of ecological-use land increased after 2010, those of construction-use land and rain decreased. These trends demonstrate that the size of ecological-use land had an increasing influence on the supply and demand of ecosystem services—ten years of rapid urbanization have not only expanded the area of urban construction zones, increasing the ecosystem service demand, but the process of urbanization also massively encroached on ecological-use land, leading to declining supplies of ecosystem services. Therefore, the management of ecosystem services should focus on controlling urban expansion and reducing the resulting damage to ecological-use land while maintaining the ecological red line and ecological reserve spaces. Other measures include active ecological restoration planning to expand ecological areas and increase ecosystem service supply.

4.5. Analyzing the MGWR Model Results

Although geographical detectors allow for selecting the main factors that affect the supply and demand of ecosystem services in the Huai River Basin, it cannot depict the effect of each factor on the SDI in each city. As such, the factors in the detectors with explanatory powers greater than 0.3 were selected to further simulate the direction and intensity of their influence and spatiotemporal differences.
In this study, the Ordinary Least Square (OLS) model and MGWR model were used to explore the influence of spatial distribution on the supply and demand matching relationship. By comparing the running results of the two models (Table 4), it was observed that the R2 and Adj. R2 of MGWR were greater than 0.9 and much higher than the OLS model, and the AICc value and residual sum of squares were significantly lower than those of the OLS model, which indicates that MGWR performs better than OLS model and can better explain the influence of various factors on the spatial distribution of the supply and demand matching relationship. Therefore, this study deeply analyzed the influence mechanism of the supply and demand of ecosystem services in the Huai River Basin using the MGWR model. Based on the regression coefficient of MGWR output, visual analysis was carried out using the ArcGIS spatial distribution module, as shown in Figure 8.
(1) Ecological-use land area
The regression coefficients of ecological-use area size between 2010 and 2020 were positive. Furthermore, the mean values of the regression coefficients were 0.576 and 0.552, which showed the greatest intensities among all the influencing factors. This indicates that the ecological-use area size has a significant influence on the supply and demand of ecosystem services. Furthermore, the mean values of the regression coefficients were 0.208 and 0.211, the greatest intensities among all the influencing factors. Zones with high regression coefficients for ecological-use area sizes were concentrated in Lu’An, Huainan, and Xinyang. The increased area size of ecological-use land will drive a significant increase in the SDI in the region.
(2) Construction-use land area
The regression coefficients of the construction-use area size between 2010 and 2020 were negative values, indicating that the increased construction-use areas impaired the ecosystem service supply–demand balance. The values were lower in 2020 than in 2010, indicating an increase in the negative influence of construction-use land. From a spatial distribution perspective, the regression coefficients for construction-use land centered around Heze, Jining, and Xuzhou and gradually decreased outward. Low-value zones in 2010 were mainly clustered around Yancheng, Yangzhou, and Taizhou, and in 2020, they had shifted to Tongbai, Guangshui, and Xinyang. Increases in construction-use land will lead to a severely increased supply–demand imbalance in the region.
(3) Rain
The regression coefficients for rain were between −0.052 and 0.234 (mean: 0.035) in 2010 and between −0.002 and 0.024 (mean: 0.01) in 2020. This decline demonstrates the declining effect of rain on the ecosystem service supply–demand balance in the Huai River Basin. The proportion of positive mean values was 73.84% and 85.64%, respectively; from a global perspective, rain has a positive influence on the supply–demand balance. The spatial distribution revealed that the high-value zones in 2010 were concentrated in the east and west of the basin, while the medium-value and low-value zones were more dispersed. In 2020, the distribution was higher in the west and gradually decreased towards the east.
(4) Temperature
The regression coefficients for temperature were between −0.006 and 0.029 in 2010 (mean: 0.006; proportion of positive values: 53.33%) and between −0.016 and 0.171 (mean: 0.046; proportion of positive values: 77.94%) in 2020. Temperature had a smaller effect on supply to demand matching in the Huai River Basin in 2010, but by 2020, the mean values and positive value rate had markedly increased, demonstrating a positive effect on the supply–demand balance in the basin. The spatial distribution revealed visible spatial heterogeneity, with higher values in the west, which decreased gradually toward the east.

5. Discussion

Ecosystem services are the foundation of the survival and development of human society. Due to their role in the sustainable development of human society, an investigation into ecosystem service supply and demand and their influencing factors carries vital significance in human well-being [42]. In this study, the Huai River Basin was selected as the research area, and the empirical research on ecosystem services of developing urban agglomerations was considered. Multi-time series measurement is helpful to determine the evolution trend of supply and demand in the Huai River Basin. In addition, on the basis of identifying the influencing factors, the paper also adopted the MGWR model to analyze the relationship between and spatial heterogeneity information of related factors. Compared with the traditional GWR model, the MGWR model takes into account the differences in spatial scale, and is optimized on the basis of inheriting the advantages of the GWR model [40]. It provides a vital reference for the drafting and implementation of differentiated ecological management strategies in the Huai River Basin. Ecosystem service supply and demand among the cities in the Huai River Basin echoes research findings of cities in the Yangtze Delta [43]. Due to socioeconomic development, the increase in construction-use land has resulted in rising ecosystem service demand; however, the constant encroachment on ecological-use land has weakened the region’s ecosystem services supply capacity. Although the Huai River Basin has a greater area of farmland and higher levels of food service supply, the ecological-use land area is smaller, and the supply of regulating services and cultural services is consequently lower. Therefore, ecosystem service supply–demand in the basin is in a state of deficit. Furthermore, massive differences in the natural resources of the river basin have led to different levels of urbanization, and subsequently, ecosystem service supply and demand also demonstrate significant spatial heterogeneity. The natural environment and socioeconomic factors affect ecosystem service supply and demand to different degrees [21]. Natural factors, such as rain and temperature, in the Huai River Basin will affect the relationship between the supply and demand of ecosystem services, but social factors are the main factors in the evolution of the ecological relationship. With the rapid development of cities, the change in land use has had a significant impact on ecosystem services, the urban construction area has been increasing, and the ecological land has been eroded, resulting in the intensification of the contradiction between supply and demand.
This study has certain limitations. (1) The supply–demand matrix is a semiquantitative approach, and although it can display the evolving characteristics of ecosystem service supply and demand in the Huai River Basin, the matrix is limited by the subjective views of the expert panel, the members of which having their own limitations and uncertainties. In the future, more abundant watershed data could be collected, and the physical quantity of ecosystem services in the watershed could be measured using InVEST and other models. (2) Different scales have different ecological resources and socio-economic development, which leads to differences in ecosystem services supply, demand, and matching degrees between supply and demand. In the future, research could be carried out on multiple scales to provide a more detailed and scientific reference for ecosystem service management. (3) There is a flow between ecosystem supply and demand, and there is also a flow of ecosystem services between spaces. It is of great significance to understand the spatial transfer law of ecosystem services and coordinate the relationship between the supply and demand of ecosystem services scientifically. In the future, based on the analysis of the relationship between the supply and demand of ecosystem services, research should further build a simulation model of the flow of ecosystem services, reveal the transmission path of ecosystem services from the supply area to the benefit area and the attenuation law in the process of flow, and reduce the flow consumption caused by human activities in the process of the supply and demand of ecosystem services.

6. Conclusions

This study quantitatively assessed the ecosystem services supply–demand balance in the Huai River Basin in China between 2010 and 2020 by using the ArcGIS program. Next, using geographical detectors, the main factors that influenced the matching degrees of ecosystem services supply and demand in the Huai River Basin were identified. The main conclusions are as follows:
(1) Ecosystem service supply in the Huai River Basin demonstrated an overall downward trend from 2010 to 2020; the spatial distribution was high in the south and low in the north. Overall, the ecosystem service demand increased from 2010 to 2020, being higher in the center of the region and lower in the peripheries.
(2) The ecosystem service demand in the Huai River Basin exceeded the supply. In 2010, 136 districts and counties were in a state of ecosystem service deficit; by 2020, this number was 146. The areas with a higher SDI were mainly concentrated in the southwestern region of the basin.
(3) The Moran’s I statistics of the supply–demand indices between 2010 and 2020 were 0.411 and 0.425, respectively, indicating a reinforcement of the spatial clustering of supply–demand matching in the Huai River Basin. High–high clusters were mainly concentrated in the southern region of the basin, and low–low clusters were concentrated around Zhoukou City, Shangqiu City, and Fuyang City. An increase in the number of low–low clusters toward the northern and eastern cities was observed.
(4) Ecosystem service supply and demand in the Huai River Basin are affected by both social factors, such as ecological-use and construction-use land areas, and natural factors, such as rain and temperature, with social factors having greater effects than natural factors.
(5) The MGWR model revealed that the ecological-use land area had a positive effect on the SDI in all Huai River Basin cities, whereas the construction-use land area impaired the SDI in the entire region. Other factors demonstrated positive effects in most cities and inhibitory effects in others.
According to the research results, the following suggestions are proposed for the ecological management of the Huai River Basin. On the one hand, we should revitalize the vitality of the city through “stock planning”, promote urban renewal, and restrain the rapid expansion of the city so as to reduce the demand level of ecosystem services and ease the tension between supply and demand. On the other hand, permanent basic farmland, the ecological protection red line, and the urban development boundary should be scientifically demarcated so as to encourage the underdeveloped areas in the Huai River Basin to develop their social economy while ensuring the supply of ecosystem services. In addition, it is particularly important to rationally carry out ecological protection and restoration planning, and establish and improve the ecological security detection and early warning mechanisms to promote the sustainable development of the Huai River Basin.

Author Contributions

Conceptualization, Z.Z. and C.L.; data curation, Z.Z.; formal analysis, Z.Z. and C.L.; funding acquisition, C.L., W.-L.H. and C.Z.; investigation, X.H. and S.G.; methodology, Z.Z. and S.G.; project administration, C.L.; resources, C.L.; software, Z.Z. and X.H.; writing—original draft, Z.Z.; writing—review and editing, Z.Z., C.L. and W.-L.H. All authors have read and agreed to the published version of the manuscript.

Funding

National Natural Science Foundation of China, China (Grant Number: 42001241); Project of Social Science Foundation of Jiangsu Province, China (Grant Number: 20SHD010); Project of Philosophy and Social Science Research in Colleges and Universities in Jiangsu Province, China (Grant Number: 2020SJA1006); Humanities and Social Sciences Foundation of the Chinese Ministry of Education (Grant Number: 20YJAGAT002, 20YJA630087, 21YJCZH156).

Institutional Review Board Statement

Not applicable.

Informed Consent Statement

Not applicable.

Data Availability Statement

Not applicable.

Conflicts of Interest

The authors declare no conflict of interest.

References

  1. Costanza, R.; de Groot, R.; Sutton, P.; van der Ploeg, S.; Anderson, S.J.; Kubiszewski, I.; Farber, S.; Turner, R.K. Changes in the global value of ecosystem services. Glob. Environ. Chang.-Hum. Policy Dimens. 2014, 26, 152–158. [Google Scholar] [CrossRef]
  2. Burkhard, B.; Kroll, F.; Nedkov, S.; Muller, F. Mapping ecosystem service supply, demand and budgets. Ecol. Indic. 2012, 21, 17–29. [Google Scholar] [CrossRef]
  3. Villamagna, A.M.; Angermeier, P.L.; Bennett, E.M. Capacity, pressure, demand, and flow: A conceptual framework for analyzing ecosystem service provision and delivery. Ecol. Complex. 2013, 15, 114–121. [Google Scholar] [CrossRef]
  4. Yan, Y.; Zhu, J.Y.; Wu, G.; Zhan, Y.J. Review and prospective applications of demand, supply, and consumption of ecosystem services. Acta Ecol. Sin. 2017, 37, 2489–2496. Available online: https://kns.cnki.net/kcms/detail/detail.aspx?FileName=STXB201708001&DbName=CJFQ2017 (accessed on 4 January 2022).
  5. Chen, Z.H.; Huang, G.L. Research progress on the differences and connections between supply and demand of urban green space. J. Appl. Ecol. 2020, 31, 3925–3934. [Google Scholar] [CrossRef]
  6. Liu, L.C.; Liu, C.F.; Wang, C.; Li, P.J. Supply and demand matching of ecosystem services in loess hilly region: A case study of Lanzhou. Acta Geogr. Sin. 2019, 74, 1921–1937. [Google Scholar]
  7. Xiao, Y.; Xie, G.D.; Lu, C.X.; Xu, J. Involvement of ecosystem service flows in human wellbeing based on the relationship between supply and demand. Acta Ecol. Sin. 2016, 36, 3096–3102. Available online: https://kns.cnki.net/kcms/detail/detail.aspx?FileName=STXB201610035&DbName=CJFQ2016 (accessed on 16 March 2022).
  8. Liu, C.F.; Wang, W.T.; Liu, L.C.; Li, P.J. Supply-demand matching of county ecosystem services in Northwest China:A case study of Gulang county. J. Nat. Resour. 2020, 35, 2177–2190. Available online: https://kns.cnki.net/kcms/detail/detail.aspx?FileName=ZRZX202009011&DbName=DKFX2020 (accessed on 9 March 2022).
  9. Boithias, L.; Acuña, V.; Vergoñós, L.; Ziv, G.; Marcé, R.; Sabater, S. Assessment of the water supply: Demand ratios in a Mediterranean basin under different global change scenarios and mitigation alternatives. Sci. Total Environ. 2014, 470, 567–577. [Google Scholar] [CrossRef]
  10. Zhao, X.Y.; Ma, P.Y.; Li, W.Q.; Du, Y.X. Spatiotemporal changes of supply and demand relationships of ecosystem services in the Loess Plateau. Acta Geogr. Sin. 2021, 76, 2780–2796. Available online: https://kns.cnki.net/kcms/detail/detail.aspx?FileName=DLXB202111014&DbName=DKFX2021 (accessed on 10 January 2022).
  11. Zhang, X.R. Analysis of Ecosystem Service Trade-Offs and Supply-Demand Balance in Karst Area of Southwest China; Chang’an University: Xi’an, China, 2020. [Google Scholar]
  12. Li, C.; Zhao, J. Research on Spatiotemporal Pattern and Influencing Factors of Supply-Demand Matching in the Yangtze River Delta Urban Agglomeration. Ecol. Econ. 2022, 1–20. Available online: https://kns.cnki.net/kcms/detail/53.1193.F.20220104.1629.002.html (accessed on 1 June 2022).
  13. Wu, A.B.; Zhao, Y.X.; Shen, H.T.; Qin, Y.J.; Liu, X. Spatiotemporal Pattern Evolution of Ecosystem Service Supply and Demand in Beijing-Tianjin-Hebei Region. J. Ecol. Rural. Environ. 2018, 34, 968–975. Available online: https://kns.cnki.net/kcms/detail/32.1766.x.20181122.1127.002.html (accessed on 12 January 2022).
  14. Baró, F.; Palomo, I.; Zulian, G. Mapping ecosystem service capacity, flow and demand for landscape and urban planning: A case study in the Barcelona metropolitan region. Land Use Policy 2016, 57, 405–417. [Google Scholar] [CrossRef]
  15. Gen, T.W.; Chen, H.; Liu, D.; Shi, Q.Q.; Zhang, H. Matching Supply and Demand of Ecosystem Services and Ecological Construction at County Scale: Take Shaanxi Province as An Example. Areal Res. Dev. 2021, 40, 140–144+150. Available online: https://kns.cnki.net/kcms/detail/detail.aspx?FileName=DYYY202102025&DbName=CJFQ2021 (accessed on 12 January 2022).
  16. Chen, F.; Li, L.; Niu, J.; Lin, A.; Chen, S.; Hao, L. Evaluating Ecosystem Services Supply and Demand Dynamics and Ecological Zoning Management in Wuhan, China. Int. J. Environ. Res. Public Health 2019, 16, 2332. [Google Scholar] [CrossRef]
  17. Park, Y.S.; Kim, C.K.; Lee, J.H.; Song, Y.K.; Hong, H.J. Identifying Supply-demand Relationships on Ecosystem Services Using Socio-ecological Approach in Gyeong-gi Province. J. Korean Soc. Rural Plan. 2021, 27, 35–46. Available online: https://www.kci.go.kr/kciportal/co/download/popup/poDownload.kci?storFileBean.orteFileId=KCI_FI002756149 (accessed on 16 January 2022).
  18. Cai, W.; Jiang, W.; Du, H.; Chen, R.; Cai, Y. Assessing Ecosystem Services Supply-Demand (Mis)Matches for Differential City Management in the Yangtze River Delta Urban Agglomeration. Int. J. Environ. Res. Public Health 2021, 18, 8130. [Google Scholar] [CrossRef]
  19. Zhang, W.X.; Wu, X.Q.; Yu, Y.; Cao, J.H. The Changes of Ecosystem Services Supply-demand and Responses to Rocky Desertification in Xiaojiang Basin During 2005-2015. J. Soil Water Conserv. 2019, 33, 139–150. [Google Scholar] [CrossRef]
  20. Chen, H.W.; Gong, J. Supply and Demand Pattern of Ecosystem Services and Its Change in the Loess Plateau of Northern Shaanxi Province. Res. Soil Water Conserv. 2021, 28, 226–232. [Google Scholar] [CrossRef]
  21. Zhao, X.J.; Su, J.D.; Wang, J.; Jin, W.Q.; Chen, E.; Zhang, J.; Xiang, M. A study on the relationship between supply-demand relationship of ecosystem services and impact factors in Gansu Province. China Environ. Sci. 2021, 41, 4926–4941. [Google Scholar] [CrossRef]
  22. Zhang, C.; Wang, C.; Mao, G.; Wang, M.; Hsu, W.-L. An Empirical Study on the Ecological Economy of the Huai River in China. Water 2020, 12, 2162. [Google Scholar] [CrossRef]
  23. Wang, K.; Chu, D.Y.; Yang, Z.H. Flood control and management for the transitional Huaihe River in China. Procedia Eng. 2016, 154, 703–709. [Google Scholar] [CrossRef]
  24. Liang, J.; Pan, S.; Chen, W.; Li, J.; Zhou, T. Cultivated Land Fragmentation and Its Influencing Factors Detection: A Case Study in Huaihe River Basin, China. Int. J. Environ. Res. Public Health 2022, 19, 138. [Google Scholar] [CrossRef] [PubMed]
  25. Wang, H.; Zhang, M.; Wang, C.; Wang, K.; Wang, C.; Li, Y.; Bai, X.; Zhou, Y. Spatial and Temporal Changes of Landscape Patterns and Their Effects on Ecosystem Services in the Huaihe River Basin, China. Land 2022, 11, 513. [Google Scholar] [CrossRef]
  26. Development Planning of Huaihe Ecological Economic Belt. Available online: http://www.lyg.gov.cn/ (accessed on 5 January 2022).
  27. Hsu, W.-L.; Shen, X.; Xu, H.; Zhang, C.; Liu, H.-L.; Shiau, Y.-C. Integrated Evaluations of Resource and Environment Carrying Capacity of the Huaihe River Ecological and Economic Belt in China. Land 2021, 10, 1168. [Google Scholar] [CrossRef]
  28. GlobeLand30: Global Geographic Information Public Goods. Available online: http://www.globallandcover.com/ (accessed on 10 January 2022).
  29. Geographic Data Cloud. Available online: http://www.gscloud.cn/ (accessed on 16 January 2022).
  30. Resource and Environment Science and Data Center. Available online: https://www.resdc.cn/ (accessed on 23 January 2022).
  31. China Economic and Social Big Data Research Platform. Available online: https://data.cnki.net/ (accessed on 5 March 2022).
  32. China’s National Bureau of Statistics. Available online: http://www.stats.gov.cn/ (accessed on 5 January 2022).
  33. Uehara, T.; Hidaka, T.; Tsuge, T.; Sakurai, R.; Cordier, M. An adaptive social-ecological system management matrix for guiding ecosystem service improvements. Ecosyst. Serv. 2021, 50, 101312. [Google Scholar] [CrossRef]
  34. Müller, F.; Bicking, S.; Ahrendt, K.; Kinh Bac, D.; Blindow, I.; Fürst, C.; Haase, P.; Kruse, M.; Kruse, T.; Ma, L.; et al. Assessing ecosystem service potentials to evaluate terrestrial, coastal and marine ecosystem types in Northern Germany—An expert-based matrix approach. Ecol. Indic. 2020, 112, 106116. [Google Scholar] [CrossRef]
  35. Liao, G.T.; He, P.; Gao, X.S.; Lin, Z.Y.; Fang, C.G.; Zhou, W.; Xu, C.H.; Deng, L.J. Identifying Critical Area of Ecosystem Service Supply and Demand at Different Scales Based on Spatial Heterogeneity Assessment and SOFM Neural Network. Front. Environ. Sci. 2021, 9, 714874. [Google Scholar] [CrossRef]
  36. Chen, Y.G. An analytical process of spatial autocorrelation functions based on Moran’s index. PLoS ONE 2021, 16, e0249589. [Google Scholar] [CrossRef]
  37. Guo, B.N.; Tang, L.; Zhang, H. Spatial Effects of Environmental Regulation and Ecological Welfare Performance in Yangtze River Economic Belt. Reform Econ. Syst. 2021, 3, 73–79. Available online: https://kns.cnki.net/kcms/detail/detail.aspx?FileName=JJTG202103012&DbName=DKFX2021 (accessed on 8 March 2022).
  38. Wang, J.F.; Xu, C.D. Geodetector: Principle and prospective. Acta Geogr. Sin. 2017, 72, 116–134. Available online: https://kns.cnki.net/kcms/detail/detail.aspx?FileName=DLXB201701011&DbName=CJFQ2017 (accessed on 10 March 2022).
  39. Shen, T.Y.; Yu, H.C.; Zhou, L.; Gu, H.Y.; HE, H.H. On Hedonic Price of Second-Hand Houses in Beijing Based on Multi-Scale Geographically Weighted Regression:Scale Law of Spatial Heterogeneity. Econ. Geogr. 2020, 40, 75–83. [Google Scholar] [CrossRef]
  40. Fotheringham, A.S.; Yang, W.; Kang, W. Multiscale Geographically Weighted Regression (MGWR). Ann. Am. Assoc. Geogr. 2017, 107, 1247–1265. [Google Scholar] [CrossRef]
  41. Yu, M.; Lian, L.S.; Li, B.F.; Zhang, W.H.; Chu, C.C. Assessment of Land Use and Ecological Effects of Nansi Lake Basin Based on CLUE-S Model. Bull. Soil Water Conserv. 2018, 38, 231–239. [Google Scholar] [CrossRef]
  42. Wu, J.S.; Men, X.N.; Liang, J.T.; Zhao, Y.H. Research on supply and demand equilibrium of ecosystem services in Guangdong Province based on the gini coefficient. Acta Ecol. Sin. 2020, 40, 6812–6820. Available online: https://kns.cnki.net/kcms/detail/detail.aspx?FileName=STXB202019010&DbName=CJFQ2020 (accessed on 10 March 2022).
  43. Li, C.; Zhao, J.; Zhuang, Z.C.; Gu, S.H. Spatiotemporal dynamics and influencing factors of ecosystem service trade-offsin the Yangtze River Delta urban agglomeration. Acta Ecol. Sin. 2022, 14, 1–13. Available online: https://kns.cnki.net/kcms/detail/detail.aspx?FileName=STXB20220321009&DbName=CAPJ2022 (accessed on 5 June 2022).
Figure 1. Map of the research area.
Water 14 02559 g001
Figure 2. Land use map of the Huai River Basin in 2010 and 2020.
Water 14 02559 g002
Figure 3. Digital elevation map of the Huai River Basin.
Water 14 02559 g003
Figure 4. Spatial distribution of ecosystem service supply in the Huai River Basin.
Water 14 02559 g004
Figure 5. Spatial distribution of ecosystem service demand in the Huai River Basin.
Water 14 02559 g005
Figure 6. Distribution of the supply and demand index of ecosystem services in the Huai River Basin.
Water 14 02559 g006
Figure 7. Local autocorrelations in SDI.
Water 14 02559 g007
Figure 8. Distribution of regression coefficients of factors that affect the Huai River Basin SDI between 2010 and 2020.
Water 14 02559 g008aWater 14 02559 g008b
Table 1. Huai River Basin ecosystem services supply matrix.
Land Use TypeSupply ServicesProvisioning ServicesCultural Services
FoodAquatic ProductsWaterClimate RegulationStormwater RegulationAir PurificationSoil ConservationWater PurificationWater ConservationCarbon SequestrationLeisure and EntertainmentLandscape Aesthetics
Farmland502211122211
Forests102545555555
Plains101213433343
Water bodies055331115054
Construction land000000000100
Bare land000010000121
Table 2. Huai River Basin ecosystem services demand matrix.
Land Use TypeSupply ServicesProvisioning ServicesCultural Services
FoodAquatic ProductsWaterClimate RegulationStormwater RegulationAir PurificationSoil ConservationWater PurificationWater ConservationCarbon Sequestrationleisure and EntertainmentLandscape Aesthetics
Farmland000221223122
Forests000000000000
Plains000100100000
Water bodies000000000000
Construction land555555555544
Bare land000000000000
Table 3. Factor detection results.
GDPPopulationArea of FarmlandArea of
Ecologicaluse Land
Construction
Use Land Area
ElevationSlopeTemperatureRain
2010 q values0.2270.2140.0290.8700.5370.2710.0770.3890.413
2020 q values0.1230.2630.0650.8710.5070.2510.0740.3640.412
Table 4. Parameter comparison of model running results.
Model Index20102020
MgwrOLSMgwrOLS
R20.950.7720.9370.764
Adj. R20.9410.7660.9270.758
AICc41.266279.65678.035286.29
Residual sum of squares9.79944.45112.22445.989
Publisher’s Note: MDPI stays neutral with regard to jurisdictional claims in published maps and institutional affiliations.

