
Study of the Water Environment Risk Assessment of the Upper Reaches of the Baiyangdian Lake, China

1
State Key Laboratory of Simulation and Regulation of Water Cycle in River Basin, China Institute of Water Resources and Hydropower Research, Beijing 100038, China
2
Department of Irrigation and Drainage, China Institute of Water Resources and Hydropower Research, Beijing 100048, China
*
Author to whom correspondence should be addressed.
Water 2022, 14(16), 2557; https://doi.org/10.3390/w14162557
Submission received: 18 June 2022
/
Revised: 17 August 2022
/
Accepted: 18 August 2022
/
Published: 19 August 2022
(This article belongs to the Section Water Quality and Contamination)
Abstract
:The risk assessment of water environments provides important references for water environment risk management. In this paper, the water environment risk of the upper rivers of the Baiyangdian Lake is assessed, considering both cumulative and sudden environmental risk. For the cumulative environmental risk assessment of the rivers, the characteristics of pollution transmissibility and accumulation in rivers was considered firstly. Furthermore, suggestions for the control of water environment pollution in the Baiyangdian Basin are given. The results indicate that the cumulative water environment risks of the Xiaoyi River—Dingzhou County, Xiaoyi River—Anguo County, Xiaoyi River—Boye County, and Xiaoyi River—Li County are high. The amount of fertilizer applied per unit of cultivated area, water quality, rate of water quality above the standard in water function zoning, and the ratio of environmental investment to gross domestic product (GDP) are important factors influencing the cumulative water environment risk. For sudden water environment assessments, the Xiaoyi River—Boye County is high. In the future, reducing the intensity of fertilizer application, strengthening the water quality control of the rivers, as well as upgrading the industry, should be carried out to protect the water environment in the Baiyangdian Basin.
1. Introduction
With the acceleration of social and economic development, more attention has been paid to water environment protection. Water quality is the primary representation of a water environment; many factors may influence the water quality of a river. Surface water pollution, especially river bank pollution, is one of the most serious issues. Jaybhaye, et al. [1] found that the water quality index of the Amba River from the Dolvi Region, Maharashtra, fell under the “poor” category. Snitynskyi, et al. [2] showed that water management and ecological situations may be complicated, especially in water bodies with a significant anthropogenic load, with a deterioration in the water quality due to the limitation of the dilution of polluted wastewater in the Stryi River Basin, Ukraine. Puchlik, et al. [3] pointed out that temperature changes contribute to increased surface water pollution in the northeastern part of Poland. Bridhikitti, et al. [4] studied the surface water quality in the Mun River Basin, Thailand, and showed that the water quality was often found to have high amounts of coliform bacteria during the monsoon season; the water quality in the dry season was even worse, exhibiting high loadings of organic compounds, coliform bacteria, and nutrients, in addition to low dissolved oxygen. The surface water quality was always affected by human activities. Qiao, et al. [5] indicated that, from 2000 to 2019, the water quality was not significantly improved at the non-background sites of Chengdu’s Min Basin, while during the COVID-19 lockdown, the water quality generally improved in the Min Basin. Das, et al. [6] quantified the impact of the COVID-19 lockdown on the water quality parameters of the Buddha Nala located in District Ludhiana in India and found that the impact of the COVID-19 lockdown on the improvement in water quality of Buddha Nala was more evident in the upstream and downstream sections than the middle section, where it was continually impacted by domestic household effluents. Vieira, et al. [7] evaluated the effect of existing domestic, agricultural, and industrial activities on the water quality of the Lis River and pointed that the poor water quality associated mainly with the contamination source from pig-breeding farms.
Water environmental risk analyses provide important references for the protection of water environments. Environmental risk assessment is generally divided into cumulative environmental risk assessment and sudden environmental risk assessment [8,9]. Cumulative environmental risk assessment is a risk assessment of cumulative environmental events usually caused by the long-term discharge of pollutants [10,11]. Sudden environmental risk assessment refers to the leakage of environmental risk materials caused by accidents in industrial production and transportation processes [12]. There were rare studies about the comprehensive consideration of cumulative environmental risk assessment and sudden environmental risk assessment. Many studies of cumulative water environment risk focused on heavy metal pollution in recent years, and the Heavy Metal Pollution Index (HPI), Potential Ecological Risk Index (PERI), and the Comprehensive Risk Index were commonly adopted based on the only parameter of water quality [13,14,15]. Additionally, there are also many risk assessments of organic micropollutants and sediment contamination in rivers based on the water quality monitoring without pollution source analysis [16,17]. For proposing governance recommendation, more influence parameters during the process of pollutants flowing into rivers should be considered.
In this view, the cumulative water environment risk assessment is difficult to quantify, and the chosen appropriate parameters or indicators are critical. In 1997, the US Environmental Protection Agency (USEPA) published the guidelines of cumulative environmental risk assessment, where the focus of cumulative environmental risk assessment, shifting the assessment from a single risk source to multiple risk sources, was first articulated [18]. The USEPA also divided the cumulative environmental risk assessment process into three parts: planning construction, risk analysis, and risk characterization [19]. To quantize the environment risk, many methods have been studied. Nazar, et al. [20] put forward a quantitative index of water environmental risk instead of a qualitative index. Gottardo, et al. [21] developed an alternative integrated risk assessment (IRA) methodology that provided a more comprehensive, realistic, and flexible ecological status classification based on a weight of evidence approach and applied it in the Llobregat River Basin (Spain) to assess the water environment [22]. Chen, et al. [23] established an assessment index system for accumulative water environmental risks according to the local situation of Changzhou in the Taihu Lake Basin (China) based on the methods of principal component analysis and a comprehensive neural network model, evaluated the accumulative water environmental risks from 2004 to 2009, and pointed out that non-point risk sources are mainly caused by agriculture and livestock farming. Wei, et al. [24] readjusted the proposed evaluation index system of water environment risk by the WWF (World Wide Fund for Nature) to be more suitable for local situations of China, considering the different features of water resources, water environments, water resources’ management, and information statistics, and conducted a comprehensive evaluation in the Yangtze River Basin and its seven secondary subareas. Topuz, et al. [25] proposed an environmental risk assessment approach for engineered nanoparticles by integrating the analytical hierarchy process (AHP) and fuzzy inference models, which provide a systematic evaluation of risk factors and reduce the uncertainty about the data and information, respectively. Abedzadeh, et al. [26] carried out a risk-based assessment of water resources development plans under the sustainable development framework using Fuzzy Fault Tree Analysis, which may facilitate decision making for the risk management.
For sudden water environment risk, early studies always focused on the risk assessment of a marine oil spill accident. In order to quantify the sudden environmental risk more objectively, accurately, and concretely, the research focus gradually shifted to quantitative methods, such as establishing an index system and an assessment model. Scott [27] proposed the environment–accident index (EAI) as a tool to assess the risk of chemicals. Dura, et al. [28] used a semiquantitative risk assessment method for the tentative evaluation of a hazardous chemical waste incinerator. Liu [29] used the combined methods of the analytic hierarchy process (AHP) and a fuzzy comprehensive evaluation to build an environment risk source identification technology system, and then applied it in the sudden water environment risk assessment of the main streams of the Songhua River. Yang, et al. [30] combined the drivers–pressures–state–impact–response model, fuzzy comprehensive evaluation method, and coordinated development degree model into a comprehensive risk assessment tool. In China, a regional emergent grid environmental risk assessment method based on the environment risk field has been recommended [31]. Zhou, et al. [32] studied sudden water pollution risk zoning in the Dongjiang River Basin by using this method.
From the above literature, we can see that the studies on water environment risk assessment mainly focused on single cumulative or sudden environmental risk assessments and rarely considered both. In terms of study objects, studies about the environmental risk assessment of rivers were even rarer. The main objective of this paper was to estimate both cumulative and sudden environmental risk assessments, taking the upper rivers of the Baiyangdian Lake as an example. A cumulative risk assessment system with eighteen indexes for the upper rivers of the Baiyangdian Lake was built, considering the characteristics of pollution transmissibility and accumulation in rivers. Then, the risk of sudden water pollution in the upper rivers of the Baiyangdian Lake was evaluated by a grid environmental risk analysis. Additionally, water environment risk prevention and control suggestions were given.
2. Materials and Methods
2.1. Study Area
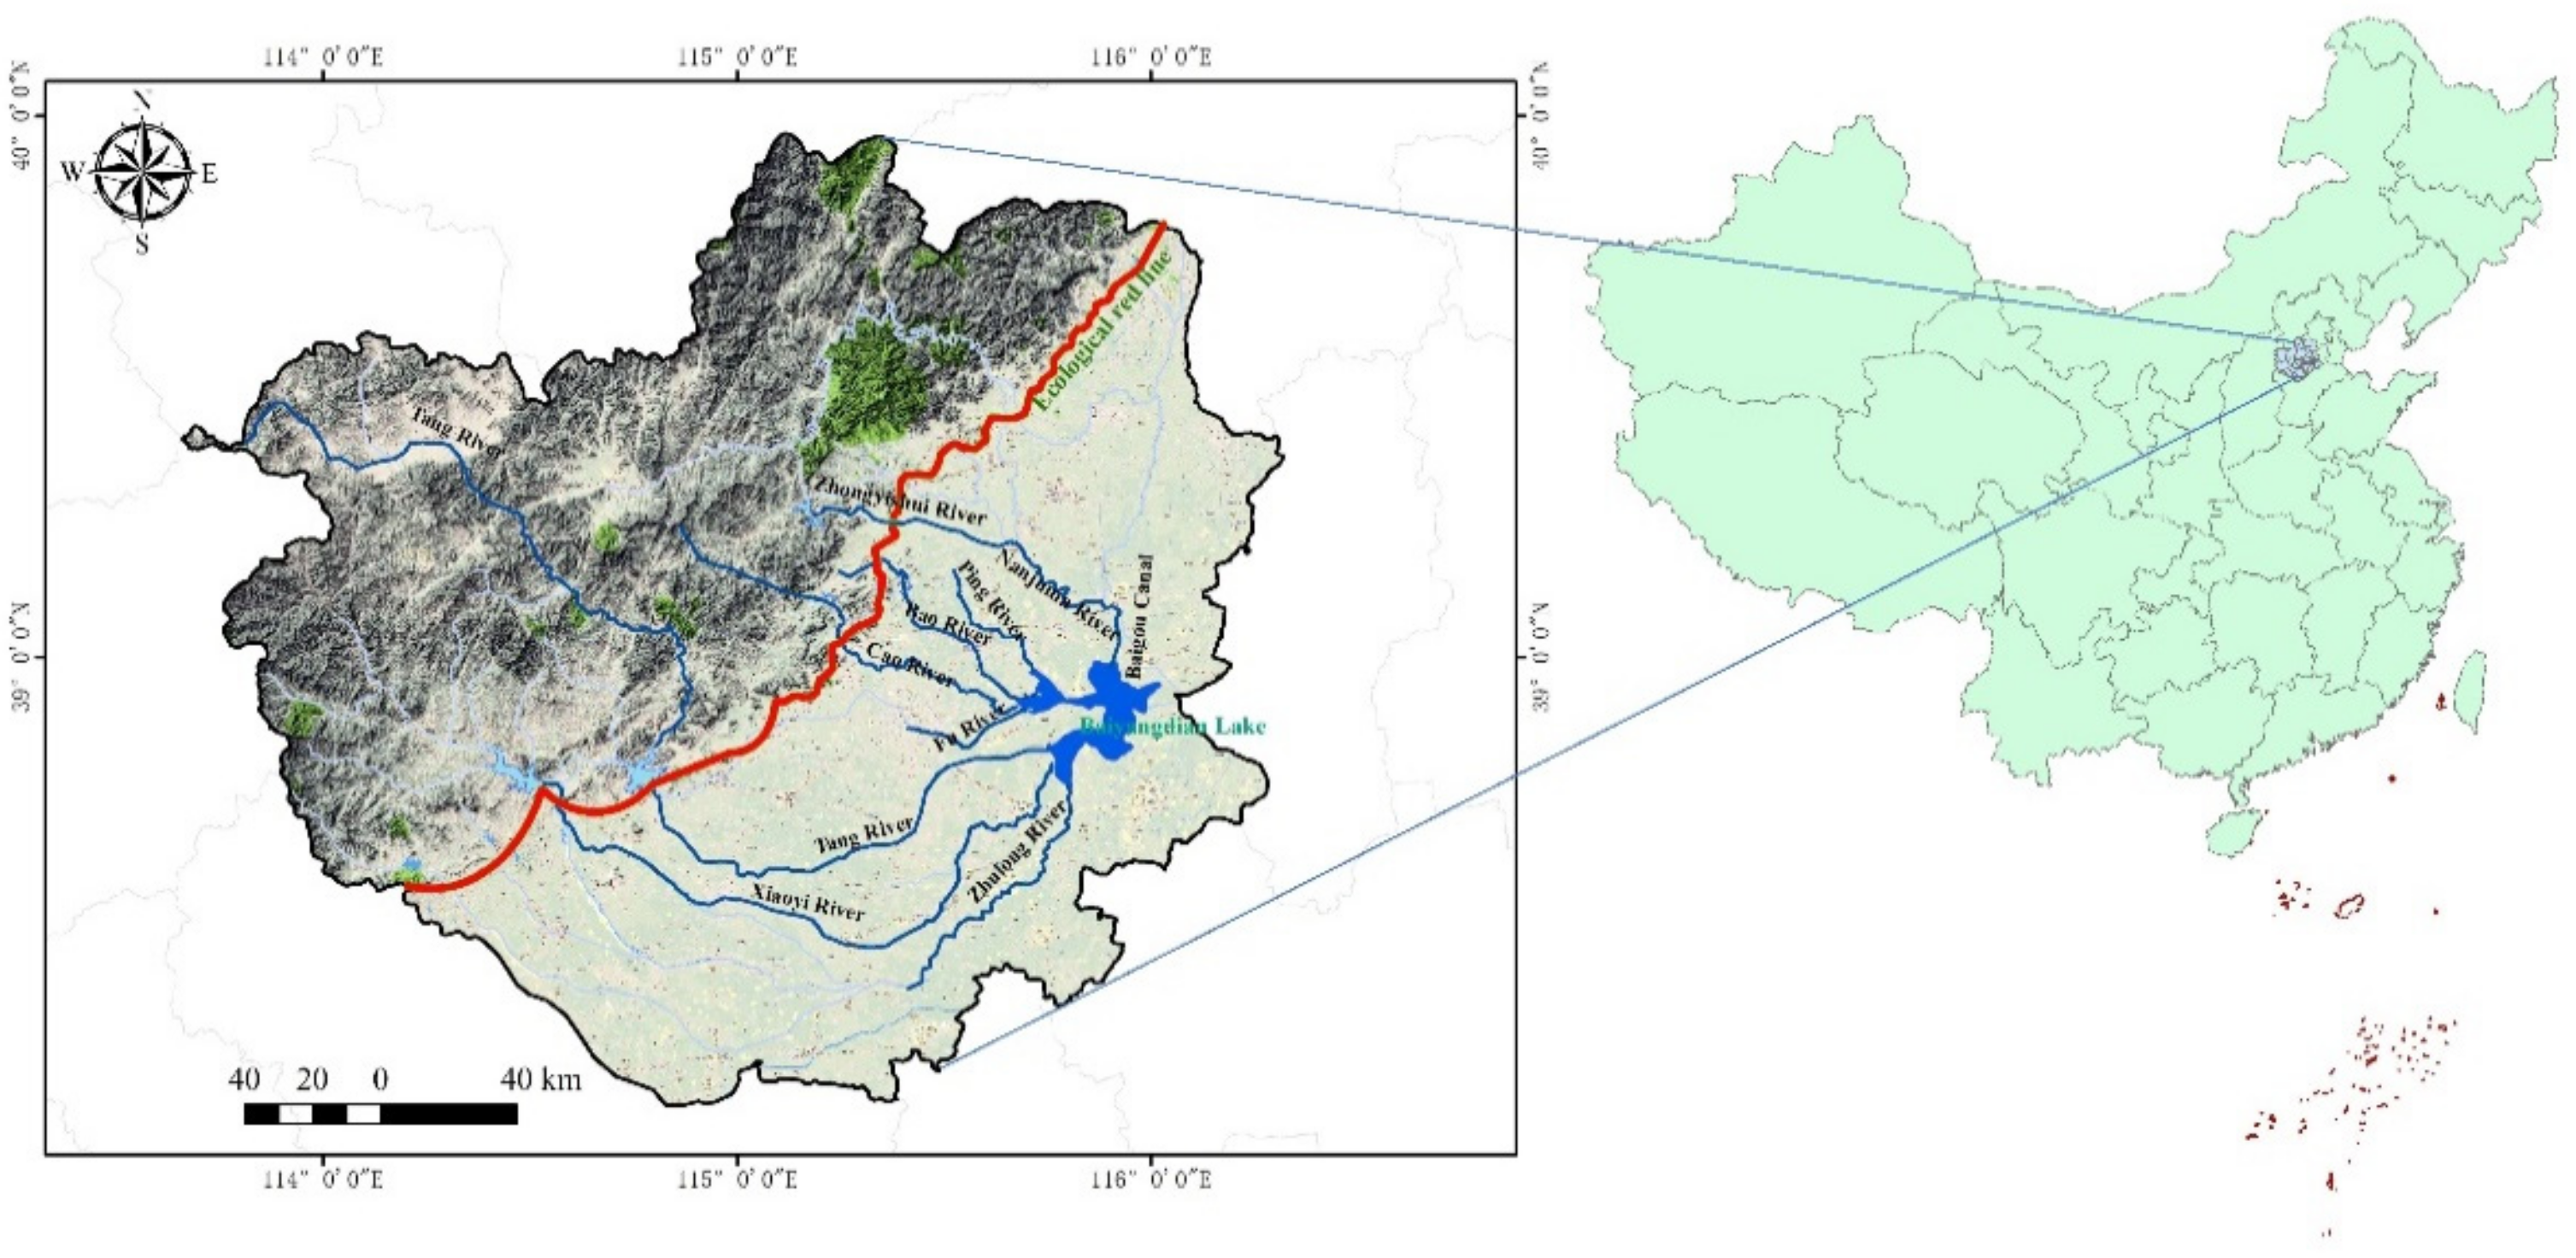
The Baiyangdian Basin is located in the middle of the North China Plain (113°39′–116°20′ E, 38°39′–40°09′ N), belonging to the Daqinghe River system in the Haihe Basin. The Baiyangdian Lake is the largest plain lake wetland in North China. The Haihe Basin has a complex topography, including middle mountains, low mountains, hills, plains, and a depression lake from west to east. The annual average rainfall is approximately 564 mm and unevenly distributed, concentrated in July to August in the Baiyangdian Basin. There are eight rivers, the Zhulong River, Xiaoyi River, Tang River, Bao River, Fu River, Cao River, Ping River, and Baigou Canal, flowing into the Baiyangdian Lake directly [33]. The Zhulong River and Ping River have no water all year round; the Xiaoyi River, Fu River, Bao River, and Baigou Canal are perennial rivers; and the others are seasonal rivers. The water body of the Baiyangdian Basin is partly maintained by the water diversion from the Yellow River and the South-to-North Water Diversion Project. The major sources of pollution of the upper reaches of the Baiyangdian Lake are chemical oxygen demand, total nitrogen, and ammonia nitrogen.
2.2. Risk Assessment Units
In order to assess the risks of different river segments, the assessment units were divided. Firstly, we marked off the sub-basin of the Baiyangdian Basin, considering topography, administrative divisions, and water function zoning, and then defined the control areas of different river segments. Twenty-four water environment risk assessment units were generated, which were named in the format of “River name–administrative name” (Table 1).
2.3. Assessment System of Accumulation Water Environment Risk
Considering the characteristics of pollution transmissibility and accumulation in rivers, for the two adjacent reaches of a river, the upstream reaches could be regarded as potential risk sources for the downstream reaches. Taking five parameters of the risk sources, river characteristics, physical geography and social development conditions, and water pollution control ability, as the criterion layer, a water environment risk assessment system was established, where sixteen indexes and eighteen indexes were given for the beginning reaches and the other reaches of a river, respectively (Table 2). For the index of river discharge, the water volume from upstream reservoirs and the supply by the South-to-North Water Diversion Project as well as the Yellow River were additionally added. Among the five parameters of the criterion layer, the parameter of physical geography and social development conditions is the indirect driving factor of water environment risk; water pollution control ability is the main driving factor of water environment pollution control and risk management.
Ten water environment experts were invited to fill in a specially designed questionnaire, which is available in the Supplementary Material; the consultation results were in good agreement. Based on the statistical results, a three-scale analytic hierarchy process (AHP) was used to calculate the index weight, which had a self-regulating function and was more accurate [34]. The scale values were divided into 0, 1, and 2. When index Ci was less important than index Cj, the scale value was 0. When index Ci was as important as index Cj, the scale value was 1. When index Ci was more important than index Cj, the scale value was 2. Then, the calculation process was the same as the traditional analytic hierarchy process [35,36].
2.4. Grading Standard of Accumulation Water Environment Risk
The accumulation water environment risk was calculated via the method of weighted comprehensive indexes. The greater the calculated result of the comprehensive score of the water environment risk was, the greater the water environment risk was. The details are shown in Table 3 [24].
For the index classification, the references of the class division were as follows: (1) firstly, adopt the limit values prescribed in national standards, provincial standards, or municipal standards; (2) secondly, take the literature as a reference, combining it with the local situation in the study area; and (3) if the index dissatisfies both of the above cases, then the Weber–Fechner law (W–F law) could be used to calculated the classification [37,38,39]. The index classification is shown in Table 4.
2.5. Study Method of Sudden Water Environment Risk
The assessment of sudden water environment risk was conducted based on the method of grid environmental risk assessment, which was recommended as a regional emergent environmental risk assessment method in China [41,42]. The grid environmental risk assessment method could quantize the field intensity of environmental risk sources and the vulnerability of environmental risk receptors for each grid cell. In this paper, grid cells with sizes of 1 km × 1 km were made through the function of Create Fishnet in ArcGis, and the grid cell number was 32,994.
The water environmental risk value of a grid cell could be calculated by the following equation:
where Rx,y is the scoring value of the environmental risk of a grid cell, Ex,y is the field intensity of the environmental risk of the grid cell, and Vx,y is the receptor vulnerability index of the environmental risk. The situations of R > 80, 60 < R ≤ 80, 30 < R ≤ 60, and R ≤ 30, respectively, correspond to high risk, slightly higher risk, middle risk, and low risk [41]. If the cumulative areas of a certain risk classification were larger than 50% of the river’s control area, the corresponding risk classification would be the risk of the river.
The water environmental risk field intensity of a grid cell could be expressed as follows:
where Qi is the ratio of the maximum presence and threshold quantity of the environmental risk substance for the ith risk source; Px,y is the probability of risk field occurrence in a grid cell, which could be set to 10−6 per year; li is the distance between the center of a grid cell and the risk sources (km); and n is the number of risk sources.
When an industry enterprise has a variety of risk substances, the ratio of the maximum presence and threshold quantity of the environmental risk substance (Q) could be calculated through summing the Q values of all of the risk substances up. The environmental risk substances of typical industry enterprises are shown in Table 5. The Q values of other industry enterprises could be deduced based on the industry category and enterprise size.
In order to facilitate the comparison of the water environmental risk field intensity in each grid cell, the field intensity of environmental risk was standardized:
where Ex,y′ is the field intensity of the environmental risk of a grid cell after standardization, Emax is the maximum field intensity of the environmental risk of the region, and Emin is the minimum field intensity of the environmental risk of the region.
The receptor vulnerability index of environmental risk mainly considered the impact of the ecological red line. When the grid cell was within the ecological red line, the Vx,y value was 80; the Vx,y value was 40 on other occasions. The ecological red line is shown in Figure 1.
2.6. Data Sources
The data in this paper mainly came from the regional statistical yearbook or economic statistical yearbook, ecological environment departments of provinces and cities, public budgets of the county and district governments, related websites, and monitoring data. In order to keep the time consistency of the data, the data in 2018 were adopted, except for those of water quality. Considering the fact that water quality data were more sensitive to time, the data timeline of the water quality was 2021. The statistical data of the water quality were from monthly reports on the websites of the governments, and the additional data were from field monitoring in March 2021. Additionally, the data of key wastewater discharge monitoring enterprises and sewage treatment plants were from seasonal reports on the websites of the governments.
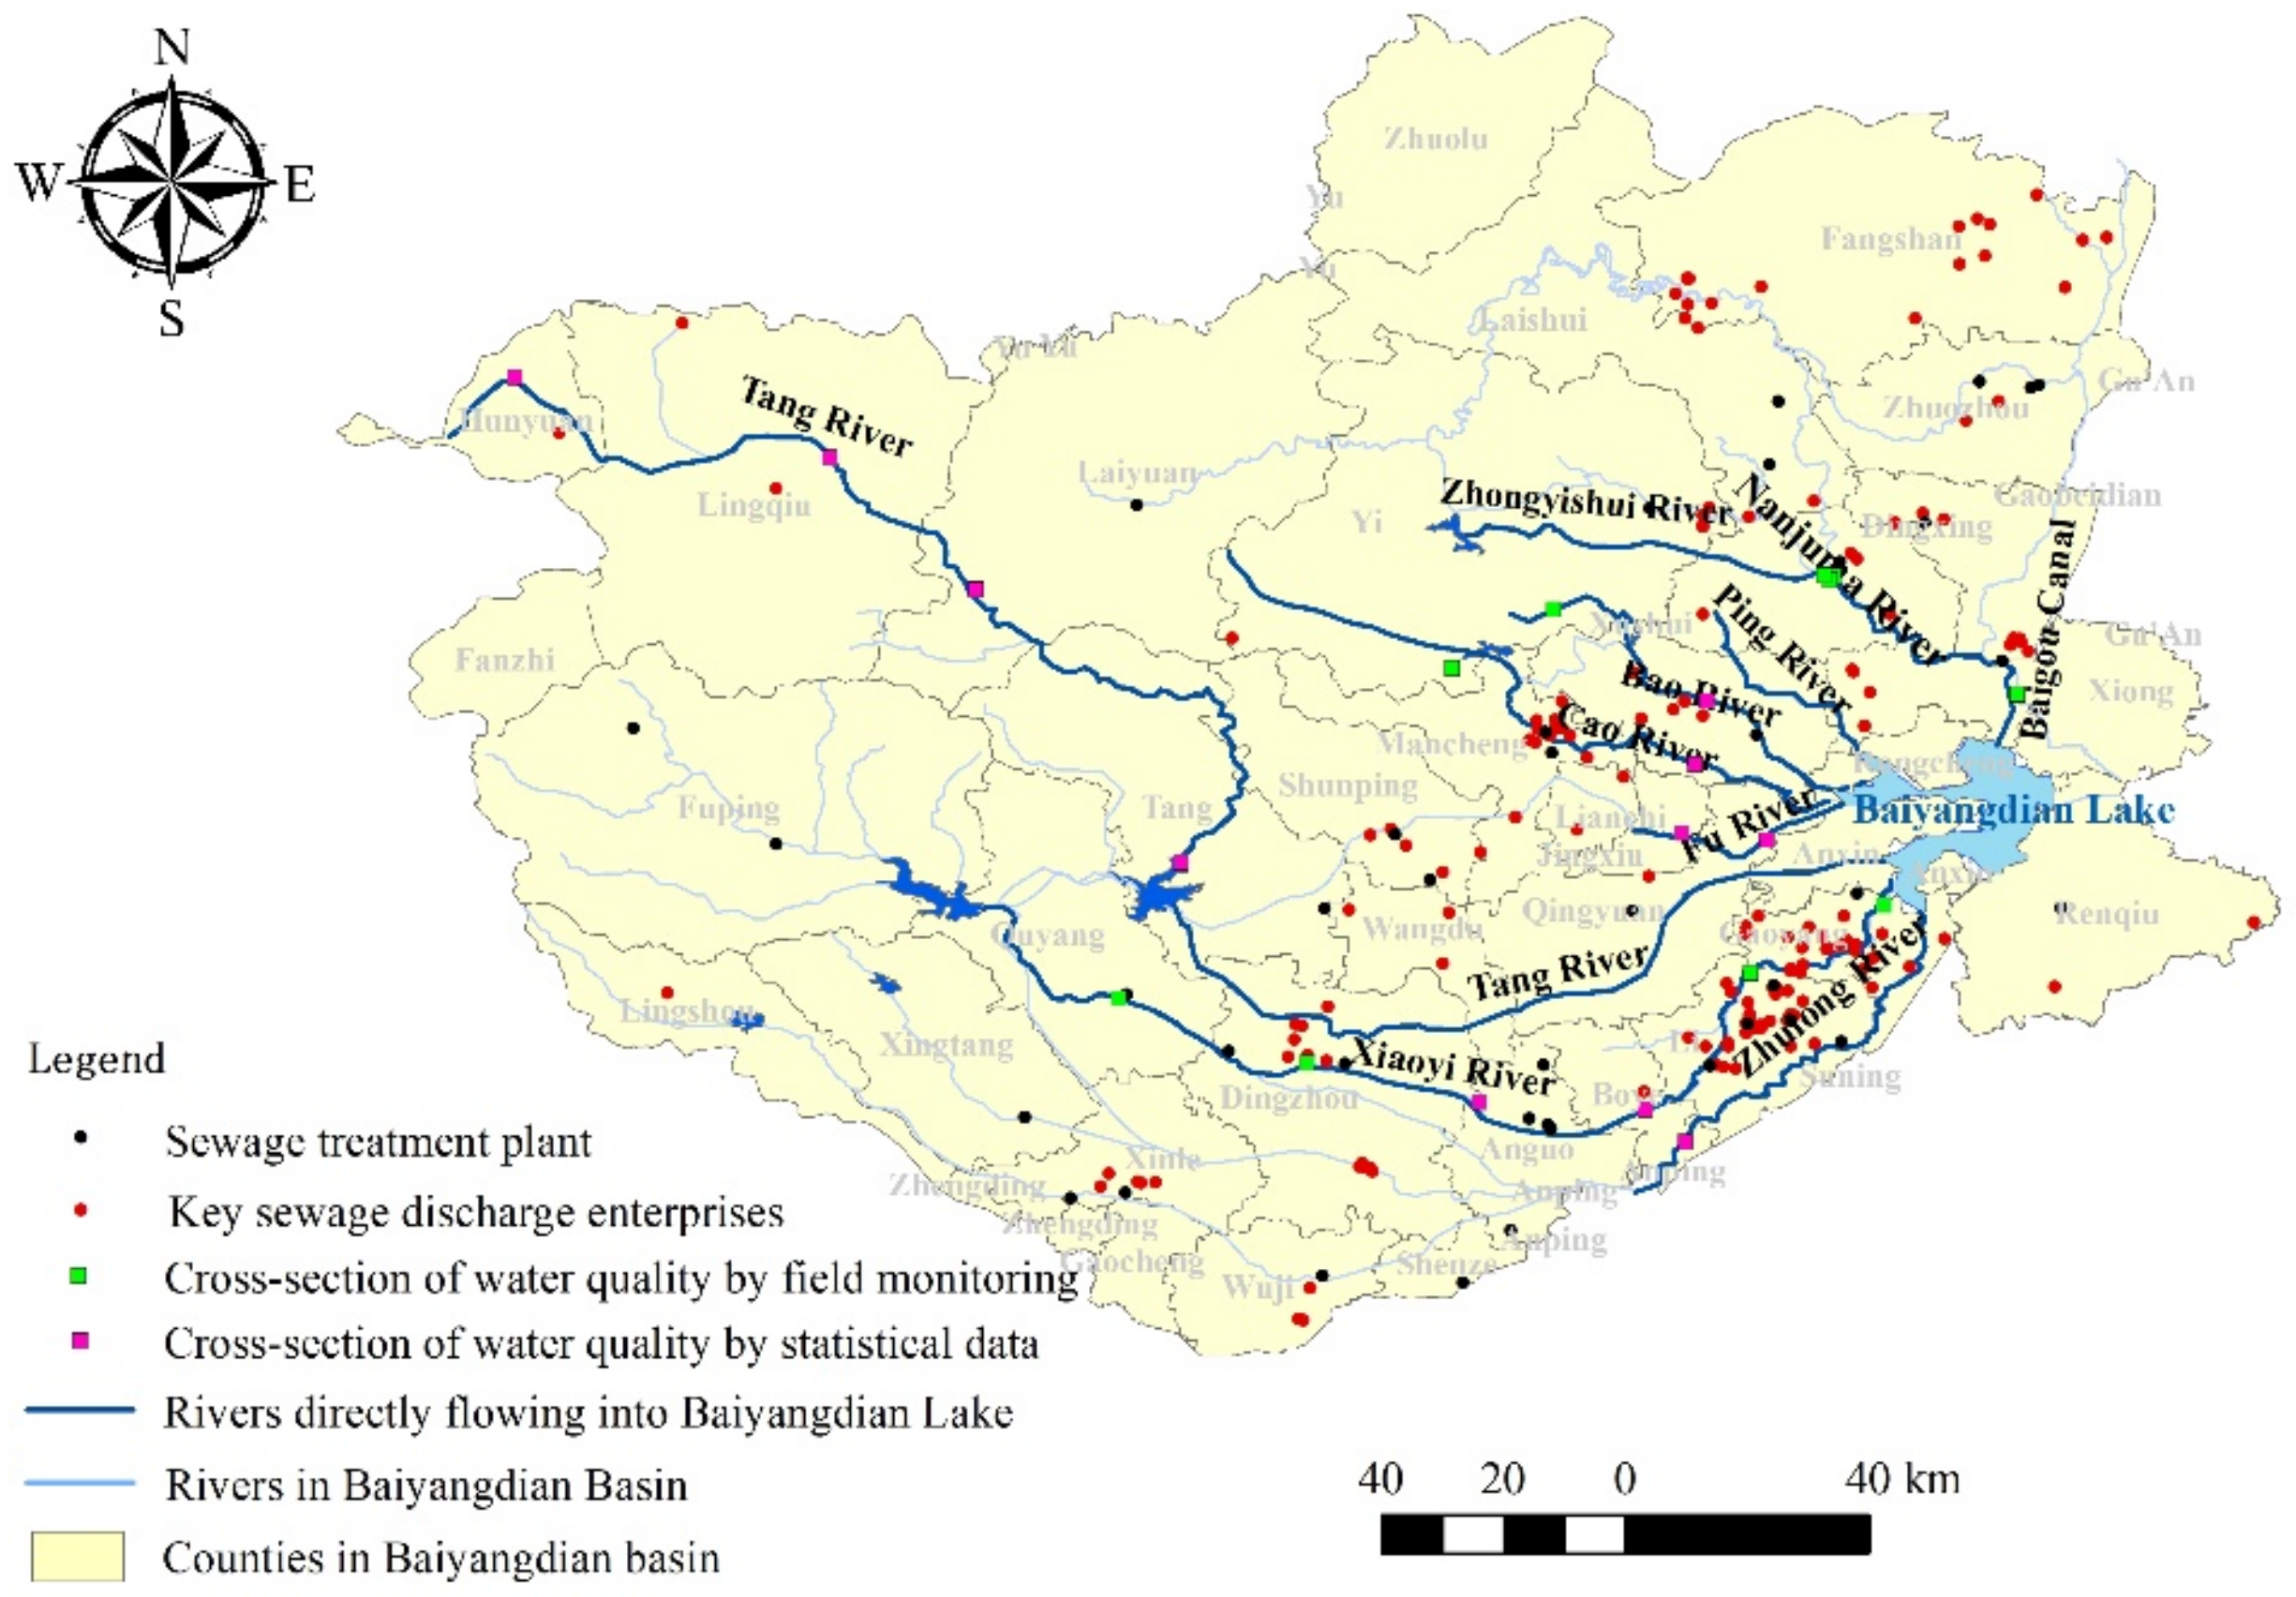
The key sewage discharge enterprises and sewage treatment plants with large discharges of collected sewage, great potential harm of pollutants, sensitive locations, and that were being monitored by the government were considered the sudden pollution sources. The water quality monitoring points in addition to the key sewage enterprises and urban sewage treatment plants are shown in Figure 2. Two hundred and fifty-four key wastewater discharge monitoring enterprises and sewage treatment plants in addition to thirty-six water quality monitoring points (including statistical data and measured data) were studied. The water quality of the reaches is shown in Table 6.
3. Results
3.1. Cumulative Water Environmental Risk
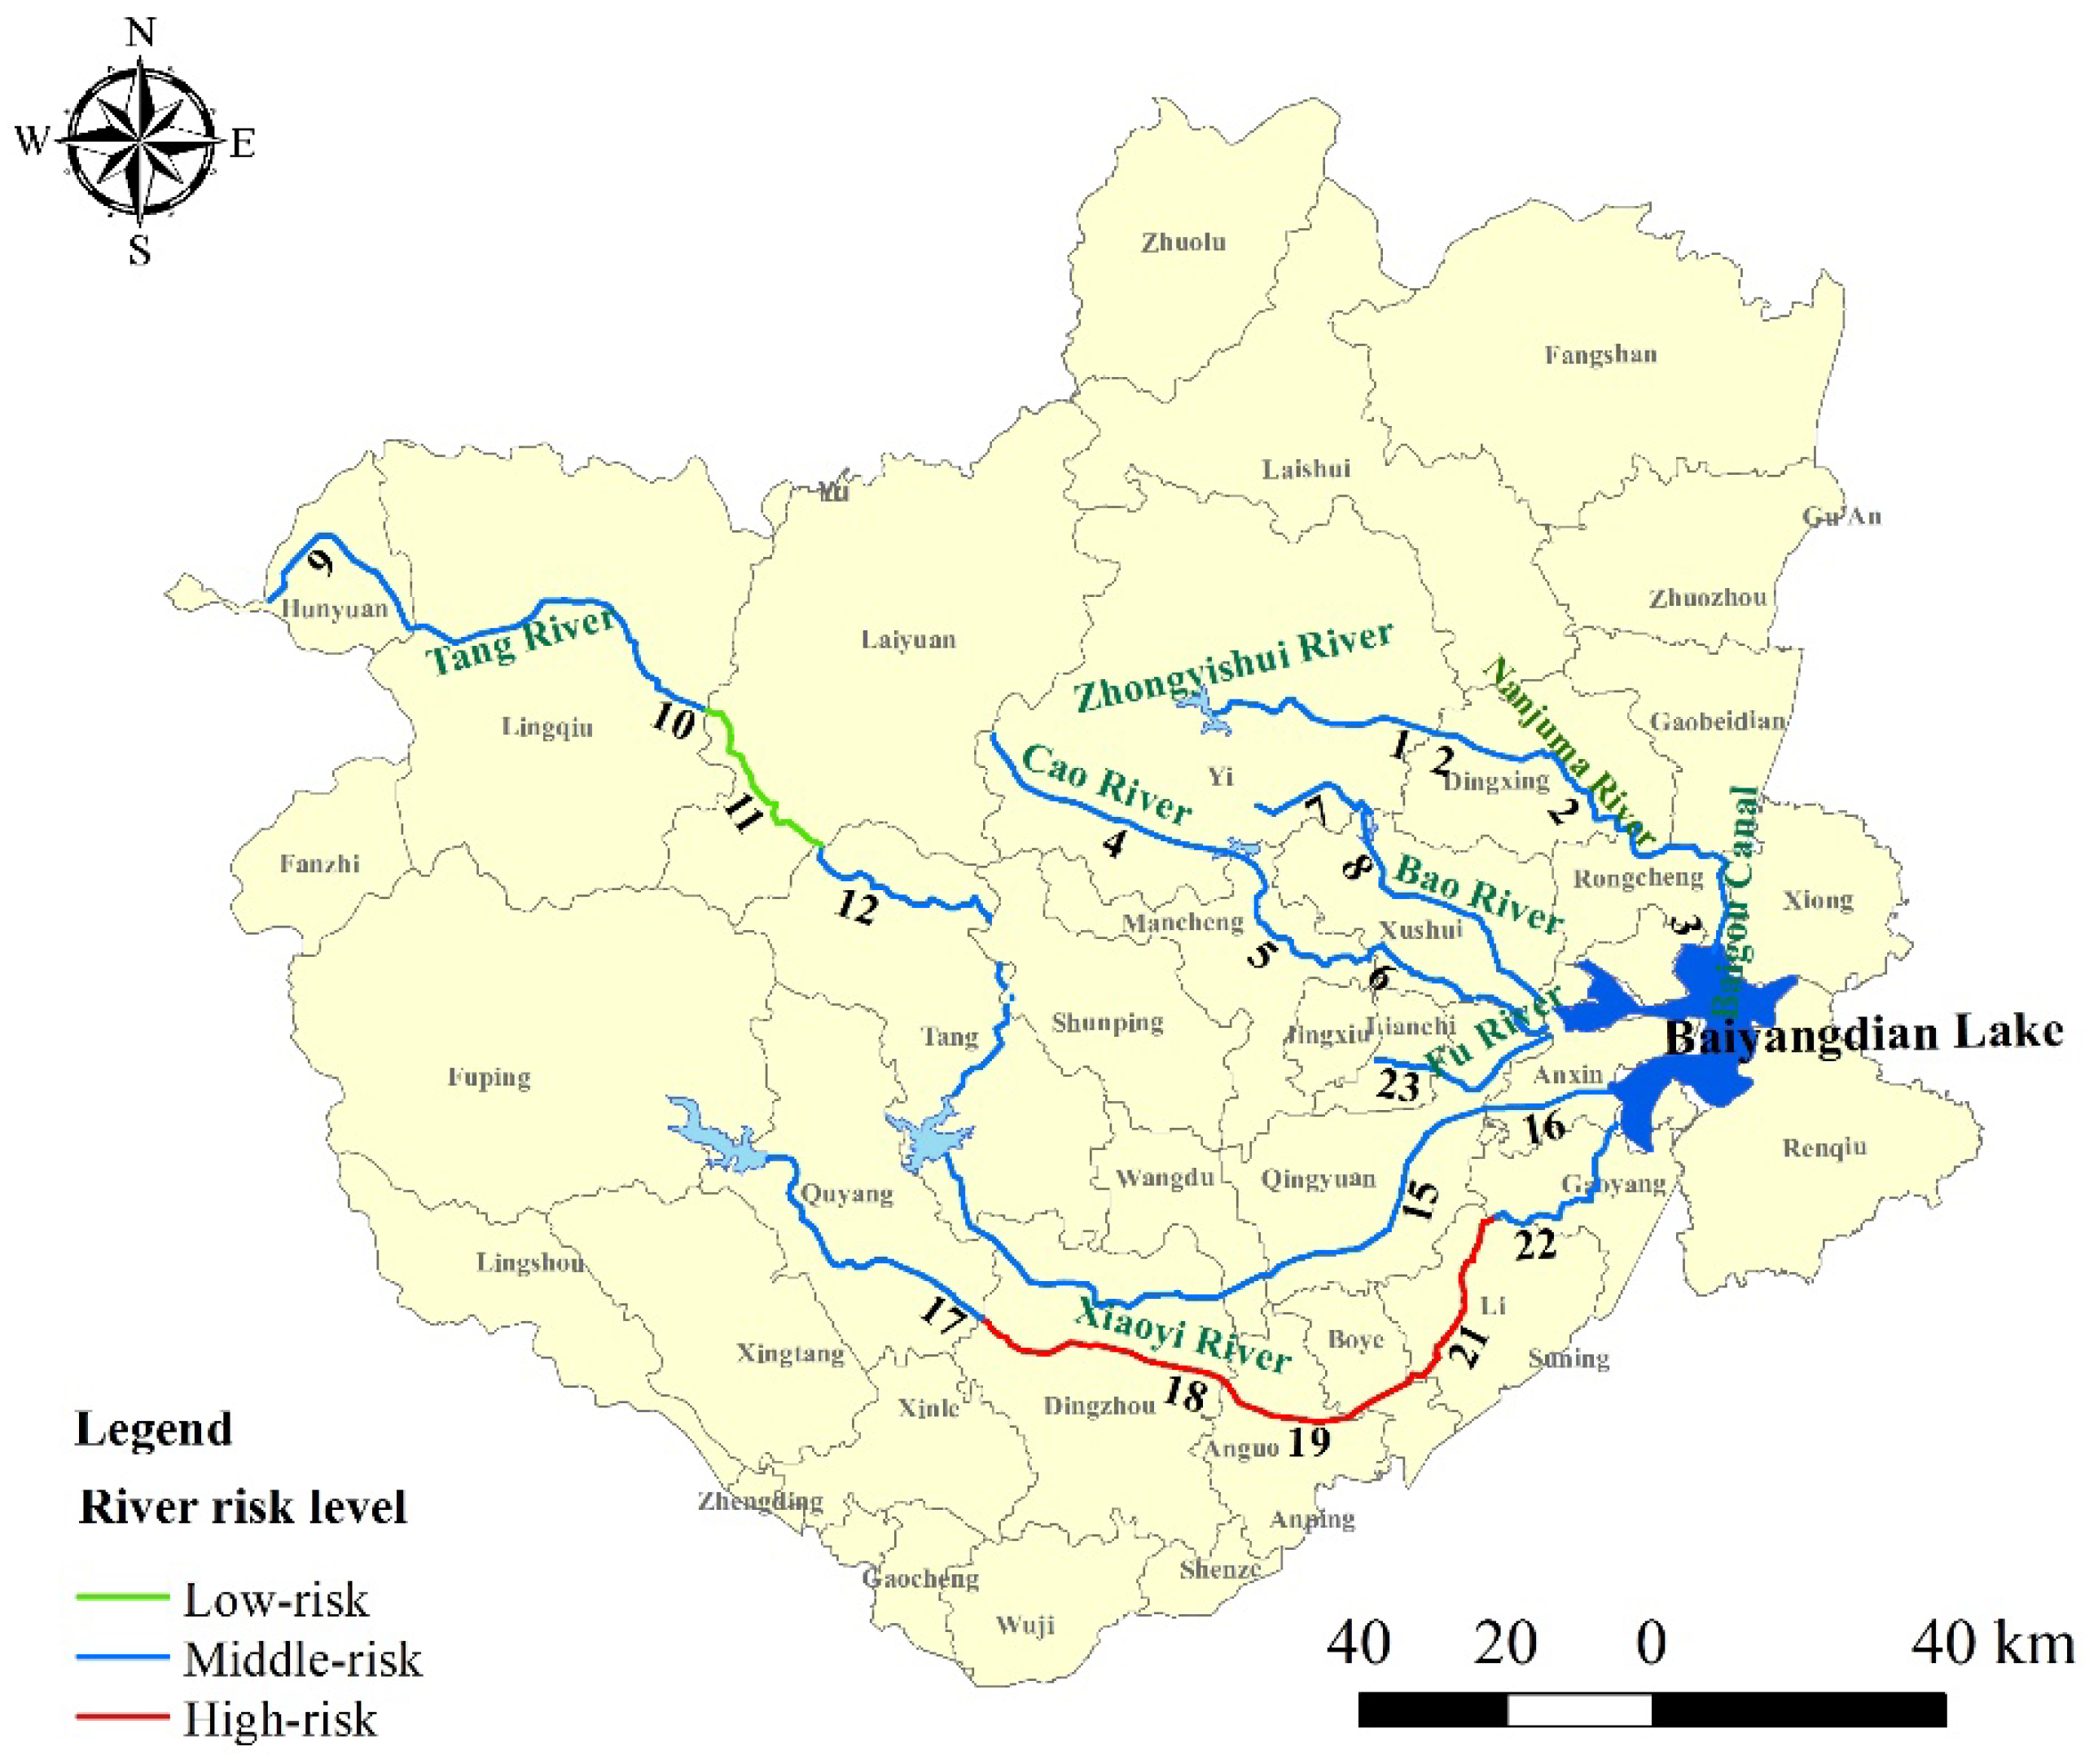
The cumulative water environmental risks of the rivers are shown in Figure 3. Totally speaking, the risk levels of the most upper reaches of the Baiyangdian Lake were Ⅲ, which meant that the water environmental risk of the reaches may happen or have the potential to cause damage. The segments of the Xiaoyi River—Dingzhou County, Xiaoyi River—Anguo County, Xiaoyi River—Boye County, and Xiaoyi River—Li County had a high water environmental risk, where risks may happen easily and could cause great damage, while the segment of the Tang River—Laiyuan County was the only low-risk area.
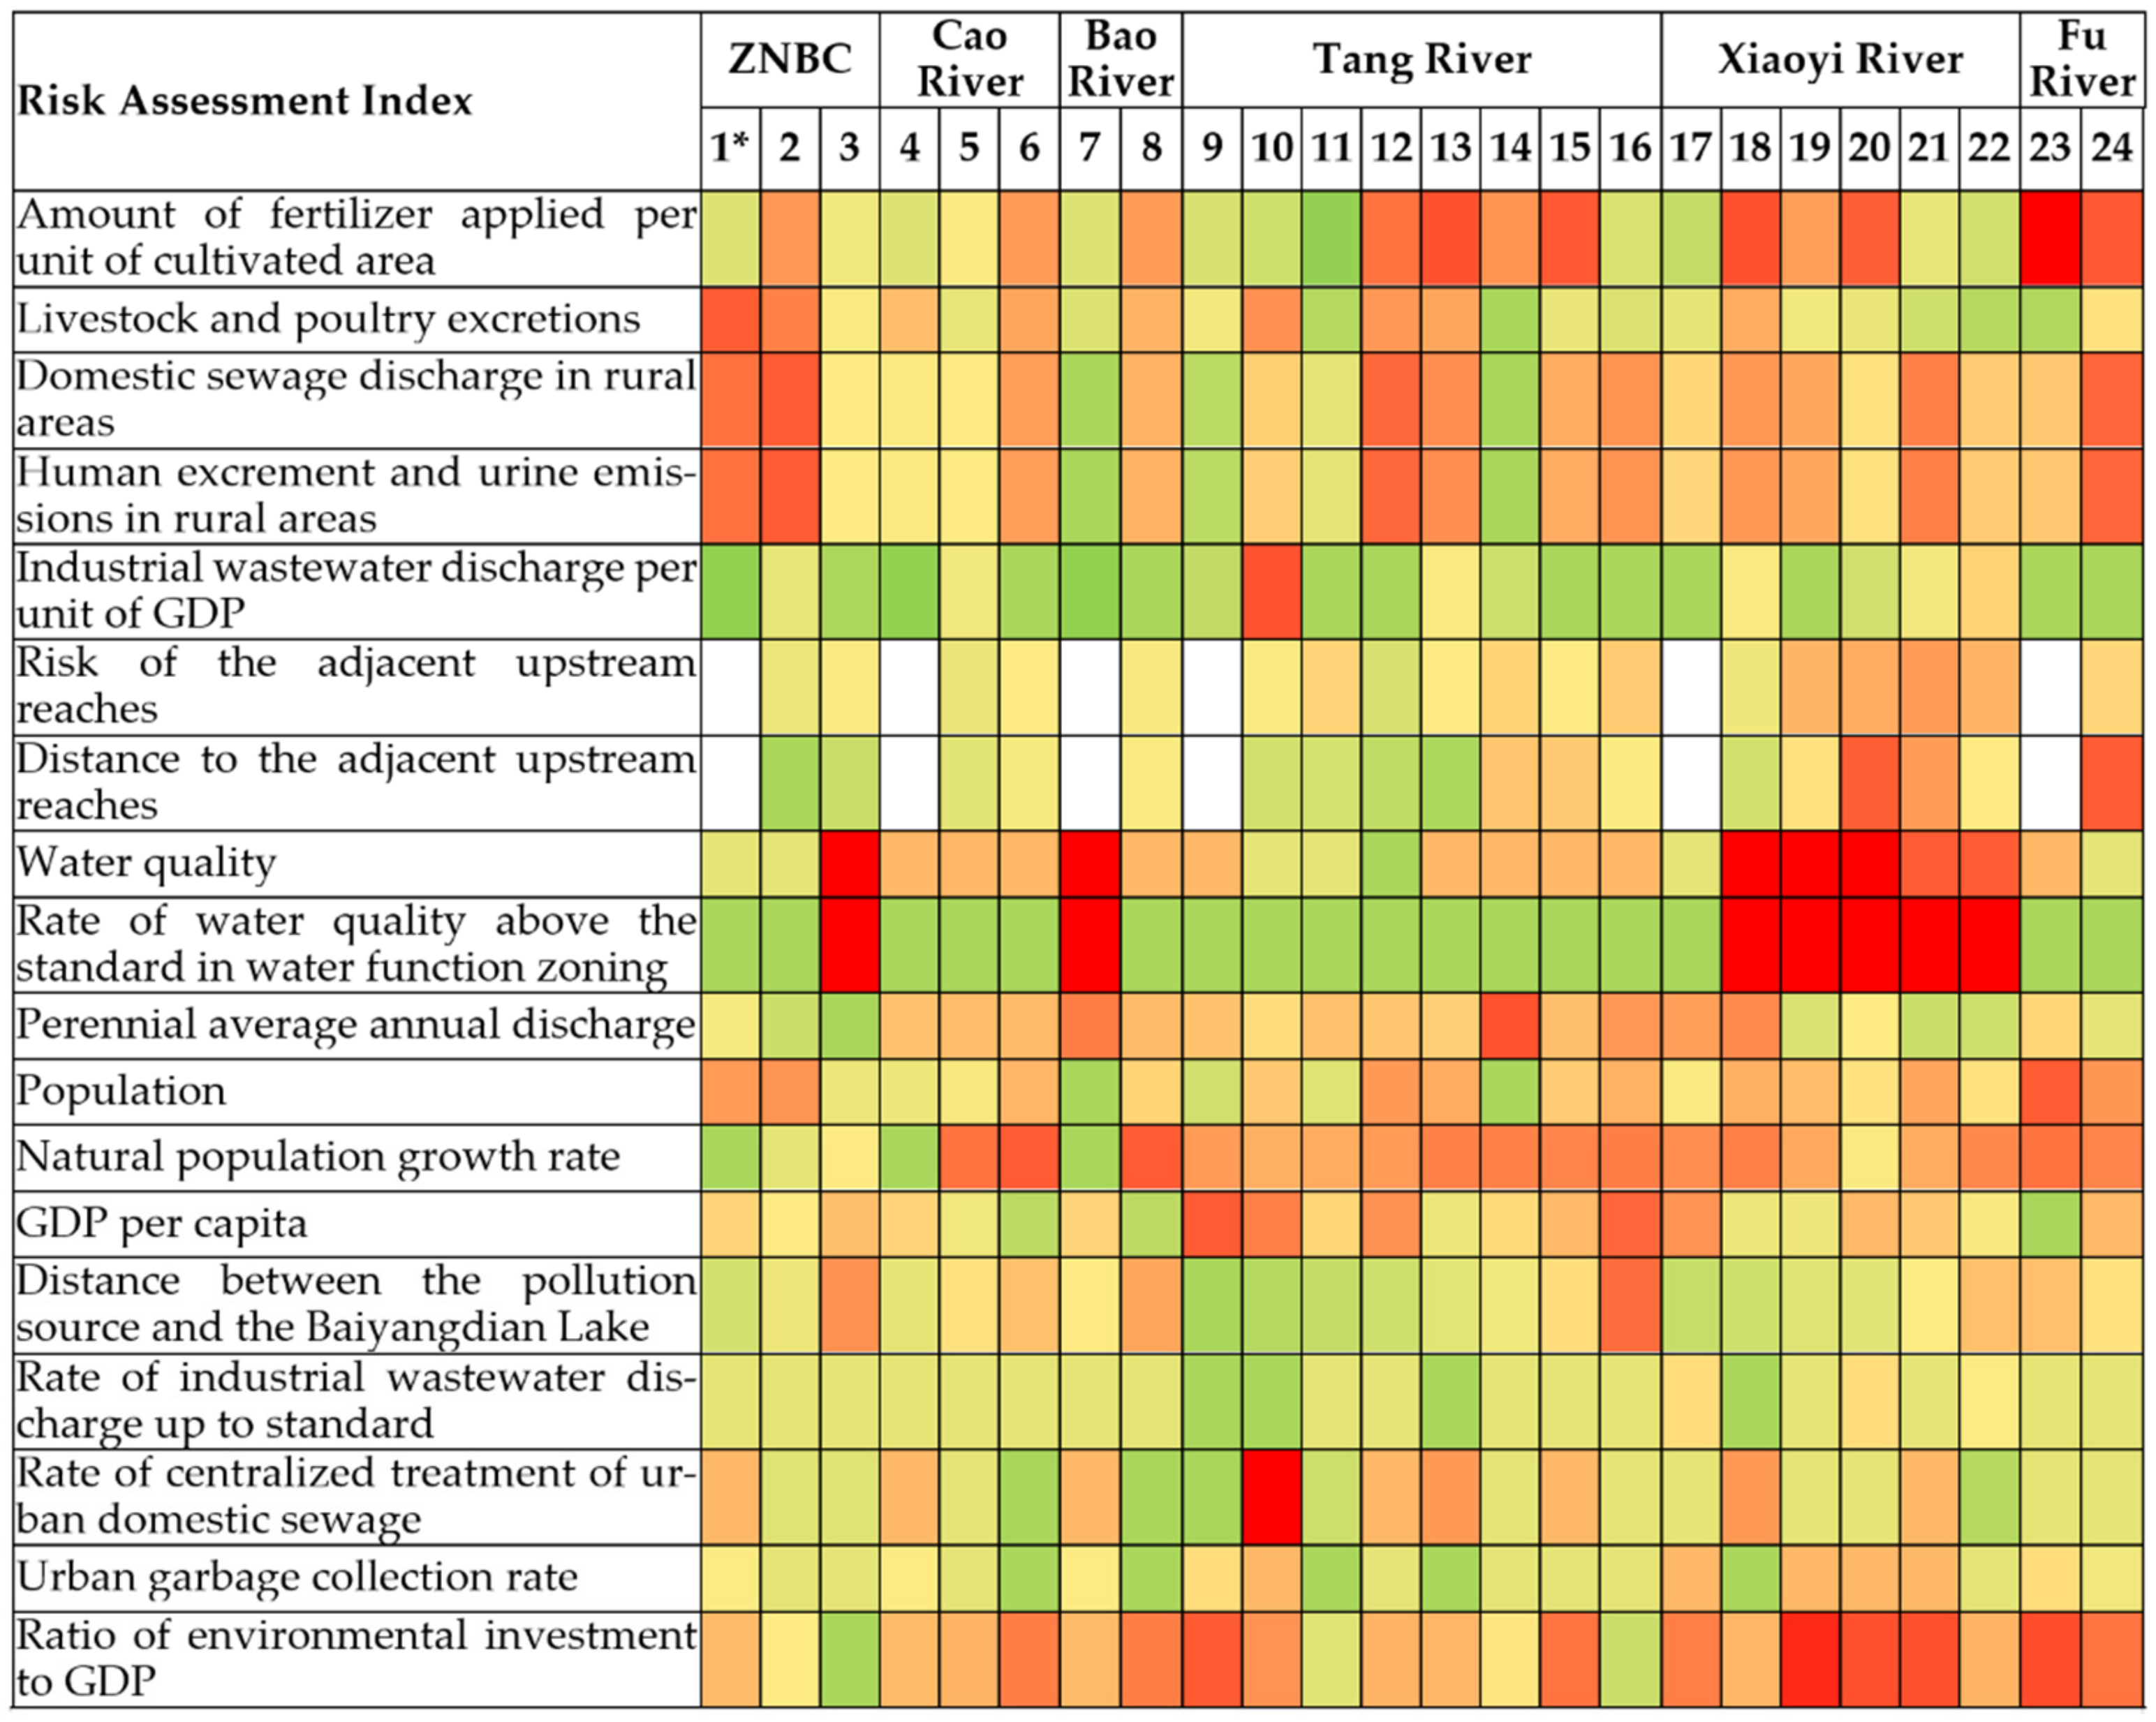
A thermal map of the water environment comprehensive risk assessment index scores in different river segments is shown in Figure 4. We can see that the amount of fertilizer applied per unit of cultivated area, water quality, the rate of water quality above the standard in water function zoning, and the ratio of environmental investment to GDP were important factors influencing the cumulative water environment risk. Most of the counties and districts surrounding the upper reaches of the Baiyangdian Lake did not pay enough attention to water environmental protection; the ratio of environmental investment to GDP was less than 1%, which may make it difficult to control the trend of environmental deterioration. The upstream rivers of the Baiyangdian Lake mainly distribute in the west plain of the Daqinghe Basin, where the agricultural production conditions are good, and the agricultural economy is relatively developed. It is the main grain-producing area in China. The fertilizer application intensities in these areas were much higher and were about three–five times higher than the internationally recognized safety limit (225 kg/hm2). In particular, in Dingzhou County and Lianchi District, more vegetable and fruits were planted, to which a great deal of fertilizer was applied. The unreasonable fertilization would lead to environmental pressure for the rivers. The water quality and the rate of water quality above the standard in water function zoning were also very important. During the study period, the water qualities of most river reaches were worse than the Ⅲ grade of the water quality standards, especially for the segments of the Xiaoyi River. Additionally, the perennial average annual discharge in the Tang River—Wangdu County unit and the rate of the centralized treatment of urban domestic sewage in the Tang River—Lingqiu County unit also had larger influences on the environment risk. Furthermore, the livestock and poultry excretions in ZNBC–Yi County also had a great effect on the environment risk.
3.2. Sudden Water Environmental Risk
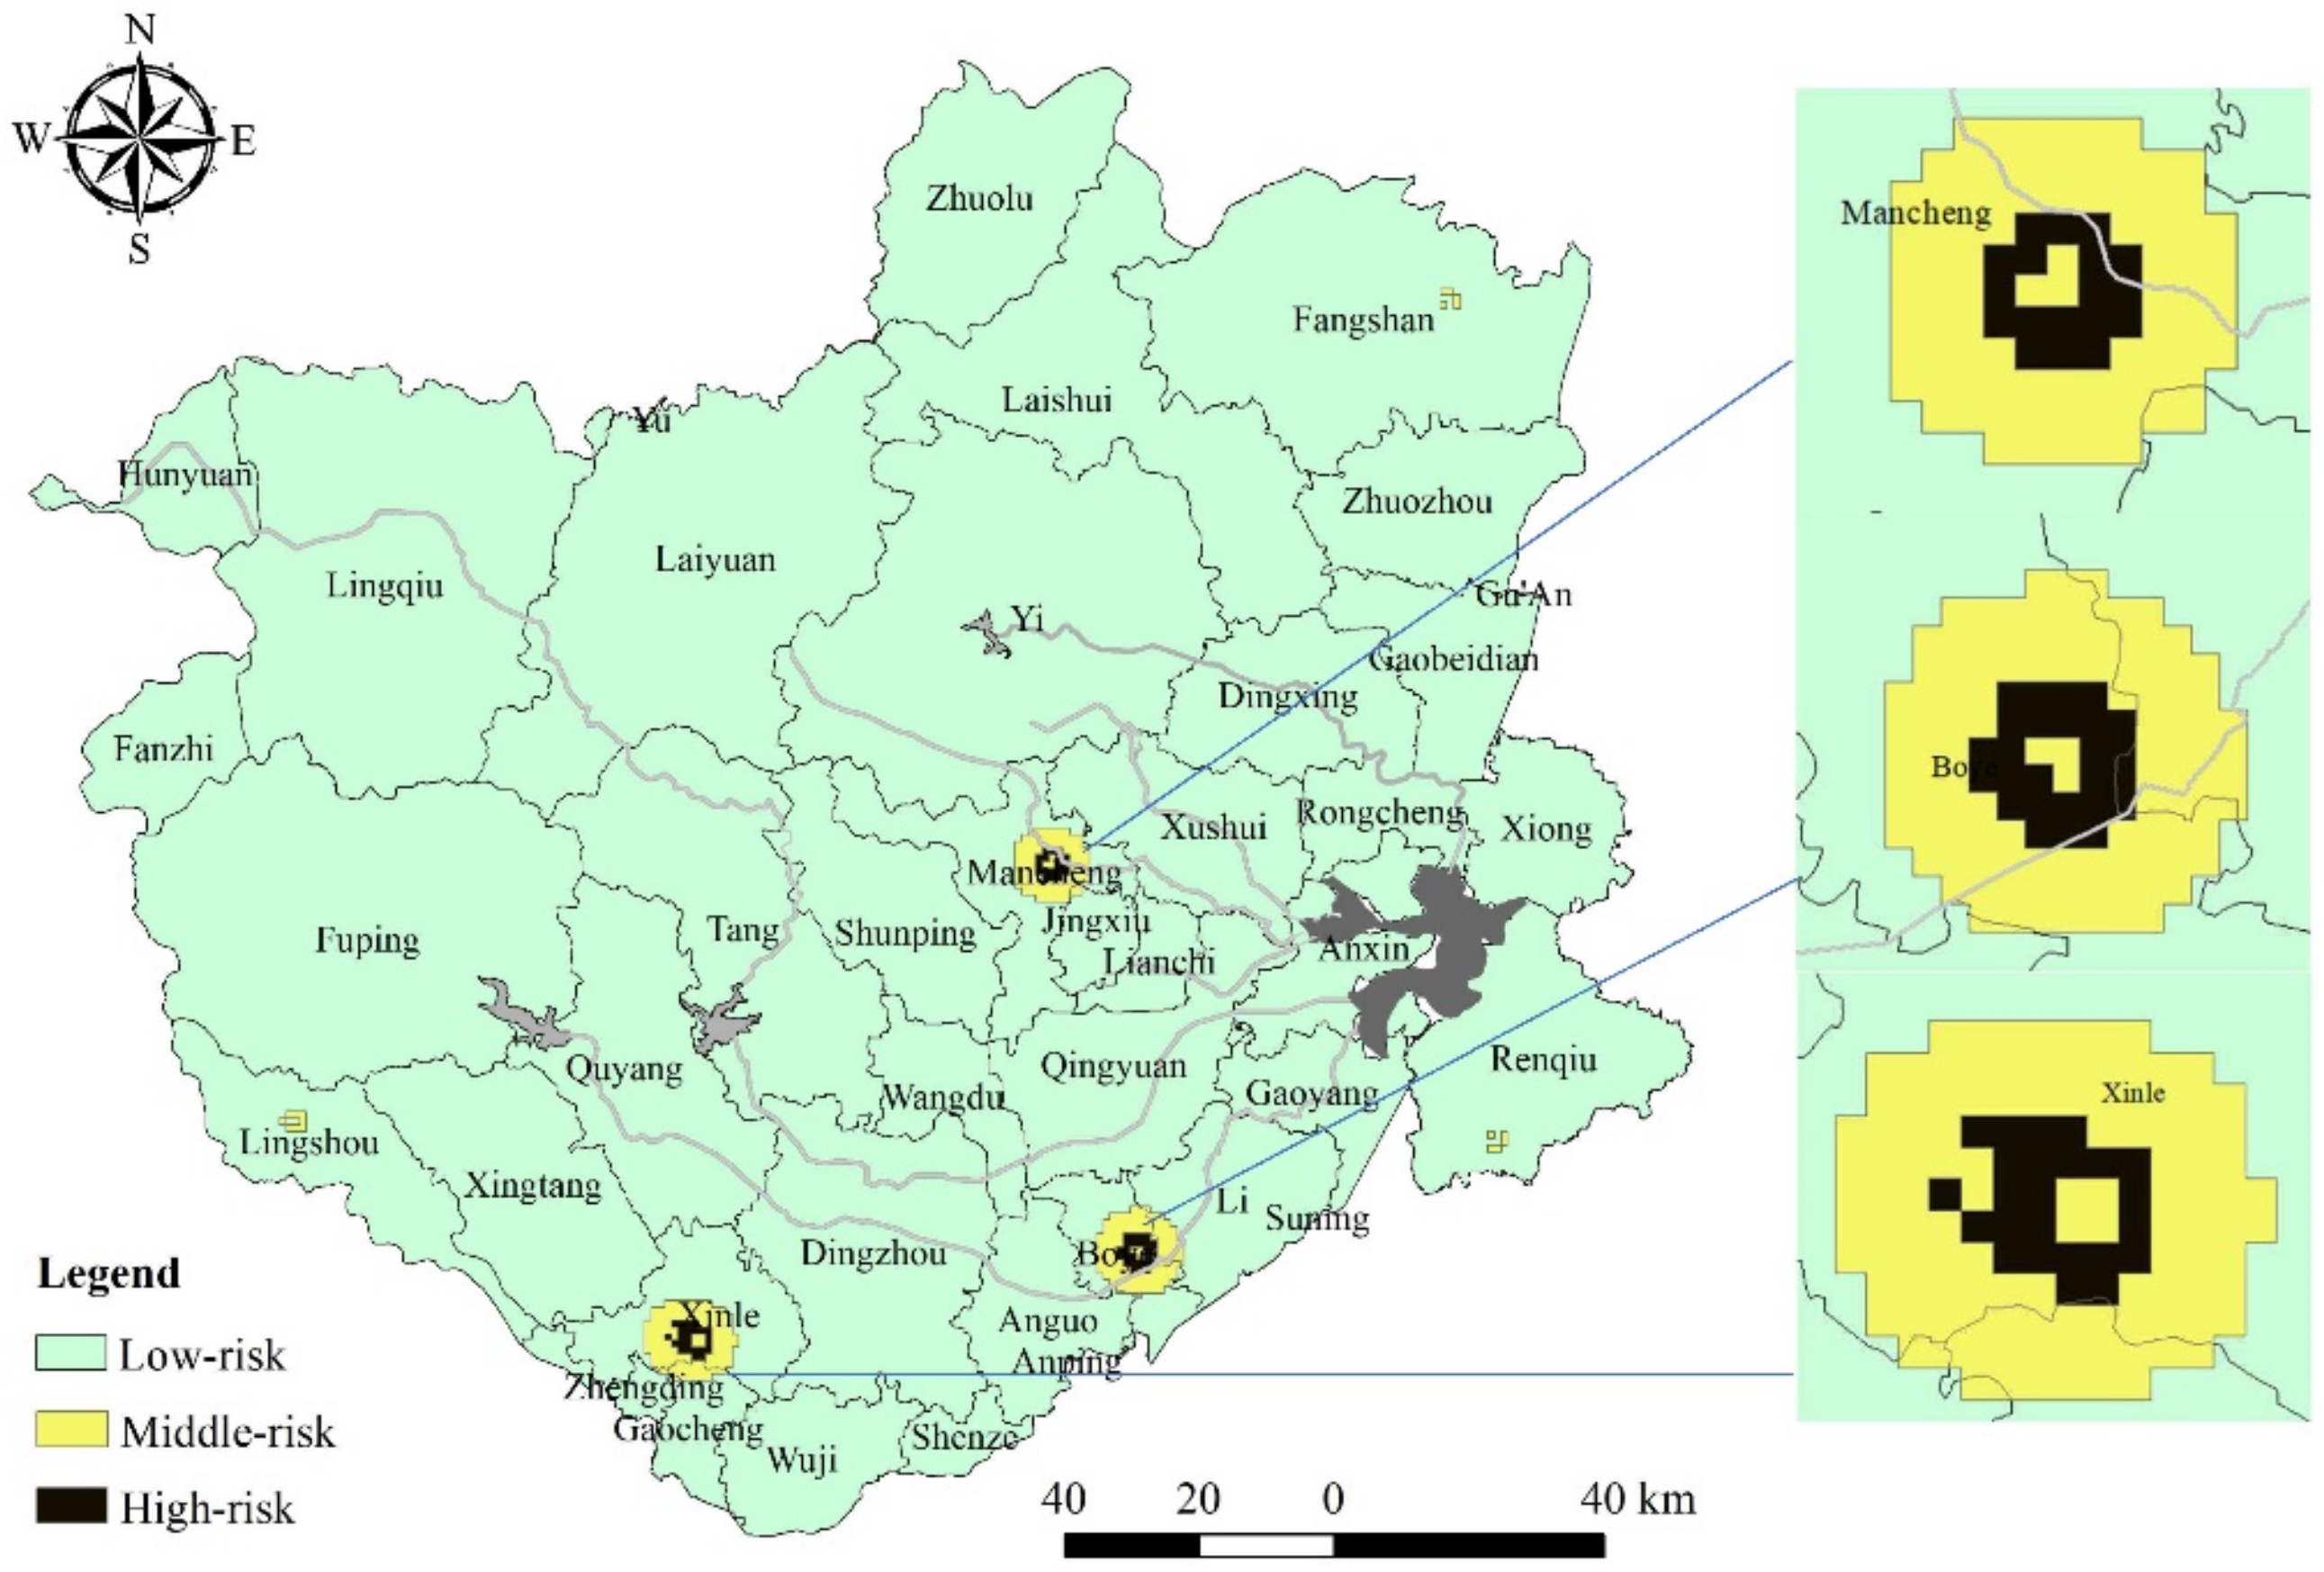
The calculated field intensity of the water environmental risk in the Baiyangdian Basin is shown in Figure 5. We can see that the areas with a high-risk field intensity were mainly distributed in Mancheng District, Li County, Boye County, and Xinle City. In these areas, large numbers of key monitoring wastewater discharge enterprises existed, accounting for 27.2% of those in the Baiyangdian Basin. The risk field intensity in Mancheng District was higher, mainly because there were more paper and paper products enterprises. For Li and Boye Counties, the main reasons were, respectively, large numbers of textile enterprises as well as papermaking enterprises and several large chemical raw materials and chemical products manufacturing enterprises in and surrounding the two regions. The high field intensity of the environmental risk in Xinle City was mainly due to the large numbers of chemical plants, food processing plants, and sewage treatment plants present. The middle-risk field intensity was mainly the radiation area of the high-risk field intensity.
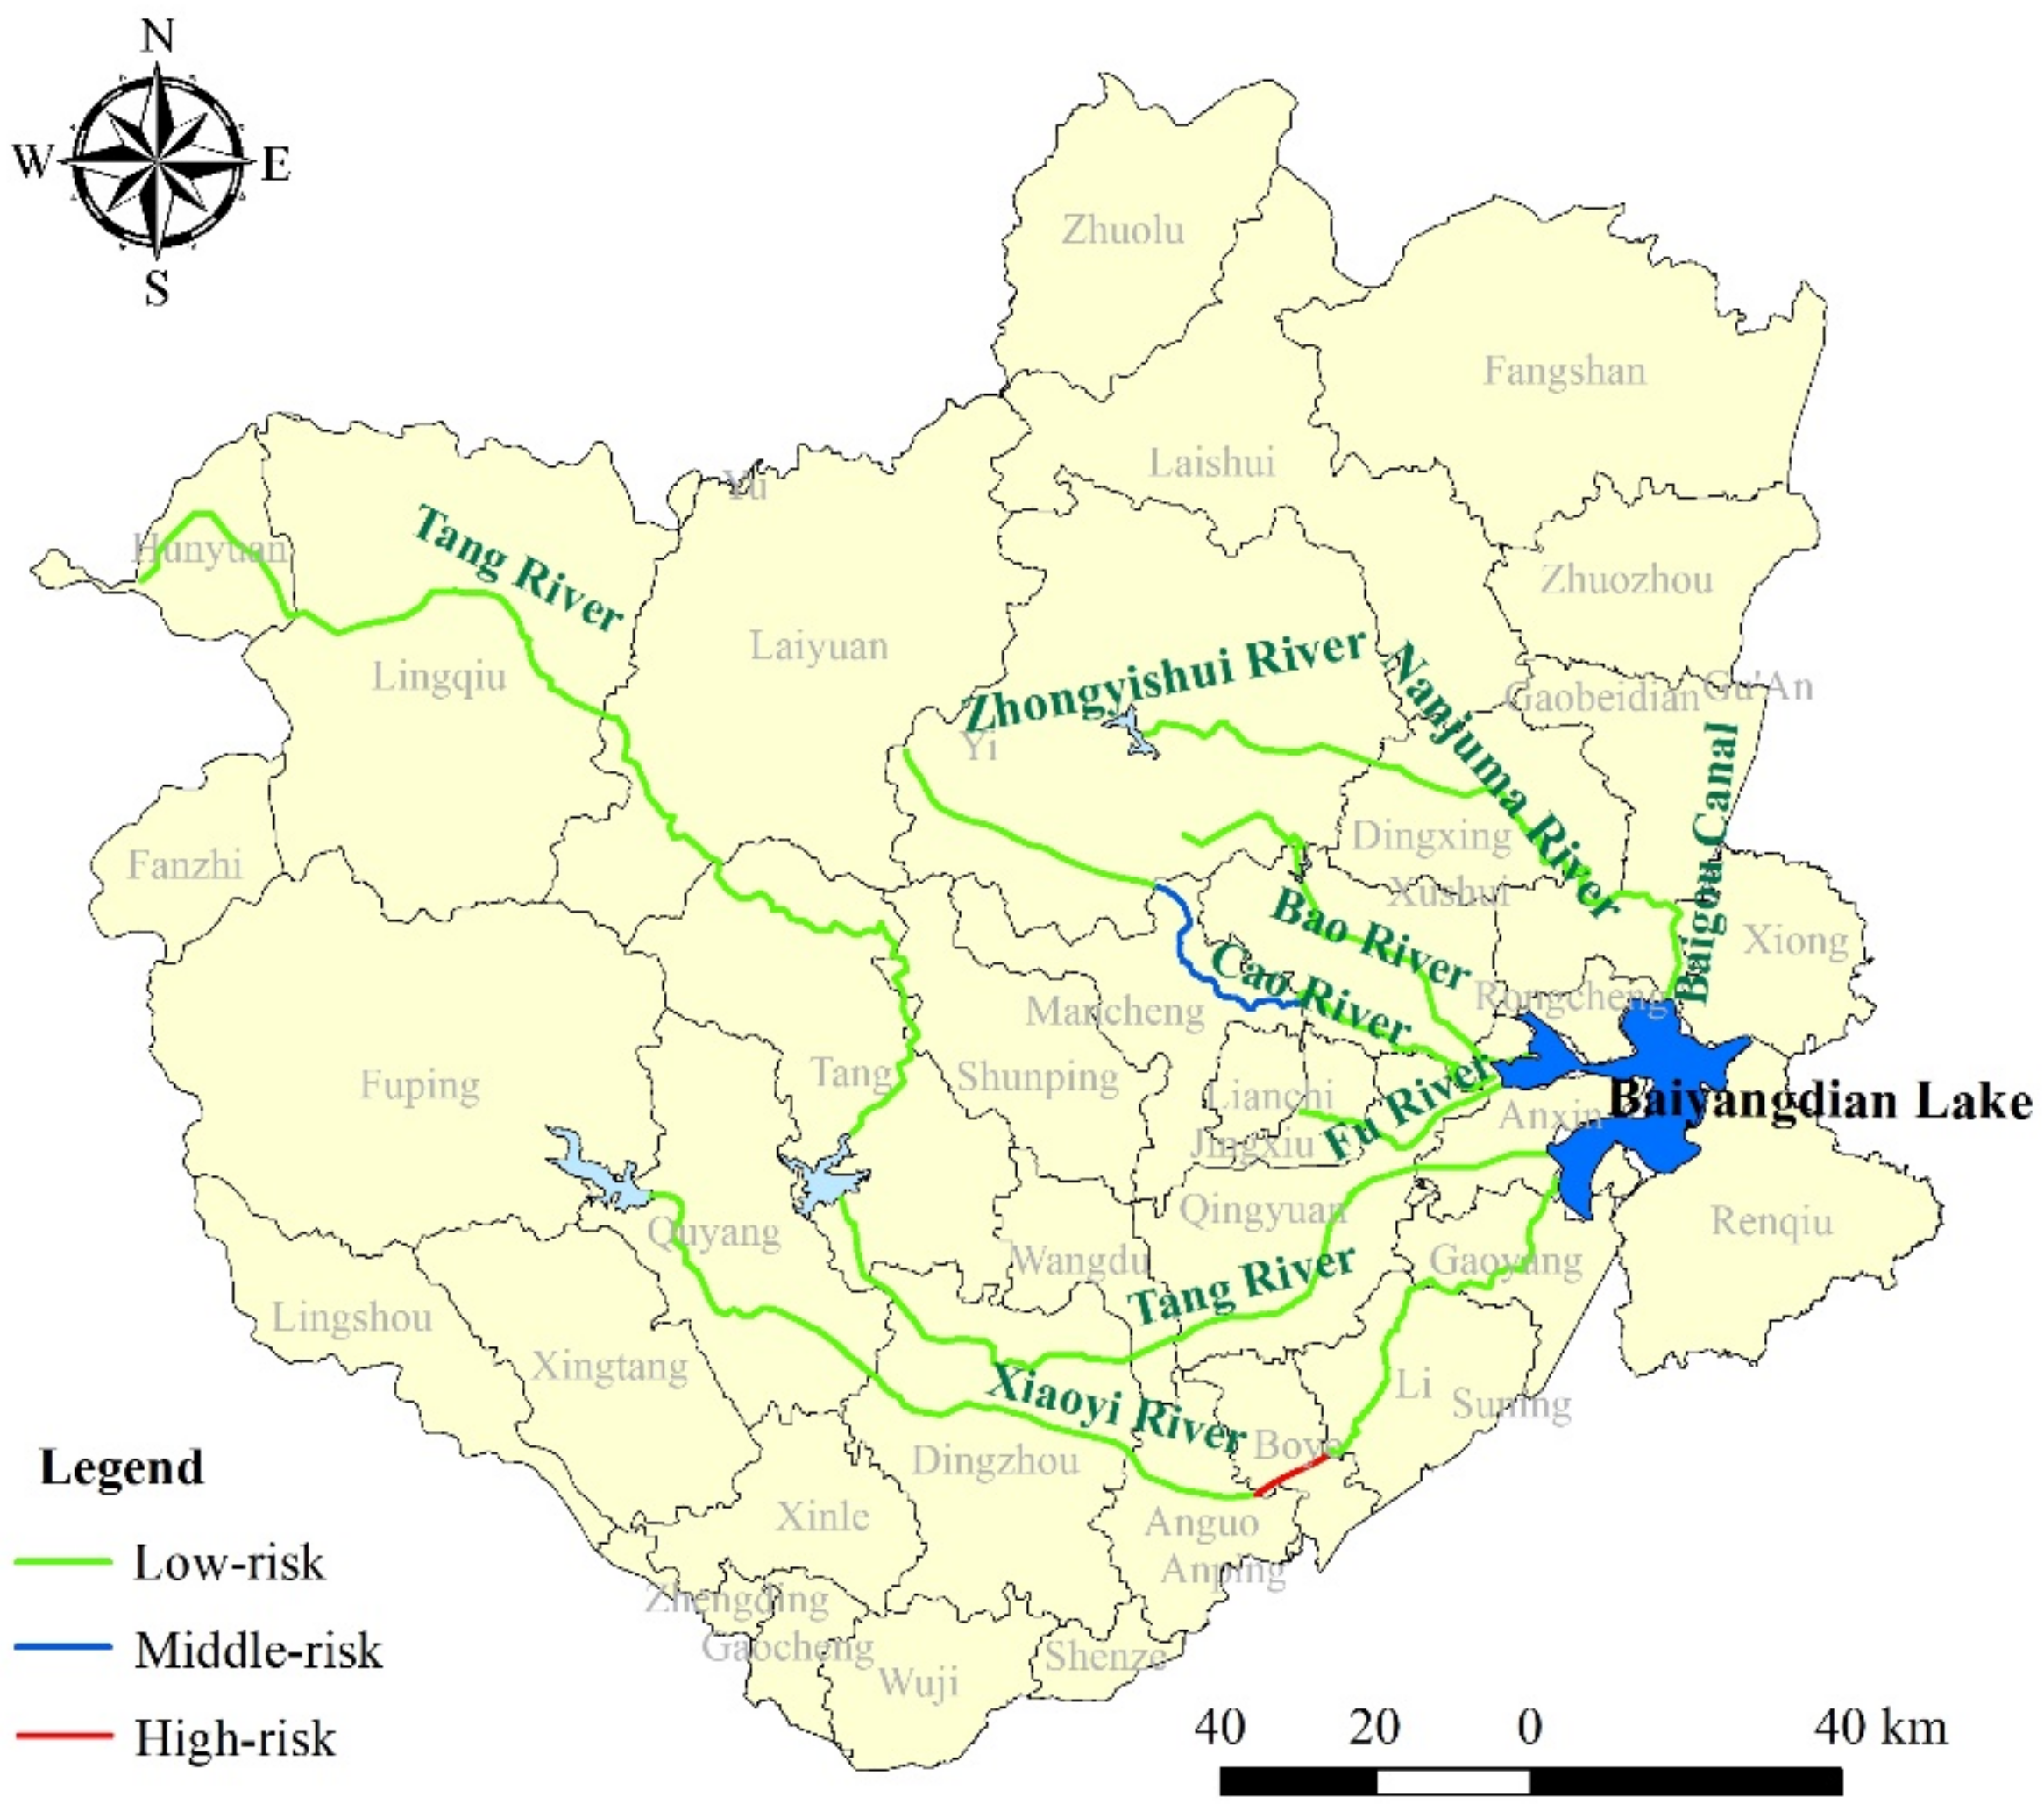
Taking the receptor vulnerability index of environmental risk into account, sudden water environmental risks of the rivers are shown in Figure 6. The results show that the sudden water environmental risk of the Xiaoyi River—Boye County reaches was high, that of the Cao River—Mancheng District reaches was in the middle, and those of the other reaches were low. For the Xiaoyi River—Boye County reaches, although the control area located outside the ecological red line and the vulnerability of risk receptors were low, the risk field intensity level was relatively higher. There were more water environmental risk substances (sulfuric acid) in the surrounding raw materials and chemical products manufacturing enterprises where the values of Q were much higher than those of other enterprises. For the Cao River—Mancheng District reaches, most of the control area laid within the red line of ecological distribution, and the risk field intensity level was also high. Under the combined effect, the sudden water environmental risk of the rivers presented such a result.
3.3. Water Environment Risk Prevention and Control Measures
Based on the analysis of the cumulative water environment risks of the upper rivers of the Baiyangdian Lake, we found that the amount of fertilizer applied per unit of cultivated area, water quality, rate of water quality above the standard in water function zoning, and the ratio of environmental investment to GDP had a great effect on cumulative water environment risks, and that the perennial average annual discharge, urban domestic sewage, and livestock were also important. For the prevention and control of cumulative water environment risk, the following suggestions could be adopted.
Firstly, scientific farming and balanced fertilization could be used in order to reduce the intensity of chemical fertilizer application; at the same time, deep tillage and the deep application of chemical fertilizer, combined with water-saving irrigation technology, should also be promoted to improve the utilization rate of nutrients [43]. Secondly, more attention should be paid to water environment protection in Dingzhou County, Anguo County, Boye County, and Lixian County. The investment in environmental protection should be increased, and the relationship between economic growth and agricultural non-point source pollution should be well-dealt. Thirdly, water environmental protection should be strengthened, and the water quality of rivers should be improved, especially for the Xiaoyi River. To ensure the water quality of the replenishment to the Baiyangdian Lake, the rivers regarded as replenishment paths should also be controlled in regard to their pollution. The investigation and punishment of illegal sewage discharges around rivers should be enhanced, and the vicious circle of cleaning up pollution should be strictly eliminated. Fourthly, optimizing livestock and poultry breeding models as well as implementing the resource utilization of livestock and poultry manure could be carried out to control the pollution of livestock farming.
For the prevention and control of sudden water environment risks, more attention should be paid to the risk sources in Boye County and Mancheng District. To control the sudden pollution in these areas, heavily polluting industries, such as textiles and paper making, should be renovated. Eliminating outdated production capacity, upgrading the industry, and resolutely shutting down heavily polluting enterprises that discharge unqualified wastewater should occur.
4. Discussion
This study can provide a comprehensive suggestion for water environment protection in the Baiyangdian Basin and offer a key reference for local governments.
For the index system of environmental risk, the index selection of the weights of different indexes was very critical.
Compared with the index systems in the literature [23], the objective in this paper was rivers, and Chen’s study objective was the basin. The index system in this paper added the indicators of river characteristics as well as physical geography and social development conditions, which directly reflected the current situation of the river environment and the economic effects, respectively. When compared with the index systems of the literature [24], the indicators of policy and reputation have not been considered in this paper, which might be difficult to obtain. While considering the development of the Xiongan New Area, the Baiyangdian Lake will be paid more attention in future. Then, the indicators of policy and reputation could be considered. The index system in this paper may be more realizable, and the data sources are more quantized, which can reasonably reduce the influence of subjective judgment. Additionally, the index system in this paper considered the characteristic of pollution transmissibility and accumulation in rivers by first setting different indicators in the beginning reaches and other reaches. In order to express the effect of the pollutant in upstream reaches on the downstream reaches, the indicators of risk of the upstream reaches and the distance between the upstream reaches and downstream reaches have been used. The transportation of pollutants along rivers could be calculated by simulation and theory calculation [44]. The quantitative characterization of the transportation of pollutants along rivers may be more accurate to the downstream water environment.
In this paper, a questionnaire survey method and analytic hierarchy process (AHP) were used to calculate the weights, which have been used in many pieces of research [45,46,47]. The APH method is usually combined with other methods for risk assessment in different fields. The questionnaire survey method is usually easier to implement and may be more suitable to reality but is more subjective. Invalid or bad results of a questionnaire survey may cause decision makers to make wrong decisions [48], while there are also some objective methods, such as the entropy weight method, method of the Technique for Order Preference by Similarity to Ideal Solution (TOPSIS), statistics models, and neural networks [49,50,51]. Additionally, there were also some combined subjective methods, such as a combined method of the TOPSIS and the entropy weight method [52]. For further improvement, an objective and reasonable approach should be used.
In addition, for sudden water environmental risk assessments, the pollution sources in this paper were the industry. There have been many other cases producing sudden pollutant, such as hazardous chemicals leaking and dumping accidents during transportation [53]. More pollution sources for sudden water environmental risk should be considered.
Furthermore, both cumulative and sudden environmental risk assessments were conducted, which was an improvement compared to previous research, while the cumulative and sudden environmental risk assessments in this paper did not form a united risk assessment. How to combine the results of cumulative and sudden environmental risk assessments may be a new exploration in the future.
5. Conclusions
Cumulative and sudden environmental risk assessments of the upper rivers of the Baiyangdian Lake were conducted, and water environment risk prevention as well as control suggestions were given, which provided a key reference for water environment protection for local governments in the Baiyangdian Basin. The main conclusions are as follows.
Firstly, an index system that considered the characteristics of pollution transmissibility and accumulation in rivers by setting different indicators in the beginning reaches and other reaches was built. The cumulative environment risk of most of the upper reaches of the Baiyangdian Lake was in the middle. The segments of the Xiaoyi River—Dingzhou County, Xiaoyi River—Anguo County, Xiaoyi River—Boye County, and Xiaoyi River—Li County had a high cumulative environment risk, and the segment of the Tang River—Laiyuan County was the only low-risk area. Secondly, the amount of fertilizer applied per unit of cultivated area, water quality, rate of water quality above the standard in water function zoning, and the ratio of environmental investment to GDP had great effects on cumulative water environment risk. Thirdly, the sudden water environment of the Xiaoyi River—Boye County unit was at high risk, that of the Cao River—Mancheng District unit was at middle risk, and those of other segments were at low risk. Fourthly, for cumulative water environment risk prevention and control, reducing the intensity of chemical fertilizer application, improving the utilization rate of nutrients, and strengthening water environmental protection may be effective measures. In order to prevent sudden water environment risks, eliminating outdated production capacity and upgrading the industry should occur. The objective and reasonable approach should be used to calculate the weight of indicators, quantitative characterization of the transportation of pollutants along rivers may be deepened, and the combined assessment of cumulative and sudden environmental risks may be explored in the future.
Supplementary Materials
The following supporting information can be downloaded at: https://www.mdpi.com/article/10.3390/w14162557/s1, Supplementary Questionnaire.
Author Contributions
X.G. and Y.T. wrote the manuscript. X.R., Y.T., X.C., and B.L. analyzed the data. X.G. and Y.T. revised the manuscript. All authors have read and agreed to the published version of the manuscript.
Funding
This research was funded by the National Natural Science Foundation Program of China (Grant Nos. 51909277), National Key R&D Program of China (Grant No.2018YFC0406502), Basic research project of Qinghai Province (2021-ZJ-709), and the follow-up work of the Three Gorges Dam Project.
Institutional Review Board Statement
Not applicable.
Informed Consent Statement
Not applicable.
Data Availability Statement
The data presented in this study are available on request from the corresponding author.
Conflicts of Interest
The authors declare no conflict of interest.
References
- Jaybhaye, R.; Nandusekar, P.; Awale, M.; Paul, D.; Kulkarni, U.; Jadhav, J.; Mukkannawar, U.; Kamble, P. Analysis of seasonal variation in surface water quality and water quality index (WQI) of Amba River from Dolvi Region, Maharashtra, India. Arab. J. Geosci. 2022, 15, 1261. [Google Scholar] [CrossRef]
- Snitynskyi, V.; Khirivskyi, P.; Hnativ, I.; Hnativ, R. Influence of climatic factors on runoff formation and surface water quality of the Stryi river basin. In Proceedings of the EcoComfort 2020, Lviv, Ukraine, 16–18 September 2021; pp. 436–442. [Google Scholar]
- Puchlik, M.; Piekutin, J.; Dyczewska, K. Analysis of the Impact of Climate Change on Surface Water Quality in North-Eastern Poland. Energies 2021, 15, 164. [Google Scholar] [CrossRef]
- Bridhikitti, A.; Prabamroong, T.; Yu, G.-A. Problem identification on surface water quality in the Mun River Basin, Thailand. Sustain. Water Resour. Manag. 2020, 6, 53. [Google Scholar] [CrossRef]
- Qiao, X.; Schmidt, A.H.; Xu, Y.; Zhang, H.; Chen, X.; Xiang, R.; Tang, Y.; Wang, W. Surface water quality in the upstream-most megacity of the Yangtze River Basin (Chengdu): 2000–2019 trends, the COVID-19 lockdown effects, and water governance implications. Environ. Sustain. Indic. 2021, 10, 100118. [Google Scholar] [CrossRef]
- Das, S.; Kaur, S.; Jutla, A. Earth Observations Based Assessment of Impact of COVID-19 Lockdown on Surface Water Quality of Buddha Nala, Punjab, India. Water 2021, 13, 1363. [Google Scholar] [CrossRef]
- Vieira, J.; Fonseca, A.; Vilar, V.J.P.; Boaventura, R.A.R.; Botelho, C.M.S. Water quality in Lis river, Portugal. Environ. Monit. Assess. 2012, 184, 7125–7140. [Google Scholar] [CrossRef] [PubMed]
- Hou, D.; Ge, X.; Huang, P.; Zhang, G.; Loáiciga, H. A real-time, dynamic early-warning model based on uncertainty analysis and risk assessment for sudden water pollution accidents. Environ. Sci. Pollut. Res. 2014, 21, 8878–8892. [Google Scholar] [CrossRef]
- Wang, X.; Pang, Y.; Wang, X.; Zhou, Q.; Xie, R. Study of Water Environmental Cumulative Risk Assessment Based on Control Unit and Management Platform Application in Plain River Network. Sustainability 2017, 9, 975. [Google Scholar] [CrossRef]
- Yuan, P.; Wen-Xiu, L.I.; Peng, J.F.; Song, Y.H.; Wei-Ning, X.U. Research progress of cumulative environmental risk assessment at home and abroad. J. Environ. Eng. Technol. 2015, 5, 393–400. [Google Scholar]
- Faust, J.B. Perspectives on cumulative risks and impacts. Int. J. Toxicol. 2010, 29, 58–64. [Google Scholar] [CrossRef]
- Xiao, Y.; Huang, S.; Zhou, J.; Kong, F.; Liu, M.; Li, Y. Risk Assessment of Upper-Middle Reaches of Luanhe River Basin in Sudden Water Pollution Incidents Based on Control Units of Water Function Areas. Water 2018, 10, 1268. [Google Scholar] [CrossRef]
- Marara, T.; Palamuleni, L.G. An environmental risk assessment of the Klip river using water quality indices. Phys. Chem. Earth 2019, 114, 102799. [Google Scholar] [CrossRef]
- Sahoo, M.M.; Swain, J.B. Modified heavy metal Pollution index (m-HPI) for surface water Quality in river basins, India. Environ. Sci. Pollut. Res. 2020, 27, 15350–15364. [Google Scholar] [CrossRef] [PubMed]
- Islam, M.S.; Nakagawa, K.; Abdullah-Al-Mamun, M.; Khan, A.; Goni, M.A.; Berndtsson, R. Spatial Distribution and Source Identification of Water Quality Parameters of an Industrial Seaport Riverbank Area in Bangladesh. Water 2022, 14, 1356. [Google Scholar] [CrossRef]
- Vosoogh, A.; Saeedi, M.; Lak, R. Metal fractionation and pollution risk assessment of different sediment sizes in three major southwestern rivers of Caspian Sea. Environ. Earth Sci. 2017, 76, 292. [Google Scholar] [CrossRef]
- Kuzmanović, M.; Ginebreda, A.; Petrović, M.; Barceló, D. Risk assessment based prioritization of 200 organic micropollutants in 4 Iberian rivers. Sci. Total Environ. 2015, 503–504, 289–299. [Google Scholar] [CrossRef] [PubMed]
- United States Environmental Protection Agency. Guidance on Cumulative Risk Assessment: Part1. Planning and Scoping; Office of Pesticide Programs: Washington, DC, USA, 1997.
- United States Environmental Protection Agency. Framework for Cumulative Risk Assessment; Risk Assessment Forum: Washington, DC, USA, 2003.
- Nazar, A.; Hall, W.; Albertson, M. Risk Avoidance Objective in Water Resources. J. Water Resour. Plan. Manag. Div. 1981, 107, 201–209. [Google Scholar] [CrossRef]
- Gottardo, S.; Semenzin, E.; Giove, S.; Zabeo, A.; Critto, A.; Zwart, D.D.; Ginebreda, A.; Marcomini, A. Integrated risk assessment for WFD ecological status classification applied to Llobregat river basin (Spain). Part I—Fuzzy approach to aggregate biological indicators. Sci. Total Environ. 2011, 409, 4701–4712. [Google Scholar] [CrossRef]
- Gottardo, S.; Semenzin, E.; Giove, S.; Zabeo, A.; Critto, A.; Zwart, D.D.; Ginebreda, A.; Ohe, P.; Marcomini, A. Integrated Risk Assessment for WFD Ecological Status classification applied to Llobregat river basin (Spain). Part II—Evaluation process applied to five environmental Lines of Evidence. Sci. Total Environ. 2011, 409, 4681–4692. [Google Scholar] [CrossRef]
- Chen, K.; Huang, L.; Fang, Q. Application of accumulative environmental risks assessment based on genetic neural network model. Environ. Monit. 2012, 4, 1–6. [Google Scholar]
- Wei, N.; Qiu, Y.Q.; Gan, H.; Qiong, L.U.; Liu, J.J.; Gan, Y.D.; Wang, C.Y.; Liu, N. Application of WWFWater Risk Assessment Tools in China—A Case Study in the Yangtze River Basin. J. Nat. Resour. 2015, 30, 502–512. [Google Scholar]
- Topuz, E.; van Gestel, C.A.M. An approach for environmental risk assessment of engineered nanomaterials using Analytical Hierarchy Process (AHP) and fuzzy inference rules. Environ. Int. 2016, 92–93, 334–347. [Google Scholar] [CrossRef] [PubMed]
- Abedzadeh, S.; Roozbahani, A.; Heidari, A. Risk Assessment of Water Resources Development Plans Using Fuzzy Fault Tree Analysis. Water Resour. Manag. 2020, 34, 2549–2569. [Google Scholar] [CrossRef]
- Scott, A. Environment–accident index: Validation of a model. J. Hazard. Mater. 1998, 61, 305–312. [Google Scholar] [CrossRef]
- Dura, G.; László, E.; Reizer, B.; Molnár, T. Tentative Hazard Assessment of Industrial Facilities. In Exposure and Risk Assessment of Chemical Pollution–Contemporary Methodology; Springer: Dordrecht, The Netherlands, 2009; pp. 195–207. [Google Scholar]
- Liu, Y. Research on Environment Risk Source Identification of Sudden Water Pollution Accident Based on Safety Theory. Master’s Thesis, Harbin Institute of Technology, Harbin, China, 2011. [Google Scholar]
- Yang, Y.; Lei, X.; Long, Y.; Tian, Y.; Zhang, Y. A novel comprehensive risk assessment method for sudden water accidents in the Middle Route of the South–North Water Transfer Project (China). Sci. Total Environ. 2020, 698, 134167. [Google Scholar] [CrossRef]
- Ministry of Ecology and Environment of the People’s Republic of China. Recommendation Method for Risk Assessment of Environmental Emergencies in Administrative Regions; Ministry of Ecology and Environment of the People’s Republic of China: Beijing, China, 2018.
- Zhou, X.; Yu, F.; Liu, Q.; Cao, G.; Ma, G.; Yang, W. Risk zoning of sudden water pollution in Dongjiang River basin. Acta Ecol. Sin. 2020, 40, 4813–4822. [Google Scholar] [CrossRef]
- Tao, Y.; Liu, J.; Guan, X.; Chen, H.; Ji, M. Estimation of potential agricultural non-point source pollution for Baiyangdian Basin, China, under different environment protection policies. PLoS ONE 2020, 15, e0239006. [Google Scholar] [CrossRef]
- Hongbin, Z.; Ci, C.; Mengqi, L.; Cunlu, G. Route Choice Decision Model for Driver Based on Three-scale Analytic Hierarchy Process. Sci. Technol. Eng. 2019, 19, 369–374. [Google Scholar] [CrossRef]
- Saaty, T.L. Decision making with the analytic hierarchy process. Int. J. Serv. Sci. 2008, 1, 83–98. [Google Scholar] [CrossRef]
- Mordeson, J.N.; Wierman, M.J.; Clark, T.D.; Pham, A.; Redmond, M.A. The Analytic Hierarchy Process. In Linear Models in the Mathematics of Uncertainty. Studies in Computational Intelligence; Springer: Berlin/Heidelberg, Germany, 2013; pp. 93–117. [Google Scholar]
- Lanzara, R.G. Weber’s law modeled by the mathematical description of a beam balance. Math. Biosci. 1994, 122, 89–94. [Google Scholar] [CrossRef]
- Dong, Y.; Zhou, W.; Wang, X.; Lu, Y.; Zhao, P.; Li, X. A new assessment method for the vulnerability of confined water: W-F&PNN method. J. Hydrol. 2020, 590, 125217. [Google Scholar] [CrossRef]
- Bojórquez-Tapia, L.A.; Cruz-Bello, G.M.; Luna-González, L.; Juárez, L.; Ortiz-Pérez, M.A. V-DRASTIC: Using visualization to engage policymakers in groundwater vulnerability assessment. J. Hydrol. 2009, 373, 242–255. [Google Scholar] [CrossRef]
- Bai, J.; Wang, H.; Liu, S.; Tian, K.; Zhao, Y.; Li, C. Evaluations of water environment carrying capacity:A case study in the Baiyangdian watershed, China. J. Agro Environ. Sci. 2020, 39, 1070–1076. [Google Scholar]
- Zhou, H.; Sun, X.; Jiang, F.; Li, L.; Tu, W. Application Practice of Grid Regional Environmental Risk Assessment—A Case Study of a District in Chongqing. Environ. Impact Assess. 2019, 41, 83–88. [Google Scholar]
- Hayashi, T.I.; Imaizumi, Y.; Yokomizo, H.; Tatarazako, N.; Suzuki, N. Ecological risk assessment of herbicides in Japan: Integrating spatiotemporal variation in exposure and effects using a multimedia model and algal density dynamics models. Environ. Toxicol. Chem. 2016, 35, 233–240. [Google Scholar] [CrossRef]
- Zheng, H.; Liu, S.; Hou, X.; Wang, S.; Huang, Z.; Ding, J.; Changhong, M.I.; Ling, L.U.; Hou, Y. Summary on the Index System of Ecological Balanced Fertilization for Maize. Meteorol. Environ. Res. 2020, 11, 76–90. [Google Scholar]
- Kachiashvili, K.; Gordeziani, D.; Lazarov, R.; Melikdzhanian, D. Modeling and simulation of pollutants transport in rivers. Appl. Math. Model. 2007, 31, 1371–1396. [Google Scholar] [CrossRef]
- Banda, W. An integrated framework comprising of AHP, expert questionnaire survey and sensitivity analysis for risk assessment in mining projects. Int. J. Manag. Sci. Eng. Manag. 2019, 14, 180–192. [Google Scholar] [CrossRef]
- Huang, H.C.; Wu, S.L.; Wu, P.Y.; Li, C.H. Selection of Festival Planners: Application of Modified Delphi Method and Analytic Hierarchy Process. J. Soc. Sci. 2016, 12, 68–77. [Google Scholar] [CrossRef]
- Matsuura, T. Assessment of potentially reusable edible wild plant and mushroom gathering sites in eastern Fukushima based on external radiation dose. J. Environ. Radioact. 2021, 227, 106465. [Google Scholar] [CrossRef]
- Ergu, D.; Kou, G. Questionnaire design improvement and missing item scores estimation for rapid and efficient decision making. Ann. Oper. Res. 2012, 197, 5–23. [Google Scholar] [CrossRef]
- Li, X.; Wang, K.; Liu, L.; Jing, X.; Yang, H.; Gao, C. Application of the Entropy Weight and TOPSIS Method in Safety Evaluation of Coal Mines. Procedia Eng. 2011, 26, 2085–2091. [Google Scholar] [CrossRef]
- Li, Z.; Luo, Z.; Wang, Y.; Fan, G.; Zhang, J. Suitability evaluation system for the shallow geothermal energy implementation in region by Entropy Weight Method and TOPSIS method. Renew. Energy 2022, 184, 564–576. [Google Scholar] [CrossRef]
- Li, R. Dynamic assessment on regional eco-environmental quality using AHP-statistics model—A case study of Chaohu Lake Basin. Chin. Geogr. Sci. 2007, 17, 341–348. [Google Scholar] [CrossRef]
- Topcu, E. Drought Analysis Using the Entropy Weight-based TOPSIS Method: A Case Study of Kars, Turkey. Russ. Meteorol. Hydrol. 2022, 47, 224–231. [Google Scholar] [CrossRef]
- Gholamizadeh, K.; Mohammadfam, I.; Kalatpour, O. Evaluation of the health consequences in Chemicals road transport accidents: Using a fuzzy approach. J. Occup. Hyg. Eng. 2019, 6, 1–8. [Google Scholar]
Figure 1.
Map of the Baiyangdian Basin and its geographical location in China.

Figure 2.
Cross-section of the water quality monitoring and key monitoring point sources of wastewater discharge in the Baiyangdian Basin.
Figure 2.
Cross-section of the water quality monitoring and key monitoring point sources of wastewater discharge in the Baiyangdian Basin.

Figure 3.
Cumulative water environmental risks of the rivers.

Figure 4.
Thermal map of the water environment comprehensive risk assessment index scores. Note: * stands for the number of the river assessment unit; details were given in Table 1. In this Table, the red mesh meant higher risk scores, the green mesh meant lower risk scores, and the yellow mesh showed the middle risk scores.

Figure 5.
Water environmental risk field intensity in the Baiyangdian Basin.

Figure 6.
Sudden water environmental risk of the rivers.


Table 1.
Water environment risk assessment units of the rivers.
| River Name | Water Environment Risk Assessment Units |
|---|---|
| Zhongyishui River—Nanyishui River—Baigou Canal (ZNBC) | (1) ZNBC–Yi County, (2) ZNBC–Dingxing County, and (3) ZNBC–Rongcheng County |
| Cao River | (4) Cao River—Yi County, (5) Cao River—Mancheng District, and (6) Cao River—Xushui District |
| Bao River | (7) Bao River—Yi County, (8) Bao River—Xushui District |
| Tang River | (9) Tang River—Hunyuan County, (10) Tang River—Lingqiu County, (11) Tang River—Laiyuan County, (12) Tang River—Tang County, (13) Tang River—Dingzhou County, (14) Tang River—Wangdu County, (15) Tang River—Qingyuan District, and (16) Tang River—Anxin County |
| Xiaoyi River | (17) Xiaoyi River—Quyang County, (18) Xiaoyi River—Dingzhou County, (19) Xiaoyi River—Anguo County, (20) Xiaoyi River—Boye County, (21) Xiaoyi River—Li County, and (22) Xiaoyi River—Gaoyang County |
| Fu River | (23) Fu River—Lianchi District and (24) Fu River—Qingyuan District |
Table 2.
Index parameters and weights of the water environment risk assessment system.
| Criterion Layer | Factor Level | Scheme Layer | Index Layer | Beginning Reaches | Other Reaches |
|---|---|---|---|---|---|
| Weight | Weight | ||||
| Risk sources | Non-point source pollution within the control range of the reaches | Planting pollution | Amount of fertilizer applied per unit of cultivated area | 0.1280 | 0.1148 |
| Livestock pollution | Livestock and poultry excretions | 0.0657 | 0.0590 | ||
| Rural living pollution | Domestic sewage discharge in rural areas | 0.0247 | 0.0221 | ||
| Human excrement and urine emissions in rural areas | 0.0091 | 0.0081 | |||
| Point source pollution within the control range of the reaches | Industrial effluents | Industrial wastewater discharge per unit of GDP | 0.2276 | 0.1048 | |
| Water environmental risk impacts of the adjacent upstream reaches | Risk | Risk of the adjacent upstream reaches | - | 0.1069 | |
| Distance | Distance to the adjacent upstream reaches * | - | 0.0393 | ||
| River characteristics | Cross-section of river | Water quality condition | Water quality | 0.0895 | 0.0895 |
| Rate of water quality above the standard in water function zoning | 0.0329 | 0.0329 | |||
| Discharge | Perennial average annual discharge | 0.0450 | 0.0450 | ||
| Physical geography and social development conditions | Social development | Population characteristics | Population | 0.0146 | 0.0146 |
| Natural population growth rate | 0.0054 | 0.0054 | |||
| Economic level | GDP per capita | 0.0543 | 0.0543 | ||
| Physical geography | Location of pollution sources | Distance between the pollution source and the Baiyangdian Lake | 0.0273 | 0.0273 | |
| Water pollution control ability | Primary control mechanism | Sewage exhaust state | Rate of industrial wastewater discharge up to standard | 0.0418 | 0.0418 |
| Sewage treatment | Rate of centralized treatment of urban domestic sewage | 0.0214 | 0.0214 | ||
| Refuse collection | Urban garbage collection rate | 0.0110 | 0.0110 | ||
| Stimulus control mechanism | Risk management investment | Ratio of environmental investment to GDP | 0.2018 | 0.2018 |
Table 3.
Classification of water environment risk comprehensive scoring value.
| Level | Class of Risk | Scoring Value | Risk Characterization |
|---|---|---|---|
| Ⅰ | No risk or acceptable risk | (0,1] | Probability of risk is extremely low, or destructiveness is weak |
| Ⅱ | Low risk | (1,2] | Water use behavior should be regulated to prevent risks |
| Ⅲ | Middle risk | (2,3] | Risk may happen or have the potential to cause damage |
| Ⅳ | High risk | (3,4] | Risk happens easily and can cause great damage |
| Ⅴ | Very high risk | (4,5] | Risks happens frequently and causes damage that is not easy to recover from |
Table 4.
Classification standard of the river water environment risk assessment index.
| Criterion Layer | Index Layer | Unit | Scoring Value | Reference | ||||
|---|---|---|---|---|---|---|---|---|
| 0~1 | 1~2 | 2~3 | 3~4 | 4~5 | ||||
| Risk sources | Amount of fertilizer applied per unit of cultivated area | kg/ha | 0~250 | 250~450 | 450~650 | 650~850 | ≥850 | [40] |
| Livestock and poultry excretions | 104 t | 0~3.8 | 3.8~10.4 | 10.4~28.6 | 28.6~78.4 | ≥78.4 | W–F law | |
| Domestic sewage discharge in rural areas | 104 m3 | 0~22 | 22~53 | 53~126 | 126~301 | ≥301 | W–F law | |
| Human excrement and urine emissions in rural areas | 104 t | 0~1.4 | 1.4~3.3 | 3.3~7.9 | 7.9~18.7 | ≥18.7 | W–F law | |
| Industrial wastewater discharge per unit of GDP | t/(CNY 104) | 0~1 | 1~4 | 4~14 | 14~52 | ≥52 | W–F law | |
| Risk of the adjacent upstream reaches | Scoring value | 0~1 | 1~2 | 2~3 | 3~4 | 4~5 | [24] | |
| Distance to the adjacent upstream reaches * | km | ≥52 | 34~52 | 22~34 | 15~22 | 0~15 | W–F law | |
| River characteristics | Water quality | Ⅰ | Ⅱ | Ⅲ | Ⅳ | Others | Standard | |
| Rate of water quality above the standard in water function zoning | % | 100 | 80~100 | 60~80 | 40~60 | 0~40 | [40] | |
| Perennial average annual discharge | 108 m3 | ≥4.72 | 1.21~4.72 | 0.31~1.21 | 0.09~0.31 | 0~0.09 | W–F law | |
| Physical geography and social development conditions | Population | 104 person | 0~3.4 | 3.4~9.4 | 9.4~25.9 | 25.9~71.5 | ≥71.5 | W–F law |
| Natural population growth rate | ‰ | ≤−9.9 | −9.9~−3.1 | −3.1~3.8 | 3.8~10.6 | ≥10.6 | W–F law | |
| GDP per capita | CNY 103 | ≥50.4 | 30.7~50.4 | 18.7~30.7 | 11.4~18.7 | ≤11.4 | W–F law | |
| Distance between the pollution source and the Baiyangdian Lake | km | ≥268 | 77~268 | 22~77 | 3~22 | 0~3 | W–F law | |
| Water pollution control ability | Rate of industrial wastewater discharge up to standard | % | 100 | 95~100 | 90~95 | 80~90 | ≤80 | [40] |
| Rate of centralized treatment of urban domestic sewage | % | 100 | 95~100 | 90~95 | 85~90 | ≤85 | [40] | |
| Urban garbage collection rate | % | 100 | 95~100 | 90~95 | 85~90 | ≤85 | [40] | |
| Ratio of environmental investment to GDP | % | ≥3 | 2~3 | 1~2 | 0.5~1 | 0~0.5 | Standard | |
Table 5.
Data of environmental risk substances of industry categories.
| Serial Number | Type of Risk Source | Registered Size (CNY 104) | Environmental Risk Substance | Maximum Presence of Environmental Risk Substance (t) | Threshold Quantity of Environmental Risk Substance (t) | Q |
|---|---|---|---|---|---|---|
| 1 | Chemical raw materials and chemical products manufacturing | 1000 | Vitriol | 400 | 10 | 40 |
| 2 | Paper products industry | 600 | Vitriol | 0.3 | 10 | 0.03 |
| Oil substances | 0.18 | 2500 | 0.000072 | |||
| 3 | Textile industry | 1000 | Sodium hydrosulfite | 0.029 | 5 | 0.0058 |
| Acetic acid | 0.065 | 10 | 0.0065 | |||
| 4 | Sewage treatment plant | 8078 | Methyl alcohol | 5.329 | 10 | 0.5329 |
| 5 | Food manufacturing industry | 3000 | Ammonium hydroxide | 2.236 | 10 | 0.2236 |
| Methyl alcohol | 7.091 | 10 | 0.7091 | |||
| 6 | Metal products industry | 1000 | Oil substances | 110.32 | 2500 | 0.044128 |
| Ammonium hydroxide | 107 | 10 | 10.7 | |||
| Liquefied petroleum gas | 2 | 10 | 0.2 | |||
| Substances harmful to water environments (Chronic toxicity Category: Chronic 2) | 300 | 200 | 1.5 | |||
| Organic wastewater (concentration of CODcr ≥ 10000 mg/L) | 36 | 10 | 3.6 | |||
| 7 | Service industry | 25,417 | Oil substances | 0.484 | 2500 | 0.0001936 |
| Ethyl alcohol | 0.202 | 500 | 0.000404 | |||
| Hydrochloric acid | 0.605 | 7.5 | 0.081 | |||
| Sodium chlorate | 0.806 | 100 | 0.00806 | |||
| 8 | Leather, fur, and feather products as well as footwear | 2000 | Health hazards, acute toxic substances (Class 2, Class 3) | 6.25 | 50 | 0.125 |
| 9 | Petroleum, coal, and other fuel processing industries | 1500 | Oil substances | 14,600 | 2500 | 5.84 |
| 10 | Wine, beverage, and refined tea manufacturing | 1200 | Ammonium hydroxide | 1.037 | 10 | 0.1037 |
| Vitriol | 0.00216 | 10 | 0.000216 | |||
| 11 | Mining and washing of coal industry | 14,260 | Oil substances | 427.822 | 2500 | 0.171 |
| 12 | Special equipment manufacturing | 1488 | Additives | 1.674 | 50 | 0.033 |
| 13 | Manufacturing of railway, marine, aerospace, and other transportation equipment | 2000 | Oil substances | 1.304 | 2500 | 0.0005 |
| Flammable liquid | 0.953 | 50 | 0.019 | |||
| Acetone | 0.00048 | 10 | 0.000048 | |||
| Ethyl alcohol | 0.00048 | 500 | 0.00000096 | |||
| Hydrochloric acid | 0.000027 | 7.5 | 0.0000037 | |||
| 14 | Motor industry | 5000 | Oil substances | 6.45 | 2500 | 0.00258 |
| Methylbenzene | 0.375 | 10 | 0.0375 | |||
| Xylene | 4.375 | 10 | 0.4375 | |||
| Nickel nitrate | 0.625 | 0.25 | 2.5 | |||
| 15 | Manufacture of non-metallic mineral products | 1000 | Oil substances | 16.667 | 2500 | 0.00667 |
| 16 | Production and supply of electric power and heat power | 313972 | Oil substances | 156.986 | 2500 | 0.063 |
Table 6.
Water quality of the upstream rivers of the Baiyangdian Lake in March 2021.
| Name of River | Name of County or District | Water Quality |
|---|---|---|
| Fu River | Lianchi District | Ⅲ |
| Fu River | Qingyuan District | Ⅱ |
| Xiaoyi River | Quyang County | Ⅱ |
| Xiaoyi River | Dingzhou County | Ⅴ |
| Xiaoyi River | Anguo County | Ⅴ |
| Xiaoyi River | Boye County | Ⅴ |
| Xiaoyi River | Li County | Ⅳ |
| Xiaoyi River | Gaoyang County | Ⅳ |
| Tang River | Hunyuan County | Ⅲ |
| Tang River | Lingqiu County | Ⅱ |
| Tang River | Laiyuan County | Ⅱ |
| Tang River | Tang County | Ⅰ |
| Tang River | Dingzhou County | Ⅲ |
| Tang River | Wangdu County | Ⅲ |
| Tang River | Qingyuan District | Ⅲ |
| Tang River | Anxin County | Ⅲ |
| Bao River | Yi County | Worse than Ⅴ |
| Bao River | Xushui District | Ⅲ |
| Cao River | Yi County | Ⅲ |
| Cao River | Mancheng District | Ⅲ |
| Cao River | Xushui District | Ⅲ |
| Zhongyishui River | Yi County | Ⅱ |
| Nanyishui River | Dingxing County | Ⅱ |
| Baigou Canal | Rongcheng County | Worse than Ⅴ |
Publisher’s Note: MDPI stays neutral with regard to jurisdictional claims in published maps and institutional affiliations. |
© 2022 by the authors. Licensee MDPI, Basel, Switzerland. This article is an open access article distributed under the terms and conditions of the Creative Commons Attribution (CC BY) license (https://creativecommons.org/licenses/by/4.0/).
Share and Cite
MDPI and ACS Style
Guan, X.; Ren, X.; Tao, Y.; Chang, X.; Li, B. Study of the Water Environment Risk Assessment of the Upper Reaches of the Baiyangdian Lake, China. Water 2022, 14, 2557. https://doi.org/10.3390/w14162557
AMA Style
Guan X, Ren X, Tao Y, Chang X, Li B. Study of the Water Environment Risk Assessment of the Upper Reaches of the Baiyangdian Lake, China. Water. 2022; 14(16):2557. https://doi.org/10.3390/w14162557
Chicago/Turabian StyleGuan, Xiaoyan, Xiaoqiang Ren, Yuan Tao, Xiaomin Chang, and Bing Li. 2022. "Study of the Water Environment Risk Assessment of the Upper Reaches of the Baiyangdian Lake, China" Water 14, no. 16: 2557. https://doi.org/10.3390/w14162557
Note that from the first issue of 2016, this journal uses article numbers instead of page numbers. See further details here.