
Variability in Minimal-Damage Sap Flow Observations and Whole-Tree Transpiration Estimates in a Coniferous Forest

Abstract
:1. Introduction
2. Materials and Methods
2.1. Site Description
2.2. Meteorology and Soil Moisture Measurements
2.3. Heat Ratio Method and Probe Installation
2.4. Sapwood Area Estimation
2.5. Sap Flow and Canopy Transpiration Evaluation
2.6. Sap Flux Variability and “Truing” Value Definition
3. Results
3.1. Sapwood Area (As)
3.2. Daily Sap Flux Characteristics during Two Growing Seasons
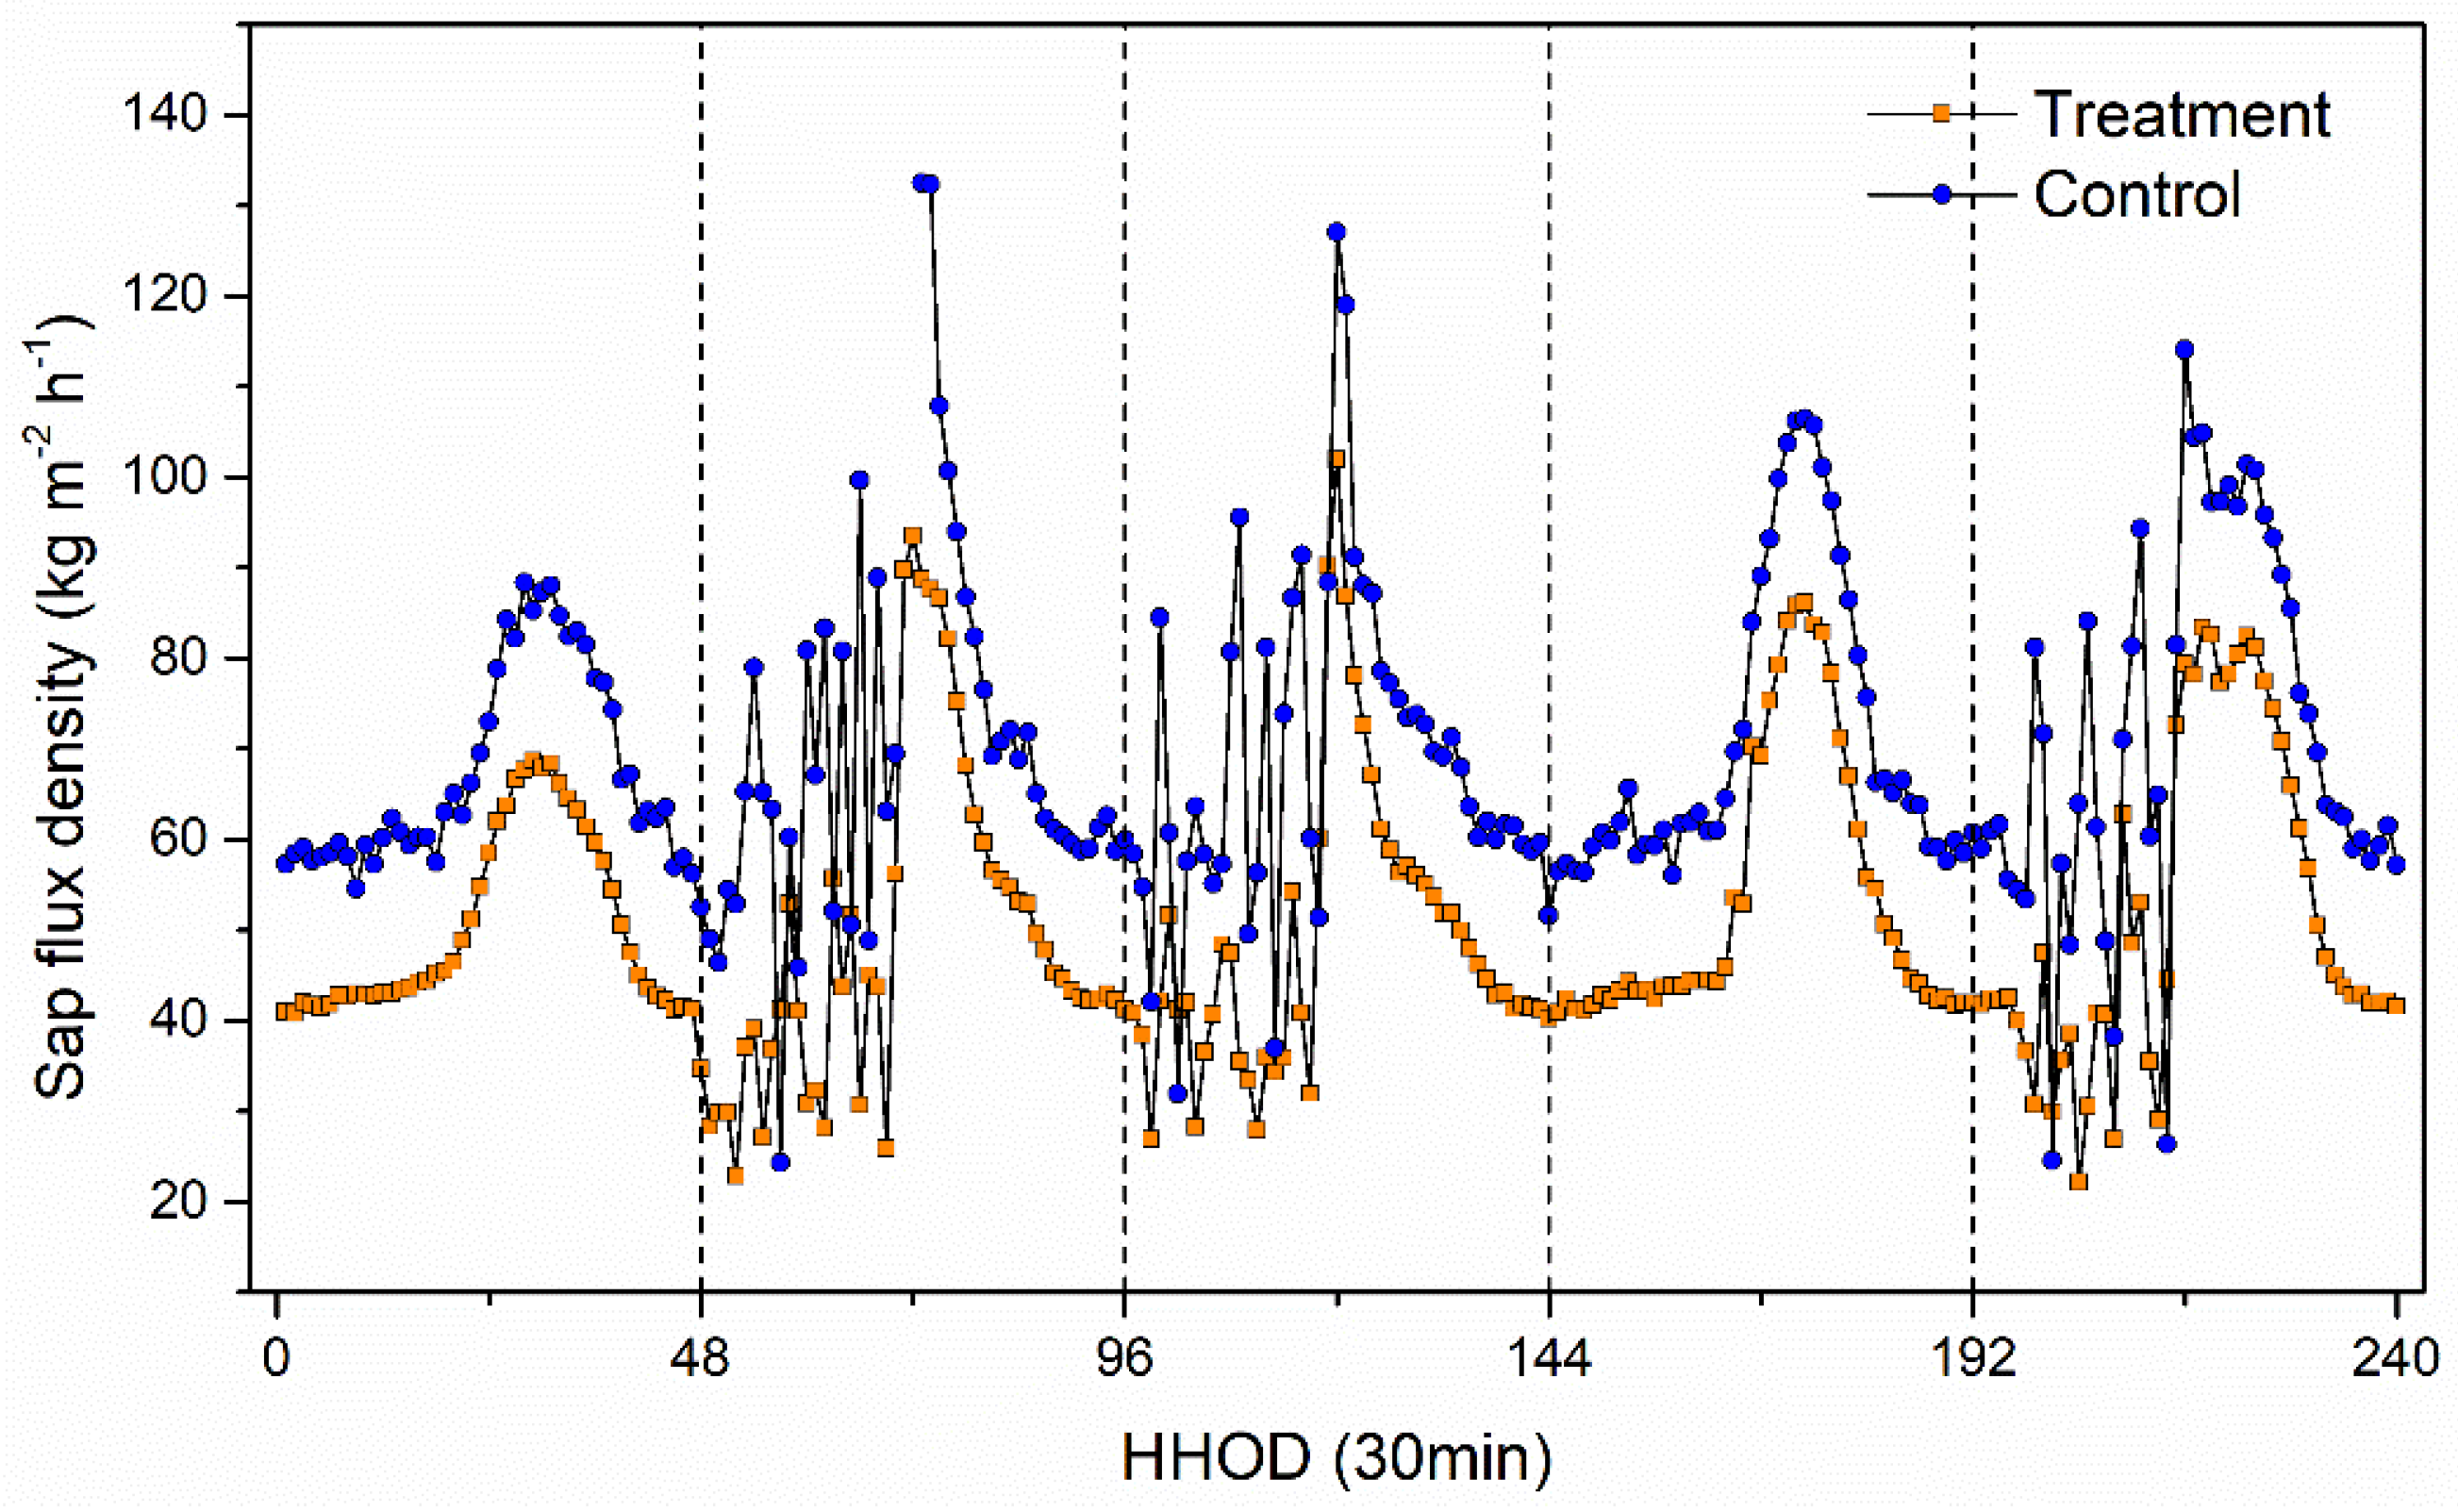
3.3. Diurnal Response Time of the Sap Flux Process
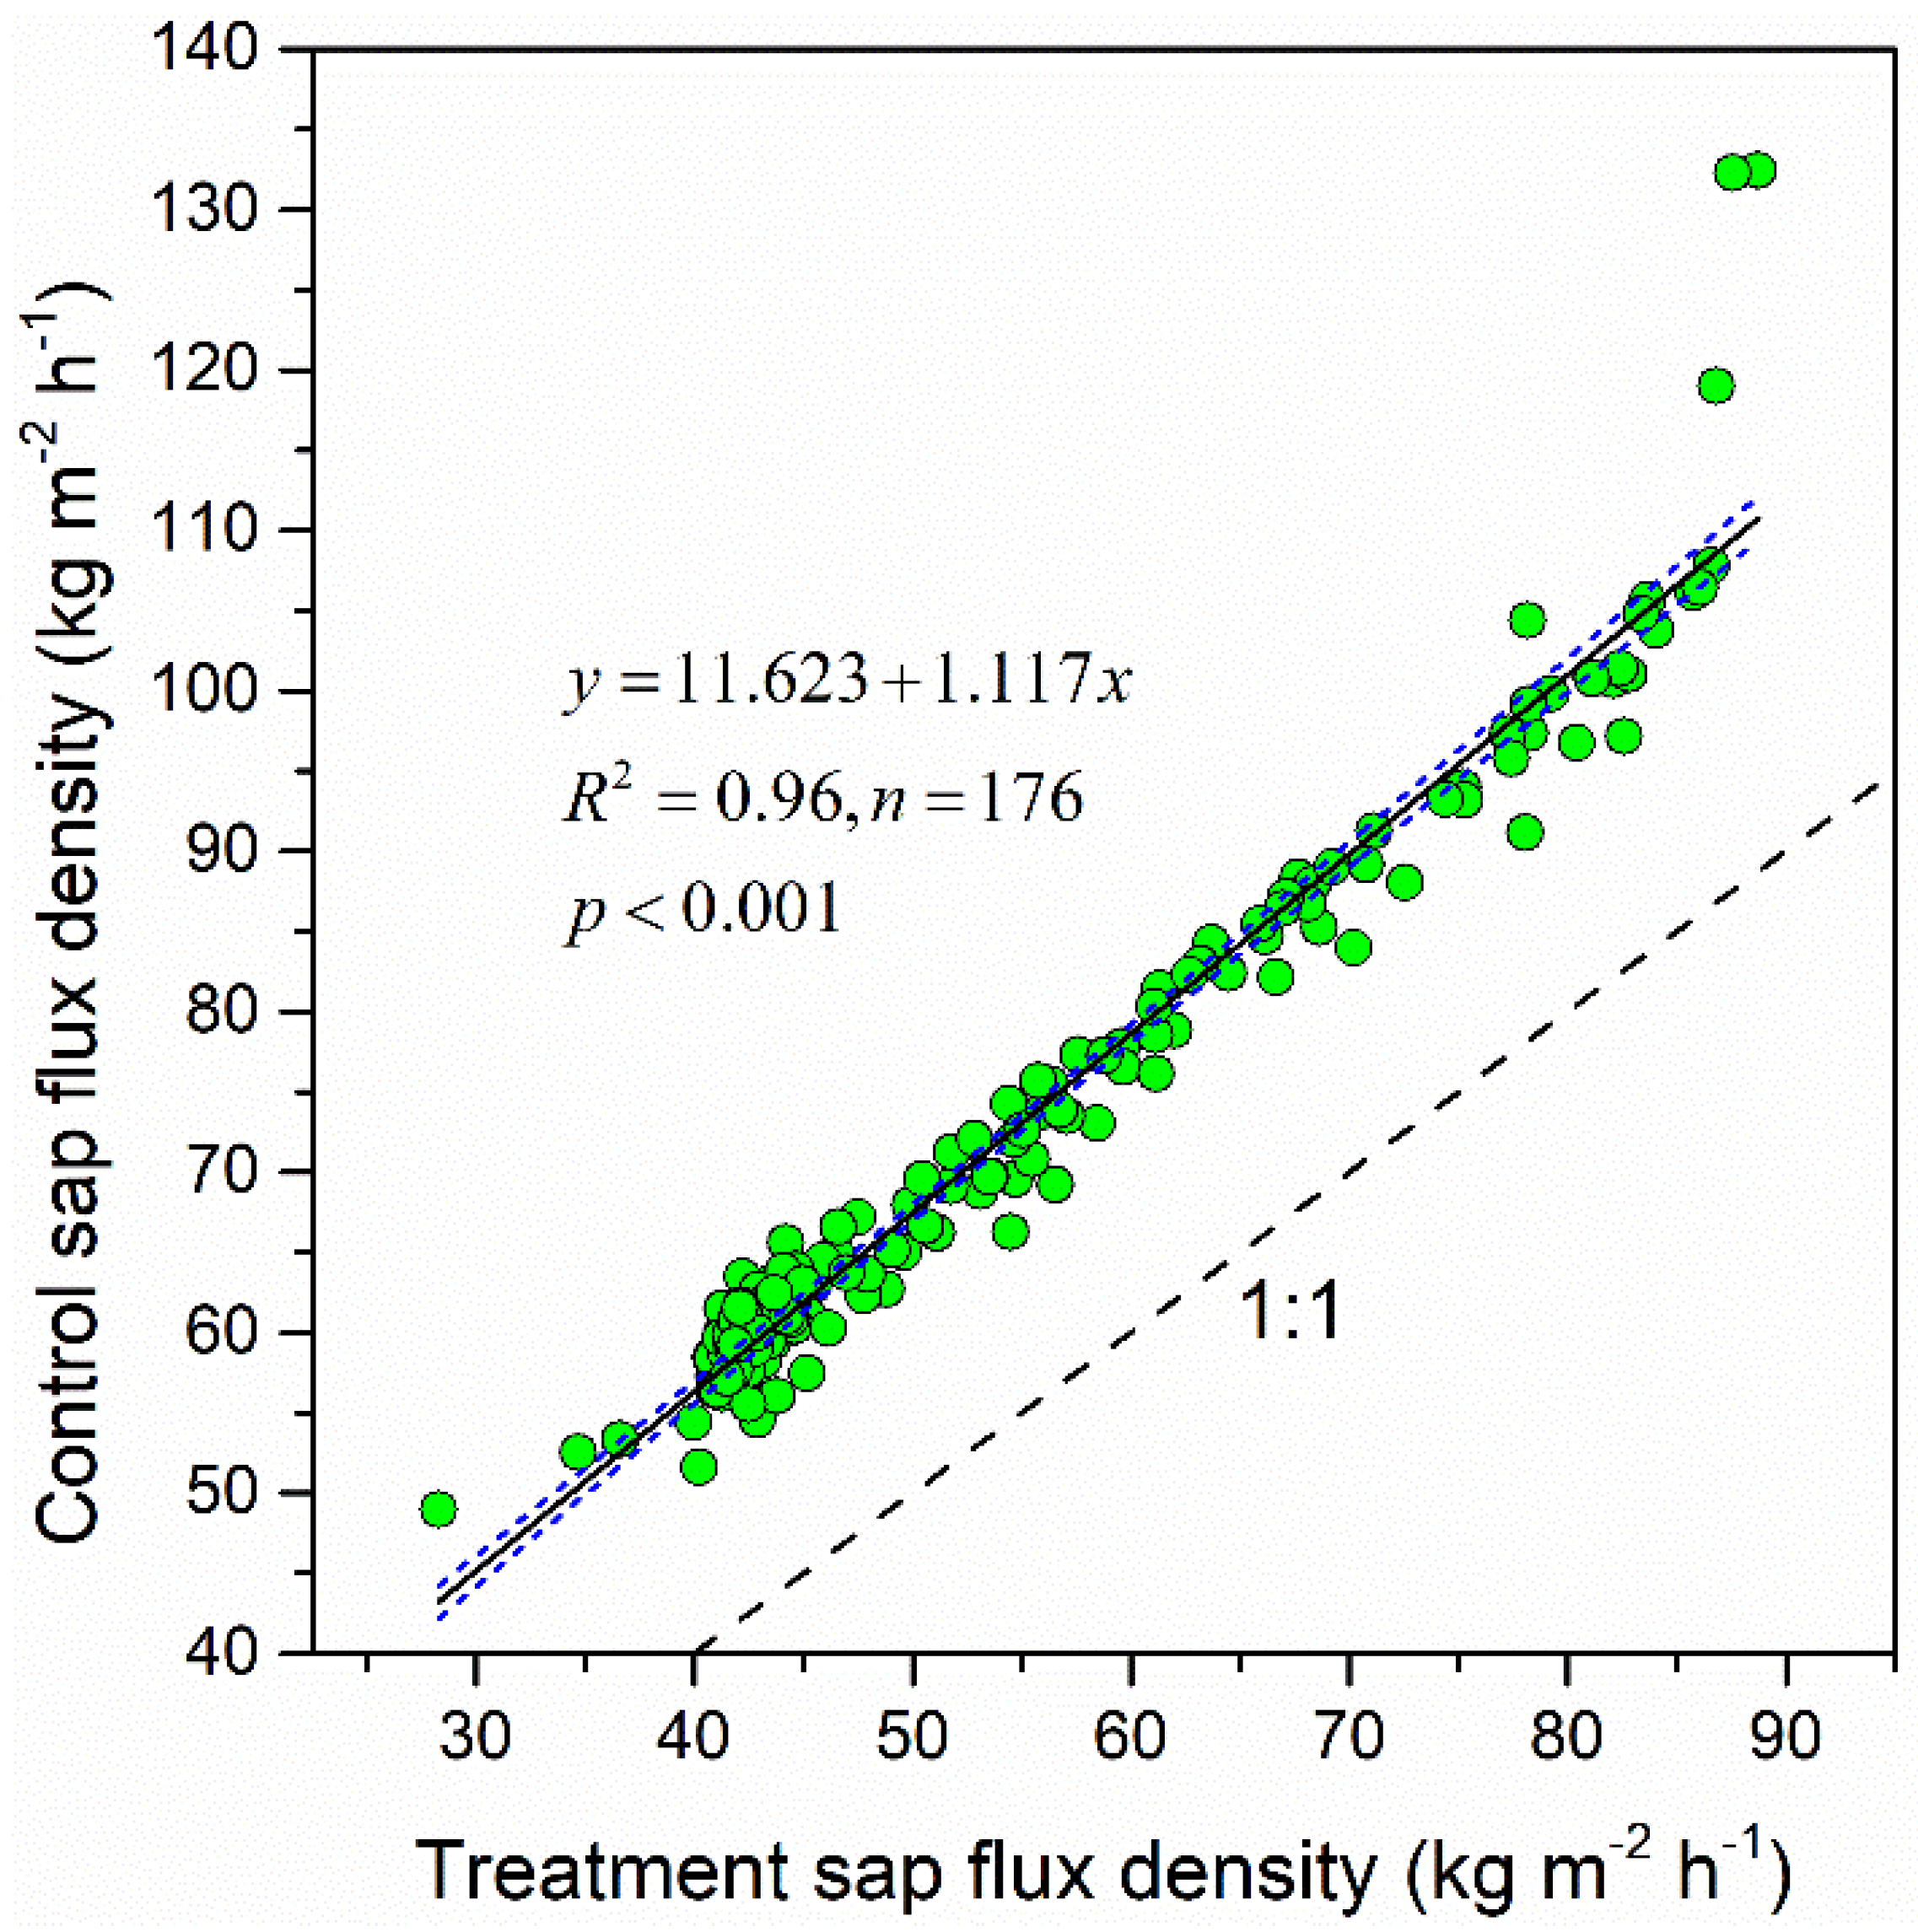
3.4. Sap Flux Analysis and Simulation Evaluation
4. Discussion
4.1. Influence of DBH Sampling on the Sapwood Area Estimation
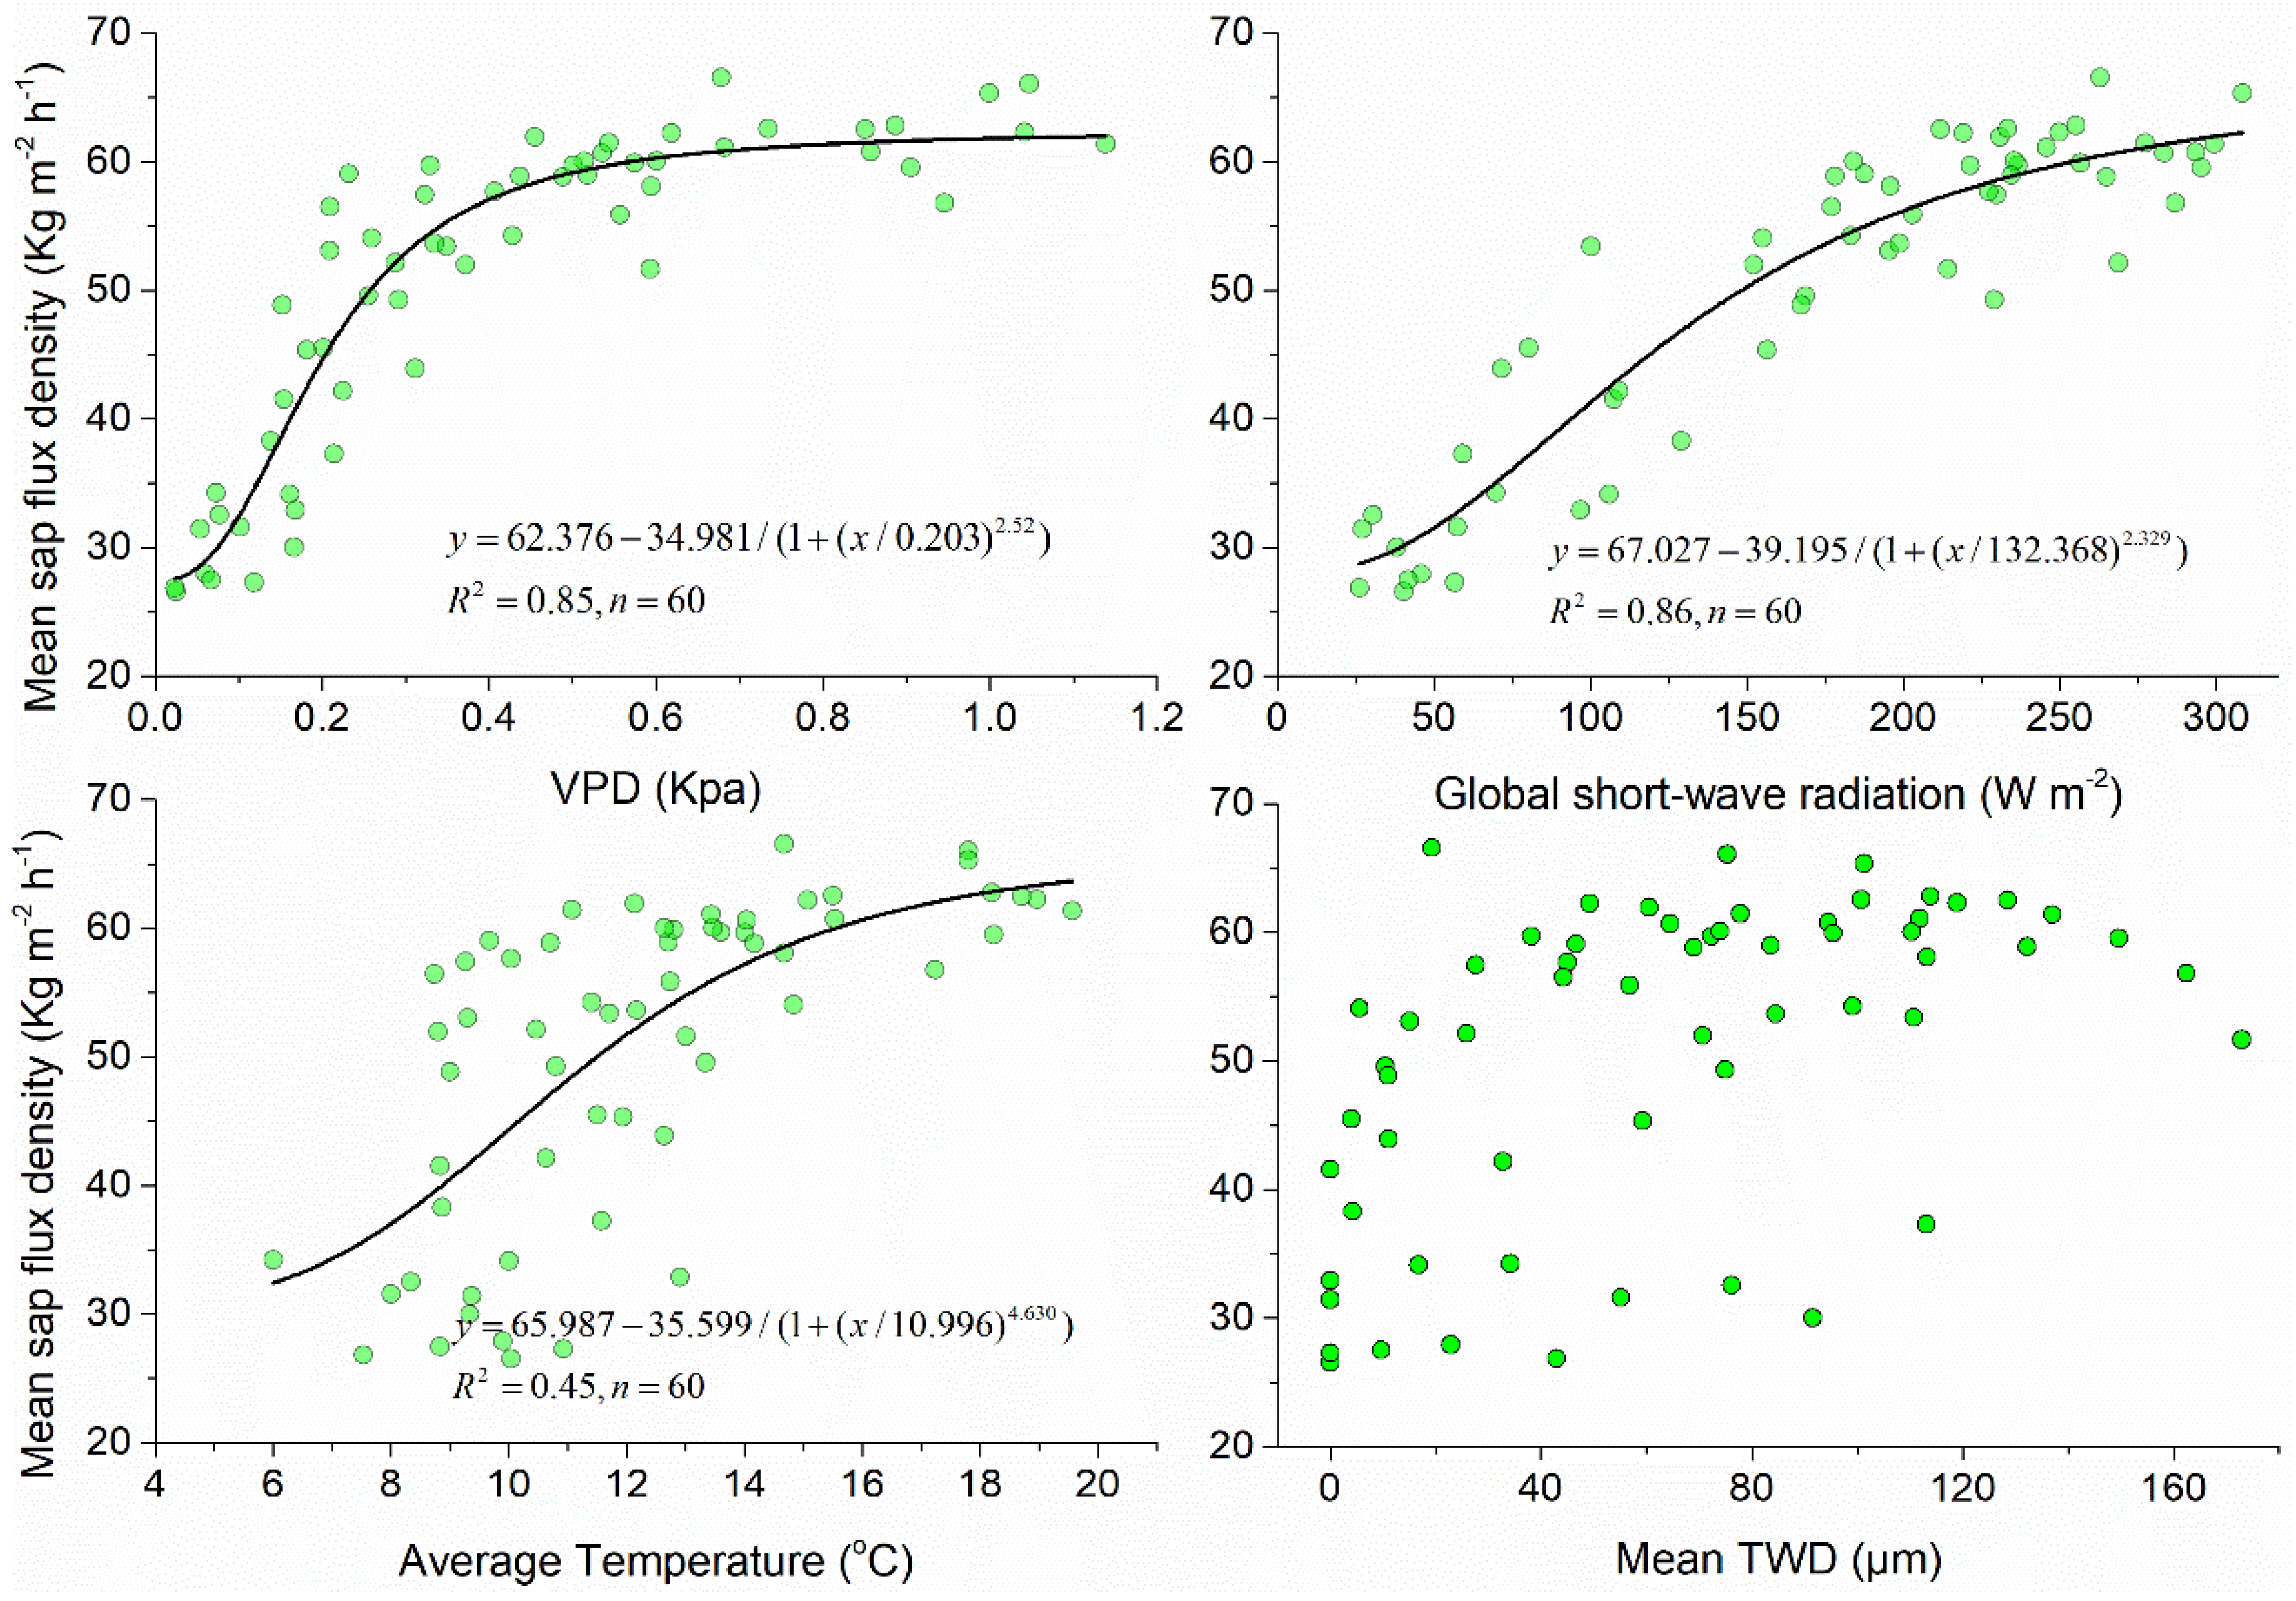
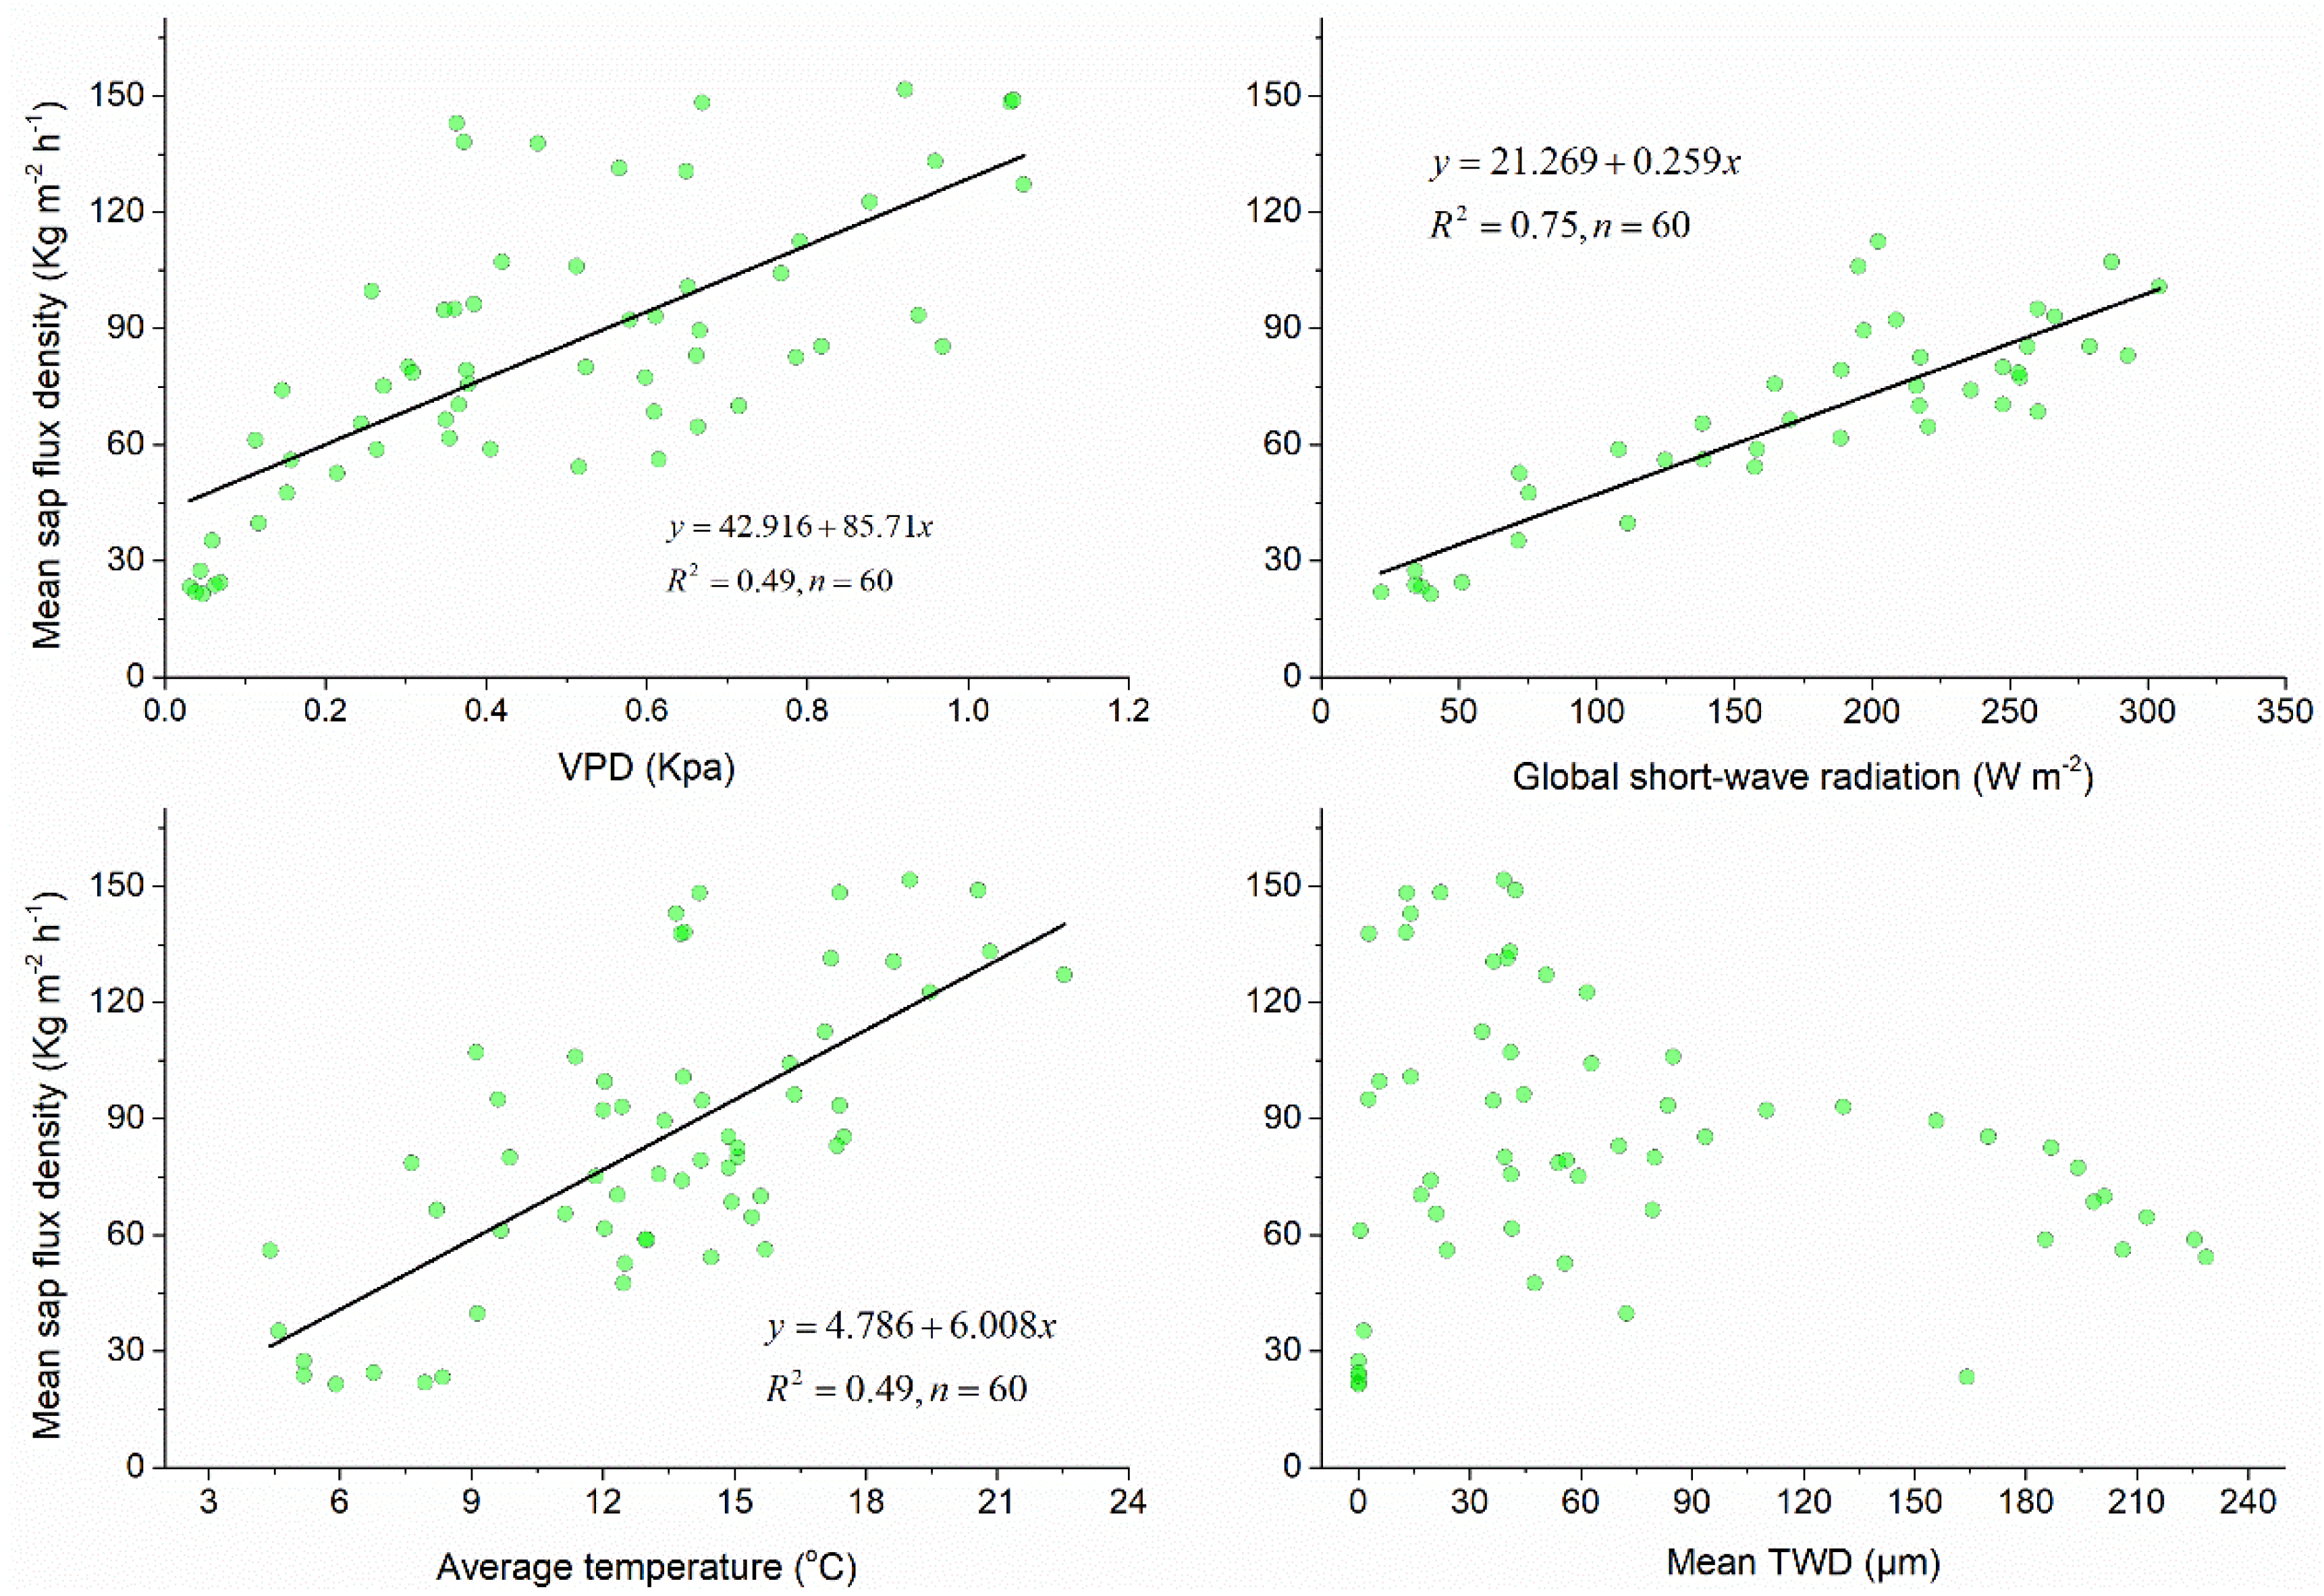
4.2. Relationships between Environmental Factors and Sap Flux Density at Various Time Scales
4.3. Sap Flow Evaluation and Estimation
5. Conclusions
Author Contributions
Funding
Institutional Review Board Statement
Informed Consent Statement
Data Availability Statement
Acknowledgments
Conflicts of Interest
References
- Jasechko, S.; Sharp, Z.D.; Gibson, J.J.; Birks, S.J.; Yi, Y.; Fawcett, P.J. Terrestrial water fluxes dominated by transpiration. Nature 2013, 496, 347–350. [Google Scholar] [CrossRef]
- Schlaepfer, D.R.; Ewers, B.E.; Shuman, B.N.; Williams, D.G.; Frank, J.M.; Massman, W.J.; Lauenroth, W.K. Terrestrial water fluxes dominated by transpiration: Comment. Ecosphere 2014, 5, 1–9. [Google Scholar] [CrossRef]
- Miralles, D.G.; De Jeu, R.A.M.; Gash, J.H.; Holmes, T.R.H.; Dolman, A.J. Magnitude and variability of land evaporation and its components at the global scale. Hydrol. Earth Syst. Sci. 2011, 15, 967–981. [Google Scholar] [CrossRef]
- Merlin, M.; Solarik, K.A.; Landhäusser, S.M. Quantification of uncertainties introduced by data-processing procedures of sap flow measurements using the cut-tree method on a large mature tree. Agric. For. Meteorol. 2020, 287, 107926. [Google Scholar] [CrossRef]
- Wullschleger, S.D.; Meinzer, F.C.; Vertessy, R.A. A review of whole-plant water use studies in trees. Tree Physiol. 1998, 18, 499–512. [Google Scholar] [CrossRef]
- Saugier, B.; Granier, A.; Pontailler, J.Y.; Dufrene, E.; Baldocchi, D.D. Transpiration of a boreal pine forest measured by branch bag, sap flow and micrometeorological methods. Tree Physiol. 1997, 17, 511–519. [Google Scholar] [CrossRef]
- Koecher, P.; Gebauer, T.; Horna, V.; Leuschner, C. Leaf water status and stem xylem flux in relation to soil drought in five temperate broad-leaved tree species with contrasting water use strategies. Ann. For. Sci. 2009, 66, 1. [Google Scholar] [CrossRef]
- Ungar, E.D.; Rotenberg, E.; Raz-Yaseef, N.; Cohen, S.; Yakir, D.; Schiller, G. Transpiration and annual water balance of Aleppo pine in a semiarid region: Implications for forest management. For. Ecol. Manag. 2013, 298, 39–51. [Google Scholar] [CrossRef]
- Marshall, D.C. Measurement of sap flow in conifers by heat transport. Plant Physiol. 1958, 33, 385–396. [Google Scholar] [CrossRef]
- McNaughton, K.G.; Black, T.A. Study of evapotranspiration from a douglas-fir forest using energy-balance approach. Water Resour. Res. 1973, 9, 1579–1590. [Google Scholar] [CrossRef]
- Edwards, W.R.N.; Warwick, N.W.M. Transpiration from a kiwifruit vine as estimated by the heat pulse technique and the Penman-Monteith equation. N. Z. J. Agric. Res. 1984, 27, 537–543. [Google Scholar] [CrossRef]
- Barrett, D.J.; Hatton, T.J.; Ash, J.E.; Ball, M.C. Evaluation of the heat pulse velocity technique for measurement of sap flow in rain-forest and eucalypt forest species of south-eastern australia. Plant Cell Environ. 1995, 18, 463–469. [Google Scholar] [CrossRef]
- Burgess, S.S.O.; Adams, M.A.; Turner, N.C.; Beverly, C.R.; Ong, C.K.; Khan, A.A.H.; Bleby, T.M. An improved heat pulse method to measure low and reverse rates of sap flow in woody plants. Tree Physiol. 2001, 21, 589–598. [Google Scholar] [CrossRef]
- Green, S.; Clothier, B.; Jardine, B. Theory and practical application of heat pulse to measure sap flow. Agron. J. 2003, 95, 1371–1379. [Google Scholar] [CrossRef]
- Burgess, S.S.O.; Downy, A. SFM1 Sap Flow Meter Manual; ICT Internal Pty Ltd.: Armidale, NSW, Australia, 2018. [Google Scholar]
- Wu, F.; Zhan, J.; Chen, J.; He, C.; Zhang, Q. Water Yield Variation due to Forestry Change in the Head-Water Area of Heihe River Basin, Northwest China. Adv. Meteorol. 2015, 2015, 786764. [Google Scholar] [CrossRef]
- Chang, X.X.; Zhao, W.Z.; He, Z.B. Radial pattern of sap flow and response to microclimate and soil moisture in Qinghai spruce (Picea crassifolia) in the upper Heihe River Basin of arid northwestern China. Agric. For. Meteorol. 2014, 187, 14–21. [Google Scholar] [CrossRef]
- Chang, X.X.; Zhao, W.Z.; Liu, H.; Wei, X.; Liu, B.; He, Z.B. Qinghai spruce (Picea crassifolia) forest transpiration and canopy conductance in the upper Heihe River Basin of arid northwestern China. Agric. For. Meteorol. 2014, 198, 209–220. [Google Scholar] [CrossRef]
- Van de Wal, B.A.E.; Guyot, A.; Lovelock, C.E.; Lockington, D.A.; Steppe, K. Influence of temporospatial variation in sap flux density on estimates of whole-tree water use in Avicennia marina. Trees-Struct. Funct. 2015, 29, 215–222. [Google Scholar] [CrossRef]
- Kutscha, N.P.; Sachs, I.B. Color Tests for Differentiating Heartwood and Sapwood in Certatin Softwood Tree Species. In USDA Forest Service; Report 2246; Forest Products Laboratory, Forest Service U.S. Department of Agriculture: Madison, WI, USA, 1962; pp. 11–12. [Google Scholar]
- Becker, P.; Edwards, W.R.N. Corrected heat capacity of wood for sap flow calculations. Tree Physiol. 1999, 19, 767–768. [Google Scholar] [CrossRef]
- Lide, D.R. Handbook of Chemistry and Physics, 73rd ed.; CRC Press Inc.: Boca Raton, FL, USA, 1992; pp. 6–10. [Google Scholar]
- Hassler, S.K.; Weiler, M.; Blume, T. Tree-, stand- and site-specific controls on landscape-scale patterns of transpiration. Hydrol. Earth Syst. Sci. 2018, 22, 13–30. [Google Scholar] [CrossRef]
- Bodo, A.V.; Arain, M.A. Radial variations in xylem sap flux in a temperate red pine plantation forest. Ecol. Process. 2021, 10, 24. [Google Scholar] [CrossRef] [PubMed]
- Looker, N.; Martin, J.; Jencso, K.; Hu, J. Contribution of sapwood traits to uncertainty in conifer sap flow as estimated with the heat-ratio method. Agric. For. Meteorol. 2016, 223, 60–71. [Google Scholar] [CrossRef]
- Ford, C.R.; McGuire, M.A.; Mitchell, R.J.; Teskey, R.O. Assessing variation in the radial profile of sap flux density in Pinus species and its effect on daily water use. Tree Physiol. 2004, 24, 241–249. [Google Scholar] [CrossRef]
- Chen, Z.; Zhang, Z.; Sun, G.; Chen, L.; Xu, H.; Chen, S. Biophysical controls on nocturnal sap flow in plantation forests in a semi-arid region of northern China. Agric. For. Meteorol. 2020, 284, 107904. [Google Scholar] [CrossRef]
- Klein, T.; Zeppel, M.J.B.; Anderegg, W.R.L.; Bloemen, J.; De Kauwe, M.G.; Hudson, P.; Ruehr, N.K.; Powell, T.L.; von Arx, G.; Nardini, A. Xylem embolism refilling and resilience against drought-induced mortality in woody plants: Processes and trade-offs. Ecol. Res. 2018, 33, 839–855. [Google Scholar] [CrossRef]
- Steppe, K.; De Pauw, D.J.W.; Doody, T.M.; Teskey, R.O. A comparison of sap flux density using thermal dissipation, heat pulse velocity and heat field deformation methods. Agric. For. Meteorol. 2010, 150, 1046–1056. [Google Scholar] [CrossRef]
- Tian, Q.; He, Z.; Xiao, S.; Peng, X.; Ding, A.; Lin, P. Response of stem radial growth of Qinghai spruce (Picea crassifolia) to environmental factors in the Qilian Mountains of China. Dendrochronologia 2017, 44, 76–83. [Google Scholar] [CrossRef]
- Ma, C.; Luo, Y.; Shao, M.; Li, X.; Sun, L.; Jia, X. Environmental controls on sap flow in black locust forest in Loess Plateau, China. Sci. Rep. 2017, 7, 13160. [Google Scholar] [CrossRef]
- Kumagai, T.; Nagasawa, H.; Mabuchi, T.; Ohsaki, S.; Kubota, K.; Kogi, K.; Utsumi, Y.; Koga, S.; Otsuki, K. Sources of error in estimating stand transpiration using allometric relationships between stem diameter and sapwood area for Cryptomeria japonica and Chamaecyparis obtusa. For. Ecol. Manag. 2005, 206, 191–195. [Google Scholar] [CrossRef]
- Bush, S.E.; Hultine, K.R.; Sperry, J.S.; Ehleringer, J.R. Calibration of thermal dissipation sap flow probes for ring- and diffuse-porous trees. Tree Physiol. 2010, 30, 1545–1554. [Google Scholar] [CrossRef]
- Shinohara, Y.; Tsuruta, K.; Ogura, A.; Noto, F.; Komatsu, H.; Otsuki, K.; Maruyama, T. Azimuthal and radial variations in sap flux density and effects on stand-scale transpiration estimates in a Japanese cedar forest. Tree Physiol. 2013, 33, 550–558. [Google Scholar] [CrossRef] [PubMed]


| No. | Groups of DBH | Height of Tree (m) | Crown Width (m) | Diameter at Breast Height (cm) | Depth of Bar (cm) | Sapwood Width (cm) | Sapwood Area (cm2) | Canopy’s Projected Area (m2) |
|---|---|---|---|---|---|---|---|---|
| #1 | DBH1 | 16.1 | 4.24 | 22.2 | 0.6 | 3.75 | 203.27 | 14.07 |
| #2 | DBH2 | 14.2 | 4.29 | 16.0 | 0.6 | 3.21 | 116.95 | 14.16 |
| #3 | DBH2 | 13.1 | 3.38 | 15.5 | 0.6 | 3.17 | 110.91 | 10.35 |
| #4 | DBH2 | 11.0 | 2.68 | 11.4 | 0.6 | 2.86 | 66.00 | 8.13 |
| #5 | DBH3 | 5.5 | 2.01 | 6.2 | 0.3 | 2.05 | 22.86 | 6.34 |
| #6 | DBH3 | 5.3 | 1.60 | 5.0 | 0.3 | 1.45 | 13.44 | 5.50 |
| #7 | DBH3 | 4.2 | 2.26 | 5.1 | 0.3 | 1.50 | 14.14 | 6.91 |
| #8 | DBH4 | 3.8 | 2.11 | 4.1 | 0.3 | 1.00 | 7.85 | 6.55 |
| Treatment Group | Control Group | Objective | |
|---|---|---|---|
| Phase 1 | 13–17 July 2015 | 18–22 July 2015 | Physiological comparison daytime |
| Phase 2 | 18 July–15 September 2014 | 18 July–15 September 2015 | Driving factors analysis |
| Phase 3 | 1–5 August 2015 | 1–5 August 2015 | Sap flow quantification |
| Variable | Evaluation Indexes | VPD | Soil Water Content | Average Temperature | Global Short-Wave Radiation | Mean TWD |
|---|---|---|---|---|---|---|
| Daily sap flux density in 2014 | Correlation coefficient | 0.900 ** | −0.081 | 0.738 ** | 0.769 ** | 0.557 ** |
| Sig. | 0.000 | 0.538 | 0.000 | 0.000 | 0.000 | |
| Daily canopy transpiration in 2014 | Correlation coefficient | 0.896 ** | −0.075 | 0.742 ** | 0.778 ** | 0.543 ** |
| Sig. | 0.000 | 0.571 | 0.000 | 0.000 | 0.000 | |
| Daily sap flux density in 2015 | Pearson correlation | 0.706 ** | 0.037 | 0.704 ** | 0.870 ** | −0.181 |
| Sig. | 0.000 | 0.779 | 0.000 | 0.000 | 0.165 | |
| Daily canopy transpiration in 2015 | Pearson correlation | 0.696 ** | 0.089 | 0.662 ** | 0.885 ** | −0.179 |
| Sig. | 0.000 | 0.498 | 0.000 | 0.000 | 0.170 |
| DOY | Date | Precipitation (mm) | VPD (Kpa) | Average Temperature (°C) | Global Short-Wave Radiation (W m−2) |
|---|---|---|---|---|---|
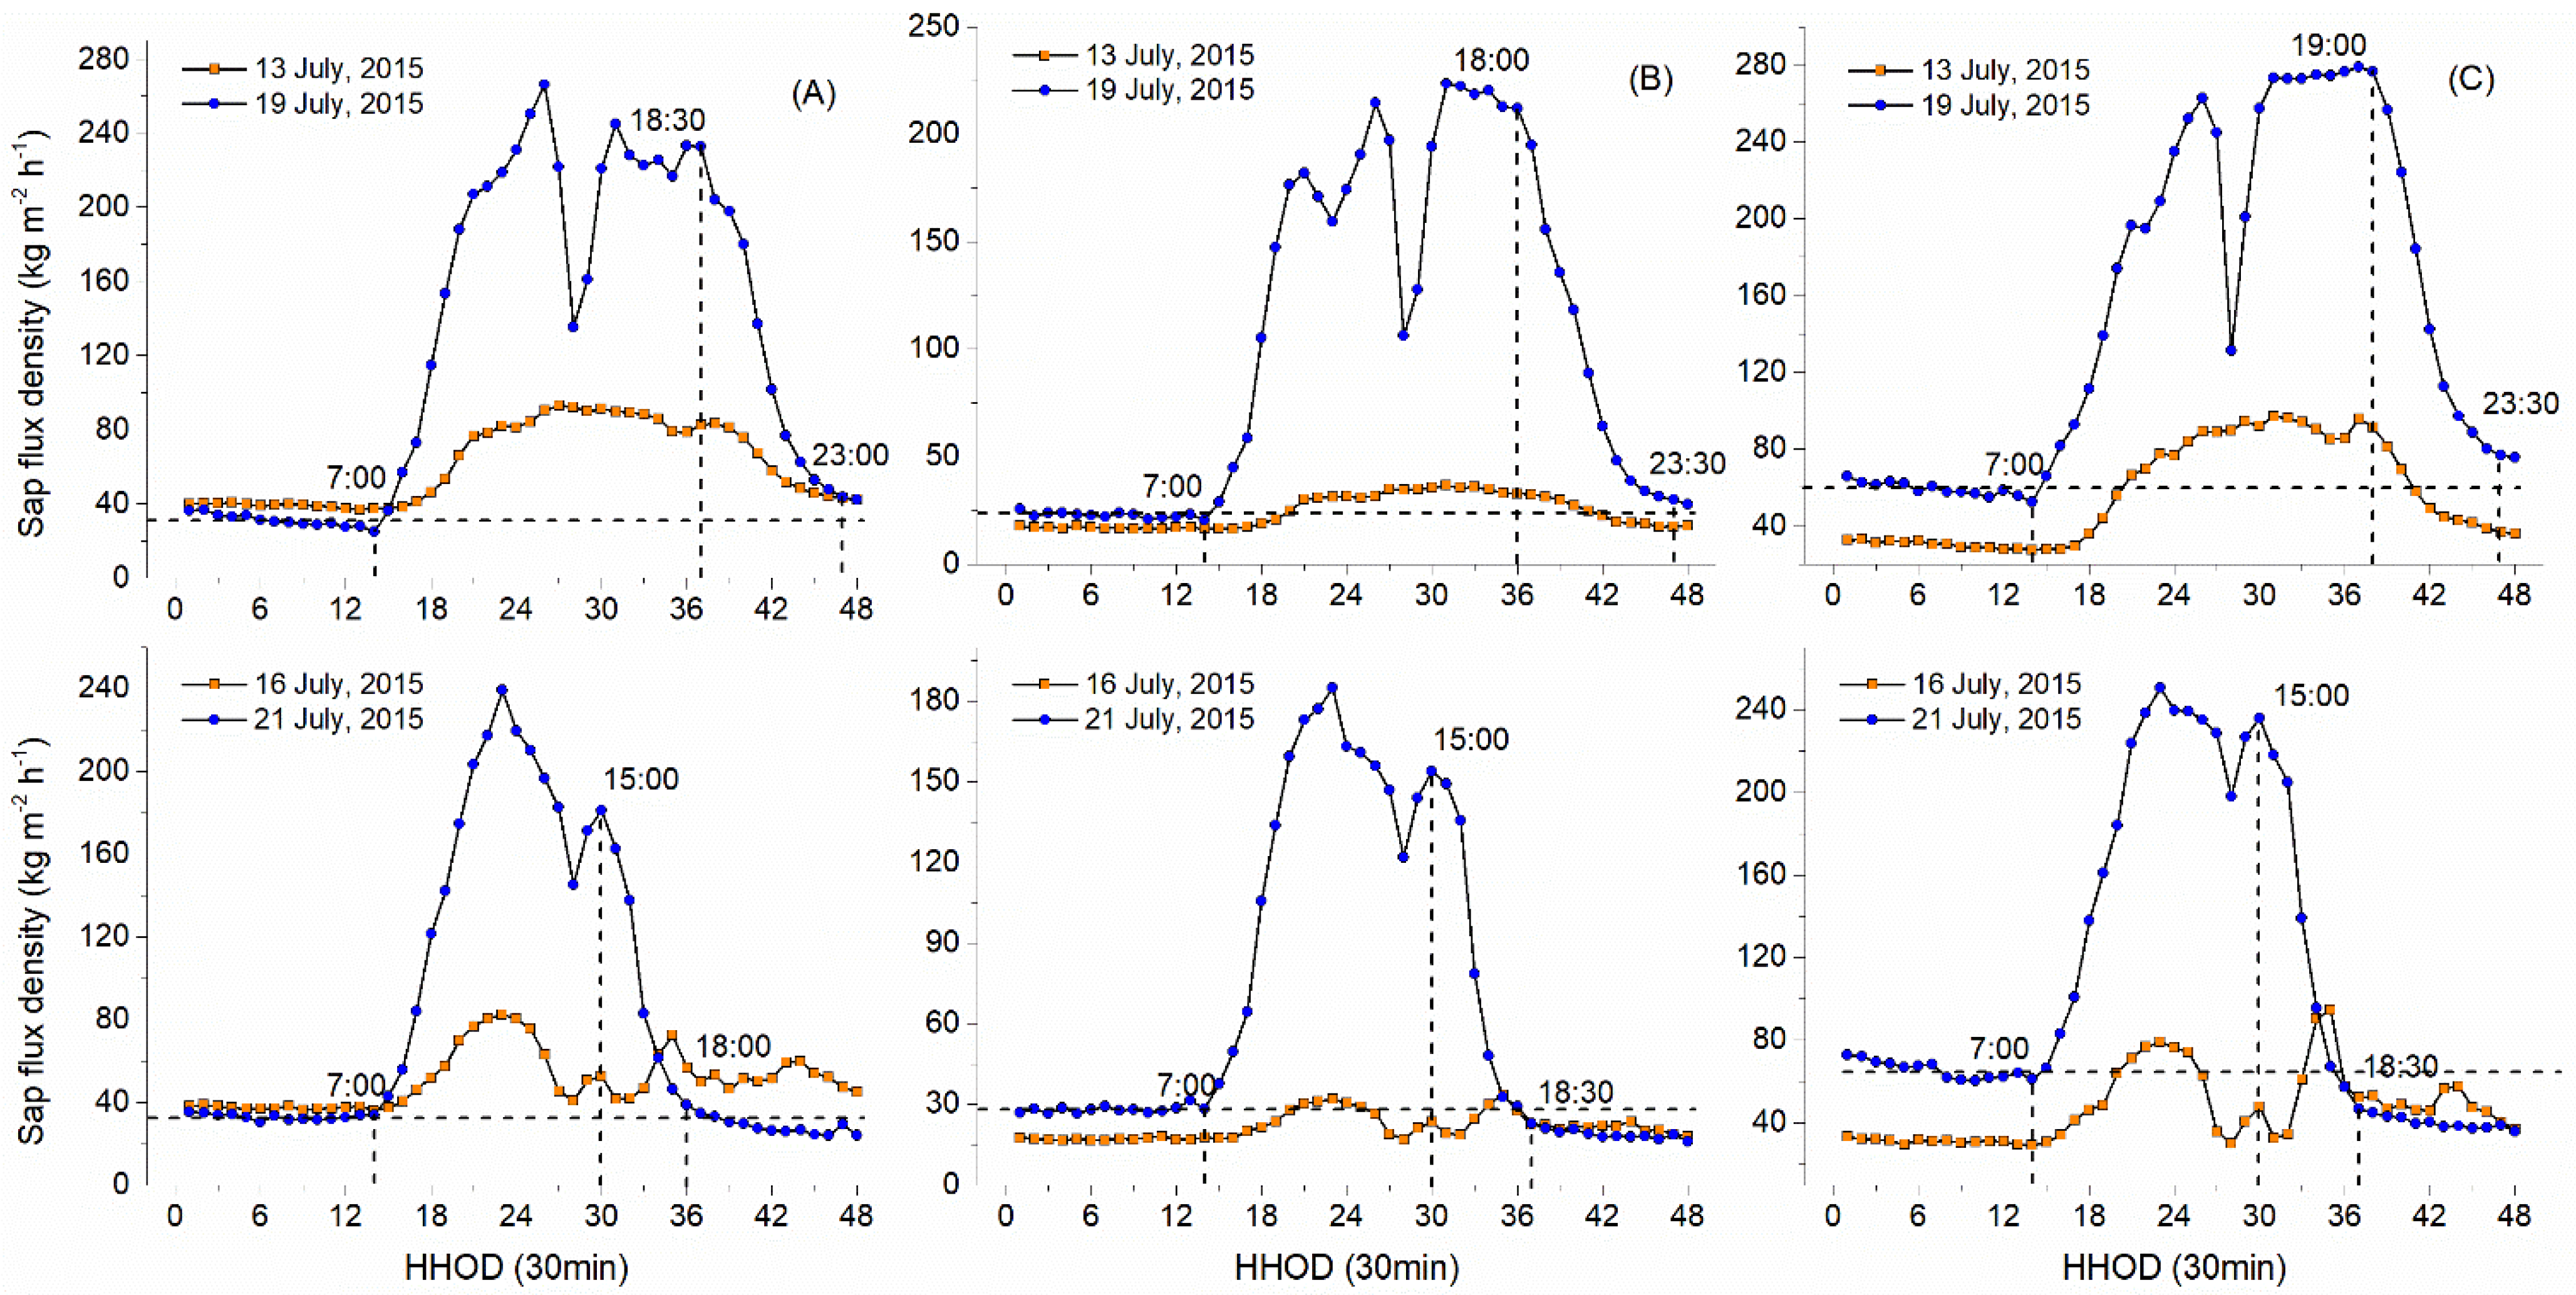
| 194 | 13 July 2015 | 0 | 0.37 | 12.4 | 318.8 |
| 200 | 19 July 2015 | 0 | 0.36 | 13.7 | 326.6 |
| 197 | 16 July 2015 | 4.5 | 0.24 | 10.0 | 316.3 |
| 202 | 21 July 2015 | 5.0 | 0.26 | 12.0 | 308.4 |
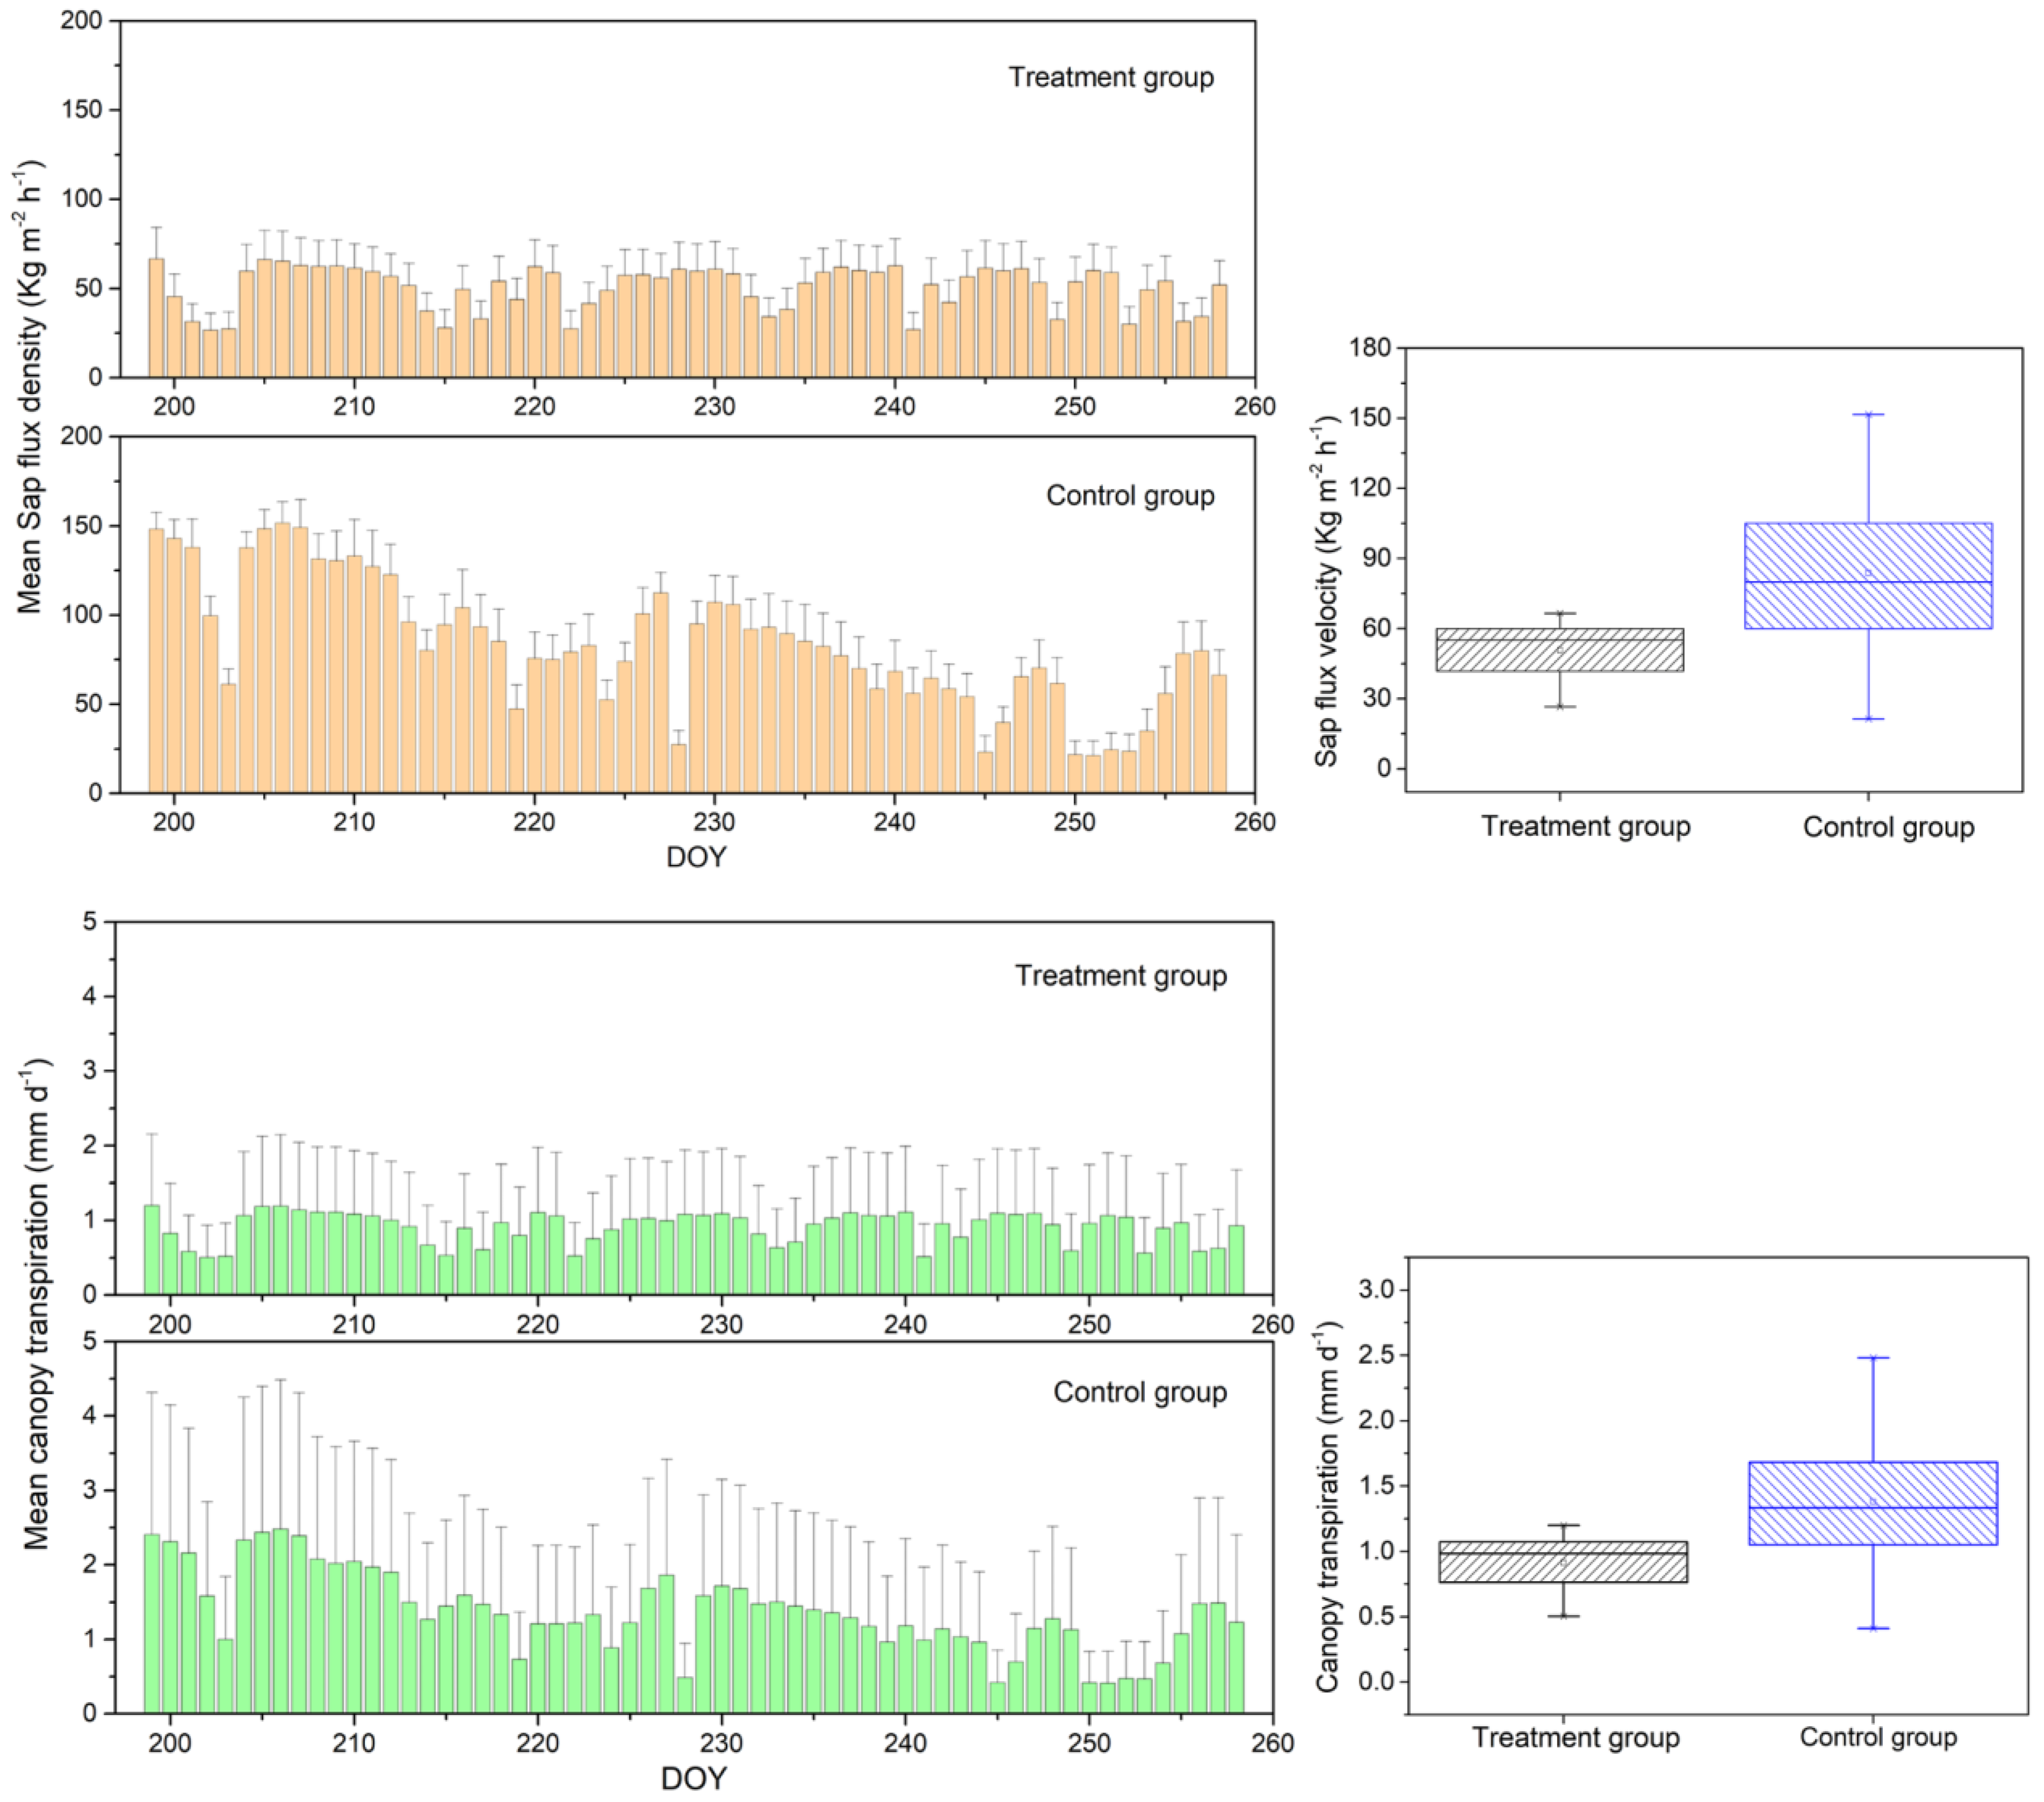
| Variable | Mean Sap Flux Density (kg m−2 h−1) | Mean Canopy Transpiration (mm d−1) |
|---|---|---|
| Treatment group | 50.80 ± 12.24 | 0.44 ± 0.01 |
| Control group | 69.82 ± 35.70 | 0.60 ± 0.55 |
| Difference | 37.5% | 36.8% |
Publisher’s Note: MDPI stays neutral with regard to jurisdictional claims in published maps and institutional affiliations. |
© 2022 by the authors. Licensee MDPI, Basel, Switzerland. This article is an open access article distributed under the terms and conditions of the Creative Commons Attribution (CC BY) license (https://creativecommons.org/licenses/by/4.0/).
Share and Cite
Yang, J.; He, Z.; Lin, P.; Du, J.; Tian, Q.; Feng, J.; Liu, Y.; Guo, L.; Wang, G.; Yan, J.; et al. Variability in Minimal-Damage Sap Flow Observations and Whole-Tree Transpiration Estimates in a Coniferous Forest. Water 2022, 14, 2551. https://doi.org/10.3390/w14162551
Yang J, He Z, Lin P, Du J, Tian Q, Feng J, Liu Y, Guo L, Wang G, Yan J, et al. Variability in Minimal-Damage Sap Flow Observations and Whole-Tree Transpiration Estimates in a Coniferous Forest. Water. 2022; 14(16):2551. https://doi.org/10.3390/w14162551
Chicago/Turabian StyleYang, Junjun, Zhibin He, Pengfei Lin, Jun Du, Quanyan Tian, Jianmin Feng, Yufeng Liu, Lingxia Guo, Guohua Wang, Jialiang Yan, and et al. 2022. "Variability in Minimal-Damage Sap Flow Observations and Whole-Tree Transpiration Estimates in a Coniferous Forest" Water 14, no. 16: 2551. https://doi.org/10.3390/w14162551