Article

Deciphering the Composition of Fulvic Acids from Recirculating Aquaculture Systems by Quadrupole Time-of-Flight Mass Spectrometry

by
Patricia Aguilar-Alarcón
*,
Susana V. Gonzalez
,
Alexandros G. Asimakopoulos
and
Øyvind Mikkelsen
Department of Chemistry, Norwegian University of Science and Technology (NTNU), Høgskoleringen 1, 7491 Trondheim, Norway
*
Author to whom correspondence should be addressed.
Water 2022, 14(16), 2549; https://doi.org/10.3390/w14162549
Submission received: 22 June 2022 / Revised: 4 August 2022 / Accepted: 10 August 2022 / Published: 19 August 2022
(This article belongs to the Section Water Quality and Contamination)

Abstract

:
The constant reuse of waters in recirculating aquaculture systems (RAS) together with the continuous addition of organic matter from fish degradation components, faeces and non-consumed feed promote the accumulation of dissolved organic matter (DOM), particularly of fulvic acids (FA), leading to the yellow discoloration of their waters. The accumulation of these acids in RAS can have potential effects on its water quality, and consequently fish health and welfare. Thus, the characterization of FA is paramount for improving water quality, and subsequently fish productivity in RAS. In this study, a non-targeted analysis by quadrupole time-of-flight mass spectrometry (QTOF-MS) was used to characterize the recirculating aquaculture systems fulvic acids (RASFA) and then compare their molecular fingerprints with actual reference standards of fulvic acids (FA) (Suwannee River; SRFA, Elliott soil; ESFA and Pahokee Peat; PPFA) purchased from the International Humic Substance Society (IHSS). The results of this study demonstrated the applicability of QTOF-MS as a rapid and comprehensive screening technique to characterize the FA fraction of DOM from RAS and to monitor differences in their molecular fingerprints when compared with other FA samples (SRFA, ESFA and PPFA). The QTOF-MS data from SRFA and ESFA standards matched the list of formulas obtained by 17 high-resolution mass spectrometry (HRMS) instruments with 90 and 76% accuracy, respectively, which guaranteed the power of QTOF-MS without the need for further coupling to liquid chromatography (LC). RASFA was found to be rich in low- and high-oxygen unsaturated classes of compounds (lowOC: 61.73% and highOC: 19.28%) and was similar in composition to SRFA. On the contrary, the ESFA and PPFA soil standards consisted mainly of aliphatic compounds (36.77 and 55.74%, respectively) and differed significantly in composition from the RASFA and SRFA water samples. RASFA matched with 66% of the elemental compositions obtained from the DOM of makeup waters analyzed in a previous experiment, indicating freshwater and seawater origins with a high fraction of terrestrial-derived organic matter (Tanimoto score: 0.53 between RASFA and SRFA). The unique information obtained from the molecular-level analysis of FA samples by QTOF-MS highlights the importance of this technique to characterize and compare FA from different origins rendering it possible to track the FA compositional changes along the water treatment processes of RAS. To our knowledge, this is the first study that characterizes the molecular fingerprints of the RASFA by QTOF-MS and compares them with the available FA reference standards from IHSS.

1. Introduction

Recirculating aquaculture systems (RAS) are developed to support human population growth, achieving profitable production of fish [1,2]. These systems recycle water through different mechanisms, ensuring optimum water quality with minimal natural water demand and waste production [3]. However, the constant utilization of RAS waters leads to an accumulation of dissolved organic matter (DOM), and consequently to the yellow discoloration of its waters [4,5,6,7,8]. DOM from RAS is a heterogeneous complex mixture containing many identifiable classes of compounds such as proteins, carbohydrates, lipids, unsaturated compounds, aliphatics, lignins, condensed aromatic and humic substances (HS), among others [4,5,9,10]. From those, HS are considered one of the causes of the yellow discoloration in natural waters, and hence are a possible contributor to the yellow discoloration of RAS waters [11,12,13,14,15].
HS in the aqueous form can be divided into two fractions: (1) humic acids (HA): dark-brownish fraction of HS not soluble in water at pH < 2; and (2) fulvic acids (FA): yellowish to yellow-brownish fraction of HS soluble in water pH [16,17,18]. These substances are ubiquitous in natural and human-made environments, including natural waters [19], wastewaters [20], sewage sludge [21], landfill leachates [22], compost [23], soil [24] and the atmosphere [25], and are defined as organic residues formed from the organic matter and detritus decay [18,26]. In a recent study performed by Yamin et al. (2017) [9], humic-substance-like (HS-like) components were found in the fish feed, fish blood and waters of freshwater and marine RAS for hybrid tilapia (Oreochromis aureus × Oreochromis niloticus) and gilthead seabream (Sparus aurata), respectively. Moreover, humic-like species were found in high abundance in the brackish waters of RAS during the acclimation of Atlantic salmon (Salmo salar) post-smolts [4].
The increase of water reuse in RAS and the steady generation of organic matter from the faeces, fish degradation components and non-consumed feed can contribute to the accumulation of HA and FA [27]. This was supported in our previous study, where accumulation of fulvic-like compounds was observed in the RAS waters of Atlantic salmon (Salmo salar) post-smolts even under the application of a powerful oxidizing agent such as ozone [4]. These acids can affect many biogeochemical processes in the aquaculture environment, including microbial growth, interaction with metallic ions and organic chemicals, pH buffering, photochemical reactions, light attenuation, and transport of contaminants, which can affect the water quality of RAS, and consequently fish health and welfare [17,28,29,30,31]. Moreover, their accumulation can cause colour, odour and taste problems in the waters of RAS, decreasing the water clarity and progressively deteriorating the fish farming environment [29]. HS are considered the most refractory fraction of DOM that resists biodegradation [17,32] and the possible cause of the accumulation of yellowish organic compounds in RAS; hence, determining the composition of HS is essential for ensuring optimal water quality management, and subsequently fish productivity in RAS.
Non-targeted screening approaches by electrospray ionization quadrupole time-of-flight mass spectrometry (ESI-QTOF-MS) can detect numerous single fulvic acid molecules out of the complex isolates when no previous information on the underlying molecules is available [33,34,35,36,37]. ESI-QTOF-MS analyses are often qualitative and can reveal information about the complexation properties, origins, formation, structure, and transformation of fulvic acids in RAS. These analyses were previously performed with and without coupling to liquid chromatography [33,34]. Liquid chromatography (LC) constitutes a powerful tool for FA analyses since it fractionates FA into classes of compounds based on their polarity (hydrophobicity or hydrophilicity), charge, molecular weight and degree of unsaturation. Moreover, LC can enhance the discrimination of a number of isobaric compounds and isomers from the complex mixture of FA and can reduce the contamination of the sample prior to the mass spectrometer [38,39,40,41,42,43,44]. Still, the instrumental simplicity and reduced analysis time of HRMS techniques without coupling to LC dominates FA analyses [32,45,46,47]. The standardized isolation and purification procedures of FA based on the International Humic Substance Society [48] available online: https://humic-substances.org/isolation-of-ihss-samples (accessed on 17 June 2022) report the disadvantage of being laborious and time-consuming, raising the need for a fast monitoring method for the FA fraction of DOM from RAS.
To date, the elemental compositions of hundreds to thousands of FA molecules from unique environments have been reported [36,49,50] and compared with reference FA standards from the IHSS [32,33,45,51,52,53]. The three currently available IHSS FA standards are Suwannee River (SRFA, river water in Okefenokee Swamp, Georgia), Pahokee Peat (PFA, agricultural peat soil, Florida Everglades) and Elliott soil (EFA, fertile prairie soils, Illinois) available online: https://ihss.humicsubstances.org/orders.html (accessed on 17 June 2022). Although the FA standards from IHSS are widely characterized and used as reference samples of DOM, no detailed information about the molecular composition of recirculating aquaculture system fulvic acids (RASFA) and their comparison with IHSS standards are obtained. In this study, a non-targeted analysis by QTOF-MS without fractionation was applied to investigate the molecular composition of RASFA isolated from the tank waters with Atlantic salmon (Salmo salar) grow-outs to subsequently compare their composition with the IHSS FA reference standards. To our knowledge, this is the first time that the performance of QTOF-MS has been assessed as a molecular fingerprinting tool of RASFA by its direct comparison with IHSS FA reference standards.

2. Materials and Methods

2.1. RAS Water Sample Collection

The 600 mL water samples were collected with high-density polyethylene (HDPE) bottles (VWR Chemicals, Trondheim, Norway) from the tanks of RAS stocked with Atlantic salmon (Salmo salar L.) in the “grow-out hall 1” at the Nofima Centre for Recirculation in Aquaculture (NCRA) in Sunndalsøra, Norway [54]. The experimental fish rearing system used in this experiment consisted of three octagonal tanks (100 m3) with a total biomass of 9400 kg (1250 fish per tank with an average weight of 2.5 kg/fish), a mechanical belt filter, a moving bed bioreactor (MBBR), a CO2 degasser, a pump-sump and an oxygenation system. Details on the system design are provided in previous publications [4,5,54]. The system worked under a total feed load of 150 kg/day with a makeup water exchange of 45% of the system volume/day, a water recirculation flow of 7500 L/min and an ozone dosage maintained with an oxidation-reduction potential (ORP) ranging between 180 to 240 mV. The mixture of makeup water that consisted of ground well water and seawater was maintained at a stable salinity of 4 ng/L. The temperature and pH on the day of sampling were 13.5 °C and 7.3, respectively.

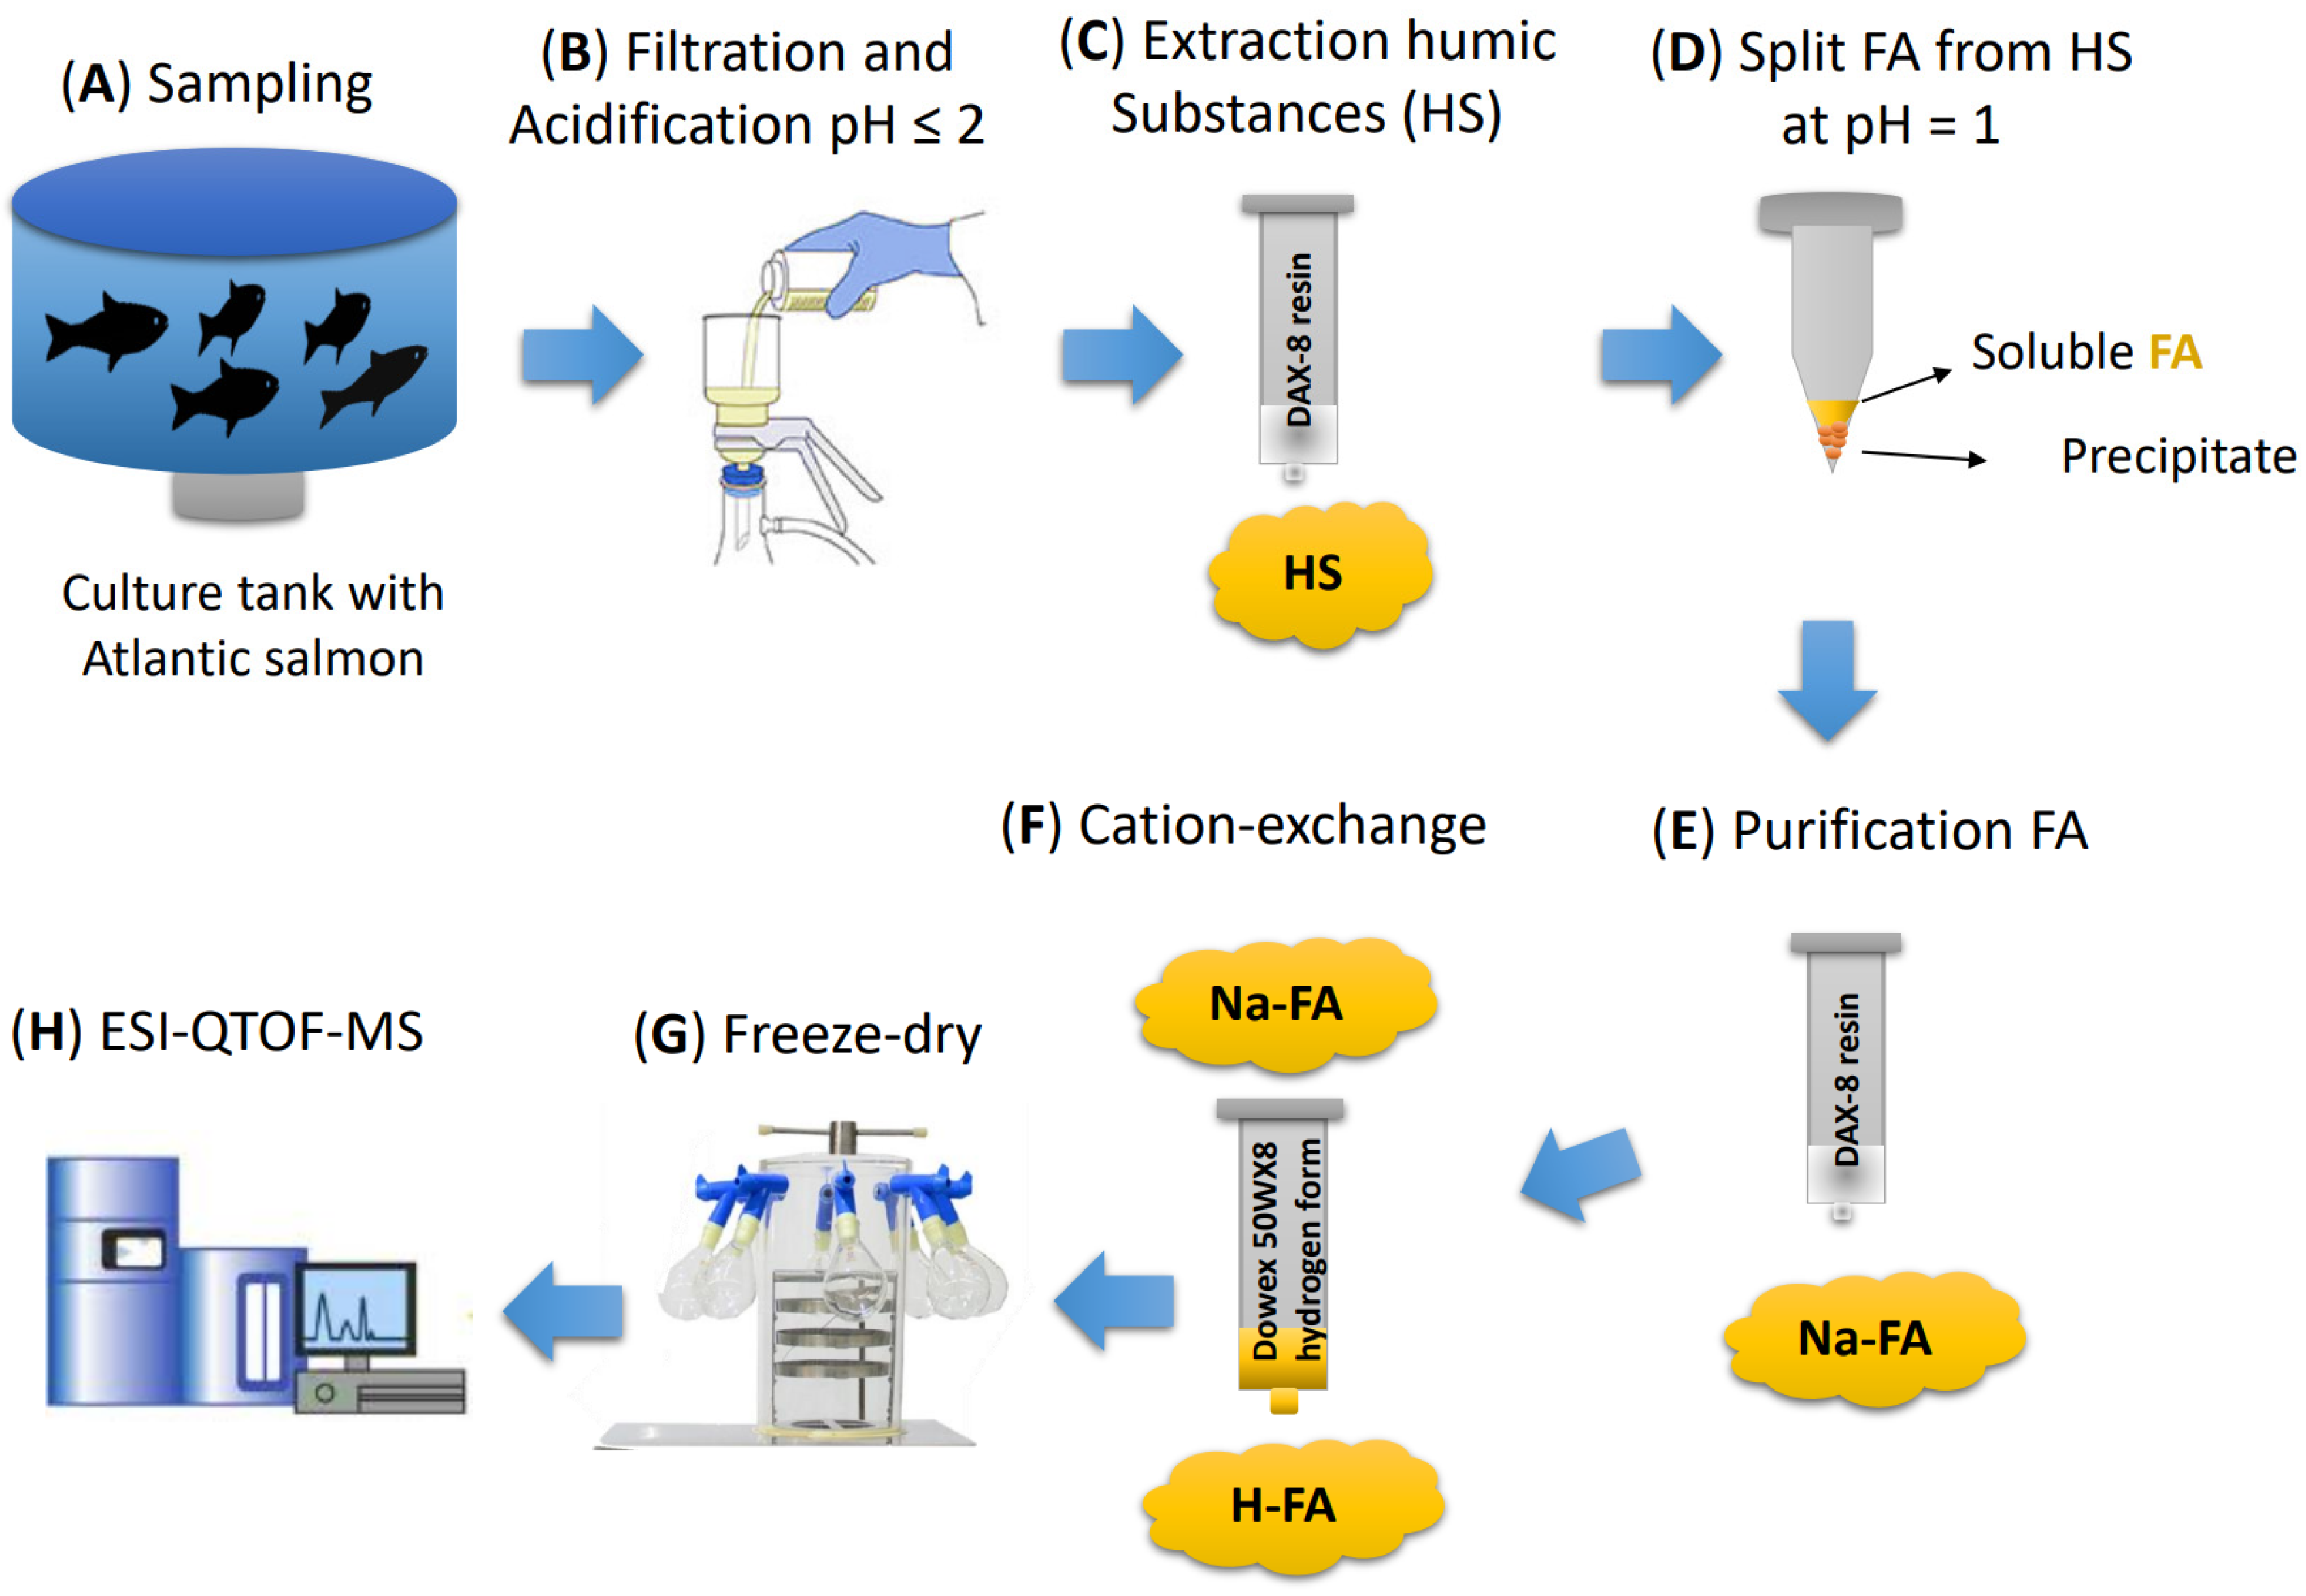
2.2. Extraction of the Fulvic Acids from RAS and Sample Preparation

The isolation procedure to extract the FA fraction of DOM in RAS was performed based on the recommended standard procedures for preparative isolation of aquatic HS by IHSS [48] available online: https://humic-substances.org/isolation-of-ihss-samples (accessed on 17 June 2022) using solid-phase extraction (SPE) cartridges as described by Hojung Rho, et al. (2019) [55] (Figure 1). Briefly, 600 mL of RAS water was filtered using pre-combusted glass microfiber filters (GF/F filters; 0.7-μm pore size; WhatmanTM, VWR Chemicals, Trondheim, Norway). The sample was acidified to pH ≤ 2 with concentrated hydrochloric acid (HPLC grade; VWR Chemicals, Trondheim, Norway) and pumped with a peristaltic pump (IPC, Ismatec, Germany) through a SPE cartridge (6 mL, Sigma-Aldrich, Trondheim, Norway) packed with 2 g of DAX-8 resin (SupeliteTM DAX-8, Sigma-Aldrich, Trondheim, Norway). SPE DAX-8 resin cartridges were washed with 13 mL of 0.1 M sodium hydroxide (NaOH, VWR Chemicals, Trondheim, Norway), 13 mL of Milli-Q water and 13 mL of 0.1 M HCl (HPLC grade; VWR Chemicals, Trondheim, Norway) before loading the RAS sample [55]. Acidification of the eluent to pH = 1 led to precipitate formation. The soluble FA fraction of DOM was re-adsorbed in a new SPE cartridge packed with 2 g of DAX-8, washed with 6 mL of Milli-Q water and eluted with 13 mL of 0.1 M NaOH. The NaOH eluent from the DAX-8 SPE was immediately passed through an SPE cartridge packed with 2 g of a strong cation exchange resin (Dowex® 50WX8 hydrogen form, Sigma-Aldrich, Norway) in the hydrogen-saturated form. Eventually, the resulting proton-saturated FA (H-FA) eluent was freeze-dried and subsequently preserved at −20 °C until further analysis. The FA reference materials were obtained from the IHSS available online: http://humic-substances.org/ (accessed on 17 June 2022) (SRFA; 3S101F, ESFA; 5S102F and PPFA; 2S103F) and together with the FA sample from RAS were prepared at concentrations of 100 ppm, dissolving the powder of each FA concentrate in Milli-Q water [33].

2.3. QTOF-MS Analysis

A Synapt G2-S quadrupole time-of-flight (QTOF) mass spectrometer (Waters Corporation, Milford, MA, USA) coupled with flow injection analysis (FIA) under negative electrospray ionization (ESI) mode was used for the analysis of the FA samples. An aliquot of 5 µL of each sample was injected through FIA for 2 min using a HPLC grade water (VWR Chemicals, Trondheim, Norway) solution with 0.1% (v/v) formic acid (Sigma-Aldrich, Steinheim, Germany) in the isocratic mode. The isocratic flow injection was: initial conditions, 0.15 mL/min; 0.10–1.00 min, 0.03 mL/min; 1.00–1.50 min, 0.2 mL/min; 1.50–1.85 min, 0.8 mL/min; and 1.85 to 2.00 min, 0.15 mL/min. A leucine enkephalin (Waters Corporation, Milford, MA, USA) solution with a concentration of 200 ng/mL was used as a Lockmass at a flow rate of 10 μL/min to allow for correction of exact mass measurements. The capillary and cone voltages were set at −3.5 kV and 30 V, respectively. The desolvation flow was fixed at 900 L/h with a desolvation temperature set at 500 °C. The full scan spectra were acquired using a scan range of 50 to 1200 mass to charge ratio (m/z) and a resolution of 35,000 full-width high maximum (FWHM). Spectra from FA samples were averaged out between 20 to 300 scans to a single mass spectrum using Masslynx V4.1 (Waters, Milford, USA). The m/z signals with their corresponding intensities were exported to a peak list and their elemental compositions were calculated using the PetroOrg SS 18.0.3 software (Omics LLC, Tallahassee, FL, USA) [56,57]. The elemental compositions were generated based on the presence of 12C4-40, 13C0-1, 1H4-80 and 16O0-35 with a mass error of ± 10 ppm, DBE range 0–40, 6 minimum peak per class and 20 number of peaks. The generated elemental compositions were confirmed to be single charged by assigning their 13C isotopic peak at m/z + 1.0031 to 1.0035. The resulting data were exported as comma delimited (.csv) format and imported to Rstudio (version 4.0.2) for further data clean-up.

2.4. Data Clean-Up and Visualization

The obtained elemental compositions from PetroOrg SS 18.0.3 software were filtered out using R scripts that constrained the m/z, mass defect, hydrogen to carbon (H/C) and oxygen to carbon (O/C) values as follows: 200 < m/z < 800, mass defect ≤ 0.4 or ≥ 0.9, 0.3 ≤ H/C ≤ 2.2 and 0 < O/C ≤ 1.2 [46,58]. Double bond equivalency minus oxygen (DBE-O) values, which were calculated as Koch and Dittmar, (2006) [59], were restricted between −10 to 10 and only the elemental compositions that were higher in intensity than those identified in the reagent blanks were further considered [60]. For the selected elemental compositions, modified aromaticity index values (AImod) were calculated as described by Koch and Dittmar, (2006) [59]. The DBE-O and metric values (AImod, H/C, O/C and m/z) were expressed as weight-averaged values (wa), which were calculated as reported by Schmidt et al., (2009) [61]. Moreover, the H/C and O/C ratios calculated from each identified elemental composition were represented in van Krevelen diagrams [49] and were classified into five chemical compound classes according to Hawkes, (2020) [46]. The compound classes were: condensed aromatics (AImod ≥ 0.67), aromatics (0.5 < AImod < 0.67), high oxygen “highOC” unsaturated (H/C < 1.5, AImod < 0.5, O/C ≥ 0.5), low oxygen “lowOC” unsaturated (H/C < 1.5, AImod < 0.5, O/C < 0.5) and aliphatics (H/C ≥ 1.5). Principal component analysis (PCA) and Tanimoto similarity test [62] based on the sum-normalized abundances obtained from each FA sample were also represented.

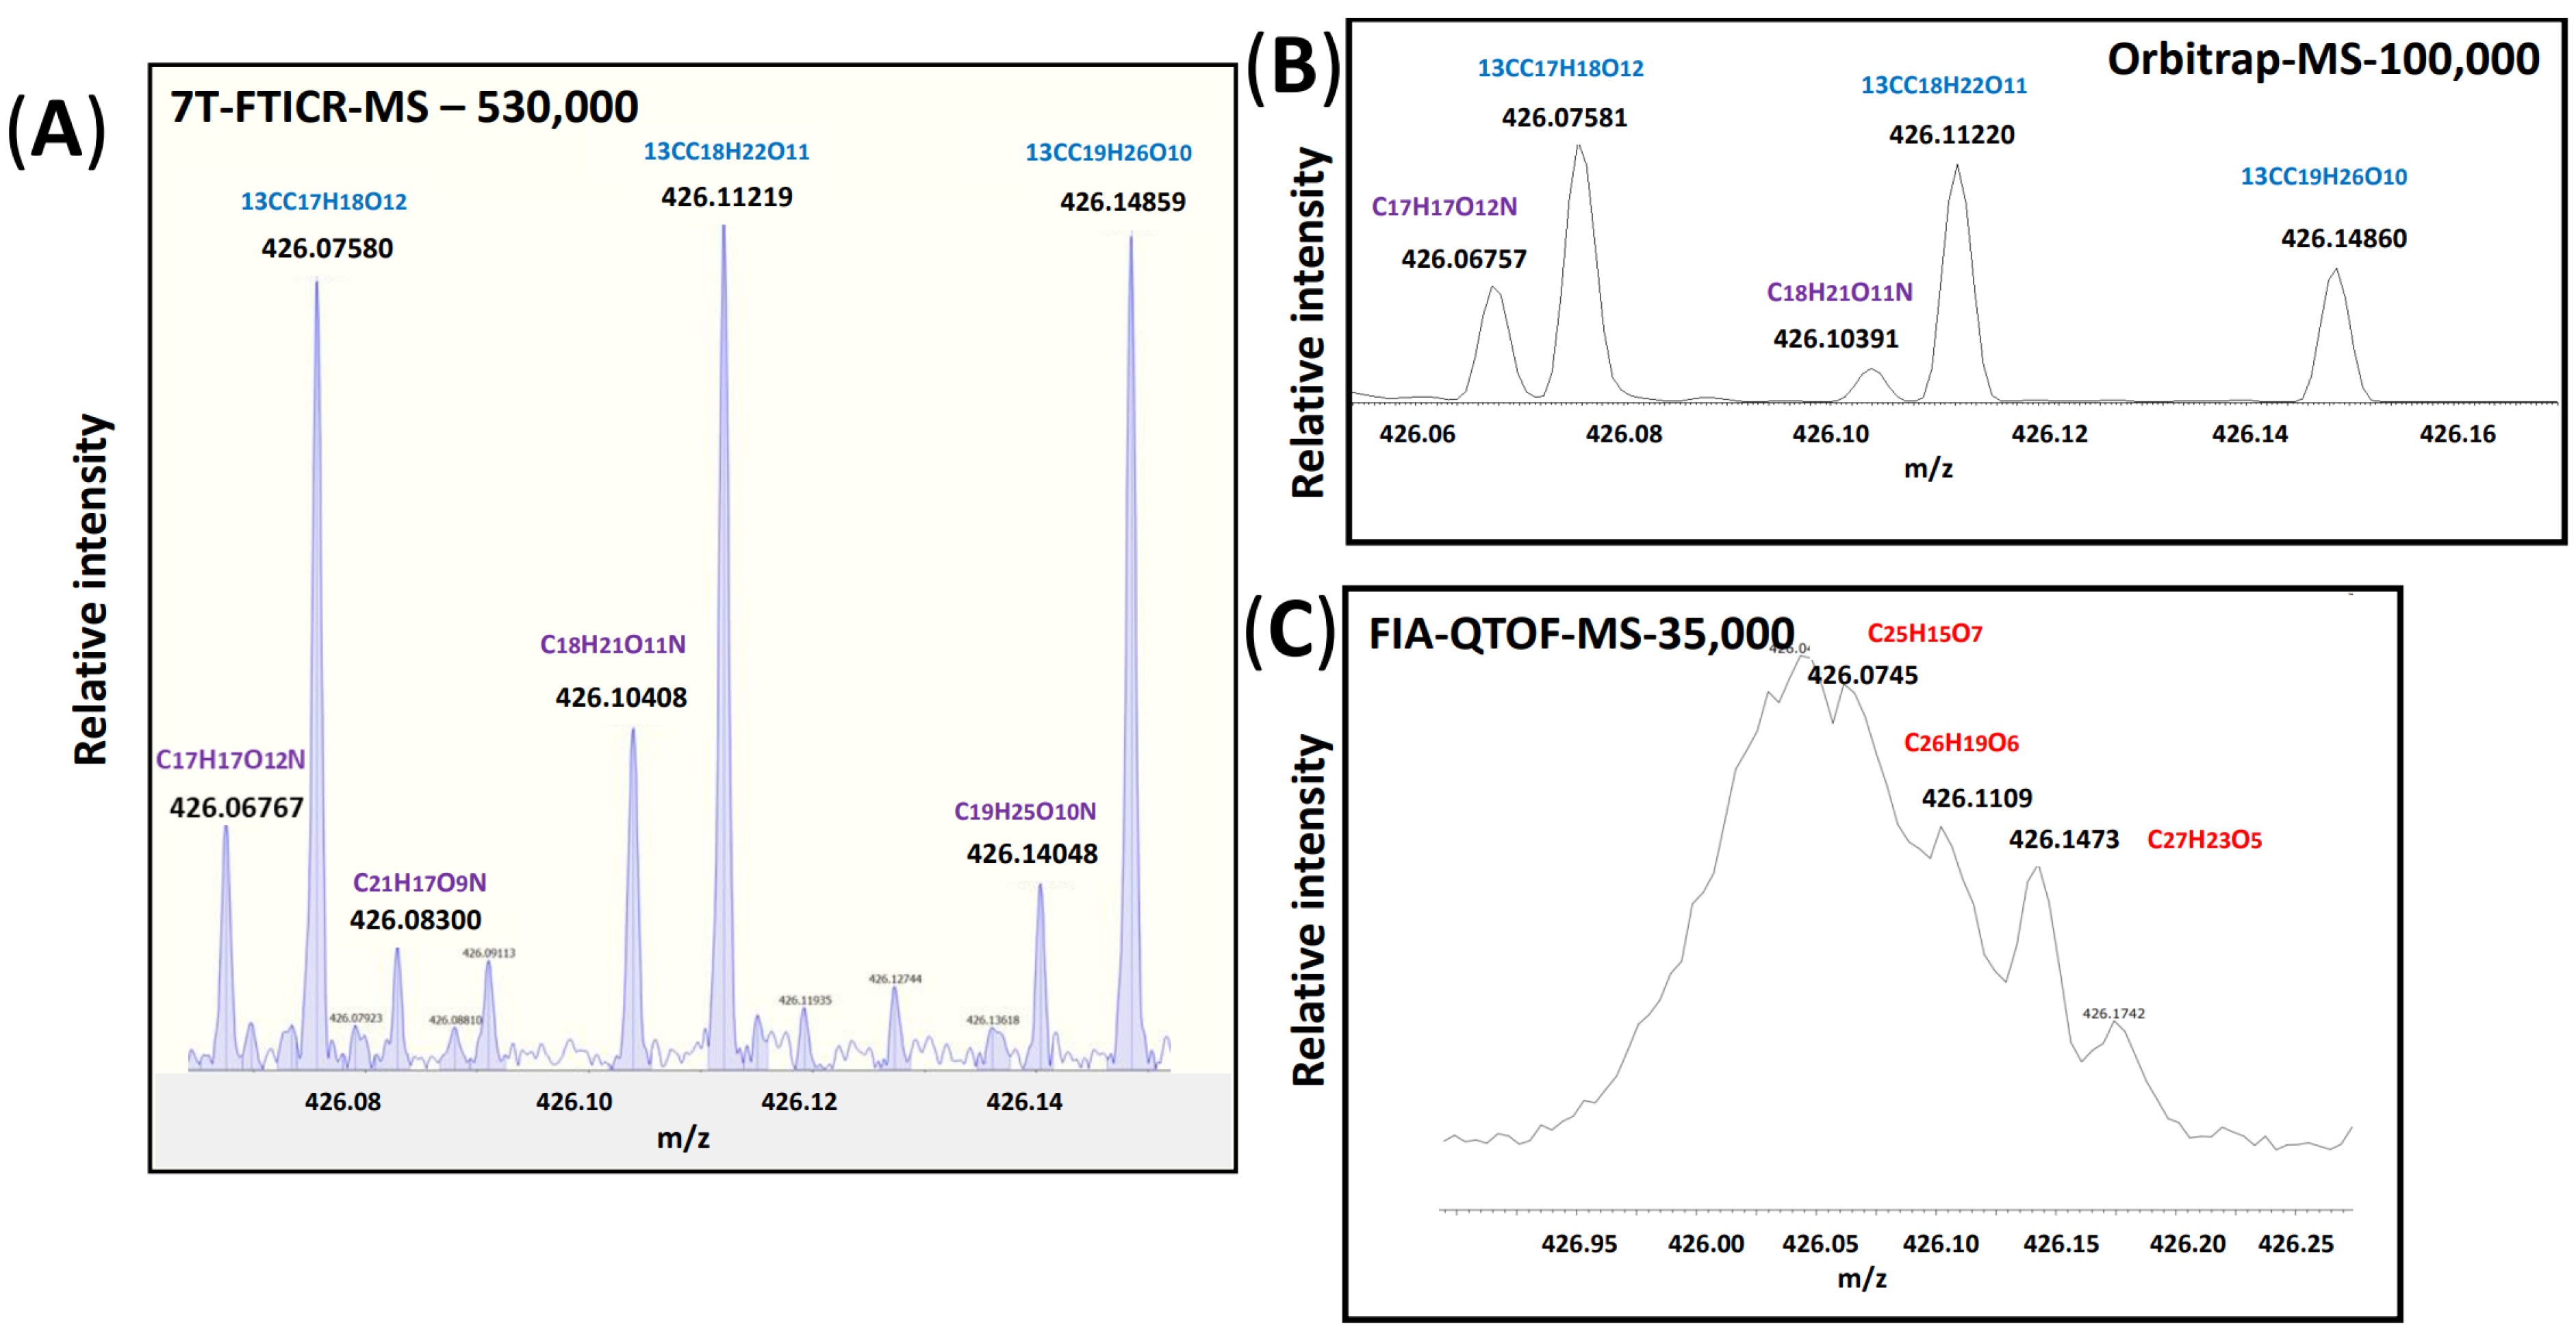
2.5. Accuracy in the Elemental Composition Assignment

The formulas obtained from the SRFA and ESFA samples were compared with two data sets comprised of SRFA, ESFA, Pony Lake fulvic acid (PLFA) and Suwannee River Natural Organic Matter (SRNOM) IHSS standards analyzed by 17 HRMS instruments under negative ESI mode, including Fourier transform mass spectrometry (FTICR-MS) and Orbitrap mass spectrometry (Orbitrap-MS) instruments using the InterLabStudy package version: 0.0.1.5 available online: https://go.warwick.ac.uk/InterLabStudy (accessed on 31 March 2022) [46]. Details on the instrument type, participating institutions and their countries can be found in Hawkes, et al. (2020) [46]. With this, the QTOF-MS data were robustly compared among research groups. The first data set comprised formulas that were common in all assigned data (common), while the second data set comprised formulas that were present in ≥3 assigned data sets (detected). The reported results from InterLabStudy platform in terms of matches in elemental compositions and metric values (O/C, m/z, H/C and AImod) were used to ensure the accuracy of elemental composition assignment by QTOF-MS and evaluate its performance. Moreover, the list of elemental compositions from the RASFA sample analyzed by QTOF-MS was compared with a list of 2645 DOM formulas with carbon, hydrogen and oxygen (CHO) obtained by a 7 Tesla FTICR-MS in a recent work of ours [4]. With this, the accuracy in the elemental composition assignment of the RASFA sample by QTOF-MS was assessed and used to identify its possible compositional sources in RAS.

3. Results and Discussion

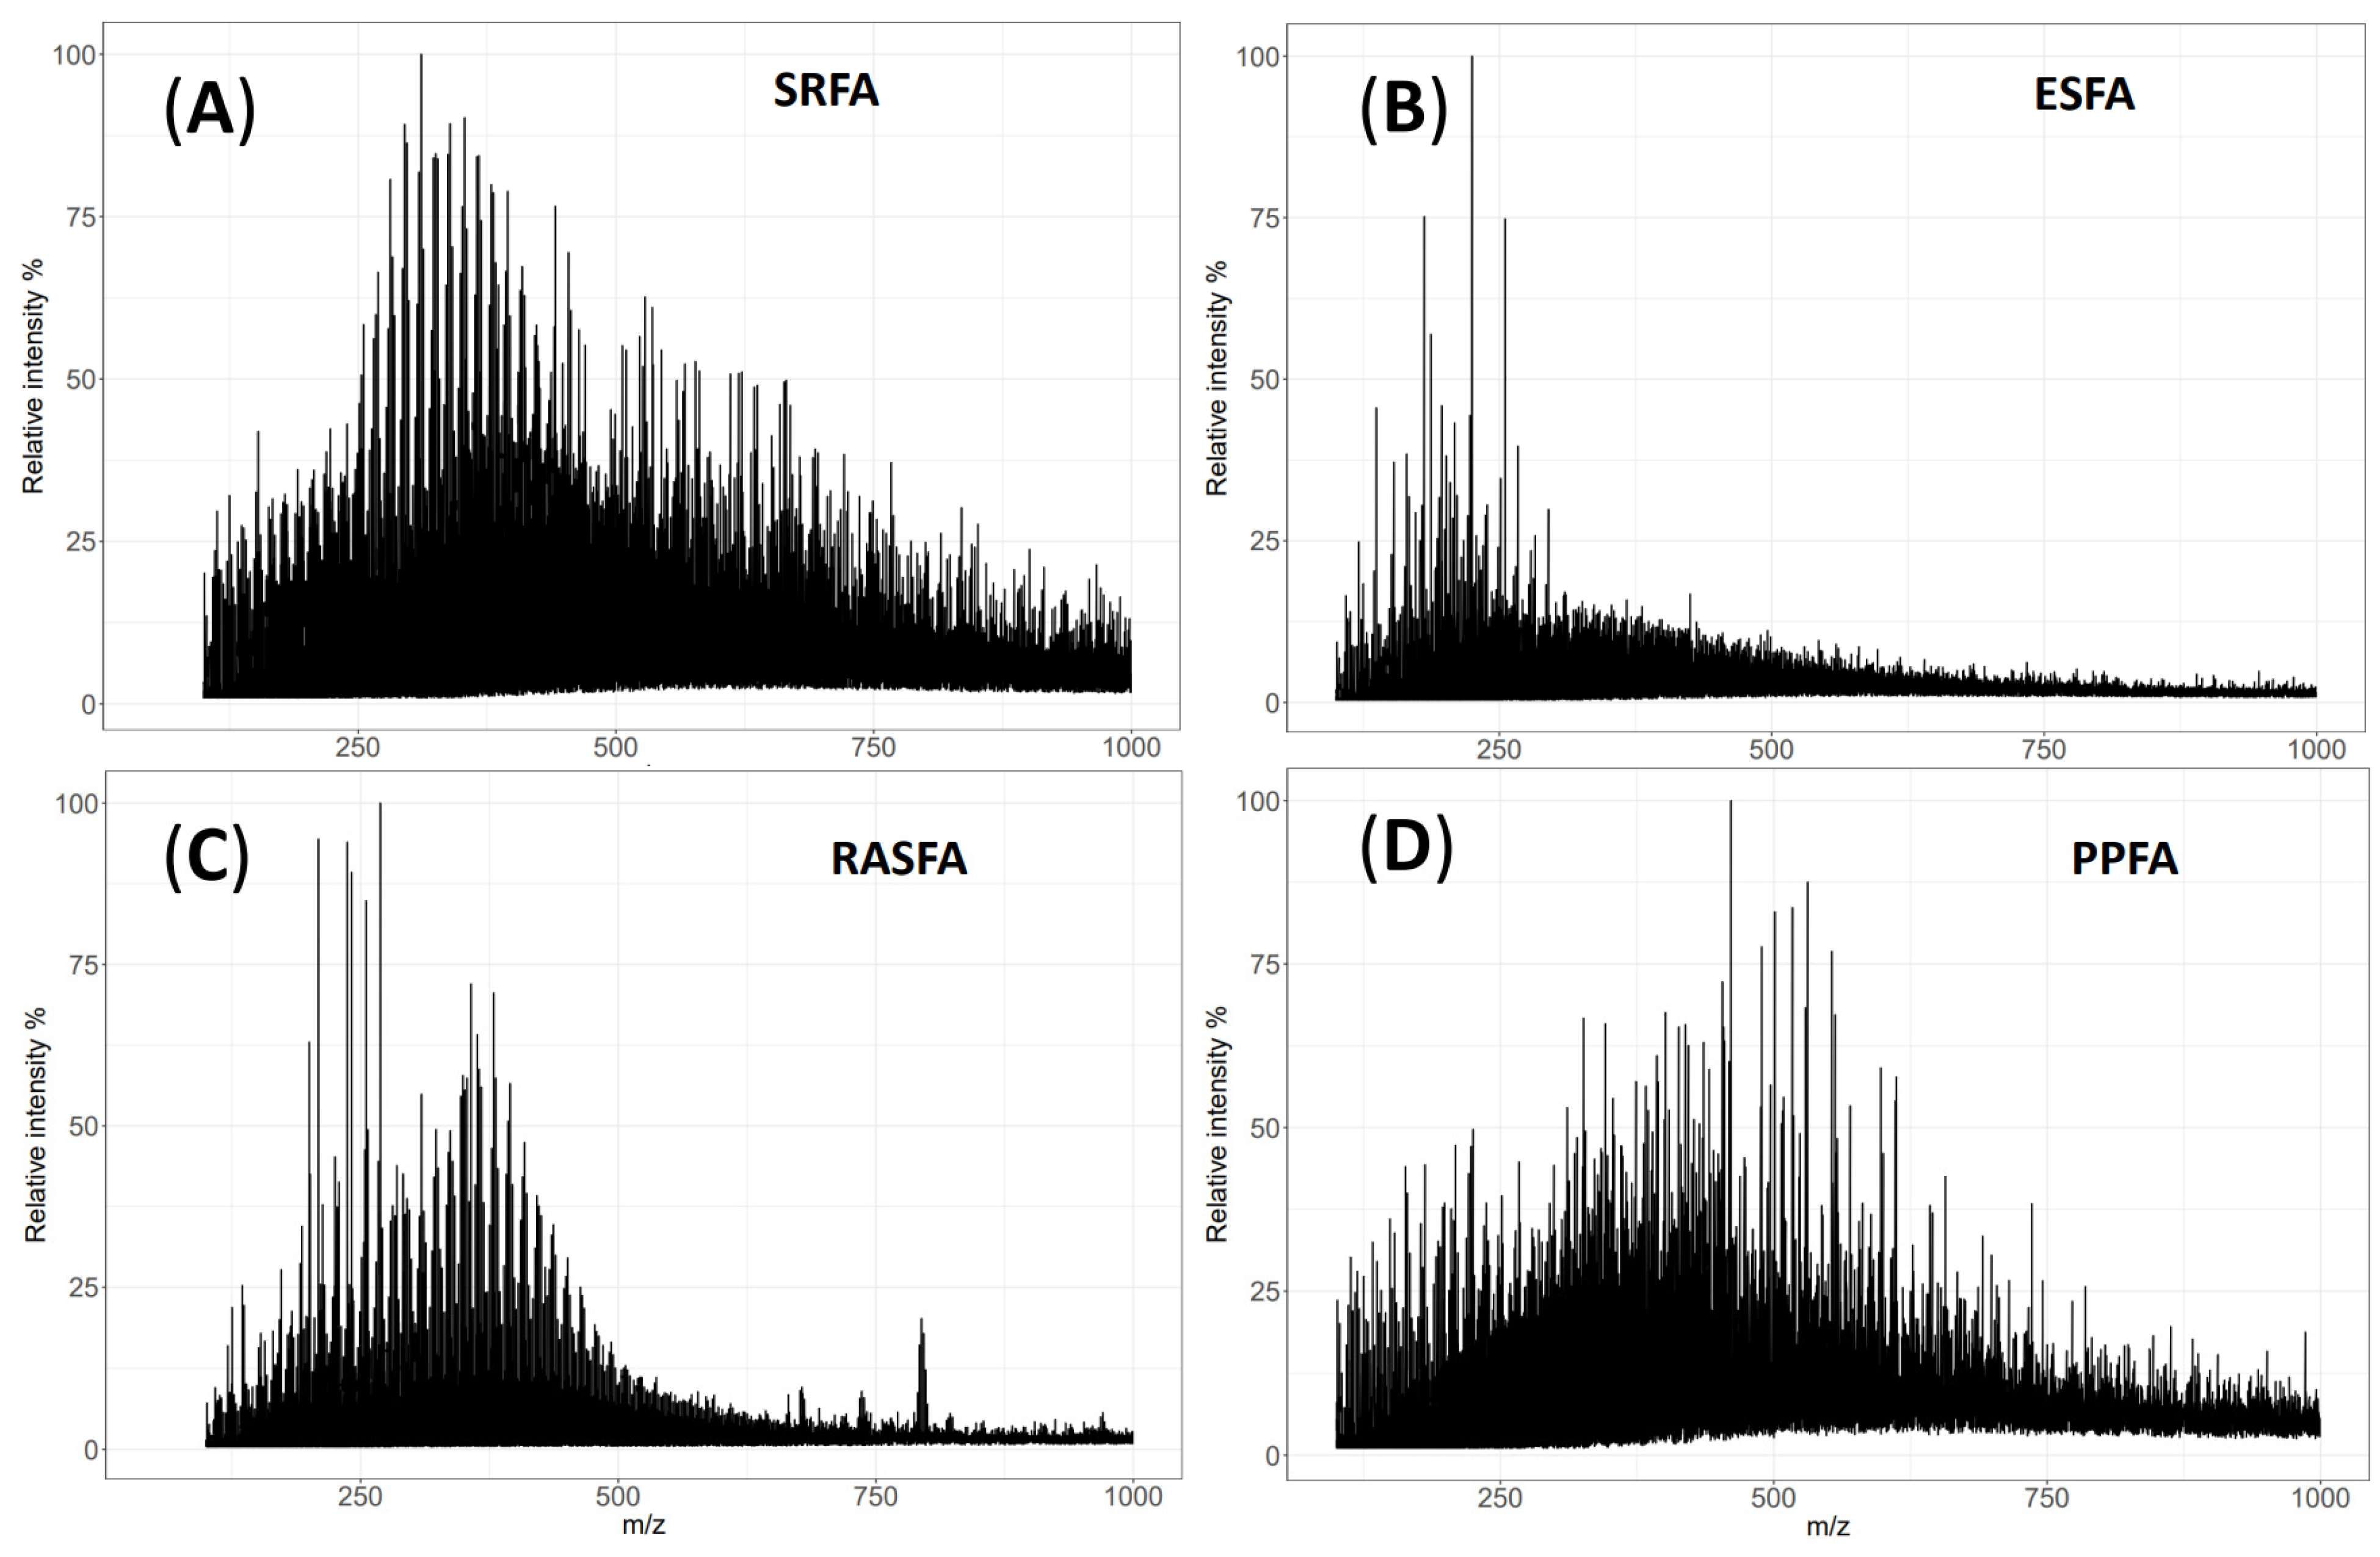
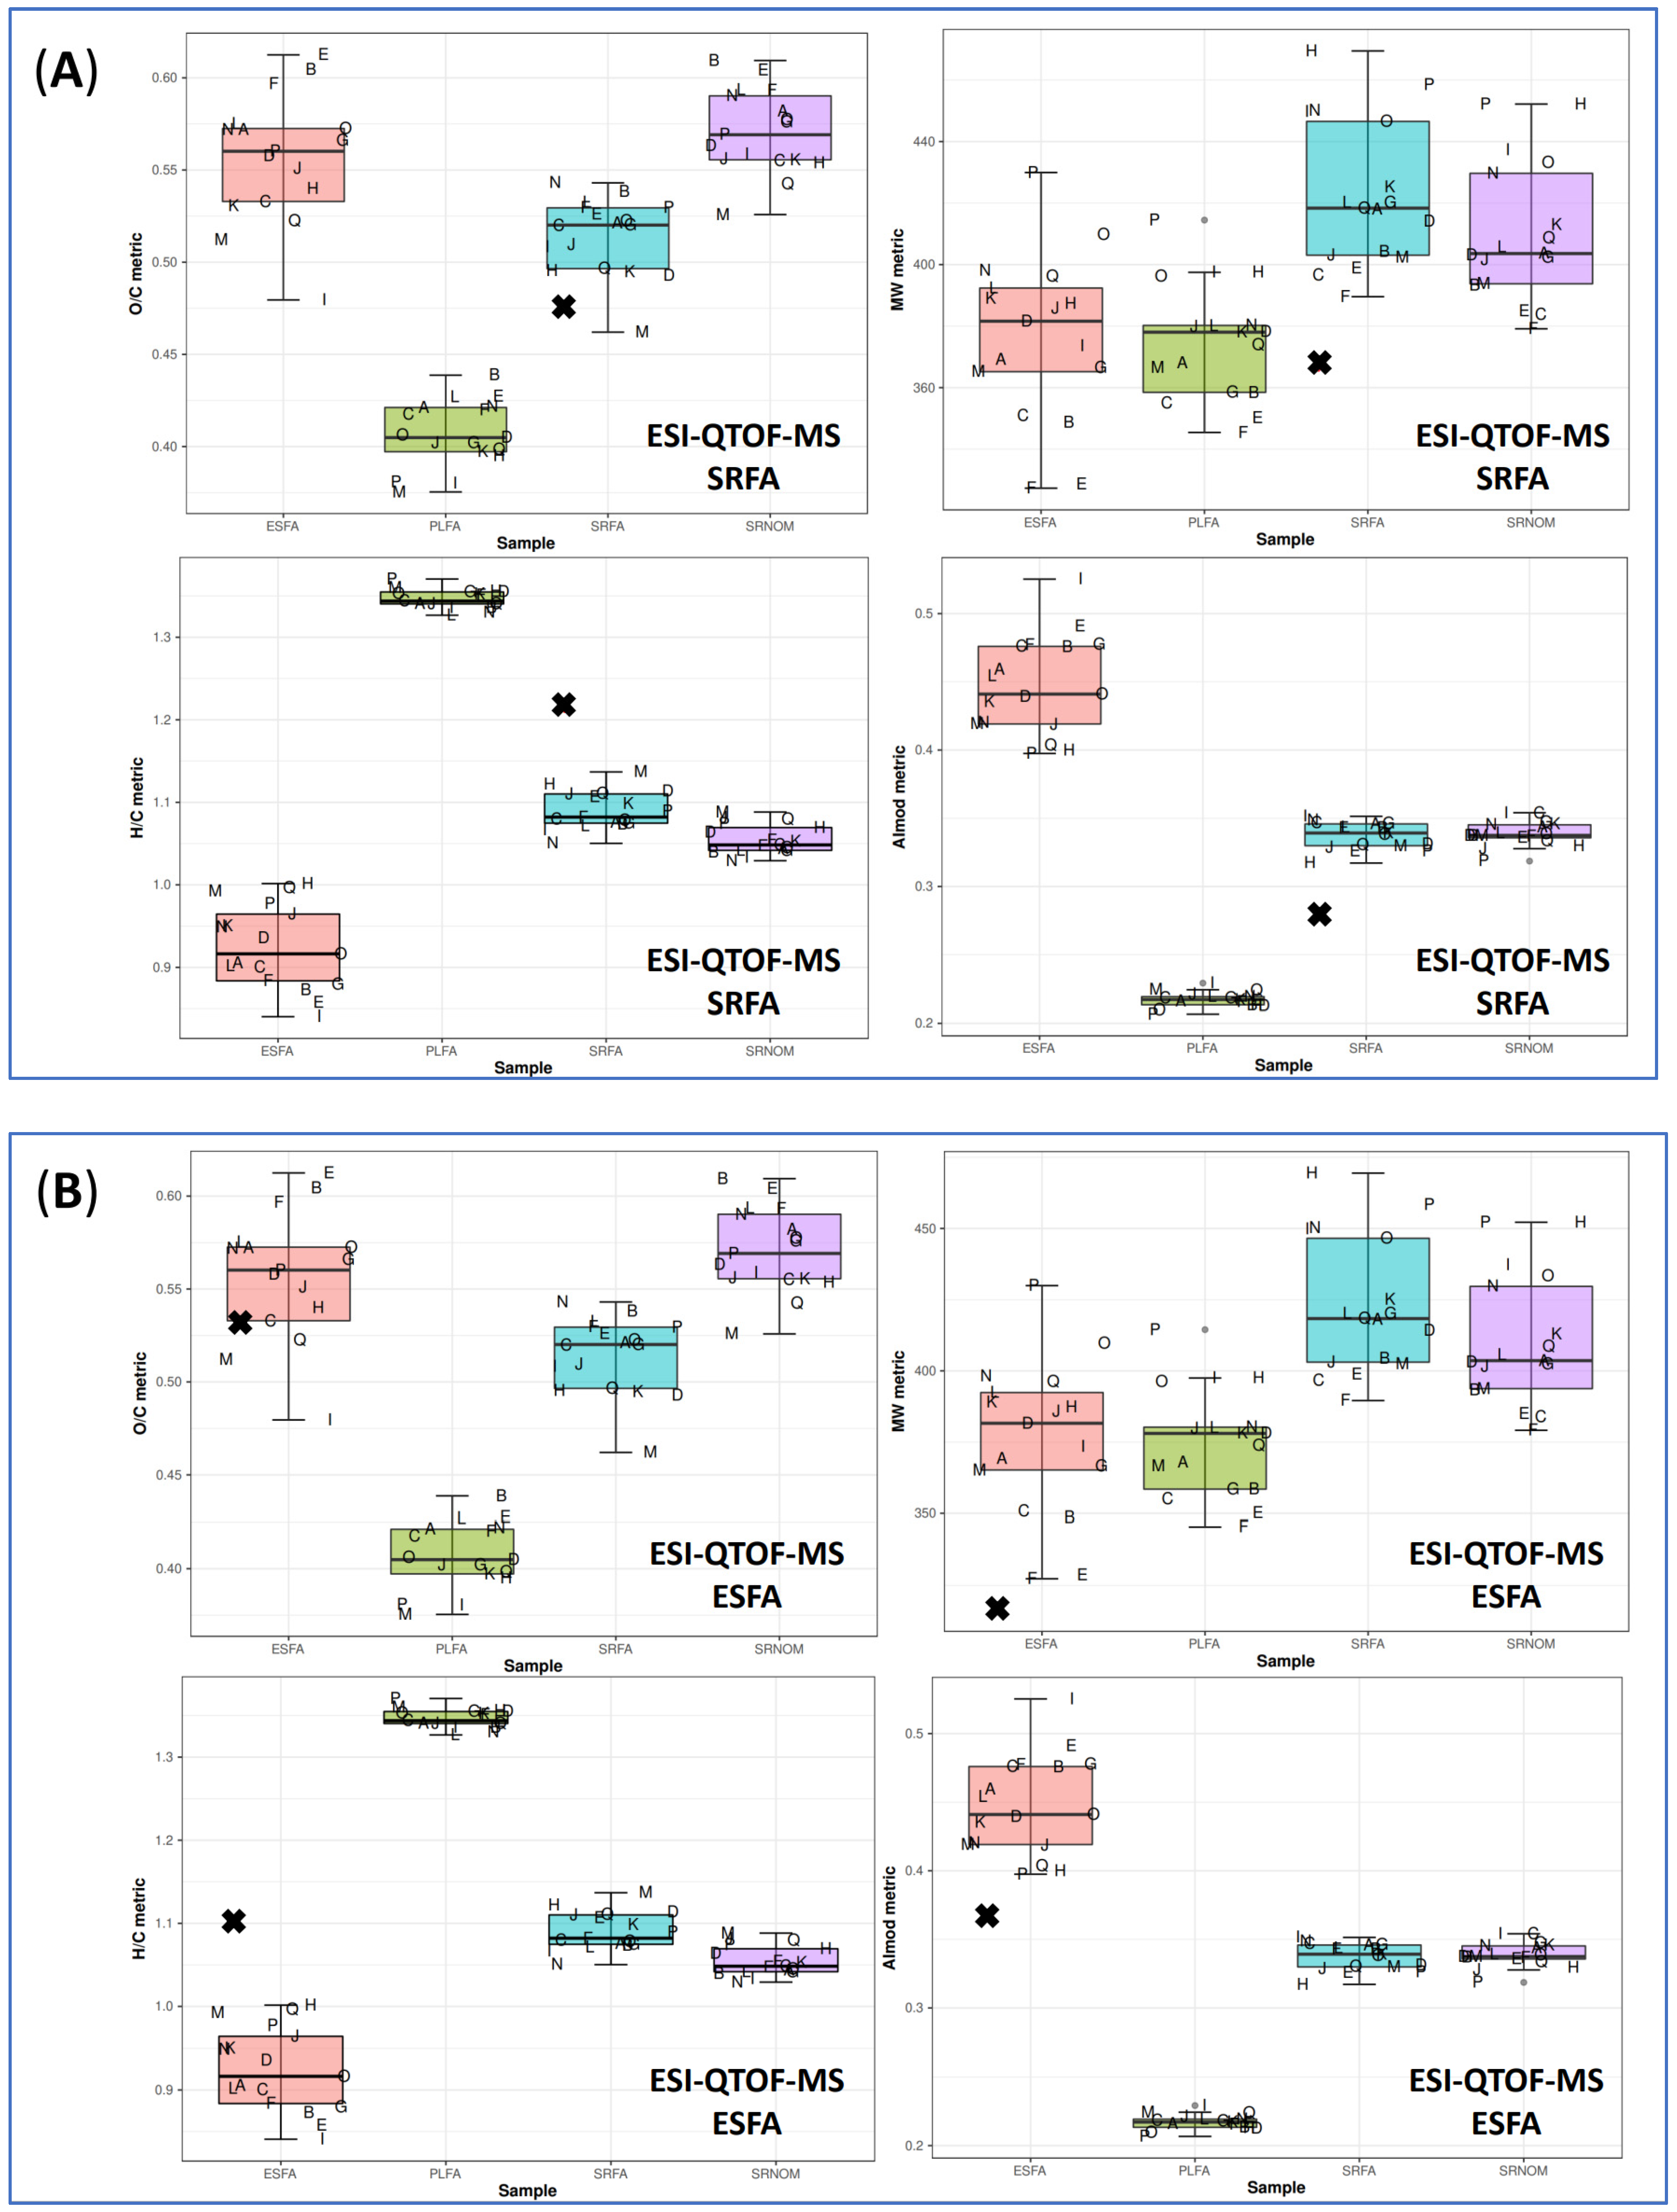
3.1. QTOF-MS of SRFA and ESFA

The QTOF-MS spectra of SRFA and ESFA are shown in Figure 2A,B. The mass distributions for SRFA spanned across the same range (250 to 500 m/z) as that of the SRFA analyzed in previous experiments [32,45,46,63]. The ESFA spectrum was also in agreement with a previous experiment [46] and its distribution was skewed below m/z 300 when compared with the Gaussian distribution for SRFA. From the detected m/z peaks of SRFA and ESFA standards, a total of 343 and 148 elemental compositions were identified, respectively (Table 1).
When the identified elemental compositions from the SRFA and ESFA standards were uploaded to https://go.warwick.ac.uk/InterLabStudy (accessed on 31 March 2022), a total of 219 and 34 elemental compositions, respectively, matched the list of molecular formulas found in all datasets (common), while 92 and 78 elemental compositions, respectively, were detected in at least three datasets of the InterLabStudy platform (Figure 3). Thus, QTOF-MS without coupling to LC enabled the correct assignment of the m/z peaks found in the SRFA and ESFA samples with an accuracy of 90% (311 common and detected by InterLabStudy) and 76% (112 common and detected by InterLabStudy), respectively (Figure 3). Nonetheless, the QTOF-MS technique with PetroOrg SS 18.0.3 software was able to provide only 22 and 6% of elemental compositions in SRFA and ESFA standards, respectively, (Figure 3B,D). This can be attributed to the FIA method used in the analysis of complex mixtures such as the FA fraction of DOM. The FIA method works by continuously delivering the FA sample into the ion source of the QTOF-MS without chromatographic separation, which can populate the ion source with many species of FA simultaneously. This can contribute to a strong ion suppression of the FA sample leading to an extensive spectral overlap, which can hinder the distinction between isomers and isobaric compounds [38,41] (Figure 4). In addition, the low resolution (35,000 FWHM) of the QTOF-MS instruments limits the identification of elemental compositions to a few high-intensity CHO peaks. Still, the van Krevelen diagrams of the QTOF-MS SRFA and ESFA data showed compositional differences in the fulvic acid fraction of their DOM (Figure 3A,C).
The QTOF-MS SRFA and ESFA data metrics were subsequently compared in the InterLabStudy platform (Figure 5). The QTOF-MS technique produced data with higher H/Cwa values and lower O/Cwa, AIwa and m/zwa values than the formulas collected by the InterLabStudy platform. Calculated weight-averaged values for the SRFA and ESFA samples were shown in Table 1. Despite the deviation observed in the QTOF-MS weight-averaged values from those obtained by the InterLabStudy platform (Figure 5), the same findings were achieved when the SRFA values were compared to those from the ESFA samples analyzed by QTOF-MS. The SRFA samples showed higher H/Cwa and m/zwa values than the ESFA samples, which showed higher O/Cwa and AIwa values. These results agreed with those obtained by the InterLabStudy (Figure 4) and the previous publication of Hawkes, (2020) [46], indicating the potential of QTOF-MS for characterizing the molecular fingerprints of the FA fraction of DOM.
To further study the molecular fingerprints of the SRFA and ESFA samples and decipher their differences using QTOF-MS, van Krevelen and bar chart diagrams of the identified CHO compounds were represented based on the classification of five compositional classes and their sum-normalized abundances (Figure 6). The SRFA showed higher proportions of unsaturated lowOC (50.80%) and unsaturated highOC (37.95%) classes of compounds than the ESFA, while the ESFA showed higher proportions of aliphatics (36.77%), aromatics (25.73%), unsaturated lowOC (21.00%) and condensed aromatics (10.63%) classes of compounds. The SRFA results were in agreement with those obtained with the 17 HRMS instruments [46]. Moreover, similar trends were found in the analysis of SRFA from IHSS using FTICR-MS by D’Andrilli et al., 2013 [32] and Qin et al., 2019 [45] and using Orbitrap-MS by Mangal et al., 2016 [63]. D’Andrilli et al., 2013 [32] reported that the SRFA standards were rich in biomolecules with O/C and H/C ratios of 0.53 and 1.20, respectively, whereas Qin et al., 2019 [45] and Mangal et al., 2016 [63] stated that SRFA standards were rich in lignin-like compounds (H/C = 0.7−1.5, O/C = 0.1−0.67). The O/C and H/C ranges of the previously mentioned studies were located in the same van Krevelen space described for unsaturated compounds (unsaturated H/C < 1.5, lowOC: O/C < 0.5 and highOC: O/C ≥ 0.5). Results obtained from the SRHA standards from IHSS analyzed by different laboratories using FTICR-MS instruments were also in agreement with the SRFA IHSS standards analyzed by QTOF-MS [47]. The spectra obtained from the different laboratories were characterized by the prevalence of lowOC and highOC unsaturated compounds. The high level of agreement between the FA results obtained by QTOF-MS and higher resolution techniques such as FTICR-MS and Orbitrap-MS demonstrated the ability of the QTOF-MS technique as a potential alternative to higher resolution techniques to characterize and compare the molecular fingerprints of the FA standards from IHSS, and hence of the FA fraction of DOM in RAS.

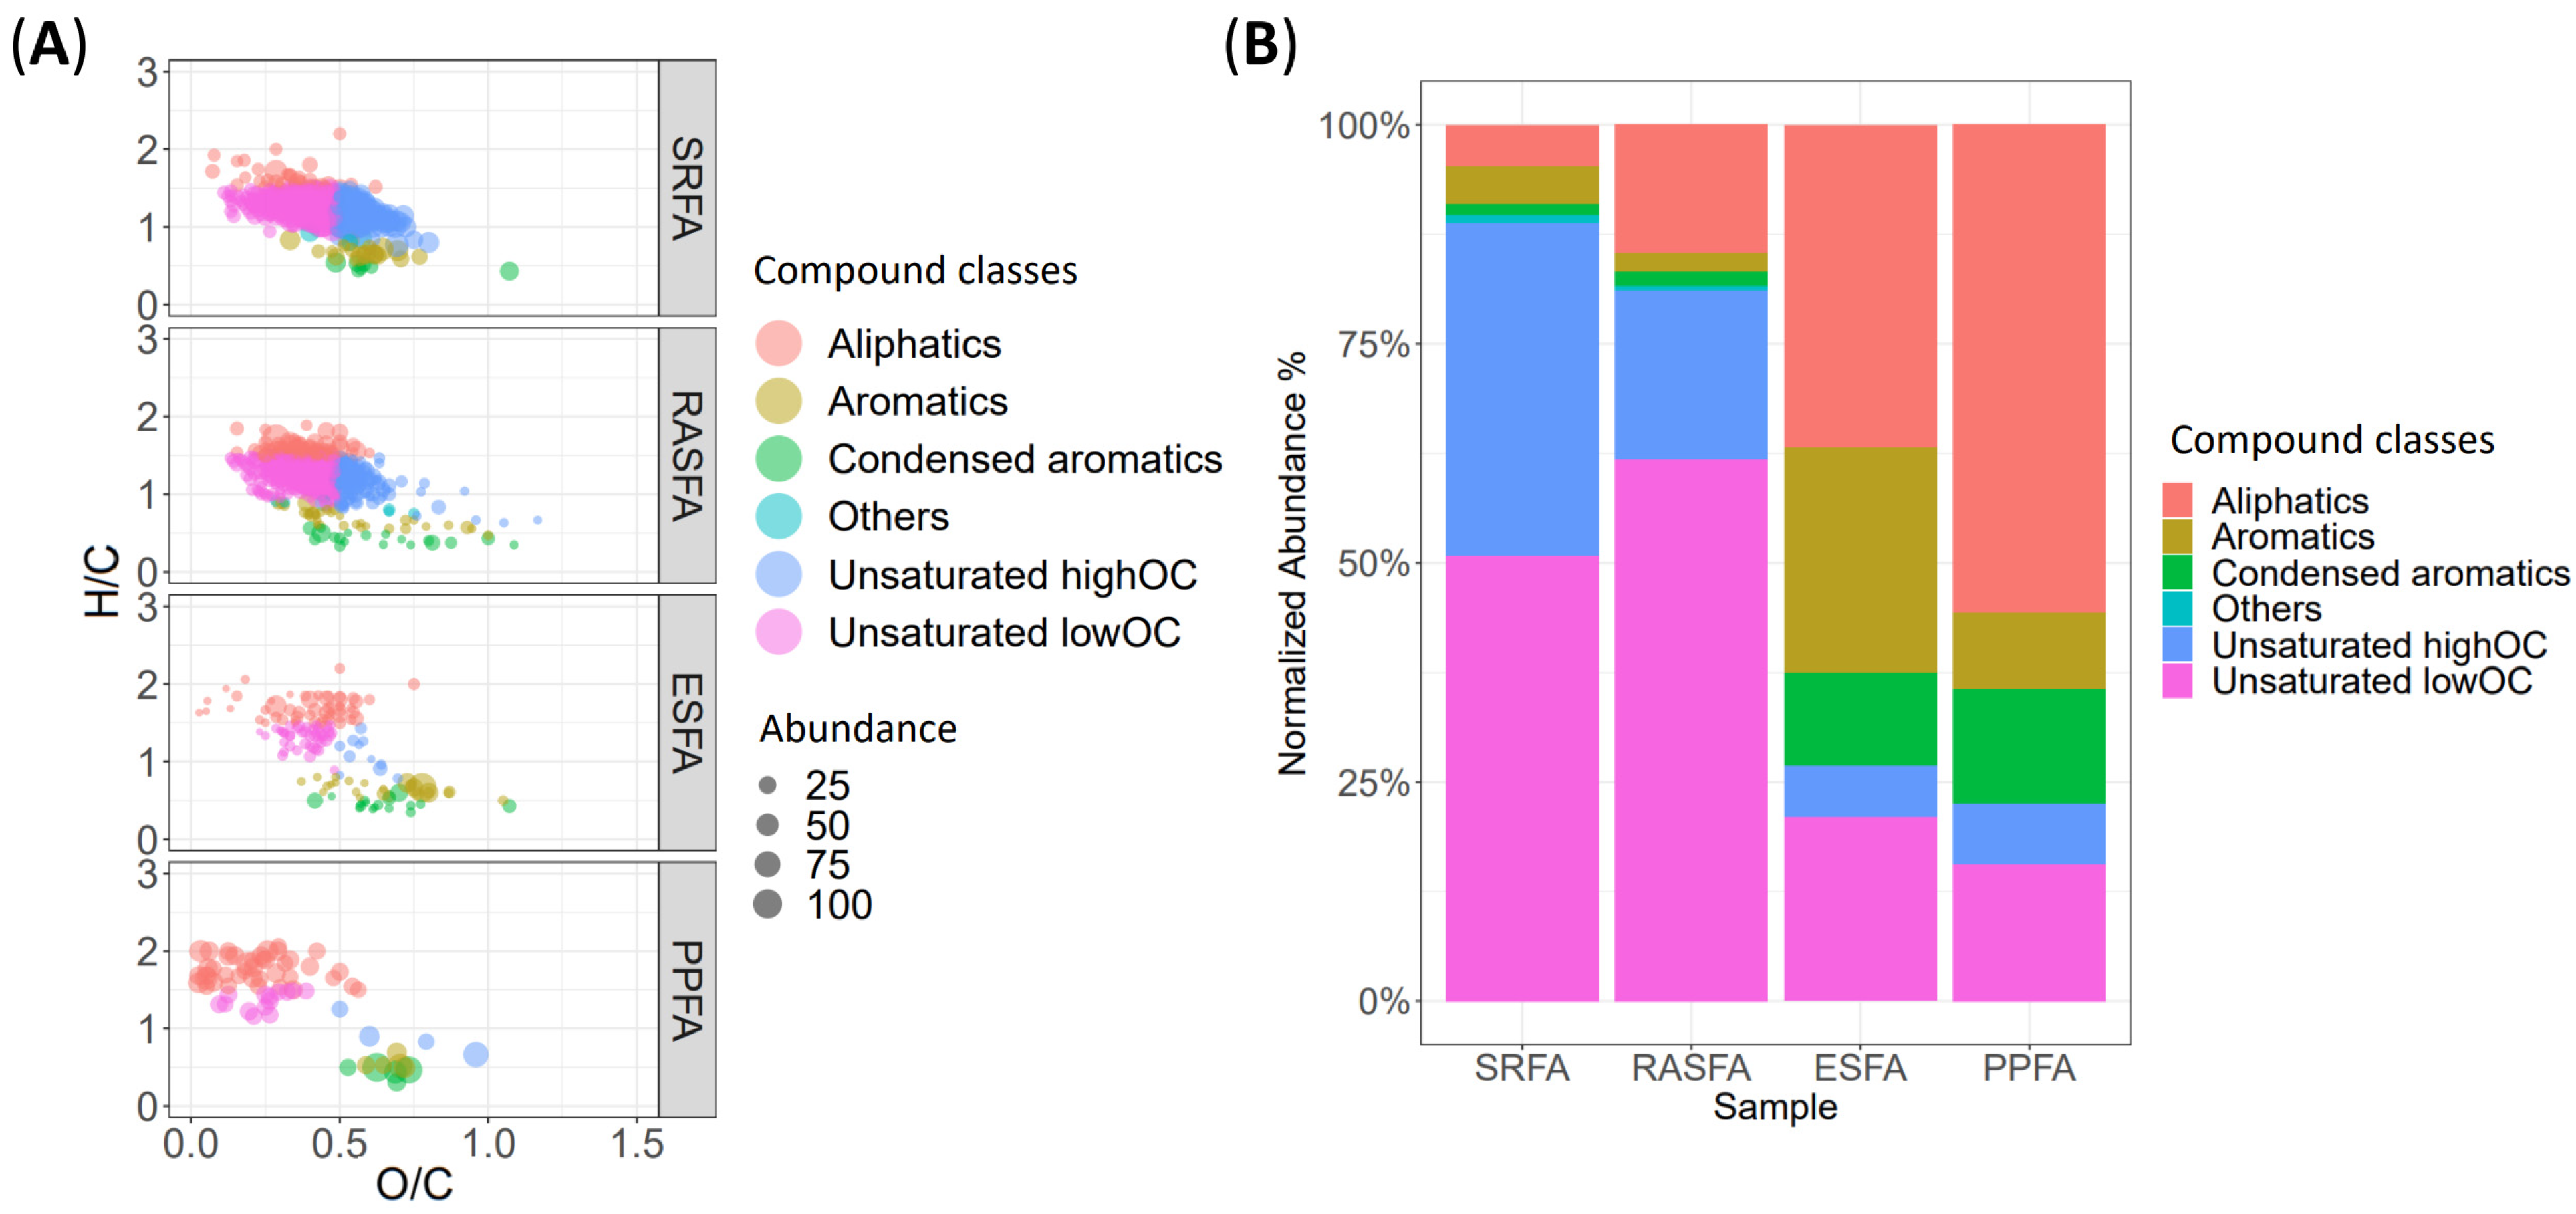
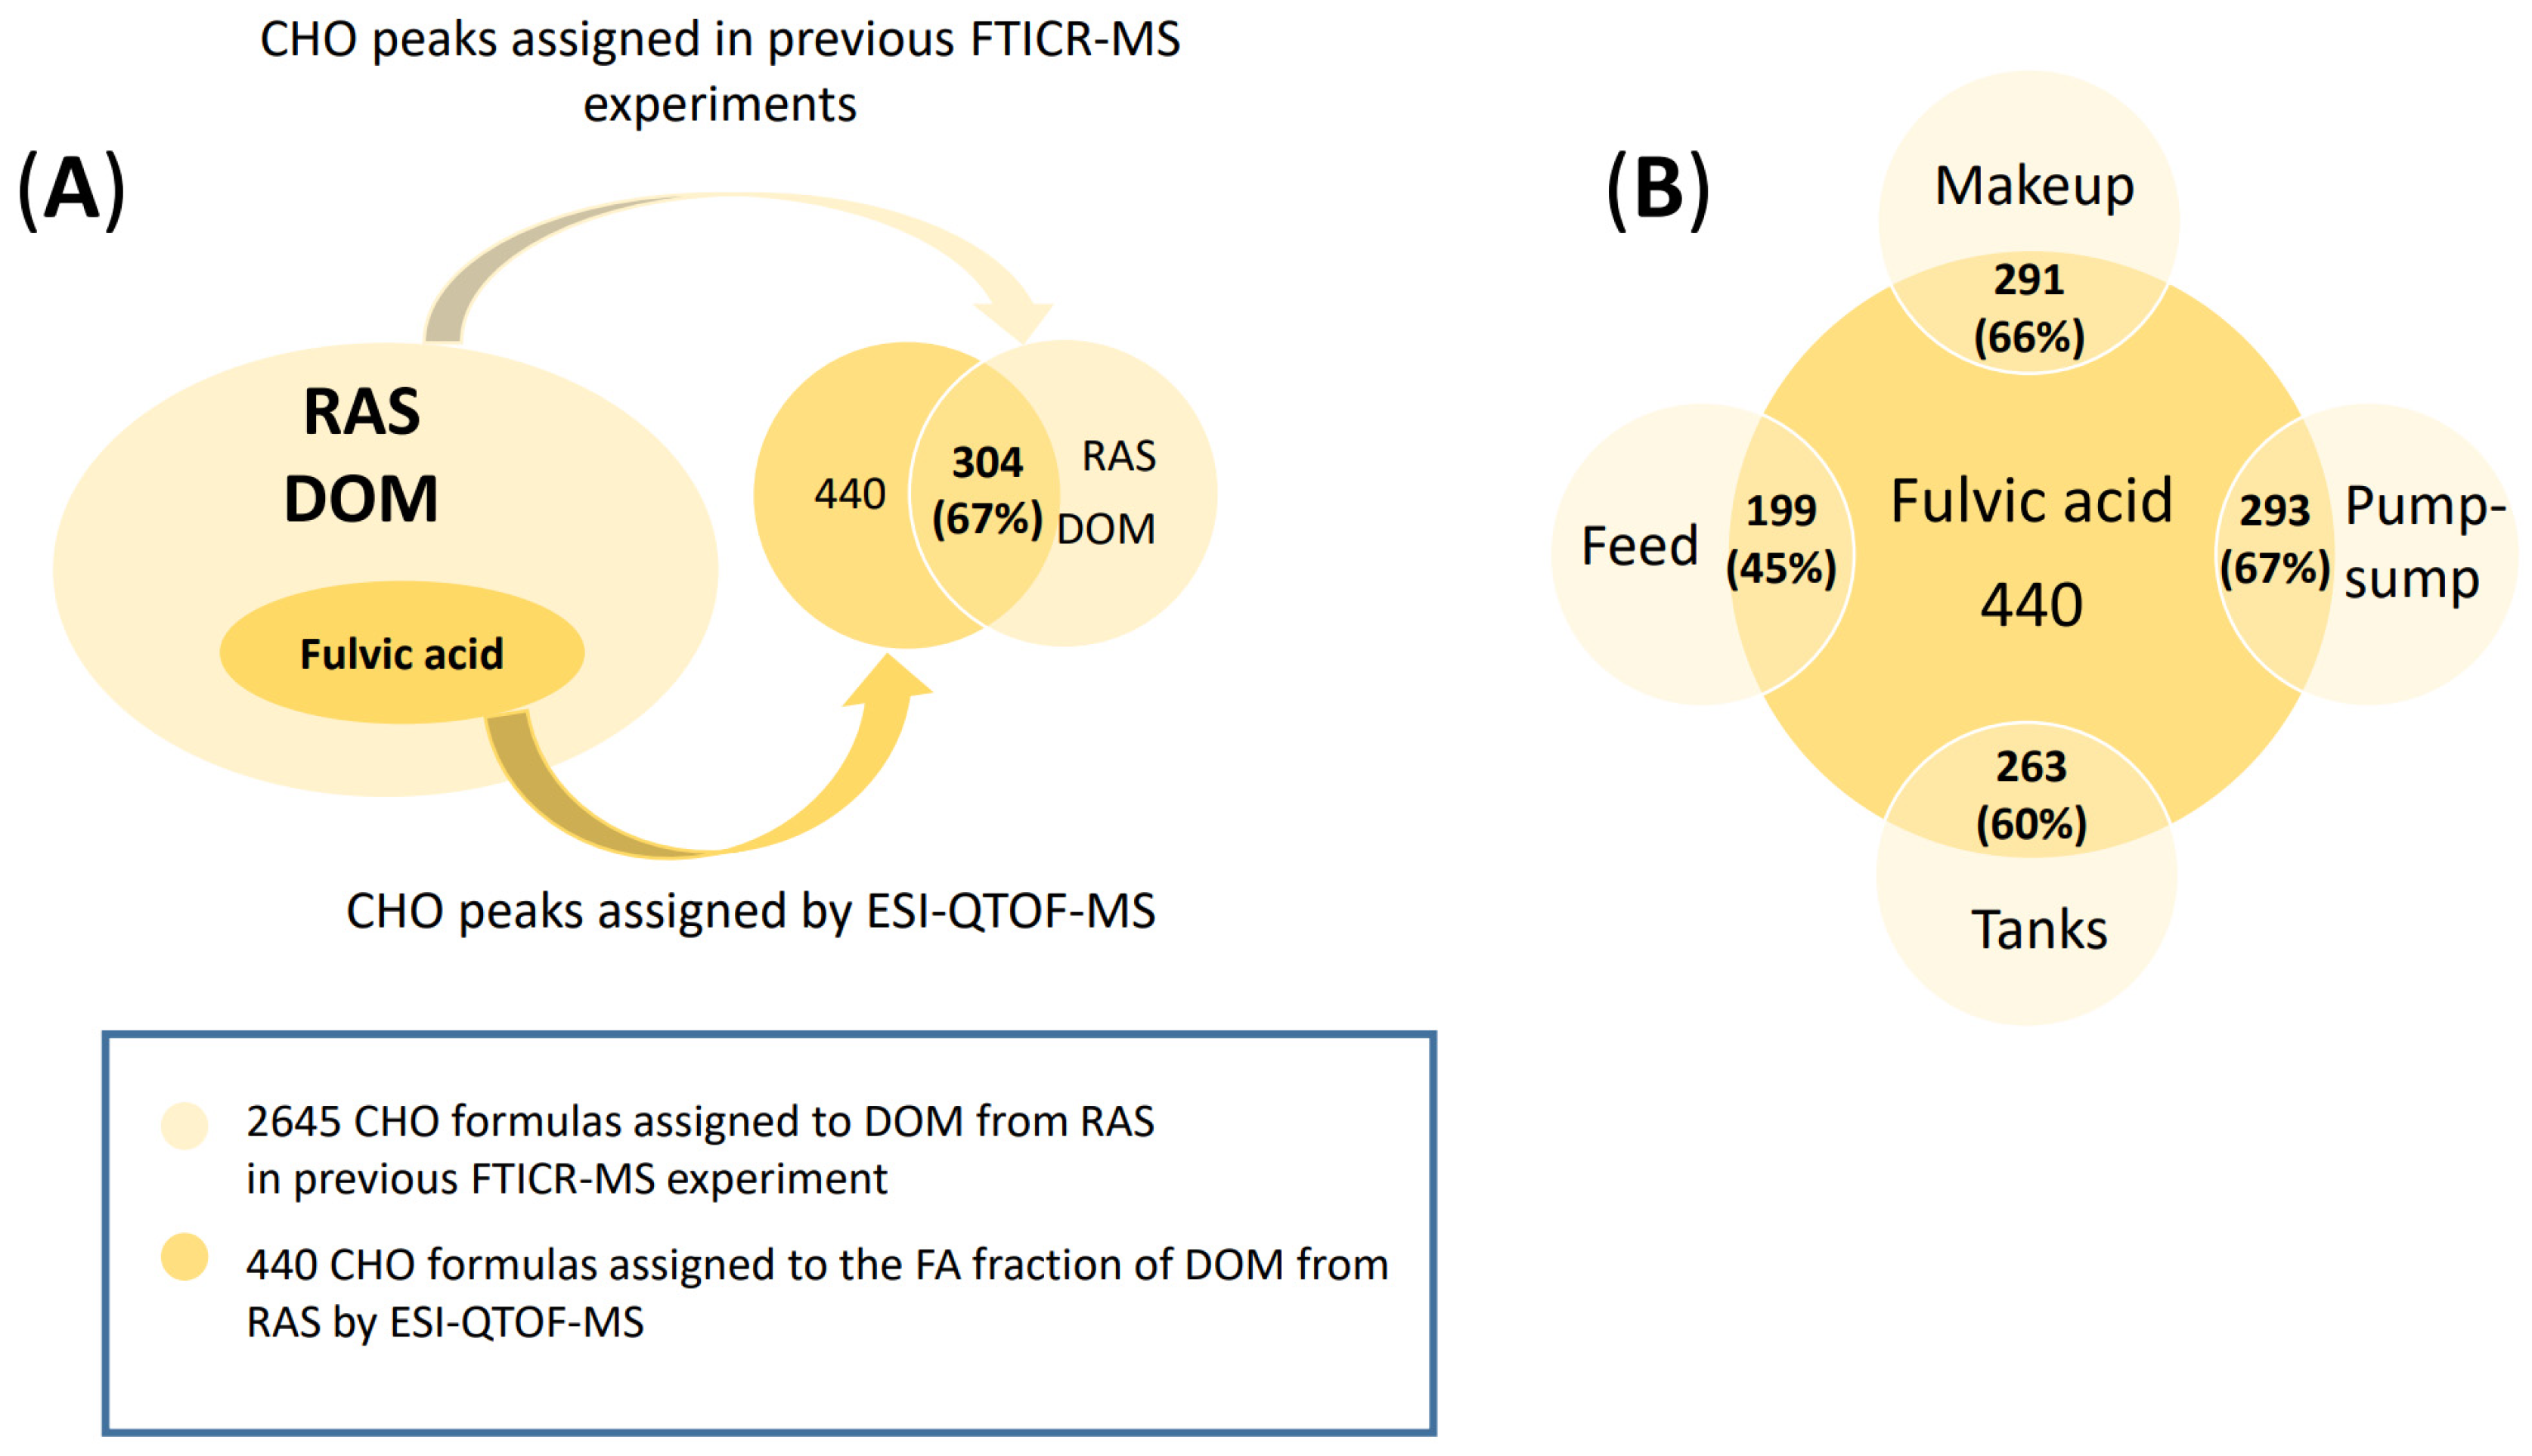
3.2. RASFA by QTOF-MS

The QTOF-MS spectrum of RASFA (Figure 1C) showed high intensity peaks in the m/z region between 250 to 500 m/z, which was in accordance with previous DOM samples collected from the waters of RAS [4]. From the thousands of m/z peaks in the RASFA spectra, a total of 440 CHO elemental compositions were assigned to the RASFA sample (Table 1, Figure 7A). To assess the accuracy of the QTOF-MS in the elemental composition assignment of RASFA samples, the 440 identified CHO formulas were represented against the 2645 CHO formulas assigned by a higher resolution technique (FTICR-MS) used in previous work [4] (Figure 7A). The Venn diagram showed that 67% of formulas identified in the FA fraction of DOM from RAS matched the list of CHO formulas obtained from the analysis of makeup, pump-sump, tank and feed DOM samples. However, 33% of the formulas assigned by QTOF-MS did not match the formulas obtained by previous experiments [4]. This deviation could be originated mainly from the extraction method used in this experiment, which was performed according to the recommendation of IHSS that included the DAX-8 resin. This resin is composed of poly(methyl methacrylate) that constitutes a strong hydrophobic matter to adsorb mainly FA and enriches higher proportions of aromatic compounds [64,65,66]. The functionalized styrene divinylbenzene polymer (PPL) sorbent used in previous experiments [4,5] adsorbs hydrophobic compounds and polar compounds such as functionalized aliphatics and nitrogen-containing compounds, which increases the range of extracted compounds [64,65,66]. It is well known that the properties of the sorbent used to extract DOM can induce changes in its composition, and, consequently, differences could arise in the RASFA extracts when compared to the DOM extracts from RAS [66,67,68]. The isolation of the specific FA fraction of DOM from RAS can also facilitate the ionization of some ions that can be suppressed when a more complex mixture such as DOM is introduced into the ion source of HRMS techniques. Moreover, differences in the RAS water treatment processes and HRMS methodologies [69,70] of the current and previous experiments (see Section 2.1, Aguilar-Alarcón et al., 2022) [4] could also be a major contributing factor in the deviation of the number of common elemental compositions. Still, the DAX-8 resin tailored to QTOF-MS was able to accurately characterize the hydrophobic FA fraction of DOM from RAS. In fact, this technique was able to suggest compositional sources of the FA fraction of DOM (Figure 7B), since the makeup and pump-sump RAS waters demonstrated the highest similarity in compositions to the hydrophobic RASFA sharing 66 and 67%, respectively, of elemental compositions. The mixture of makeup water comprised of freshwater water and seawater entered into the system at a 45% water exchange rate prior to the pump-sump and was mixed with the water after the water treatment process (pump-sump) before returning it to the tanks. The high similarities in the composition of RASFA with the makeup and pump-sump waters from RAS indicated that the isolated RASFA had freshwater and seawater origins.

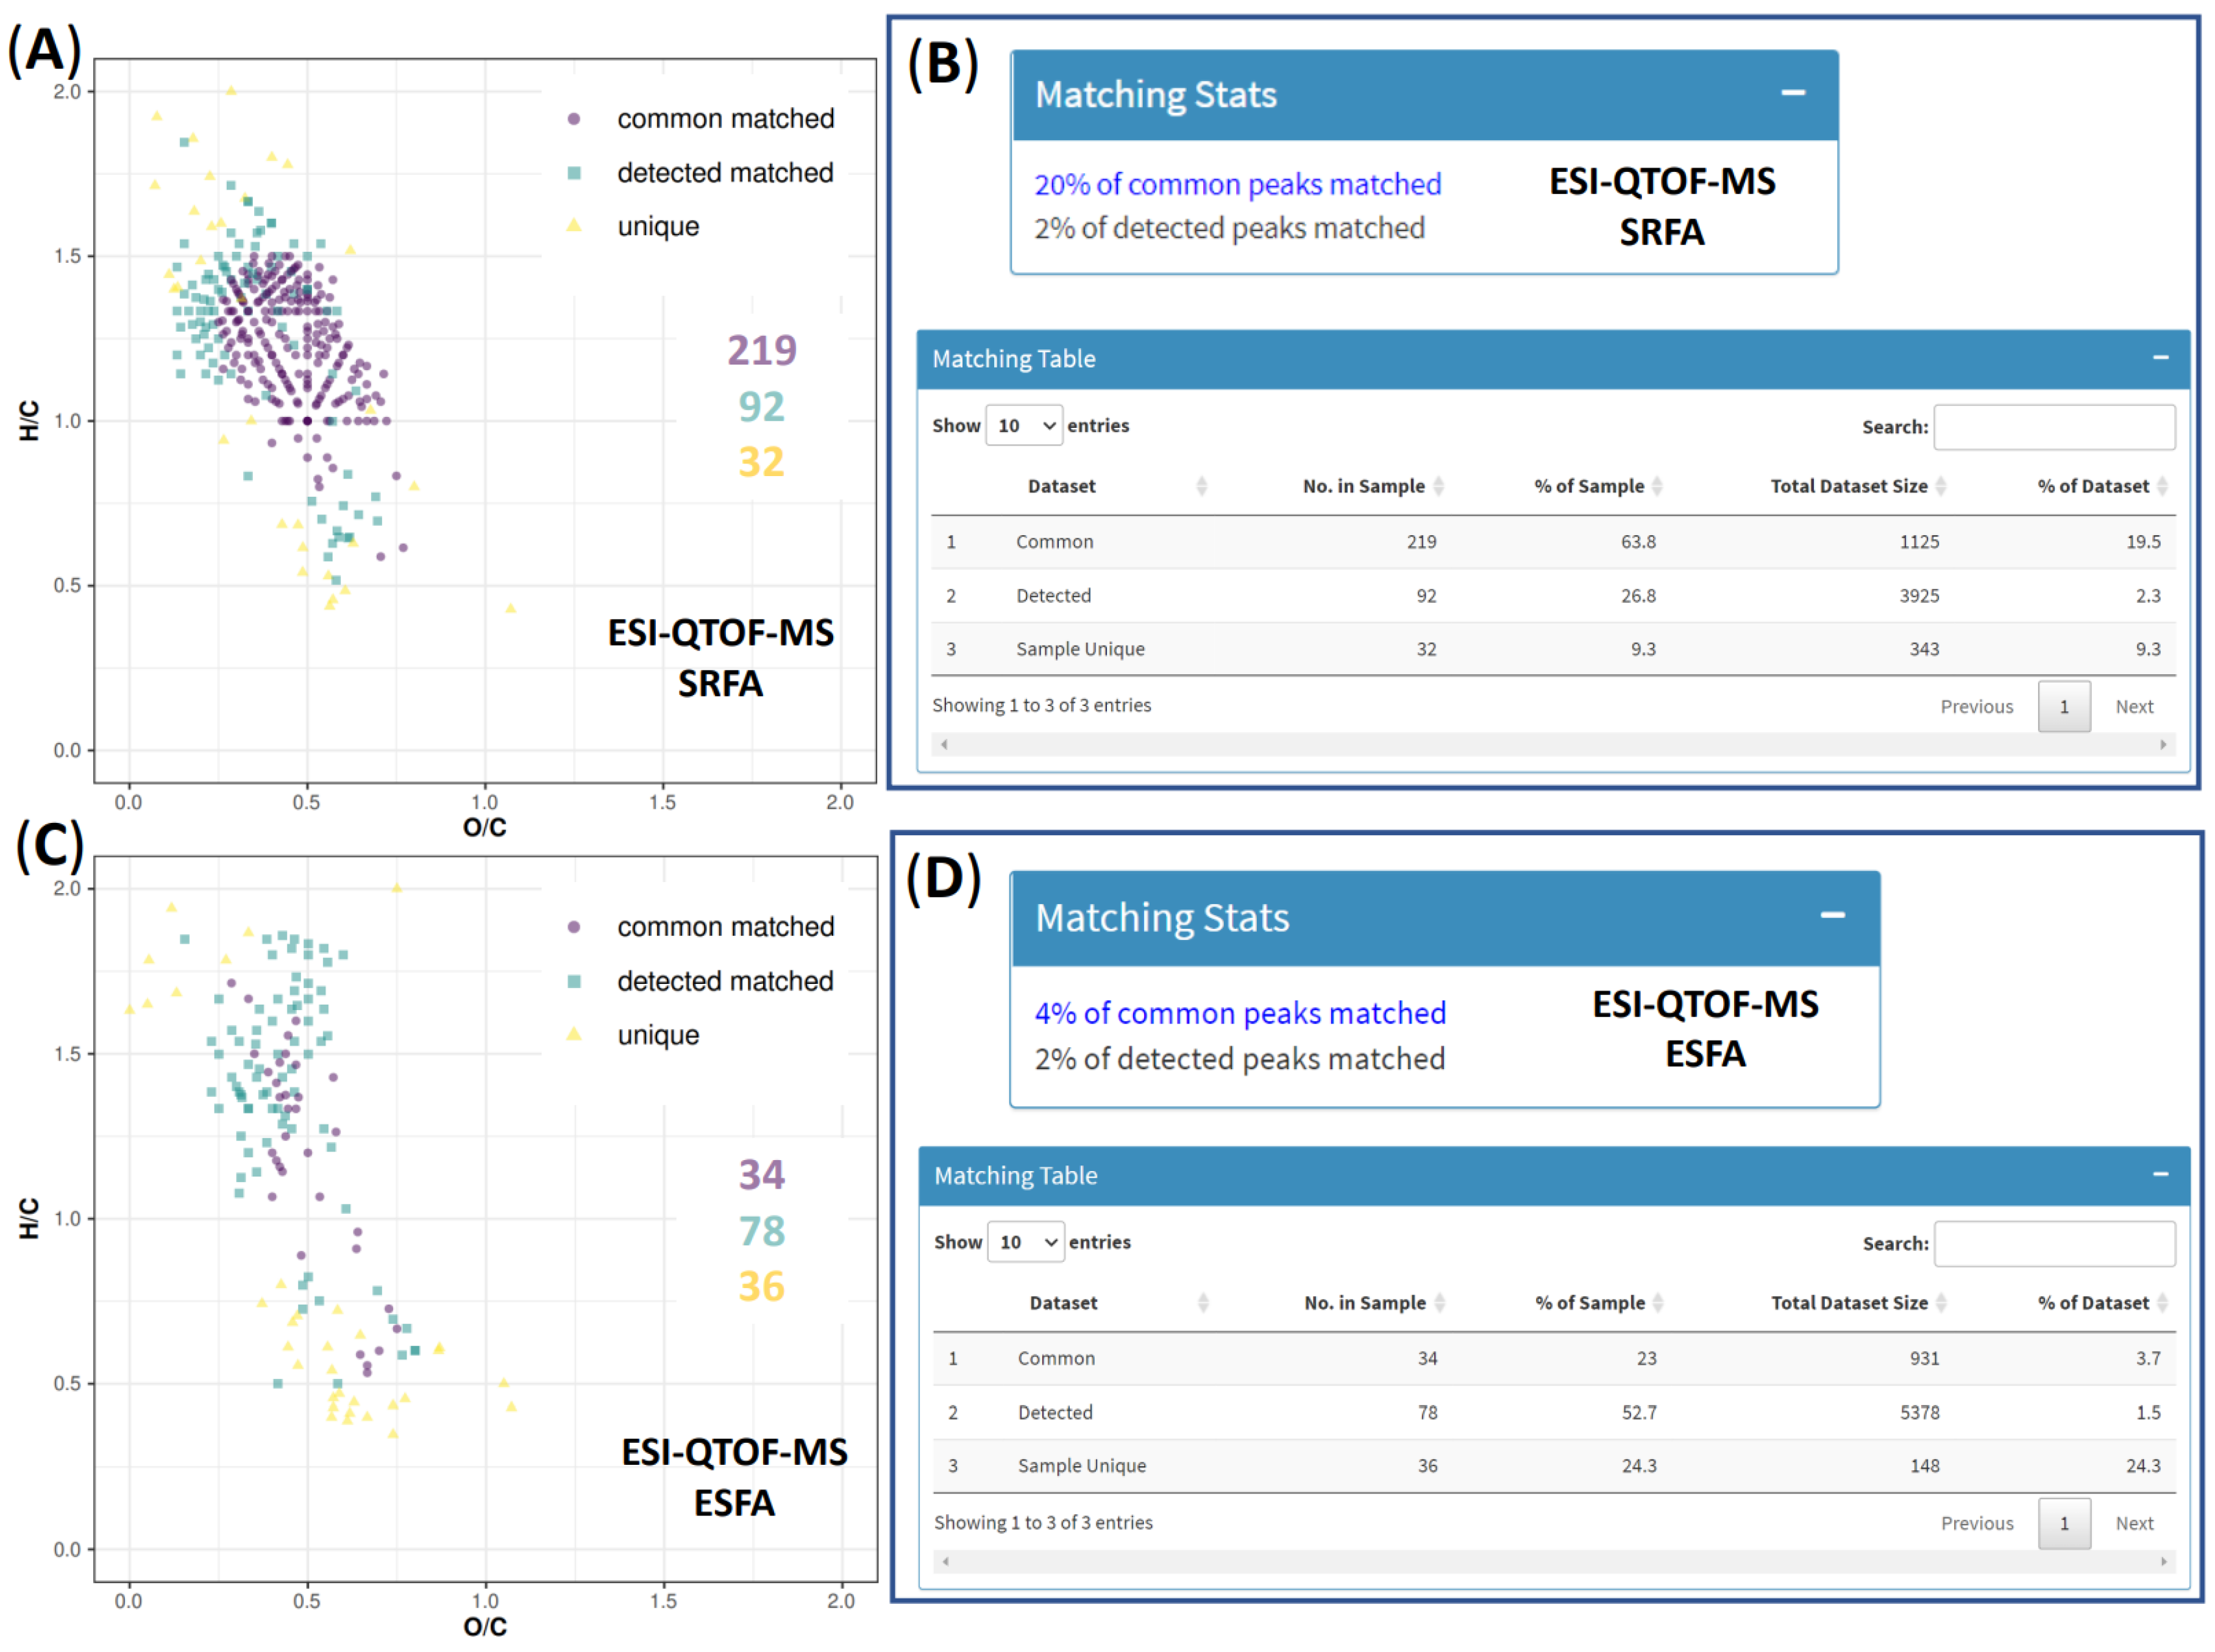
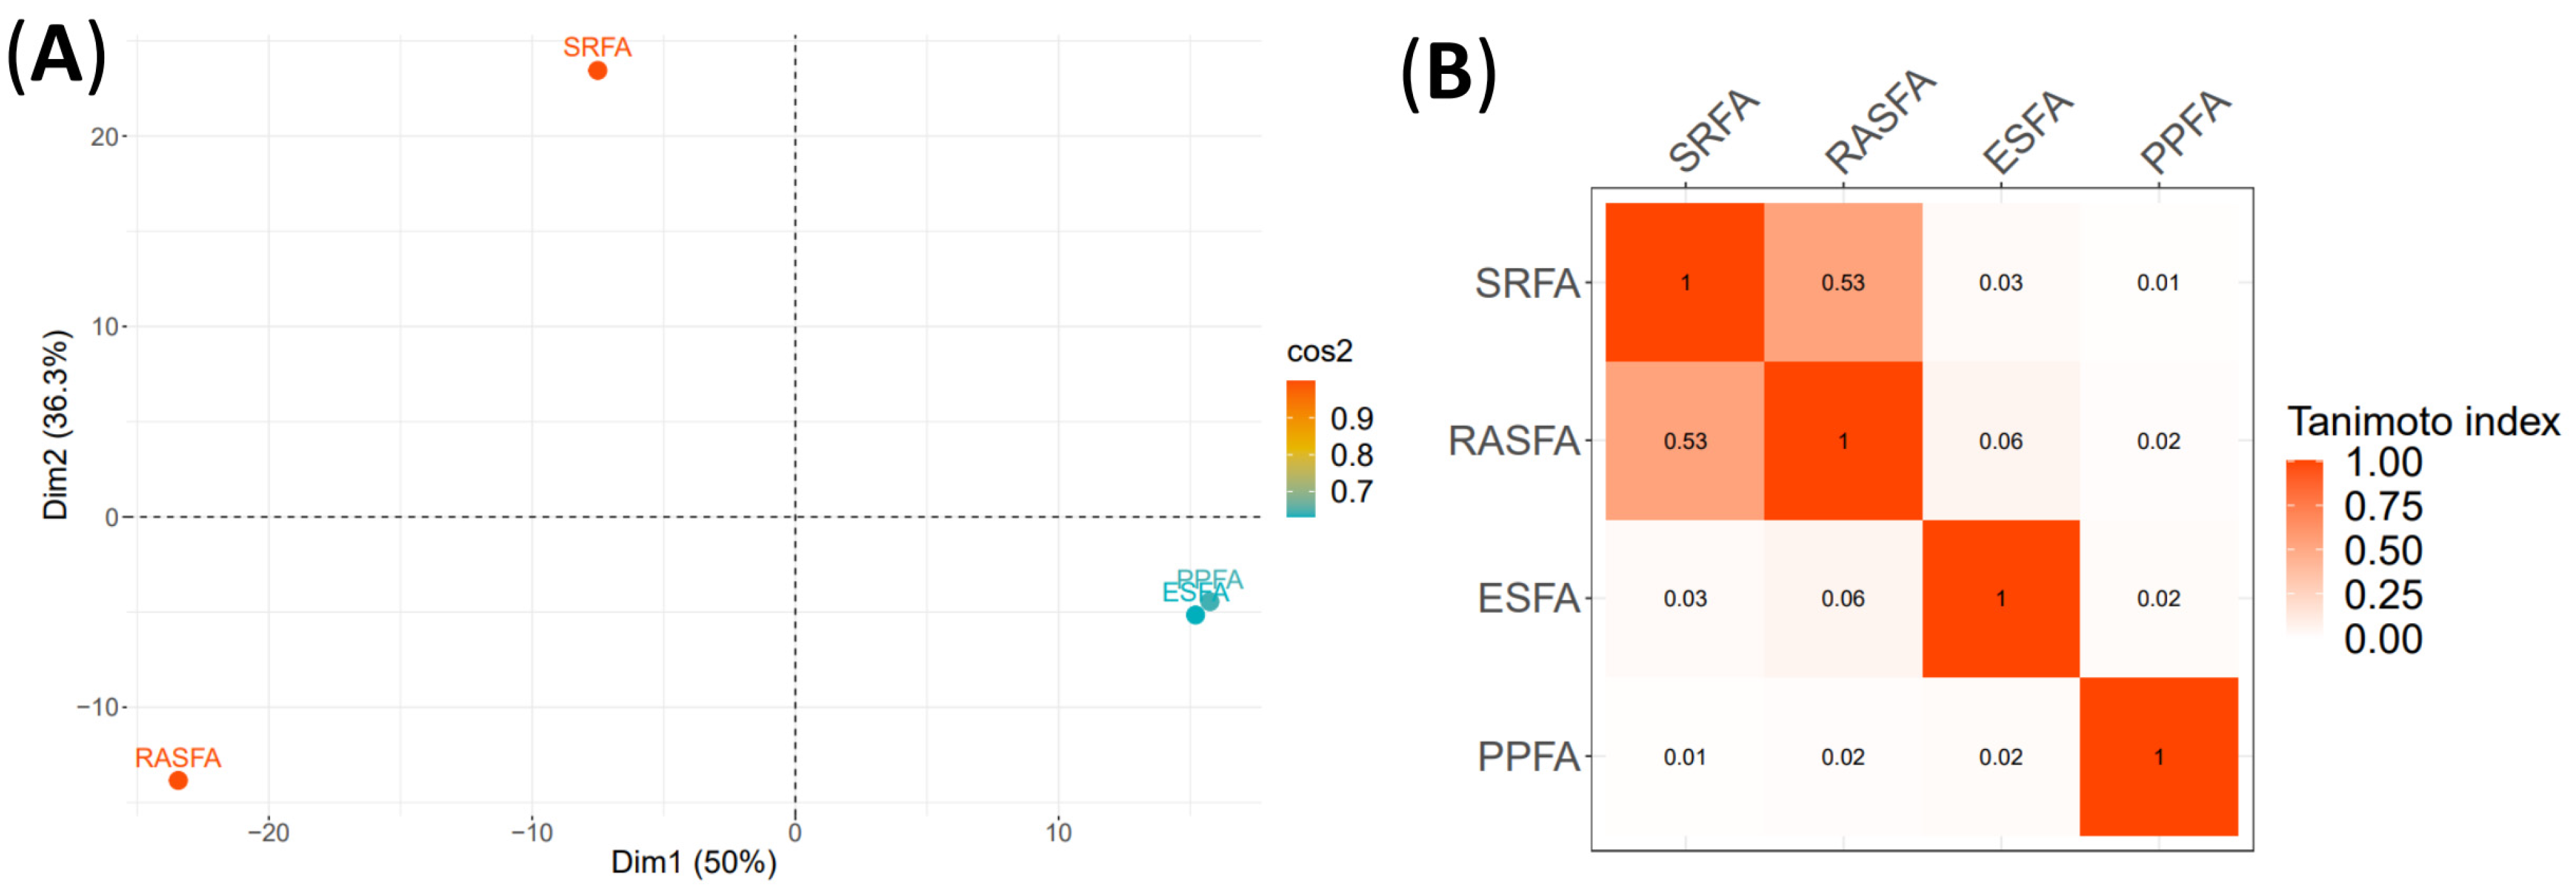
3.3. RASFA and FA Standards from IHSS by QTOF-MS

The QTOF-MS spectra of RASFA, SRFA and PPFA (Figure 2A,C,D) shared high intensity peaks in the m/z region ranging between 250 to 500 m/z. Although similar spectral patterns were observed between RASFA, SRFA and PPFA, the weight-averaged values of PPFA significantly differed from the other three FA samples (Table 1). PPFA showed the highest H/Cwa and m/zwa values and the lowest O/Cwa values. Moreover, only 69 elemental compositions were assigned to PPFA, which can be attributed to the high complexity of its FA mixture. On the contrary, the RASFA sample agreed with previous H/Cwa, O/Cwa and AIwa values obtained in the DOM from the makeup, tank and pump-sump waters of RAS by higher resolution techniques [4], which in turn were in line with the weight-averaged values obtained from a water sample matrix such as SRFA (Table 1). Compositional differences in the fulvic acid fraction of DOM from SRFA, PPFA, ESFA and RASFA samples were further studied using PCA and Tanimoto similarity tests (Figure 8). The cumulative score of the first two principal components was 86.3%. Separation in dimension 1 (Dim1) explained 50% of the total variance, where SRFA and RASFA were grouped indicating similarities in their FA composition. On the contrary, the ESFA and PPFA were grouped together, which was consistent with them being a mixture extracted from a soil matrix. Despite the distinct grouping between the samples extracted from water and soil matrices, their assigned elemental compositions alongside their abundances were considered in the Tanimoto similarity tests for correct comparison of different FA samples. By T-scores, the FA fraction of RAS shared a common pool of elemental compositions (index of 0.53) with the FA fraction of Suwannee River indicating that RASFA contained a set of terrestrial-derived organic compounds. The Suwannee River contains a high concentration of dissolved organic carbon (DOC) (25 to 75 mg/L) with a minimal input of anthropogenic contaminants and a low concentration of inorganic salts. SRFA standards are regarded as terrestrial analogues since they have a higher fraction of terrestrial-derived organic matter than other aquatic systems with a greater fraction of microbial-derived organic matter [32,71]. The high similarity (index 0.53) between the SRFA and RASFA samples constitutes a novel finding for aquaculture, particularly in RAS. Obtaining a reference standard that mimics a portion of the RASFA can be advantageous for monitoring the changes in the FA fraction of DOM in RAS when exposed to different water treatment processes before their application in large-scale RAS projects. On the contrary, the RASFA sample differed significantly from the ESFA and PPFA soil samples (index 0.06 and 0.02, respectively), which can be attributed to the poor extraction of the FA compounds from the soil samples and their low ionization efficiency by ESI under negative mode [72,73]. It is noteworthy that the FA fraction of DOM from RAS and the IHSS reference standards can be assigned accurately at low resolution (35,000 FWHM), even though no separation techniques are tailored to the QTOF-MS.
The van Krevelen and the bar chart diagrams confirmed the similarity between the water SRFA and RASFA samples (Figure 6). The sum-normalized abundances in percentages of the five compound classes found in SRFA and RASFA samples followed the same pattern: unsaturated lowOC (50.80 to 61.73%) > unsaturated highOC (19.28 to 37.95%) > aliphatics (4.77 to 14.65%) > aromatics (2.11 to 4.35%) and condensed aromatics (1.25 to 1.62%), demonstrating the similarity in the FA fraction of their DOM. By contrast, the soil ESFA and PPFA samples differed significantly in composition from the water SRFA and RASFA samples. The aliphatic class of compounds (36.77 to 55.74%) accounted for the highest abundance in ESFA and PPFA samples. However, aromatics (25.73%) and unsaturated lowOC (21.00%) were dominant in ESFA when compared with PPFA, which was richer in the unsaturated lowOC (15.66%) and condensed aromatics (13.06%) classes of compounds. These results not only indicate that the water SRFA and RASFA samples differed from the soil ESFA and PPFA samples, but also that the type of soil can induce changes in the composition of the FA fraction of DOM. This level of detail directly indicates the applicability of the QTOF-MS technique to monitor changes between the hydrophobic FA fraction of DOM from different sample matrices, sources and compositions in RAS.

4. Conclusions

The non-targeted approach using QTOF-MS was proven to be an accurate monitoring technique for characterizing the molecular fingerprint of the fulvic acid fraction of DOM from RAS and the currently available FA reference standards from the IHSS (Suwannee River, Elliott soil and Pahokee Peat). The SRFA and ESFA IHSS standards were used to assess the QTOF-MS technique by uploading their data to an InterLabStudy platform with data sets obtained from the analysis of SRFA, ESFA, SRNOM and PLFA IHSS standards by 17 HRMS instruments including FTICR-MS and Orbitrap-MS. From the 343 and 148 elemental compositions identified from SRFA and ESFA, respectively, 311 (90%) and 112 (76%) matched the list of elemental compositions provided by the InterLabStudy proving the power of QTOF-MS in the accurate characterization of FA from water and soil origins. Although the weight-averaged values of SRFA and ESFA samples analyzed by QTOF-MS varied significantly from the values obtained by the InterLabStudy platform, the QTOF-MS data revealed the same findings when SRFA and ESFA were compared in terms of calculated metrics of intensity-weighted average indices (H/C, O/C, m/z and AImod) and proportion of compound classes. These results promote the use of QTOF-MS as a potential alternative to FTICR-MS and Orbitrap-MS for the comparison of different FA samples in terms of metric values and class of compounds. When the QTOF-MS technique was applied to RASFA, 440 elemental compositions were identified. The RASFA was similar in composition to the IHSS SRFA water sample and differed from the composition of soil IHSS samples such as ESFA and PPFA. Mainly unsaturated lowOC and highOC classes of compounds composed RASFA and SRFA, while ESFA and PPFA were rich in aliphatics. The QTOF-MS data from RASFA matched with a 67% accuracy a data set comprised of elemental compositions obtained by the analysis of DOM samples isolated in the same RAS facility (pump-sump, makeup, tank and feed samples) using the 7T FTICR-MS technique. RASFA was found to have a higher fraction of terrestrial-derived organic matter (T-score 0.53; SRFA and RASFA) with marine and freshwater origins (66% common formulas RASFA with makeup DOM analyzed by FTICR-MS). The similar compositions found between SRFA and RASFA constitute a new finding in aquaculture, especially in RAS so that SRFA from IHSS can be used in small-scale aquaculture experiments to monitor changes in the hydrophobic fraction of DOM. The level of detail provided by the QTOF-MS technique can help RAS operators to better manage the water quality of RAS by measuring the FA quality under different water treatment processes for optimal production of healthy fish.

Author Contributions

Conceptualization, formal analysis, data curation, investigation, visualization, writing—original draft preparation, P.A.-A.; methodology and software, P.A.-A. and S.V.G.; validation, P.A.-A. and A.G.A.; resources, S.V.G., A.G.A. and Ø.M.; supervision, writing—review and editing, A.G.A., Ø.M. and P.A.-A.; project administration, A.G.A., Ø.M. and P.A.-A.; funding acquisition, A.G.A. and Ø.M. All authors have read and agreed to the published version of the manuscript.

Funding

This research was part of CtrlAQUA SFI, Center for research-based innovation, funded by the Research Council of Norway and the partners of the center (project # 237856/O30).

Institutional Review Board Statement

Not applicable.

Informed Consent Statement

Not applicable.

Data Availability Statement

Not applicable.

Acknowledgments

The author would like to thank Behzad Rahnama for facilitating the sampling and experimental set-up of the RAS at Nofima Sunndalsøra and Åsa Maria Espmark for transferring the samples to the laboratory.

Conflicts of Interest

The authors declare no conflict of interest.

References

  1. Tidwell, J.H.; Allan, G.L. Fish as food: Aquaculture’s contribution. EMBO Rep. 2001, 2, 958–963. [Google Scholar] [CrossRef] [PubMed]
  2. Lem, A.; Bjørndal, T.; Lappo, A. Economic Analysis of Supply and Demand for Food up to 2030. Special Focus on Fish and Fishery Products; FAO: Rome, Italy, 2014; Volume 1089, ISBN 9789251084007. [Google Scholar]
  3. Ebeling, J.M.; Timmons, M.B. Recirculating Aquaculture Systems. In Aquaculture Production Systems; Cayuga Aqua Ventures: Ithaca, NY, USA, 2007. [Google Scholar]
  4. Aguilar-Alarcón, P.; Zherebker, A.; Rubekina, A.; Shirshin, E.; Simonsen, M.A.; Kolarevic, J.; Lazado, C.C.; Nikolaev, E.N.; Asimakopoulos, A.G.; Mikkelsen, Ø. Impact of ozone treatment on dissolved organic matter in land-based recirculating aquaculture systems studied by Fourier transform ion cyclotron resonance mass spectrometry. Sci. Total Environ. 2022, 843, 157009. [Google Scholar] [CrossRef] [PubMed]
  5. Aguilar-Alarcón, P.; Gonzalez, S.V.; Simonsen, M.A.; Borrero-santiago, A.R.; Sanchís, J.; Meriac, A.; Kolarevic, J.; Asimakopoulos, A.G.; Mikkelsen, Ø. Characterizing changes of dissolved organic matter composition with the use of distinct feeds in recirculating aquaculture systems via high-resolution mass spectrometry. Sci. Total Environ. 2020, 749, 142326. [Google Scholar] [CrossRef] [PubMed]
  6. Badiola, M.; Mendiola, D.; Bostock, J. Recirculating Aquaculture Systems (RAS) analysis: Main issues on management and future challenges. Aquac. Eng. 2012, 51, 26–35. [Google Scholar] [CrossRef]
  7. Chen, S.; Timmons, M.B.; Aneshansley, D.J.; Bisogni, J.J. Suspended solids characteristics from recirculating aquacultural systems and design implications. Aquaculture 1993, 112, 143–155. [Google Scholar] [CrossRef]
  8. Cripps, S.J.; Bergheim, A. Solids management and removal for intensive land-based aquaculture production systems. Aquac. Eng. 2000, 22, 33–56. [Google Scholar] [CrossRef]
  9. Yamin, G.; Borisover, M.; Cohen, E.; van Rijn, J. Accumulation of humic-like and proteinaceous dissolved organic matter in zero-discharge aquaculture systems as revealed by fluorescence EEM spectroscopy. Water Res. 2017, 108, 412–421. [Google Scholar] [CrossRef]
  10. Hambly, A.C.; Arvin, E.; Pedersen, L.F.; Pedersen, P.B.; Seredyńska-Sobecka, B.; Stedmon, C.A. Characterising organic matter in recirculating aquaculture systems with fluorescence EEM spectroscopy. Water Res. 2015, 83, 112–120. [Google Scholar] [CrossRef]
  11. Malcolm, R.L. The uniqueness of humic substances in each of soil, stream and marine environments. Anal. Chim. Acta 1990, 232, 19–30. [Google Scholar] [CrossRef]
  12. Christman, R.F.; Ghassemi, M. Chemical Nature of Organic Color in Water. J.-Am. Water Work. Assoc. 1966, 58, 723–741. [Google Scholar] [CrossRef]
  13. Mostofa, K.M.G.; Liu, C.-Q.; Mottaleb, M.A.; Wan, G.; Ogawa, H.; Vione, D.; Yoshioka, T.; Wu, F. Dissolved organic matter in natural waters. In Photobiogeochemistry of Organic Matter; Springer: Berlin/Heidelberg, Germany, 2013; pp. 1–137. [Google Scholar] [CrossRef]
  14. Oliver, B.G.; Thurman, E.M.; Malcolm, R.L. The contribution of humic substances to the acidity of colored natural waters. Geochim. Cosmochim. Acta 1983, 47, 2031–2035. [Google Scholar] [CrossRef]
  15. Yu, M.J.; Kim, Y.H.; Han, I.; Kim, H.C. Characterization of Humic Substances Isolated from Han River Water and Change in the Structural and Chemical Characteristics by Ozonation. Environ. Technol. 2010, 26, 1033–1042. [Google Scholar] [CrossRef] [PubMed]
  16. Abbt-Braun, G.; Lankes, U.; Frimmel, F.H. Structural characterization of aquatic humic substances—The need for a multiple method approach. Aquat. Sci. 2004, 66, 151–170. [Google Scholar] [CrossRef]
  17. Kulikova, N.A.; Perminova, I.V. Interactions between Humic Substances and Microorganisms and Their Implications for Nature-like Bioremediation Technologies. Molecules 2021, 26, 2706. [Google Scholar] [CrossRef] [PubMed]
  18. Thurman, E.M. Organic Geochemistry of Natural Waters, 2nd ed.; Springer Science & Business Media: Berlin/Heidelberg, Germany, 2012; ISBN 9789401087520. [Google Scholar]
  19. Rodríguez-Vidal, F.J.; Núñez, L.A. Characterization of aquatic humic substances. Water Environ. J. 2011, 25, 163–170. [Google Scholar] [CrossRef]
  20. Koparal, A.; Yildiz, Y.; Keskinler, B.; Demircioglu, N. Effect of initial pH on the removal of humic substances from wastewater by electrocoagulation. Sep. Purif. Technol. 2008, 59, 175–182. [Google Scholar] [CrossRef]
  21. Réveillé, V.; Mansuy, L.; Émilie Jardé, A.; Garnier-Sillam, É. Characterisation of sewage sludge-derived organic matter: Lipids and humic acids. Org. Geochem. 2003, 34, 615–627. [Google Scholar] [CrossRef]
  22. Yang, X.; De Buyck, P.-J.; Zhang, R.; Manhaeghe, D.; Wang, H.; Chen, L.; Zhao, Y.; Demeestere, K.; Van Hulle, S.W. Van Enhanced removal of refractory humic- and fulvic-like organics from biotreated landfill leachate by ozonation in packed bubble columns. Sci. Total Environ. 2022, 807, 150762. [Google Scholar] [CrossRef] [PubMed]
  23. Guo, X.; Liu, H.; Wu, S. Humic substances developed during organic waste composting: Formation mechanisms, structural properties, and agronomic functions. Sci. Total Environ. 2019, 662, 501–510. [Google Scholar] [CrossRef]
  24. Kelleher, B.P.; Simpson, A.J. Humic Substances in Soils: Are They Really Chemically Distinct? Environ. Sci. Technol. 2006, 40, 4605–4611. [Google Scholar] [CrossRef]
  25. Graber, E.R.; Rudich, Y.; Dagan, B. Atmospheric HULIS: How humic-like are they? A comprehensive and critical review. Atmos. Chem. Phys. 2006, 6, 729–753. [Google Scholar] [CrossRef]
  26. Maccarthy, P. The principles of humic substances: An introduction to the first principle. Spec. Publ.-R. Soc. Chem. 2001, 273, 19–30. [Google Scholar] [CrossRef]
  27. Christensen, J.M.; Rusch, K.A.; Malone, R.F. Development of a model for describing accumulation of color and subsequent destruction by ozone in a freshwater recirculating aquaculture system. J. World Aquac. Soc. 2000, 31, 167–174. [Google Scholar] [CrossRef]
  28. Averett, R.C.; Leenheer, J.A.; McKnight, D.M.; Thorn, K.A. Humic Substances in the Suwannee River, Georgia: Interactions, Properties, and Proposed Structures; US Government Printing Office: Washington, DC, USA, 1994.
  29. Hirayama, K.; Mizuma, H.; Mizue, Y. The accumulation of dissolved organic substances in closed recirculation culture systems. Aquac. Eng. 1988, 7, 73–87. [Google Scholar] [CrossRef]
  30. Mladenov, N.; Huntsman-mapila, P.; Wolski, P.; Masamba, W.R.L.; Mcknight, D.M. Dissolved organic matter accumulation, reactivity, and redox state in ground water of a recharge wetland. Wetlands 2008, 28, 747–759. [Google Scholar] [CrossRef]
  31. Porcal, P.; Koprivnjak, J.; Molot, L.A.; Dillon, P.J. Humic substances—part 7: The biogeochemistry of dissolved organic carbon and its interactions with climate change. Environ. Sci. Pollut. Res. 2009, 16, 714–726. [Google Scholar] [CrossRef]
  32. D’Andrilli, J.; Foreman, C.M.; Marshall, A.G.; McKnight, D.M. Characterization of IHSS Pony Lake fulvic acid dissolved organic matter by electrospray ionization Fourier transform ion cyclotron resonance mass spectrometry and fluorescence spectroscopy. Org. Geochem. 2013, 65, 19–28. [Google Scholar] [CrossRef]
  33. Mawhinney, D.B.; Rosario-ortiz, F.L.; Baik, S.; Vanderford, B.J.; Snyder, S.A. Characterization of fulvic acids by liquid chromatography-quadrupole time-of-flight mass spectrometry. J. Chromatogr. A 2009, 1216, 1319–1324. [Google Scholar] [CrossRef]
  34. Plancque, G.; Toulhoat, P.; Amekraz, B.; Moulin, C. Molecular structure of fulvic acids by electrospray with quadrupole time-of-flight mass spectrometry. Rapid Commun. Mass Spectrom. 2001, 15, 827–835. [Google Scholar] [CrossRef]
  35. Reemtsma, T.; These, A. Comparative Investigation of Low-Molecular-Weight Fulvic Acids of Different Origin by SEC-Q-TOF-MS: New Insights into Structure and Formation. Environ. Sci. Technol. 2005, 39, 3507–3512. [Google Scholar] [CrossRef]
  36. These, A.; Winkler, M.; Thomas, C.; Reemtsma, T. Determination of molecular formulas and structural regularities of low molecular weight fulvic acids by size-exclusion chromatography with electrospray ionization quadrupole time-of-flight mass spectrometry. Rapid Commun. Mass Spectrom. 2004, 18, 1777–1786. [Google Scholar] [CrossRef] [PubMed]
  37. These, A.; Reemtsma, T. Structure-Dependent Reactivity of Low Molecular Weight Fulvic Acid Molecules during Ozonation. Environ. Sci. Technol. 2005, 39, 8382–8387. [Google Scholar] [CrossRef] [PubMed]
  38. Patriarca, C.; Bergquist, J.; Sjöberg, P.J.R.; Tranvik, L.; Hawkes, J.A. Online HPLC-ESI-HRMS Method for the Analysis and Comparison of Different Dissolved Organic Matter Samples. Environ. Sci. Technol. 2018, 52, 2091–2099. [Google Scholar] [CrossRef]
  39. Patriarca, C.; Balderrama, A.; Može, M.; Sjöberg, P.J.R.; Bergquist, J.; Tranvik, L.J.; Hawkes, J.A. Investigating the Ionization of Dissolved Organic Matter by Electrospray. Anal. Chem. 2020, 92, 14210–14218. [Google Scholar] [CrossRef]
  40. Patriarca, C.; Hawkes, J.A. High Molecular Weight Spectral Interferences in Mass Spectra of Dissolved Organic Matter. J. Am. Soc. Mass Spectrom. 2021, 32, 394–397. [Google Scholar] [CrossRef] [PubMed]
  41. Capley, E.N.; Tipton, J.D.; Marshall, A.G.; Stenson, A.C. Chromatographic reduction of isobaric and isomeric complexity of fulvic acids to enable multistage tandem mass spectral characterization. Anal. Chem. 2010, 82, 8194–8202. [Google Scholar] [CrossRef] [PubMed]
  42. Ali, I.; Al-Othman, Z.A.; Nagae, N.; Gaitonde, V.D.; Dutta, K.K. Recent trends in ultra-fast HPLC: New generation superficially porous silica columns. J. Sep. Sci. 2012, 35, 3235–3249. [Google Scholar] [CrossRef]
  43. Al-Othman, Z.A.; Al-Warthan, A.; Ali, I. Advances in enantiomeric resolution on monolithic chiral stationary phases in liquid chromatography and electrochromatography. J. Sep. Sci. 2014, 37, 1033–1057. [Google Scholar] [CrossRef]
  44. Aboul-Enein, H.Y.; Ali, I. Comparison of the chiral resolution of econazole, miconazole, and sulconazole by HPLC using normal-phase amylose CSPs. Anal. Bioanal. Chem. 2001, 370, 951–955. [Google Scholar] [CrossRef]
  45. Qin, S.; Xu, C.; Guo, F.; Qi, J.; Xu, L.; Xu, Y.; Song, F. Molecular Signatures of Three Fulvic Acid Standard Samples as Revealed by Electrospray Ionization Fourier Transform Ion Cyclotron Resonance Mass Spectrometry. Energy Technol. Environ. Sci. Mol. 2019, 4, 13940–13946. [Google Scholar] [CrossRef]
  46. Hawkes, J.A.; Andrilli, J.D.; Agar, J.N.; Barrow, M.P.; Berg, S.M.; Catalán, N.; Chen, H.; Chu, R.K.; Cole, R.B.; Dittmar, T.; et al. An international laboratory comparison of dissolved organic matter composition by high resolution mass spectrometry: Are we getting the same answer? Limnol. Oceanogr. Methods 2020, 18, 235–258. [Google Scholar] [CrossRef]
  47. Zherebker, A.; Kim, S.; Schmitt-Kopplin, P.; Spencer, R.G.M.; Lechtenfeld, O.; Podgorski, D.C.; Hertkorn, N.; Harir, M.; Nurfajin, N.; Koch, B.; et al. Interlaboratory comparison of humic substances compositional space as measured by Fourier transform ion cyclotron resonance mass spectrometry (IUPAC Technical Report). Pure Appl. Chem. 2020, 92, 1447–1467. [Google Scholar] [CrossRef]
  48. Thurman, E.M.; Malcolm, R.L. Preparative Isolation of Aquatic Humic Substances. Environ. Sci. Technol. 1981, 15, 463–466. [Google Scholar] [CrossRef]
  49. Kim, S.; Kramer, R.W.; Hatcher, P.G. Graphical Method for Analysis of Ultrahigh-Resolution Broadband Mass Spectra of Natural Organic Matter, the Van Krevelen Diagram. Anal. Chem. 2003, 75, 5336–5344. [Google Scholar] [CrossRef]
  50. Stenson, A.C.; Marshall, A.G.; Cooper, W.T. Exact masses and chemical formulas of individual Suwannee River fulvic acids from ultrahigh resolution electrospray ionization Fourier transform ion cyclotron resonance mass spectra. Anal. Chem. 2003, 75, 1275–1284. [Google Scholar] [CrossRef]
  51. Bai, Y.; Wu, F.; Xing, B.; Meng, W.; Shi, G.; Giesy, J.P. Isolation and Characterization of Chinese Standard Fulvic Acid Sub-fractions Separated from Forest Soil by Stepwise Elution with Pyrophosphate. Sci. Rep. 2015, 5, 8723. [Google Scholar] [CrossRef]
  52. Reemtsma, T.; These, A.; Springer, A.; Linscheid, M. Fulvic Acids as Transition State of Organic Matter: Indications from High Resolution Mass Spectrometry. Environ. Sci. Technol. 2006, 40, 5839–5845. [Google Scholar] [CrossRef]
  53. Morris, E.; Cawley, K.M.; Mcknight, D.M.; Miller, P.; Cory, R. Characterization of fulvic acid fractions of dissolved organic matter during ice-out in a hyper-eutrophic, coastal pond in Antarctica. Environ. Res. Lett. 2013, 8, 045015. [Google Scholar] [CrossRef]
  54. Terjesen, B.F.; Summerfelt, S.T.; Nerland, S.; Ulgenes, Y.; Fjæra, S.O.; Megård Reiten, B.K.; Selset, R.; Kolarevic, J.; Brunsvik, P.; Bæverfjord, G.; et al. Design, dimensioning, and performance of a research facility for studies on the requirements of fish in RAS environments. Aquac. Eng. 2013, 54, 49–63. [Google Scholar] [CrossRef]
  55. Rho, H.; Chon, K.; Park, J.; Cho, J. Rapid and Effective Isolation of Dissolved Organic Matter Using Solid-Phase Extraction Cartridges Packed with Amberlite XAD 8/4 Resins. Water 2019, 11, 67. [Google Scholar] [CrossRef]
  56. Corilo, Y.E.; Rodgers, R.P.; Marshall, A.G. PetroOrg Software; Florida State University: Tallahassee, FL, USA, 2014. [Google Scholar]
  57. Waters Corporation. Classifying Petroleum Samples with Waters SYNAPT HDMS and Omics LLC PetroOrg Petroleomics Software; Waters Corporation: Milford, MA, USA, 2014; Available online: https://www.waters.com/webassets/cms/library/docs/720005061en.pdf (accessed on 1 April 2022).
  58. Patriarca, C.; Sedano-Núñez, V.T.; Garcia, S.L.; Bergquist, J.; Bertilsson, S.; Sjöberg, P.J.R.; Tranvik, L.J.; Hawkes, J.A. Character and environmental lability of cyanobacteria-derived dissolved organic matter. Limnol. Oceanogr. 2021, 66, 496–509. [Google Scholar] [CrossRef]
  59. Koch, B.P.; Dittmar, T. From mass to structure: An aromaticity index for high-resolution mass data of natural organic matter. Rapid Commun. Mass Spectrom. 2006, 20, 926–932. [Google Scholar] [CrossRef]
  60. Kellerman, A.M.; Dittmar, T.; Kothawala, D.N.; Tranvik, L.J. Chemodiversity of dissolved organic matter in lakes driven by climate and hydrology. Nat. Commun. 2014, 5, 3804. [Google Scholar] [CrossRef] [PubMed]
  61. Schmidt, F.; Elvert, M.; Koch, B.P.; Witt, M.; Hinrichs, K.U. Molecular characterization of dissolved organic matter in pore water of continental shelf sediments. Geochim. Cosmochim. Acta 2009, 73, 3337–3358. [Google Scholar] [CrossRef]
  62. Zherebker, A.Y.; Rukhovich, G.D.; Kharybin, O.N.; Fedoros, E.I.; Perminova, I.V.; Nikolaev, E.N. Fourier transform ion cyclotron resonance mass spectrometry for the analysis of molecular composition and batch-to-batch consistency of plant-derived polyphenolic ligands developed for biomedical application. Rapid Commun. Mass Spectrom. 2020, 34, e8850. [Google Scholar] [CrossRef] [PubMed]
  63. Mangal, V.; Stock, N.L.; Guéguen, C. Molecular characterization of phytoplankton dissolved organic matter (DOM) and sulfur components using high resolution Orbitrap mass spectrometry. Anal. Bioanal. Chem. 2016, 408, 1891–1900. [Google Scholar] [CrossRef]
  64. Khreptugova, A.N.; Mikhnevich, T.A.; Molodykh, A.A.; Melnikova, S.V.; Konstantinov, A.I.; Rukhovich, G.D.; Volikov, A.B.; Perminova, I.V. Comparative Studies on Sorption Recovery and Molecular Selectivity of Bondesil PPL versus Bond Elut PPL Sorbents with Regard to Fulvic Acids. Water 2021, 13, 3553. [Google Scholar] [CrossRef]
  65. Yang, K.; Zhang, Y.; Dong, Y.; Li, W. Selectivity of solid phase extraction for dissolved organic matter in the hypersaline da Qaidam Lake, China. Environ. Sci. Process. Impacts 2017, 19, 1374–1386. [Google Scholar] [CrossRef]
  66. Peuravuori, J.; Lehtonen, T.; Pihlaja, K. Sorption of aquatic humic matter by DAX-8 and XAD-8 resins Comparative study using pyrolysis gas chromatography. Anal. Chim. Acta 2002, 471, 219–226. [Google Scholar] [CrossRef]
  67. Brezonik, P.L.; Bloom, P.R.; Sleighter, R.L.; Cory, R.M.; Khwaja, A.R.; Hatcher, P.G. Chemical differences of aquatic humic substances extracted by XAD-8 and DEAE-cellulose. J. Environ. Chem. Eng. 2015, 3, 2982–2990. [Google Scholar] [CrossRef]
  68. Li, Y.; Harir, M.; Lucio, M.; Kanawati, B.; Smirnov, K.; Flerus, R.; Koch, B.P.; Schmitt-Kopplin, P.; Hertkorn, N. Proposed Guidelines for Solid Phase Extraction of Suwannee River Dissolved Organic Matter. Anal. Chem. 2016, 88, 6680–6688. [Google Scholar] [CrossRef] [PubMed]
  69. Hawkes, J.A.; Dittmar, T.; Patriarca, C.; Tranvik, L.; Bergquist, J. Evaluation of the Orbitrap Mass Spectrometer for the Molecular Fingerprinting Analysis of Natural Dissolved Organic Matter. Anal. Chem. 2016, 88, 7698–7704. [Google Scholar] [CrossRef] [PubMed]
  70. Simon, C.; Roth, V.N.; Dittmar, T.; Gleixner, G. Molecular Signals of Heterogeneous Terrestrial Environments Identified in Dissolved Organic Matter: A Comparative Analysis of Orbitrap and Ion Cyclotron Resonance Mass Spectrometers. Front. Earth Sci. 2018, 6, 138. [Google Scholar] [CrossRef]
  71. Green, N.W.; Mcinnis, D.; Hertkorn, N.; Maurice, P.A.; Perdue, E.M. Suwannee River Natural Organic Matter: Isolation of the 2R101N Reference Sample by Reverse Osmosis. Environ. Eng. Sci. 2015, 32, 38–44. [Google Scholar] [CrossRef]
  72. Raeke, J.; Lechtenfeld, O.J.; Wagner, M.; Reemtsma, T. Selectivity of solid phase extraction of freshwater dissolved organic matter and its effect on ultrahigh resolution mass spectra. Environ. Sci. Process. Impacts 2016, 18, 918–927. [Google Scholar] [CrossRef] [PubMed]
  73. Wünsch, U.J.; Geuer, J.K.; Lechtenfeld, O.J.; Koch, B.P.; Murphy, K.R.; Stedmon, C.A. Quantifying the impact of solid-phase extraction on chromophoric dissolved organic matter composition. Mar. Chem. 2018, 207, 33–41. [Google Scholar] [CrossRef]
Figure 1. Overview of the fulvic acids (FA) isolation procedure based on Thurman and Malcolm, (1981) [48]. After sampling tank waters (A), the water was filtered with pre-combusted glass microfiber GF/F 0.7 µm pore size filters and acidified with hydrochloric acid (HCl) to pH ≤ 2 (B). The humic substance (HS) fraction of dissolved organic matter (DOM) was extracted by solid-phase extraction (SPE) with 2 g of DAX-8 resin (C) and the soluble FA fraction was separated from the precipitate at pH = 1 (D). The FA fraction was re-adsorbed in 2 g of DAX-8 resin for purification (E), and the eluent with the FA in the sodium form (Na-FA) was passed through 2 g of a strong cation-exchange resin in hydrogen form to extract the protonated FA form (H-FA) (F). The H-FA eluent was freeze-dried (G) and prepared for negative ESI-QTOF-MS analysis (H).
Water 14 02549 g001
Figure 2. Negative ESI-QTOF-MS mass spectra of fulvic acids (FA) extracted from: (A) Suwannee River (SRFA), (B) Elliott soil (ESFA), (C) tank waters from RAS (RASFA) and (D) Pahokee Peat soil (PPFA).
Water 14 02549 g002
Figure 3. Van Krevelen diagrams and matching tables provided by InterLabStudy package version: 0.0.1.5 available online: https://go.warwick.ac.uk/InterLabStudy (accessed on 31 March 2022) to compare the assigned elemental compositions from the negative ESI-QTOF-MS mass spectra of Suwannee River FA (SRFA) and Elliott soil (ESFA) IHSS standards with those assigned by 17 HRMS instruments including FTICR-MS and Orbitrap-MS [46]. Van Krevelen diagrams of (A) SRFA and (C) ESFA and matching tables of SRFA (B) and ESFA (D).
Water 14 02549 g003
Figure 4. Comparison of raw mass spectra of SRFA from 7 Tesla Fourier transform mass Bruker Daltonics mass spectrometer at 530,000 FWHM (A), from LTQ-Velos-Pro Orbitrap Thermo Scientific mass spectrometer at 100,000 FWHM (B) and from Waters QTOF-MS by FIA at 35,000 FWHM (C). The indicated elemental compositions were assigned from the exact mass. Elemental compositions by FIA-QTOF-MS at 426 m/z were not correctly assigned due to the broad peaks caused by ion suppression when FIA was used in combination with the low resolution (35,000 FWHM) of the Waters QTOF mass spectrometer.
Water 14 02549 g004
Figure 5. Box plots showing median (black horizontal line) and range (a vertical line with black bar) from the metric values (O/Cwa, m/zwa, H/Cwa and AIwa) for the Elliott Soil, Pony Lake and Suwannee River IHSS fulvic acids (ESFA, PLFA and SRFA), together with the Suwannee River natural organic matter sample (SRNOM) across 17 HRMS instruments using common ions provided by InterLabStudy package version: 0.0.1.5 available online: https://go.warwick.ac.uk/InterLabStudy (accessed on 31 March 2022). The calculated metric values from the SRFA (A) and ESFA (B) analyzed by ESI-QTOF-MS are indicated with a black “X”. Instruments are indicated by their designated letters: Orbitrap-MS (A–G) and FTICR-MS (H–Q).
Water 14 02549 g005
Figure 6. Assigned CHO peaks by ESI-QTOF-MS under negative mode from Suwannee River, Elliott soil, Pahokee Peat and recirculating aquaculture systems fulvic acids (SRFA, ESFA, PPFA and RASFA) classified into five compound classes (aliphatics, aromatics, condensed aromatics, high oxygen “highOC” and low-oxygen “lowOC” unsaturated compounds). The compound classes ranges were based on Hawkes, et al. (2020) [46]. (A) Van Krevelen diagrams with H/C and O/C ratios and (B) bar chart diagram with the sum-normalized abundances of the compound classes identified in each sample.
Water 14 02549 g006
Figure 7. Venn diagrams comparing the number of CHO peaks assigned to the fulvic acid fraction of DOM by ESI-QTOF-MS and 2645 assigned to DOM from RAS by FTICR-MS in previous experiments under negative mode [4]. The DOM samples of the previous experiment were isolated from the makeup, pump-sump, tank, and feed samples during the production of Atlantic salmon (Salmo salar) post-smolts at the Nofima Centre for Recirculation in Aquaculture (NCRA) in Sunndalsøra, Norway. The set-up of the RAS used in the previous experiment can be found in Aguilar-Alarcón et al., 2022 [4]. The Venn diagrams were represented with: (A) The total number of CHO peaks in the recirculating aquaculture fulvic acids (RASFA) sample and those found common with DOM from RAS. (B) The total number of CHO peaks identified in the RASFA sample and those found common with the makeup, pump-sump, tank and feed samples of DOM from RAS analyzed by 7T FTICR-MS [4].
Water 14 02549 g007
Figure 8. Principal component analysis (PCA) showing score plots (A) and Tanimoto similarity scores based on the normalized abundances of peaks extracted from ESI-QTOF mass spectra under negative mode (B) for the Suwannee River, Elliott soil, Pahokee Peat and recirculating aquaculture systems fulvic acids (SRFA, ESFA, PPFA and RASFA).
Water 14 02549 g008
Table 1. Characteristics of the fulvic acid (FA) fraction of dissolved organic matter (DOM) based on the intensity weight-averaged (wa) values of the identified peaks by ESI-QTOF-MS under negative mode in the Suwannee River, Elliott soil, Pahokee Peat fulvic acid standards (SRFA, ESFA and PPFA) from IHSS together with the FA fraction of DOM from RAS (RASFA).
SamplesIdentified
Formulas
H/CwaO/Cwam/zwaAIwa
SRFA3431.210.46374.30.29
ESFA1481.180.53320.70.32
PPFA691.370.35582.60.24
RASFA4401.300.42387.30.25
Publisher’s Note: MDPI stays neutral with regard to jurisdictional claims in published maps and institutional affiliations.

