Article

Abundance, Composition, and Potential Ecological Risks of Microplastics in Surface Water at Different Seasons in the Pearl River Delta, China

1
Pearl River Fisheries Research Institute, Chinese Academy of Fishery Sciences, Guangzhou 510380, China
2
Fishery Ecological Environment Monitoring Center of Pearl River Basin, Ministry of Agriculture and Rural Affairs, Guangzhou 510380, China
3
Guangzhou Scientific Observing and Experimental Station of National Fisheries Resources and Environment, Guangzhou 510380, China
4
Key Laboratory of Aquatic Animal Immune Technology of Guangdong Province, Guangzhou 510380, China
5
Tianjin Key Laboratory of Aqua-Ecology and Aquaculture, Tianjin Agricultural University, Tianjin 300384, China
*
Authors to whom correspondence should be addressed.
Water 2022, 14(16), 2545; https://doi.org/10.3390/w14162545
Submission received: 14 July 2022 / Revised: 6 August 2022 / Accepted: 17 August 2022 / Published: 18 August 2022
(This article belongs to the Section Water Quality and Contamination)

Abstract

:
In this study, microplastics in the surface water in the Pearl River Delta during different seasons were studied to analyze their temporal and spatial distribution, morphological characteristics, related socio-economic indicators, and potential ecological risks. Based on an analysis of surface water samples from 13 sampling sites, we found that the temporal and spatial distribution of microplastics in the Pearl River Delta were unbalanced. The microplastic abundances at the Qingqi, Chencun, Zuotan, and Beijiao sites were tremendously higher than those at other sites. Nevertheless, the abundance of microplastics at most sites was tremendously higher in the rainy season than dry season. Meanwhile, the morphological characteristics of microplastics had a strong correlation with the changes of season and site location. During the rainy season, the major color, shape, and size distribution of microplastics were gray (38.64%), strip (78.29%), and 100–500 μm (57.38%), respectively. The most usual color, shape, and size distribution of microplastics in the dry season were black (38.64%), granular (78.29%), and 0–100 μm (70.29%), respectively. As for the socio-economic indicators, including the degree of afforestation as well as the extent of industrial, transportation, and other human activities, all had varying degrees of impact on microplastic abundances. The potential ecological risk assessments demonstrated that most sites in the Pearl River Delta had a high potential for ecological risk related to microplastic pollution, which should be given more attention in the future. In summary, our investigations offer a theoretical basis for research related to microplastics in the Pearl River Delta and can further improve our understanding of the need to protect aquatic environments by exploring the overall ecological risks posed by microplastics.

1. Introduction

In 2004, Thompson et al. [1] first proposed that microplastics (MPs) were an emerging pollutant. MPs mainly refer to very small plastic particles (0–5 mm), although the particle size can reach micron or even nanometer scales. MPs have become a new threat to the global environmental ecosystem in recent years. One of the main resources of MP pollutions is the frequent use of plastic products in our daily lives. Plastic products not only bring us great convenience but also cause large volumes of plastic product waste, which do not degrade completely after entering the aquatic environment but will eventually be fragmented into MPs with a small particle size [2]. In addition, MPs have strong hydrophobicity, relatively stable properties, and can exist in the environment for a long time. Many studies have confirmed that MPs are widespread in ocean and freshwater environments worldwide, even in the distant deep sea and Arctic Ocean [3,4]. Meanwhile, more than 90% of MPs in marine environments come from land-based pollution sources; river runoff is an important transmission mode of MPs discharged from the land to marine environments [5]. It can be seen that the key to the treatment of marine MP pollution is the treatment of land-derived MPs, and the prerequisite for the treatment of land-derived MP pollution is to investigate and analyze the characteristics of pollution in inland waters, especially rivers.
Nowadays, the research on the pollution of freshwater by MPs has attracted widespread attention from scholars worldwide [6]. Related studies have proved that MPs are widely distributed in rivers around the world [7]. In general, the rivers in China have relatively high amounts of MPs, therefore, the current status of MP pollution needs to have a high profile. The above research results show that the MP pollution level in some rivers was more supernal to that in the ocean. MP pollution in rivers is affected by the types of land use and human activity along the banks of a river [8,9]. Meanwhile, the large amounts of MPs have an immeasurable negative effect on human health [10]. A large number of MPs in fresh water can absorb a large number of pollutants in the water environment, which can then be absorbed and transported by many aquatic animals and plants, resulting in great negative effects and accumulation of ecotoxicity. Human exposure can occur through inhalation and diet by ingestion of contaminated crops and aquatic animals or by consumption of bottled water [11,12,13]. Furthermore, MPs can also provide attachment points for microorganisms in the water environment, and then generate biofilms to produce secondary pollution. Therefore, studying the existence of MPs in inland water bodies is of great significance to humans as well as to efforts to maintain oceanic and riverine ecosystem health.
The Pearl River Delta is one of China’s three major riverine deltas, which includes the four major river systems of the Xijiang, Beijiang, Dongjiang, and Pearl rivers [14]. Previous environmental studies on the Pearl River have mainly focused on heavy metal and organic compound pollution. In recent years, researchers have successively reported MP abundances in the water body, sediment, and organisms. Although there have been many relevant studies, it is still necessary to conduct in-depth research on the current situation and potential risks of MPs in the rich river network of the Pearl River Delta [15,16,17]. The river network areas of the Pearl River Delta extend for 9750 km2, and the river network density is 0.8 km/km2. The total amount of water passing through the Xijiang, Beijiang, and Dongjiang rivers is 2.941 × 10¹¹ m3. The dense river network, abundant water resources, and human activities of the Pearl River Delta can well reveal the factors related to MP pollutions of rivers [18,19,20,21]. Thirteen different sampling sites completely covering the different ecological characteristics in the Pearl River Delta network were selected in this study, and the collected data were highly representative of the conditions related to MP pollution in the surface water system. To the best of our knowledge, the one-off sampling method has commonly been applied in the previous studies that addressed MPs in the Pearl River Delta; nevertheless, it has been difficult to reflect the characteristics of MPs over a long time. By contrast, aquatic MP data of the present study were collected during the dry and rainy seasons in order to better reveal the factors involved in MP pollution in rivers on temporal and spatial scales.
In this study, in order to figure out the MP pollution in the water networks of Pearl River Delta, research objects (13 sampling sites) were used to assess the abundance, distribution, and physicochemical characteristics of MPs in the surface water of the Pearl River Delta and the related potential ecological risks. The analysis explored the elements that may affect the MPs’ nature and sources in the river network and determined the comprehensive potential risks posed by MPs in the Pearl River Delta. In comparison with previous literature, this study provides a more comprehensive and systematic analysis of the pollution of the overall waters of the Pearl River Delta. The study provides basic data and information to support further research on MP pollution and its ecological effects.

2. Materials and Methods

2.1. Study Area and Sample Collection

The Pearl River Delta is situated at 22°02′–23°18′ N, 112°35′–113°57′ E and is composed of the alluvial plains of the Xijiang, Beijiang, and Dongjiang rivers along with the estuary deltas of the lower reaches. Covering an area of 4.16 × 10⁴ km2, the delta is the largest alluvial plain in the southern subtropics of China [22]. The water network area covers 9750 km2 and has more than 100 main waterways with a total length of about 1700 km, with the waterways crisscrossing each other. The area is severely affected by domestic sewage and industrial wastewater from the surrounding developed cities in the Pearl River Delta. In February (dry season) and August (rainy season) 2021, samples were collected from different sampling sites in the water networks of the Pearl River Delta (Figure 1). A MANTA net (aperture size = 15 μm, HYDRO-BIOS Co., Kiel, Germany) in the form of a horizontal trawl net in the surface water (trawling time = 10–15 min) was used to collect water samples. Flow meters (Qingdao Haohai Technology Co., Ltd., Qingdao, China) installed through the network port were used to measure the amount of water passing through the network. The surface water samples were collected from the top 0.5 m of the water body at each sampling site, which were transferred into sterile bottles, transported back to lab and stored at 4 °C for analysis.

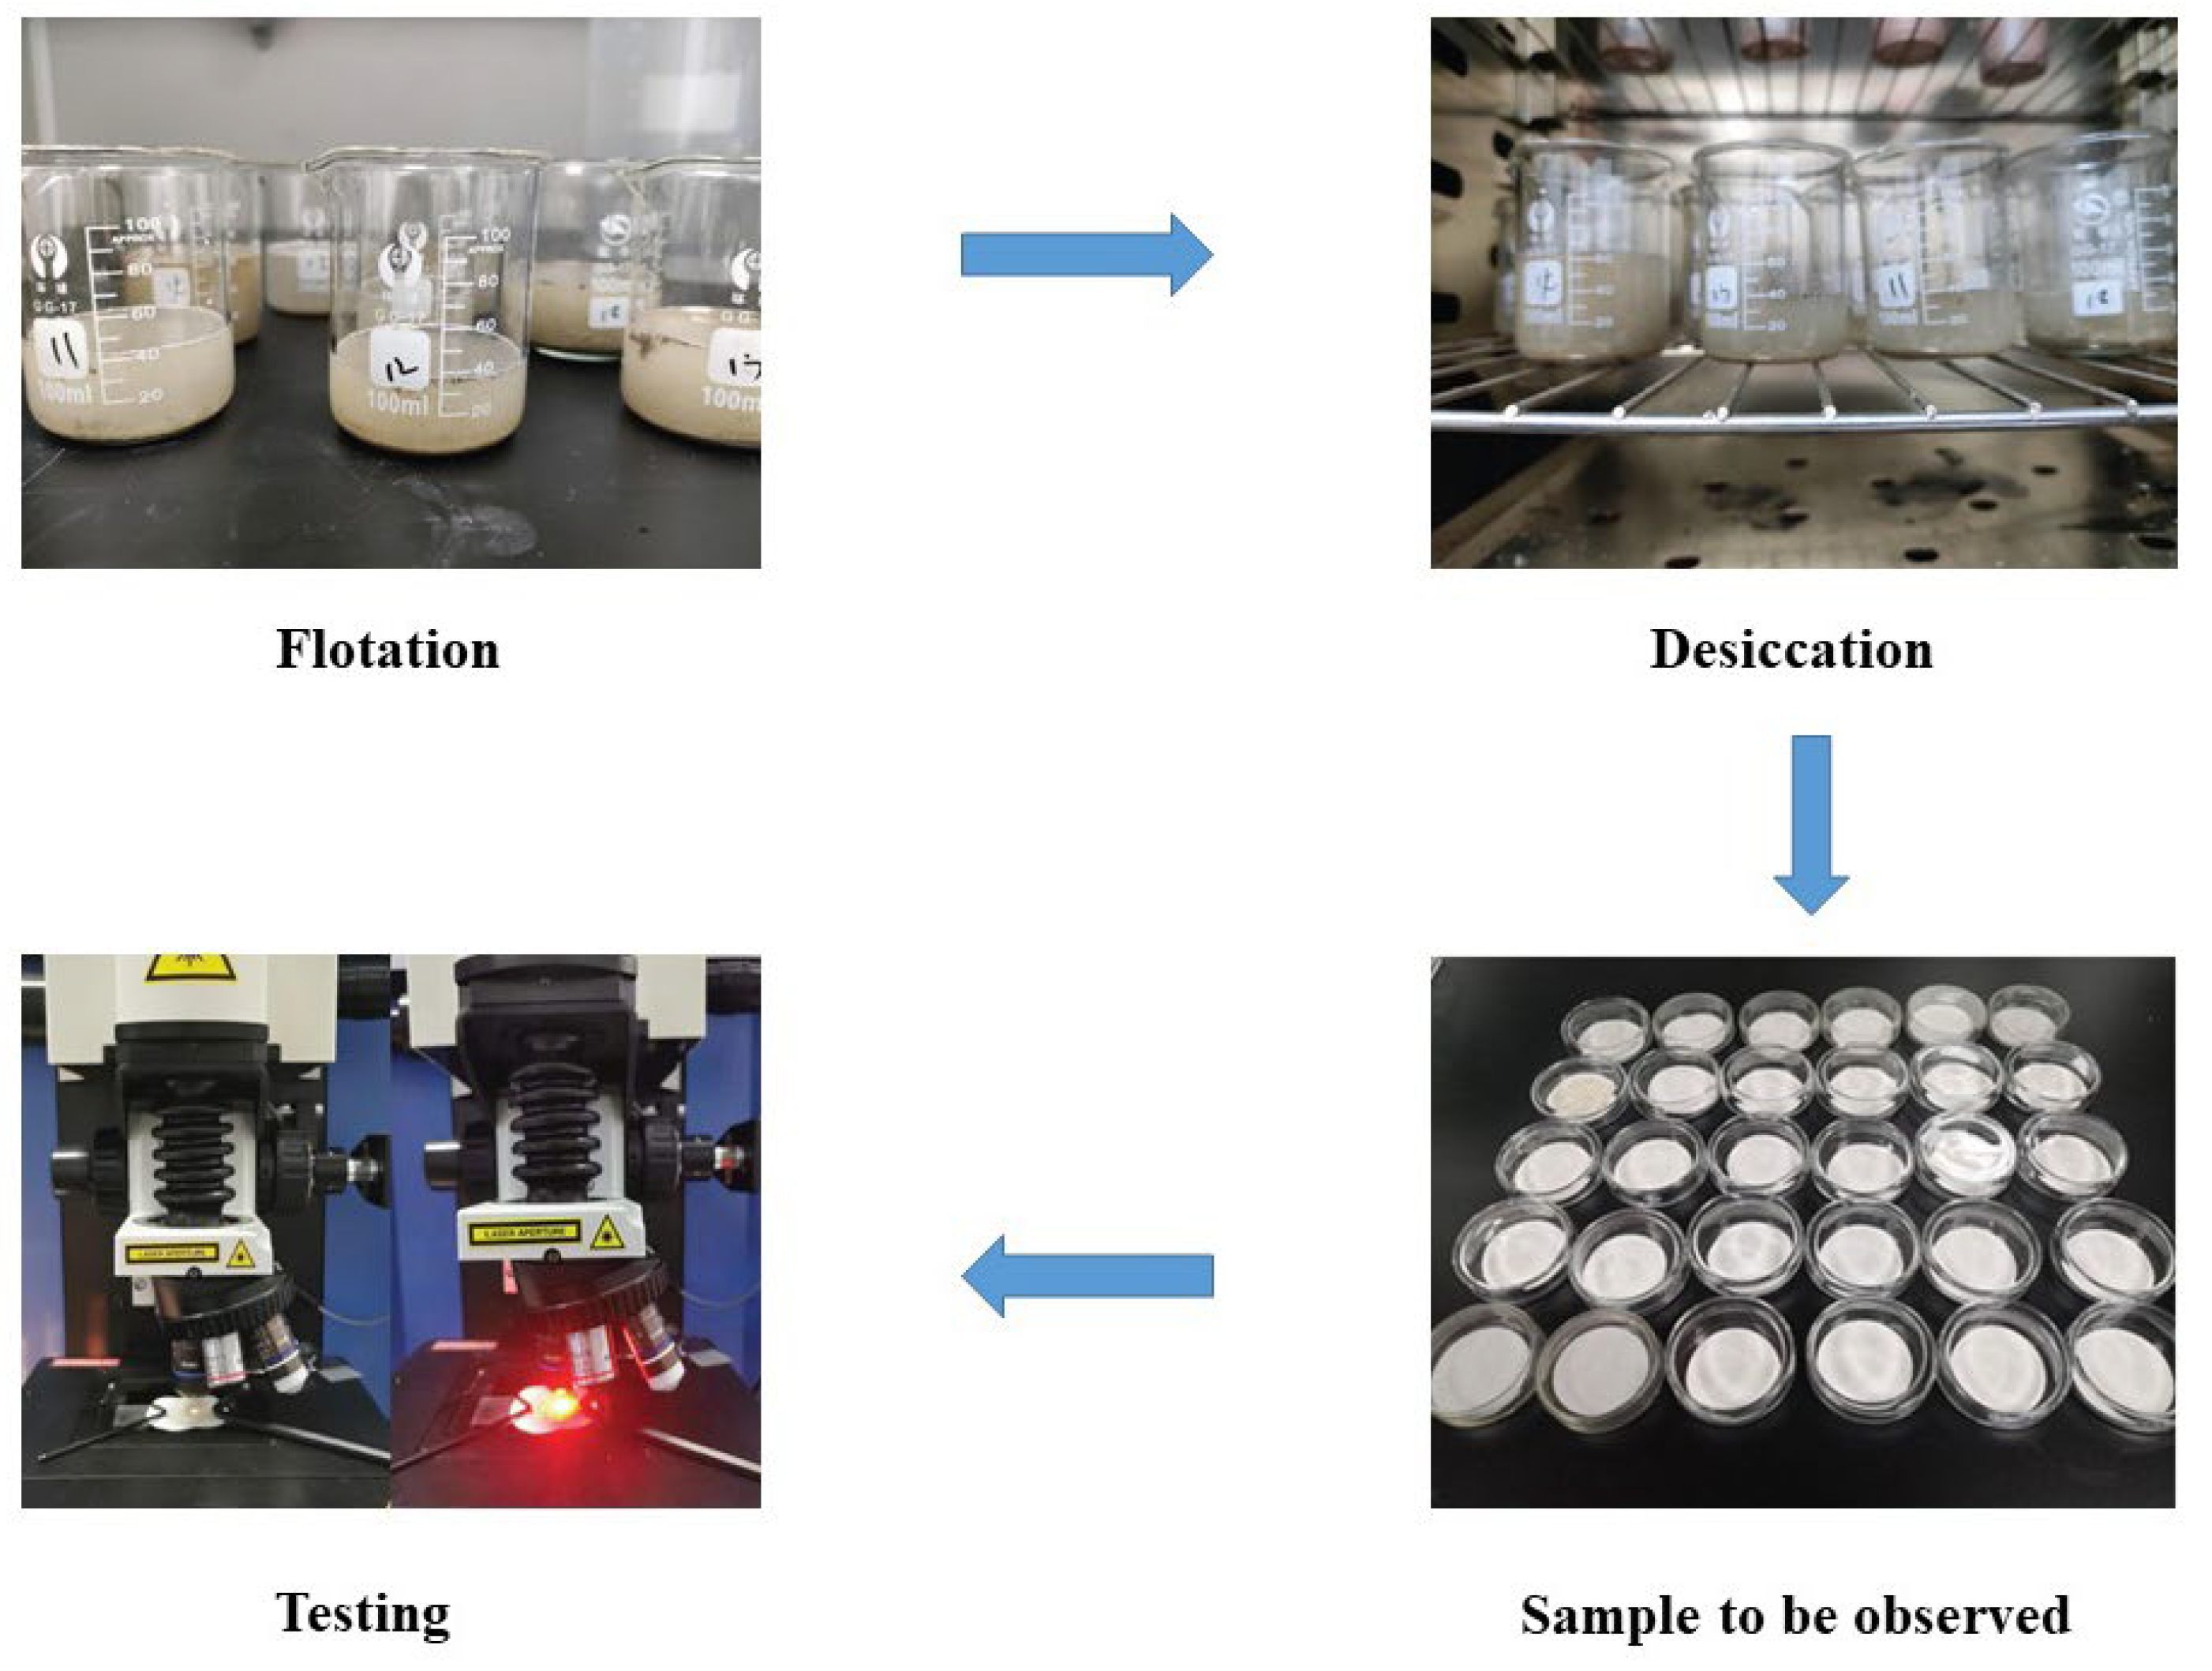
2.2. Extraction of MPs

The extraction of MPs was performed on the basis of the formerly reported method [23] with modifications. The extraction and observation method of MPs in water samples are shown in Figure 2. In brief, the water samples were incubated overnight with 30% H2O2 to degrade the organic matter, and then, they were filtered through 0.7-μm pore-size GF/F glass microfiber filters. All of the filters were placed on sterile glass culture dishes and were dried at 60 °C for 2 h in an electric blast drying oven before further inspection and identification.

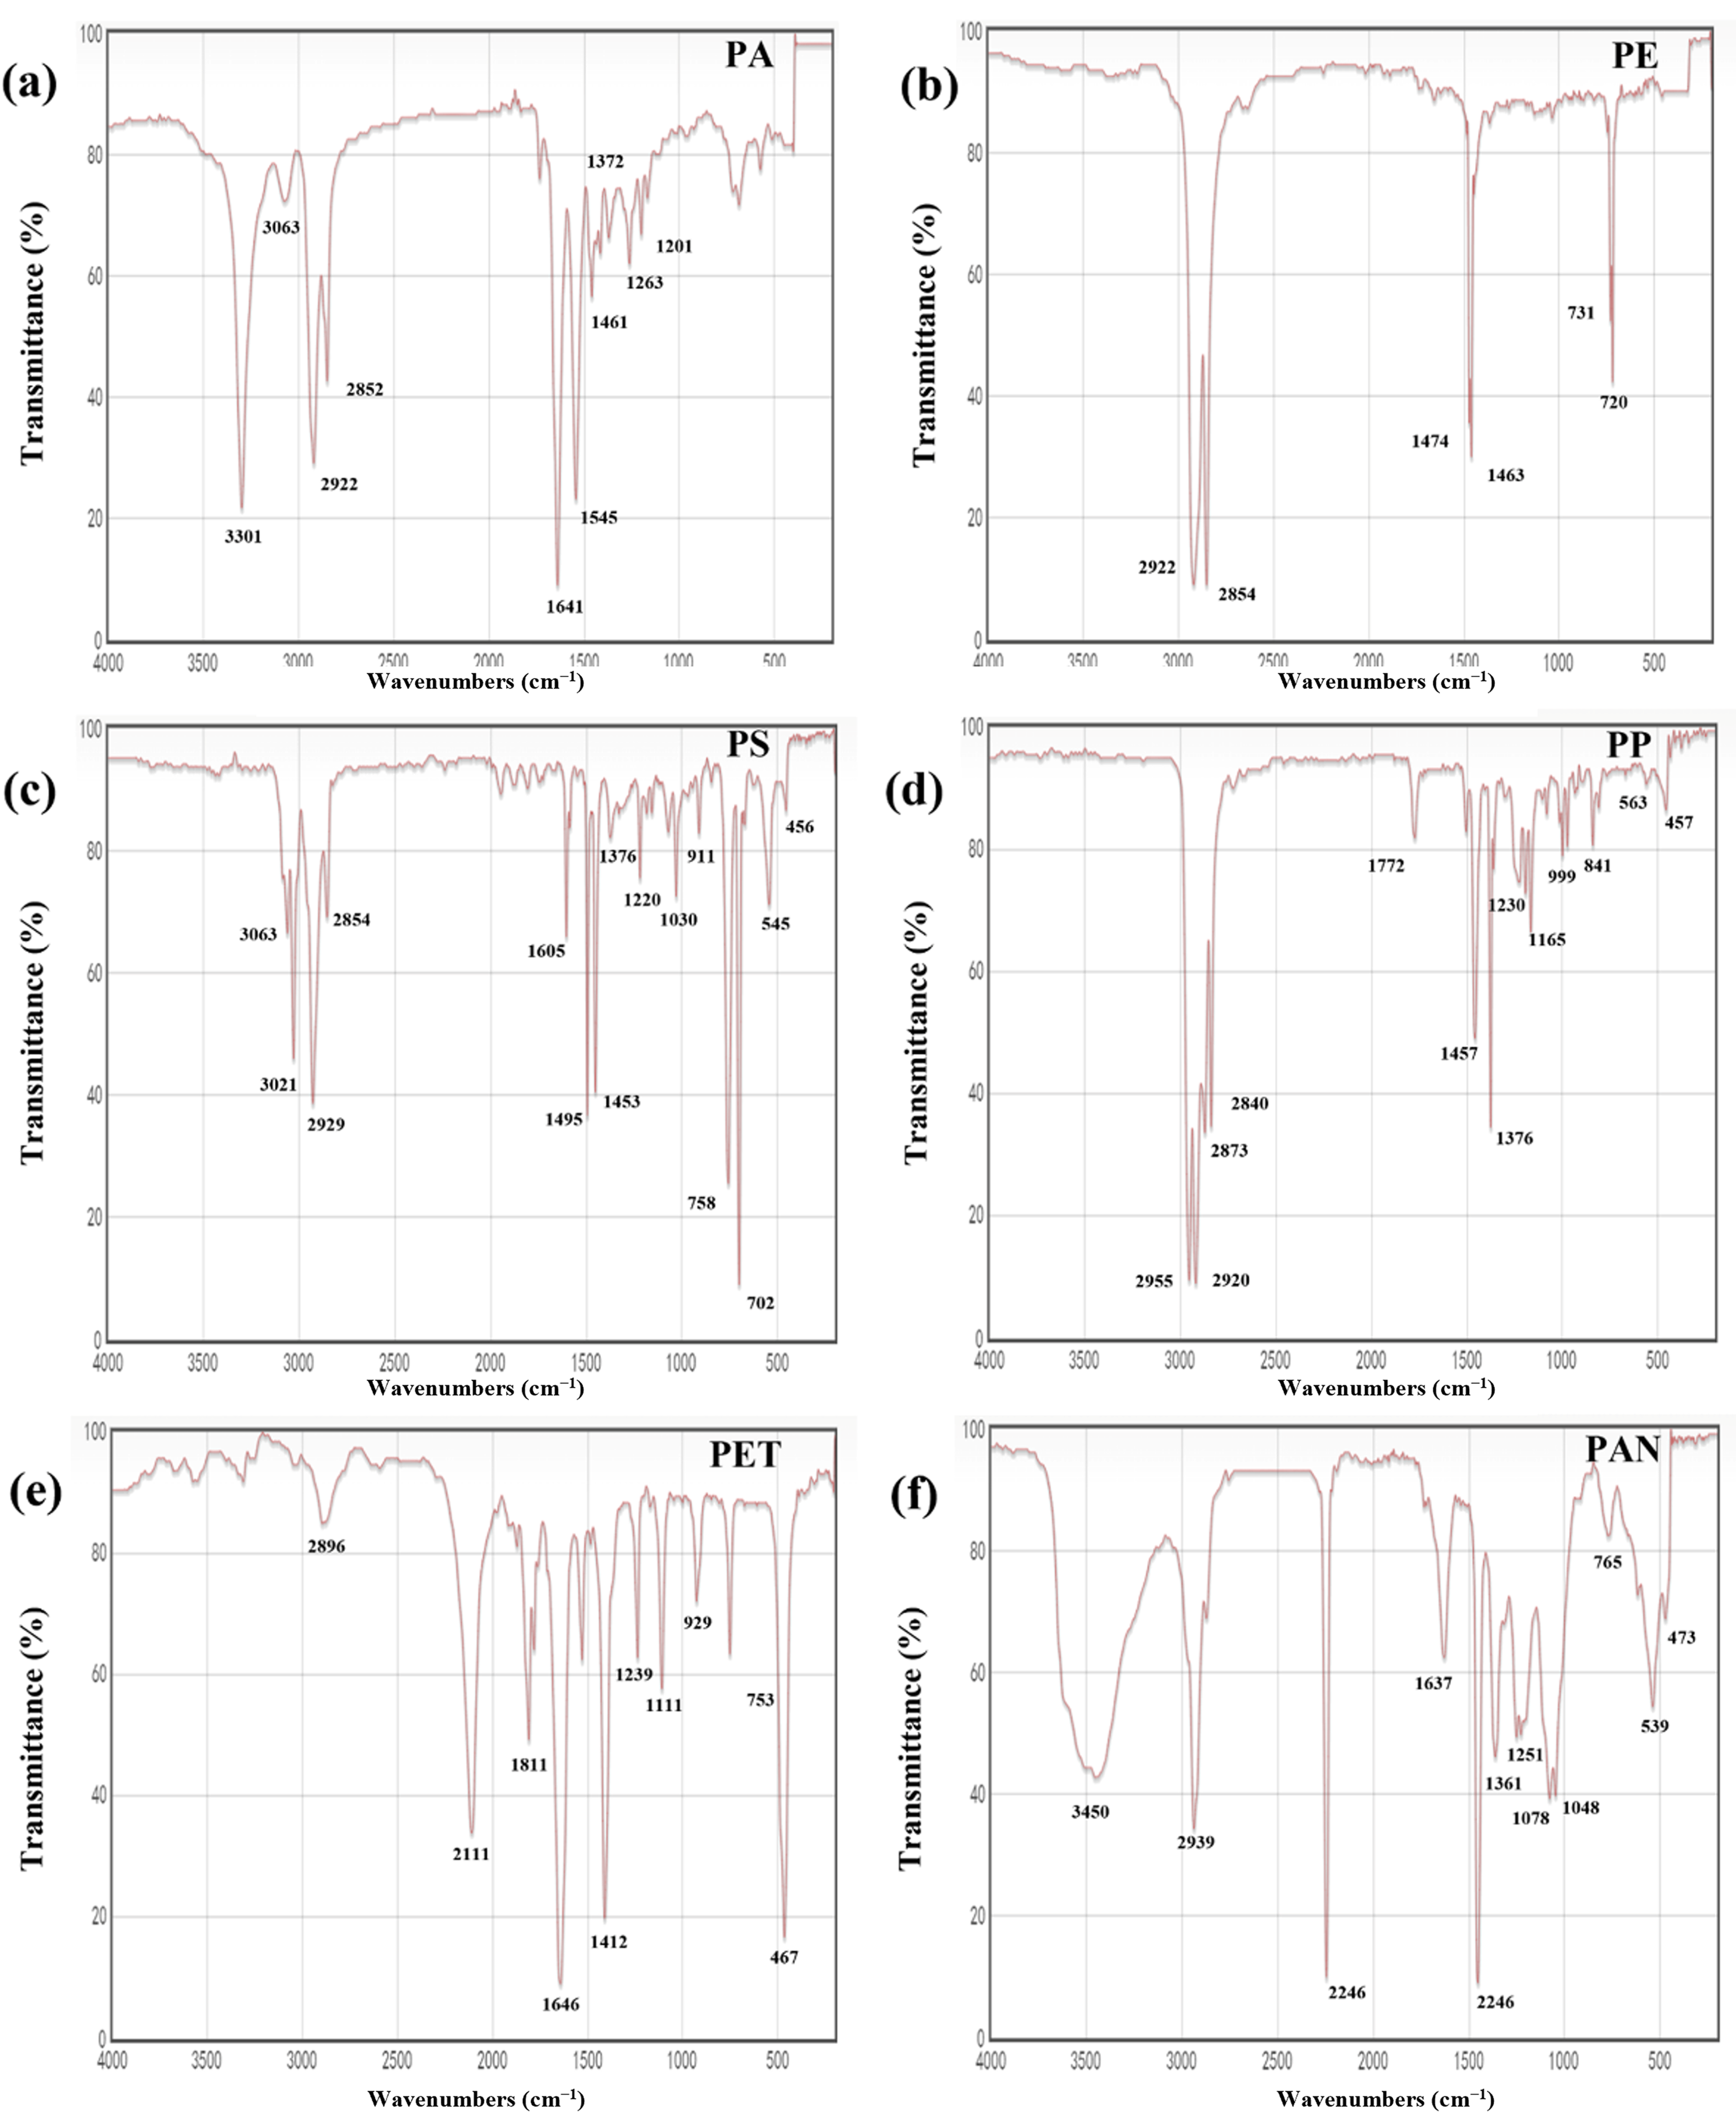
2.3. Characterization of MPs

A SteREO Discovery V8 zoom microscope system (Zeiss, Oberkochen, Germany) was used to observe the residues on the filter membrane, to identify the MPs, and to record the number, color, shape, and size of MPs. According to the morphological differences, MPs were differentiated by color (black, red, blue, orange, yellow, brown, gray, white, and green), size (0–100 μm, 100–500 μm, and > 500 μm), and shape (strip, granular, fragment, fiber, lump, and rod-like). A Thermo Nicolet iS5 FT-IR Spectrometer (Thermo Fisher Scientific, Waltham, MA, USA) was used to detect the MP samples to determine their chemical composition. The technical process followed the standard methods described in the standard practice for obtaining general techniques for infrared spectroscopy for qualitative analysis (GB/T 32199-2015) (SAC/TC124 2015). And the resolution, exposure time, and wavelength range were 8 cm−1, 12 s, and 4000–400 cm−1, respectively. Three replicate microregions were randomly selected and averaged to obtain the final results in each analysis. All the samples in this study were mainly composed of six types of polymers: polyamide (PA), polyethylene (PE), polystyrene (PS), polypropylene (PP), polyethylene terephthalate (PET), and polyacrylonitrile (PAN).

2.4. Socio-Economic Indicators

The investigated socio-economic indicators mainly included population density, the degree of afforestation, the degree of industrialization and traffic density, and other relevant indicators [24,25]. The socio-economic data of each site were received from the respective closest area. The respective closest areas (four cities) surrounding the sampling sites were as follows: Foshan City, QQ = Sanshui District, XT = Nanhai District, BJ = Shunde District, ZT = Nanhai District, and LH = Shunde District; Guangzhou City, PRB = Liwan District, LHS = Panyu District, CC = Panyu District, SQ = Panyu District, and HL = Nansha District; Zhongshan City, XL = Xiaolan Town, and XW = Banfu Town; and Jiangmen City, WH = Jianghai District. The socio-economic data of respective closest areas surrounding the different sampling sites were derived from the Fohsan, Guangzhou, Jiangmen, and Zhongshan statistical yearbooks of 2020. The statistical websites with local government socio-economic indicators were as follows: for Foshan City, http://www.foshan.gov.cn/ (accessed on 20 December 2021); for Guangzhou City, http://www.gz.gov.cn/ (accessed on 20 December 2021); for Jiangmen City, http://www.jiangmen.gov.cn/ (accessed on 20 December 2021); for Zhongshan City, http://www.zs.gov.cn/ (accessed on 20 December 2021).

2.5. Potential Ecological Risk Evaluation

Classical methods were employed to evaluate the MP ecological risks [26]. The related model can be expressed as follows:
E i = T i   × C i C 0 ,   R I = i = 1 n E i ,
where Ei and RI are the potential ecological risk factor and the potential ecological risk, respectively, Ti is the chemical toxicity coefficient for the constituent polymer [26], and Ci/C0 is the ratio of the observed MP concentration to the background level. The lowest MP concentration measured in this study was adopted as the background value due to the lack of available background data.
Based on the Ei and RI values calculated using Equation (1), the risks posed by MPs in the Pearl River Delta were further assessed in this study based on the hazard scores of plastic polymers and polymer types, as follows:
H = P n × S n ,
where H is the polymer risk index, Pn is the percentage of each MP polymer type at each sampling site, and Sn is the score for the polymers comprising the MPs. According to the corresponding references [23,26], the Sn values of PP, PE, PS, PA, PET, and PAN were 1, 11, 30, 130, 10, and 1021, respectively.
Furthermore, a pollution load index (PLI) was calculated to assess the pollution levels in the Pearl River Delta, as follows:
C F i = C i C 0 i ,   P L I = C F i ,
where C0i is the lowest MP abundance in the zooplankton samples from 13 sampling sites. CFi is the quotient of the MP abundance and C0i for each sampling site. PLI is the pollution load index posed by MPs. The different categories for the risk levels based on Ei, RI, H, and PLI are presented in Table 1.

2.6. Quality Assurance and Quality Control

All samplers and containers were rinsed with pure water three times before sampling. A clean glass petri dish with a glass microfiber filter inside was used to collect airborne MPs at each site. In the process of sample collection, extraction, and MP identification, operators wore nitrile gloves and pure cotton lab coats; samples were stored in a closed space to reduce plastic pollution in the laboratory air. Before identification and quantification, the sample holders of the stereo microscope and FT-IR were carefully cleaned and inspected. A blank test was performed to assess any potential contamination of the laboratory. No MPs and fibers were detected in each blank sample, indicating that the probability of MP contaminations in laboratory air or distilled water was negligible.

2.7. Statistical Analysis

All of the data applied in this study were expressed as averages. Pearson correlation analysis was conducted to determine the relationships between the socio-economic indicators and MP abundances. If the data (MP abundances and potential ecological risk values) were normally distributed, one-way analysis of variance with Fisher’s least significant difference test (for MP abundances) and Tukey’s multiple comparison test (for potential ecological risk) were used to verify the differences between the groups. When the parametric assumptions were not met, the data were analyzed using a nonparametric Kruskal–Wallis test under Dunn’s multiple comparison test. The statistical analyses were conducted and plots (i.e., histograms, stacked diagrams, plotting diagrams, and scatter plots with regression lines) were created using OriginPro 8.5.1 data analysis and mapping software (OriginLab Co., Northampton, MA, USA) and Excel data analysis and mapping software (Microsoft Corporation, Washington, DC, USA). The statistical analysis of relevant data was conducted using the SPSS statistical analysis and processing software (SPSS, Chicago, IL, USA).

3. Results and Discussion

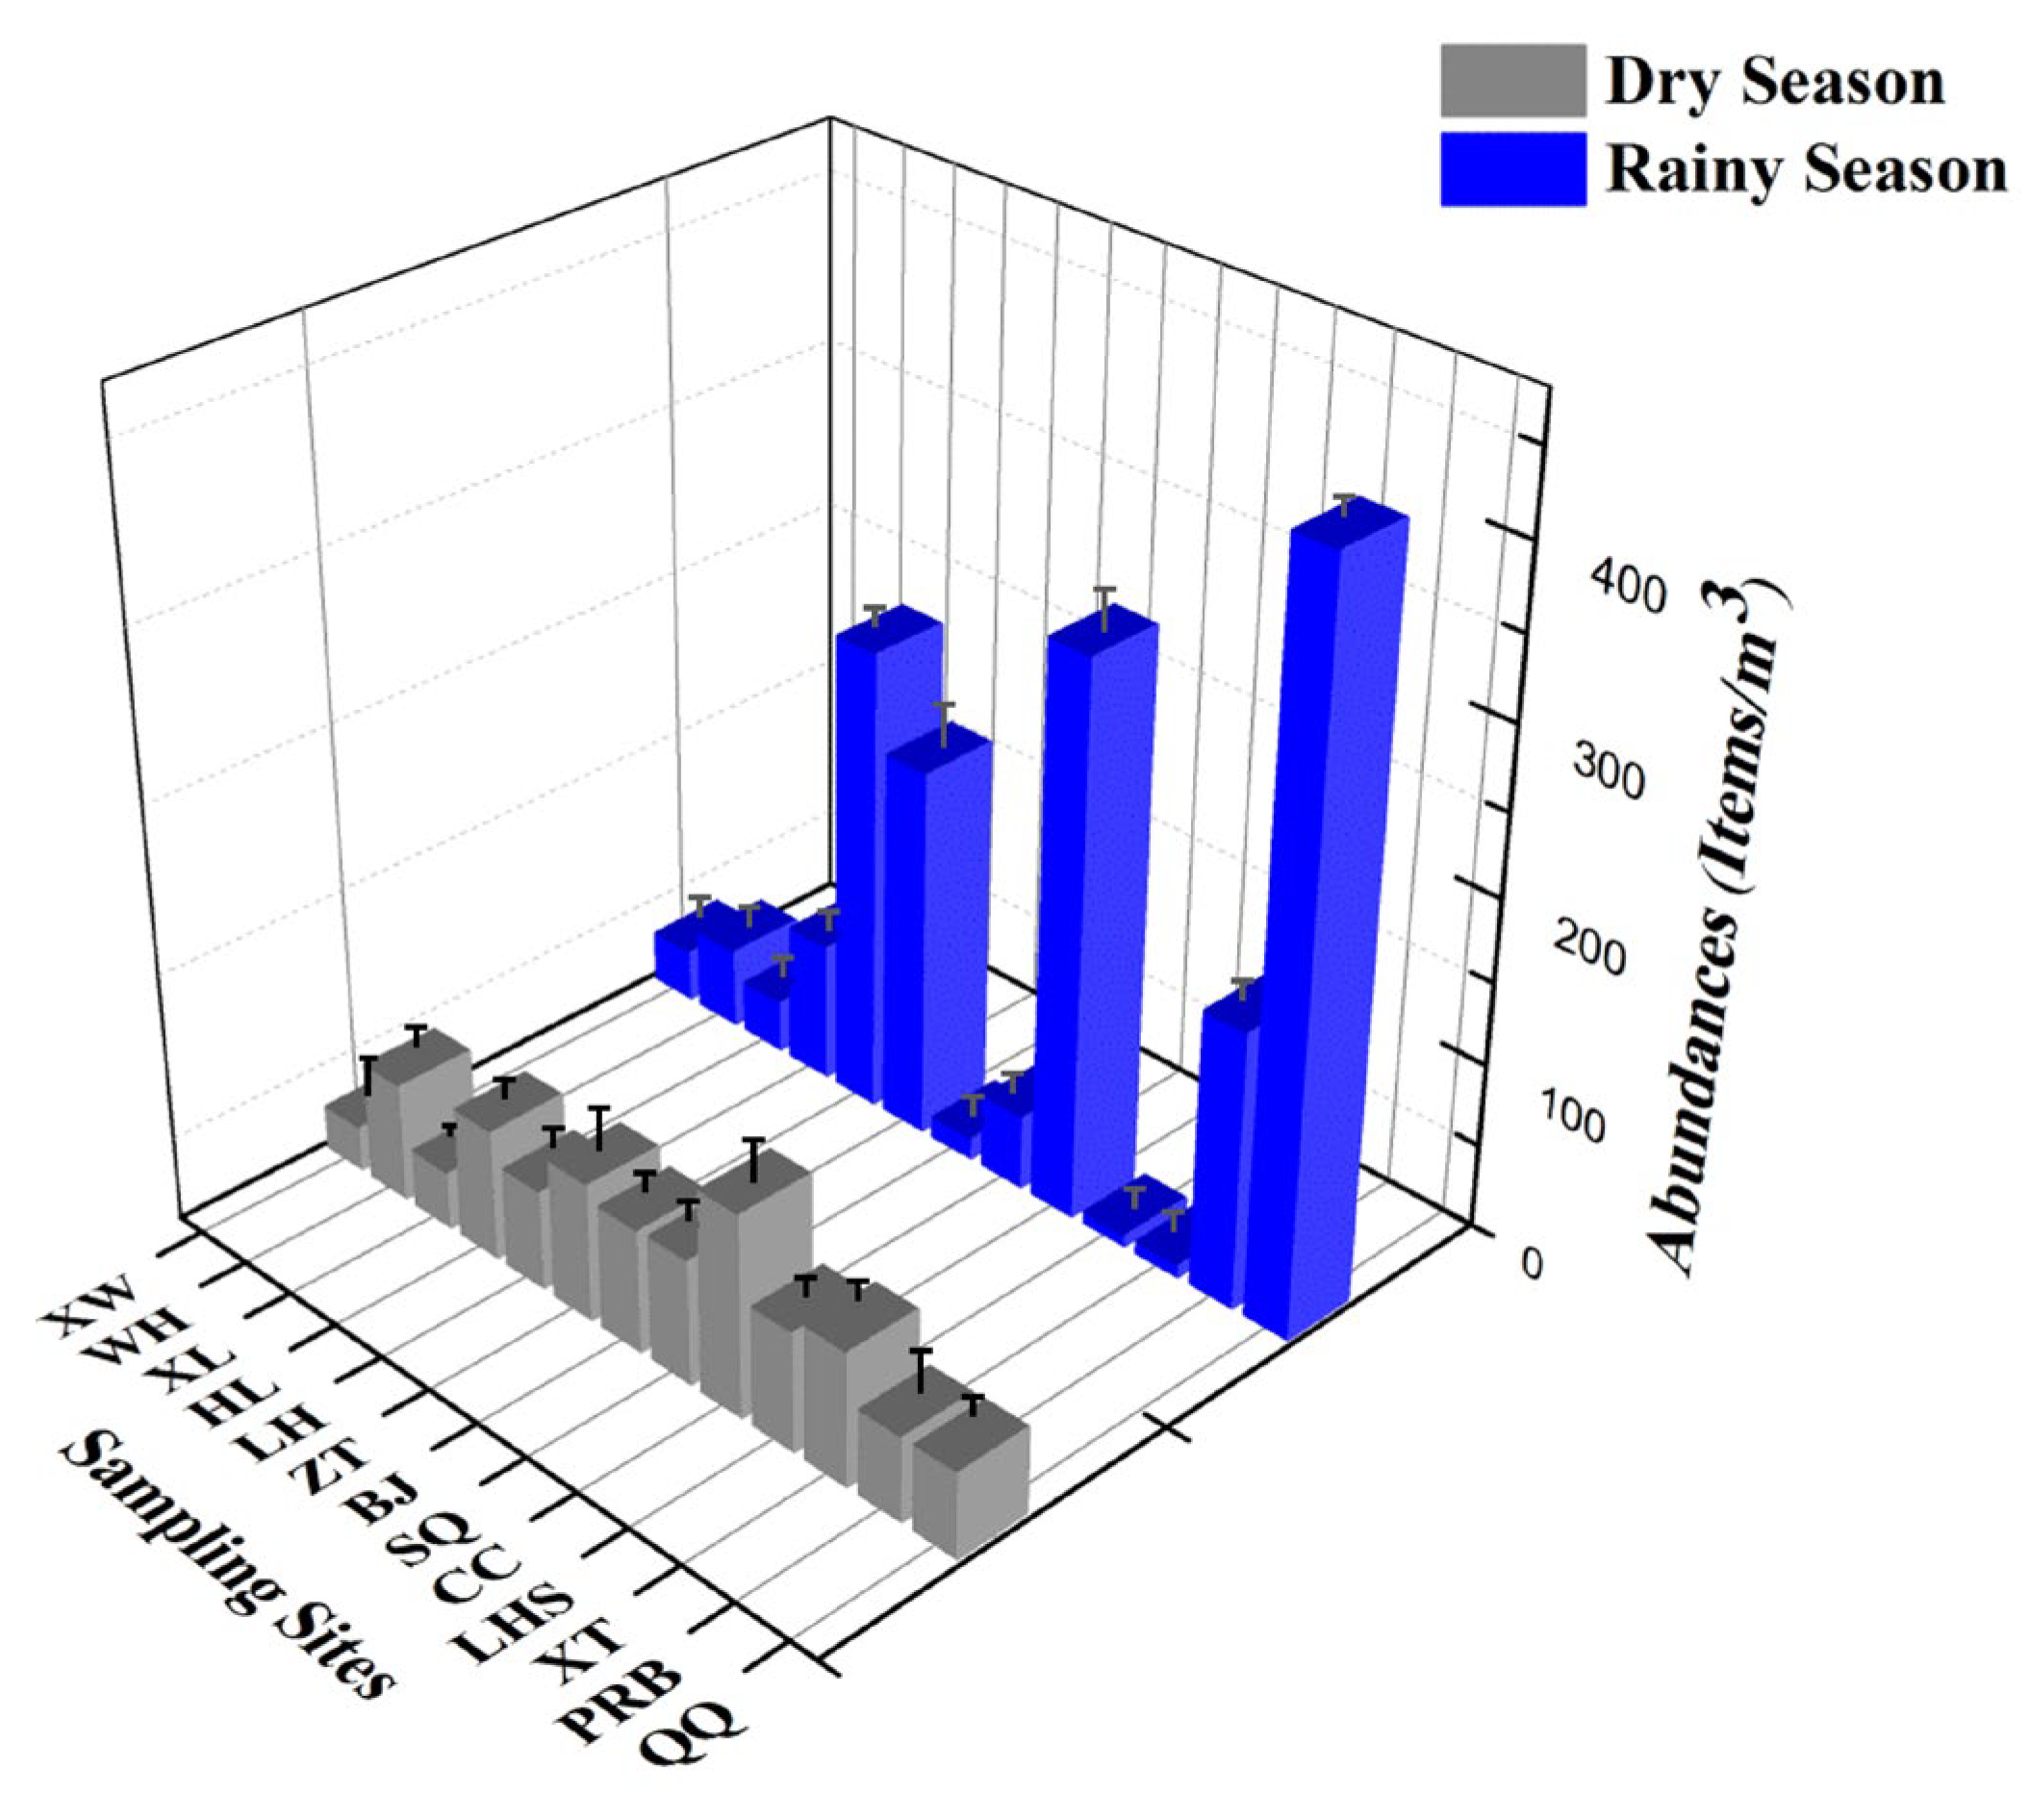
3.1. Abundance and Distribution of MPs

MP abundances in the surface water samples from all 13 sampling sites along the aquatic networks of the Pearl River Delta are shown in Figure 3, indicating MP abundances varies greatly with time and space. Significant temporal differences in MP abundances were observed during different seasons along the aquatic networks of the Pearl River Delta. As for the spatial distribution, the average MP abundances at all sampling sites in the Pearl River Delta during the rainy season were ranked as follows: QQ > CC > LH > ZT > PRB > HL > WH > SQ > XW = XL > BJ > XT > LHS. During the dry season, the average abundances of MPs at all 13 sampling sites in the Pearl River Delta were ranked as follows: CC > ZT > XT > HL > SQ > BJ > LHS > WH > LH > QQ > PRB > XL > XW. The differences in MP abundances during different seasons and sampling sites confirmed the unbalanced temporal and spatial distributions of MPs along the aquatic networks of the Pearl River Delta.
Based on the previous results, it can be seen that the MPs in the Pearl River Delta were not evenly distributed temporally and spatially. From the perspective of time, MP abundances in the rainy season were significantly higher than those in the dry season (Figure 3). The reasons may be related to the flow and velocity of water in different seasons. A large amount of MPs migrated with the water body during the rainy season [27]. The QQ site was at the intersection of the Beijiang and Xijiang rivers; during the rainy season, the MPs flowing in from the two upstream trunk streams gather here. Therefore, MP abundances in the QQ site were the most abundant during the rainy season. In the dry season, with a decreased volume and velocity of water, part of the MPs deposited were into the sediment; therefore, MP abundances in the dry season was generally moderate. The size distribution results of MPs found in different seasons can also confirm this phenomenon (Figure 4). The size of MPs in the water during dry season was always less than 100 μm, whereas the size of MPs in the rainy season were always distributed in the range of 100–500 μm. Large-sized particles of MPs were more likely to be deposited in the sediment than those with small size [28]. From the perspective of spatial location, most of the locations with a high MP abundances in the Pearl River Delta were concentrated in the central area of the delta. Sampling sites such as CC, ZT, and BJ located in the central area had relatively high MP abundances in both the rainy and dry seasons. In some previous reports, MP abundances were greater in places with more human activity and higher populations in cities in the central part of the study area [14,29,30,31]. According to this conclusion, sampling sites closer to Guangzhou such as PRB, LHS, and SQ sites should have greater MP abundances, but our results did not support this conclusion. For this reason, we conducted on-site inspections in CC, BJ, and other sites; we found that a large oil depot was being constructed near the CC and BJ sites. A large number of plastic products (such as paints and plates) were used; we concluded that the high MP abundances in these sampling sites in all probability were related to the construction of the large oil depot.

3.2. Morphological Characteristics of MPs

The morphological characteristics of MPs including the color, shape, and size distribution in the surface water samples at different sampling sites in the Pearl River during the rainy and dry seasons were investigated and the results are shown in Figure 4. As depicted in Figure 4a, the color compositions of the MPs in the surface water during the rainy season were mainly gray, followed by black, white, yellow, green, and red. Meanwhile, the color compositions of the MPs during the dry season (Figure 4b) were more variable than those in the rainy season, which mainly included black, red, blue, orange, yellow, brown, gray, white, and green. The different color compositions of the MPs during the rainy and dry seasons indicated the diversity of MP colors and their differences in time and space along the Pearl River aquatic networks. In addition, the composition of shapes of the MPs during the rainy and dry seasons were also depicted in Figure 4c–d. During the rainy season, the compositions of MP shapes (Figure 4c) were predominantly striped, followed by granular, fragment, and fiber. In addition, the proportions of striped MPs at PRB and XT sites and those of granular MPs at LHS site were higher than those at other sites. The compositions of MP shapes in the dry season were also depicted in Figure 4d, and the shapes of MPs were mainly granular, lump, striped, and rod-like. The proportions of granular MPs at ZT and WH sites were much higher than those at other sites. The size distributions of MPs during the rainy season were as follows: 100–500 μm, 0–100 μm and >500 μm. However, the size distributions of MPs had some changes during the dry season. The above results confirmed that major differences existed in the morphological characteristics of MPs at the different sites during the rainy and dry seasons, mainly including differences in color, shape, and size distribution (Figure 4e,f).

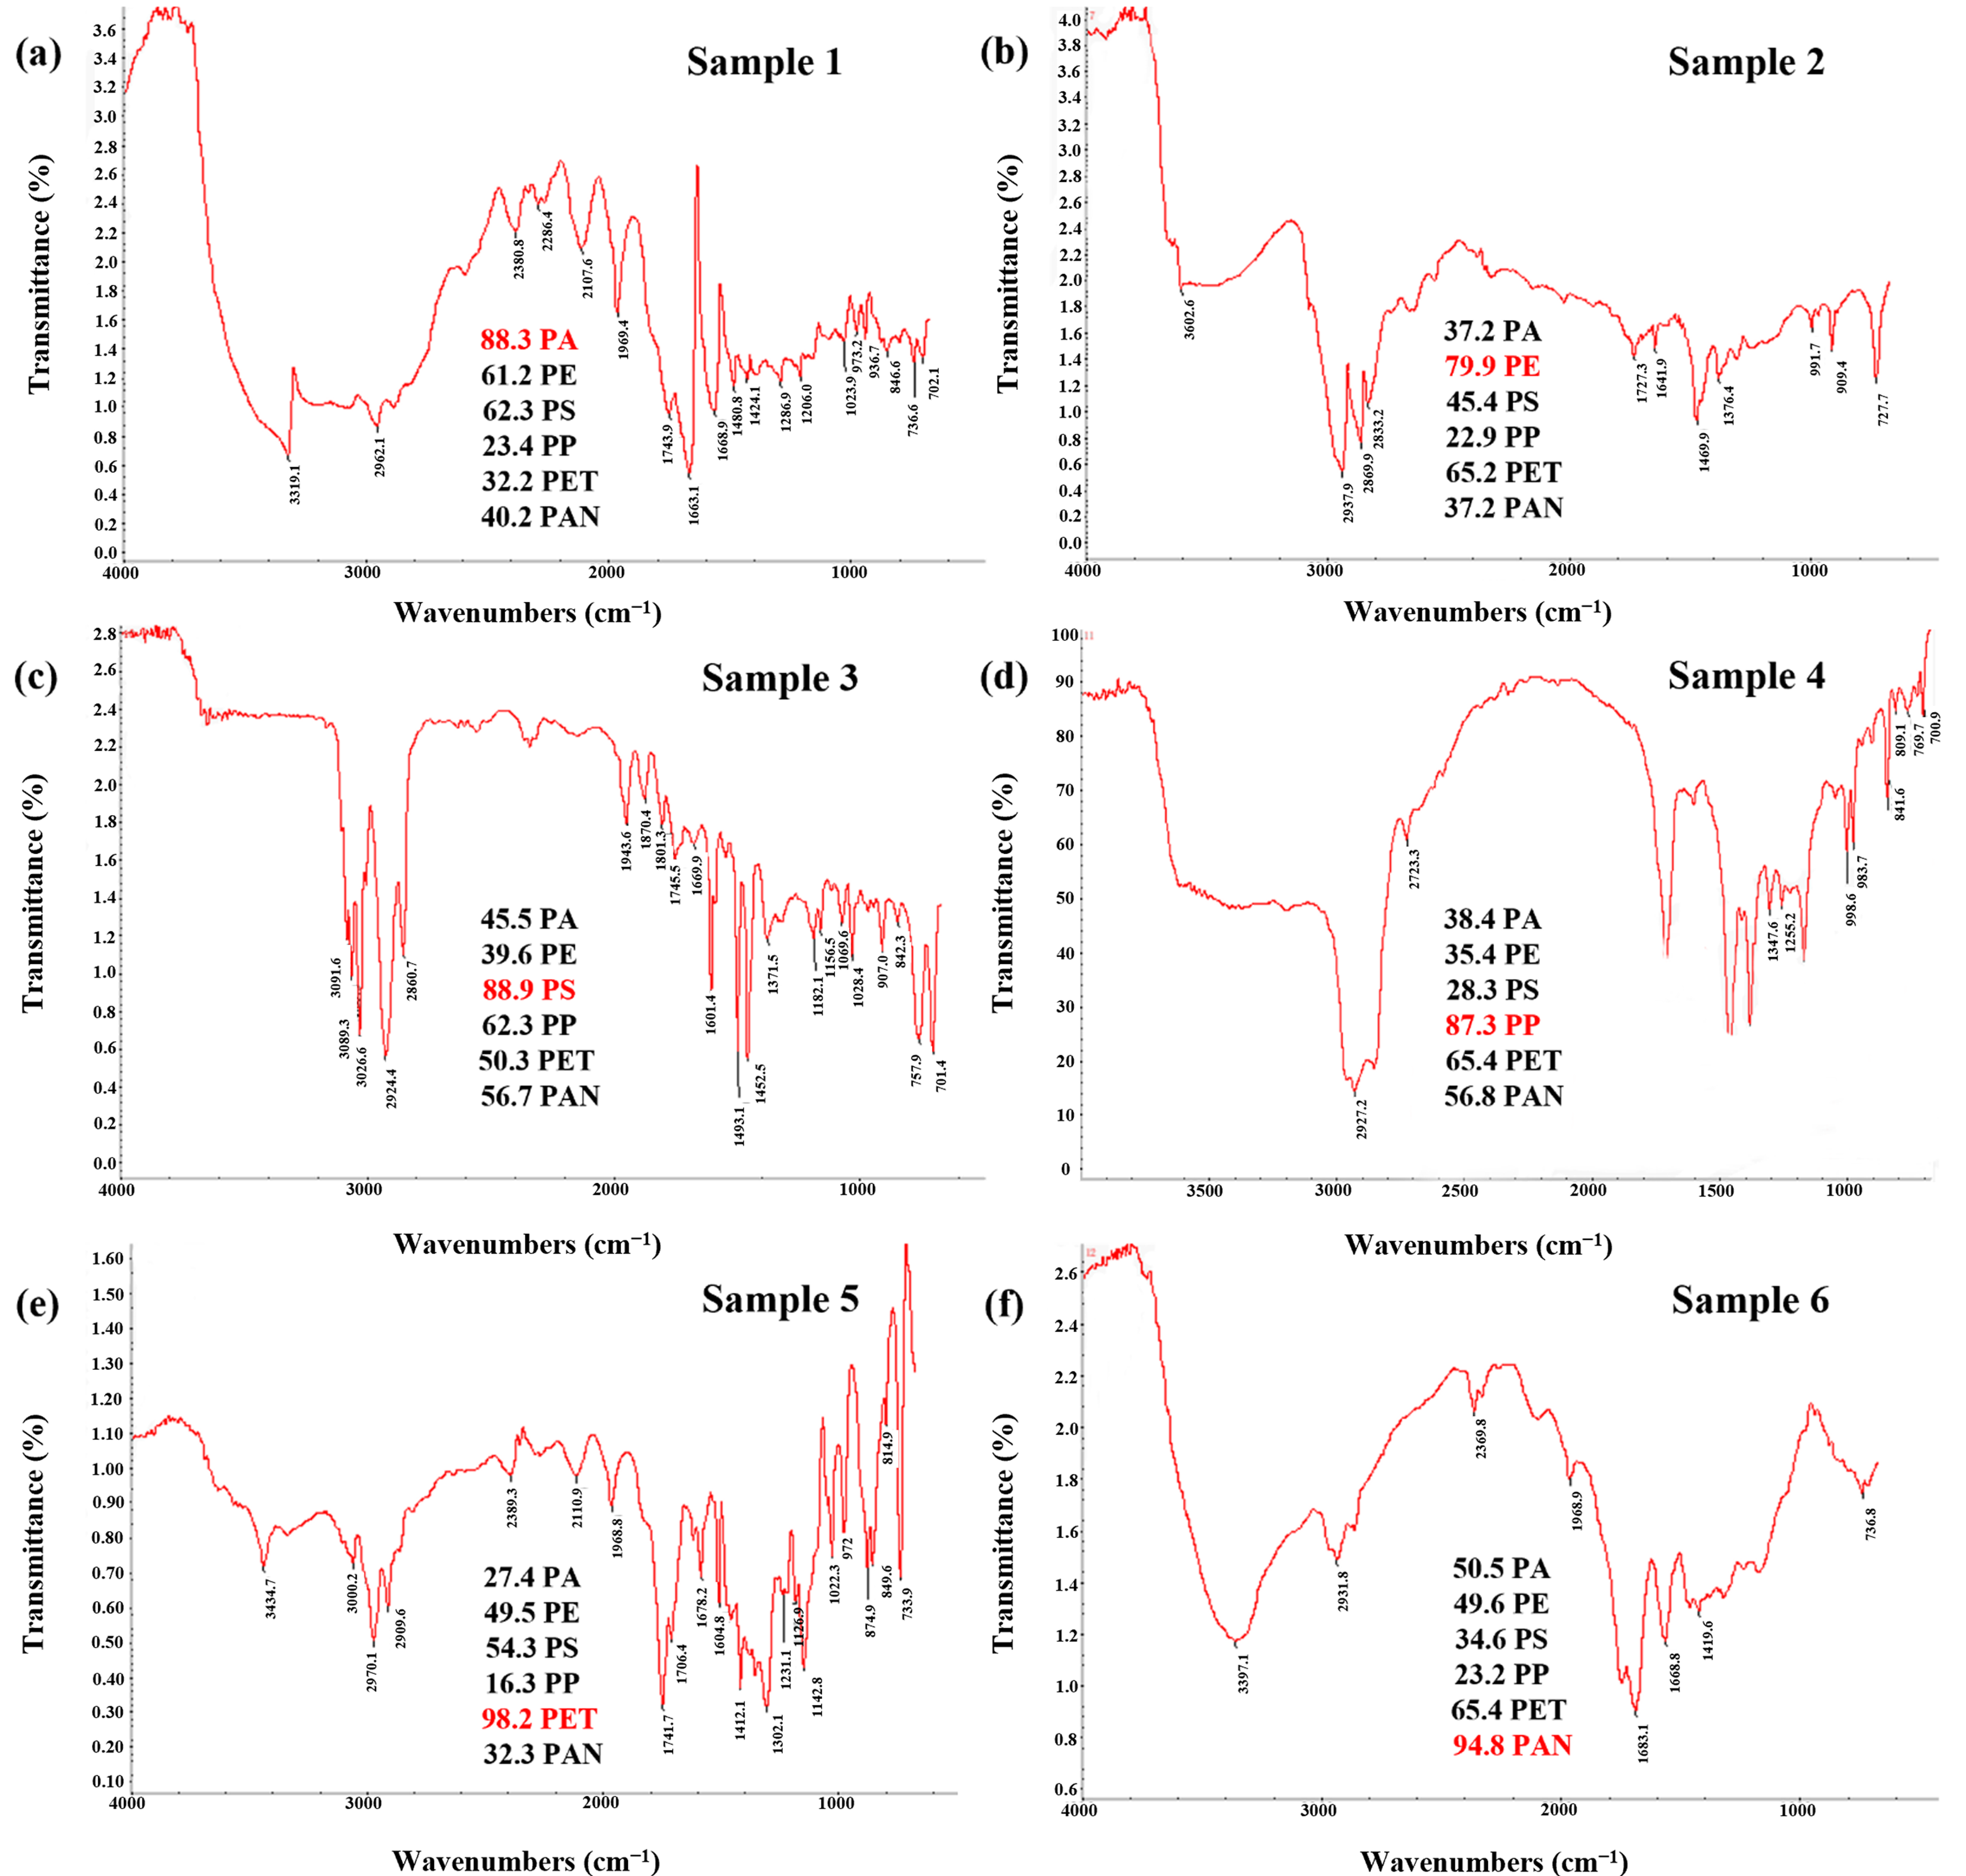
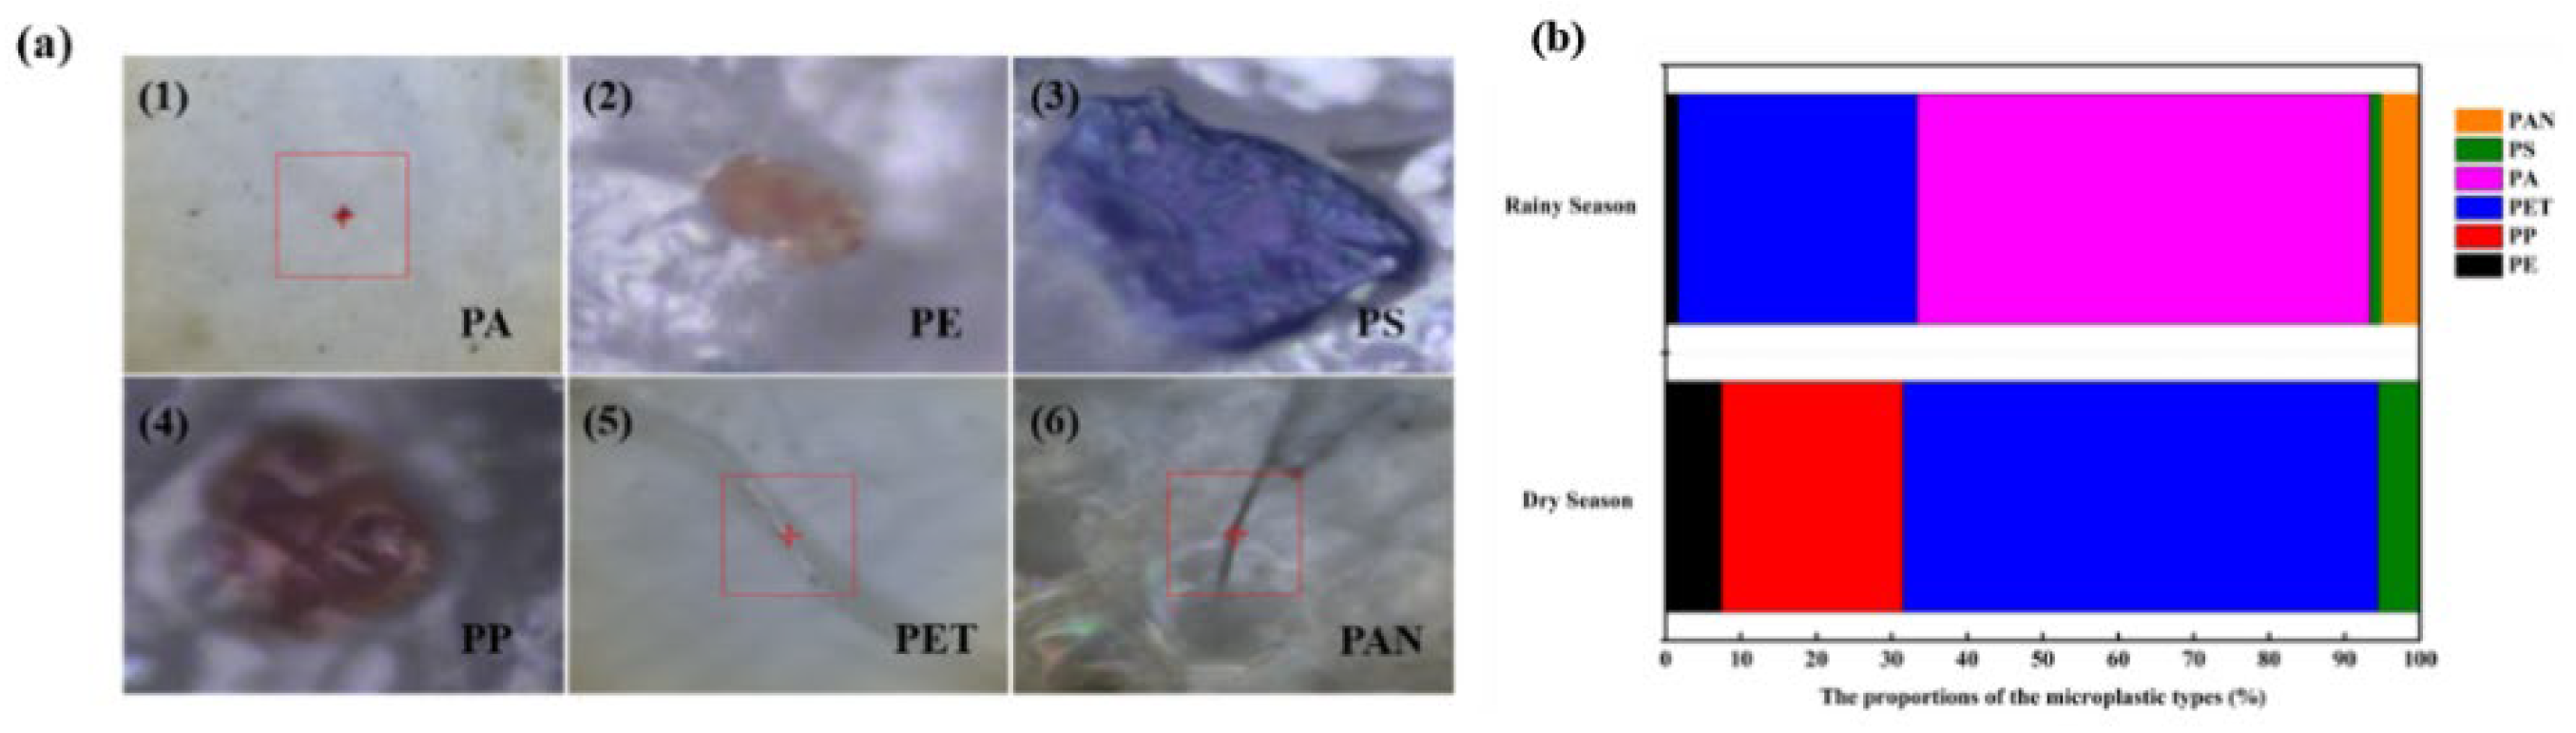
3.3. The Distribution, Micrographs, and FT-IR Results of MPs

The FT-IR characterizations of MPs in surface water samples from different sampling sites in the Pearl River Delta were conducted, which were compared with the standard FT-IR spectra of PA, PE, PS, PP, PET, and PAN respectively (Figure 5). The FT-IR spectra of MPs in the surface water samples were compared with the standard spectra based on the data such as position, number, intensity, and peak width of the characteristic peaks to calculate the matching degree. If the matching degree was greater than 70, the testing data was reliable and the MP compositions could be determined; if it was lower than 70, the data reliability still needed to be examined. As revealed in Figure 6, the FT-IR spectra of predominant MP types in surface water samples were divided into six types, all of which were compared with the standard FT-IR spectra of PA, PE, PS, PP, PET, and PAN respectively. The matching degree values revealed that the predominant MP types in surface water samples (Sample 1–6) were PA, PE, PS, PP, PET, and PAN respectively. In order to further confirm the types of MPs in our study, a large number of references were also cited, in which the FT-IR characteristic peaks were basically consistent with those in our study [23,32,33,34]. The distribution of MP types and their micrographs were also investigated (Figure 7). Figure 7a shows the micrographs of various MP types, which directly verified the existence of the above-mentioned MPs in the surface water of the 13 sites discussed above. Furthermore, the proportions of the various MP types in the surface water from these sites were also determined, and the results are depicted in Figure 7b. During the rainy season, the proportions of the MP types mainly included PA, PET, PAN, PE and PS, which had changed some in the dry season.

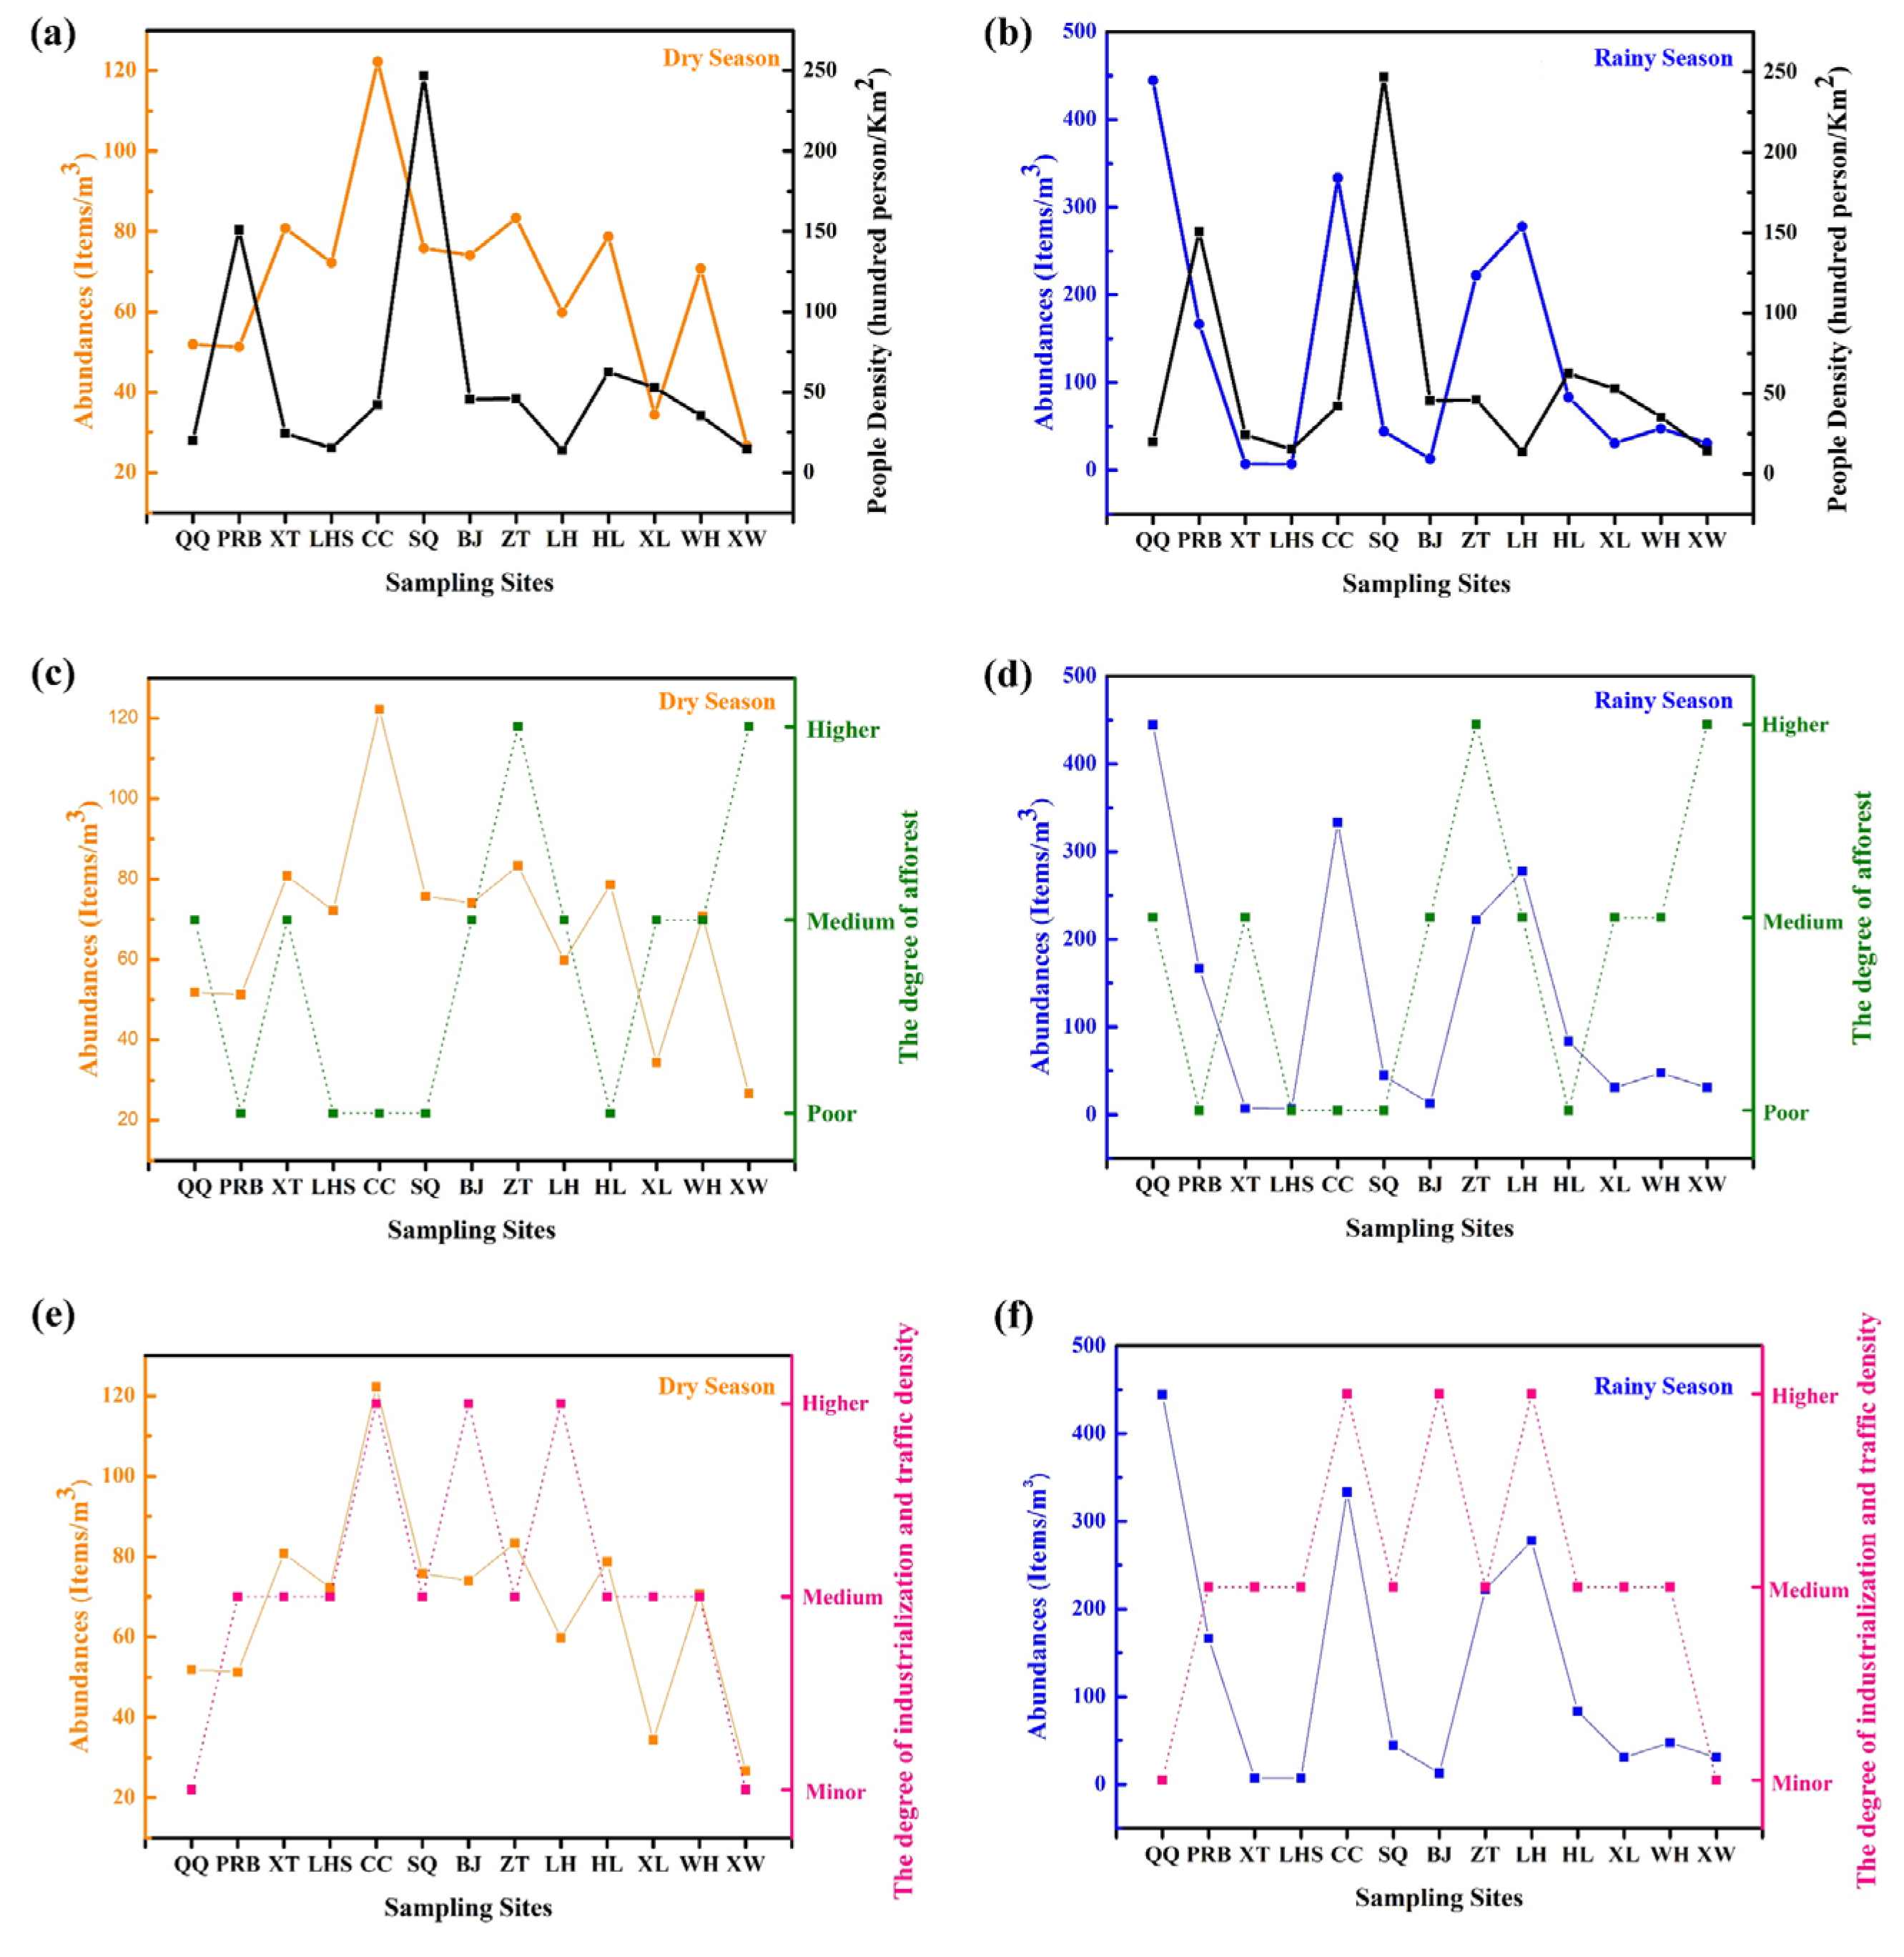
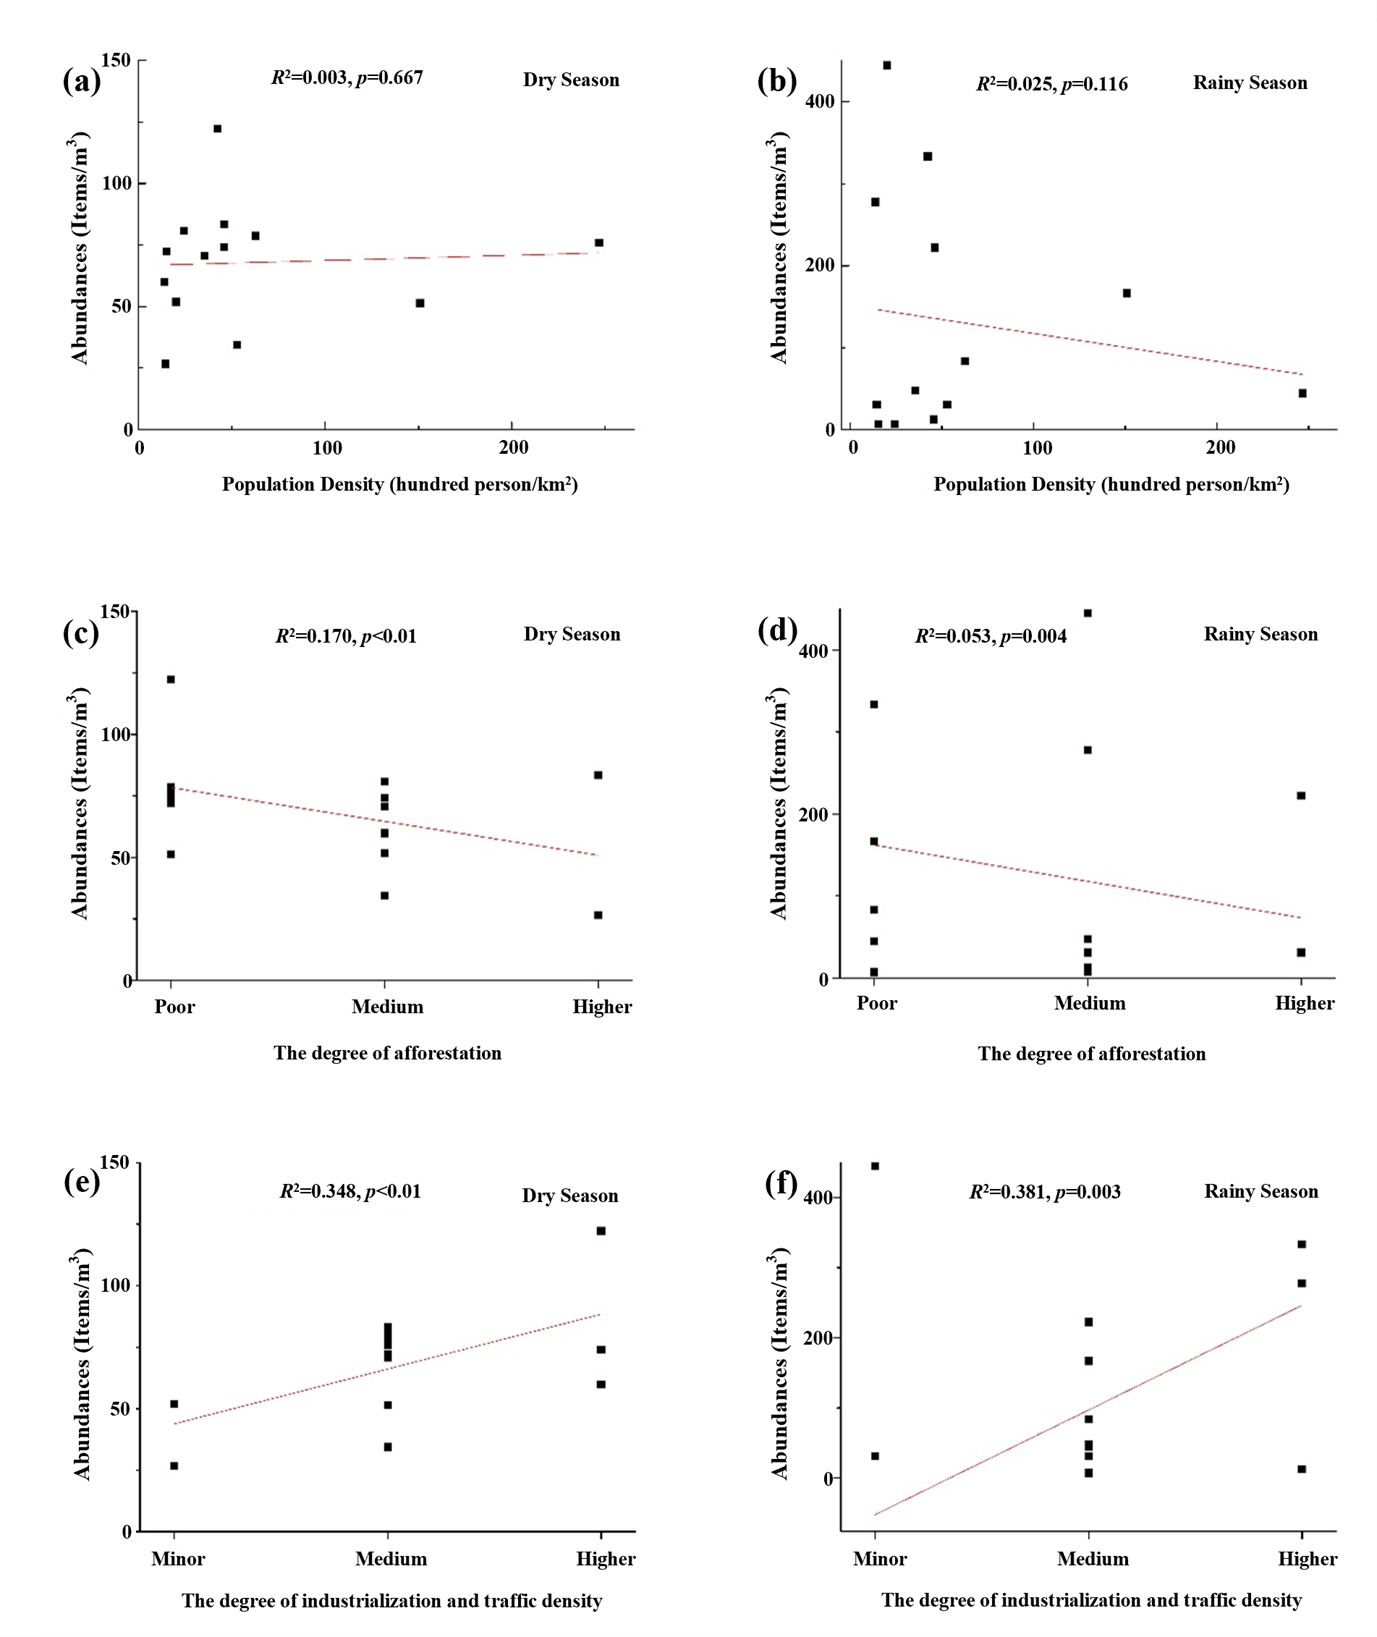
3.4. The Correlation Analysis of the Socio-Economic Indicators and MP Abundances

Three major socio-economic indicators were applied to investigate the potential relationships between MP abundances and human social and economic activities [35,36]. The three socio-economic indicators used in our study were the population density (hundred person/km2), the degree of afforestation, and the degree of industrialization and traffic density. The variations in the three above-mentioned socio-economic indicators of the selected 13 sampling sites had varying degrees of correlation with the abundances of MPs (Figure 8).
Figure 9 showed the Pearson correlation analysis between MP abundances and the three socio-economic indicators used in our study, namely, population density, the degree of afforestation, and the degree of industrialization and traffic density. Firstly, the statistical and correlation analyses showed that MP abundances in the surface water had no significant correlation with the changes in population density (p = 0.116 in the rainy season and p = 0.667 in the dry season). Secondly, Figure 8c,d showed that MP abundances during the study were related to the degree of afforestation. For example, the degree of afforestation at the CC site was much lower than that at the XW site in both the rainy season and the dry season, whereas MP abundances showed a completely opposite trend. Moreover, the results of Pearson correlation analysis between the degree of afforestation and MP abundances also proved the above opinion. Based on the Pearson correlation analysis results related to the degree of afforestation, the R2 and p values were 0.0529 and 0.004, respectively, in the rainy season and 0.170 and less than 0.01, respectively, in the dry season (Figure 9c,d), indicating the negative correlation between MP abundances and the degree of afforestation. Finally, Figure 8e–f showed the relationships between MP abundances at different sampling sites during the rainy and dry seasons and the degree of industrialization and traffic density. The statistics in Figure 8e,f and Figure 9e,f show that MP abundances had a significant positive correlation with the degree of industrialization and traffic density (p = 0.003 in the rainy season and p < 0.01 in the dry season). In general, the higher the degree of industrialization and traffic density, the higher the MP abundances in the surface water. Among them, the CC site had the most obvious positive correlation between the degree of industrialization and traffic density and MP abundances.
Plastics are only produced by people and do not exist in nature [37]. Anthropogenic activities such as urbanization and industrial production are associated with MP abundances in aquatic ecosystems [38,39,40]. In this study, we observed changes in anthropogenic activity indicators (population density, green area, number of factories, and vessels) with changes in MP abundances at different sampling sites (Figure 8). However, we found that there were no strong correlations between population density and MP abundances in both rainy season and dry season. This may occur because MPs in aquatic ecosystems will settle with spatial movement over time and eventually be deposited into the sediment [41,42]. Although population density was not highly correlated with MP abundances, we found that the degree of greening around a sampling site, as well as the number of factories and ships, was correlated with MP abundances. MP abundances in the sampling sites with a low degree of afforestation were obviously higher than that in the sampling sites with more afforestation. In both the rainy season and dry season, MP abundances were higher as the number of factories and ships increased. Some of the MPs that had migrated from the upstream water system will remain in the bottom mud due to sedimentation, whereas most of the MPs around each sampling site may have been produced by the production activities of factories and the corrosion or peeling-off of the plastic coating on ships [43,44,45]. Although this study found that there is a certain correlation between the degree of afforestation and the degree of industrialization and traffic density with MP abundances in the Pearl River Delta, we cannot rule out the influence of other human activities on the abundances and distributions of MPs; additional indicators will need to be considered in future studies.

3.5. Potential Ecological Risk Associated with MP Abundance

In order to assess the potential ecological risks associated with MP abundances in the Pearl River Delta, four related parameters (Ei, RI, H, and PLI) [14,26] were applied in our study; the results are presented in Table 2. The Ei values of PAN and PA were much higher than those of other materials (Table 2), indicating that the risks posed by PAN and PA were significantly higher than those posed by PE, PP, PET, and PS at all sites [46]. In addition, the RI values of these sites during the rainy and dry seasons along the Pearl River were also calculated and summarized. The RI values at QQ, ZT, CC, and LH sites in the rainy season were 74,350, 37,527, 6243, and 5603, respectively, which were significantly higher than those at other sites, indicating that the potential ecological risks posed by MPs at the above-mentioned four sites should receive more attention [47]. Moreover, we found that in general, the RI value of the same sampling site in the rainy season was much higher than that in the dry season. In addition, the risk index (H) and PLI values indicated that the potential chemical risks posed by the MPs along the water networks of the Pearl River were affected by the changes of period and time. For all sites, these values were significantly higher in the rainy season than those in the dry season, indicating that the potential ecological risks posed by the MPs along the Pearl River Delta aquatic networks should receive more attention in the rainy season [48,49].
In recent years, many studies have addressed the potential ecological risks posed by MPs in many types of environments. At present, the commonly used indicators for hazard and risk assessment are Ei, RI, H, and PLI, which were also applied in the present study in order to evaluate the potential ecological risks posed by the MPs in the Pearl River Delta [24,25,26]. As presented in Table 2, the extremely high Ei values of PA and PAN at all sites in the rainy season are highly significant because of their potential high toxicity to aquatic organisms in the Pearl River Delta aquatic networks [23]. The PA accounted for 60.0% of all of the detected MPs in the rainy season (Figure 7), which was present in large amounts and had a relatively strong probability of being ingested by aquatic animals when compared with other MPs. However, although the PAN only accounted for 5.0% of all types of MPs during the rainy season, PAN and other toxic MPs are easily consumed by fish and other animals in aquatic ecosystems [50]. Furthermore, the RI values might be related to the sources of MPs. The higher RI values of the samples at the QQ, CC, BJ, ZT, and LH sites indicated that the above-mentioned five sites might act as the main source areas of MPs, and so posed greater potential risks to aquatic organisms. In addition, the low PLI values at all of the sampling sites indicated that the potential risks posed by these MPs in the Pearl River Delta were low. However, the H values at the QQ, LHS, CC, BJ, ZT, HL, WH, and XW sites were 196, 130, 130, 345, 293, 130, 106, and 130, respectively, all of which are considered level III pollutants in China, indicating that the potential risks posed by the MPs in these sampling sites in the Pearl River Delta were higher than those in other sampling sites.
As far as we know, many researchers have underestimated the potential harm caused by MPs and related pollutants in the Pearl River Delta aquatic networks for a long time [51,52,53]. Actually, the environmental pollution caused by human activities has a significant impact on the safety of aquatic organisms and human health around the Pearl River Delta aquatic networks [54,55,56]. According to the extensive data in this study, the surface waters of the Pearl River Delta contain significant amounts of MPs. The abundance, morphological characteristics, and temporal and spatial distributions of MPs were investigated in this study. In addition, the socio-economic indicators and potential ecological risks of MPs were also explored. The results indicated that the abundance and potential ecological risk index of MPs in the Pearl River Delta were generally high during the rainy season, indicating that the previously neglected potential ecological risks of MPs in the Pearl River Delta deserves further attention in the future.

4. Conclusions

In this study, the abundance, temporal and spatial distribution, morphological characteristics, socio-economic indicators, and the potential ecological risks of MPs in the Pearl River Delta were investigated, and the following conclusions were drawn. First, the abundance and the temporal and spatial distribution of MPs in the Pearl River Delta are unbalanced and divergent. The MP abundances in the rainy season are significantly higher than those in the dry season, which may be related to the flow and velocity of water in different seasons. During the rainy season, the major color, shape, and size distribution of MPs are gray (38.64%), striped (78.29%), and 100–500 μm (57.38%), respectively. The most common color, shape, and size distribution of MPs in the dry season are black (38.64%), granular (78.29%), and 0–100 μm (70.29%), respectively. Meanwhile, the significant differences in MP abundances and characteristics are also observed among 13 sampling sites. For example, the MP abundance at QQ site was significantly higher than those at other sites in the rainy season. Furthermore, the proportions of granular MPs at ZT and WH sites were much higher than those at other sites in the dry season. Second, the socio-economic indicators, including the degree of afforestation, the degree of industrialization and traffic density, the number of factories and ships, and other indicators of the intensity of human activities, have varying degrees of impact on the abundance of MPs. MP abundances are negatively correlated with the degree of afforestation, positively correlated with the degree of industrialization and traffic density, and not correlated with the population density. Finally, the assessment of the potential ecological risks posed by MPs is conducive to the safety and health of aquatic organisms and humans in the surrounding area, and the results of the risk assessment show that most locations in the Pearl River Delta are areas with a high risk of MP pollution. In particular, QQ, CC, BJ, ZT, and LH sites may be the main source regions of MPs in the Pearl River Delta because of the high RI values, which have great potential risks to aquatic organisms and should be paid more attention in the future. In conclusion, this study provides a theoretical basis for related research on MPs in the Pearl River Delta. We can fully understand the overall ecological risks posed by MPs in the Pearl River Delta, which can further improve our understanding of the need to protect aquatic environments.

Author Contributions

Y.G. designed and wrote the paper. K.F., C.W. and Y.Z. contributed to data processing. H.L. and Y.M. contributed to investigation. Q.L. and Z.L. contributed to the review and edit. All authors have read and agreed to the published version of the manuscript.

Funding

This study was supported by the Guangdong Basic and Applied Basic Research Foundation (2021A1515011306) and the National Key R&D Program of China (2018YFD0900802).

Acknowledgments

We thank LetPub (www.letpub.com, accessed on 20 January 2022) for its linguistic assistance during the preparation of this manuscript.

Conflicts of Interest

The authors declare no conflict of interest.

References

  1. Thompson, R.C.; Olsen, Y.; Mitchell, R.P.; Davis, A.; Rowland, S.J.; John, A.W.G.; McGonigle, D.; Russell, A.E. Lost at sea: Where is all the plastic? Science 2004, 304, 838. [Google Scholar] [CrossRef] [PubMed]
  2. Zhao, Y.B.; Gao, P.P.; Ni, H.G. A Chemical Time Bomb: Future Risks of Microplastics. Water Air Soil Pollut. 2019, 230, 268. [Google Scholar] [CrossRef]
  3. Van Cauwenberghe, L.; Vanreusel, A.; Mees, J.; Janssen, C.R. Microplastic pollution in deep-sea sediments. Environ. Pollut. 2013, 182, 495–499. [Google Scholar] [CrossRef]
  4. Lusher, A.L.; Tirelli, V.; O’Connor, I.; Officer, R. Microplastics in Arctic polar waters: The first reported values of particles in surface and sub-surface samples. Sci. Rep. 2015, 5, 14947. [Google Scholar] [CrossRef] [PubMed]
  5. Jambeck, J.R.; Geyer, R.; Wilcox, C.; Siegler, T.R.; Perryman, M.; Andrady, A.; Narayan, R.; Law, K.L. Plastic waste inputs from land into the ocean. Science 2015, 347, 768–771. [Google Scholar] [CrossRef]
  6. Wong, J.K.H.; Lee, K.K.; Tang, K.H.D.; Yap, P.S. Microplastics in the freshwater and terrestrial environments: Prevalence, fates, impacts and sustainable solutions. Sci. Total Environ. 2020, 719, 137512. [Google Scholar] [CrossRef] [PubMed]
  7. Kumar, R.; Sharma, P.; Manna, C.; Jain, M. Abundance, interaction, ingestion, ecological concerns, and mitigation policies of microplastic pollution in riverine ecosystem: A review. Sci. Total Environ. 2021, 782, 146695. [Google Scholar] [CrossRef]
  8. Zhou, A.G.; Zhang, Y.; Xie, S.L.; Chen, Y.L.; Li, X.; Wang, J.; Zou, J.X. Microplastics and their potential effects on the aquaculture systems: A critical review. Rev. Aquac. 2021, 13, 719–733. [Google Scholar] [CrossRef]
  9. Xu, Y.Y.; Chan, F.K.S.; Johnson, M.; Stanton, T.; He, J.; Jia, T.; Wang, J.; Wang, Z.L.; Yao, Y.T.; Yang, J.T.; et al. Microplastic pollution in Chinese urban rivers: The influence of urban factors. Resour. Conserv. Recycl. 2021, 173, 105686. [Google Scholar] [CrossRef]
  10. Vital, S.A.; Cardoso, C.; Avio, C.; Pittura, L.; Regoli, F.; Bebianno, M.J. Do microplastic contaminated seafood consumption pose a potential risk to human health? Mar. Pollut. Bull. 2021, 171, 112769. [Google Scholar] [CrossRef] [PubMed]
  11. Barbosa, F.; Adeyemi, J.A.; Bocato, M.Z.; Comas, A.; Campiglia, A. A critical viewpoint on current issues, limitations, and future research needs on micro- and nanoplastic studies: From the detection to the toxicological assessment. Environ. Res. 2020, 182, 109089. [Google Scholar] [CrossRef] [PubMed]
  12. Yin, L.S.; Wen, X.F.; Huang, D.L.; Du, C.Y.; Deng, R.; Zhou, Z.Y.; Tao, J.X.; Li, R.J.; Zhou, W.; Wang, Z.Y.; et al. Interactions between microplastics/nanoplastics and vascular plants. Environ. Pollut. 2021, 290, 117999. [Google Scholar] [CrossRef] [PubMed]
  13. Beloe, C.J.; Browne, M.A.; Johnston, E.L. Plastic Debris As a Vector for Bacterial Disease: An Interdisciplinary Systematic Review. Environ. Sci. Technol. 2022, 56, 2950–2958. [Google Scholar] [CrossRef]
  14. Wang, S.D.; Zhang, C.N.; Pan, Z.K.; Sun, D.; Zhou, A.G.; Xie, S.L.; Wang, J.; Zou, J.X. Microplastics in wild freshwater fish of different feeding habits from Beijiang and Pearl River Delta regions, south China. Chemosphere 2020, 258, 127345. [Google Scholar] [CrossRef] [PubMed]
  15. Fan, Y.J.; Zheng, K.; Zhu, Z.W.; Chen, G.S.; Peng, X.Z. Distribution, sedimentary record, and persistence of microplastics in the Pearl River catchment, China. Environ. Pollut. 2019, 251, 862–870. [Google Scholar] [CrossRef]
  16. Zuo, L.Z.; Sun, Y.X.; Li, H.X.; Hu, Y.X.; Lin, L.; Peng, J.P.; Xu, X.R. Microplastics in mangrove sediments of the Pearl River Estuary, South China: Correlation with halogenated flame retardants’ levels. Sci. Total Environ. 2020, 725, 138344. [Google Scholar] [CrossRef] [PubMed]
  17. Li, S.Y.; Wang, Y.L.; Liu, L.H.; Lai, H.W.; Zeng, X.C.; Chen, J.Y.; Liu, C.; Luo, Q.J. Temporal and Spatial Distribution of Microplastics in a Coastal Region of the Pearl River Estuary, China. Water 2021, 13, 1618. [Google Scholar] [CrossRef]
  18. Dou, M.; Zuo, Q.T.; Zhang, J.P.; Li, C.Y.; Li, G.Q. Influence of changes in hydrodynamic conditions on cadmium transport in tidal river network of the Pearl River Delta, China. Environ. Monit. Assess. 2013, 185, 7501–7516. [Google Scholar] [CrossRef] [PubMed]
  19. Liu, B.J.; Peng, S.H.; Liao, Y.Y.; Long, W.L. The causes and impacts of water resources crises in the Pearl River Delta. J. Clean. Prod. 2018, 177, 413–425. [Google Scholar] [CrossRef]
  20. Fan, J.J.; Wang, S.; Tang, J.P.; Zhao, J.L.; Wang, L.; Wang, J.X.; Liu, S.L.; Li, F.; Long, S.X.; Yang, Y. Bioaccumulation of endocrine disrupting compounds in fish with different feeding habits along the largest subtropical river, China. Environ. Pollut. 2019, 247, 999–1008. [Google Scholar] [CrossRef]
  21. Yan, M.T.; Nie, H.Y.; Xu, K.H.; He, H.Y.; Hu, Y.T.; Huang, Y.M.; Wang, J. Microplastic abundance, distribution and composition in the Pearl River along Guangzhou city and Pearl River estuary, China. Chemosphere 2019, 217, 879–886. [Google Scholar] [CrossRef] [PubMed]
  22. Zhou, Y.; Liu, J.; Wu, R.H. Analysis on water environmental problems and their causes in Pearl River delta. Yunnan Geogr. Environ. Res. 2003, 15, 47–53. [Google Scholar]
  23. Mai, Y.Z.; Peng, S.Y.; Lai, Z.N.; Wang, X.S. Measurement, quantification, and potential risk of microplastics in the mainstream of the Pearl River (Xijiang River) and its estuary, Southern China. Environ. Sci. Pollut. Res. 2021, 28, 53127–53140. [Google Scholar] [CrossRef]
  24. Li, H.; Yang, J.Q.; Ye, B.; Jiang, D.Y. Pollution characteristics and ecological risk assessment of 11 unheeded metals in sediments of the Chinese Xiangjiang River. Environ. Geochem. Health 2019, 41, 1459–1472. [Google Scholar] [CrossRef] [PubMed]
  25. Li, R.L.; Yu, L.Y.; Chai, M.W.; Wu, H.L.; Zhu, X.S. The distribution, characteristics and ecological risks of microplastics in the mangroves of Southern China. Sci. Total Environ. 2020, 708, 135025. [Google Scholar] [CrossRef] [PubMed]
  26. Lithner, D.; Larsson, A.; Dave, G. Environmental and health hazard ranking and assessment of plastic polymers based on chemical composition. Sci. Total Environ. 2011, 409, 3309–3324. [Google Scholar] [CrossRef] [PubMed]
  27. Cheung, P.K.; Fok, L.; Hung, P.L.; Cheung, L.T.O. Spatio-temporal comparison of neustonic microplastic density in Hong Kong waters under the influence of the Pearl River Estuary. Sci. Total Environ. 2018, 628–629, 731–739. [Google Scholar] [CrossRef] [PubMed]
  28. Li, X.T.; Liang, R.F.; Li, Y.; Zhang, Y.D.; Wang, Y.M.; Li, K.F. Microplastics in inland freshwater environments with different regional functions: A case study on the Chengdu Plain. Sci. Total Environ. 2021, 789, 147938. [Google Scholar] [CrossRef] [PubMed]
  29. Bissen, R.; Chawchai, S. Microplastics on beaches along the eastern Gulf of Thailand—A preliminary study. Mar. Pollut. Bull. 2020, 157, 111345. [Google Scholar] [CrossRef] [PubMed]
  30. Yin, L.S.; Wen, X.F.; Du, C.Y.; Jiang, J.; Wu, L.X.; Zhang, Y.; Hu, Z.H.; Hu, S.P.; Feng, Z.Q.; Zhou, Z.Y.; et al. Comparison of the abundance of microplastics between rural and urban areas: A case study from East Dongting Lake. Chemosphere 2020, 244, 125486. [Google Scholar] [CrossRef] [PubMed]
  31. Wu, Q.Q.; Liu, S.G.; Chen, P.; Liu, M.Y.; Cheng, S.Y.; Ke, H.W.; Huang, P.; Ding, Y.C.; Cai, M.G. Microplastics in seawater and two sides of the Taiwan Strait: Reflection of the social-economic development. Mar. Pollut. Bull. 2021, 169, 112588. [Google Scholar] [CrossRef] [PubMed]
  32. Wang, G.L.; Lu, J.J.; Tong, Y.B.; Liu, Z.L.; Zhou, H.J.; Xiayihazi, N. Occurrence and pollution characteristics of microplastics in surface water of the Manas River Basin, China. Sci. Total Environ. 2020, 710, 136099. [Google Scholar] [CrossRef] [PubMed]
  33. Wu, P.; Tang, Y.; Dang, M.; Wang, S.; Jin, H.; Liu, Y.; Jing, H.; Zheng, C.; Yi, S.; Cai, Z. Spatial-Temporal Distribution of Microplastics in Surface Water and Sediments of Maozhou River within Guangdong-Hong Kong-Macao Greater Bay Area. Sci. Total Environ. 2020, 717, 135187. [Google Scholar] [CrossRef] [PubMed]
  34. Mohamed, H.E.; Abdullah, A.; Salem, S.A. Optimization of amine-terminated polyacrylonitrile synthesis and characterization. Arab. J. Chem. 2014, 7, 235. [Google Scholar]
  35. Siegfried, M.; Koelmans, A.A.; Besseling, E.; Kroeze, C. Export of microplastics from land to sea. A modelling approach. Water Res. 2017, 127, 249–257. [Google Scholar] [CrossRef]
  36. Miranda, M.N.; Silva, A.M.T.; Pereira, M.F.R. Microplastics in the environment: A DPSIR analysis with focus on the responses. Sci. Total Environ. 2020, 718, 134968. [Google Scholar] [CrossRef] [PubMed]
  37. Santos, R.G.; Machovsky-Capuska, G.E.; Andrades, R. Plastic ingestion as an evolutionary trap: Toward a holistic understanding. Science 2021, 373, 56. [Google Scholar] [CrossRef] [PubMed]
  38. Tang, G.W.; Liu, M.Y.; Zhou, Q.; He, H.X.; Chen, K.; Zhang, H.B.; Hu, J.H.; Huang, Q.H.; Luo, Y.M.; Ke, H.W. Microplastics and polycyclic aromatic hydrocarbons (PAHs) in Xiamen coastal areas: Implications for anthropogenic impacts. Sci. Total Environ. 2018, 634, 811–820. [Google Scholar] [CrossRef] [PubMed]
  39. Zhou, Y.F.; Liu, X.N.; Wang, J. Characterization of microplastics and the association of heavy metals with microplastics in suburban soil of central China. Sci. Total Environ. 2019, 694, 133798. [Google Scholar] [CrossRef] [PubMed]
  40. Huang, Y.L.; Tian, M.; Jin, F.; Chen, M.Y.; Liu, Z.G.; He, S.Q.; Li, F.X.; Yang, L.Y.; Fang, C.; Mu, J.L. Coupled effects of urbanization level and dam on microplastics in surface waters in a coastal watershed of Southeast China. Mar. Pollut. Bull. 2020, 154, 111089. [Google Scholar] [CrossRef] [PubMed]
  41. Zhang, K.; Chen, X.C.; Xiong, X.; Ruan, Y.F.; Zhou, H.E.; Wu, C.X.; Lam PK, S. The hydro-fluctuation belt of the Three Gorges Reservoir: Source or sink of microplastics in the water? Environ. Pollut. 2019, 248, 279–285. [Google Scholar] [CrossRef]
  42. Amrutha, K.; Warrier, A.K. The first report on the source-to-sink characterization of microplastic pollution from a riverine environment in tropical India. Sci. Total Environ. 2020, 739, 140377. [Google Scholar] [CrossRef] [PubMed]
  43. Song, Y.K.; Hong, S.H.; Jang, M.; Kang, J.H.; Kwon, O.Y.; Han, G.M.; Shim, W.J. Large Accumulation of Micro-sized Synthetic Polymer Particles in the Sea Surface Microlayer. Environ. Sci. Technol. 2014, 48, 9014–9021. [Google Scholar] [CrossRef]
  44. Song, Y.K.; Hong, S.H.; Jang, M.; Han, G.M.; Shim, W.J. Occurrence and Distribution of Microplastics in the Sea Surface Microlayer in Jinhae Bay, South Korea. Arch. Environ. Contam. Toxicol. 2015, 69, 279–287. [Google Scholar] [CrossRef] [PubMed]
  45. Zhou, Z.Y.; Zhang, P.Y.; Zhang, G.M.; Wang, S.Q.; Cai, Y.J.; Wang, H.J. Vertical microplastic distribution in sediments of Fuhe River estuary to Baiyangdian Wetland in Northern China. Chemosphere 2021, 280, 130800. [Google Scholar] [CrossRef] [PubMed]
  46. Kularatne, R.K.A. Occurrence of selected volatile organic compounds in a bra cup manufacturing facility. Int. J. Environ. Sci. Technol. 2017, 14, 315–322. [Google Scholar] [CrossRef]
  47. Yan, D.X.; Bai, Z.K.; Liu, X.Y. Heavy-Metal Pollution Characteristics and Influencing Factors in Agricultural Soils: Evidence from Shuozhou City, Shanxi Province, China. Sustainability 2020, 12, 1907. [Google Scholar] [CrossRef]
  48. Xu, P.; Peng, G.Y.; Su, L.; Gao, Y.Q.; Gao, L.; Li, D.J. Microplastic risk assessment in surface waters: A case study in the Changjiang Estuary, China. Mar. Pollut. Bull. 2018, 133, 647–654. [Google Scholar] [CrossRef]
  49. Neelavannan, K.; Sen, I.S.; Lone, A.M.; Gopinath, K. Microplastics in the high-altitude Himalayas: Assessment of microplastic contamination in freshwater lake sediments, Northwest Himalaya (India). Chemosphere 2021, 290, 133354. [Google Scholar] [CrossRef]
  50. Eriksson, C.; Burton, H. Origins and biological accumulation of small plastic particles in fur seals from Macquarie Island. Ambio 2003, 32, 380–384. [Google Scholar] [CrossRef]
  51. Wang, J.Z.; Nie, Y.F.; Luo, X.L.; Zeng, E.Y. Occurrence and phase distribution of polycyclic aromatic hydrocarbons in riverine runoff of the Pearl River Delta, China. Mar. Pollut. Bull. 2008, 57, 767–774. [Google Scholar] [CrossRef] [PubMed]
  52. Xu, W.H.; Yan, W.; Li, X.D.; Zou, Y.D.; Chen, X.X.; Huang, W.X.; Miao, L.; Zhang, R.J.; Zhang, G.; Zou, S.C. Antibiotics in riverine runoff of the Pearl River Delta and Pearl River Estuary, China: Concentrations, mass loading and ecological risks. Environ. Pollut. 2013, 182, 402–407. [Google Scholar] [CrossRef] [PubMed]
  53. Zhang, L.Y.; Guo, S.H.; Wu, B. The source, spatial distribution and risk assessment of heavy metals in soil from the Pearl River Delta Based on the National Multi-Purpose Regional Geochemical Survey. PLoS ONE 2015, 10, e0132040. [Google Scholar] [CrossRef] [PubMed]
  54. Ouyang, T.P.; Zhu, Z.Y.; Kuang, Y.Q. Assessing impact of urbanization on river water quality in the Pearl River Delta Economic Zone, China. Environ. Monit. Assess. 2006, 120, 313–325. [Google Scholar] [CrossRef] [PubMed]
  55. Lu, Q.Q.; Bai, J.H.; Zhang, G.L.; Wu, J.J. Effects of coastal reclamation history on heavy metals in different types of wetland soils in the Pearl River Delta: Levels, sources and ecological risks. J. Clean. Prod. 2020, 272, 122668. [Google Scholar] [CrossRef]
  56. Renzi, M.; Pauna, V.H.; Provenza, F.; Munari, C.; Mistri, M. Marine Litter in Transitional Water Ecosystems: State of The Art Review Based on a Bibliometric Analysis. Water 2020, 12, 612. [Google Scholar] [CrossRef]
Figure 1. Location of the different sampling sites in the Pearl River Delta. The map was produced using ArcGIS software (Version 10.5, Redlands, CA, USA). Note: QQ, Qingqi; PRB, Pearl River Bridge; XT, Xiaotang; LHS, Lianhuashan; CC, Chencun; SQ, Shiqiao; BJ, Beijiao; ZT, Zuotan; LH, Lanhe; HL, Hengli; XL, Xiaolan; WH, Waihai; XW, Xinwei. An inset map shows the location of the study area within China.
Water 14 02545 g001
Figure 2. Process of extraction and testing of microplastics.
Water 14 02545 g002
Figure 3. The microplastic abundances during different seasons in the Pearl River Delta. Note: QQ, Qingqi; PRB, Pearl River Bridge; XT, Xiaotang; LHS, Lianhuashan; CC, Chencun; SQ, Shiqiao; BJ, Beijiao; ZT, Zuotan; LH, Lanhe; HL, Hengli; XL, Xiaolan; WH, Waihai; XW, Xinwei.
Water 14 02545 g003
Figure 4. Color, shape, and size distribution of microplastics in the surface water samples at different sampling sites in the Pearl River Delta. (a,b) color compositions during the rainy and dry seasons; (c,d) shape compositions during the rainy and dry seasons; (e,f) size distributions during the rainy and dry seasons. Note: QQ, Qingqi; PRB, Pearl River Bridge; XT, Xiaotang; LHS, Lianhuashan; CC, Chencun; SQ, Shiqiao; BJ, Beijiao; ZT, Zuotan; LH, Lanhe; HL, Hengli; XL, Xiaolan; WH, Waihai; XW, Xinwei.
Water 14 02545 g004
Figure 5. The standard FT-IR spectra of the predominant microplastics. (a) PA; (b) PE; (c) PS; (d) PP; (e) PET; and (f) PAN.
Water 14 02545 g005
Figure 6. FT-IR spectra of the predominant microplastics in surface water samples from 13 sampling sites in the Pearl River Delta. (a) Sample 1 = PA; (b) Sample 2 = PE; (c) Sample 3 = PS; (d) Sample 4 = PP; (e) Sample 5 = PET; and (f) Sample 6 = PAN.
Water 14 02545 g006
Figure 7. (a) Micrographs of the predominant microplastics; (b) the proportions of various microplastic types found during different seasons in the Pearl River Delta. Note: PA, polyamide; PE, polyethylene; PS, polystyrene; PP, polypropylene; PET, polyethylene terephthalate; and PAN, polyacrylonitrile.
Water 14 02545 g007
Figure 8. Correlations of microplastic abundances and the related socio-economic indicators. The applied socio-economic parameters were as follows: (a,b) population density (100 persons/km2); (c,d) the degree of afforestation; (e,f) the degree of industrialization and traffic density. Note: QQ, Qingqi; PRB, Pearl River Bridge; XT, Xiaotang; LHS, Lianhuashan; CC, Chencun; SQ, Shiqiao; BJ, Beijiao; ZT, Zuotan; LH, Lanhe; HL, Hengli; XL, Xiaolan; WH, Waihai; XW, Xinwei.
Water 14 02545 g008
Figure 9. Pearson correlation analysis between microplastic abundances and (a,b) population density; (c,d) the degree of afforestation; (e,f) the degree of industrialization and traffic density.
Water 14 02545 g009
Table 1. The categories for ecological risks posed by microplastics.
EiRisk CategoryRIRisk CategoryHRisk CategoryPLIRisk Category
<40Minor<150Minor<10I<10I
0–80Medium150–300Medium10–100II10–20II
80–160High300–600High100–1000III20–30III
160–320Danger600–1200Danger>1000IV>30IV
≥320Extreme danger≥1200Extreme danger
Table 2. Potential ecological risk assessment of microplastics in the Pearl River Delta.
SitesEiRIHPLI
PEPPPETPAPSPAN
Dry SeasonRainy SeasonDry SeasonRainy SeasonDry SeasonRainy
Season
Dry SeasonRainy SeasonDry SeasonRainy SeasonDry SeasonRainy SeasonDry SeasonRainy SeasonDry SeasonRainy SeasonDry SeasonRainy Season
QQ21 (Mi)~2 (Mi)~19 (Mi)640~8325 (Ex)~~~65,385 (Ex)23 (Mi)74,350 (Ex)8 (I)196 (III)1.4 (I)8.0 (I)
PRB~~2 (Mi)~19 (Mi)240(Da)~~57 (Me)~~ 78 (Mi)240 (Me)5 (I)10 (II)1.4 (I)5.0 (I)
XT~~3 (Mi)~30 (Mi)10 (Mi)~134 (Hi)~~~ 33 (Mi)144 (Mi)5 (I)70 (III)1.7 (I)1.0 (I)
LHS~~~~27 (Mi)~~130 (Hi)~~~ 27 (Mi)130 (Mi)10 (II)130 (III)1.7 (I)1.0 (I)
CC~~~~45 (Me)~~6243 (Ex)~~~ 45 (Mi)6243 (Ex)10 (II)130 (III)2.14 (I)6.9 (I)
SQ~~3 (Mi)~~64 (Me)~832 (Ex)85 (Hi)~~ 88 (Mi)896 (Da)4 (I)40 (III)1.7 (I)2.5 (I)
BJ~~3 (Mi)~27 (Mi)18 (Mi)~~~55 (Me)~1886 (Ex)30 (Mi)1959 (Ex)7 (I)345 (III)1.7 (I)1.4 (I)
ZT~352 (Ex)3 (Mi)~31 (Mi)320 (Ex)~4162 (Ex)~~~32,692 (Ex)34 (Mi)37,527 (Ex)7 (I)293 (III)1.8 (I)5.7 (I)
LH~~2 (Mi)~22 (Mi)400 (Ex)~5203 (Ex)~~~~24 (Mi)5603 (Ex)5 (I)82 (III)1.5 (I)6.3 (I)
HL~~3 (Mi)~29 (Mi)~~1560 (Ex)88 (Hi)~~~120 (Mi)1560 (Ex)8 (I)130 (III)1.7 (I)3.5 (I)
XL14 (Mi)~~~12 (Mi)44 (Me)~578 (Ex)~~~~14 (Mi)622 (Da)10 (II)58 (III)1.1 (I)2.1 (I)
WH29 (Mi)~3 (Mi)~~68 (Me)~892 (Ex)~~~~5 (Mi)960 (Da)4 (I)106 (III)1.6 (I)2.6 (I)
XW11 (Mi)~~~10 (Mi)~~578 (Ex)30 (Mi)~~~41 (Mi)578 (Hi)10 (II)130 (III)1 (I)2.1 (I)
Note: Ei potential ecological hazardous single index; RI: potential ecological risk; H: polymer risk index; PLI: pollution load index; QQ, Qingqi; PRB, Pearl River Bridge; XT, Xiaotang; LHS, Lianhuashan; CC, Chencun; SQ, Shiqiao; BJ, Beijiao; ZT, Zuotan; LH, Lanhe; HL, Hengli; XL, Xiaolan; WH, Waihai; XW, Xinwei; The categories for ecological risks posed by microplastics were classified in support information (Table 1); ~: No such microplastic components were detected.
Publisher’s Note: MDPI stays neutral with regard to jurisdictional claims in published maps and institutional affiliations.

