Article

Effect of Changing the Shape and Size of Inlet Area of Grates on the Hydraulic Efficiency of Urban Rainstorm Drainage Systems

1
Department of Water and Water Structures Engineering, Faculty of Engineering, Zagazig University, Zagazig 44519, Egypt
2
Ministry of Water Resources and Irrigation, Sharkia 44519, Egypt
3
Department of Environmental Engineering, Faculty of Civil Engineering, Technical University of Kosice, 042 00 Kosice, Slovakia
4
Center for Research and Innovation in Construction, Faculty of Civil Engineering, Technical University of Kosice, 042 00 Kosice, Slovakia
*
Author to whom correspondence should be addressed.
Water 2022, 14(16), 2541; https://doi.org/10.3390/w14162541
Submission received: 30 July 2022 / Revised: 15 August 2022 / Accepted: 16 August 2022 / Published: 18 August 2022

Abstract

:
Urban rainstorm drainage systems are used to collect the surface runoff from streets and other land surfaces through grate or curb openings that convey it to the drains. The quantity of surface runoff that is not discharged to the urban rainstorm drainage systems due to inadequate grate size or because the grate capacity is exceeded can cause flooding, immoderate hazards to drivers and pedestrians, and disrupt urban activities. This study aims to carry out experimental work to investigate the hydraulic efficiency of urban rainstorm drainage systems using different types of grates (shape and size of inlet area) for harvesting excess rainwater. Different grate shapes (five) with different inlet areas were investigated, as well as using three relative grate inlet areas (26%, 51%, and 64%). The results of the experimental work indicated that the best grate shape is the grate type 4 which provided the smallest reduction in discharge efficiency within 8.7%. The results specified that changing the size of the inlet area of grates from (26%) to (64%) has a significant impact on urban rainstorm drainage systems efficiency which decreased by 4%. In addition, the dimensional analysis principle with multi regression analysis were used to develop an empirical equation to compute the efficiency of urban rainstorm drainage systems. The relation between grate shapes and the relative inlet area with the efficiency of grate capture provides an indication to the decisionmakers to increase the time period for maintenance which will save the cost for further maintenance. The presented empirical equation can help decisionmakers for monitoring the current situation of grate blockage (relative grate inlet areas) and the corresponding efficiency. This study is beneficial for future road drainage system construction to avoid problems by assessing the performances of the current drainage systems and proposing mitigation measures to avoid improper functioning. Finally, this methodology can help to improve the efficiency of urban rainstorm drainage systems that can reduce the risks of urban floods.

1. Introduction

Urban rainstorm drainage systems have become an important issue in the planning and management of urban drainage in different countries. Adequate knowledge of the hydraulic behavior of surface drainage structures requires the consideration of surface flow hydraulic, grate capacity, and hazards related to urban runoff during the storms. These factors affect the design of a surface drainage system. The hydraulic behavior of grate inlets has an impact on the efficiency of urban rainstorm drainage networks. Asfaw [1] investigated that the stormwater drainage system was inadequate to convey the peak discharge for the required design period, in which the drainage system filled with sediment and rubbish material. The results for those problems were due to the drainage system design, the hydraulic analysis, and type of drainage system provided. Several studies have used the dimensional analysis technique to obtain empirical equations that corelate the studied parameters in a certain place [2,3].
The American Association of State Highway and Transportation Officials (AASHTO) [4] investigated that the transverse slope of a road can vary from −0.10 to +0.10. When the side slope is more than zero, the flow collected above the grate has the characteristics of a triangular flow channel. In contrast, parking lots and pavements are the zones where only longitudinal gradient is realized. Magdi [5] used two case studies to investigate the effects of a deficient drainage system on road performance in Khartoum, Sudan. The causes of road failure in the first 5 years following construction were identified. In this study, it was found that there are four main causes for the early deterioration of road pavements including poor maintenance structures, poor drainage system design and construction, lack of local standards of practice, and the use of low-quality materials. Singh et al. [6] found that good road drainage is essential to reducing the environmental impact of roadways. Moreover, they found that removing surface water quickly led to enhanced road safety, minimized traffic interruption, and extended the lifetime of the road surface and related infrastructures as much as possible.
Owuama et al. [7] examined options for a road network’s sustainable drainage system, such as a trenchless drains, which include an absorption unit and grass cover. It was discovered that the technology would offer a low-cost, aesthetically pleasing, and practical method for removing road surface runoff with little inconvenience to users and little harm to the environment. It was determined that trenchless drains easily dispose the stored surface water and add aesthetic appeal to the surrounding. Izzard [8] indicated that the flow above the inlet lip is crucial (the inlet is acting as a weir), and the water depth declines linearly throughout the inlet length. The total flow per length of the inlet was calculated for the whole inlet length to obtain the flow discharge into the inlet. Mostkow [9] showed that the efficiency increases as longitudinal slope decrease to horizontal slope. This concept is useable only if grate bars are parallel to the flow path. However, in actual cases plane grades may make blockage problems and rubbish accumulation.
The hydraulics of grate inlets with several coefficients via Reynolds number and Froude number were studied by Mustafa [10]. Diverse shapes of grate inlets located in channels and reservoirs were utilized and an orifice-oriented inlet was used for multiple orifices, single orifice, and orifices with a certain amount of roughness on the adjacent bed. The results presented differences in the discharge coefficients that are suitable to the calculation of the actual flow entering the inlet for several flow conditions. Gahin [11] analyzed data from the Federal Highway Administration’s (FHWA) experiments to establish the sort of drainage inlet that is most effective. Six distinct grate types with differing bar arrangements and longitudinal slopes were tested in these experiments. These experiments presented two dimensionless parameters for each type of grates. According to the study, transverse bar grates performed hydraulically worse than grates with parallel bars to the flow direction.
Michael et al. [12] examined combining techniques for enhancing the performance of hydraulic models for urban rainfall drainage systems utilizing simple black-box models. HYDROWORKS software was used to implement this technique in a storm system in a small catchment. Four black-box models were tested as an updating procedure to improve the output of the hydraulic model for real-time forecasting. Updated forecasts were studied for a range of lead times and the overall model efficiencies were compared. The approach can provide enhanced information for the operational and real-time control of storm water drainage systems. The system is valuable for small urban catchments and for catchments with steep slopes with short catchment response times.
A number of studies have been conducted for determining stormwater drainage efficiency. Carvalho et al. [13] used a two-dimensional (volume of fluid/fractional area volume obstacle demonstration) model to define stormwater drainage efficiency. Rainfalls of various intensities were simulated by a network of pipes projected 1.0 m above the road surface with sprinklers at 2.0 m staggered intervals. Lopes et al. [14] developed a three-dimensional method using the OpenFOAM program to study the surcharge of the jet characterization, flow in a gully storm system, and its height above the gully. The detailed mesh allowed the investigators to obtain respectable similarity between experimental and numerical results. Sezenöz [15] analyzed the grates’ efficiency using the Flow 3D program. The used platform was built from fiberglass with a height of 10 cm and a width of 90 cm. A single grate system and single longitudinal slope of 1% was carried out in the experimental study. The results indicated that the efficiency rates with total flow showed a bell-shaped curve; this means that by increasing flow rates, the efficiency of the grate increases until it reaches the peak point, then starts to decrease. Total discharge, longitudinal slope, shape, and width of the channel affected the intercepted flow rate and efficiency of the grate. For higher discharges, it can be highlighted that efficiencies are extremely reduced and become inefficient.
The hydraulic efficiency of continuous transverse grates, despite the importance and the general use of this type of surface drainage structure was investigated by Manuel [16]. A flume with dimensions of 5.5 m long and 1.5 m wide with a platform able to simulate road lanes with longitudinal slopes up to 10% and side slopes up to 4% was used. By available system capacity, it is possible to test inlet grates and examine their hydraulic capacity for a significant range of flows (0–200 L/s). Linear equations were developed by linking the Froude number with hydraulic efficiency. These findings have been updated and enhanced by new information acquired from new experimental trials. These equations established a connection between certain parameters relating to the geometry of the grate and the flow rate per unit width upstream of the grate and the hydraulic efficiency. Wakif and Sabtu [17] improved the knowledge and effect on the hydraulic properties of gully grates caused by vertical depression. They attempted to develop empirical equations that describe the relationship of significant parameters, such as Froude number and hydraulic efficiency. A full-scale physical model was created to simulate the actual condition on site. Experimental results indicated that vertical depression decreases the hydraulic efficiency by 6% to 10% for a 20 mm depressed single grate.
Experimental studies have been used to determine the discharge coefficients through an inlet for surcharged pipe conditions. Cosco et al. [18] defined the discharge coefficients using actual scale experiments to deliver information for inlet manufacturers and practitioners. Longitudinal and transversal gradients varied between (0–10%) and (0–4%), respectively, whereas the tested discharge values ranged between (25–200 L/s). In order to calculate the discharge coefficients if the flow completely covers the grates, the inlets of three grates were examined. A relationship between discharge coefficient and upstream Froude number was demonstrated for supercritical flow conditions. Regarding the orifice method, the discharge values for the Barcelona, Meridiana, and E-25 grated inlets varied between (0.055–0.294), (0.033–0.431), and (0.054–0.423), respectively. In contrast, the coefficients for the weir assumption ranged between (0.009–0.244), (0.003–0.245), and (0.006–0.286), respectively. Gómez et al. [19] presented an experimental method to compute discharge coefficients through an inlet for overflow pipe circumstances. Tests were run using a real laboratory platform that simulated a road lane. Different surcharged inlet flows ranging from 10 to 50 L/s were taken into consideration. For surcharged flows of 10 to 50 L/s, the obtained discharge coefficient ranged between 0.13 and 0.41. According to the results of the sensitivity analysis, discharge coefficients can be regarded as constant for any roadway longitudinal slope.
The efficiency of grates under different conditions have been studied either experimentally or numerically. Guo et al. [20] inspected experimentally eight types of such grates used in China. A full-scale physical model simulating a 3.0 m wide, and 12.0 m length road was built for 320 hydraulic experiments with different inlet flow rates and road longitudinal grades. The grates’ hydraulic efficiencies under diverse settings were estimated, and the influencing factors were studied, including the grates’ geometry (grate length, effective width, effective length, effective width ratio, effective length ratio opening style, and opening rate) and Froude number. To correlate the hydraulic efficiency and affecting factors, empirical equations were provided. The presented results are helpful for understanding continuous transverse grates and enhancing the grates’ engineering design. Aranda et al. [21] used an Iber model to present a method based on the assessment of grate inlet efficiency and hydraulic numerical simulation. The method is appropriate for application to design criteria regarding the standards of various countries. Through complete control of the hydraulic behavior of each of the grate inlets considered in each scenario, the proposed method makes it easier to conduct sensitivity evaluations of the performance of various scupper arrangements. To improve decisions and find solutions that maximize efficiency, several solution comparisons can be made using the comprehensive hydraulic information.
According to the above lecturer review, there no study has been performed on linking both the shape of grates and the inlet areas of grates with the efficiency of urban rainstorm drainage systems, which certainly affects the design, operation, maintenance, and the cost of the system. Moreover, the decisionmakers actions for the maintenance of the network is related to the blocked area of the grates (percent of grate inlet area) along the drainage system, which also affects the operation and cost of maintenance. Therefore, this study aims to conduct an experimental work to determine the hydraulic efficiency of using different grate shapes and varying inlet area with different storm events. Moreover, to develop an empirical equation to correlate the efficiency of urban rainstorm drainage systems with grate shapes and the inlet area of grates. The relation between grate inlet area and efficiency of grate capture provides an indication to the decisionmakers to increase the time period for maintenance, which reduces the cost of maintenance and operation. The developed empirical equation can provide an indicator that can help decisionmakers to take action by investigating the current situation of grate blockage (relative grate inlet areas) and corresponding efficiency.

2. Dimensional Analysis

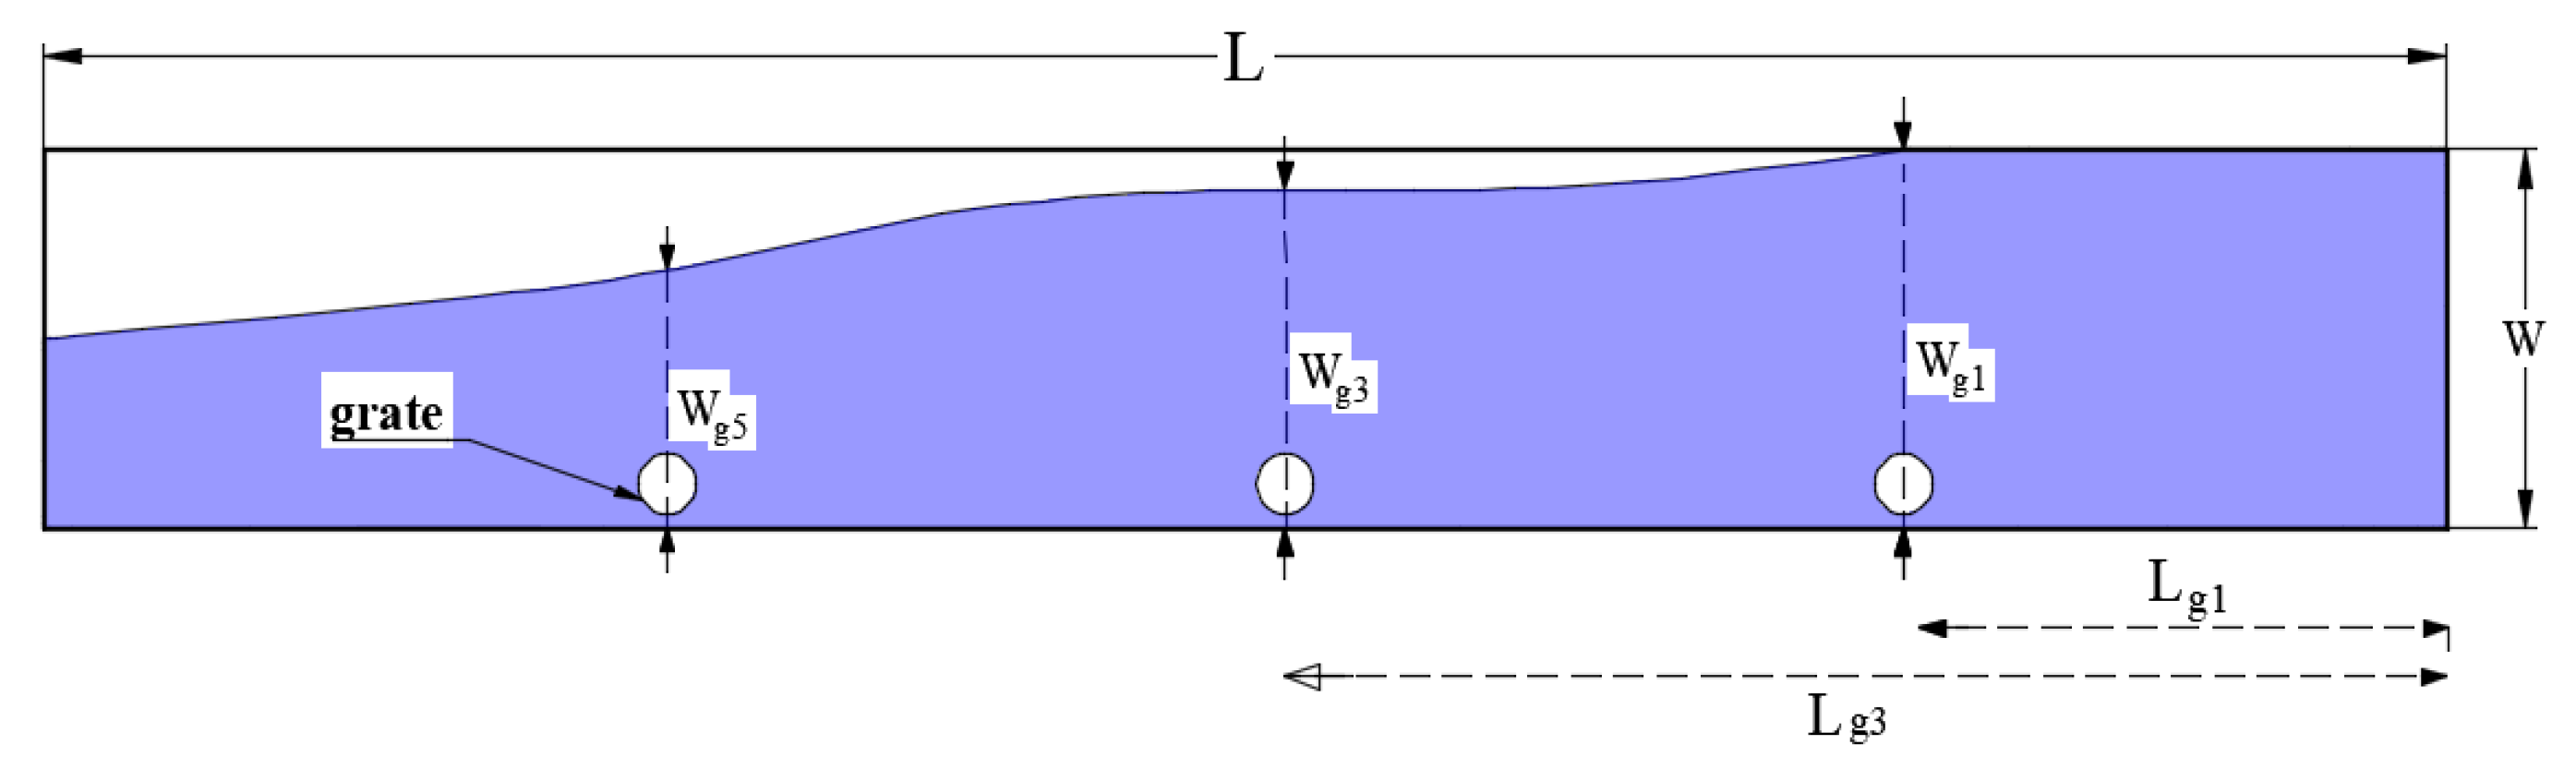
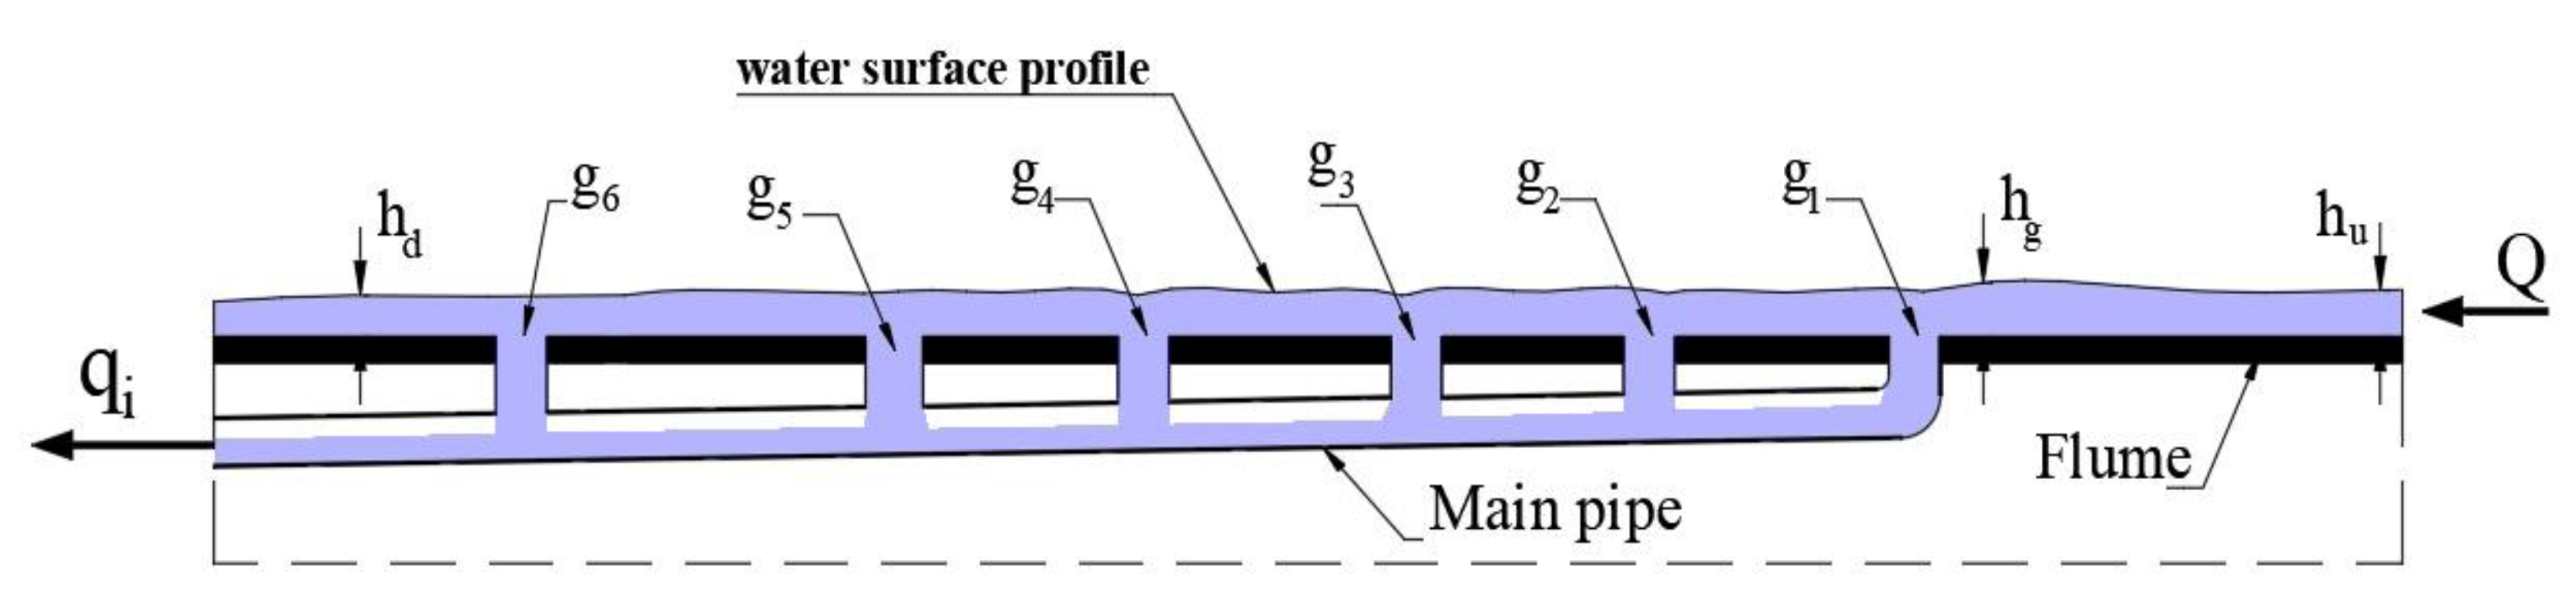
The discharge efficiency of urban rainstorm drainage systems depends on a number of parameters such as total discharge, the relative grate length, the relative grate width, the relative grate height, and the relative inlet area. A dimensional analysis based on THE Buckingham theory [22] was used to develop a relationship between the discharge efficiency and the other parameters involved in the phenomenon which are shown in Figure 1 and Figure 2. Applying the Buckingham theory, the functional relationships of the discharge efficiency may be expressed as the following:
£ = ƒ(Q, Lo, Wo, Hg, Ag)
where £ is the efficiency of discharge (qi/Q), Q is the total discharge, qi is the intercepted discharge, Lo is the relative grate length (Lg/L), L
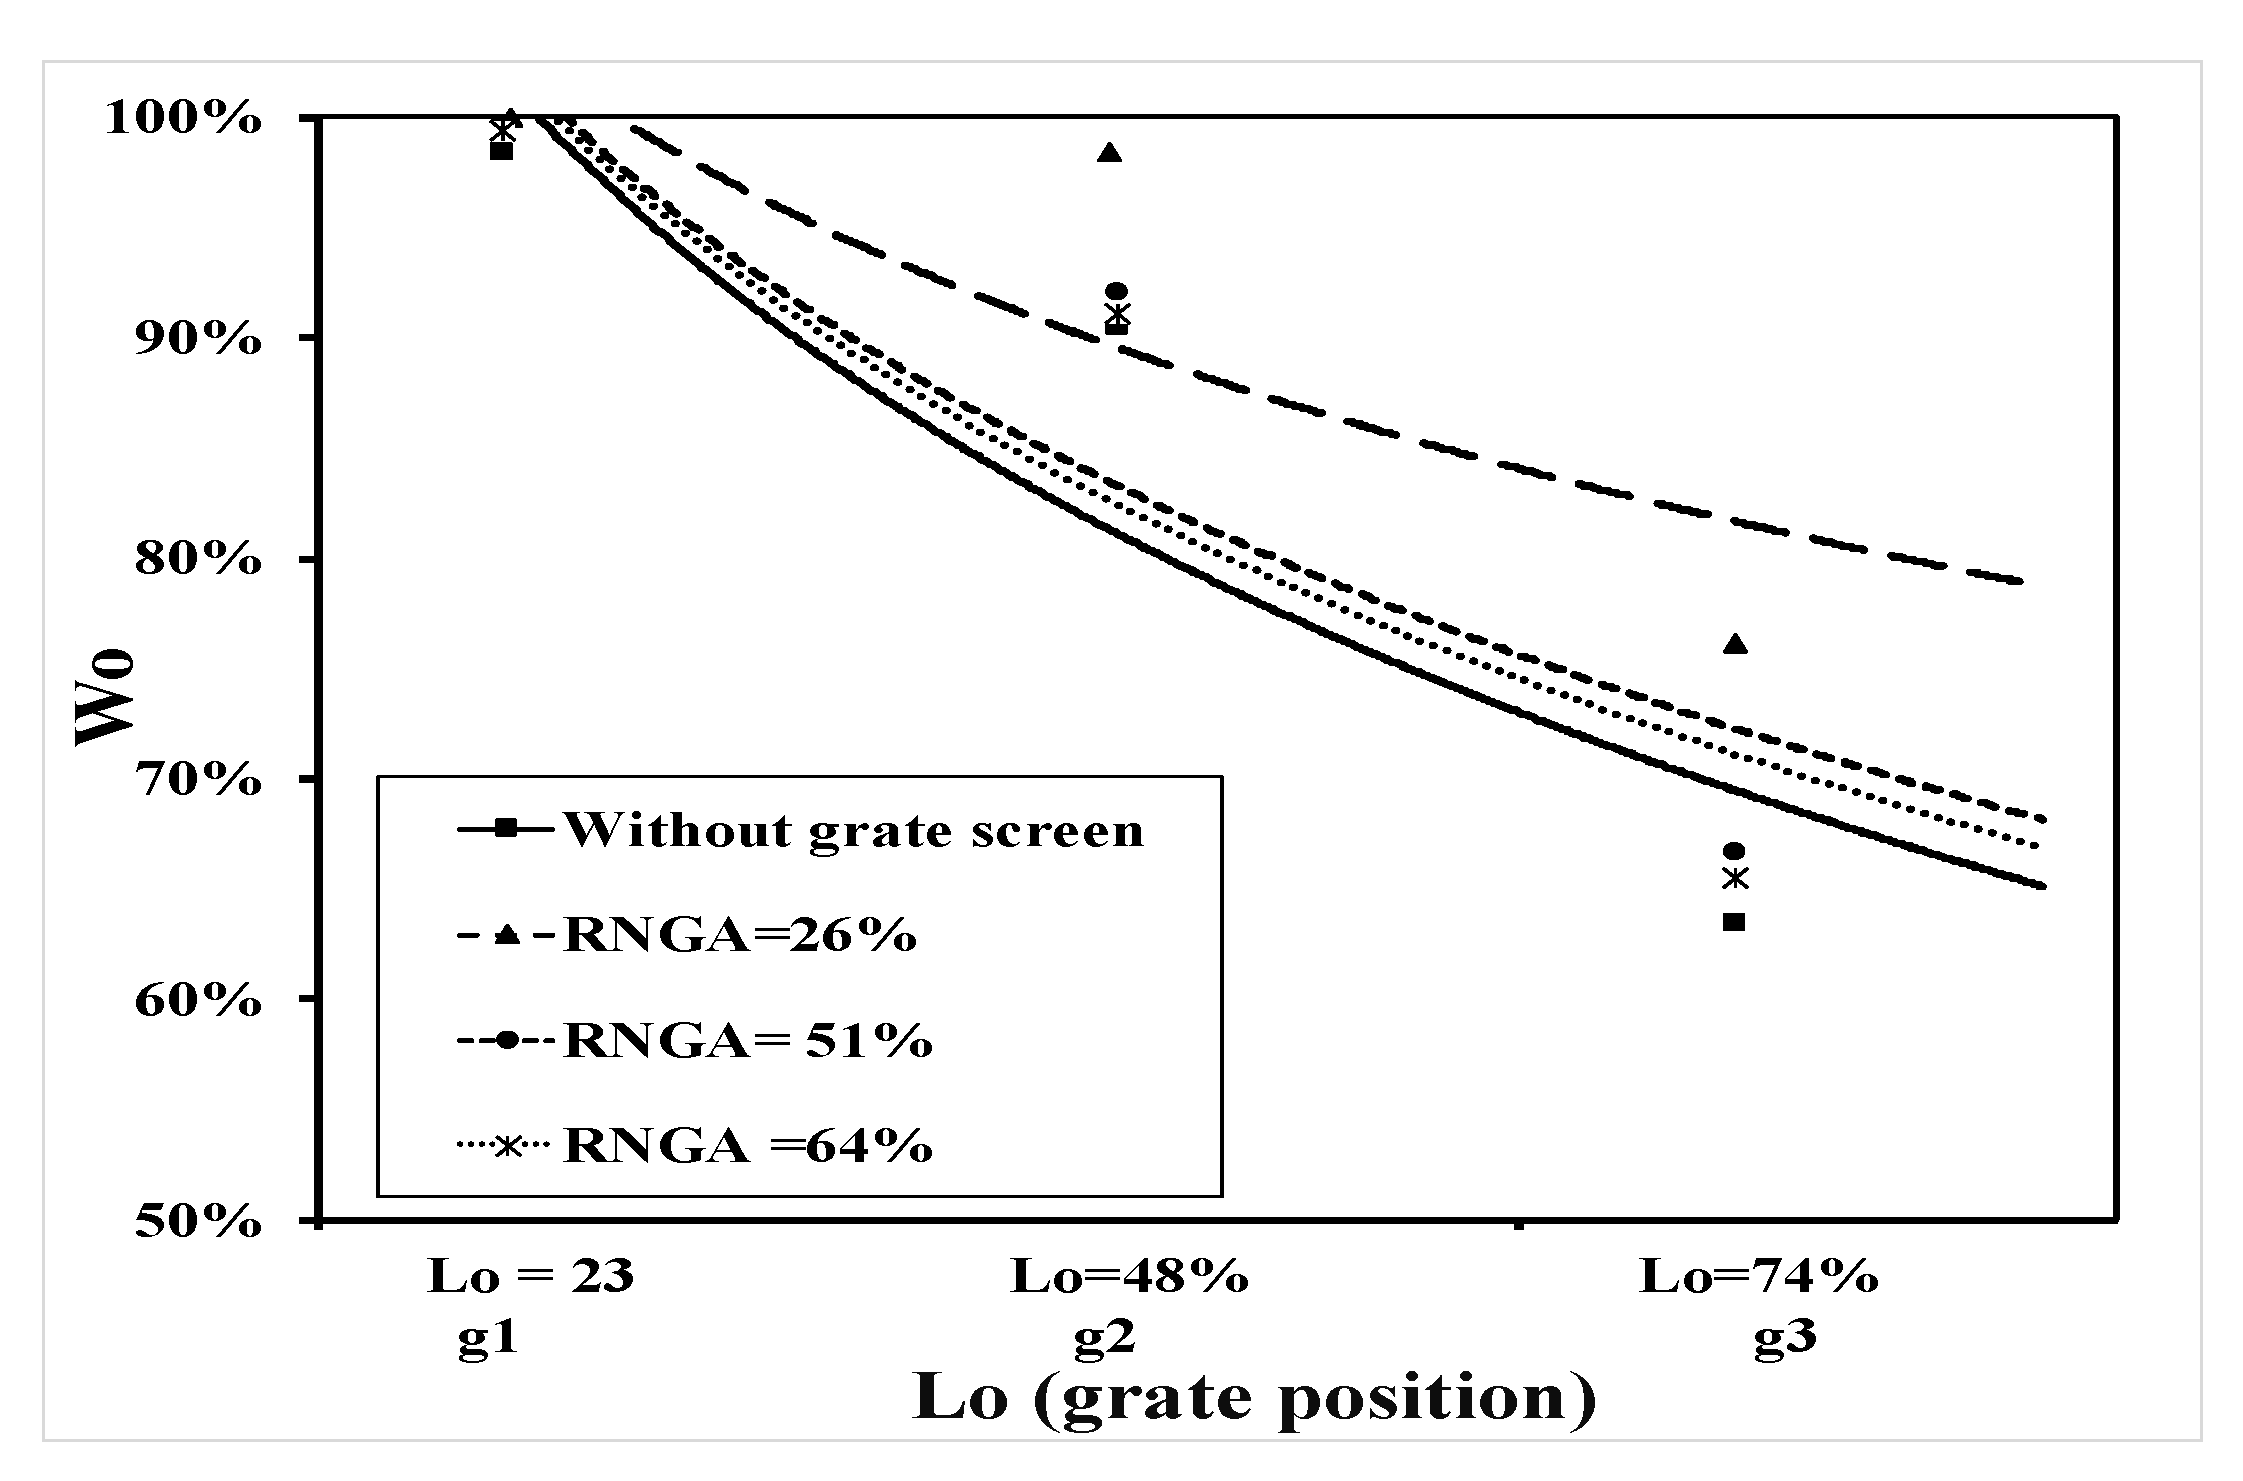
g is the length from beginning of flume to the grate position, L is the length of the flume, Wo is the relative grate width (Wg/W), W is the channel width, Wg is the water spread beside every grate, Hg is the relative grate height (hg/hu), hg is the water depth at grate upstream, hu is the water depth at flume upstream, Ag is the relative grate area (ao/ag), ao is the grate inlet area, ag is the grate area, g1, g3, g5 refers to the grate’s position, and hd is the water depth at flume downstream.
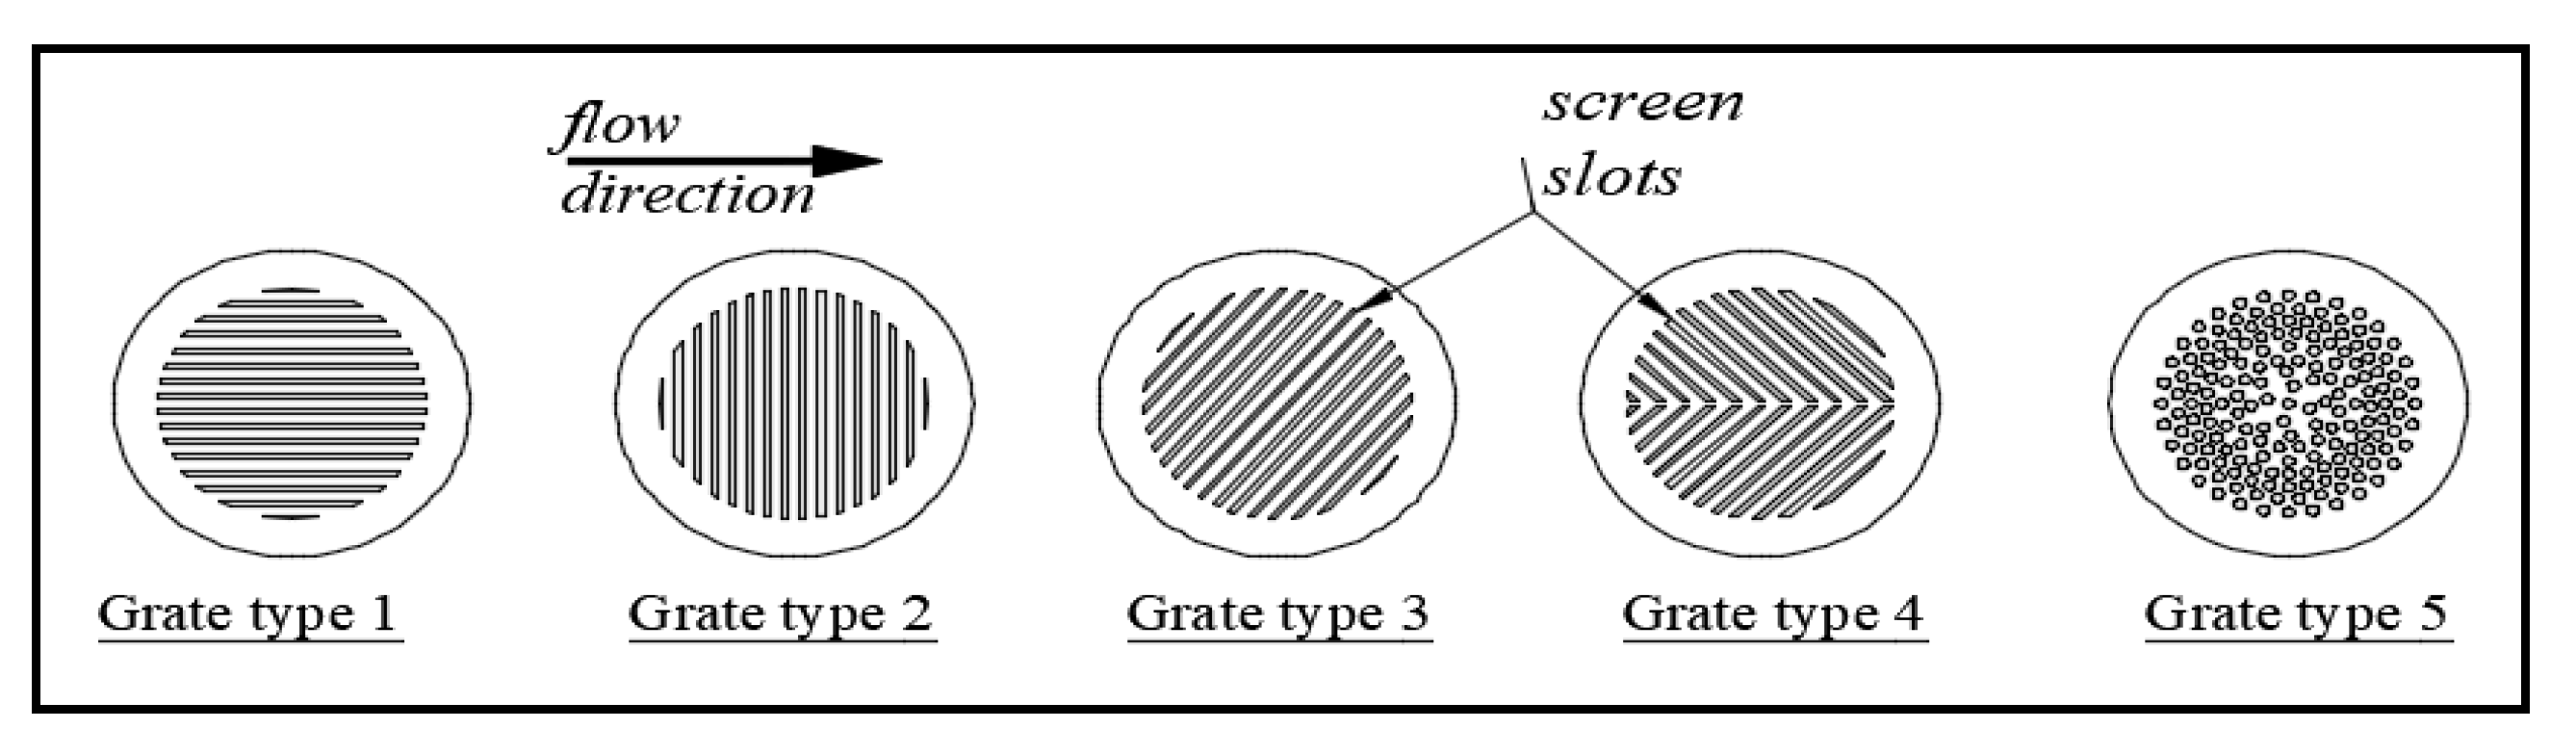
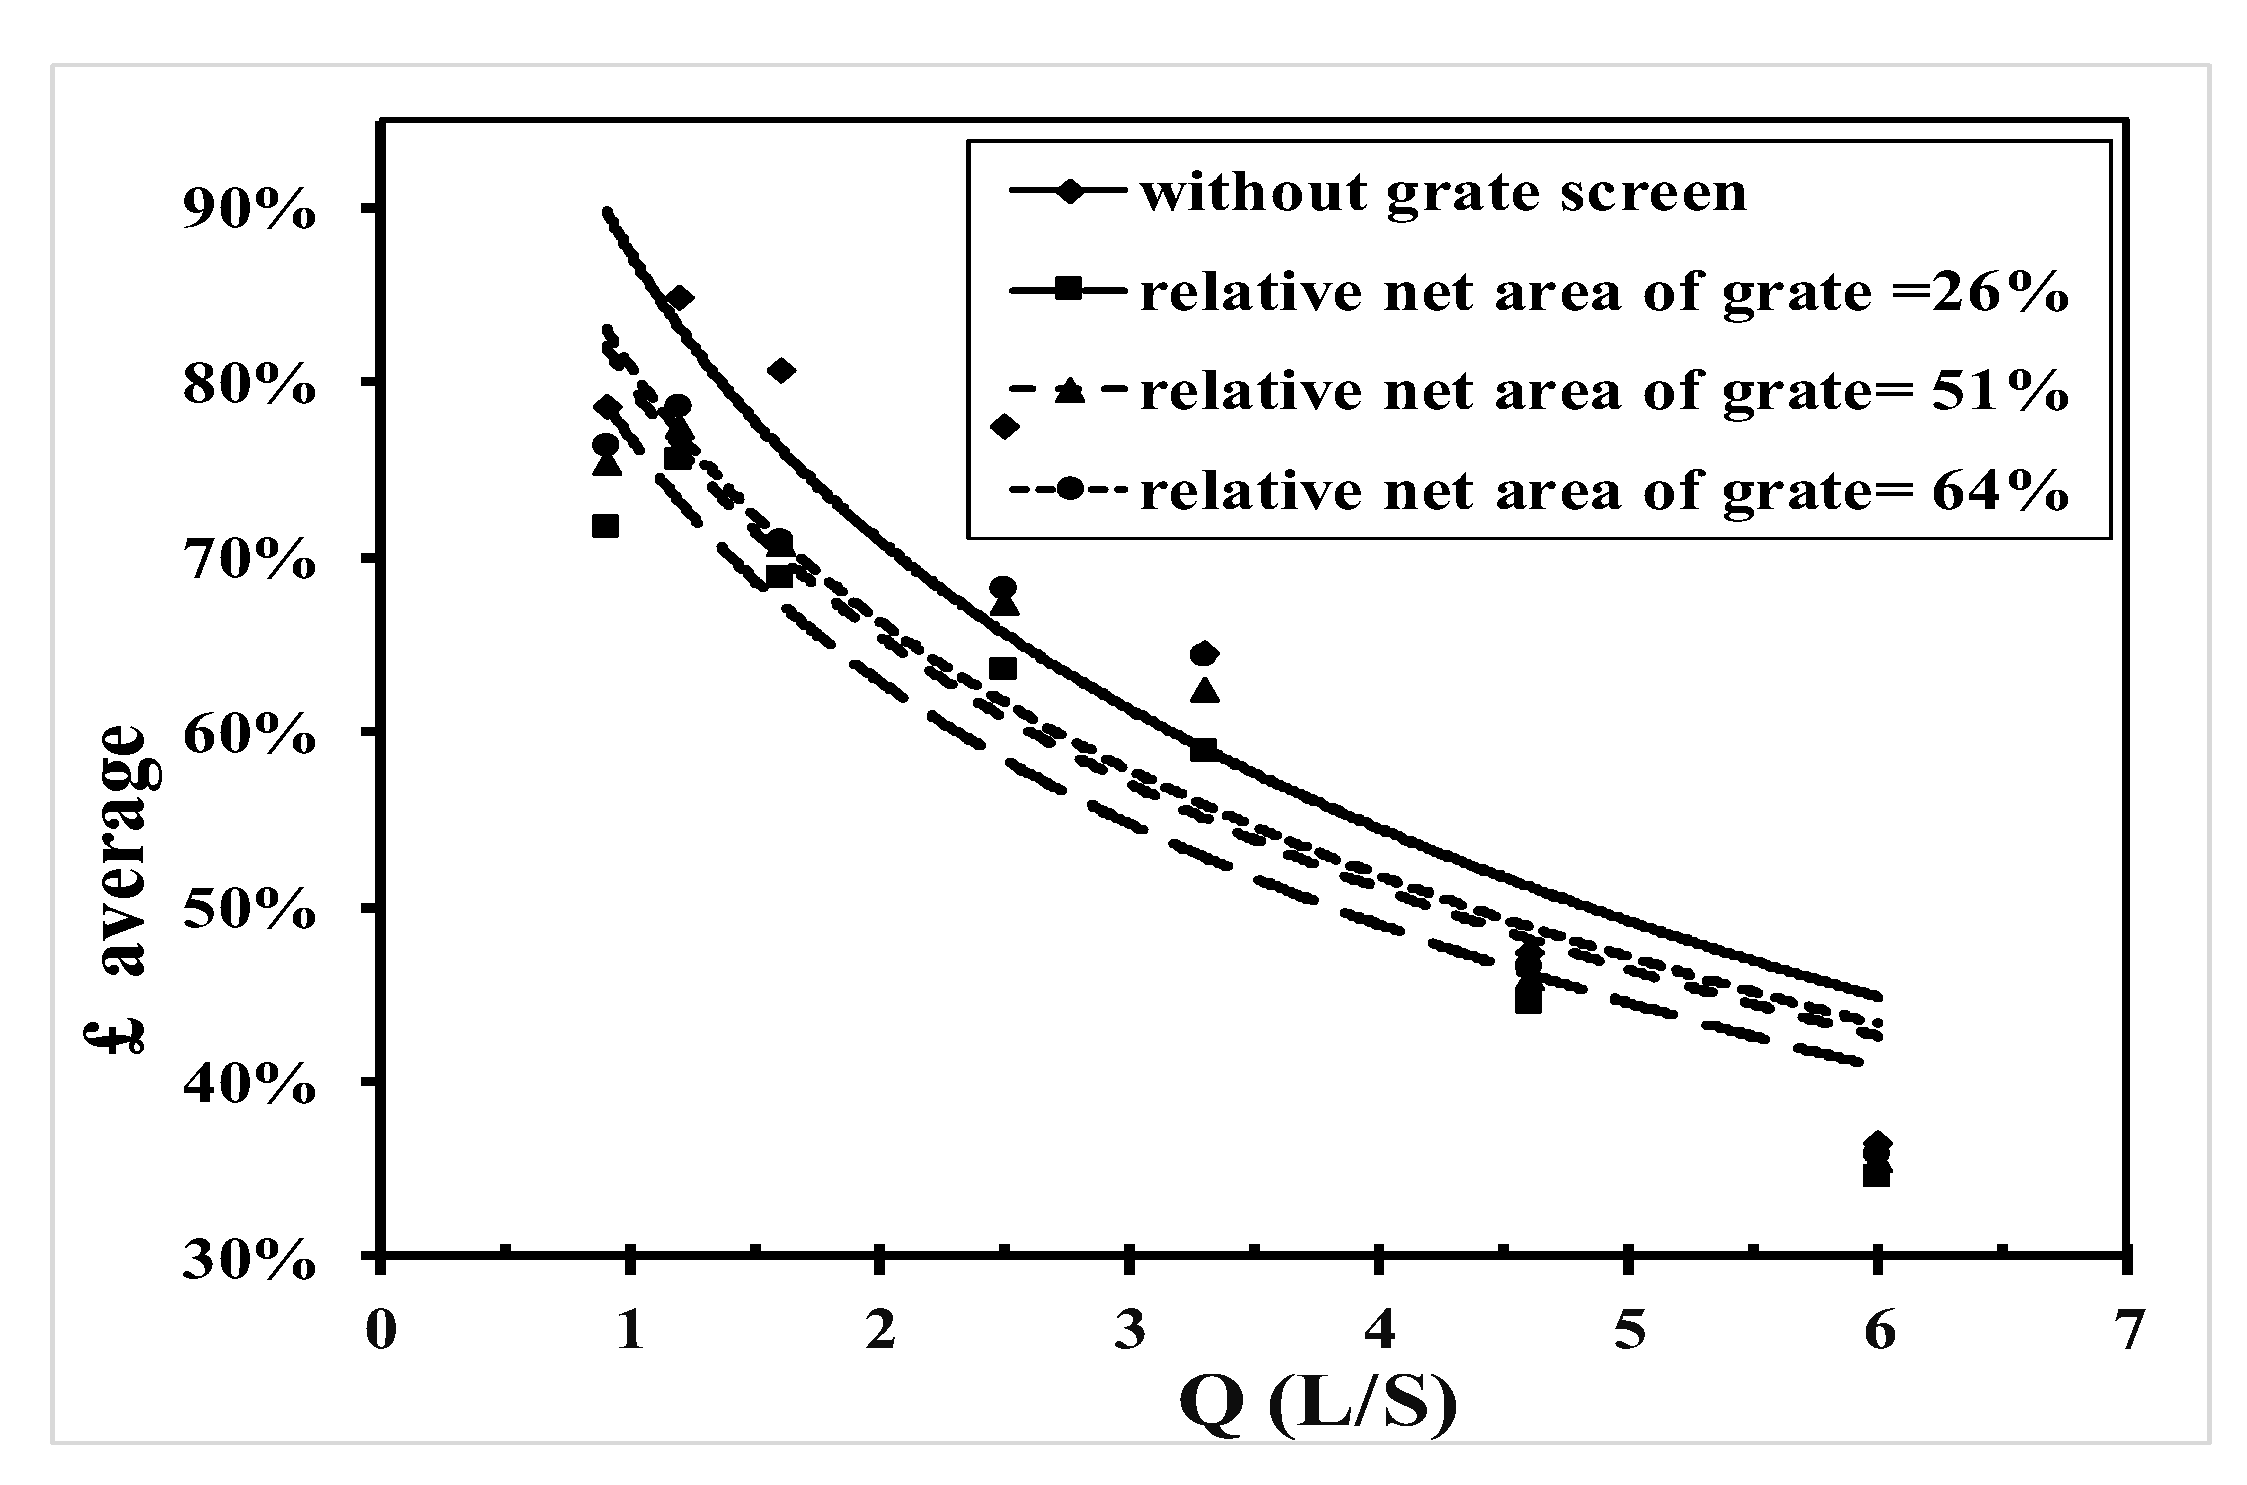
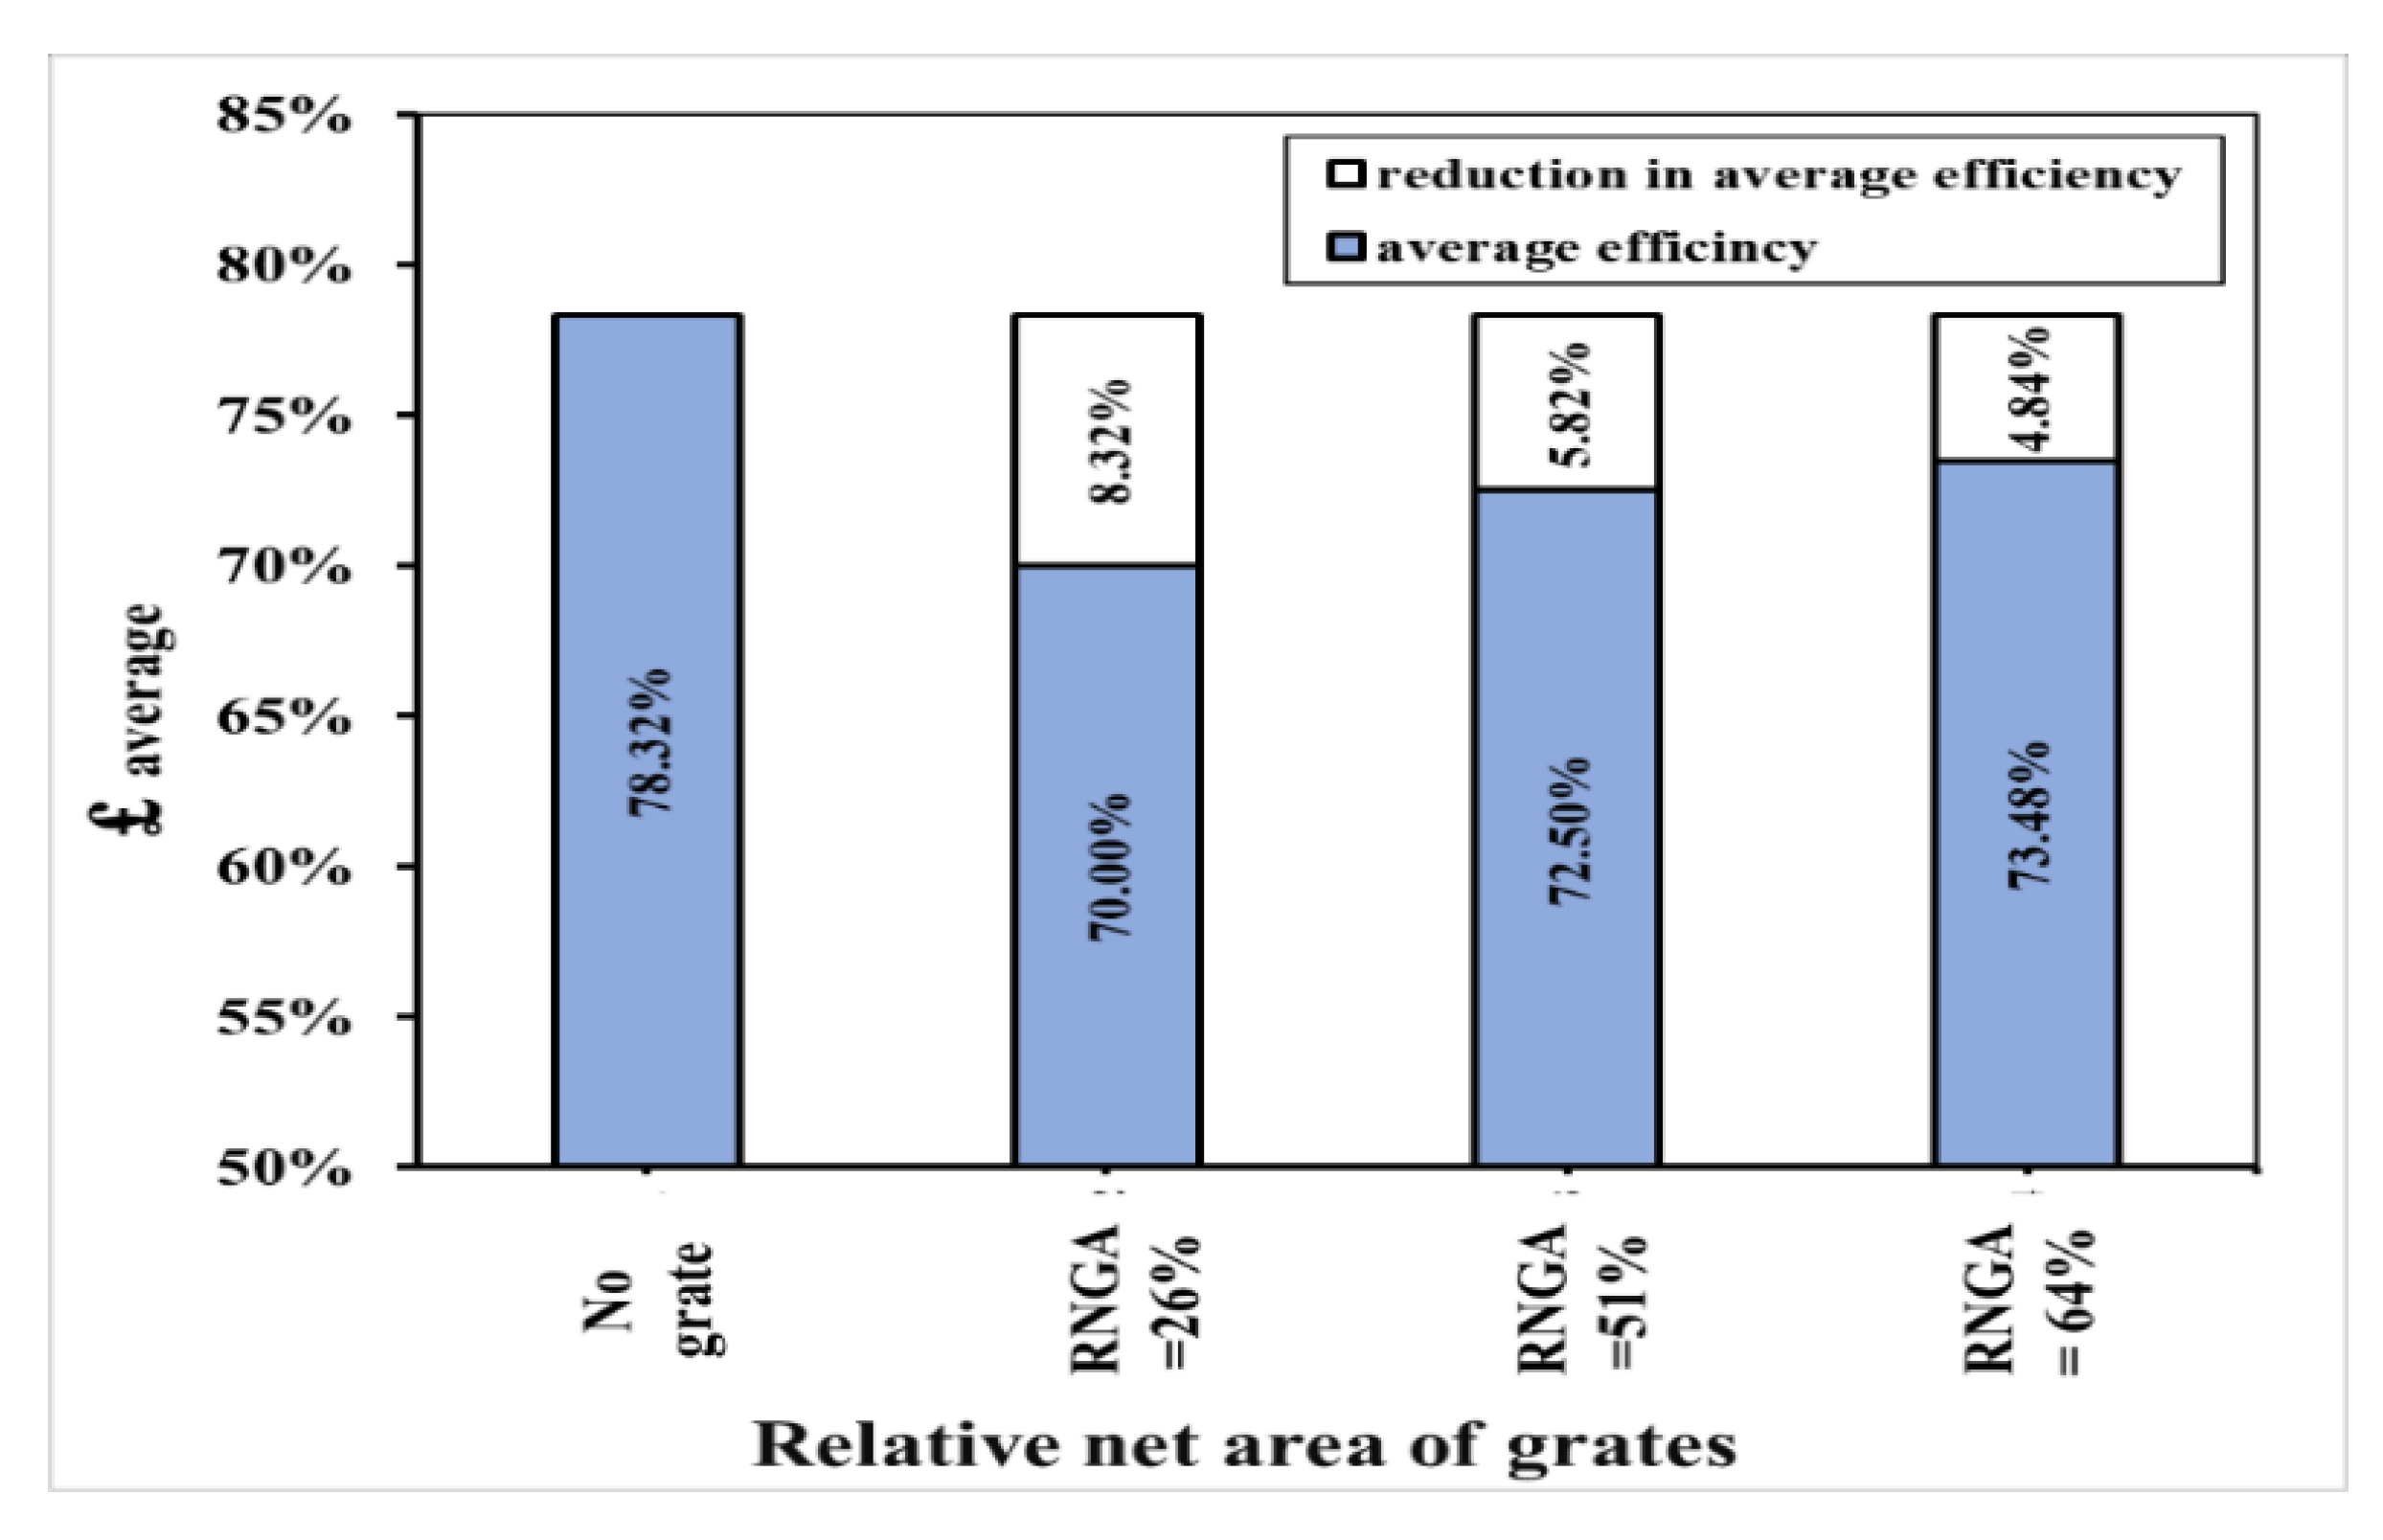
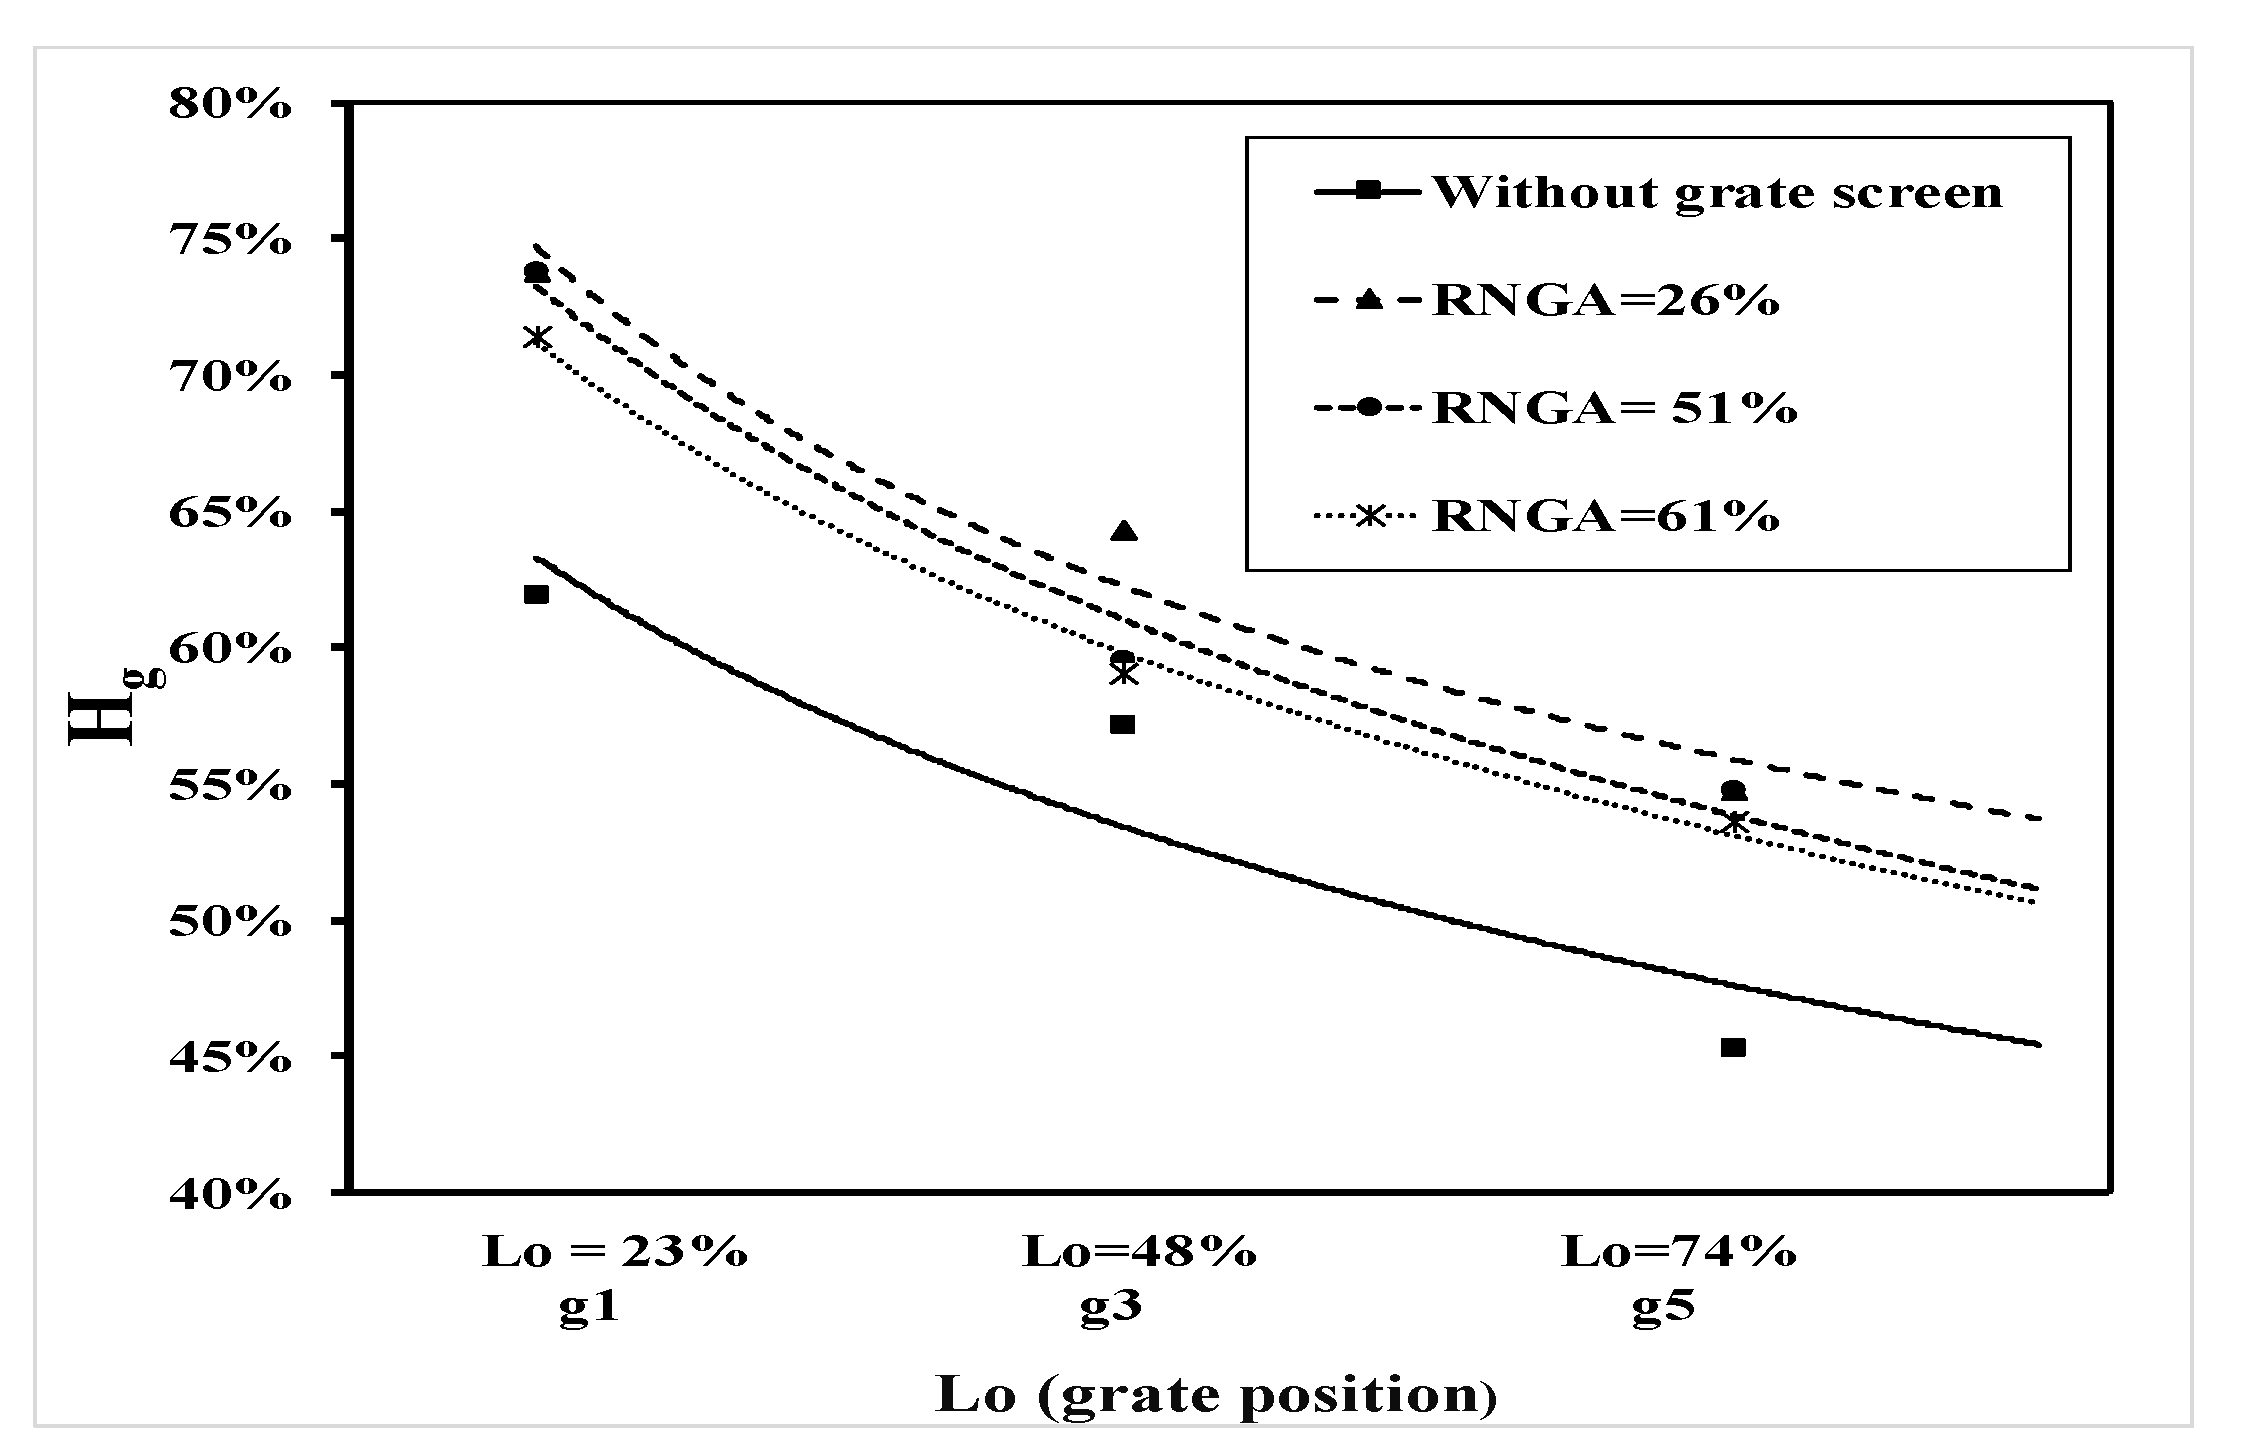
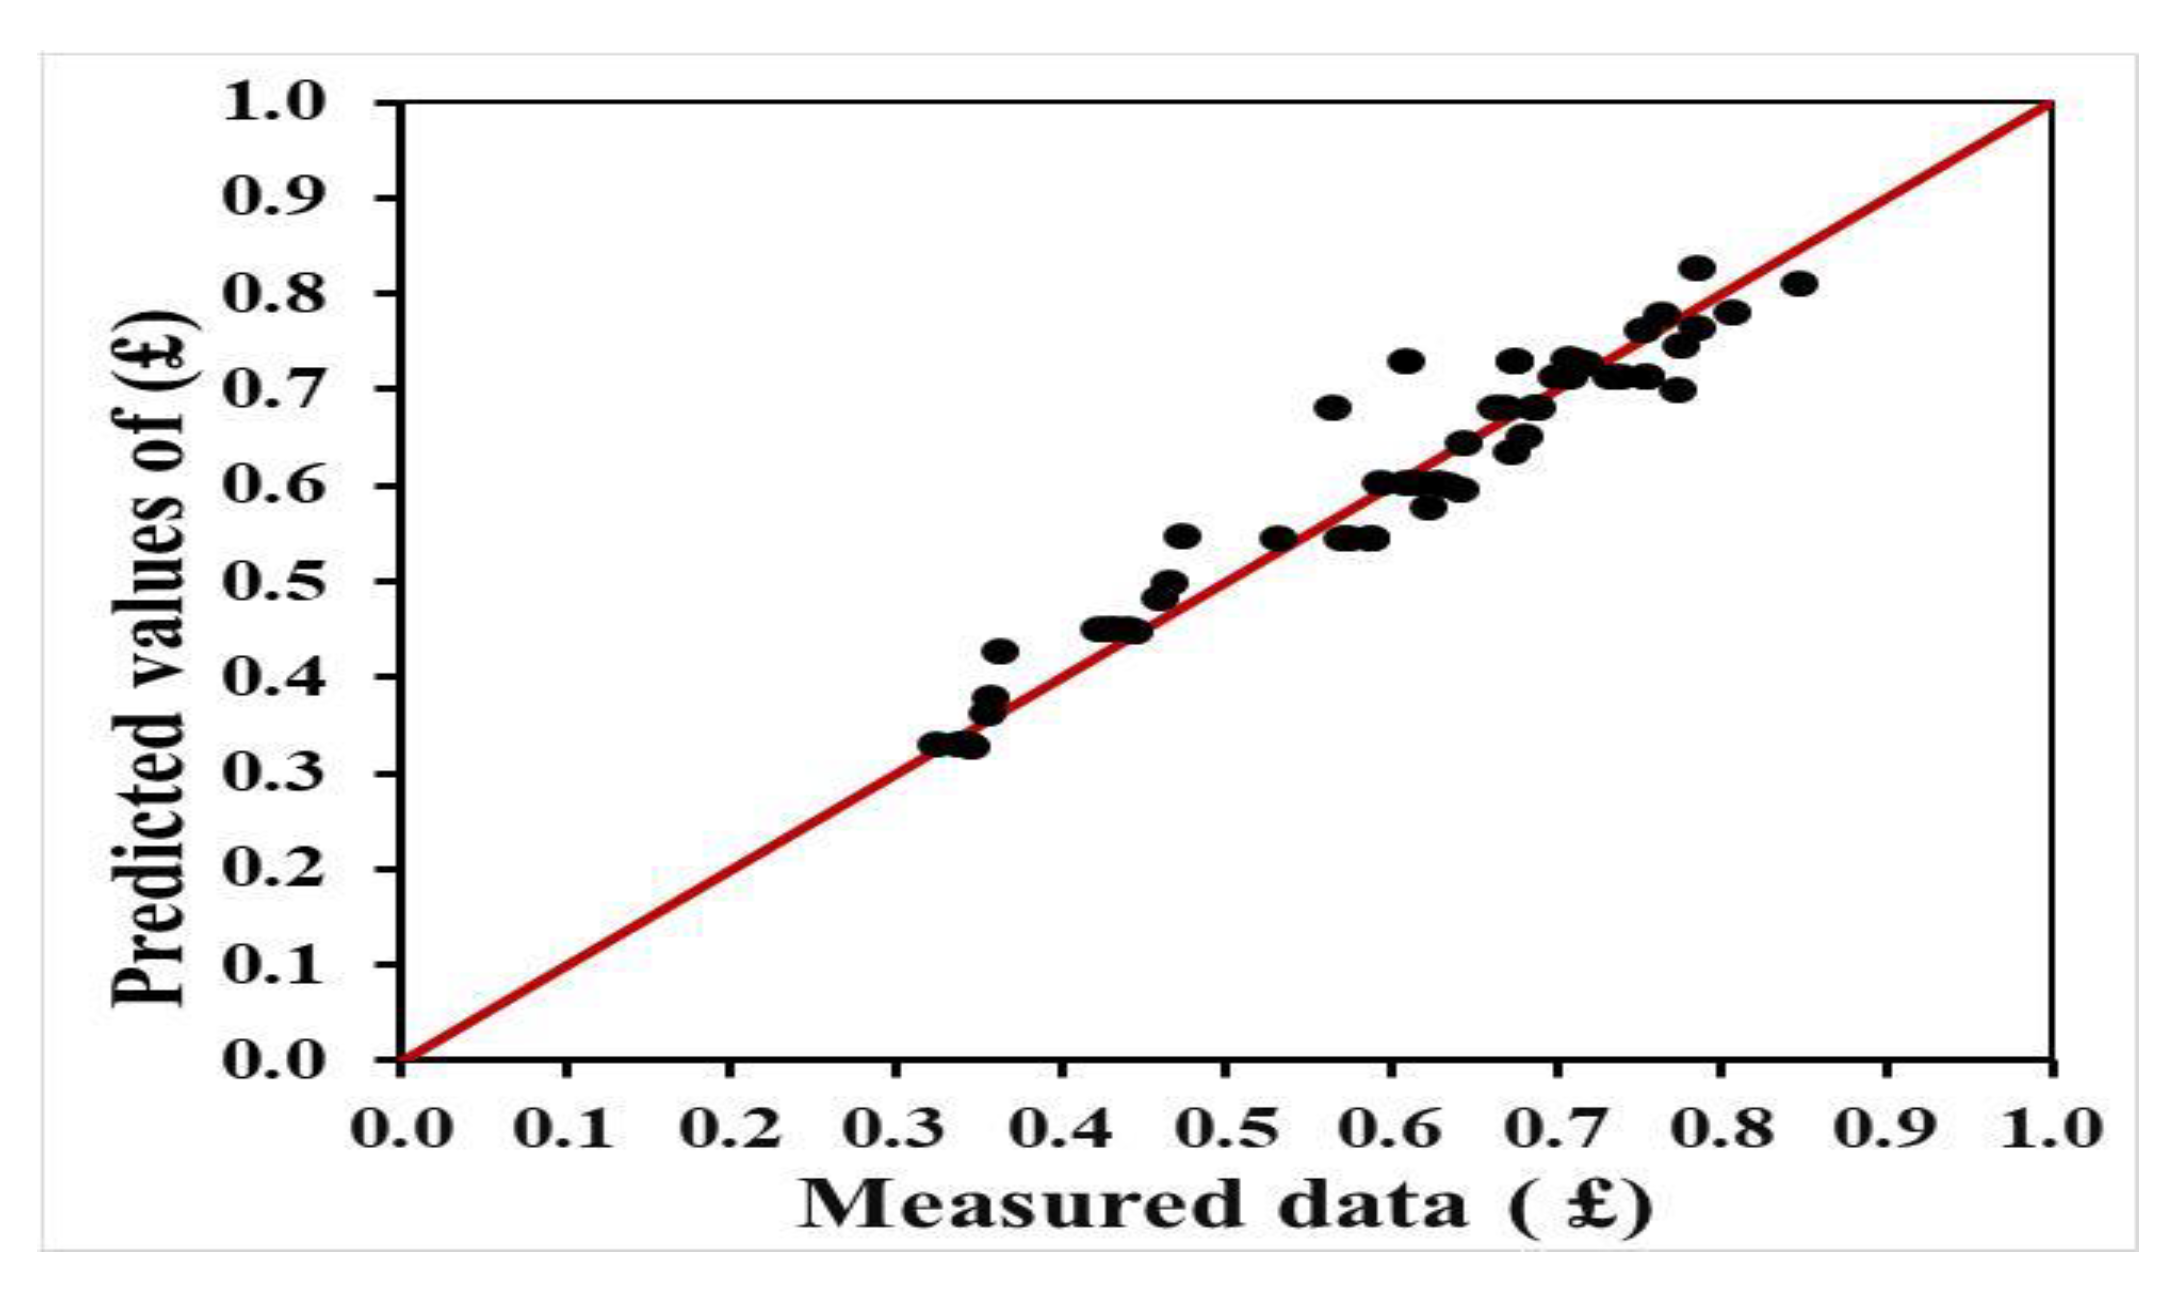
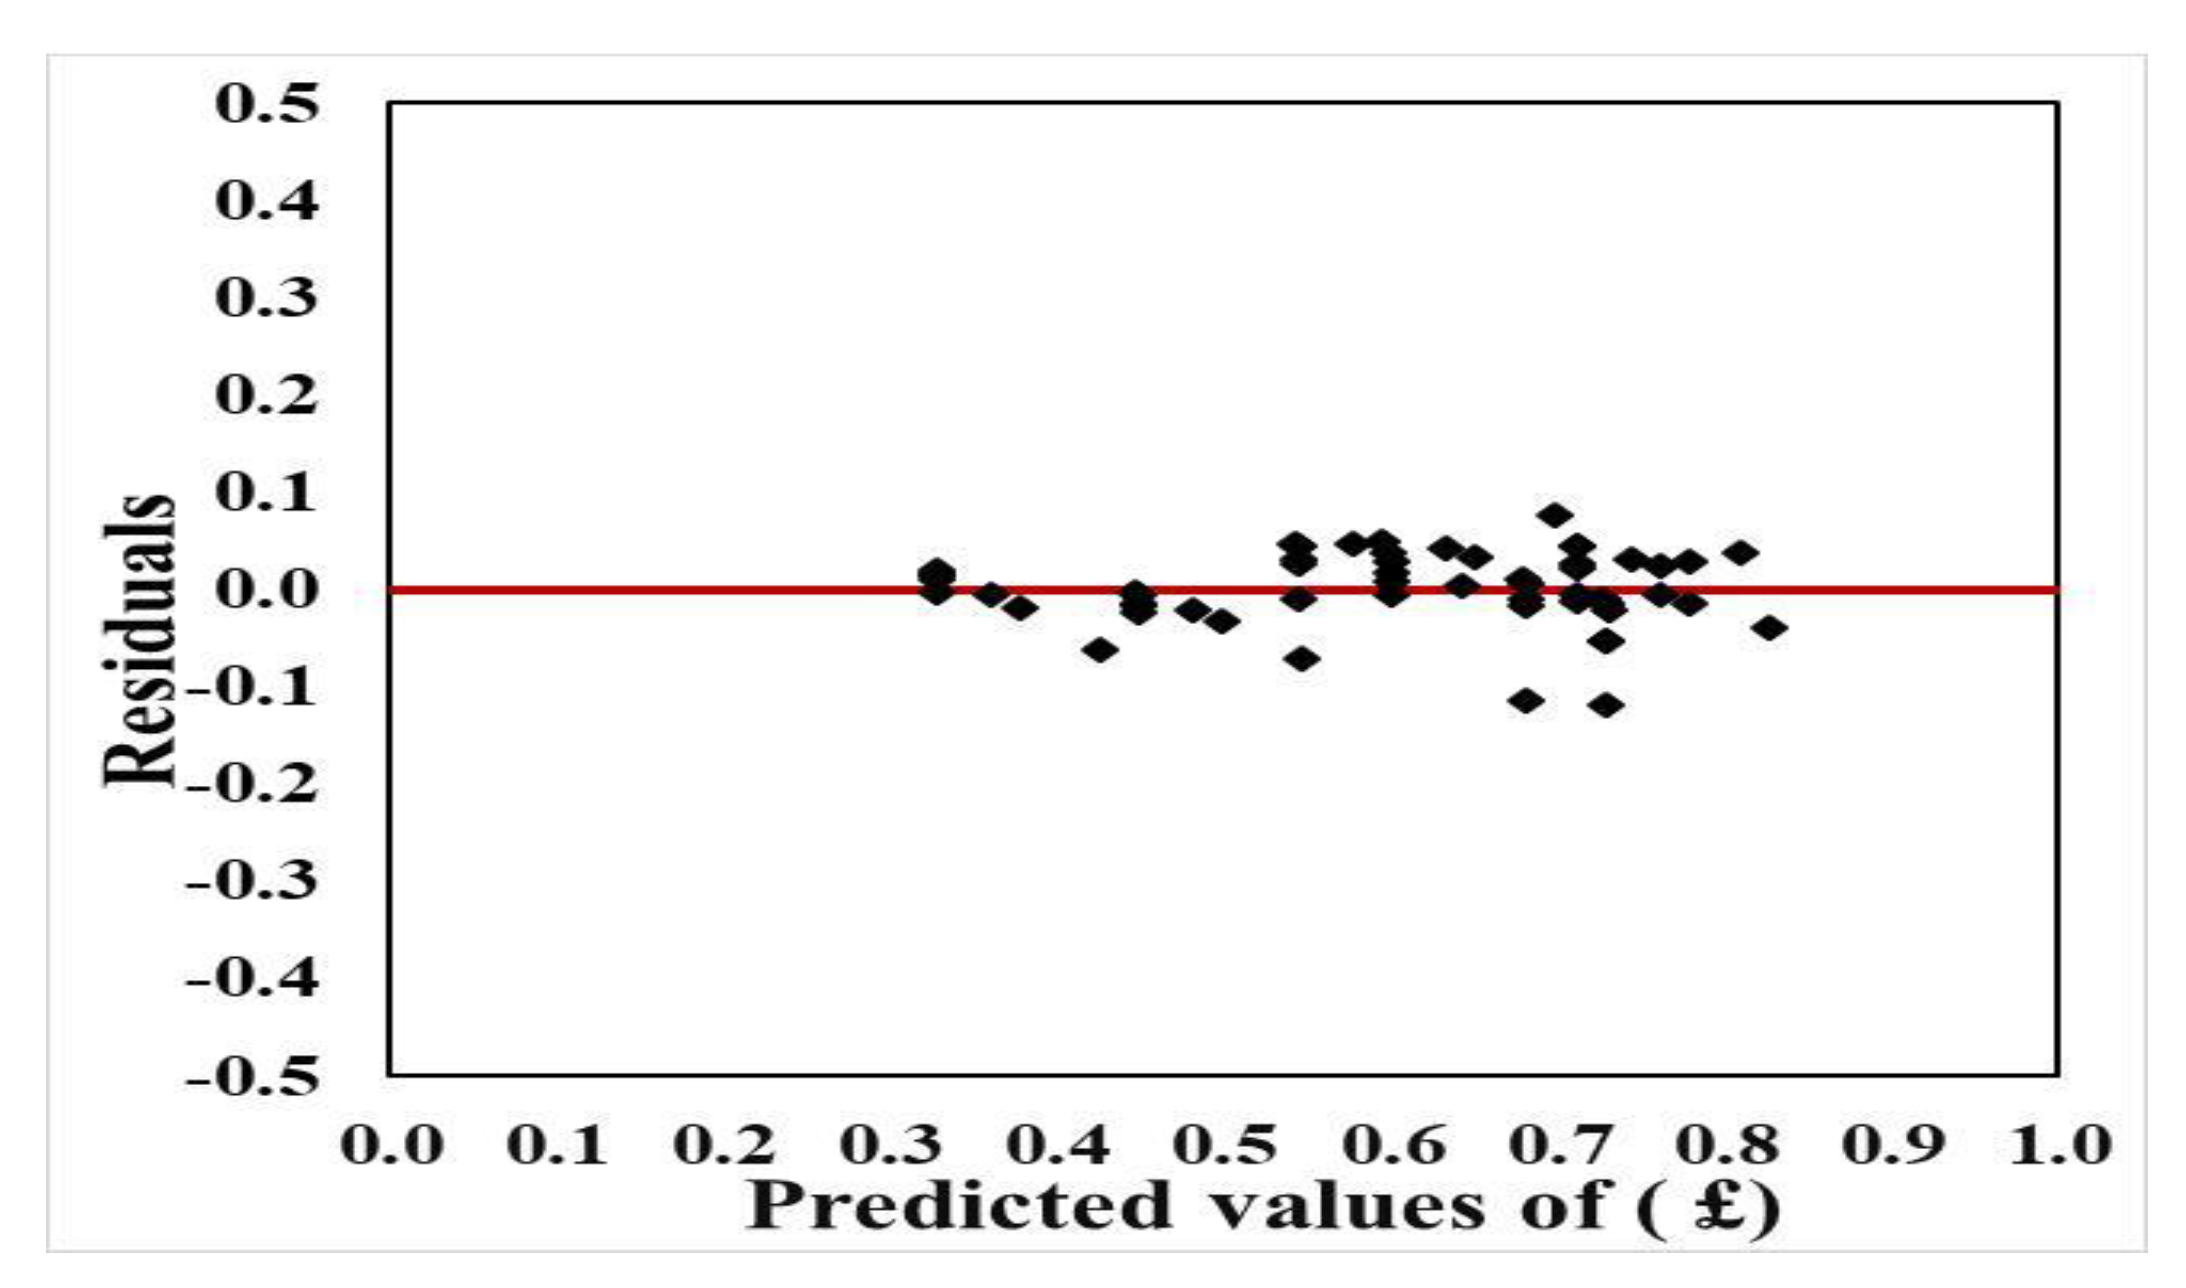
3. Experimental Work

The experimental work was carried out in the hydraulic laboratory at the Faculty of Engineering, Zagazig University. The glass-reinforced plastic mounding flume was used during the experimental tests. The dimensions of the flume are 0.63 m width, 0.10 m depth, and 6.0 m length. The longitudinal slope and cross-section slope are 0.3% and 2%, respectively. A pre-calibrated orifice meter was used to measure the total discharge. A point gauge was used to measure the water depths through the flume length. Three holes were used with radius of 0.05 m at the bottom of the flume over distances 1.08 m and 0.02 m from the edge of the flume. These holes are connected by a pipe with diameter 0.05 m that dispose the drained water to a storage tank with dimension (1.20 m, 0.60 m, 0.60 m) as shown in Figure 3. Five different shapes of grates were used as shown in Figure 4. Moreover, three relative inlet areas of grates (26%, 51%, and 64%) of the best selected grates were used as shown in Figure 5. The time suitable to adjust the total inlet discharge water surface level along the flume in two directions (longitudinal and cross-section) is 30 min.

4. Results and Discussion

The experimental work was divided into two stages. The first stage studied the effect of changing the shape of grates on urban rainstorm drainage system efficiency. During this stage, five types of grates were used (Figure 4). The slots of (grate type 1) are parallel to water flow direction, (grate type 2) perpendicular to water flow direction, (grate type 3) make an angle of 45° with the water flow direction, (grate type 4) are diagonal rectangles with a bar in the middle of the grate, and (grate type 5) are circles distributed on the surface of the grate (see Figure 6). The second stage investigated the effect of changing the inlet area of grates on stormwater drainage system efficiency, the relative water depth and the relative water spread width. Through this stage three different relative inlet areas of grates were used (26%, 51%, and 64%) as shown in Figure 5. Two stages were performed with passing discharge from 1.00 to 6.00 L/s.

4.1. The Effect of Changing the Grate Shape on the Efficiency of Urban Rainstorm Drainage Systems

The effect of different grate shapes on the discharge efficiency was studied and the results of the five grate shapes are shown in Figure 7. From the figure it can be seen that the best grate shapes that affected the discharge efficiency are grate type 4 and grate type 1, followed by grate type 2, grate type 3, and grate type 5 was the lowest one. Figure 8 shows the rate of reduction in the discharge efficiency for the five grate types, which also can help in selecting the best grate shape to be used. The results clearly show that the best grate shape is grate type 4 because it provided the lowest reduction in discharge efficiency within 8.70%. This can be explained by the presence of longitudinal and transverse slope in the flume, which leads to a change in the direction of flow for the semi-slant.
Grate shape type 4 mimics the form of water flow at the grate, leading to the opportunity to harvest more water. On the other hand, Manuel [16] investigated that the results of hydraulic design of grate type 1 (with bars parallel to the flow) was better than the hydraulic design of grate type 4. The difference between the two studies is that Manuel used the flume without a transverse slope, and the position of fish bone grate’s slots are perpendicular to the flow direction across the width of the flume. This led to produce more splash phenomena than bars parallel that decrease in captured flow as shown in Figure 9. The shape, dimension, and average efficiency of discharge (AEOD) for different types of grates were calculated and are presented in Table 1.

4.2. The Effect of Changing the Inlet Area of Grates on the Efficiency of Urban Rainstorm Drainage Systems

After choosing the best grate shape (grate type 4) from stage one, different inlet areas of grates were studied with different total discharges. Three different inlet areas of grates (26%, 51%, and 64%) were used to study the effect of changing the inlet area of grates on the efficiency of discharge, relative grate water height, and the relative water width.

4.2.1. The Effect of Changing the Inlet Area of Grates on the Discharge Efficiency

The relationship between efficiency of passing discharge for different inlet area of grate are shown in Figure 10. The results reveal that the grate inlet areas increased from (26% to 64%) and the discharge efficiency increased by 3.48%. Figure 11 shows the results of the average efficiency of discharge and the reductions in efficiency for using different inlet areas. From the results, the average efficiency of discharge for using the grate inlet area (51%, 64%) were very close with a difference of about 1%. The shape, dimension, and average efficiency of discharge for different inlet areas were calculated and are presented in Table 2.

4.2.2. The Effect of Changing the Inlet Area of Grate on the Relative Grate Water Height

The water depth upstream each grate along the flume was measured to investigate the effect of increasing the inlet area of grate type 4 on water surface profile. Figure 12 and Figure 13 show relationship between relative water height and relative grate distance for using different inlet area of grate (26%, 51%, and 64%) for total discharge (1.20 and 6.00 L/s) respectively. The results indicated that the relative water height of grate increased when grate inlet area 26% was used by (29% and 31%) for inlet discharge (1.20 and 6.00 L/s) respectively. The relative water height of grate decreased by (20% and 7%) at total discharge (1.20 and 6.00 L/s) for increasing the inlet area of grates from (26%) to (64%) as shown in Figure 12 and Figure 13.

4.2.3. Effect of Changing the Inlet Area of Grate on the Relative Water Width

The effect of increasing the inlet area of grates on the relative water spread width was studied by measuring the water spread width along the flume. Figure 14 and Figure 15 show the relationship between relative water spread width and relative grate distance with different grate inlet areas at Q = (1.20 and 3.30 L/s). The results indicate that using a grate inlet area with a value of 26% decreased the efficiency by (30% and 14%) using Q = (1.20 and 3.30 L/s), respectively. This decreases due to preventing excess water from passing through grate slots. On the other hand, this negative effect decreased by increasing the inlet area of the grate from 26% to 64% by (4% and 9%) for using Q = (1.20 and 3.30 L/s), respectively, as shown in Figure 13 and Figure 14.

5. Prediction of the Discharge Efficiency

An empirical equation was developed to correlate the discharge efficiency (£) of urban rainstorm drainage systems to a number of parameters such as total discharge, the relative grate length, the relative grate width, the relative grate height, and the relative grate inlet area. The measured data in the laboratory with dimensional analysis and multi regression analysis were used to develop the empirical equation to correlate the water discharge efficiency (£) to other parameters based on Equation (1). The discharge efficiency (£) is expressed as the following:
£ = 0.77289Q − 0.08Ag + 0.134
where Ag is the relative grate area, Q is the flume discharge (L/s), and £ is the system discharge efficiency.
The correlation coefficient and the standard error of for Equation (2) are 94% and 0.04, respectively. Figure 16 shows the relationship between the predicted values of £ using Equation (2) versus the measured value while Figure 17 shows the distribution of the residuals around the line of zero error. Both figures indicate that Equation (2) represented the measured data very well and hence can be used to predict the efficiency of a different number of grates for passing discharge ranging from 1.00 to 6.00 L/s.

6. Conclusions

Improving the efficiency of road drainage systems depends on studying the hydraulic behavior of different parts of the drainage system. This study presents an experimental work to investigate the effect of changing the grates’ shape and size of inlet area on the hydraulic efficiency of urban rainstorm drainage systems. The study examined five different grate shapes and three different inlet areas of grates. The efficiency of rainstorm discharge system for using five types of grate shapes (type1, type2, type3, type4, and type5) was (69.31%, 67.35%, 67.21%, 69.62%, and 62.54%), respectively. The best grate shape is (grate type 4) for the smallest reduction in efficiency of discharge within 8.7%, due to the presence of longitudinal slope of 0.3% and transverse slope of 2% in the flume, which changed the direction of flow for the semi-slant, especially in the area of grates. Therefore, grate shape type 4 mimics the form of water flow at the grate, leading to the opportunity to harvest more water. The efficiency of the water discharge system using three grate inlet areas (26%, 51%, and 64%) was (70%, 72.5%, and 73.48%), respectively. The relative grate height decreased as the area of grate increased by (20% and 7%) at total discharge (1.20, 6.00 L/s), increasing the relative inlet area of the grate’s screen from (26%) to (64%), which provided minimum grate slots a negative effect of flow. This negative effect decreased by increasing the inlet area of grates from 26% to 64% by (4% and 9%) for using discharge of (1.20 and 3.30 L/s), respectively. Multi regression analysis and dimensional analysis principle were used to develop an empirical equation to estimate the efficiency of urban rainstorm drainage systems in correlation to grate shapes and the relative inlet area of the grates. This empirical equation can be used by the decisionmakers to monitor the situation of grate blockage and system efficiency. However, a three-dimensional simulation of the drainage system including other variables such as changing pipe diameters, slopes, and surface roughness are recommended for future studies. The results of this study can be used to improve the urban rainstorm drainage systems’ efficiency and can reduce flood risks in urban areas, especially on roads.

Author Contributions

Conceptualization, I.F. and A.F.; Data curation, G.M.A.-A., A.F. and M.A.N.; Formal analysis, H.F.A.-E. and M.Z.; Investigation, G.M.A.-A., M.A.N. and I.F.; Methodology, A.F. and I.F.; Project administration, G.M.A.-A. and M.Z.; Resources, G.M.A.-A. and M.Z.; Software, M.R.F., I.F. and H.F.A.-E.; Supervision, G.M.A.-A. and M.Z.; Validation, M.R.F., M.A.N. and H.F.A.-E.; Visualization, M.R.F. and M.Z.; Writing—original draft, I.F.; Writing—review and editing, A.F., M.A.N., H.F.A.-E. and M.Z. All authors have read and agreed to the published version of the manuscript.

Funding

This work was supported by the Slovak Research and Development Agency under the Contract no. APVV-20-0281. This work was supported by project HUSKROUA/1901/8.1/0088 Complex flood-control strategy on the Upper-Tisza catchment area.

Institutional Review Board Statement

Not applicable.

Informed Consent Statement

Not applicable.

Data Availability Statement

Not applicable.

Conflicts of Interest

The authors declare no conflict of interest.

References

  1. Asfaw, B. Assessment of Storm Water Drainage System in Kemise Town. Master’s Thesis, School of Graduate Studies Addis Ababa Institute of Technology, Addis Ababa University, Addis Ababa, Ethiopia, 2016. [Google Scholar]
  2. Čarnogurská, M.; Příhoda, M.; Zeleňáková, M.; Lázár, M.; Brestovič, T. Modelling the Profit from Hydropower Plant Energy Generation Using Dimensional Analysis. Pol. J. Environ. Stud. 2016, 25, 73–81. [Google Scholar] [CrossRef]
  3. Zeleňáková, M.; Čarnogurská, M.; Slezingr, M.; Słys, D.; Purcz, P. Model based on dimensional analysis for prediction of nitrogen and phosphorus concentrations at the river station Ižkovce, Slovakia. Hydrol. Earth Syst. Sci. 2013, 17, 201–209. [Google Scholar] [CrossRef]
  4. AASHTO. A Policy on Geometric Design of Highways and Streets. Task Force on Geometric Design. American Association of State Highway and Transportation Officials. 2001. Available online: https://sjnavarro.files.wordpress.com/2011/08/aashto-2001.pdf (accessed on 15 March 2022).
  5. Magdi, M.E.Z. The Impacts of Poor Drainage on Road Performance in Khartoum. Int. J. Multidiscip. Sci. Emerg. Res. 2014, 3, 901–907. [Google Scholar]
  6. Singh, R.R.; Navpreet, K.; Goyal, E.N. Drainage on roads. Int. J. Prog. Civ. Eng. 2014, 1, 2394–4684. [Google Scholar]
  7. Owuama, C.O.; Uja, E.; Kingsley, C.O. Sustainable Drainage System for Road Networking. Int. J. Innov. Manag. Technol. 2014, 5, 83–86. [Google Scholar] [CrossRef]
  8. Izzard, C.F. Tentative results on capacity of curb opening inlets, with discussion. Highw. Res. Board 1950, 11, 36–54. [Google Scholar]
  9. Mostkow, M.A. Theoretical study of bottom type water intake. Proceeding of Sur le calcul des grilles de prise d’eau, La Houille blanche, Grenoble. 2011, pp. 570–580. Available online: https://doi.org/10.1051/lhb/1957048 (accessed on 15 April 2022).
  10. Mustafa, Z. An Experimental Investigation of the Hydraulics of Street Inlets. Ph.D. Thesis, University Teknologi Petronas, Seri Iskandar, Malaysia, 2003. [Google Scholar]
  11. Gahin, H.Ġ. Examination of Grate Inlets within Urban Stormwater Drainage. Master’s Thesis, Istanbul Technical University, Ġstanbul, Turkey, 2006. [Google Scholar]
  12. Michael, B.; Jianqing, Y. Combined hydraulic and black models for forecasting in urban drainage systems. J. Hydrol. Eng. 2006, 11, 589–596. [Google Scholar]
  13. Carvalho, R.F.; Leandro, J.; David, L.M.; Martins, R.; Melo, N. Numerical Research of the Inflow Into Different Gullies Outlets. In Proceedings of the Computing and Control for the Water Industry, Exeter, UK, 5–7 September 2011. [Google Scholar]
  14. Lopes, P.; Leandro, J.; Carvalho, R.F.; Páscoa, P.; Martins, R. Numerical and experimental investigation of a gully under surcharge conditions. Urban Water J. 2013, 13, 468–476. [Google Scholar] [CrossRef]
  15. Sezenöz, B. Numerical Modeling of Continuous Transverse Grates for Hydraulic Efficiency. Master’s Thesis, Middle East Technical University, Ankara, Turkey, 2014. [Google Scholar]
  16. Manuel, G.; Joan, R.; Beniamino, R.; Eduardo, M. Assessment of inlet efficiency through a 3D simulation: Numerical and experimental comparison. Water Sci. Technol. 2016, 74, 1926–1935. [Google Scholar]
  17. Wakif, S.; Sabtu, N. Hydraulic Performance of Vertically Depressed and Non-Depressed Grate. Urban Water J. 2019, 16, 554–563. [Google Scholar] [CrossRef]
  18. Cosco, C.; Gómez, M.; Russo, B.; Tellez-Alvarez, J.; Macchione, F.; Costabile, P.; Costanzo, C. Discharge coefficients for specific grated inlets. Influence of the Froude number. Urban Water J. 2020, 17, 1–13. [Google Scholar] [CrossRef]
  19. Gómez, M.; Russo, B.; Tellez-Alvarez, J. Experimental investigation to estimate the discharge coefficient of a grate inlet under surcharge conditions. Urban Water J. 2019, 16, 85–91. [Google Scholar] [CrossRef]
  20. Guo, S.; Chen, L.; Chen, G.; Zhang, W.; Ma, Y. Experimental Study of the Hydraulic Performance of Continuous Transverse Grates. J. Irrig. Drain. Eng. 2021, 147, 06021007. [Google Scholar] [CrossRef]
  21. Aranda, J.; Beneyto, C.; Sánchez-Juny, M.; Bladé, E. Efficient Design of Road Drainage Systems. Water 2021, 13, 1661. [Google Scholar] [CrossRef]
  22. Buckingham, E. On physically similar systems; illustrations of the use of dimensional equations. Phys. Rev. 1914, 4, 345–376. [Google Scholar] [CrossRef]
Figure 1. Plan of flume and arrangements of grates.
Water 14 02541 g001
Figure 2. Longitudinal cross-section of flume and main pipe system.
Water 14 02541 g002
Figure 3. The shape of flume used in the experimental study.
Water 14 02541 g003
Figure 4. Sketch of different shapes of grates.
Water 14 02541 g004
Figure 5. Sketch of different inlet area of grate type 4.
Water 14 02541 g005
Figure 6. Grate shapes used in the study.
Water 14 02541 g006
Figure 7. Relationship between discharge efficiency and passing discharge for different types of grate shapes.
Water 14 02541 g007
Figure 8. The average discharge efficiency for different types of grate shapes.
Water 14 02541 g008
Figure 9. Comparison between grate type 4 in (a) the current study (b) Manuel study [16].
Water 14 02541 g009
Figure 10. Relationship between discharge efficiency and passing discharge for different inlet areas.
Water 14 02541 g010
Figure 11. The average efficiency of discharge for different inlet area of grates.
Water 14 02541 g011
Figure 12. Relationship between relative water height of grate and relative grate distance for different grate inlet areas at (Q = 1.2 L/s).
Water 14 02541 g012
Figure 13. Relationship between relative grate water height and relative grate distance for different grate inlet areas at (Q = 6.0 L/s).
Water 14 02541 g013
Figure 14. Relationship between relative width and relative grate distance for different grate inlet areas (Q = 1.2 L/s).
Water 14 02541 g014
Figure 15. Relationship between relative width and relative grate distance for different grate inlet areas (Q = 3.3 L/s).
Water 14 02541 g015
Figure 16. Measured £ versus predicted values from Equation (2).
Water 14 02541 g016
Figure 17. The distribution of residuals around the line of zero error for predicted values of £.
Water 14 02541 g017
Table 1. The effect of using different grate shapes on the discharge efficiency.
Types of Grate ShapeShape of SlotsLength of Total Slot (cm)Width of Slots (cm)Inlet Area (cm2)% Inlet AreaNumber of Longitudinal BarsNumber of Transverse BarsNumber of Diagonal Bars (£)
from Q (6.0–1.0) L/s
Grate type (1)Trapezium104.80.22127%150034.4% to 75.5%
Grate type (2)Trapezium104.80.22127%015064.2%to 73.3%
Grate type (3)Trapezium104.80.22127%001533.7% to 73.9%
Grate type (4)Trapezium103.80.220.826%102434.6% to 75.6%
Grate type (5)Circleــــــ0.421.728%173 circles with diameter 0.4 cm32.5% to 70%
Table 2. The effect of using different inlet area of on the discharge efficiency.
Types of Grates Length of Total Slots (cm)Width of Slots (cm)Inlet Area (cm2)% Inlet AreaNumber of Longitudinal BarsNumber of Transverse Bars Number of Diagonal Bars (£)
From
Q (6.0–1.0) L/s
Grate type 4103.80.22126%102434.6% to 75.6%
Grate type 4168.40.240.3251%104435.5% to 77.6%
Grate type 4201.60.350.5264%103626.8% to 78.7%
Publisher’s Note: MDPI stays neutral with regard to jurisdictional claims in published maps and institutional affiliations.

