
A Novel Roughness and Flow Pattern for Steep Stream-Type Fishways: Preliminary Insights


1
Department of Civil and Environment Engineering, Faculty of Science and Engineering, Toyo University, 2100 Kujirai, Kawagoe 350-8585, Saitama, Japan
2
Department of Civil and Environment Engineering, Graduate School of Science and Engineering Graduated, Toyo University, Kawagoe 350-8585, Saitama, Japan
3
Department of Civil and Environment Engineering, Graduate School of Science and Engineering, Toyo University, 2100 Kujirai, Kawagoe 350-8585, Saitama, Japan
*
Author to whom correspondence should be addressed.
Water 2022, 14(16), 2540; https://doi.org/10.3390/w14162540
Submission received: 27 June 2022
/
Revised: 8 August 2022
/
Accepted: 15 August 2022
/
Published: 18 August 2022
(This article belongs to the Special Issue Research on Hydraulics of Migration Route of Aquatic Animals)
Abstract
:The purpose of this study was to allow fish to move upstream past barriers or difficult sections of passage, even on steep stream-type fishways. Therefore, the authors devised a roughness arrangement to raise the water depth in the fishway and reduce its flow velocity. Roughness was used as a group in the arrangement so as to expect afflux effects. Water depth was raised and the flow velocity was reduced around the roughness groups, which allowed fish to hold position and move upstream. Although rapid flow was locally formed in some spots in the fishway, its area was small, enabling the fish to move upstream sufficiently. The experimental results obtained in this study will be applied as a removable stream-type fishway to small channels, head constructions, and so on where fishways cannot be installed due to management.
1. Introduction
Fishways are set in rivers and waterways to help fish and crustaceans move upstream and expand their habitable ranges. There exist the following several types of fishways: pool type, stream type, culvert type, and operation type [1]. This study focuses on stream-type fishways. Nature-friendly landscapes and various flow velocities are obtained by the stream-type fishway and are therefore suitable for the movement of various types of fish such as demersal fish, swimming freshwater fish, and fry.
In Japan, the Guideline for environmental works of rivers for fish to move upstream [2] was issued in 2005 by the River Bureau (current Water and Disaster Management Bureau) of the Japanese Ministry of Land, Infrastructure, Transport and Tourism. According to the guide, a longitudinal gradient of a stream-type fishway should be 1/20 or less, and a steep slope is described as a longitudinal gradient of 1/10 or more.
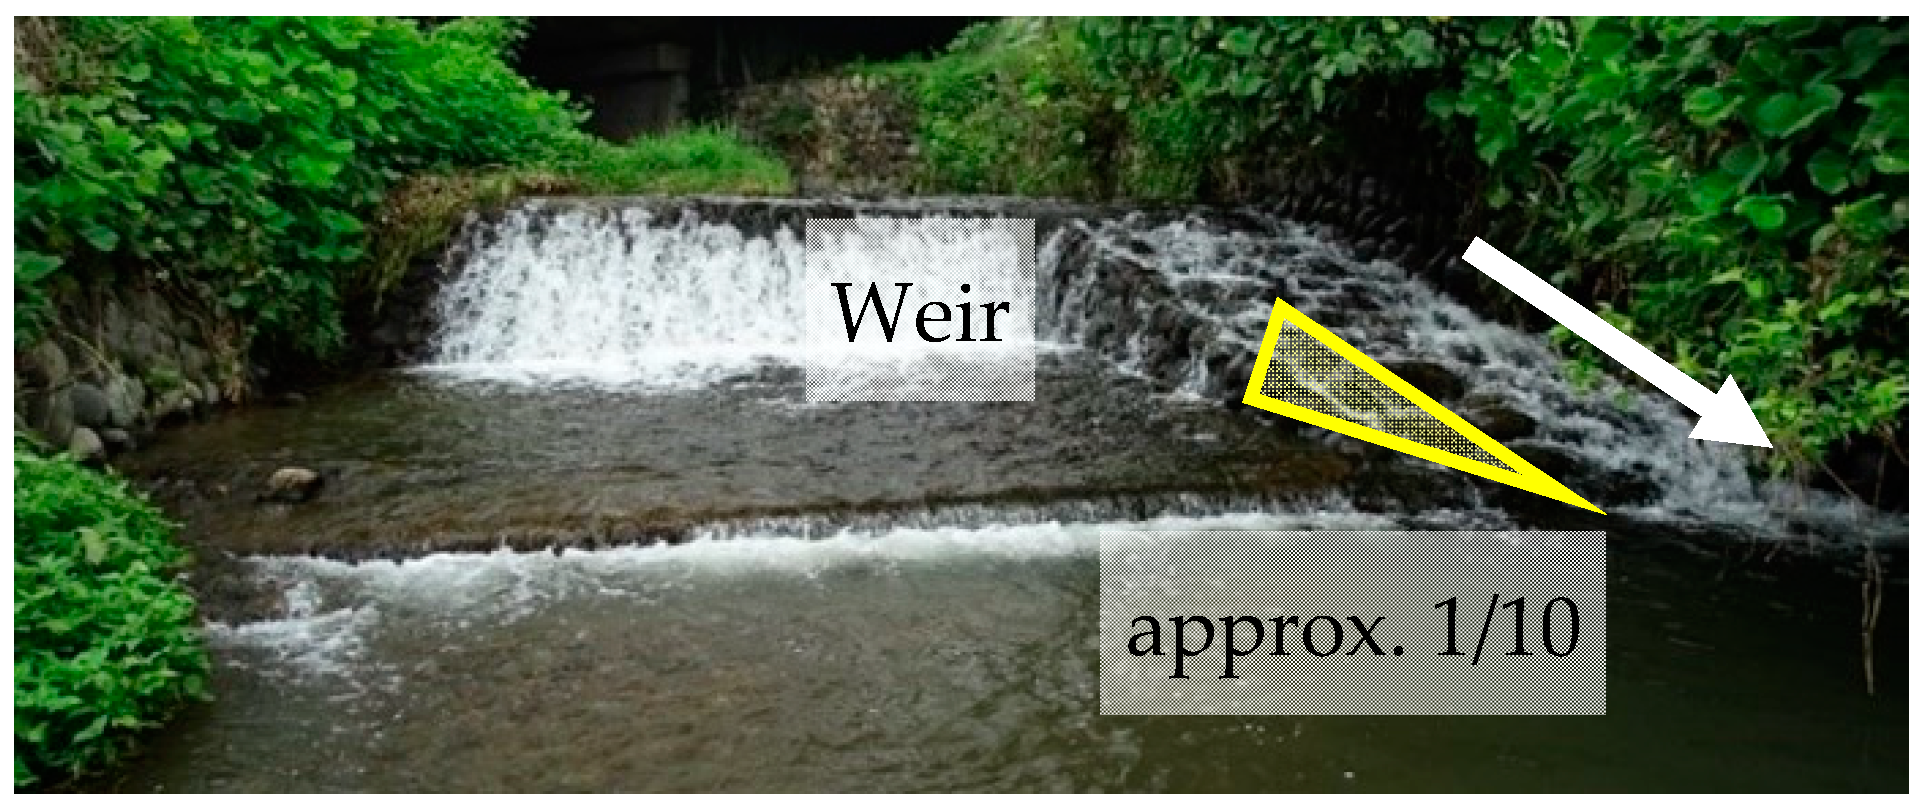
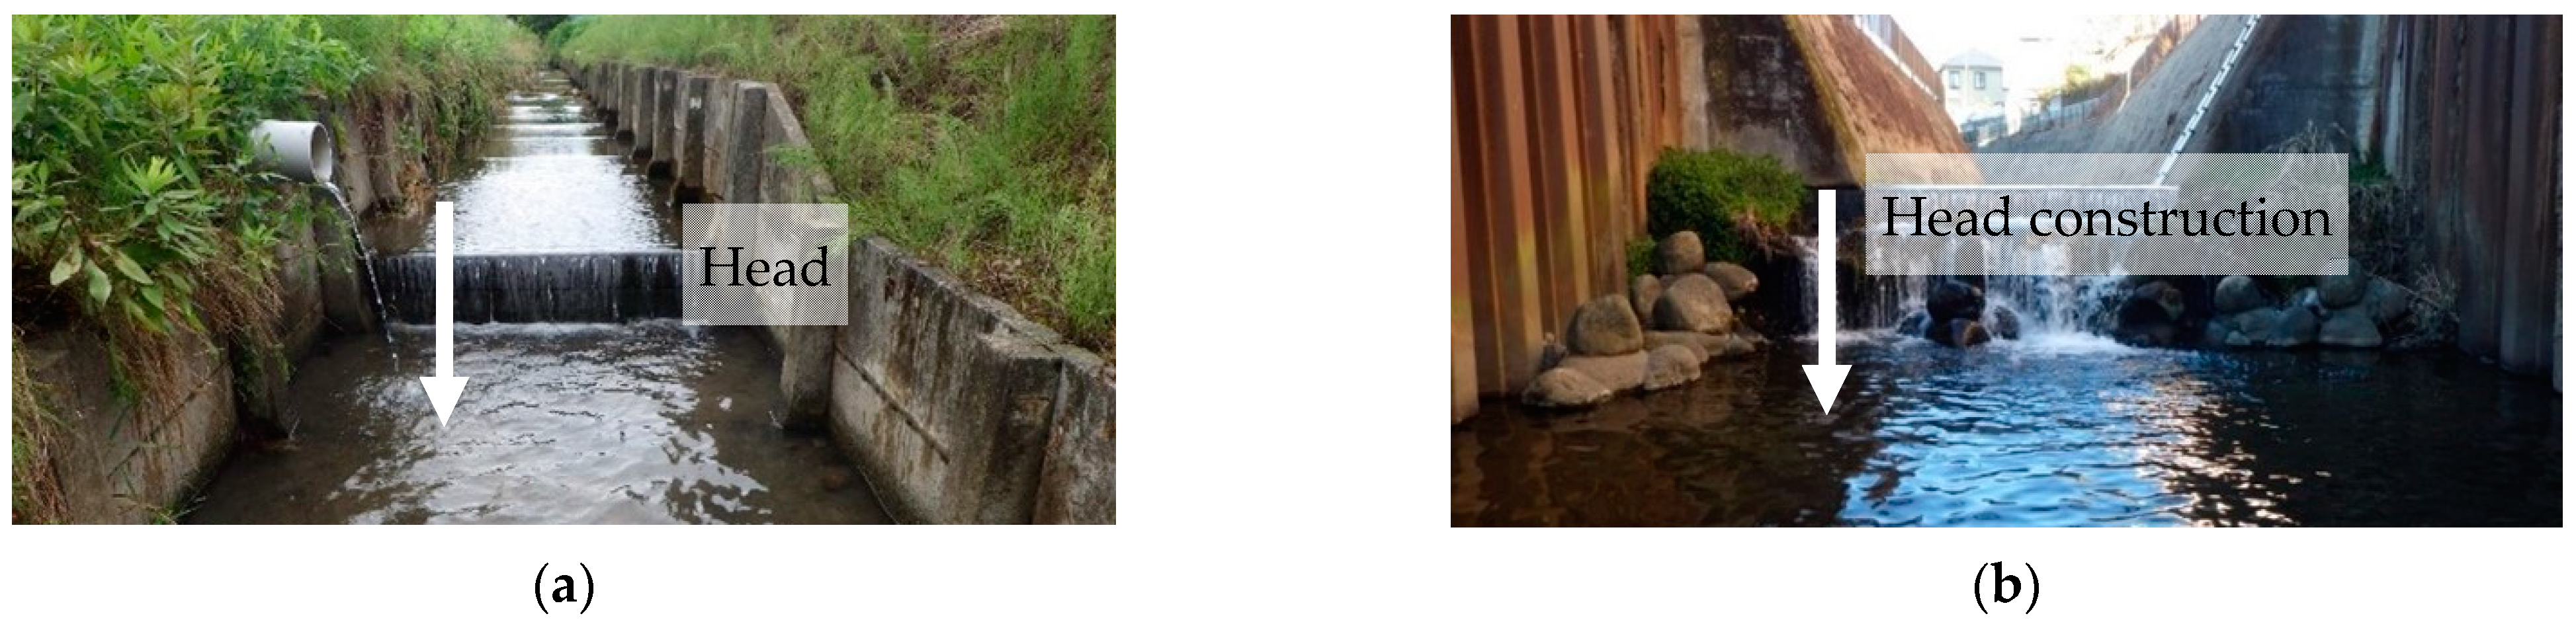
However, a fishway may not be expanded sufficiently depending on the local site conditions, and the authors have confirmed the existence of fishways with a longitudinal gradient of over 1/20 (see Figure 1). According to the survey report published by the Japan RiverFront Research Center on the Japanese rivers under the direct control of the central government [3], 80% of the 133 sloped fishways have longitudinal gradients steeper than 1/20. In addition, there are spots where the continuity of the fish’s upstream movement is interrupted by the head of waterways or rivers (see Figure 2). Installation of a fishway at the head will allow fish to move upstream as well. In addition, water areas such as rivers, irrigation channels, drainage channels, and paddy fields will be connected by installing a fishway, which allows the ecosystem to be conserved.
The authors have been studying a roughness arrangement that allows fish to move upstream even on steep fishways. Here, “roughness” means the drag of colony of cylinder to flow. The previous study [4] revealed, basic characteristics of roughness arrangement. It is an arrangement with a diameter of 4.8 cm cylinder used as a roughness element and several of them are installed as a colony with convex surfaces. The percentage of fish passing upstream has been improved by directing the convex surface of the roughness group to the downstream direction.
In this study, based on the basic roughness arrangement, we examined setting conditions of the roughness group, aiming to furthermore improve the percentage of fish passing upstream of fish and achieve an efficient move upstream. Moreover, we simplified the fishway aiming at developing a fishway so it can be easily installed and removed in small size rivers and waterways.
2. Experiment Outline
The authors considered two ways in which fish could more easily move upstream. One is to increase the interval between roughness groups, thereby increasing the area to which fish can hold a position in the fishway. The other is to diversify the flow in the fishway by an alternating arrangement of the roughness groups. Therefore, the authors proposed six experimental cases.
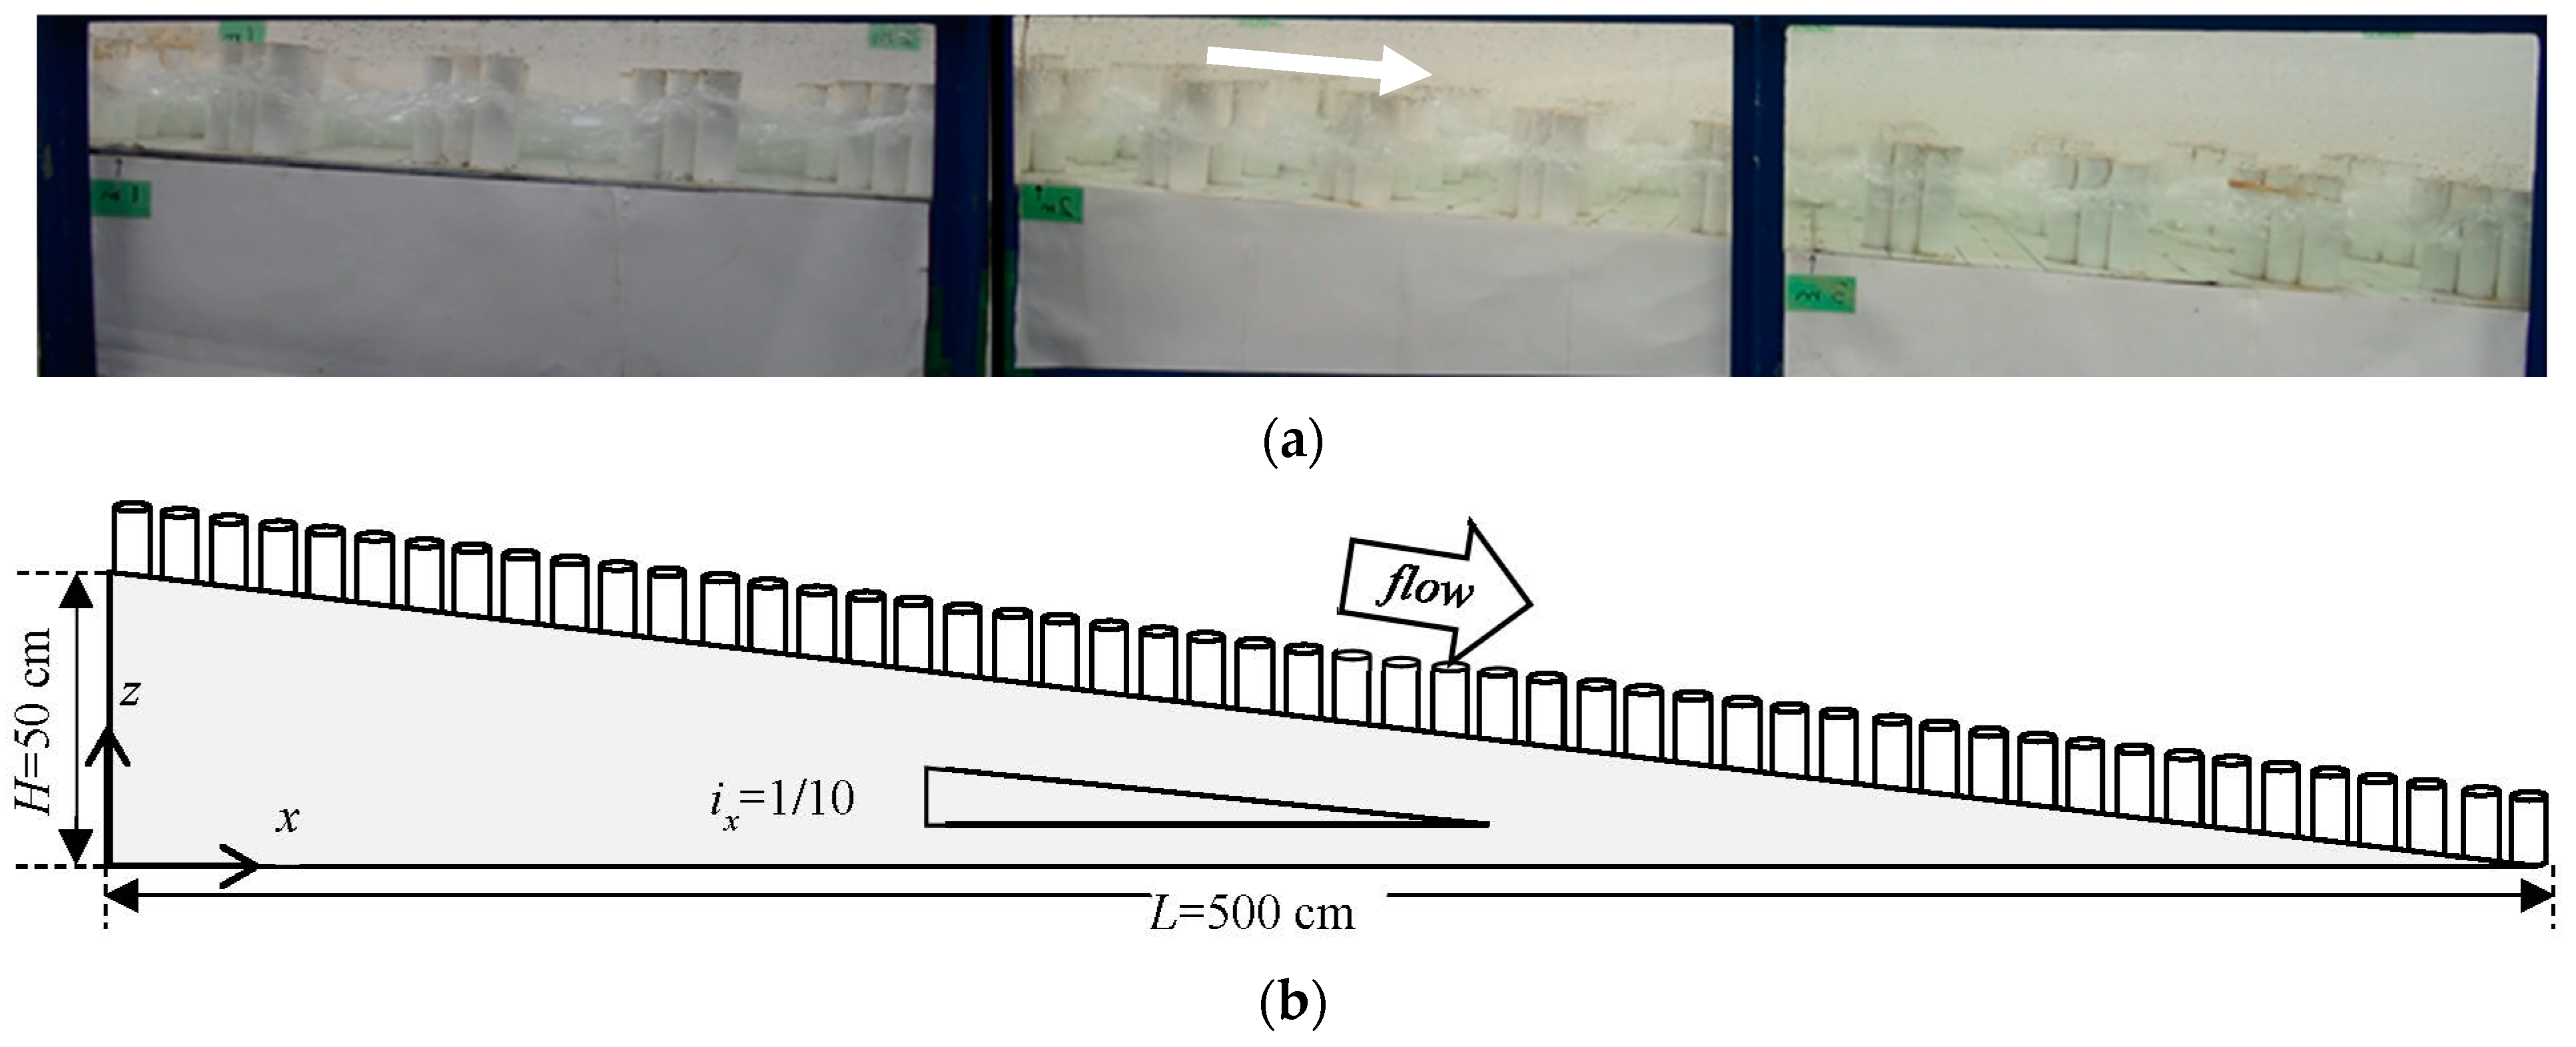
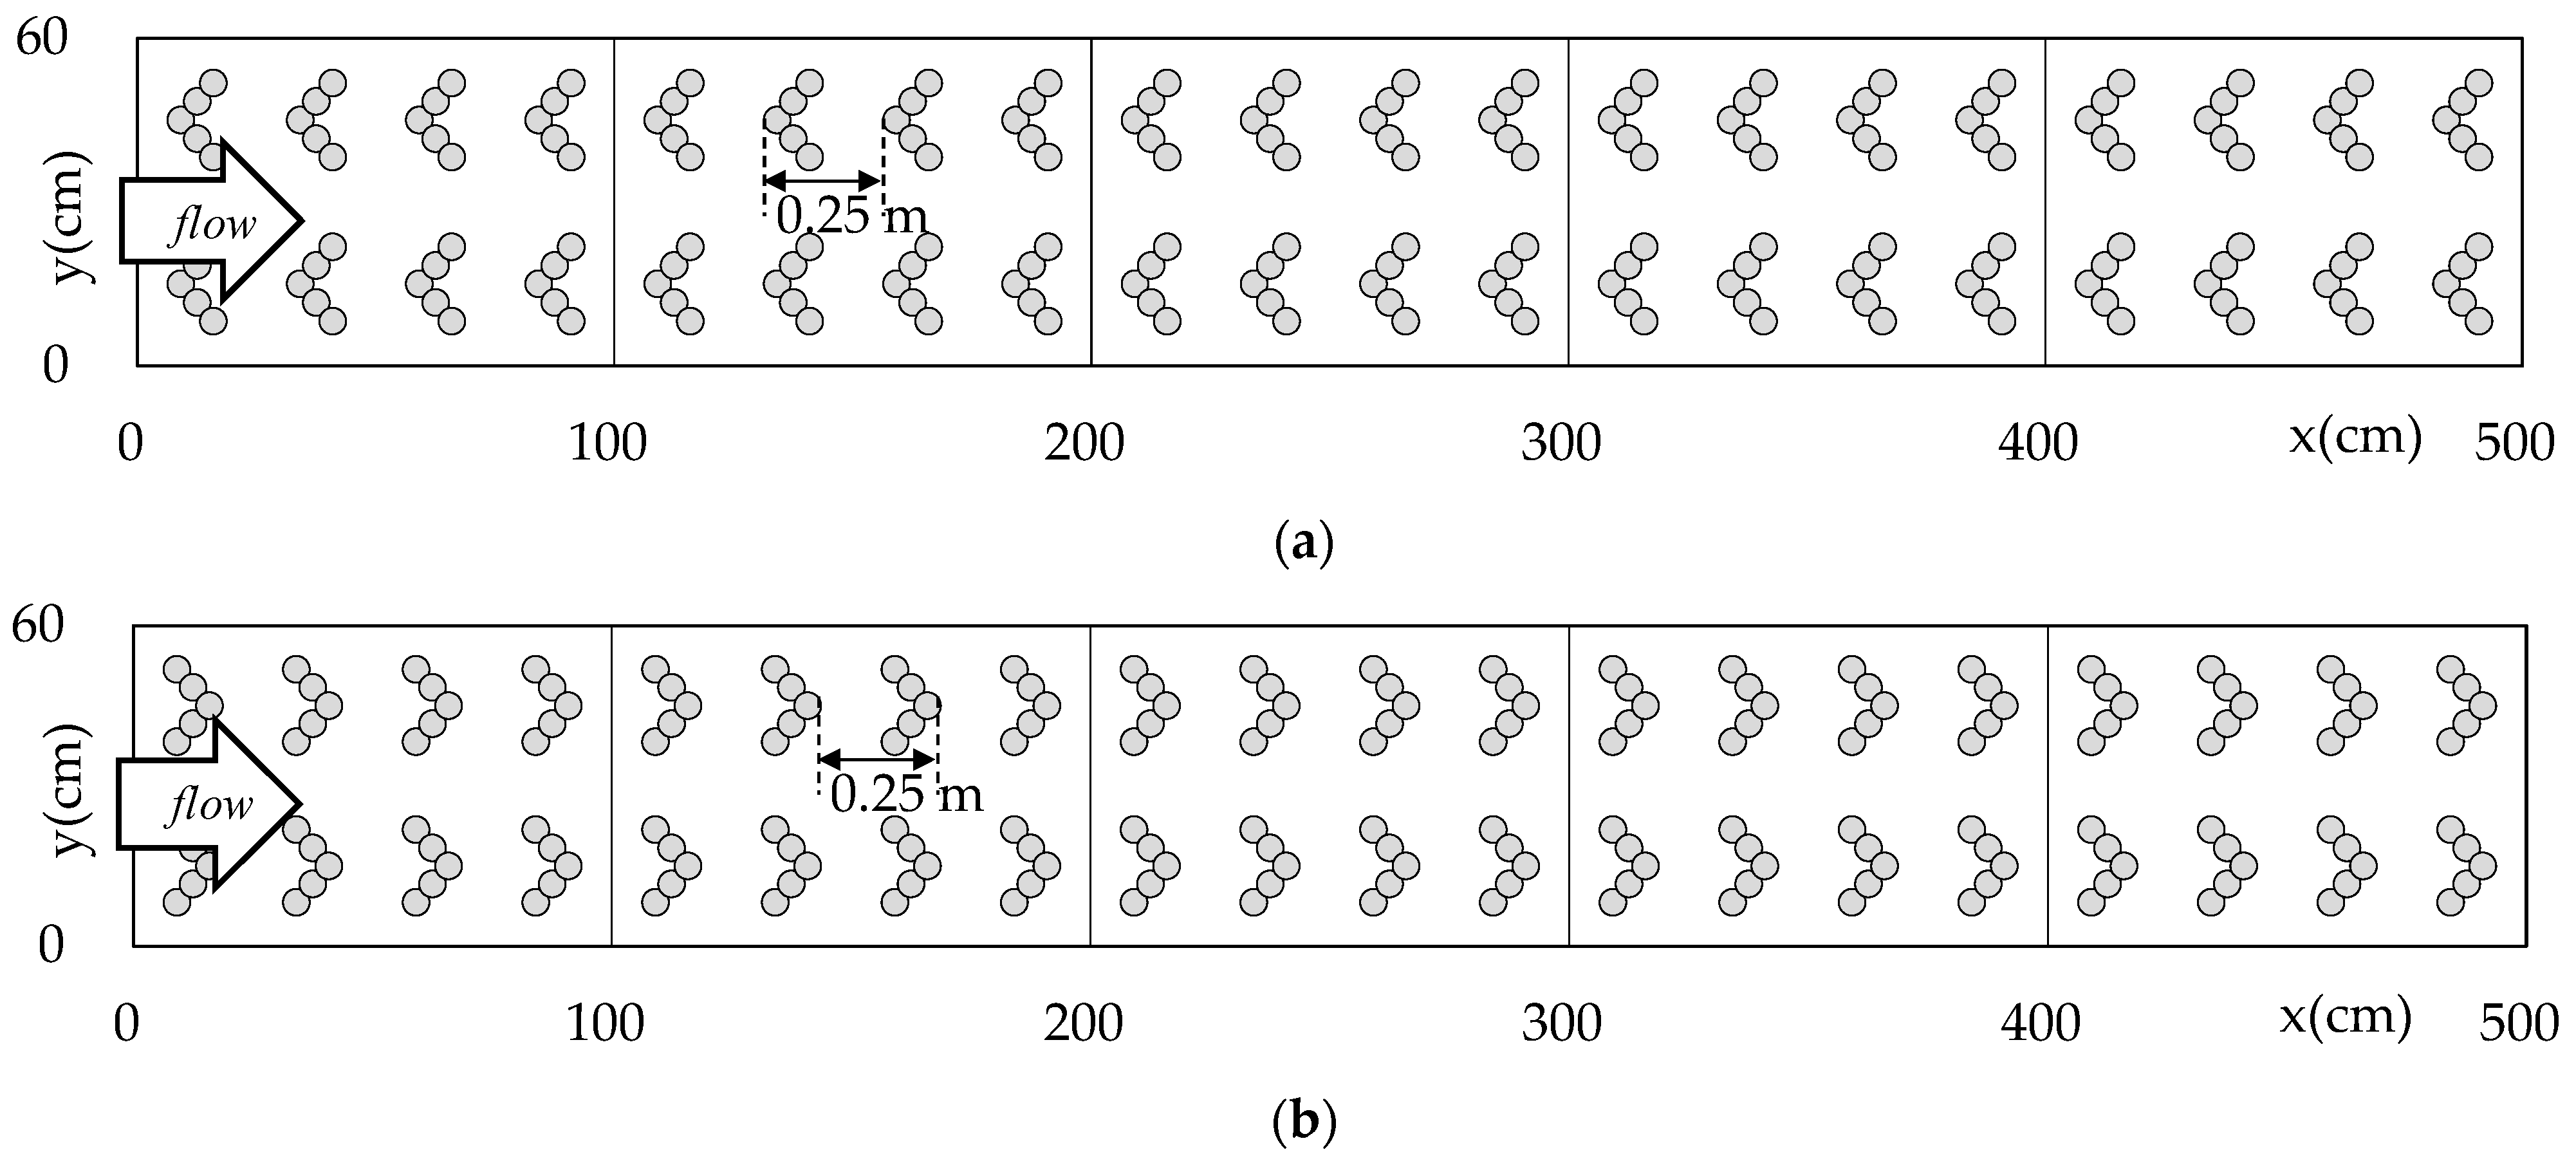
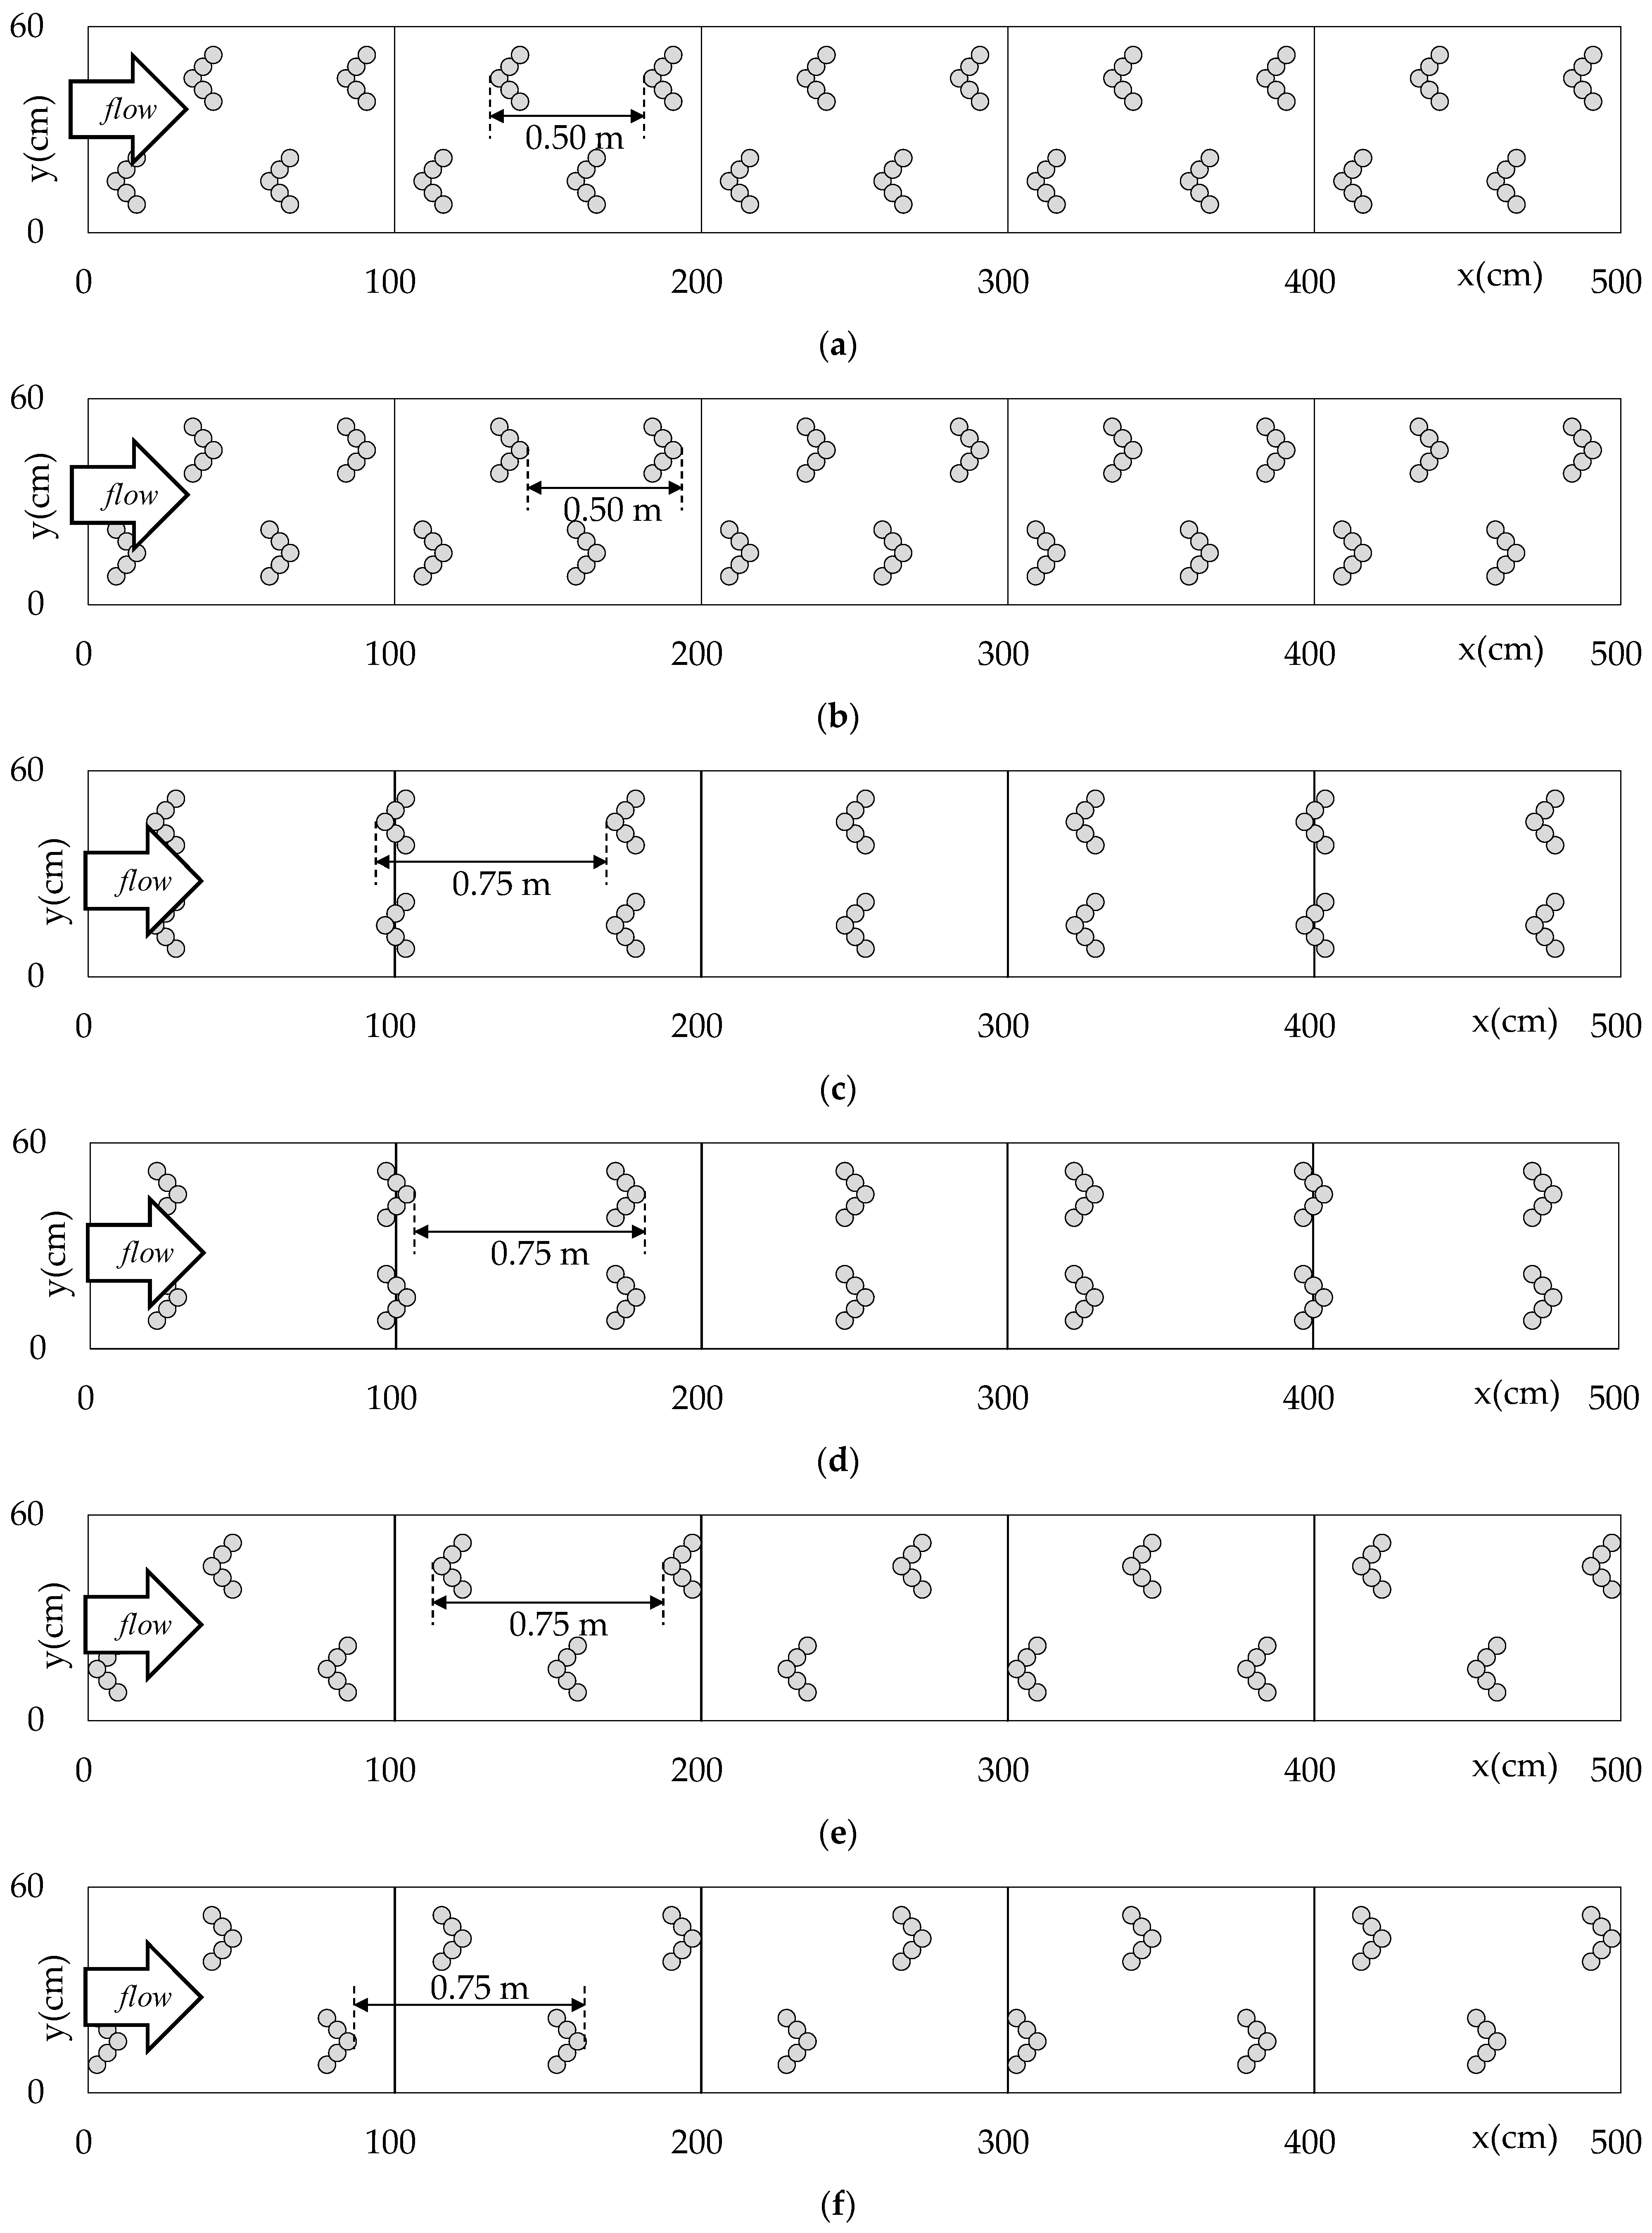
The fishway used in the experiment is shown in Figure 3. The width of the fishway is 60 cm, the horizontal length is 500 cm, and the height is 50 cm; therefore, the vertical slope of the fishway is as steep as 1/10. The experiment was conducted with a flow quantity of 0.024 m3/s. Table 1 shows a list of experimental cases. Case 4 was applied in the previous study [4] which is included here for comparison with the results of this study. Figure 4 shows the arrangement of the roughness groups in each case of the previous study [4] and Figure 5 shows that of this study. In Cases 5 and 7, the roughness groups were installed alternately with the installation interval of the roughness groups set to 0.5 m and 0.75 m, respectively. In Case 6, the roughness groups were installed in parallel with the installation interval of the roughness groups set to 0.75 m. Compared to the previous study (Case 4) [4], the density of roughness λ of Cases 5–7 is 0.5 times, 0.33 times, and 0.33 times, respectively.
2.1. Experiment of Real Fish Behavior
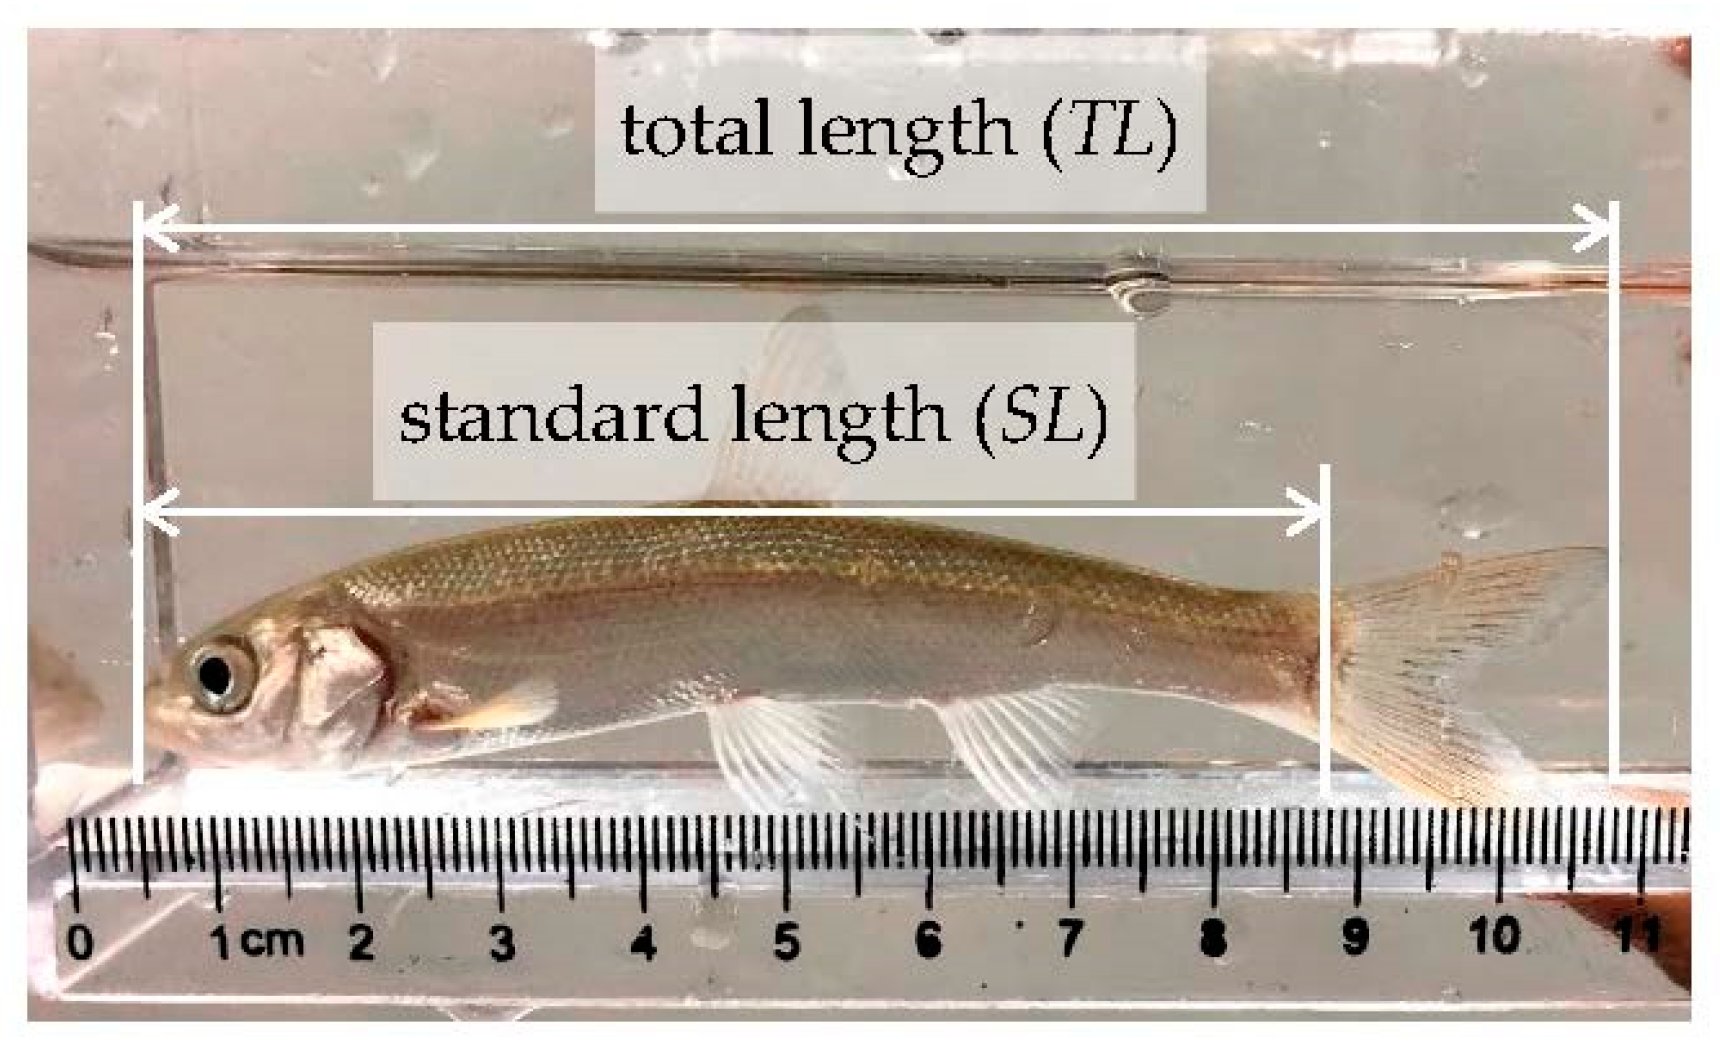
All experiments were performed according to the guideline of ethical animal experiments at Toyo University. We used Tribolodon hakonensis (hereinafter called “Ugui”) with a standard length (SL) ranging between 7.4 and 10.4 cm (average standard length () is 9.0 cm) (see Figure 6). Ugui is a swimming freshwater fish that lives in various parts of Japan and uses fishways [5]. In addition, Ugui has a swimming ability that is similar to same as that of Plecoglossus altivelis altivelis, Salvelinus leucomaenis, and Zacco platypus [6,7,8]. Therefore, we believe that the results of this experiment with Ugui are applicable to similar other species of swimming freshwater fish. In the experiments, the downstream x = 500 cm and x = 550 cm of the fishway were separated by a net and used as an acclimatization section of Ugui. 10 Uguis were released in this section and left under the experimental conditions for 5 min to allow them to become familiar with the environment. After that, only the net with x = 500 cm on the upstream side was opened and the experiment was started. The experiment time was 30 min, and the behavior of Ugui was photographed with a high-resolution camera during the experiment. Experiments were performed 3 times in each case.
2.2. Hydraulic Experiment
In each case, the water depth and flow velocity were measured. The water depth was measured with a point gauge. The water depth was measured three times at each station and the measured values were simply averaged. The flow velocity was measured with a two-dimensional electromagnetic current meter. The flow velocities in the x and y directions are indicated as u and v, respectively. For the flow velocities, the authors measured a total of 25.6 s; 512 data every 0.05 s, and the simple average was used as the temporal mean velocity. The temporal mean velocities in the x and y directions are indicated as and , respectively. The swimming depth of Ugui was approximately 2 cm above the fishway bed, which was a phenomenon similar to that seem observed in the previous study [4], and therefore, the measurement point of the flow velocity was determined as 2 cm above the fishway-bed.
2.3. Material and Methods
The percentage of fish passing upstream (hereinafter called “Rr”) is defined by the following formulas [9,10,11,12].
Here, Rr is the percentage of fish passing upstream, FC is the total number of Ugui that completed to move upstream (passing from the most downstream end to the most upstream end of the fishway), and FT is the total number of Ugui used in the experiment.
3. Results and Discussion
In order to evaluate the functionality of the fishway, the authors focused on the Rr of Ugui. Moreover, the flow in the fishway and swimming paths of Ugui were compared, in consideration of the difference in the arrangement of the roughness groups. Next, we discussed whether Ugui was able to move upstream efficiently, focusing on the distance and time that Ugui spent moving upstream in the fishway. Finally, it was determined which case was preferable for fish to move upstream comprehensively, based on the results of the flow in the fishway, the Rr, the distance, and the time of Ugui passing upstream.
3.1. The Percentage of Fish Passing Upstream Rr
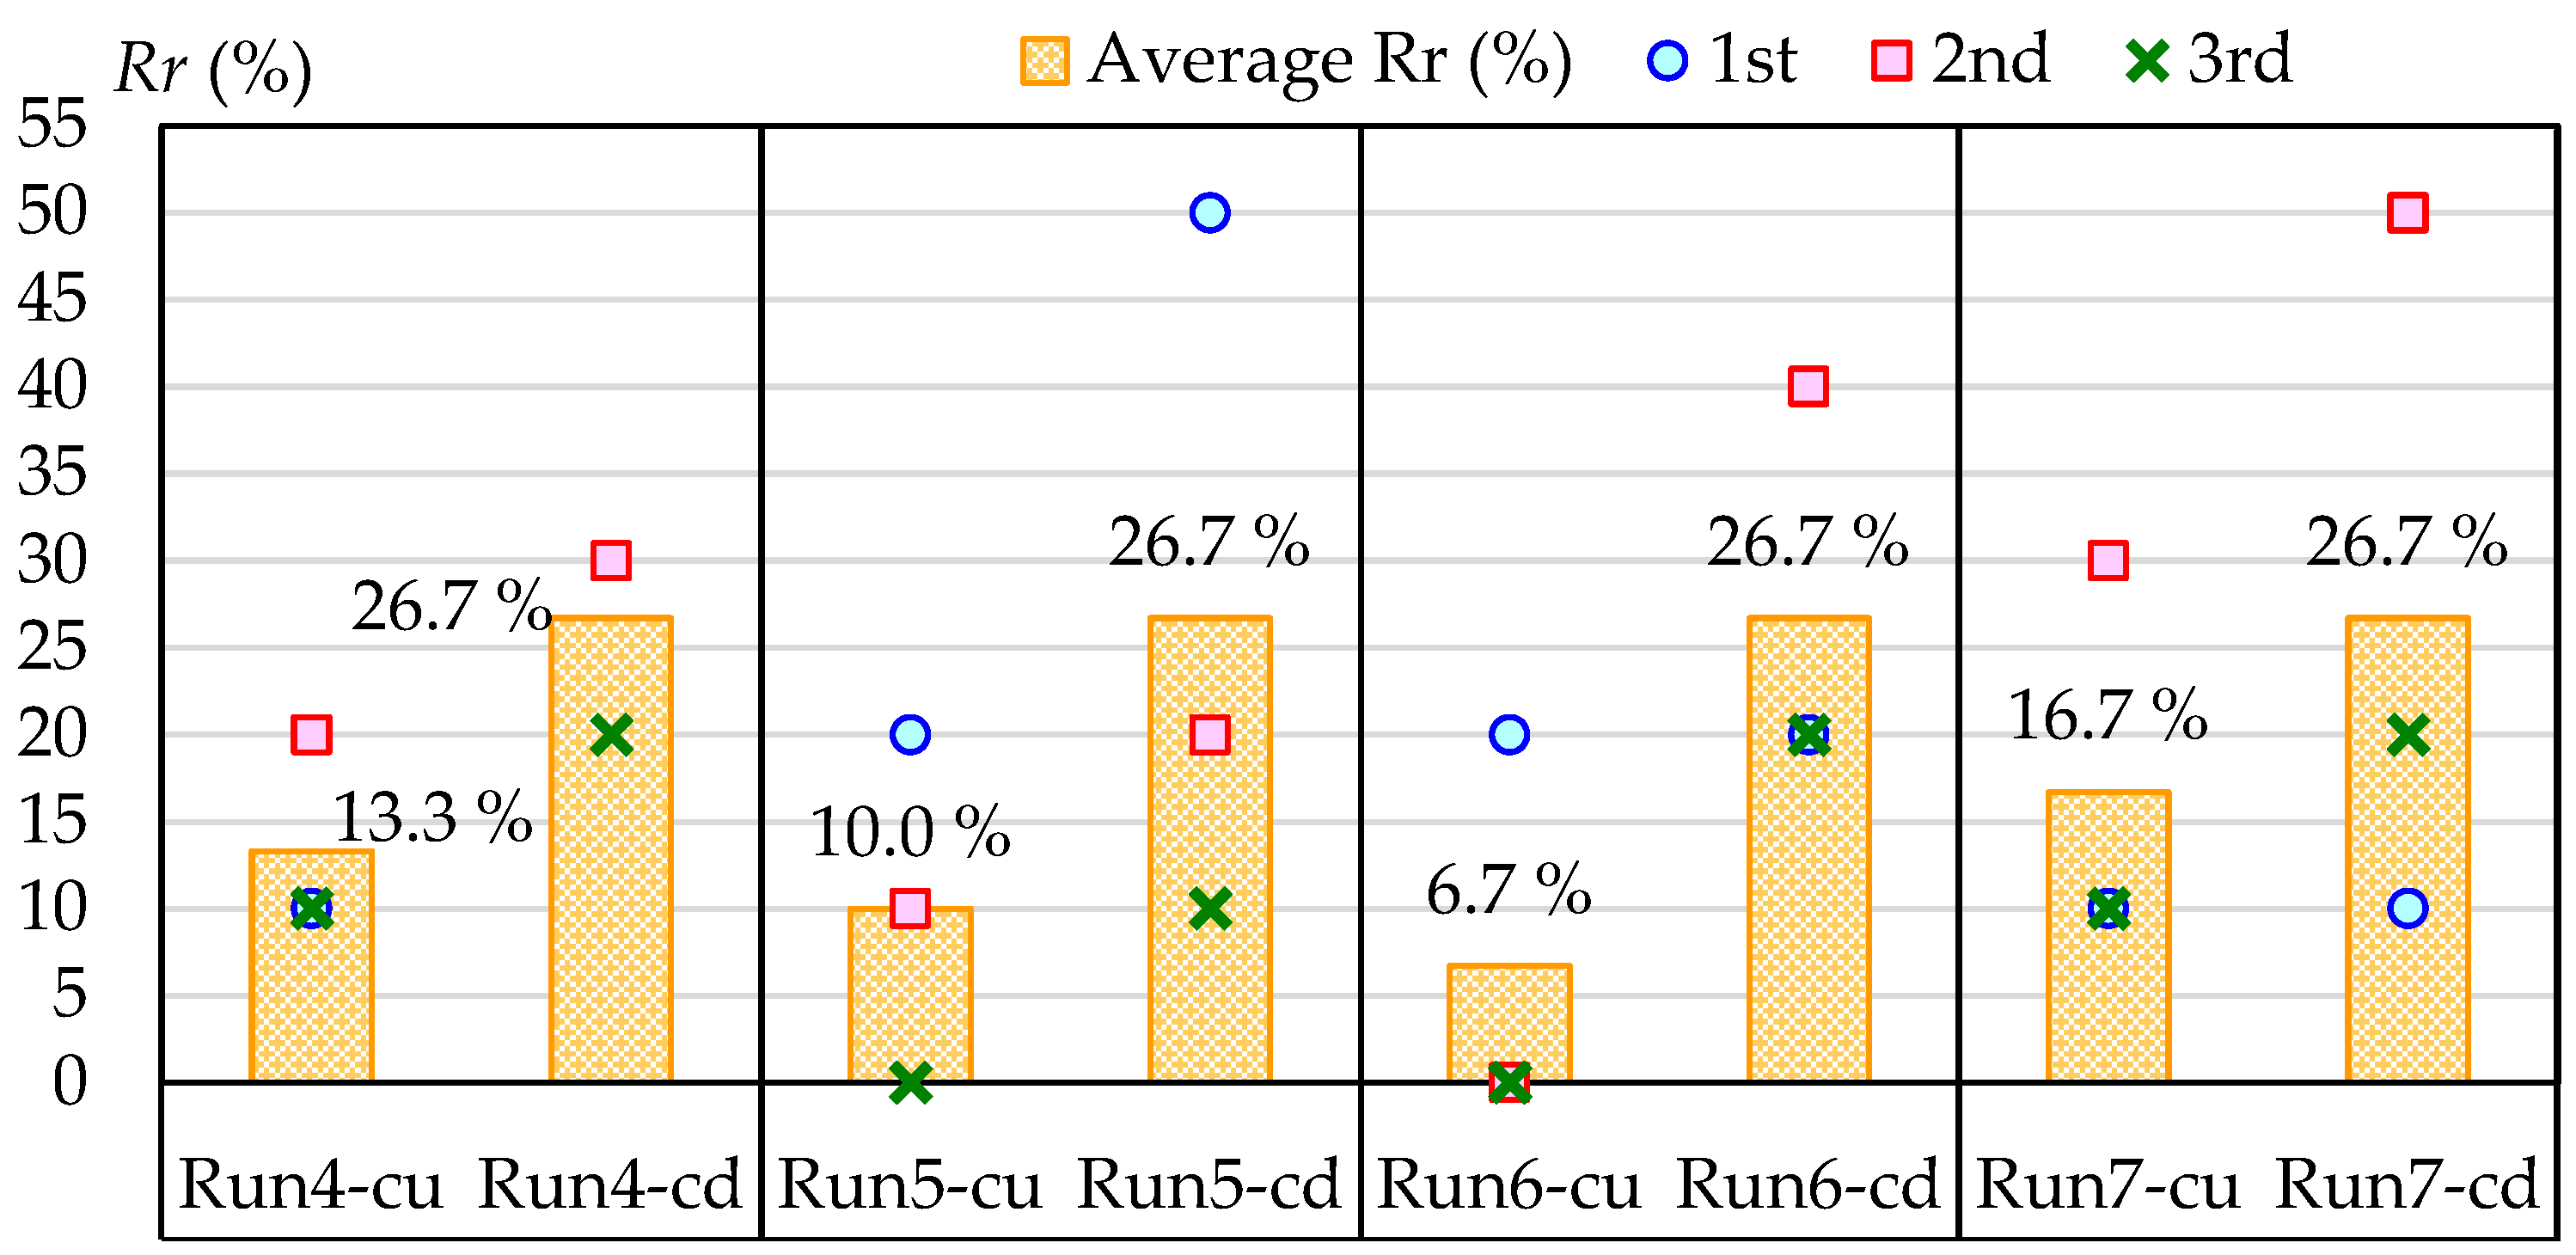
Figure 7 shows the Rr for each case. The Rr in the cases where the convex end representing the tip of the arrowhead (Run5-cd, Run6-cd, it can be seen that the Rr of Ugui in Run7-cd) were higher than those in the cases where the convex side of the inside of the arrowhead (Run5-cu, Run6-cu, Run7-cu). This result was similar to that of Case 4 in the previous study [4]. In the case where the convex end represents the tip of the arrowhead, the average Rr of Ugui was 26.7%. The Rr of Ugui was not improved, compared to the results of Run4-cd in the previous study [4]. However, Run5-cd, Run6-cd, and Run7-cd have a wider installation interval of the roughness groups and a smaller density of roughness λ than that of Run4-cd, suggesting that the fishway functioned even with decreased number of roughness groups installations. This result is useful information for installing the fishway in a local waterway and a small size river. For example, the cost of installing the fishway can be reduced with the small number of roughness groups. In addition, even in the case that some of the roughness groups are damaged, the fishway’s functions can be maintained as long as 0.04 and more of the density of roughness λ is satisfied.
However, we should repeat experiment of real fish behavior to accumulate more verification experimental results because experimental were performed three times.
3.2. Flow Velocity in the Fishway and the Route of Fish Passing Upstream
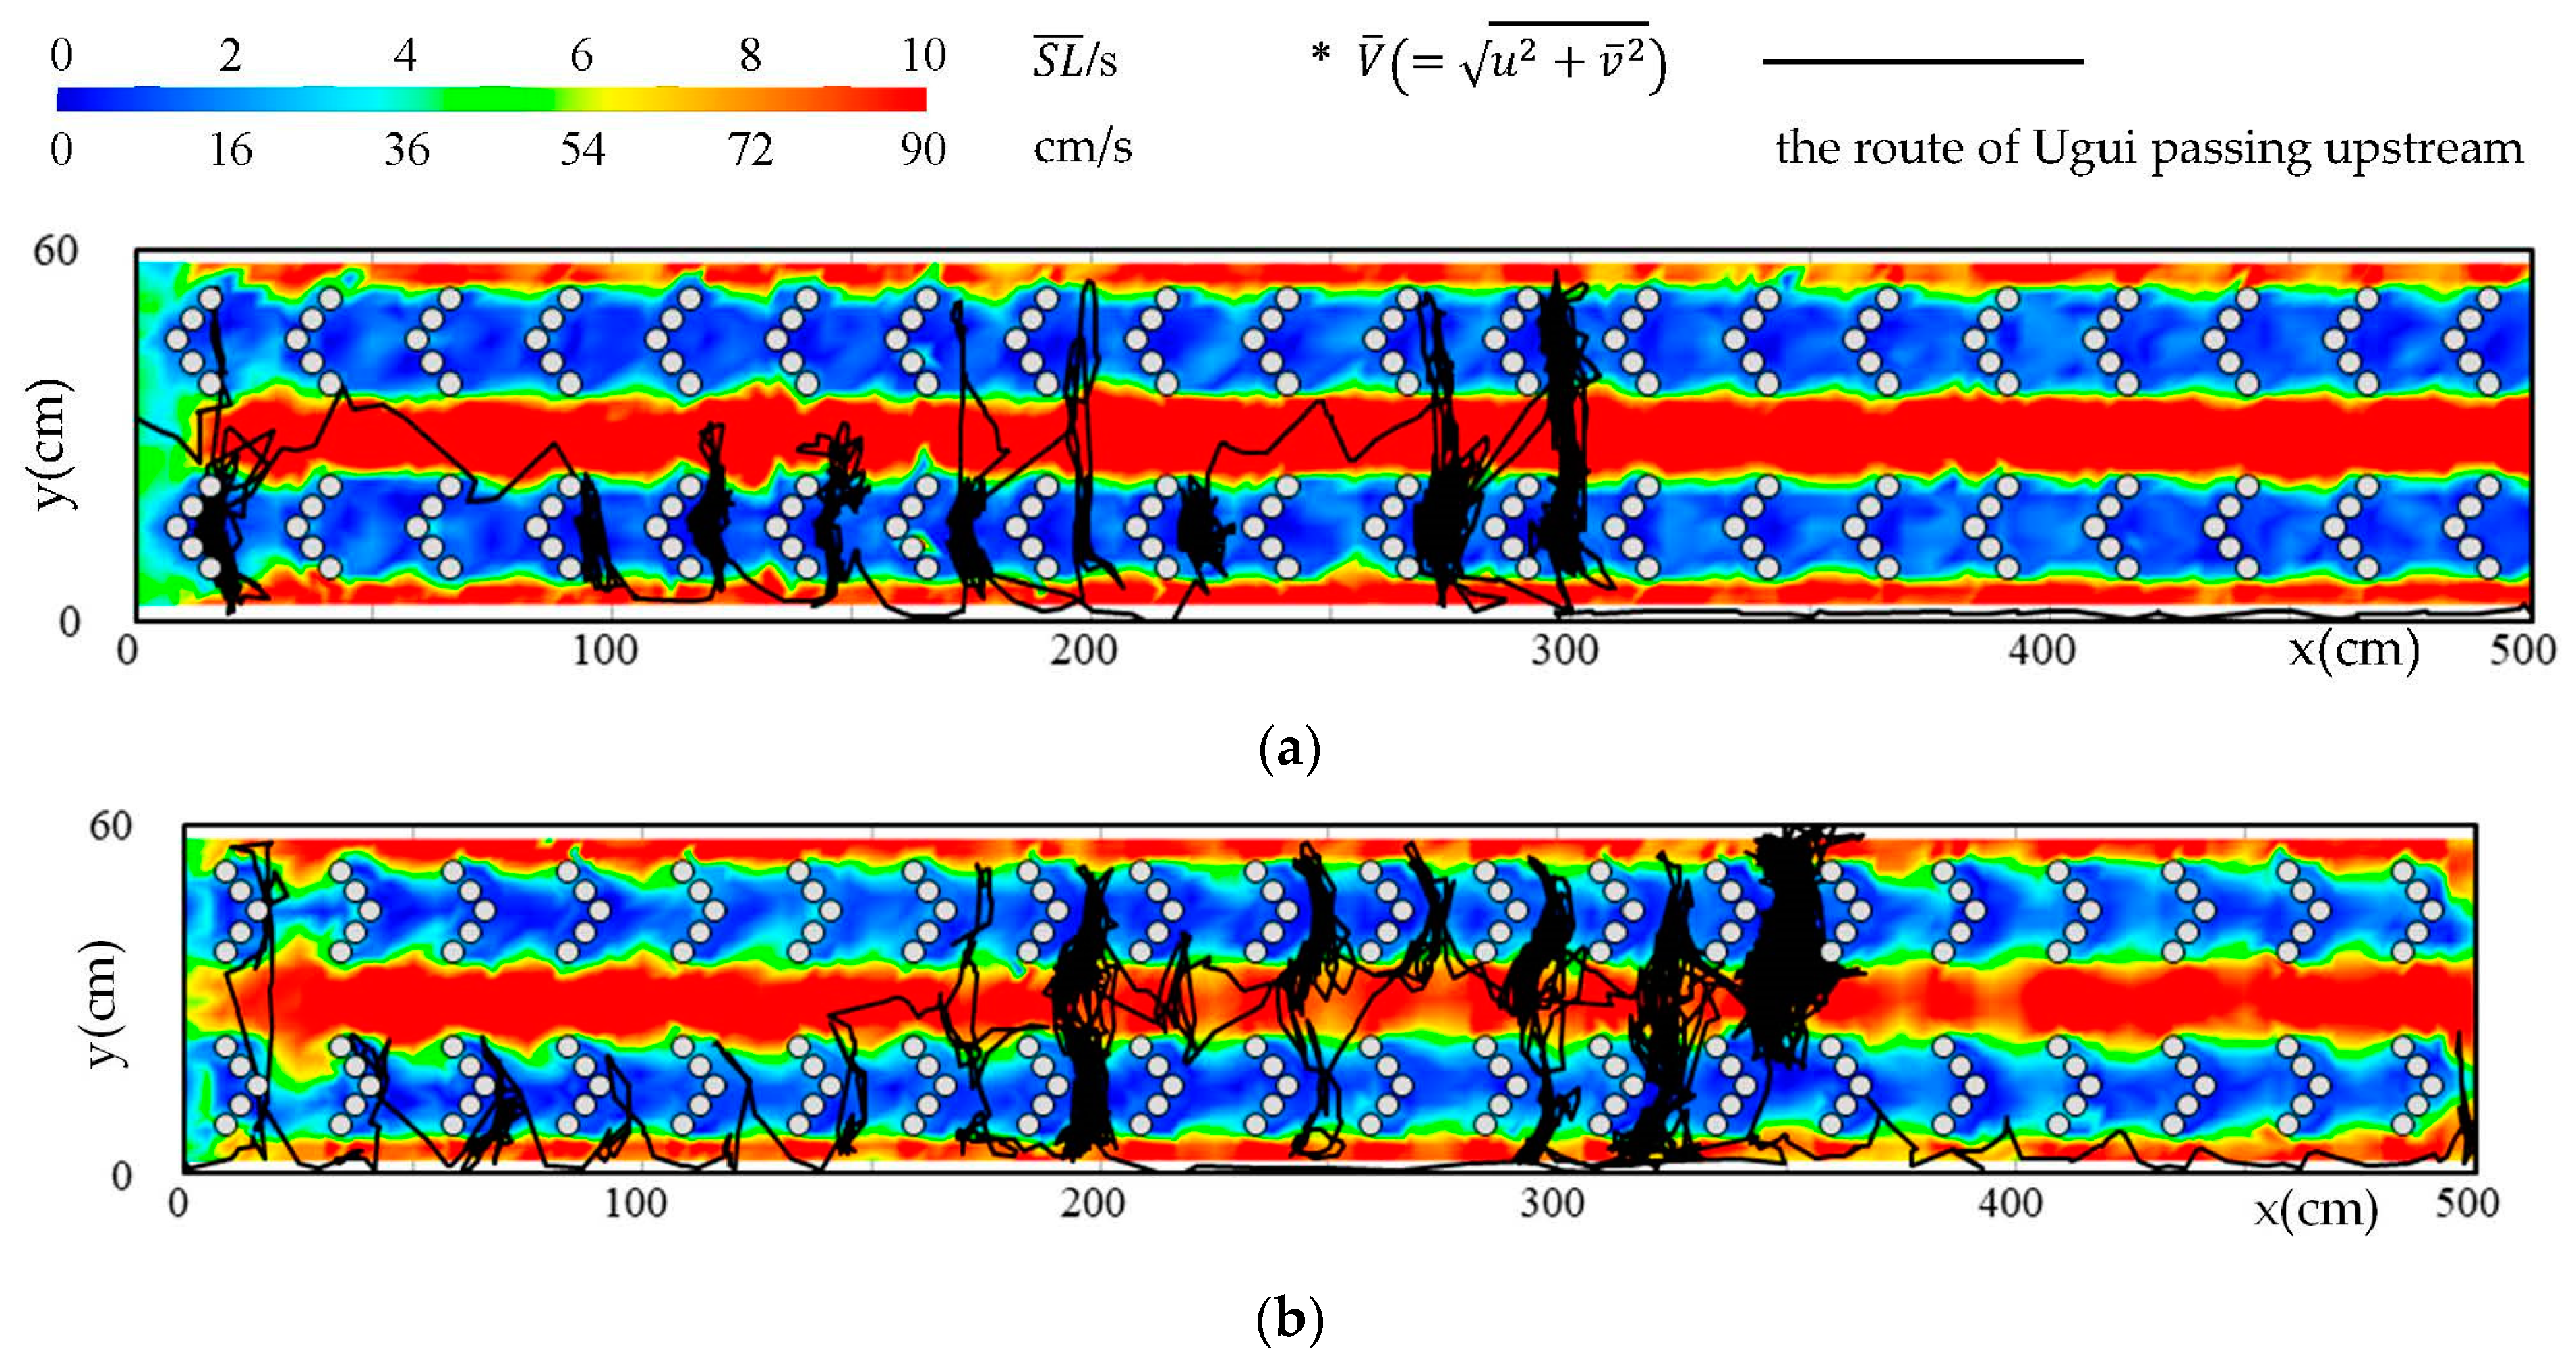
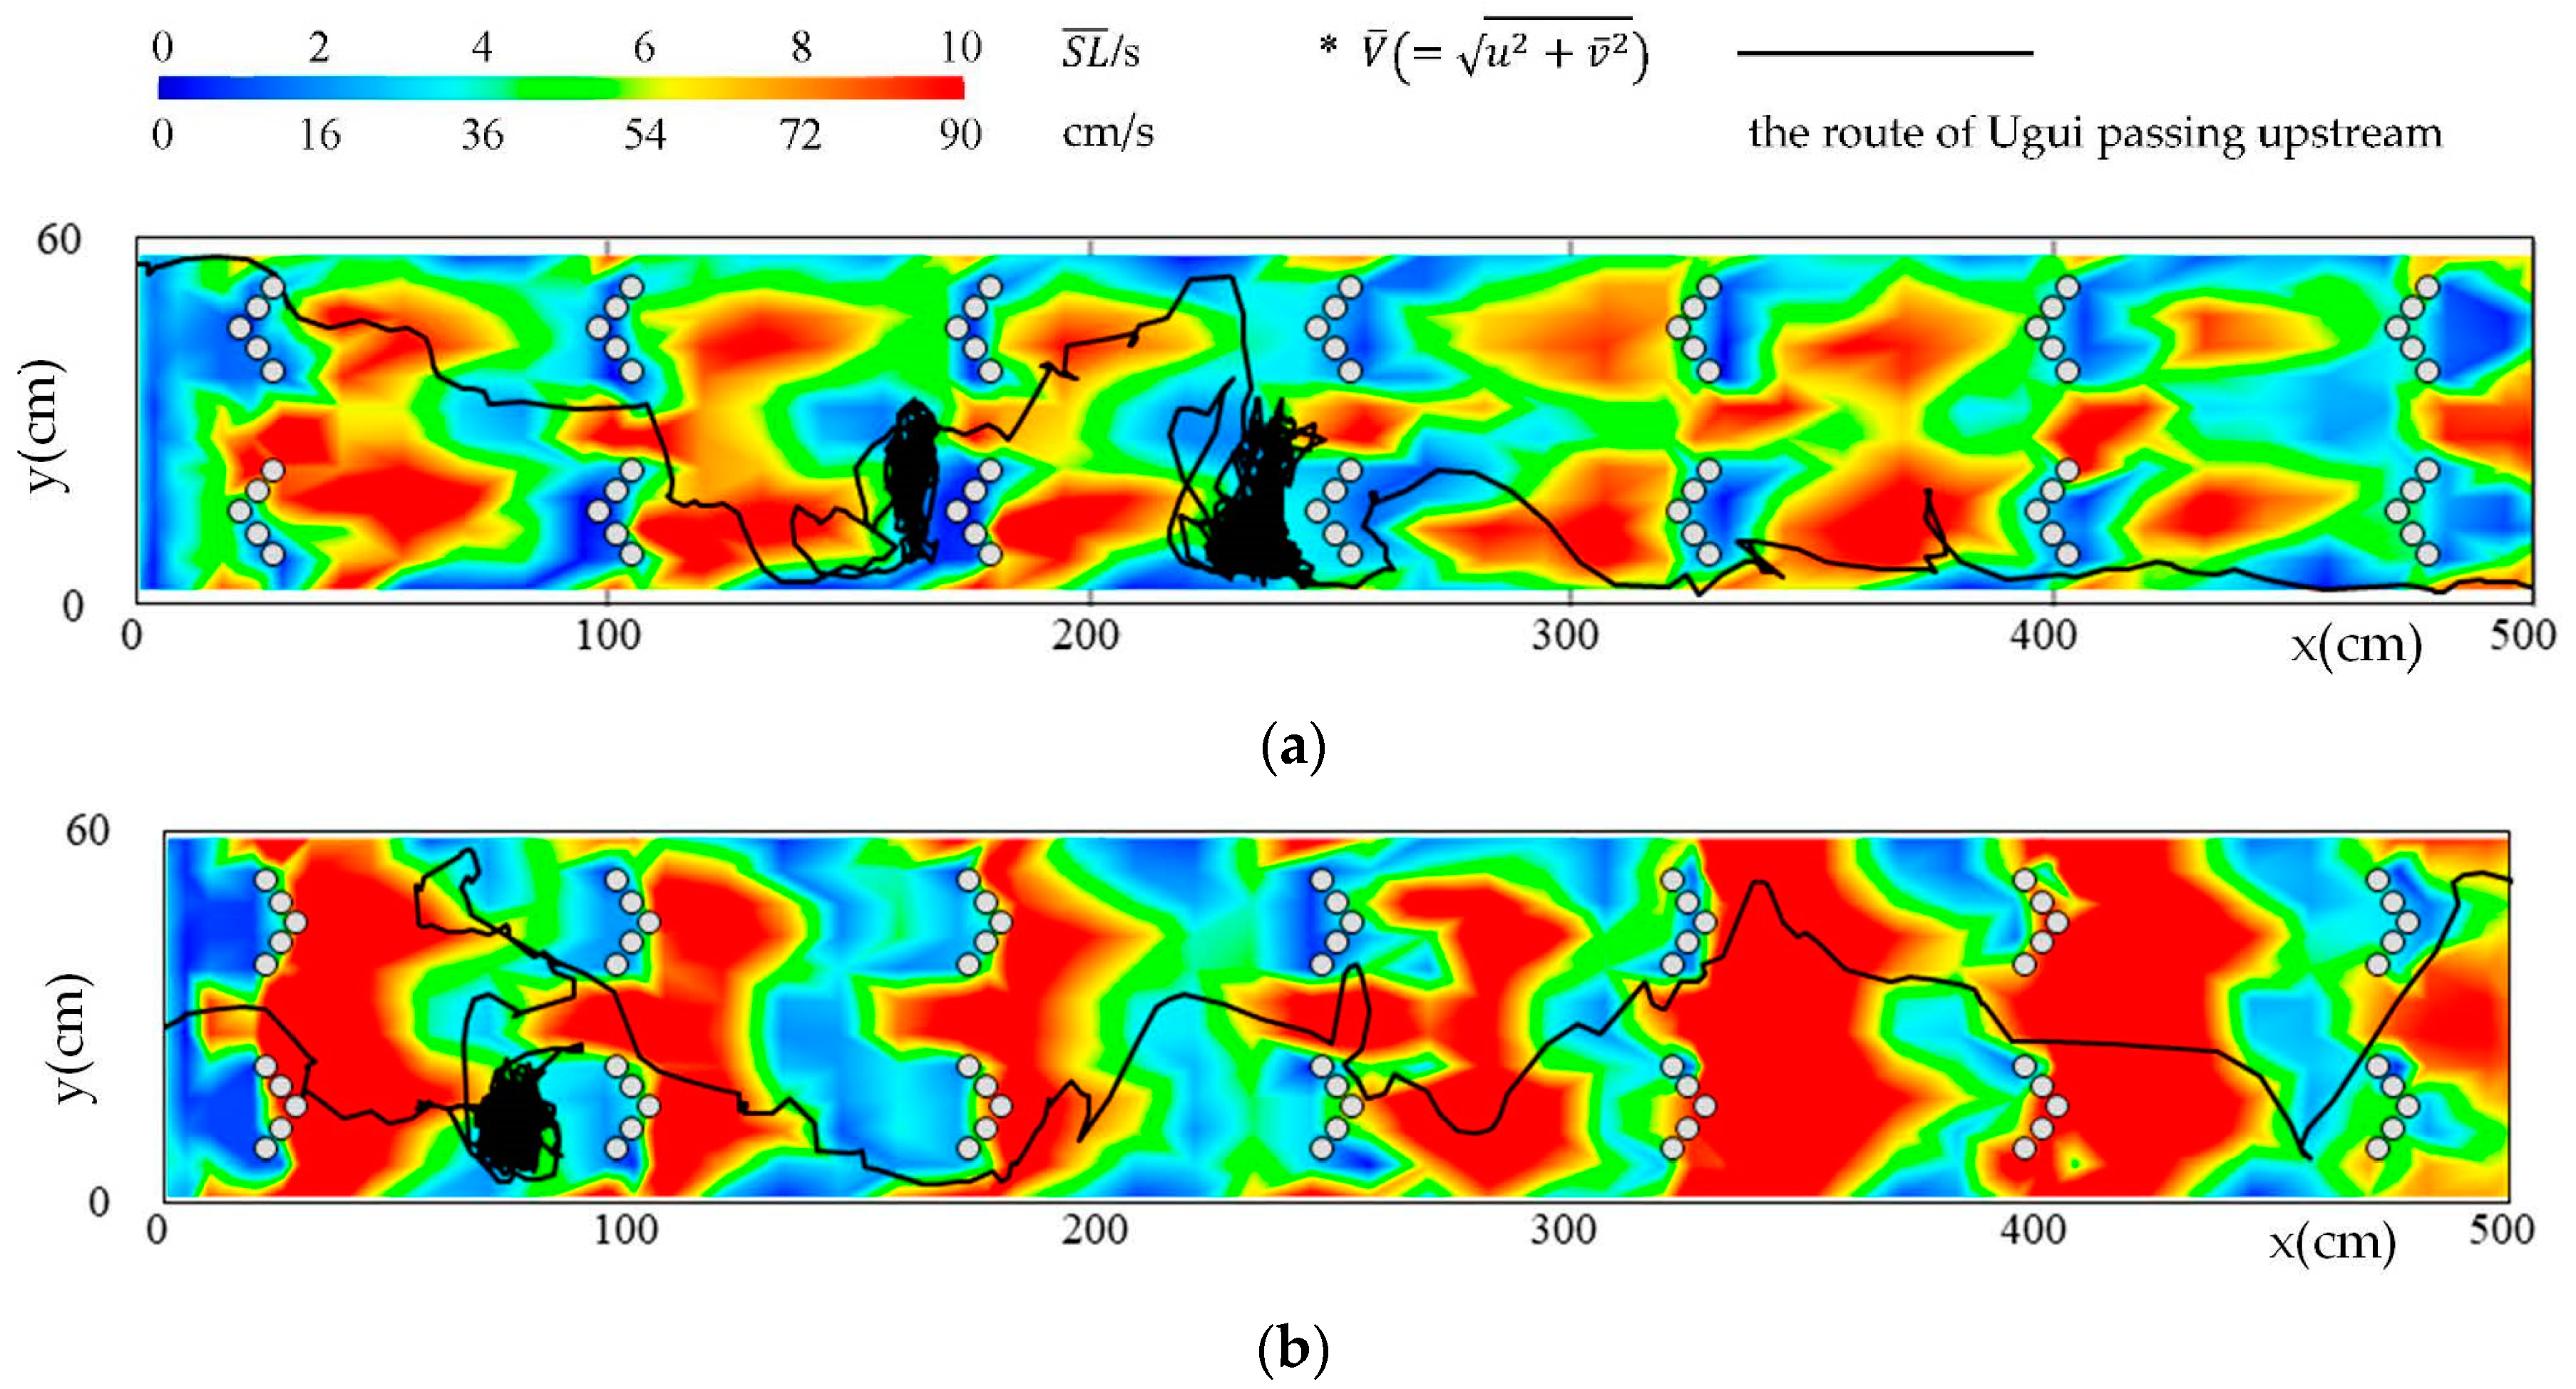
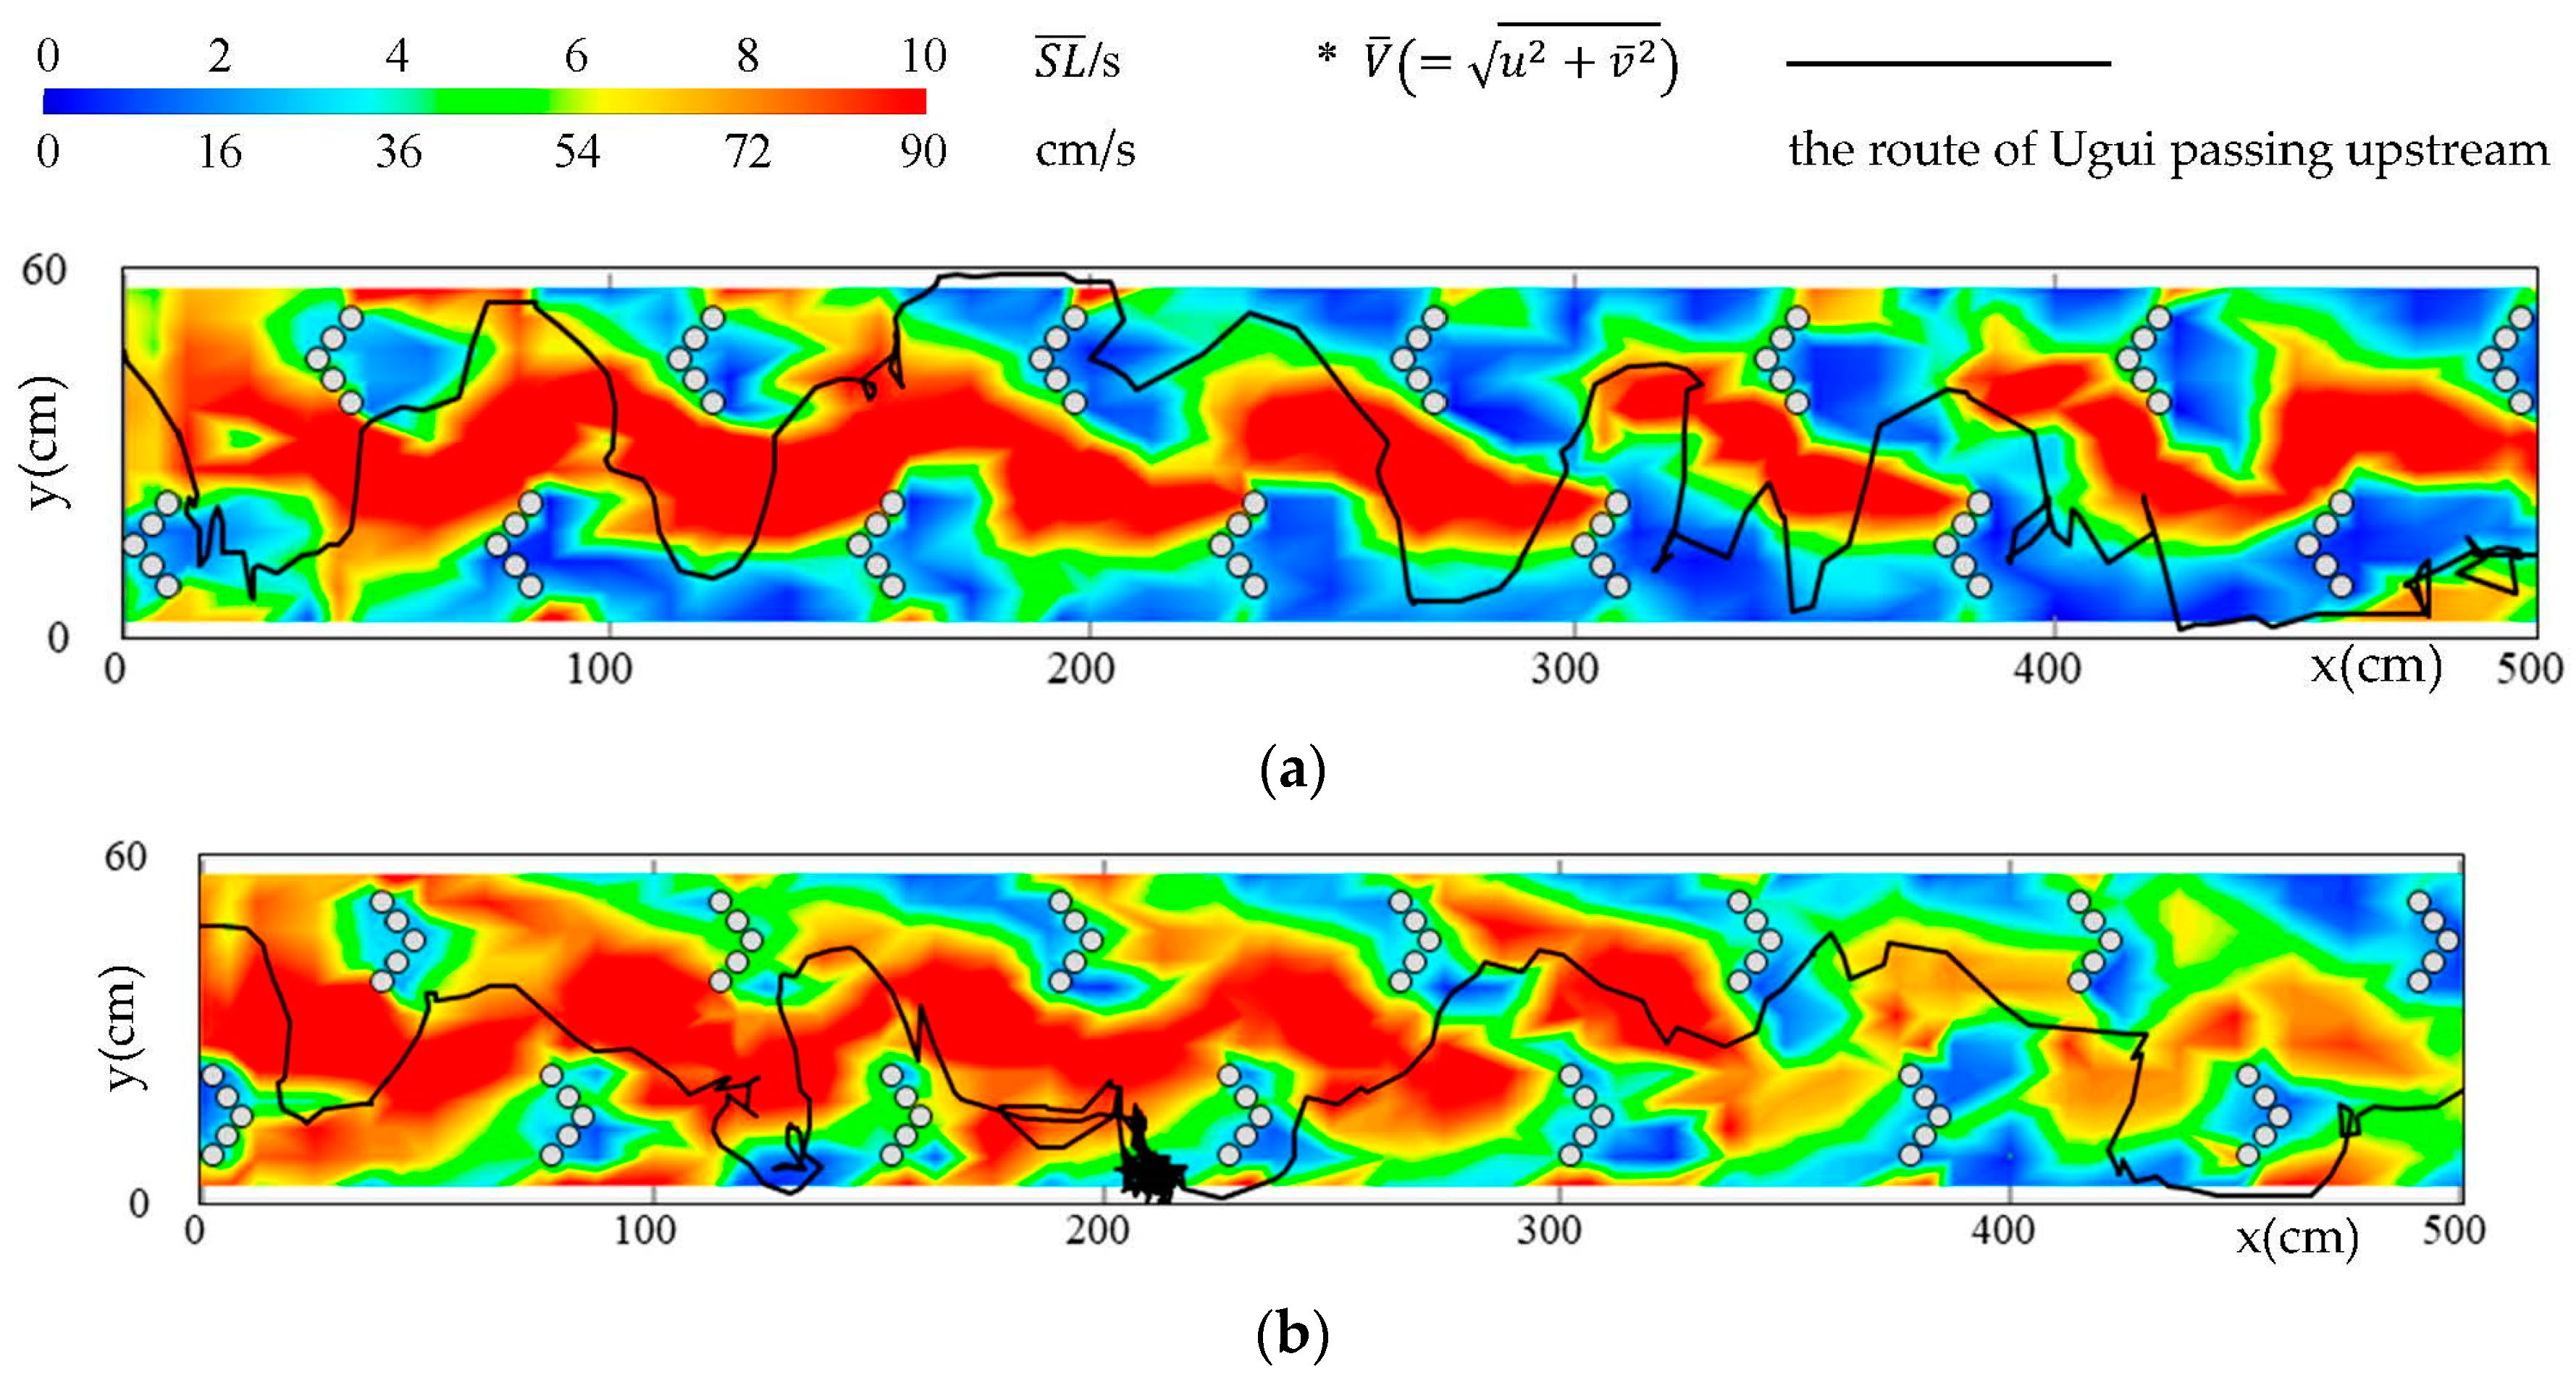
In this section, we discuss flow velocities in the fishway and the route of Ugui passing upstream in each case. Figure 8, Figure 9, Figure 10 and Figure 11 show flow velocity contour diagrams of the fishway and the route of Ugui passing upstream in each case of the previous study [4] and compared to this study. First, in Case 4, which is of the previous study [4], the flow velocity between the roughness groups was 2 /s or less. while it was approximately 2 to 6 /s in Case 5, and approximately 3 to 10 /s in Cases 6 and 7. In Cases 5–7, Ugui held a position in the area where the flow velocity was slow and moved upstream. It seems that the held position of Ugui changes depending on the roughness groups interval. At the 0.50 m spacing interval, Ugui were held position directly on the downstream side of the roughness group and directly on the upstream side of the roughness groups at the 0.75 m.
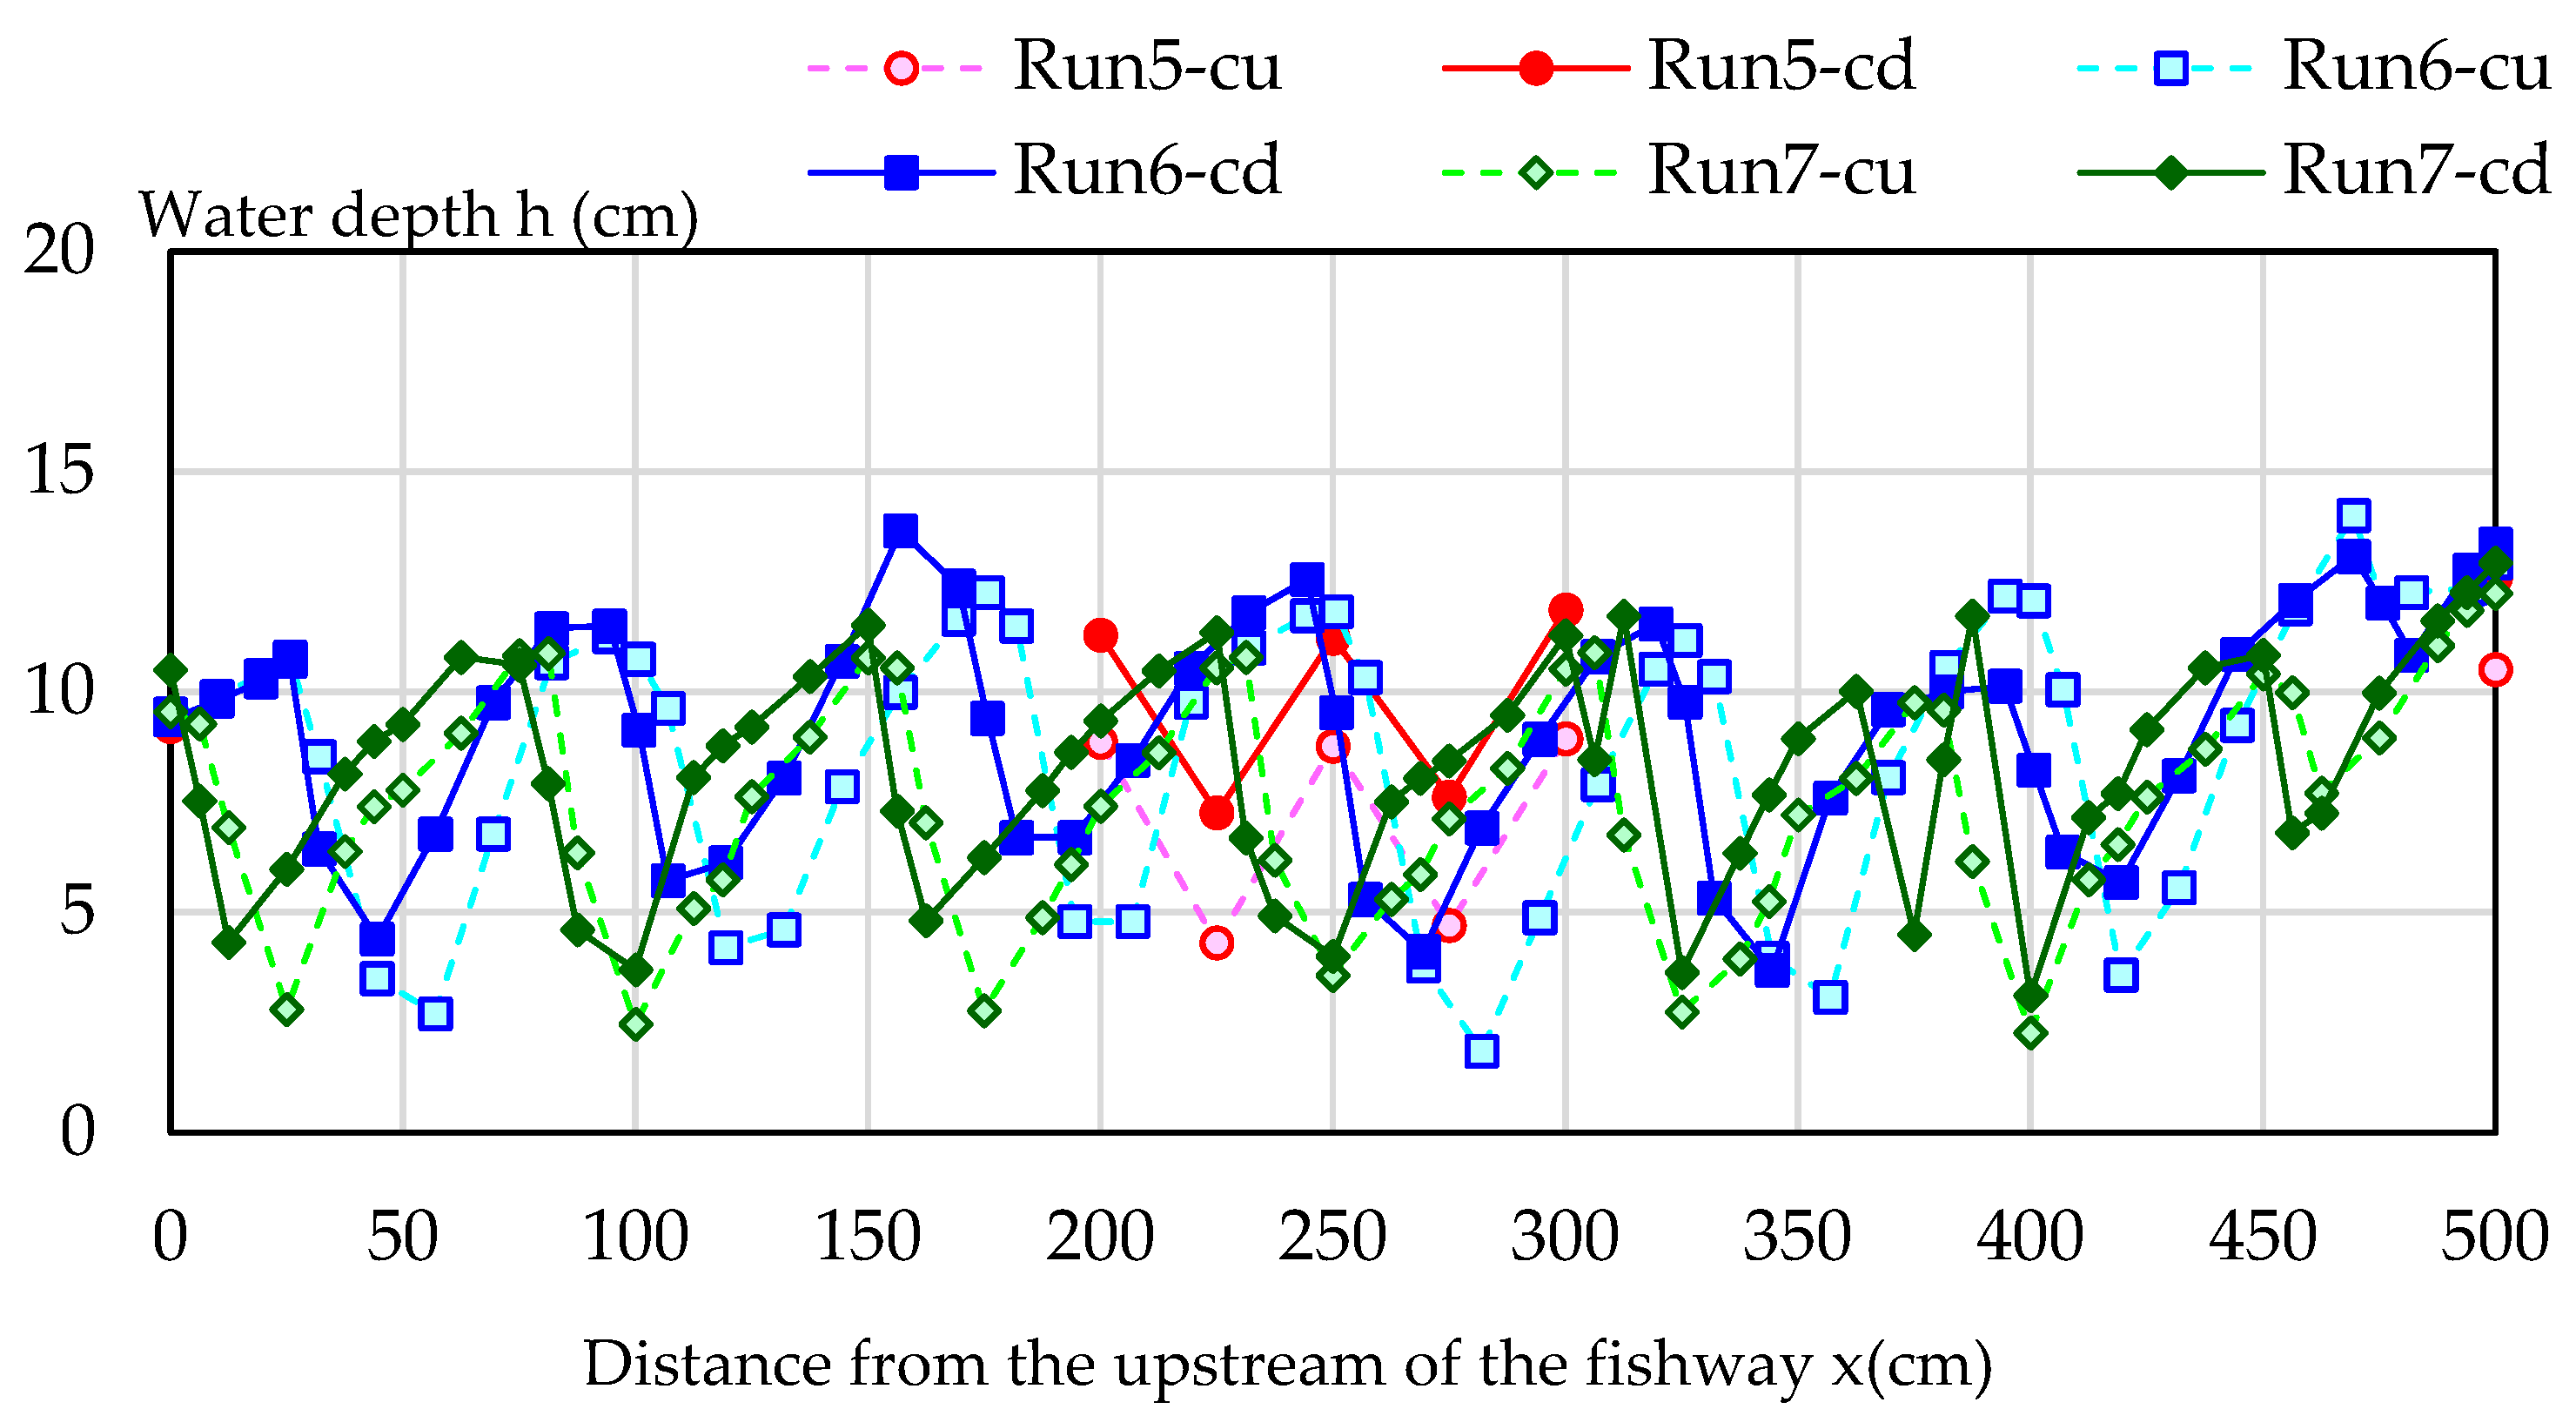
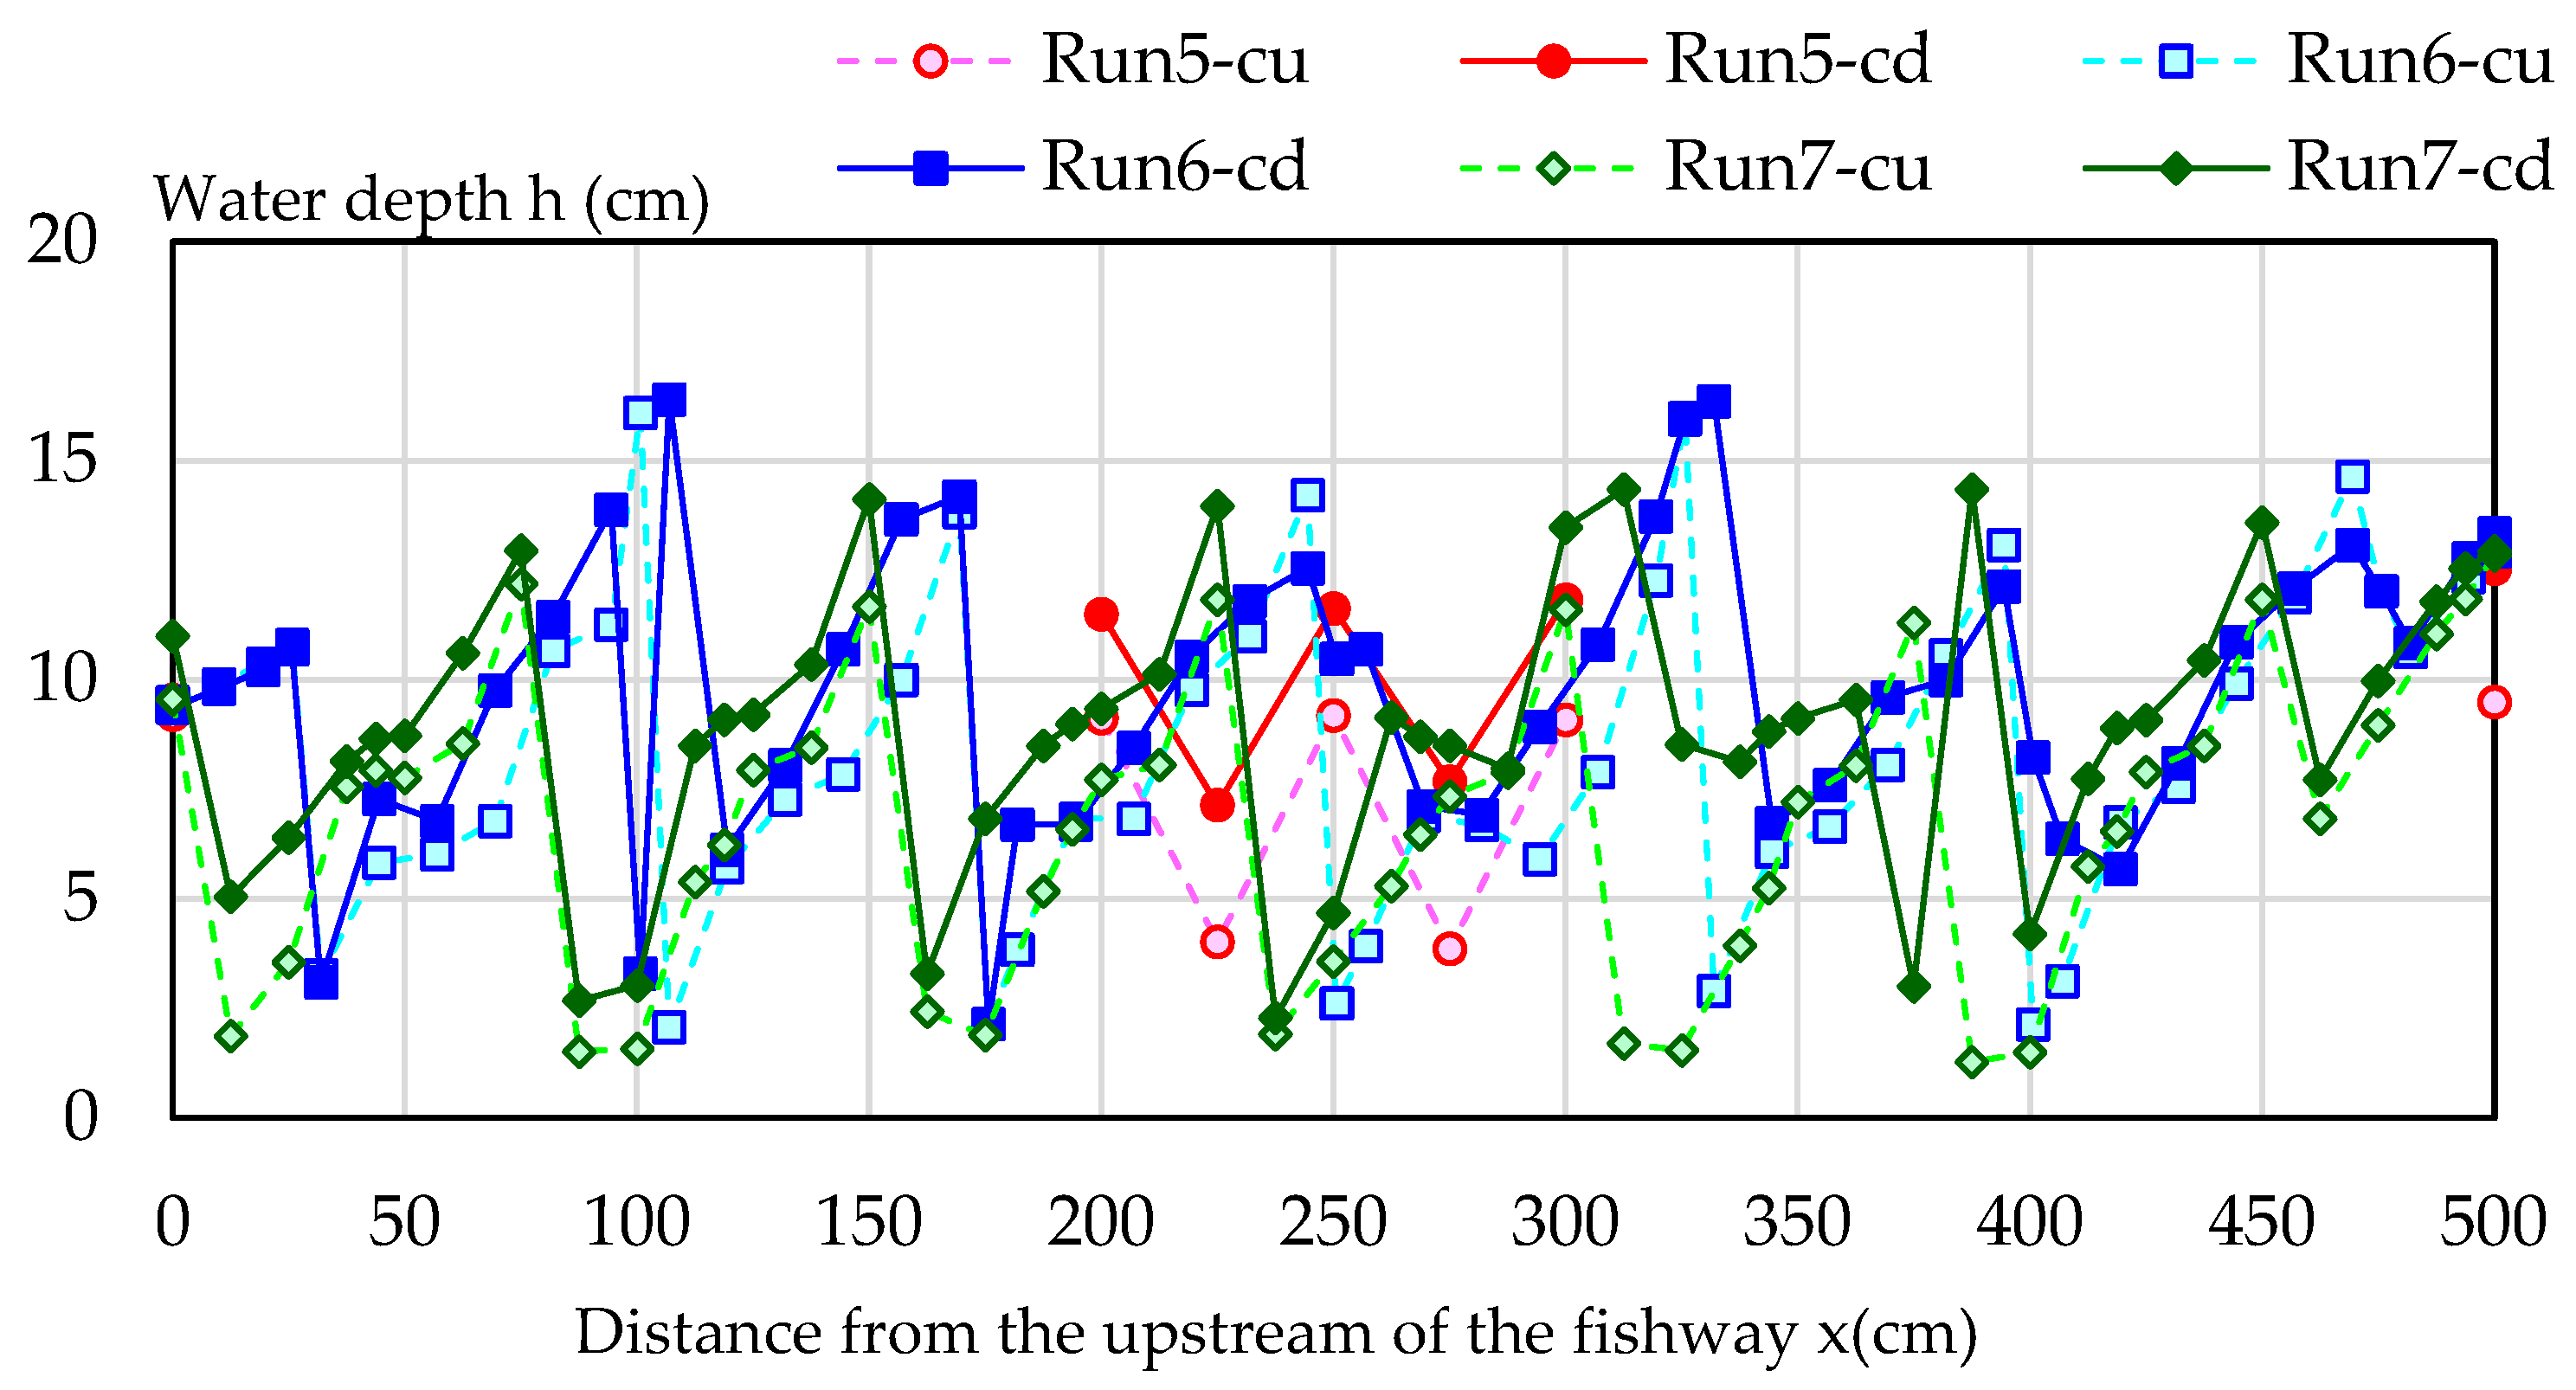
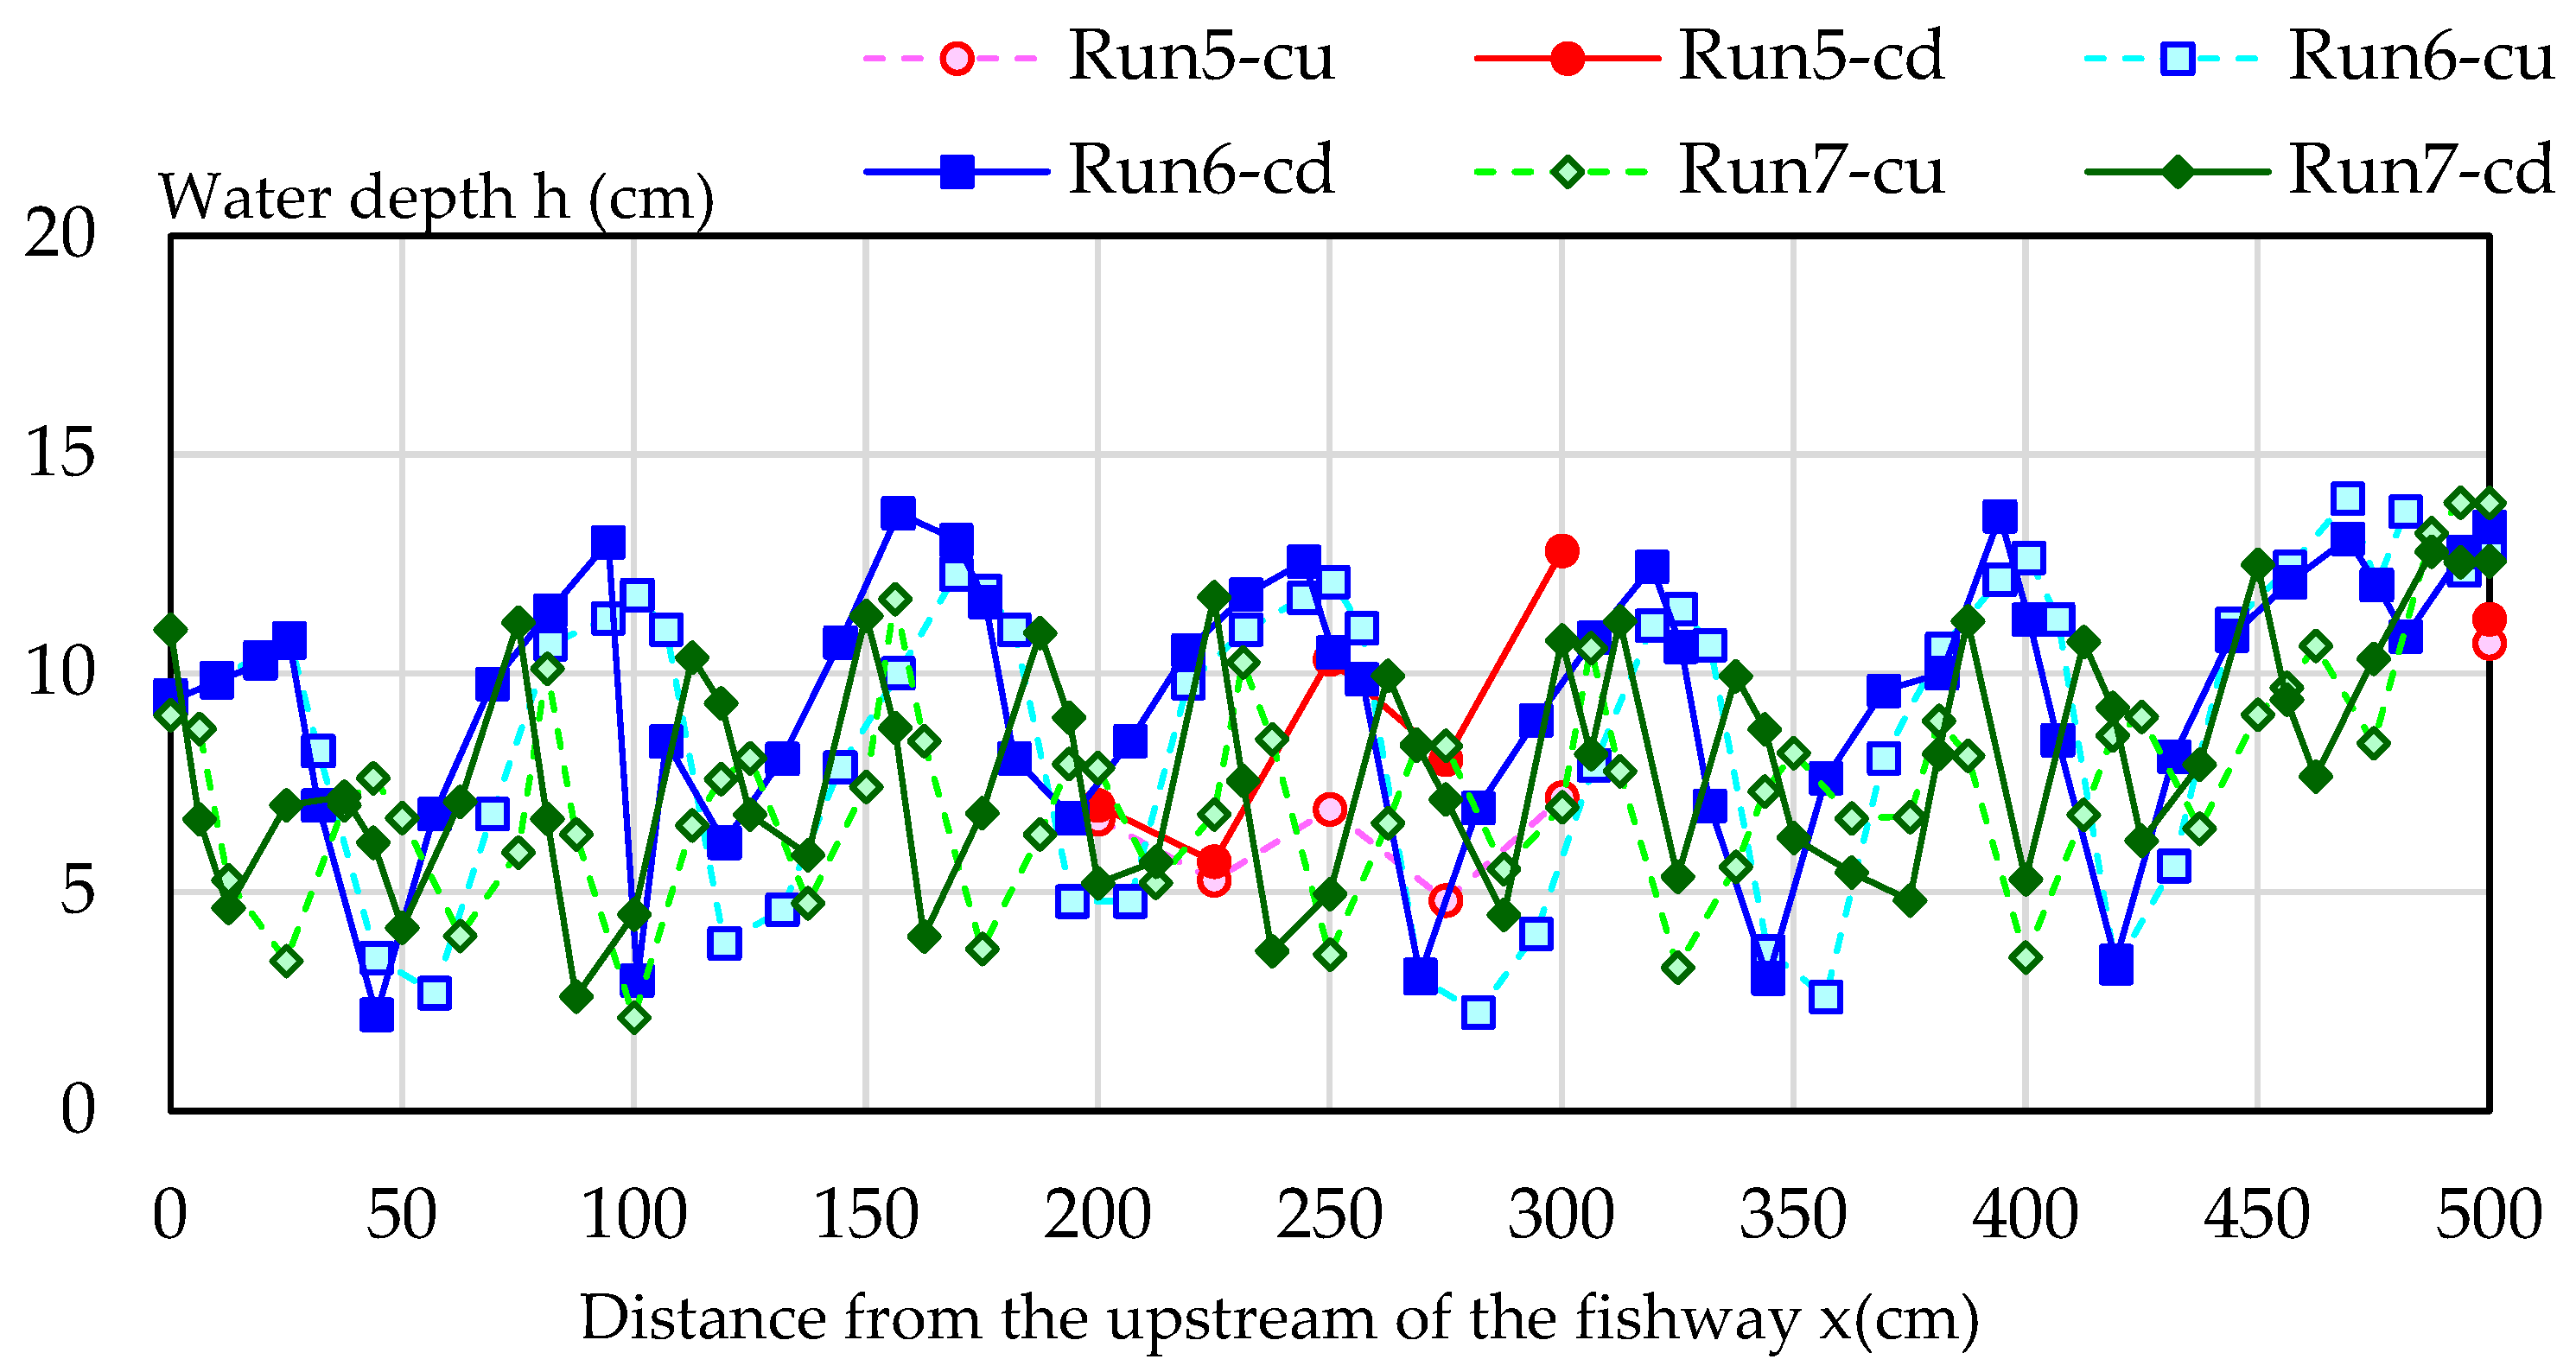
Here, we focused on water depth in the fishway. Figure 12, Figure 13 and Figure 14 show the water surface profile in the fishway in each case. In the areas that are directly upstream or directly downstream sides of the roughness, water depth was approximately 10 cm or more. Therefore, the flow velocity was reduced by the afflux effect, and Ugui was able to hold the position. In addition, although the water depth was low and the flow velocity was high in the lateral part and the central part of the fishway, which was the route of Ugui passing upstream, the formation area was limited narrow, which allowed Ugui to move upstream.
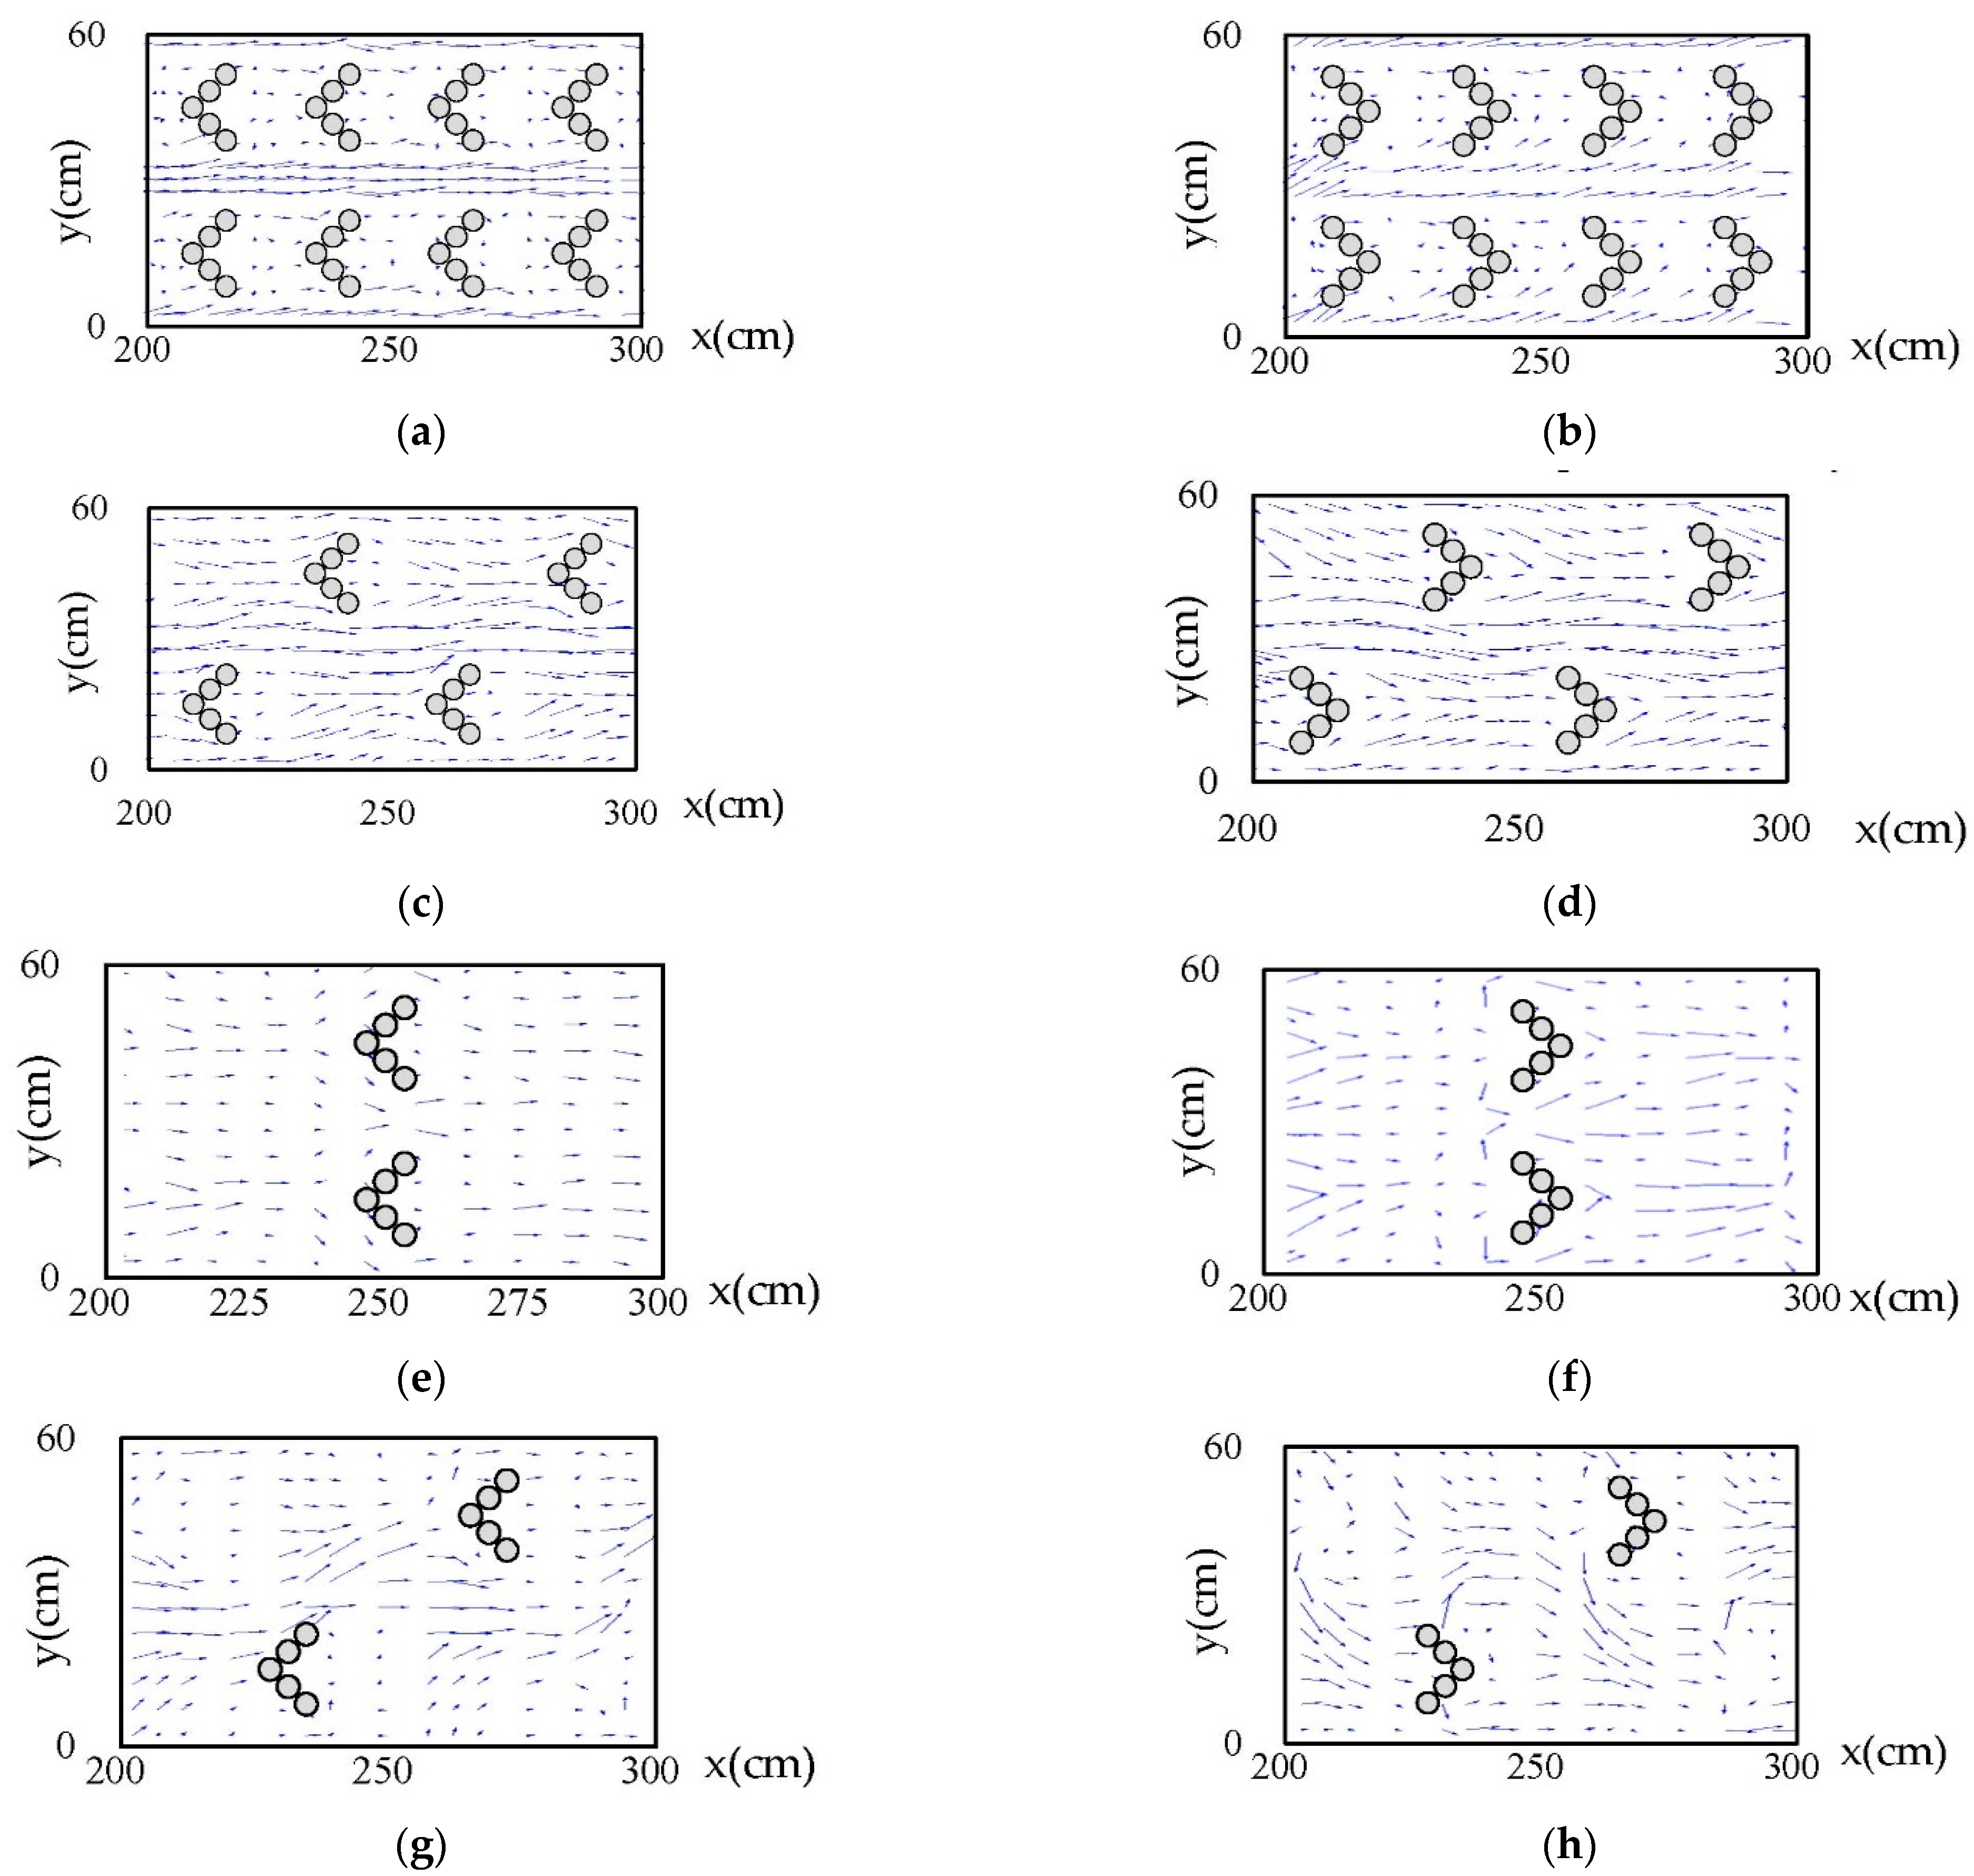
In addition, Figure 15 shows the flow velocities vector diagram in each case. Here, the authors picked up the midstream area of the fishway with x ranging between 200 and 300 cm where the flow was relatively stable. When the spacing of the roughness groups is narrow, the water flow was concentrated in the central part of the fishway. Therefore, it can be suggested that Ugui are more likely to move upstream in Cases 5–7 than in Case 4. Moreover, the flow in Case 6 where the roughness groups were installed in parallel was also similar to in Case 4. On the other hand, the flow in Cases 5 and 7 where the roughness groups were installed alternately formed a diverse flow. Therefore, it can be suggested that Ugui are ever more likely to move upstream in Cases 5 and 7 than in Case 6. Furthermore, focusing on the direction of the roughness group, the flow tended to be more concentrated and rapidly in Run4-cu, Run5-cu, Run6-cu, and Run7-cu than in Run4-cd, Run5-cd, Run6-cd, and Run7-cd. In addition, in Run4-cd, Run5-cd, Run6-cd, and Run7-cd tended to be easier for Ugui to move upstream than in Run4-cu, Run5-cu, Run6-cu, and Run7-cu. This is because water flows were easier streamed around behind the downstream of the roughness groups.
3.3. The Distance and Time of Fish Passing Upstream
In this section, we discuss the distance and time of Ugui passing upstream that successfully moved upstream in each case. The authors suppose hypothesized that a fishway with a short distance and time passing upstream is preferable in addition to the Rr. This is because the longer a fish holds its position in the fishway, the more likely it is that birds will prey on it. In addition, fish with longer holding times will deplete energy reserves compared to those that pass through quicker in the fishway. Therefore, we focus on whether Ugui was able to move upstream efficiently.
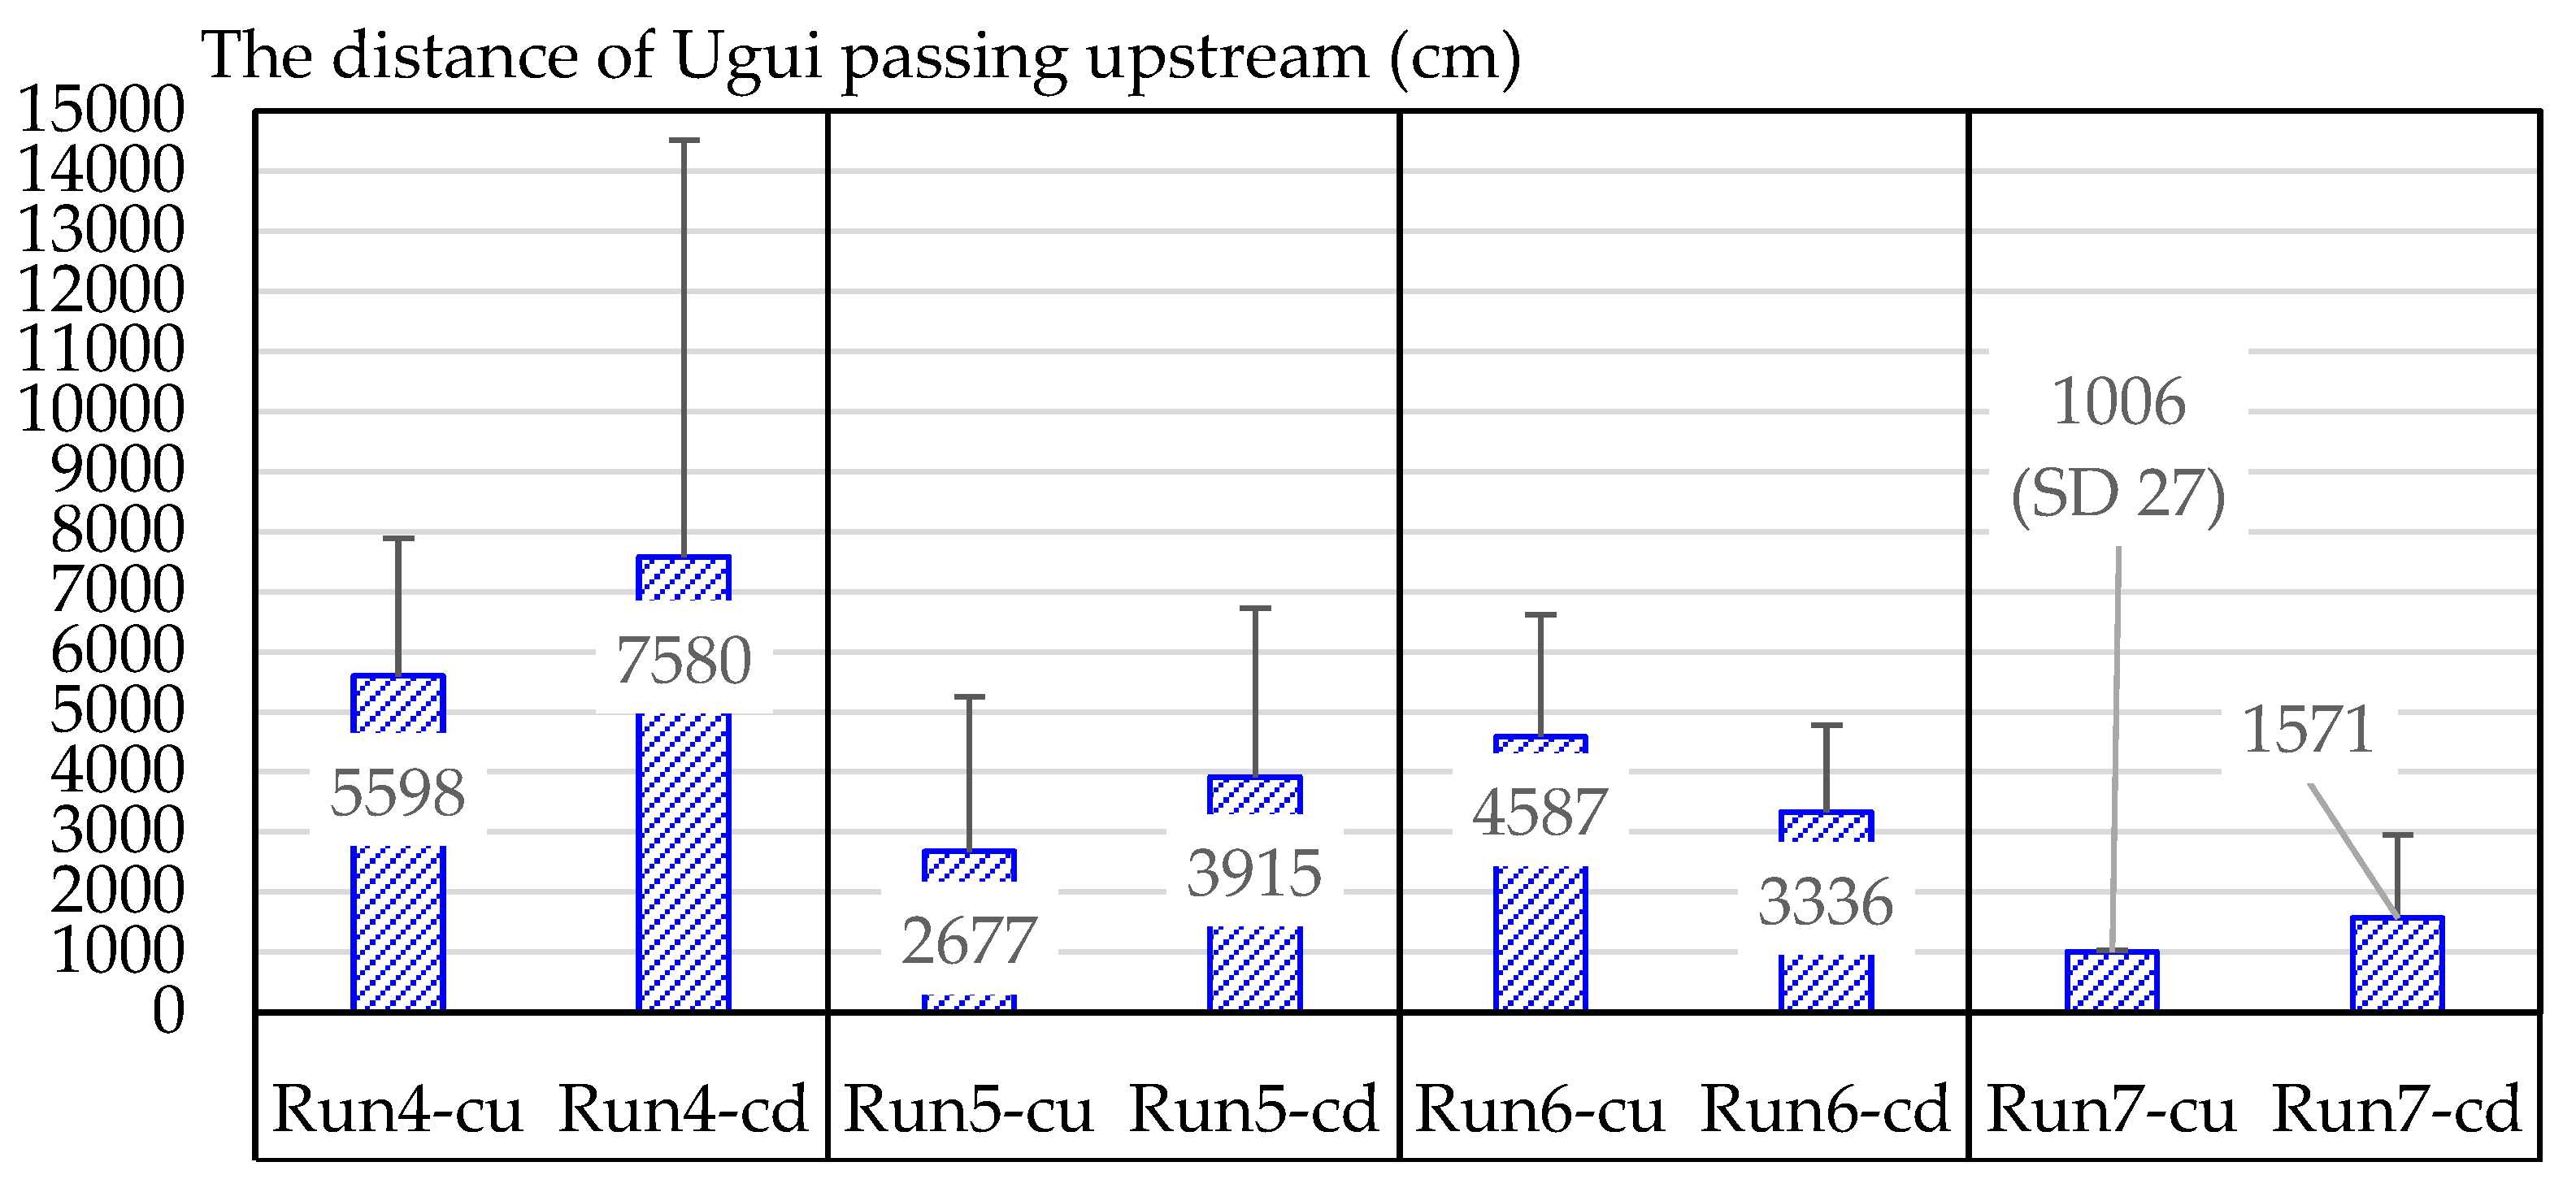
Figure 16 shows the average distance of Ugui passing upstream that successfully moved upstream in each case. The distance of Ugui passing upstream tended to decrease with wider installation intervals of the roughness groups. Furthermore, regardless of the installation distance of the roughness groups, the distance of Ugui passing upstream of Case 7 in which the roughness groups were installed alternately was shorter than that of Case 6 in which the roughness groups were installed in parallel. This is because more diverse flows were formed by installing the roughness groups alternately. Therefore, the installation of the roughness groups should be using an alternate pattern.
On the other hand, the effect of the direction of the convex surface of the roughness groups on the move upstream distance of Ugui has not yet been determined. However, the distance changed only by approximately 1.3 to 1.5 times, which implies that the direction of the convex surface of the roughness groups does not significantly affect the behavior of Ugui passing upstream.
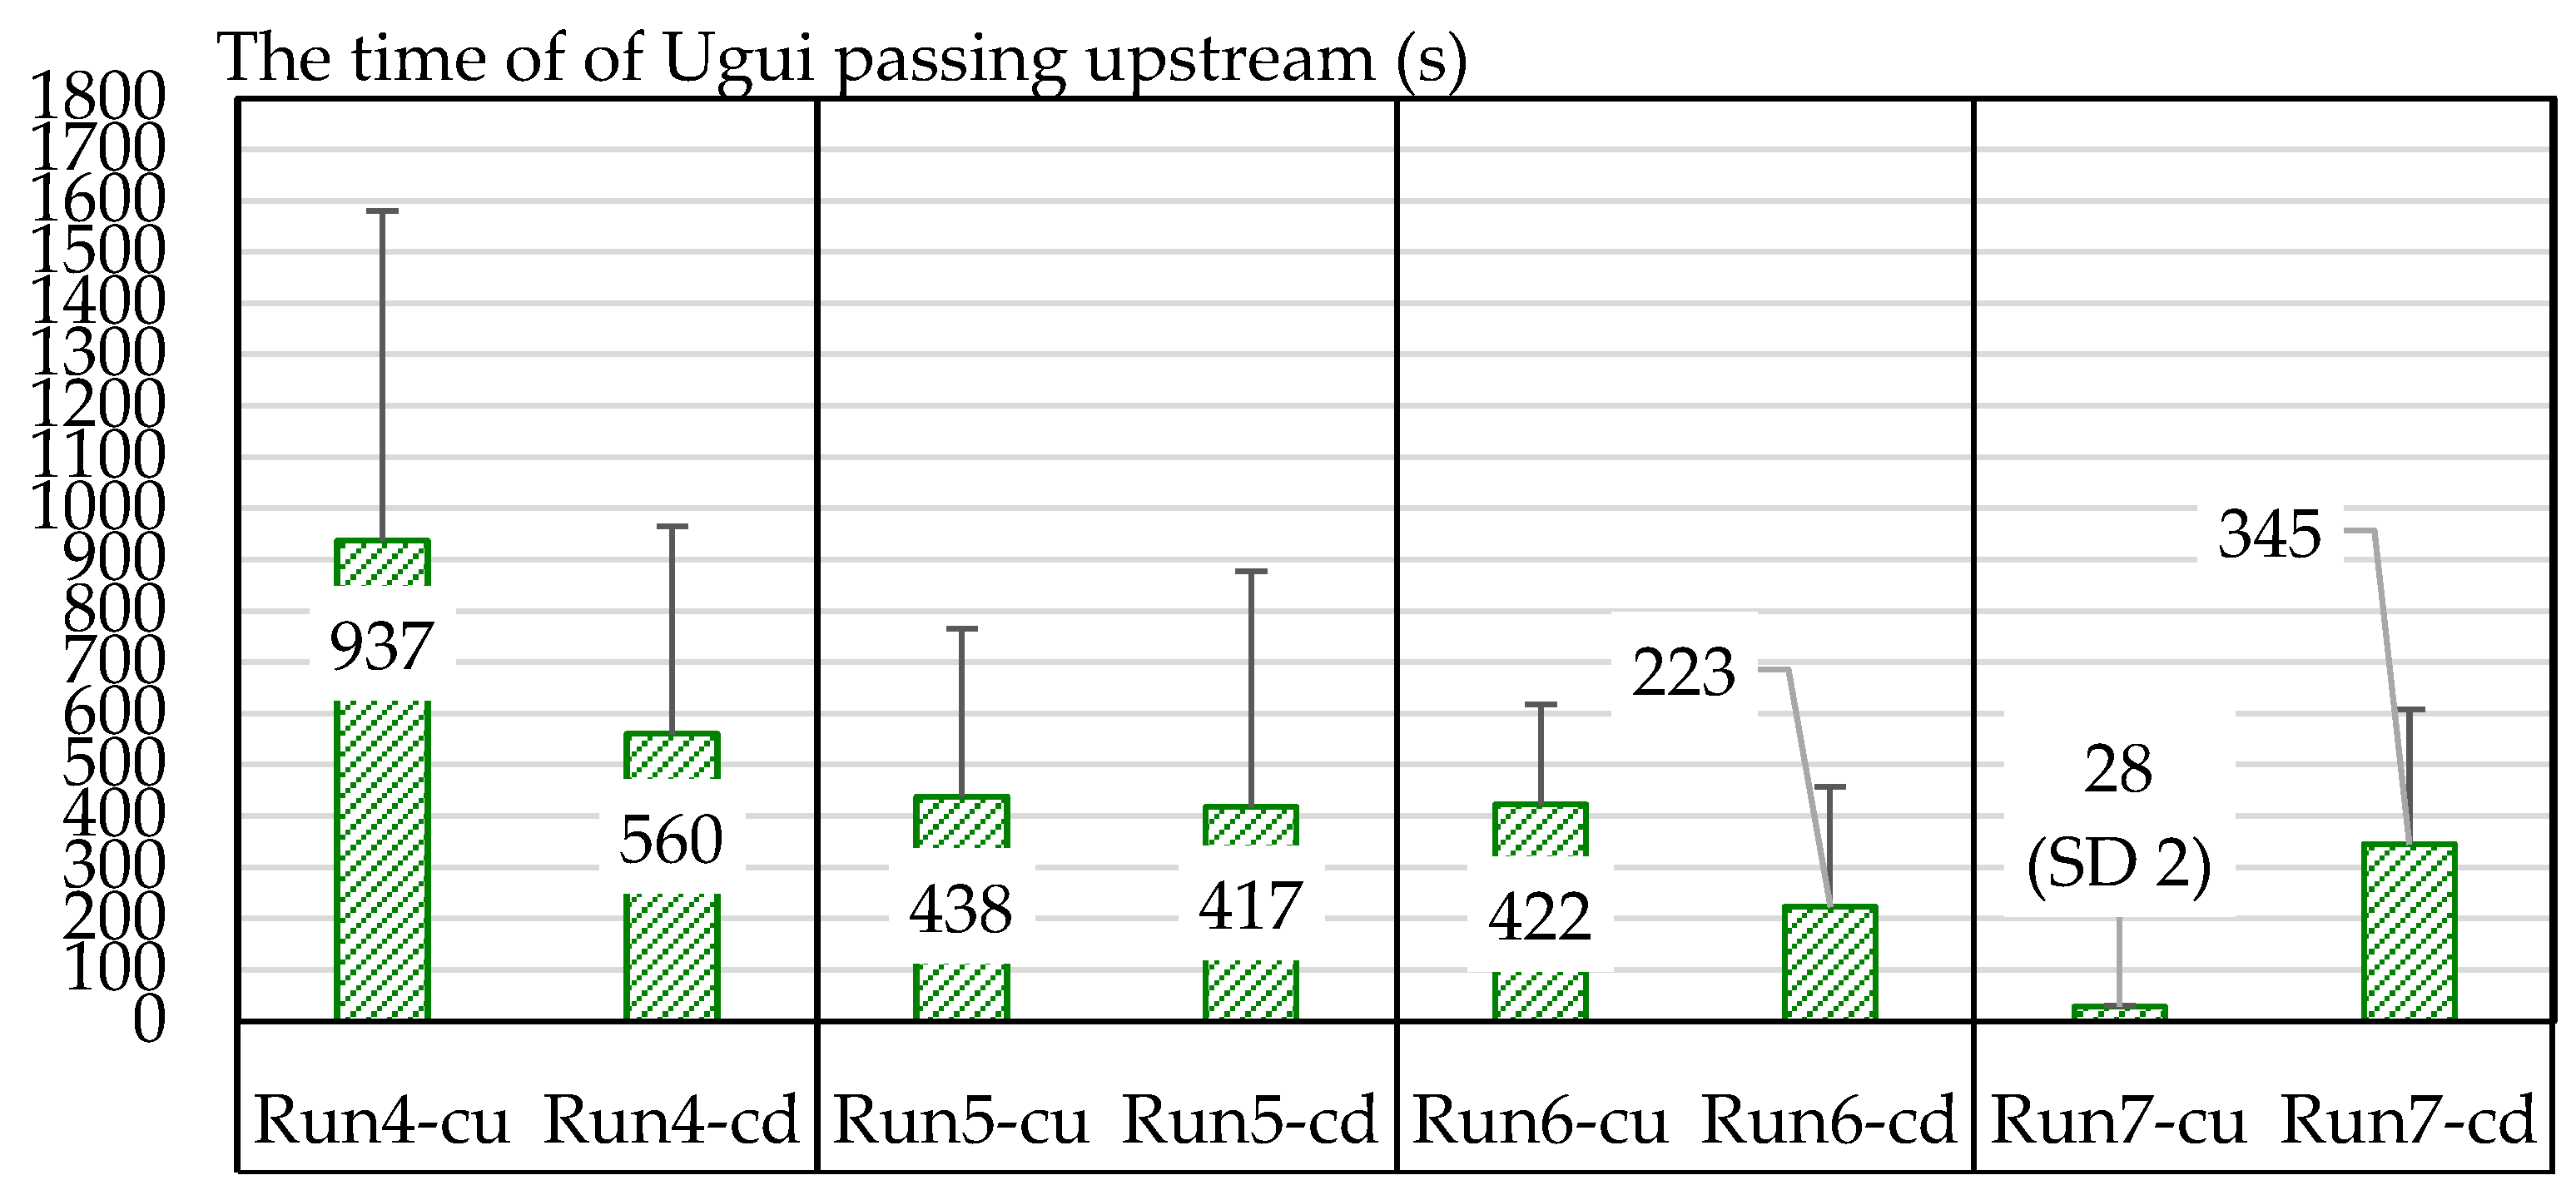
Figure 17 shows the average time of Ugui passing upstream that successfully moved upstream in each case. The time of Ugui passing upstream tended to decrease with wider installation intervals of the roughness groups. In addition, in the cases where the convex end represents the tip of the arrowhead the time of Ugui passing upstream tended to be shorter than that in the cases where the convex side is the inside of the arrowhead. This is because the former so that the flow was directed toward the held position of Ugui more easily than the latter, making it easy for Ugui to recognize the upstream side. Phenomena similar to those seen in this result were observed in the previous study [4]. In Run7-cu in this experiment, the behavior of Ugui was outlandish, and therefore it is considered a reference here. Repeating the experiment in Case 7 and collecting more data enables us to expect that the tendency is similar to that in Cases 4–6.
From the above, it has been confirmed that Ugui moves upstream more efficiently in the cases where the convex end represents the tip of the arrowhead than in the cases where the convex side is the inside of the arrowhead. The authors believe that it might be similar to other fish species. In addition, even in the case that the installation interval of the roughness groups on the fishway used in this experiment was 0.75 m, the function of the fishway did not deteriorate, suggesting that no problems are caused even in the case that the area ratio of roughness to the fishway area is relatively small. On the other hand, in the case that the installation distance of roughness is extended beyond the conditions shown in this study, the afflux effect of the roughness groups may decrease. Therefore, it is necessary to reconfirm the possibility in the experiment, and design optimum conditions for specific situations based on the knowledge obtained from this experiment. Moreover, we will attempt to set up the fishway in the field. In addition, we will continue the experimental conditions by installing the experimental fishway in a natural setting and observing wild fish passages.
4. Conclusions
In this study, it has been reconfirmed that turning the convex end representing the tip of the arrowhead allowed Ugui to easily to moved upstream. In this experimental fishway, the fishway function did not deteriorate even in the case that the installation distance of the roughness groups was 0.75 m. Therefore, no problems are caused even in the case that the area ratio of roughness to the fishway area is relatively small. In the case that the installation distance of roughness is extended beyond the conditions of this experiment, the blocking effect of the roughness groups may decrease. In the future, the authors will design optimum conditions for the situation and set up a fishway on-site based on the knowledge obtained in this experiment.
In addition, the authors consider the following future issues. We should repeat the experiment of real fish behavior to accumulate more verification experimental results and also indicate the statistical analysis results.
Author Contributions
Conceptualization, M.A. and M.N.; methodology, M.A.; formal analysis, M.N., T.F. and T.S.; data curation, T.F. and T.S.; writing—original draft preparation, M.A. and M.N.; writing—review and editing, M.A.; visualization, T.F. and T.S.; supervision, M.A.; project administration, M.A.; funding acquisition, M.A. All authors have read and agreed to the published version of the manuscript.
Funding
This study was supported by JSPS KAKENHI Grant Number JP21K04280.
Informed Consent Statement
Not applicable.
Data Availability Statement
Not applicable.
Acknowledgments
We thank Syota Sueyoshi and Riki Nakamura for assistance with the experiments.
Conflicts of Interest
The authors declare no conflict of interest.
References
- Chris, K. Introduction to Fishway Design. Working Document, Freshwater Institute, Central and Arctic Region, Department of Fisheries and Oceans, Canada. 1992. Available online: https://www.researchgate.net/publication/267095265_INTRODUCTION_TO_FISHWAY_DESIGN (accessed on 17 May 2022).
- The Guideline for Environmental Works of Rivers for Fish to Move Upstream. Available online: https://www.mlit.go.jp/river/shishin_guideline/kankyo/kankyou/sakana_tebiki/pdf/print.pdf (accessed on 5 January 2022).
- Kawada, T.; Sakanoi, K.; Shioi, N.; Emi, S.; Tsuzuki, T. Report on the Survey on the Existing Fish Channels Status in the Rivers Managed by the Government. Rep. Riverfront Jpn. Res. Inst. 2016, 27, 66–71. [Google Scholar]
- Aoki, M.; Sato, T.; Funakoshi, T.; Nitta, M. On the scheme of roughness arrangement in the steep stream-type fishway based on the swimming behavior of Tribolodon hakonensis. J. JSCE Ser. G (Environ. Res.) 2022, 78, 61–70. [Google Scholar] [CrossRef]
- Namihira, A.; Goto, M.; Kobayashi, H. Flow and upstream migrating behavior of Leuciscus hakonensis at each pool of pool-and-weir fishway accompanying discharge change. Annu. J. Hydraul. Eng. 2007, 51, 1291–1296. [Google Scholar] [CrossRef]
- Takashima, N.; Nakamura, S. Experimental study on the behavior of Ayu in fishladder. Annu. J. Hydraul. Eng. 1984, 28, 353–358. [Google Scholar]
- Miyazono, M.; Tomatsu, O. Arrangement of protruding boulders in a slanted fishway. JSECE J. 2003, 56, 3–12. [Google Scholar]
- Onitsuka, K.; Akiyama, J.; Kiuchi, D.; Takahashi, Y.; Iiguni, Y. Effect of location of notch on migration rate in pool-and-weir fishway. Annu. J. Hydraul. Eng. 2007, 51, 1279–1284. [Google Scholar] [CrossRef]
- Matsuki, K.; Aoki, M.; Kikuchi, Y.; Fukui, Y. The improvement of the function of the full cross section fish way with rubbles and the repear. J. JSCE Ser. B1 (Hydraul. Eng.) 2015, 71, I_1105–I_1110. [Google Scholar] [CrossRef]
- Matsuki, K.; Aoki, M.; Fukui, Y.; Sakurai, R. On the flow of a rocky ramp fishway transverse slope and fish behavior to it. J. JSCE Ser. G (Environ. Res.) 2016, 72, III_411–III_417. [Google Scholar] [CrossRef]
- Aoki, M.; Funakoshi, T.; Yoshida, S. Swimming behavior of Tribolodon hakonensis in a rocky ramp fishway with transverse slope that changed roughness height. J. JSCE Ser. B1 (Hydraul. Eng.) 2018, 74, I_397–I_402. [Google Scholar] [CrossRef]
- Aoki, M.; Funakoshi, T. Flow in the stream type fishway with different rocky ramp arrangement and swimming behavior of Tribolodon hakonensis. J. JSCE Ser. G (Environ. Res.) 2018, 74, III_485–III_491. [Google Scholar] [CrossRef]
Figure 1.
An example of a fishway with a longitudinal gradient greater than 1/20.

Figure 2.
Examples of the places where the continuity of the upstream movement of fish is interrupted by the head: (a) The head of a waterway that interrupts the upstream movement of fishes; (b) The head construction of a small size river that interrupts the upstream movement of fishes.
Figure 2.
Examples of the places where the continuity of the upstream movement of fish is interrupted by the head: (a) The head of a waterway that interrupts the upstream movement of fishes; (b) The head construction of a small size river that interrupts the upstream movement of fishes.

Figure 3.
The fishway used in the experiment: (a) Longitudinal photo of the fishway; (b) The cross section plan of the fishway.
Figure 3.
The fishway used in the experiment: (a) Longitudinal photo of the fishway; (b) The cross section plan of the fishway.

Figure 4.
Arrangement of roughness groups in each case of the previous study [4]: (a) Run4-cu in Case 4; (b) Run4-cd in Case 4.
Figure 4.
Arrangement of roughness groups in each case of the previous study [4]: (a) Run4-cu in Case 4; (b) Run4-cd in Case 4.

Figure 5.
Arrangement of roughness groups in each case of this study: (a) Run5-cu in Case 5; (b) Run5-cd in Case 5; (c) Run6-cu in Case 6; (d) Run6-cd in Case 6; (e) Run7-cu in Case 7; (f) Run7-cd in Case 7.
Figure 5.
Arrangement of roughness groups in each case of this study: (a) Run5-cu in Case 5; (b) Run5-cd in Case 5; (c) Run6-cu in Case 6; (d) Run6-cd in Case 6; (e) Run7-cu in Case 7; (f) Run7-cd in Case 7.

Figure 6.
Tribolodon hakonensis; Ugui.

Figure 7.
The Rr of Ugui in each case (Run4-cu and Run4-cd are previous study [4]).
Figure 7.
The Rr of Ugui in each case (Run4-cu and Run4-cd are previous study [4]).

Figure 8.
Flow velocity contour diagram of the fishway and the route of Ugui the upstream in each case of the previous study [4]: (a) Run4-cu in Case 4; (b) Run4-cd in Case 4.
Figure 8.
Flow velocity contour diagram of the fishway and the route of Ugui the upstream in each case of the previous study [4]: (a) Run4-cu in Case 4; (b) Run4-cd in Case 4.

Figure 9.
Flow velocity contour diagram of the fishway and the route of Ugui passing upstream in each case of this study: (a) Run5-cu in Case 5; (b) Run5-cd in Case 5.
Figure 9.
Flow velocity contour diagram of the fishway and the route of Ugui passing upstream in each case of this study: (a) Run5-cu in Case 5; (b) Run5-cd in Case 5.

Figure 10.
Flow velocity contour diagram of the fishway and the route of Ugui passing upstream in each case of this study: (a) Run6-cu in Case 6; (b) Run6-cd in Case 6.
Figure 10.
Flow velocity contour diagram of the fishway and the route of Ugui passing upstream in each case of this study: (a) Run6-cu in Case 6; (b) Run6-cd in Case 6.

Figure 11.
Flow velocity contour diagram of the fishway and the route of Ugui passing upstream in each case of this study: (a) Run7-cu in Case 7; (b) Run7-cd in Case 7.
Figure 11.
Flow velocity contour diagram of the fishway and the route of Ugui passing upstream in each case of this study: (a) Run7-cu in Case 7; (b) Run7-cd in Case 7.

Figure 12.
Water surface profile in the fishway (y = 2.5 cm; the lateral part of the fishway).

Figure 13.
Water surface profile in the fishway (y = 12.5 cm; the roughness groups installation part).
Figure 13.
Water surface profile in the fishway (y = 12.5 cm; the roughness groups installation part).

Figure 14.
Water surface profile in the fishway (y = 27.5 cm; the central part of the fishway).

Figure 15.
Flow velocities vector diagram in each case: (a) Run4-cu in Case 4 (previous study [4]); (b) Run4-cd in Case 4 (previous study [4]); (c) Run5-cu in Case 5 (this study); (d) Run5-cd in Case 5 (this study); (e) Run6-cu in Case 6 (this study); (f) Run6-cd in Case 6 (this study); (g) Run7-cu in Case 7 (this study); (h) Run7-cd in Case 7 (this study).

Figure 16.
The average distance of Ugui passing upstream that successfully moved upstream in each case (Run4-cu and Run4-cd are previous study [4]).
Figure 16.
The average distance of Ugui passing upstream that successfully moved upstream in each case (Run4-cu and Run4-cd are previous study [4]).

Figure 17.
The average time of Ugui passing upstream that successfully moved upstream in each case (Run4-cu and Run4-cd are previous study [4]).
Figure 17.
The average time of Ugui passing upstream that successfully moved upstream in each case (Run4-cu and Run4-cd are previous study [4]).


Table 1.
List of the experimental cases.
| Case | Run | Roughness Arrangement | Flow Quantity | Density of Roughness λ | Fishway Slope | Interval of Roughness | Note |
|---|---|---|---|---|---|---|---|
| 4 | Run4-cu | Figure 4a | 0.024 m3/s | 0.12 | 1/10 | 0.25 m | previous study [4] |
| Run4-cd | Figure 4b | ||||||
| 5 | Run5-cu | Figure 5a | 0.024 m3/s | 0.06 | 1/10 | 0.50 m | this study |
| Run5-cd | Figure 5b | ||||||
| 6 | Run6-cu | Figure 5c | 0.024 m3/s | 0.04 | 1/10 | 0.75 m | this study |
| Run6-cd | Figure 5d | ||||||
| 7 | Run7-cu | Figure 5e | 0.024 m3/s | 0.04 | 1/10 | 0.75 m | this study |
| Run7-cd | Figure 5f |
Publisher’s Note: MDPI stays neutral with regard to jurisdictional claims in published maps and institutional affiliations. |
© 2022 by the authors. Licensee MDPI, Basel, Switzerland. This article is an open access article distributed under the terms and conditions of the Creative Commons Attribution (CC BY) license (https://creativecommons.org/licenses/by/4.0/).
Share and Cite
MDPI and ACS Style
Aoki, M.; Nitta, M.; Funakoshi, T.; Sato, T. A Novel Roughness and Flow Pattern for Steep Stream-Type Fishways: Preliminary Insights. Water 2022, 14, 2540. https://doi.org/10.3390/w14162540
AMA Style
Aoki M, Nitta M, Funakoshi T, Sato T. A Novel Roughness and Flow Pattern for Steep Stream-Type Fishways: Preliminary Insights. Water. 2022; 14(16):2540. https://doi.org/10.3390/w14162540
Chicago/Turabian StyleAoki, Muneyuki, Masayuki Nitta, Tomoaki Funakoshi, and Taisei Sato. 2022. "A Novel Roughness and Flow Pattern for Steep Stream-Type Fishways: Preliminary Insights" Water 14, no. 16: 2540. https://doi.org/10.3390/w14162540
Note that from the first issue of 2016, this journal uses article numbers instead of page numbers. See further details here.