Article

Spatial-Temporal Pattern Analysis of Land Use and Water Yield in Water Source Region of Middle Route of South-to-North Water Transfer Project Based on Google Earth Engine

1
College of Earth Science, Chengdu University of Technology, Chengdu 610059, China
2
Henan Polytechnic Institute, Nanyang 473009, China
3
Highway School, Henan College of Transportation, Zhengzhou 451460, China
*
Author to whom correspondence should be addressed.
Water 2022, 14(16), 2535; https://doi.org/10.3390/w14162535
Submission received: 5 July 2022 / Revised: 12 August 2022 / Accepted: 13 August 2022 / Published: 18 August 2022
(This article belongs to the Special Issue Inevitable Connection of River Flow Modeling, GIS, and Hydrogeology)

Abstract

:
The water source area of the middle route of the South-to-North Water Diversion Project is an important water conservation and ecological protection area in China. Based on remote sensing data, this paper analyzed the evolution process of land use/cover change in water source region in the past 35 years. Then, based on the InVEST model, the spatial-temporal patterns of water yield in the water source region were calculated with land use cover, meteorology and soil data as inputs. The impacts of climate factors such as precipitation and temperature and land use change on water yield were discussed, and the responses of water yield to these two changes were also discussed. The results show that from 1985 to 2020, the average water yield depth in the middle route of the South-to-North Water Diversion Project increases first and then decreases, from 615 mm in 1985 to 738 mm in 2000, and then decreases to 521 mm in 2020. The spatial heterogeneity of the water-producing capacity is obvious. The high value of the water-producing capacity is concentrated in the Daba Mountain area in the south, while the low values are concentrated in the Hanzhong Basin, Ankang Basin and the eastern plain area. The spatial pattern of water producing depth has no obvious change. The average water yield depth of forest, grassland and shrub in the region was the largest, and forest and cultivated land were the main contributors to the total water yield of the region, providing 82% and 14% of the total water yield in 2020. Precipitation has a significant effect on water yield, while land use/cover change has a small effect on water yield.

1. Introduction

Water yield service is one of the most important service functions of ecosystem, which plays a key role in regulating regional water cycle and maintaining regional ecosystem stability [1]. It directly affects the overall level of regional water resources and is an important indicator of regional ecosystem quality [2,3,4]. Regional water service functions have strong temporal and spatial heterogeneity, which can directly affect climate, hydrology, vegetation and soil systems and indirectly affect human activities such as agriculture, industry, fisheries and hydropower generation [5,6,7,8,9,10,11,12,13]. In recent years, the study of spatial-temporal changes in watershed water yield services and their influencing mechanisms has become one of the hot topics in the interdisciplinary fields of hydrology and ecology, which has important application value and guiding significance for the rational development and allocation of watershed water resources, the sustainable development of ecosystems and the balance of regional economic and social development and ecological security [8,9].
For a long time, scholars of various countries have summed up different methods for the assessment of ecosystem water yield services. Among them, the observational statistical method is based on the actual observation data in a small watershed, using the soil storage capacity method, comprehensive storage capacity method, water balance method, precipitation storage method, annual runoff method and underground runoff growth method to estimate. However, this method is limited by the small number of monitoring stations in the basin and the quality of observation equipment, and the above methods have a large error in the estimation of water yield in large regions and basins. Based on the development of remote sensing science and GIS technology in the fields of ecology and hydrology, the model calculation method realizes the simulation and evaluation of large-scale regional water yield service through the establishment of a water yield service model. There are TOPMODEL [14], MIKESHE model [15], SWAT model and InVEST model [16,17,18,19]. The InVEST model based on ecological processes has been widely used in the evaluation of ecosystem services in recent years [20,21,22,23]. This model has obvious advantages in data input, parameter calibration, spatial analysis and result visualization. The water yield module of the InVEST model takes into account the spatial difference of soil permeability of different land use types, DEM and other factors and uses the principle of water balance to subtract actual evapotranspiration from precipitation as water yield. In addition, the input data and calculation results of InVEST model are in a TIF format, which is convenient for analyzing the driving factors of spatial heterogeneity of runoff production and the confluence of each sub-watershed in the region and can also quickly calculate the contribution of different landscape units to watershed water yield [24]. The InVEST model has been widely used in many countries and regions and has achieved good application results. The Brazilian Subtropical Basin [25], Atlanta Metropolitan area [26], arid Basin in Iran and Lower Mekong [27] have been estimated by foreign scholars using this module [28]. There are many studies based on the InVEST module and land use change data to study the three-river source area [29] in northeast China [22,30], in the Beijing Gui River basin [31], in the Yellow River and in Qinling [10,32] in characteristics such as water rate and the change in time and space [22]. Climate change is discussed under the condition of the influence of human activities on the regional water rate [33].
As the main carrier of human production and life, land use/cover change has become an indispensable part of ecological environment change research [24,33,34,35]. Under the influence of climate change and human activities, the global land use/cover change is increasingly frequent, leading to drastic changes in the ecological environment and water resources environment, aggravating the contradiction between social and economic water use and ecological water use and resulting in an imbalance between ecosystem structure and function [35,36]. Research related to land use/cover change and its ecological and environmental impacts needs to be conducted. It will help to alleviate the contradiction between man and land and promote the coordinated development of water and soil resources [17,37,38].
The water source area of the middle route of the South-to-North Water Diversion Project is an important water conservation area in China [39,40]. The Danjiangkou reservoir in the region is the starting point of the middle route of the South-to-North Water Diversion Project in China. The variation in water yield in this region plays an important role in regulating the water resource security and ecological security in the middle and lower reaches of the Han River [41]. By January 2022, the project had transferred nearly 45 billion cubic meters of water, directly benefitting more than 120 million people and becoming a major source of domestic water for many major cities. Therefore, the water yield in this region is the key to ensure the high quality and continuous water transfer in the middle route of the South-to-North Water Transfer Project. Since 1985, urbanization in the middle route of the South-to-North Water Transfer has developed rapidly, and economic water use and agricultural irrigation water use have increased rapidly, which has seriously threatened the role of regional water conservation. Since 1999, China has carried out a series of ecological construction projects, such as returning cropland to forest (grassland), protecting natural forests and water and soil conservation, in order to improve the ecological service functions of the water source areas. The implementation of a series of ecological projects led to the expansion of forest area, the increase in vegetation coverage and the corresponding enhancement of evapotranspiration, which further led to the change in the regional water yield. Therefore, it is of great scientific significance to study the relationship between land use/cover change and water yield change in the water source region of the middle route of the South-to-North Water Diversion Project [42]. At present, the existing studies mainly focus on vegetation cover change and runoff change caused by landscape pattern evolution before and after ecological restoration project construction. There are also a lot of studies on environmental impact assessment of this region, but there are insufficient studies on the water yield service function of the ecosystem in this region. There are few quantitative studies on the contribution of climate change and human activities to the variation in water yield in this region. Therefore, estimating water yield service and its driving factors in the water source region of the middle route of the South-to-North Water Diversion Project and clarifying the spatio-temporal dynamic response relationship between water yield, precipitation, land use and other key factors will provide scientific theory and decision support for the scientific utilization and rational allocation of regional water resources [43].
Firstly, multi-source remote sensing data provided by the Google Earth Engine (GEE) cloud platform were used to analyze land use/cover change in the region [44]. Then, the land use/cover change results and other remote sensing data were put into the InVEST model to simulate the water yield service before returning cropland to forest (1985 and 1990), at the beginning of returning cropland to forest (2000), after the middle route of South-to-North Water Diversion Project was officially put into operation (2010) and most recently in 2020. The difference of water producing capacity under different land use and climate conditions was analyzed. On the basis of ensuring the accuracy and reliability of the data, through the deep integration of remote sensing big data, GIS technology and ecosystem service assessment method, the spatio-temporal dynamic simulation results of water yield service under the condition of climate disturbance are estimated accurately and efficiently. Finally, the contribution rate of precipitation change and land use change to regional water yield change was quantitatively analyzed by scenario analysis method, and then the key factors affecting the change in water yield service in the middle route of the South-to-North Water Diversion Project were identified.

2. Materials and Methods
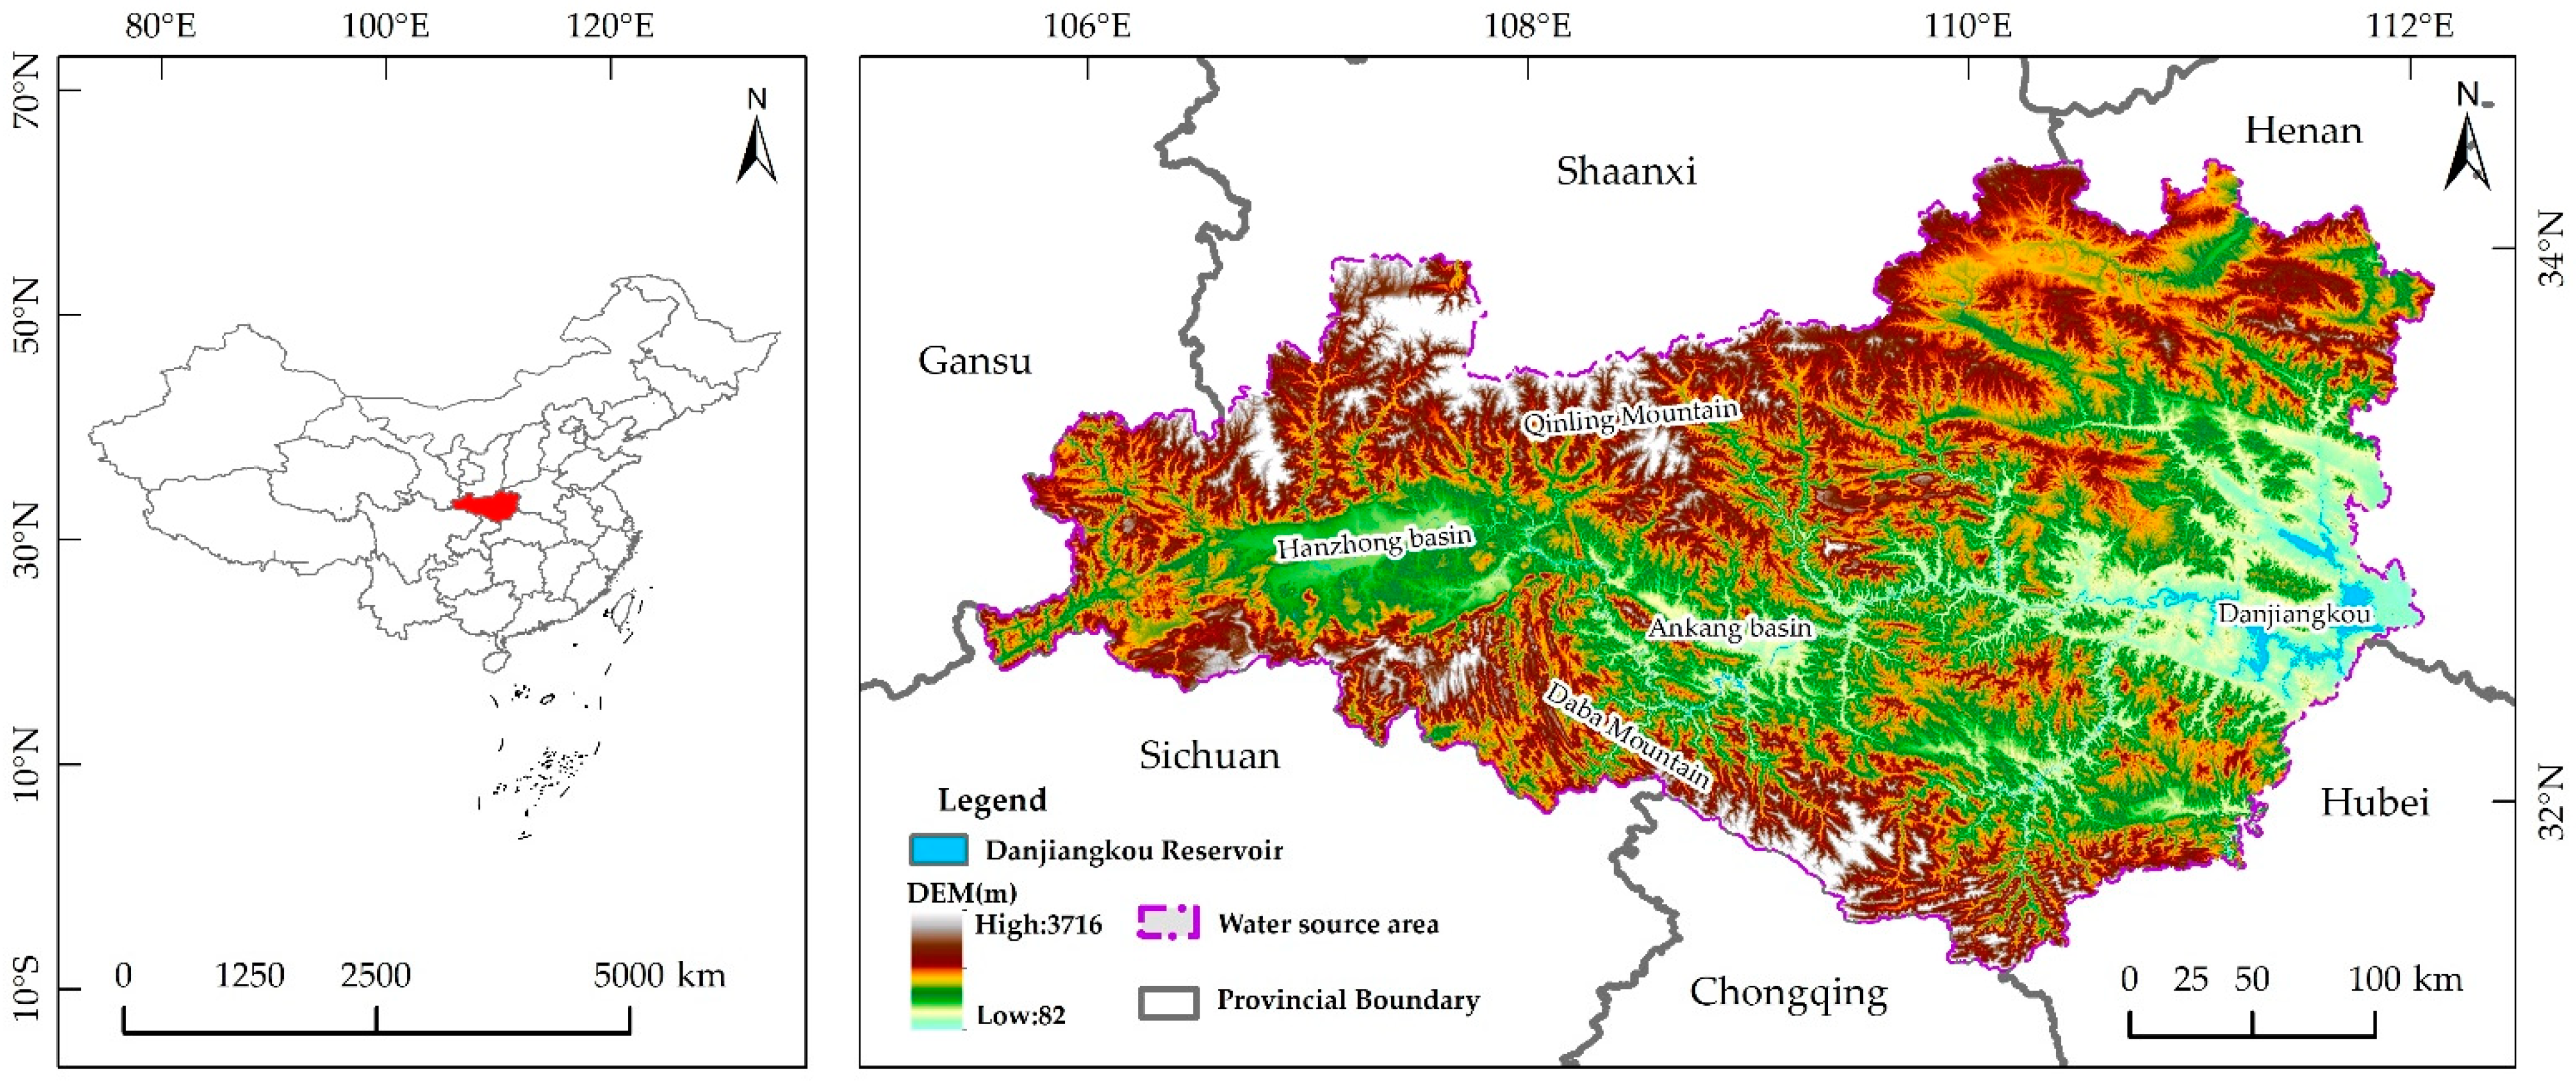
2.1. Study Area

As shown in Figure 1, the water source area of the middle line of the South-to-North Water Diversion Project (hereinafter referred to as the water source area) is located between the Qinling Mountains and the Dabashan Mountains (31°20′~34°10′ N and 106°~112° E), forming a typical geomorphic feature of “two mountains sandwiching a river”. The landforms are mainly mountainous (88.9%), hilly (3.9%) and alluvial platform (6.9%). The slope of mountainous areas is generally large, ranging from 0 to 68.8°. Only Hanzhong Basin, Ankang Basin and the eastern part of the basin have gentle topography, becoming the main residential areas, and the range of regional elevation is 100–3177 m. In addition, there are Danjiang, Hanjiang and Duhe river basins in the water source region, with a total area of 10.9 × 10⁴ km2 and a surface runoff of 39.8 km3. The climate in the water source region is mild and humid, and the average annual precipitation is 894 mm, which is the main factor of landmark runoff in the water source region. The vegetation in the west and south of the water source region is mainly forest, and the natural vegetation mainly includes evergreen broad-leaved forest, evergreen coniferous forest, deciduous broad-leaved forest and mixed forest, etc. The vegetation coverage is relatively good, and it is the water conservation area of the middle route of South-to-North Water Diversion Project. Danjiangkou Reservoir in the water source area is the source of water diversion for the middle route of the South-to-North Water Transfer Project, with a dam height of 170 m, a water area of 1022.75 km2 and a storage capacity of 29.05 billion m3. After the middle route of the South-to-North Water Transfer project is fully put into operation, about 9.5 billion m3 of water will be transferred annually.

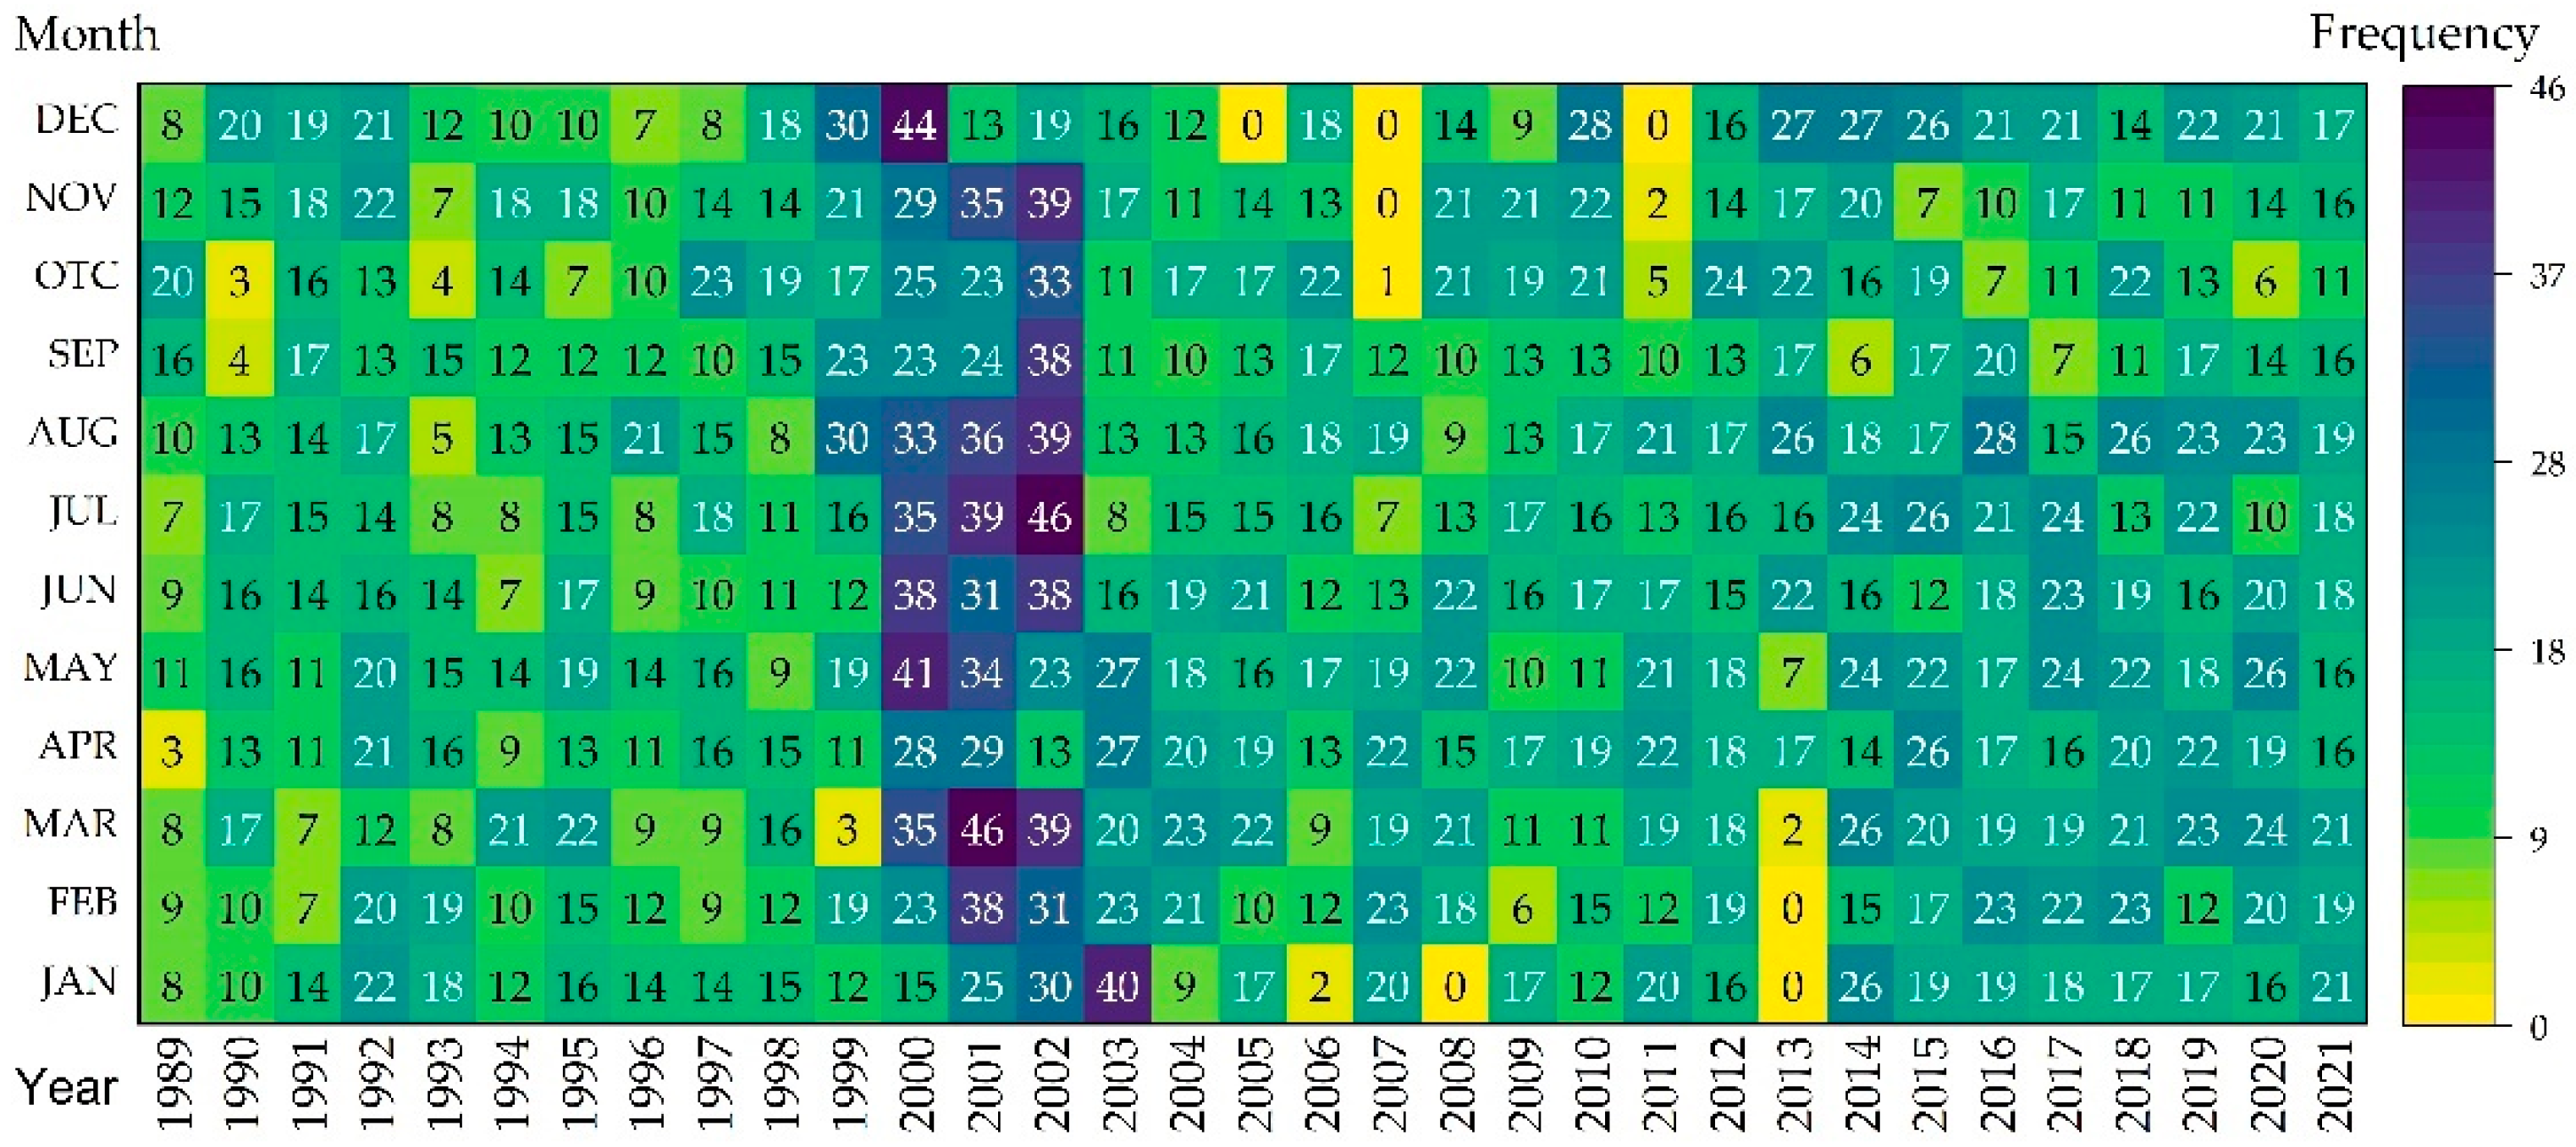
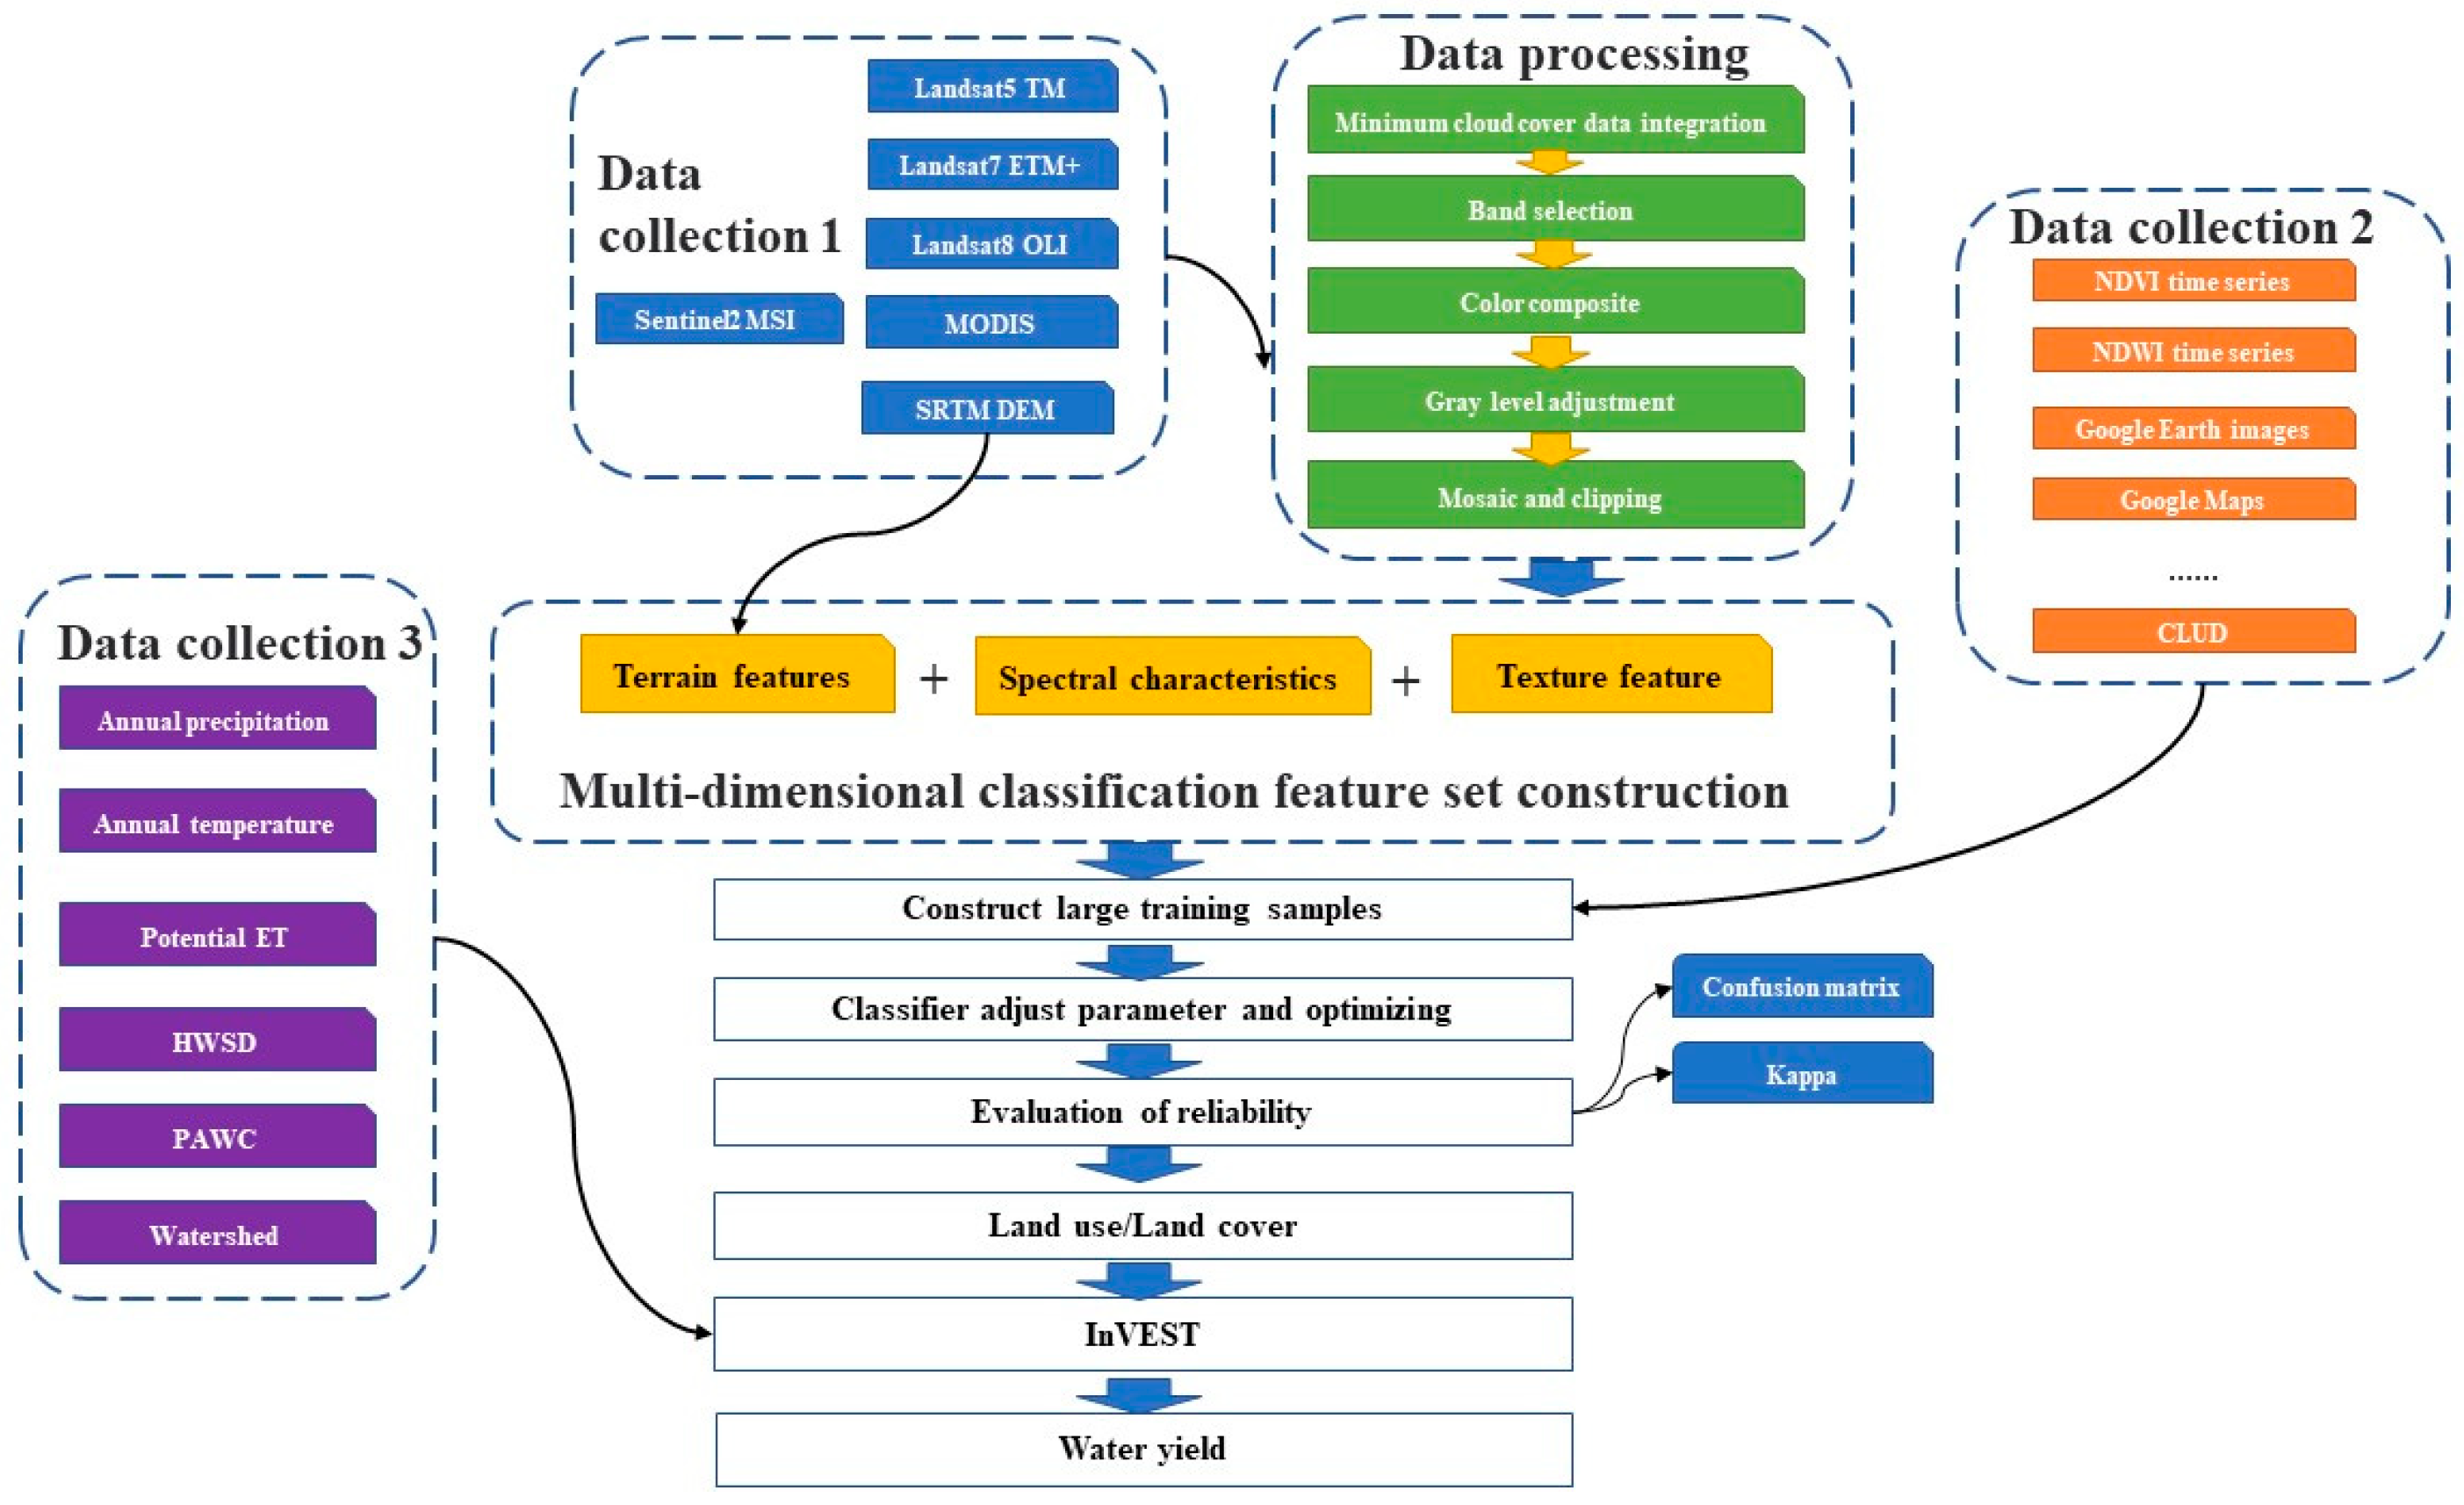
2.2. GEE Platform and Remote Sensing Image Statistics

The land use classification in the study area is mainly accomplished by means of the GEE platform. Google Earth Engine, also known as cloud computing Engine, is jointly developed by Google, Carnegie Mellon University, NASA and The US Geological Survey and is the world’s leading cloud computing platform and geographic information processor for Earth observation data [45]. With the advent of the era of remote sensing big data, the emergence of remote sensing cloud platform represented by GEE makes it possible to perform rapid calculation and analysis of water surface extraction and vegetation monitoring worldwide [46,47]. Its open remote sensing image dataset has stored remote sensing satellite image data for more than 40 years online and provides convenience for large-scale and long-term remote sensing image data processing and analysis through its powerful cloud computing capability. In this paper, the spatiotemporal consistency processing of Landsat and MODIS data on the GEE platform was carried out to regenerate the training and testing samples of the growing time series (1985–2020). Then, the features were constructed, and the land classification data with a resolution of 30 m was produced by combining the independent sample data of visual interpretation. Ensure the accuracy of the classification data by checking the classification and comparing the accuracy with other products. This process is implemented on the GEE platform without data download, which is very beneficial to data management [46,48]. The amount of Landsat data in the water source area can support the monitoring of interannual changes of land use in the area since 1985. Therefore, Landsat 5 TM, Landsat 7 ETM+, Landsat 8 OLI Collection 1 Tier 1 and other surface reflectance data covering the study area from 1985 to 2020 were used in this study (about 44,000 scenes, about 400 terabytes of data) from the United States Geological Survey (USGS). All Landsat data were obtained by GEE and passed geometric correction and atmospheric correction [49,50]. As The Landsat data have been included in the data archive of GEE cloud computing platform, we counted the effective Landsat observation times on the annual and monthly scales in the water source area from 1985 to 2020 through the platform, as shown in the Figure 2. However, the average annual cloud frequency in the study area calculated according to GEE platform is between 56.49%–89% and 81% [51]. Although it is much lower than the average cloud frequency in southern China, it is considered to minimize the influence of cloud coverage probability on visual interpretation of remote sensing images. Therefore, in this paper, the built-in open source algorithm “simpleCloudScore” of the GEE platform is first used to calculate the “cloud score” of each image pixel, and then the threshold of “cloud score” = 15 is taken as the “good observation”; that is, pixels below 15 are considered as “good observation”. Finally, the “good observation” pixel is used to generate the study area splice map. It can effectively reduce the impact of cloud coverage on the results. In addition, to enable the LC change monitoring backdate to 1985, we generated a LUCC map for 1985 as a supplement [51].

2.3. LUCC Data Source and Classification

GEE platform can only recognize and classify the spectral features, texture features and topographic elements of the study area as input features of the classifier. Normalized Difference Water Index (NDWI), and Normalized Difference Vegetation Index (NDVI). Grey-level Co-occurrence Matrix (GLCM) and SRTM DEM. Finally, training samples were extracted from global land cover product MCD12Q1 Version 6 IGBP_LC_Type1 to realize the automatic creation of a large training sample data set. Through the selection of free access to China’s land cover data sets [52] (CLCD, accessed on 19 June 2022), Geo-wiki [53] and Global Land Cover Validation Sample Set (GLCVSS) [54] to fully verify the data quality of this paper, it was found that the classification accuracy of land use/cover data in this paper was 84.3%, better than that of CLCD (81.31%), MCD12Q1 (79.97%) and GLCVSS (78.93%). Hydrological and elevation information from The Chinese Academy of Sciences Data Center for Resources and Environment (accessed on 19 June 2022).
Confusion Matrix (CM) is one of the most popular indices in the accuracy evaluation of land cover classification [55,56]. Each column of the confusion matrix represents the real land cover information, and the value in each column is equal to the corresponding category quantity of real surface pixels in the classified image. In this study, 150 samples were randomly selected from the study area in 2020, and the classification results and verification samples were analyzed on the GEE cloud platform [50,57], including cropland, forest, shrub, grassland, construction land, water body and wasteland. Production accuracy, user accuracy, overall accuracy, Kappa coefficient, missed error and misclassification error are calculated by the evaluation index of confusion matrix [49,57,58]. The results are shown in Table 1.

2.4. Land Use Transfer Matrix

The land use transfer matrix reflects the dynamic transformation process of cropland, forest, shrub, grassland, construction land, water body and wasteland in 1985, 1990, 2000, 2010 and 2020. After calculating the area conversion between different land use types in the water source region, we also analyzed the causes of conversion between different land use types in combination with the implementation of ecological projects such as converting cropland to forest and South-to-North water diversion [15,24,32,59]:
S i j = [ S 11 S n 1 S n 1 S n n ]
where S represents the area; i, j (i, j = 1, 2, …, n) are before and after land use type transfers, respectively; Sij represents the area from land use type i to type j between the two time points; and n indicates the classification number of land use types.

2.5. Model of Water Yield

Integrated Valuation of Ecosystem Services and trade-offs (InVEST) is jointly developed by Stanford University, The Nature Conservancy (TNC) and the World Wildlife Fund (WWF). Its main function is to visually simulate the changes in ecosystem service quality and value under different land cover scenarios at the grid scale [60]. The water yield module is one of the most widely used models for calculating regional water yield based on the coupled equilibrium theory of water and heat based on Budyko’s hypothesis [61]. In this study, the model was used to estimate the spatial distribution and temporal variation in water yield in five periods from 1985 to 2020, and the flowchart of the water yield process is shown in Figure 3. Its calculation formula is shown in Formula (2):
Y ( x ) = ( 1 A E T ( x ) P ( x ) ) · P ( x )
where Y(x) represents the annual water yield depth of grid X; AET(x) is the average annual actual evapotranspiration of grid X; P(x) represents the average annual precipitation of grid X. (AET(x))/(P(x)) is the ratio of the actual evapotranspiration to precipitation, which can be calculated according to Zhang et al. [62] and Budyko’s hypothesis [61]:
A E T ( x ) P ( x ) = 1 + ω ( x ) + R ( x ) 1 + ω ( x ) · R ( x ) + 1 R ( x )
ω ( x ) = Z · P A W C ( x ) P ( x )
R ( x ) = k ( x ) · E T 0 P ( x )
where Z represents the Zhang coefficient [62], R(x) refers to Budyko’s dryness index which is the ratio of potential evapotranspiration to precipitation, and PAWC(x) refers to available water content of plants in grid X. ω(x) is the ratio of improved vegetation annual water availability to expected precipitation. k(x) is the plant evapotranspiration coefficient; ET0 is the annual reference evapotranspiration.
The input parameters for the model parameter water yield module include LULC, precipitation, soil depth, vegetation available water, biophysical parameter list, watershed and Zhang coefficient. The spatial resolution of all the data in this study is resampled to 30 m, and the coordinate system uses the world Geodetic coordinate System (WGS1984). In order to save computing cost, this study calls the data of land use and DEM based on The Cloud platform of Google Earth Engine and performs cutting and pre-processing calculations [63]. The InVest model data structure and data information used in this paper are shown in Table 2.
The original data of annual average rainfall, maximum temperature and minimum temperature in the study area were obtained from The Chinese Meteorological Data Center, and then the spatial grid data of annual average temperature, temperature difference and rainfall were calculated based on ANUSPLIN spatial interpolation. The reference evapotranspiration data used in this paper were calculated by the InVEST model and the Hargreaves method, given by:
E T 0 = 0.0019 × R A × T D 0.5 × ( T a v + 17.8 )  
where RA is extraterrestrial solar radiation, in units of (MJ/(m2·day); Tav is the average daily temperature, in units of °C; TD is the average daily temperature difference, in units of °C [63,64].
Plant available water content (PAWC) can be calculated based on soil texture and soil organic matter content:
P A W C = 54.509 0.132 × S A N D 0.03 × ( S A N D ) 2 0.55 × S I L T 0.006 × ( S I L T ) 2 0.738 × C L A Y + 0.007 × ( C L A Y ) 2 2.688 × O C + 0.501 × ( O C ) 2  
where SAND, SILT and CLAY represent the proportion of soil SAND, SILT and CLAY particles (%), respectively. OC represents soil organic carbon content (%).
The Zhang coefficient is a seasonal constant representing precipitation distribution characteristics. After several simulation runs, when Zhang coefficient is 3.4, the estimated water yield in the study area is close to the measured annual average runoff, of which the measured runoff data are from the Yangtze River Hydrological yearbook and related research results [15,65].

2.6. Scenario Analysis

According to Formula (2), precipitation and actual evapotranspiration are the main factors affecting regional water yield, and the transformation of land use type will directly lead to the change in actual evapotranspiration. Therefore, this paper sets up two scenarios to explore the contribution of precipitation change and land use change to the change of water yield service in the study area by comparing different scenarios [37,66].
Precipitation change scenario: keep the input of land use data in 1990 unchanged, input the precipitation data in 2000, 2010 and 2020 into the model and then calculate the difference between the simulated water yield and the actual scenario water yield, indicating the influence of precipitation change on water yield, Δ p .
Land use change scenario: keep the precipitation data input of 1990 unchanged, input the land use data of 2000, 2010 and 2020 into the model and then calculate the difference between the simulated water yield and the actual water yield of the scenario, indicating the impact of land use change on water yield, Δ l .
The calculation formulas for the contribution rate of precipitation change and land use change ( R P ,   R l ) are Formulas (8) and (9):
R P = Δ p Δ p + Δ l × 100 %
R l = Δ l Δ p + Δ l × 100 %

3. Results

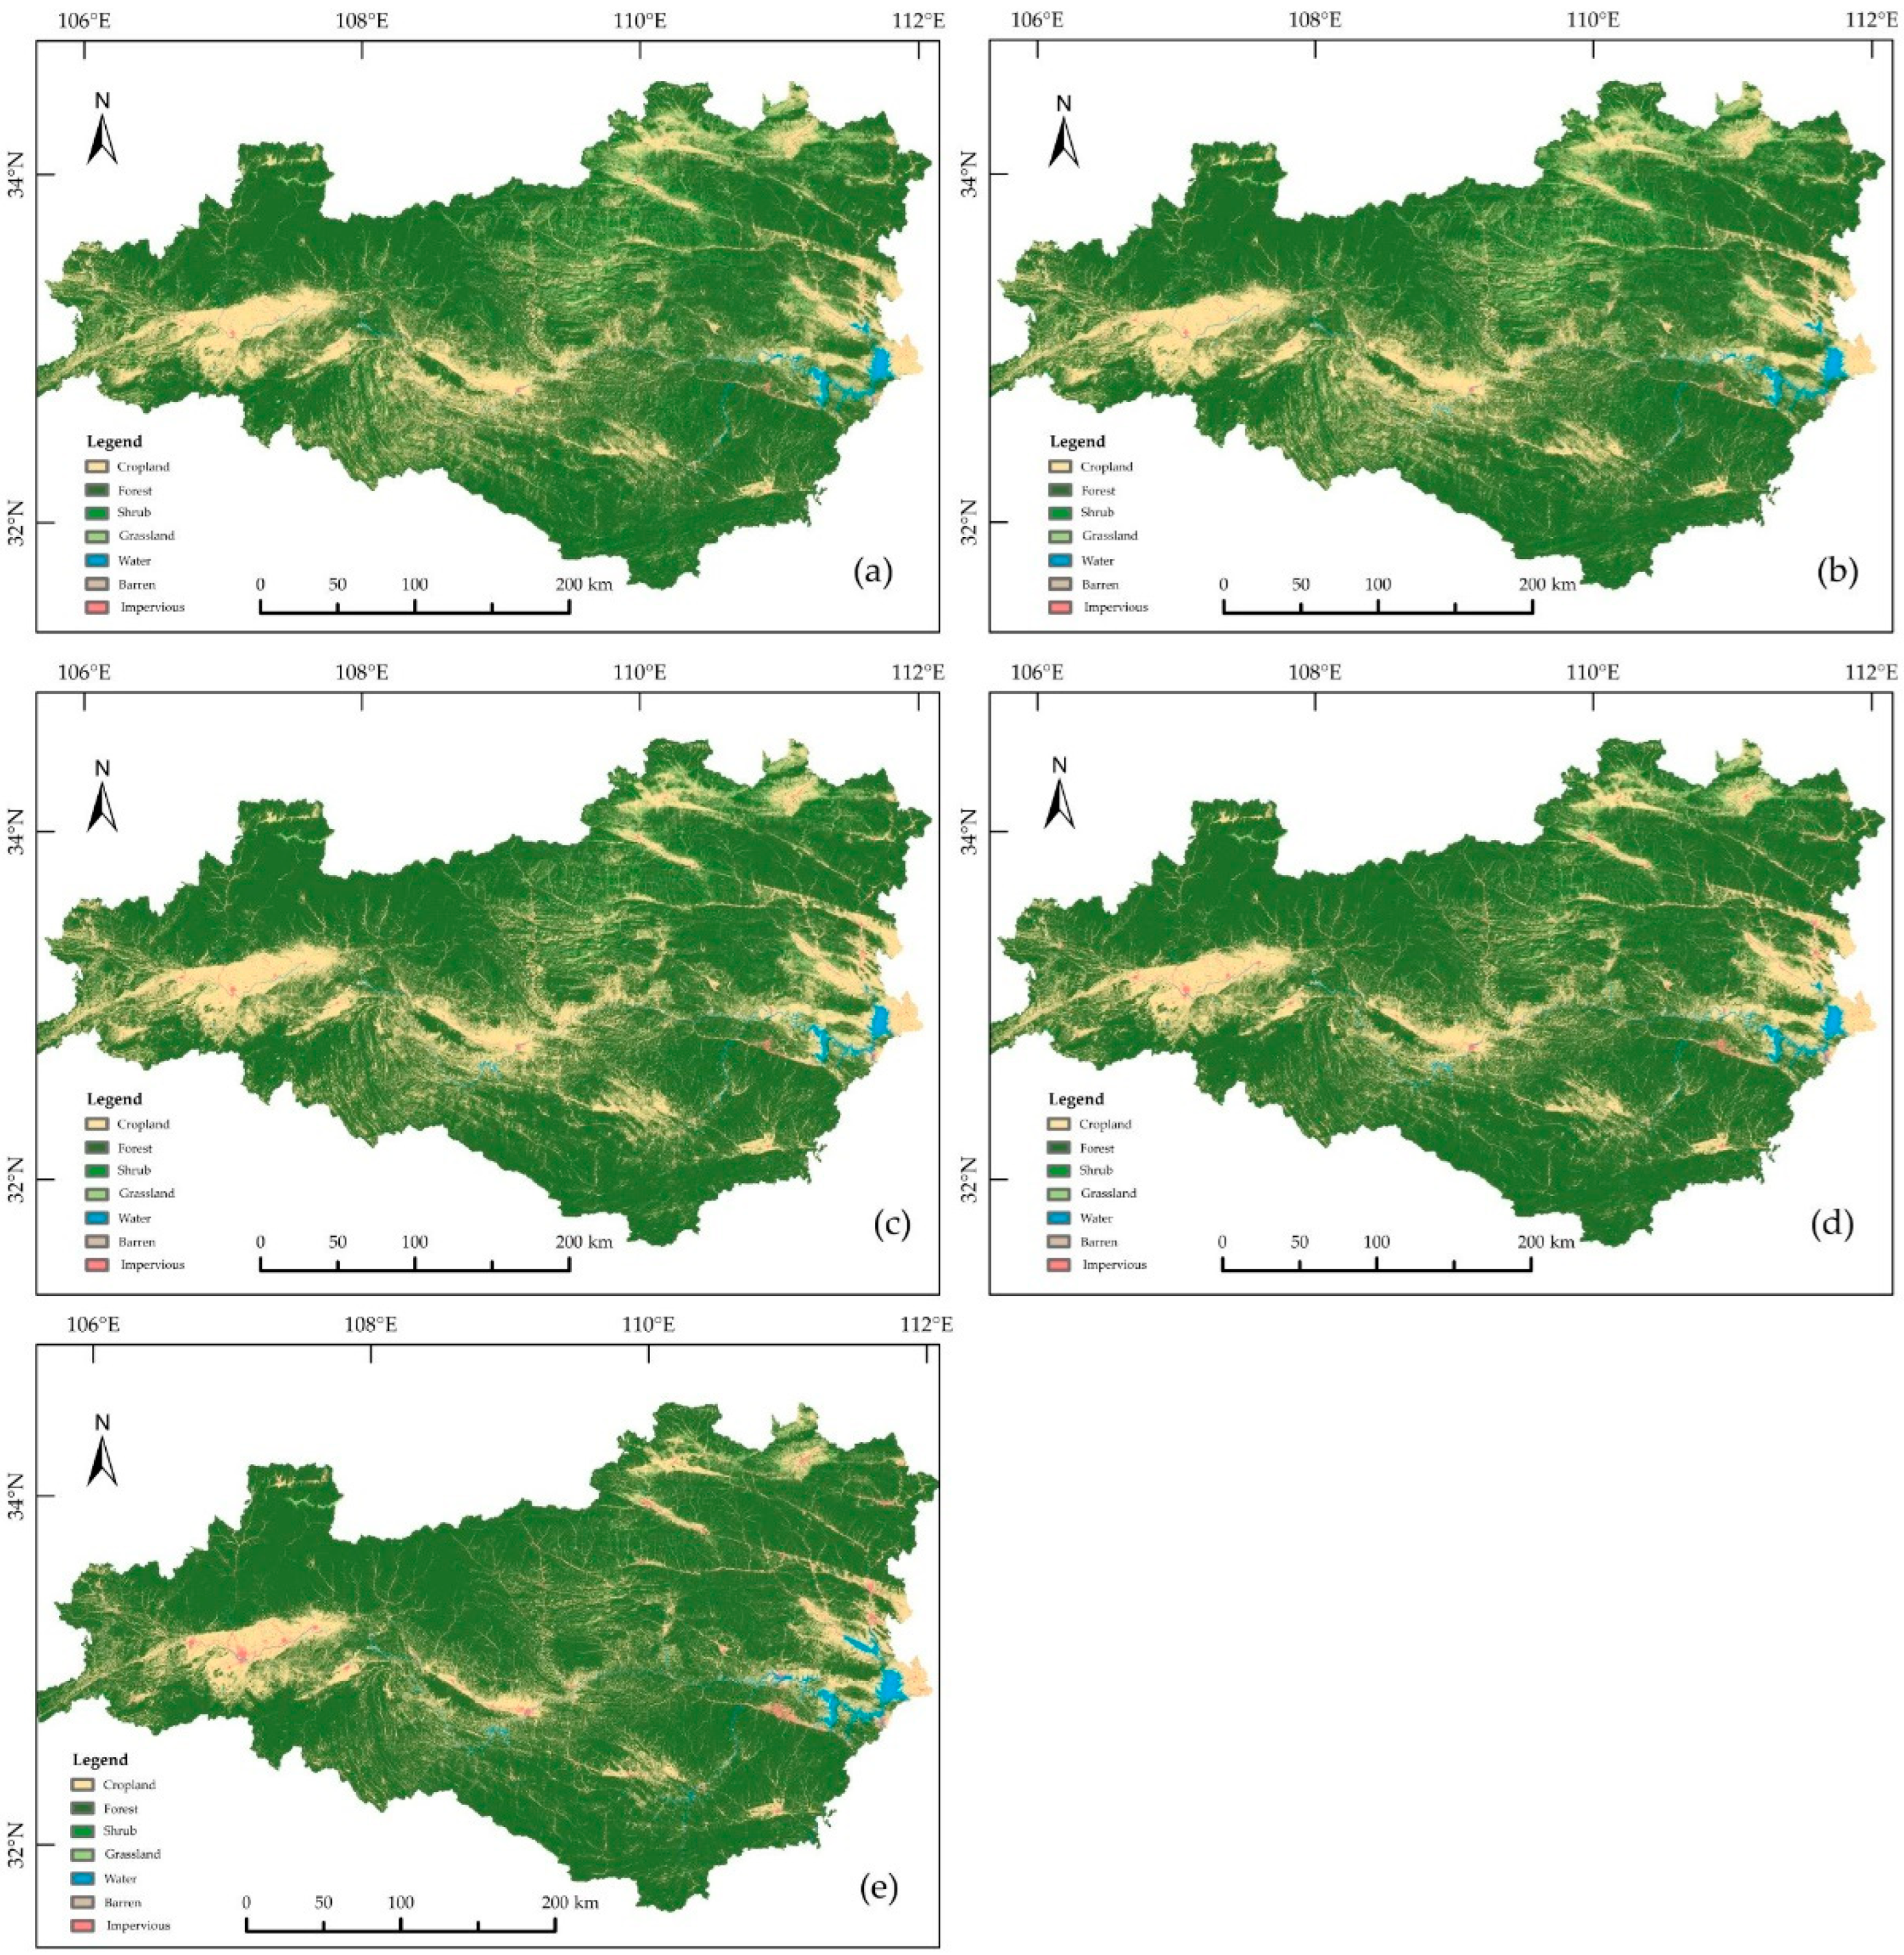
3.1. Temporal and Spatial Characteristics of Land Use Change in the Study Area

From 1985 to 2020, land use in the water source region of the middle route of the South-to-North Water Diversion Project has changed significantly (Figure 4). The forest area increased by 8895.09 km2, 11.24%; the area of construction land kept increasing, with a cumulative increase of 715.95 km2, 138.02%, and the main growth areas were Hanzhong Basin, Ankang Basin and the gentle terrain area in the east of the water source region. Due to the implementation of the early-stage water storage project of the South-to-North Water Transfer Project [42], the water area in the water source area increased by 299.74 km2, an increase of 38.59%, mainly in the Danjiangkou reservoir area. The effect of returning cropland to forest was obvious, and the agricultural land area decreased 4067.05 km2, equivalent to 19.05% of the cultivated land area in 1985. The area of grassland and shrub decreased by 3922.16 km2 and 1862.7 km2, respectively, with proportions of 77.18% and 88.40%, respectively. In general, the transformation of land use/cover type in the study area is intense, which is manifested as construction land > shrubs > grass > water > cropland > forests (Figure 5). For the process of land use change from 1985 to 2020, we divide it into four phases, and the specific situation is introduced as follows.
The conversion between cultivated land, forest, shrub and grassland was relatively frequent during 1985–1990. The areas transferred into and transferred out of cultivated land were 960.4 km2 and 930.04 km2, respectively. The increased area was mainly from grassland and shrub, and the reduced area was mainly from forest and construction land. The transfer-in area and transfer-out area of forest were 893.7 km2 and 824.1 km2, respectively, and the transfer-in area mainly came from grassland and shrub. These changes are mainly concentrated in Hanzhong basin and Ankang Basin.
From 1990 to 2000, the forest area was further expanded, and 3150.6 km2 and 4744.9 km2 were transferred, respectively. In addition, the area of shrub and grassland continued to decrease, among which the area of shrub transfer was more than 63.4% and that of grassland transfer was more than 50%. However, with the increase in the population, the cultivated land area increased rapidly in this period because the effect of the project of returning cropland to forest, which was implemented in 1999, was not fully reflected. The areas transferred out and transferred in were 2732.87 km2 and 3920.16 km2, respectively, with a net increase of 1187.29 km2. At the same time, the water area in the water source area decreased greatly, and the net decreased area reached 124.9 km2.
From 2000 to 2010, the effect of returning cropland to forest was prominent, and the cropland area decreased by 2550.14 km2, mainly due to the transfer of a large amount of agricultural land to forest and grassland in Ankang basin and Hanzhong Basin. Around 2009, the Danjiangkou Reservoir of the middle route of the South-to-North Water Transfer project had a significant effect on water storage, resulting in a significant increase in water area in the water source area, up to 110.9 km2. The change in water area is mainly concentrated in the upper reaches of the Han River, the middle and lower reaches of the Danjiang River and the Danjiangkou reservoir [67].
From 2010 to 2020, the land type transformation was still affected by the project of returning cropland to forest and the water storage project of the South-to-North Water Diversion Project, and the forest area increased by 3476.44 km2, mainly from grassland and cultivated land. Water area increased 295.52 km2. At the same time, the cropland area was further reduced by 2673.84 km2, while the grassland area was reduced by 1108.93 km2. The overall ecological environment was further improved.
During the entire study period (1985–2020), the area of grassland and arable land decreased significantly, and these two land types were mainly converted to forest and construction land. At the same time, the water area increased rapidly, mainly because of the large-scale water storage project of the South-to-North Water Diversion Project, which led to the relocation of the upper reaches of the Han River, the lower reaches of the Danjiang River and the vicinity of the Danjiangkou reservoir and a large amount of cropland and construction land into water bodies.

3.2. Temporal and Spatial Variation Characteristics of Water Yield in the Study Area

From 1985 to 2020, the average water depth of the source region of the South-to-North Water Diversion Project was between 521.2 mm and 738.3 mm. In 1985, 1990, 2000, 2010 and 2020, the average water yield depth was 615.74 mm, 582.99 mm, 738.25 mm, 688.04 mm and 521.20 mm, respectively, and the average water yield was 671, 635, 804, 75 and 56.8 billion m3, respectively. The water yield in the source region was the highest in 2000 and the lowest in 2020. Compared with 2020, the average water depth in the water source region increased by 217.05 mm (23.6 billion m3) in 2000. Figure 6 shows the spatial pattern distribution of water producing depth in the water source region during 1985–2020. On the whole, there is little difference in spatial distribution pattern of water producing depth in different years, and the overall pattern is relatively consistent, with low water producing depth in the central and northern parts and high water producing depth in the southwest and southeast parts.
In 1985, the high water yield areas were mainly concentrated in the Daba Mountain area of Nanzheng County, Zhenba County, Ziyang County, Ping County, Zhenping county and Zhuxi County in the south of the water source region and the Qinling Mountain area of Ningshan County and Taibai County in the north of the water source region, with the maximum water depth of 1226.61 mm. Compared with 1985, the water source area changed greatly in 1990, mainly concentrated in Ningqiang County, Mianxian County and Liaoyang County in the west of the water source area, with the maximum water depth of 1192.72 mm. In 2000, the water producing depth in the west decreased significantly, and the main water source area shifted to the Daba Mountain area in the south, such as Zhenba County, Ziyang County, Langao County and Zhenping County, with the highest water producing depth of 1488.09 mm. In the west (west of Ankang), the depth of water yield increased further, and the southwest and southeast became the regions with high water yield value. Compared with 2000, the annual high water value area moved westward in 2010, including Nanzheng county and Ningqiang County. Meanwhile, the water yield depth increased in Xixia County, Luanchuan County and other mountainous areas in the northeast, while the water yield increased significantly in the plain area in the middle and east. Overall, the maximum water yield depth in the region was 1379 mm. By 2020, the spatial differentiation of high water yield in the south and low water yield in the middle and east became more obvious. The highest water yield depth in the south reaches 1126.81 mm, while the lowest water yield depth in Danfeng County, Yunyang District, Danjiangkou City, Xixia County and Xichuan county with low water yield in the east is only 282.4 mm. It is also closely related to the distribution of precipitation and land use types in the water-producing area.

3.3. Variation in Water-Producing Depth in Different Land Use Types

Using the spatial analysis function of ARCGIS10.6 software, the average water yield depth of different land use types in the water source region during 1985–2020 was classified and statistically analyzed [20,21,68], and the results are shown in Figure 7. As shown in Figure 7, the water producing capacity of bare land, urban built-up area and forest is relatively strong. In the experiment, the average water producing depth of each year is 857.92 mm and 836.35 mm, respectively. These land types have no vegetation interception of precipitation, and the evapotranspiration is smaller than other land types, so the water producing capacity is relatively high. Secondly, forest, grassland and shrub had average water-producing depths of 645.88 mm, 592.71 mm and 591.15 mm, respectively. In 2010, due to abundant precipitation, the above land features could penetrate part of the precipitation into the soil and form underground runoff, which also showed a strong water-producing function. Due to strong evaporation, the water body and cultivated land have the lowest water producing capacity, with an average water producing depth of only 541.8 mm. The cultivated land in the water source area needs a lot of water. The time when evapotranspiration is strongest is the season changing time of crops, which reduces some evapotranspiration [22,69,70], so the water producing capacity is higher than that of the water body. The average water depth is 566.14 mm. On the whole, the water yield is closely related to the average annual rainfall. For example, the average rainfall in the water source region reached 1064 mm in 2010, and the water yield in all regions will reach its peak in 2020. From 1985 to 2020, the water yield depth of each land use type fluctuated in different amplitude, and the average water yield depth of forest and construction land continued to increase, but decreased in 2020. Other land categories increased first and began to decrease around 2000.
From the perspective of total water yield, the total water yield of different land use types is closely related to the area of each region. As the main land use types in the water source area are forest and arable land (Figure 5), they account for 75% and 18% of the total area, respectively, over the years. From 1985 to 2000, forest and cultivated land were the main contributors to regional water yield, accounting for 74% and 17% of the total regional water yield in 1985 and 1990 and 75% and 19% in 2000. In 2010, it was 79% and 16%, and in 2020, it was 82% and 14%. It can be seen that the forest water yield in the basin increases, which is closely related to the implementation of the continuous project of returning cropland to forest.

3.4. Relative Contribution of Precipitation and Land Use Type to Water Yield

According to the above experimental results, the actual water yield in 2020 is the lowest value in each year. For the convenience of comparison, this paper takes the precipitation and land use situation in 2020 as the benchmark, and simulates the change in water yield depth in 1990, 2000 and 2010 in the water source region under the precipitation change scenario and land use change scenario through the InVEST model. As shown in Table 3, based on the input of precipitation from 1990 to 2010, the water yield depth increases by 70.79 mm,176.31 mm and 215.84 mm, respectively, compared with the baseline scenario (actual situation in 2020). Water yield increased by 7.717 billion m3, 19.22 billion m3 and 23.53 billion m3. In the case of constant precipitation, the water depth decreases by 0.88 mm,1.41 mm and 0.7 mm, respectively, on the basis of input land use from 1990 to 2010. Water yield decreased by 97 million m3, 154 million m3 and 78 million m3.
Under the condition of constant land use type, the average water yield depth of different land types also changed significantly with the change in rainfall [15,24]. Among them, the water yield increased 1120%, 980%, 479% and 198% with the change in water body, forest, grassland and shrub. It can be seen that the change in the regional water yield pattern is mainly related to rainfall. In the case of constant rainfall, the average water yield of forest and water decreased by 9% and 4%. The average water yield of cultivated land, grassland and bare land increased by 13% and 8%, respectively. It is proven that the change in water yield and water yield pattern is not obvious under the condition of constant precipitation and land use change. According to Formulas (8) and (9), it can be calculated that the contribution rates of precipitation change and land use change to water yield change are 99% and 1%, respectively. The above results show that precipitation change has a more significant impact on water yield. Under the situation of land use change, the change in water yield is mainly related to the concrete promotion of the project of returning cropland to forest [68]. We compared and fitted the results with the annual runoff data of the Hanjiang River Basin in the study area and the root-zone soil moisture, which were produced by the Soil Moisture Active Passive (SMAP) mission. Finally, we found that the results had obvious positive correlation, which realized the further verification of the regional annual water yield and the regional average water yield of different land use types in the study area.

4. Discussion

4.1. Basic Conclusions

Based on the Cloud platform of Google Earth Engine [58], this study extracted multi-temporal land use types from the water source area of the middle route of South-to-North Water Transfer Project, and then combined with topography, meteorology and soil data from other platforms. The water yield depth and water yield in the water source region from 1985 to 2020 were analyzed and simulated by the InVEST model. The contribution of precipitation and land use change to regional water yield was quantitatively analyzed by scenario analysis. The following conclusions are drawn:
(1)
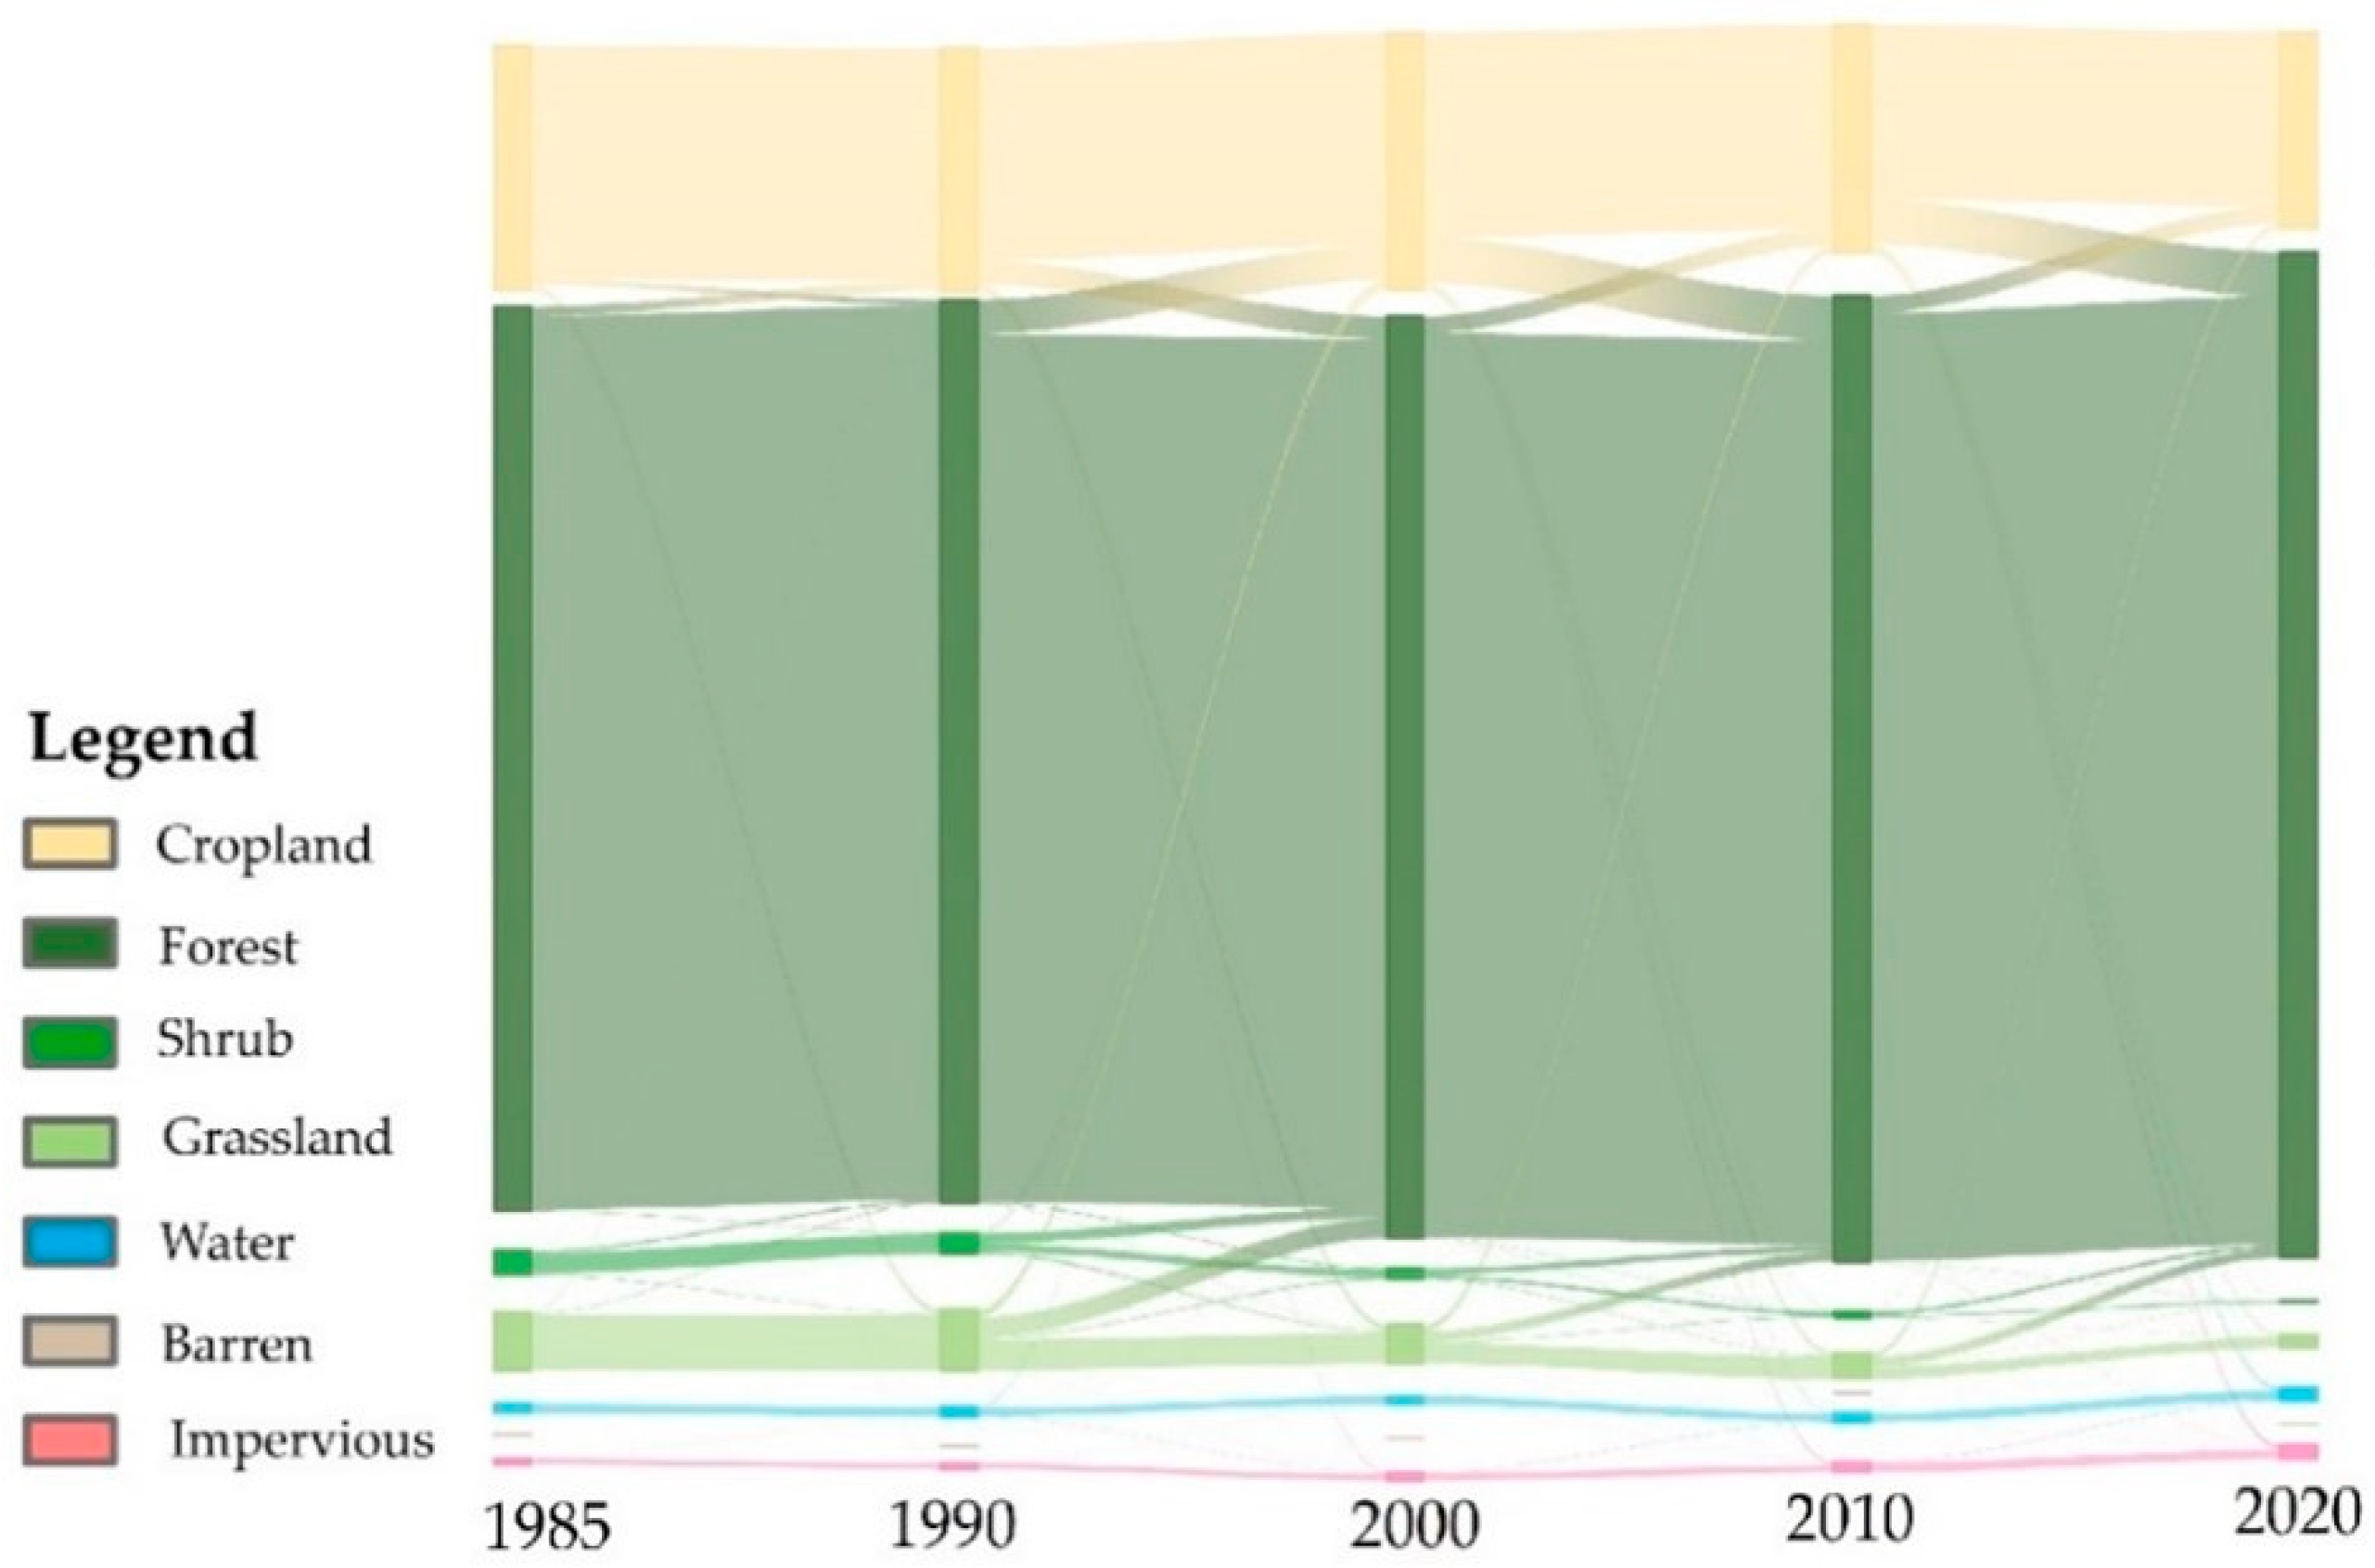
From 1985 to 20220, the land use change in the water source region of the middle route of South-to-North Water Diversion Project was obvious, and the main land type in the region was forest and cultivated land [57]. In 1985, 1990, 2000, 2010 and 2020, the proportion of forest area was 72.62%, 72.56%, 74.02%, 77.56% and 80.74%, respectively, showing a gradually increasing trend. The proportion of cultivated land area was 19.60%, 19.57%, 20.65%, 18.30% and 15.85%, showing a trend of rising first and then falling, which was mainly related to the implementation of the project of returning cropland to forest since 1999. The built-up areas such as cities and towns are also expanding, with the proportion rising from 0.48% in 1985 to 1.13% in 2020, indicating that the impact of human activities is still gradually expanding. Finally, influenced by the South-to-North Water Transfer Impounding Project, the water area in the region increased significantly, decreasing from 0.71% in 1985 to 0.62% in 2000 and increasing rapidly after the impounding project began to increase to 0.99% in 2020.
(2)
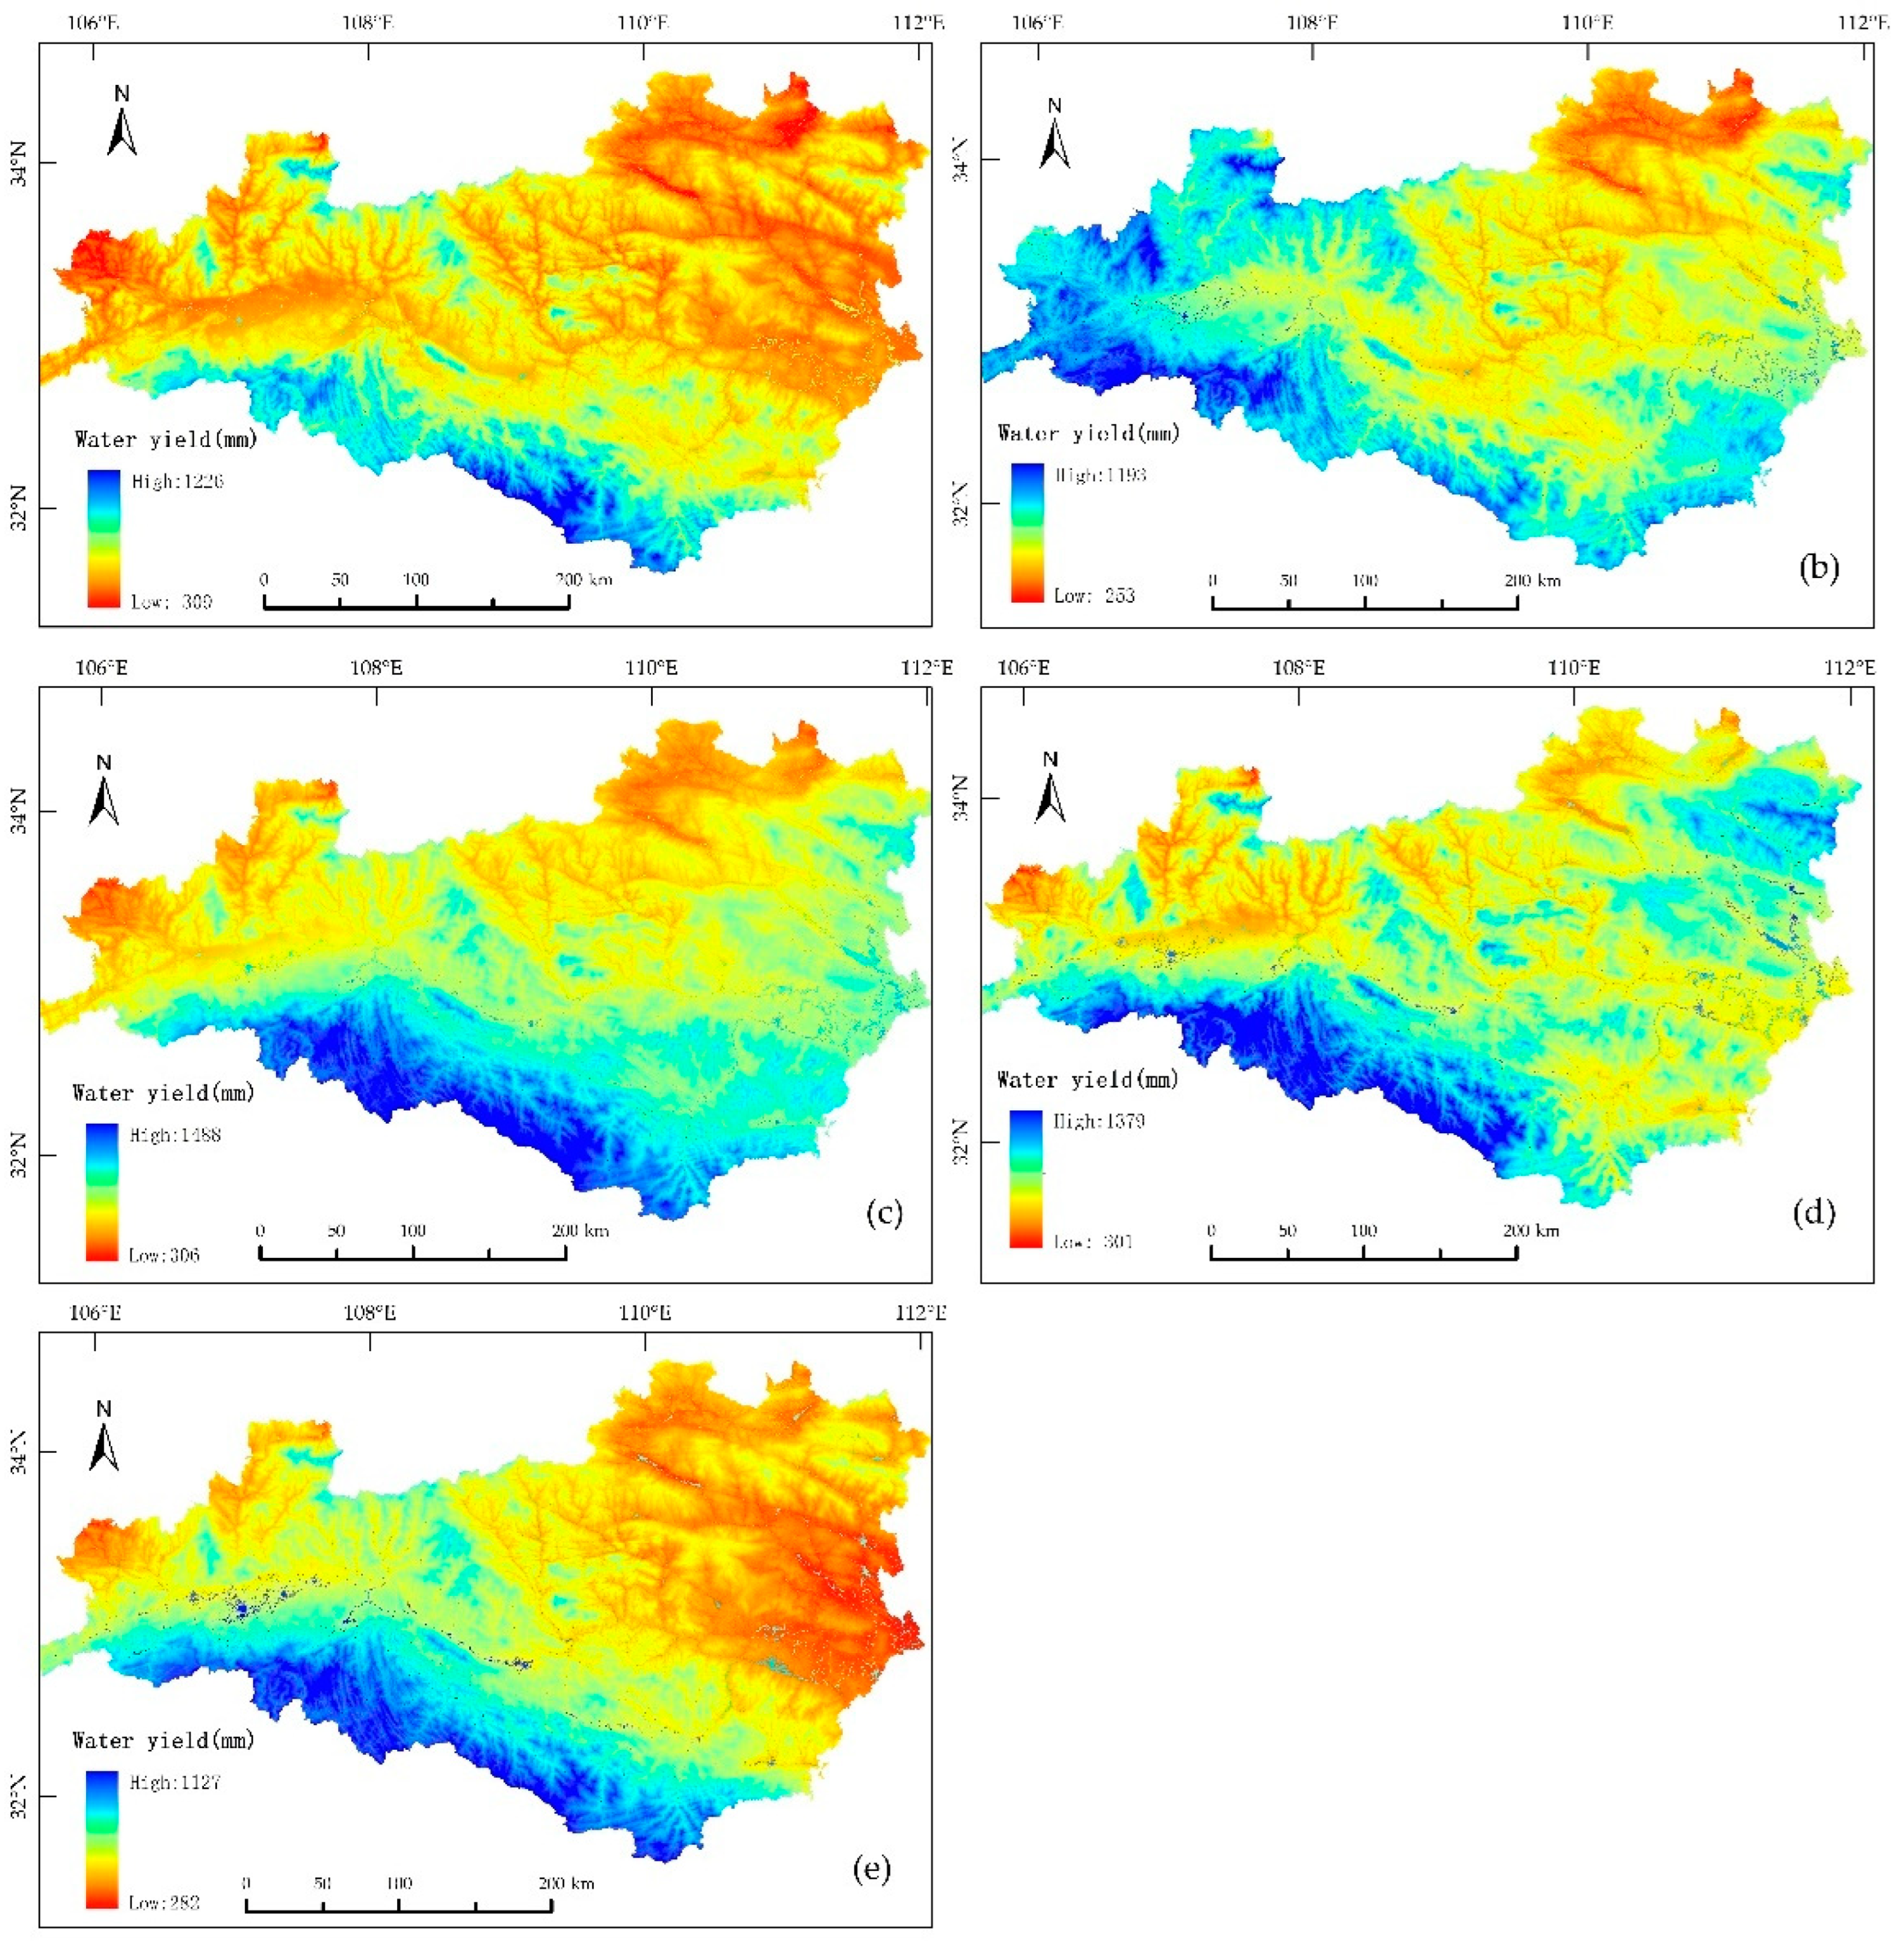
In 1985, 1990, 2000, 2010 and 2020, the annual average water yields of water source areas were 671.25 billion m3, 635.56 billion m3, 804.48 billion m3, 750.08 billion m3 and 56.820 billion m3, respectively. The spatial pattern of water yield in different periods is basically consistent, with higher water yields in the west and south and lower water yields in the middle, north and east.
(3)
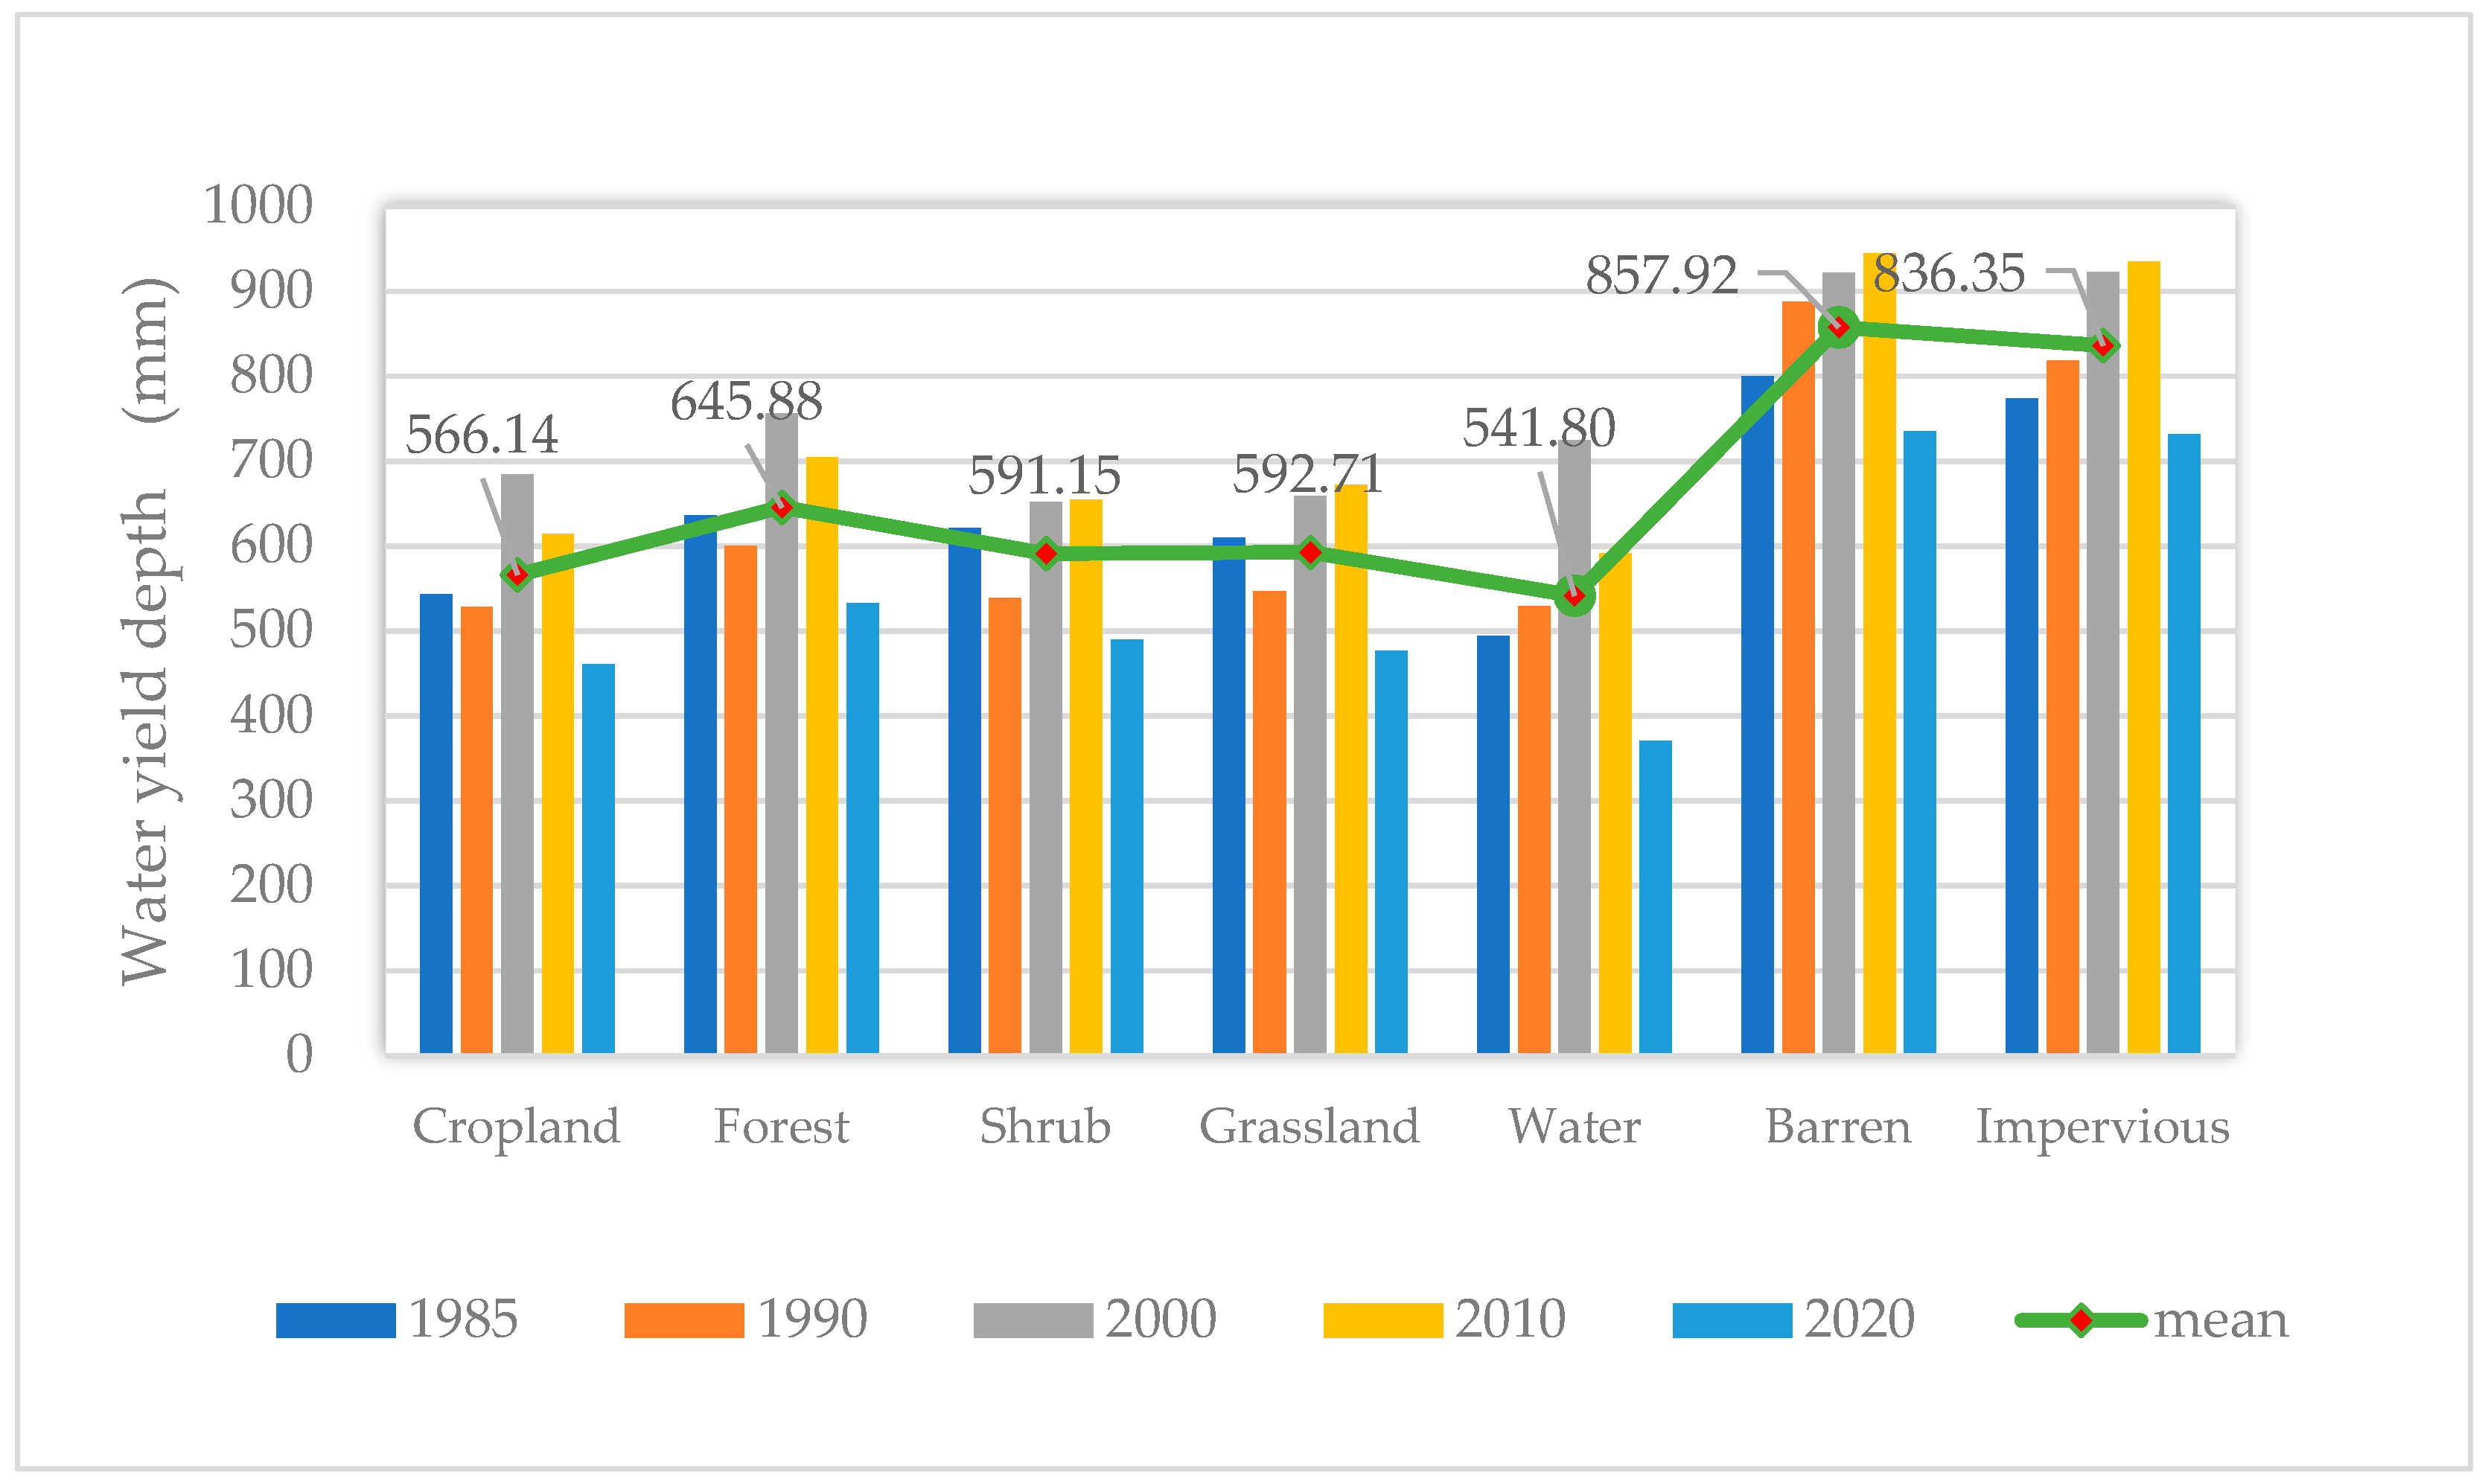
The land with the strongest water-producing capacity in the water source region was bare land, urban built-up area and forest, with average water-producing depths of 857 mm, 836 mm and 645 mm, respectively. The water body was the weakest with an average water-producing depth of 541 mm. Forest and arable land have always been the main contributors to regional water yield. By 2020, the water yield of forest and arable land will reach 82% and 14%, respectively, in the water source region.
(4)
From 1990 to 2010, the contribution rates of precipitation change and land use change to water yield in the water source region were 99% and 1%, respectively, indicating that precipitation change had a more significant impact on water yield, while land use change had a lesser impact.

4.2. Policy Reasons for Land Use Change

From 1985 to 2020, the main characteristics of land use/cover change in the water source region of the middle route of the South-to-North Water Diversion Project are that the area of forest, water body and urban built-up area expands significantly, while the area of cultivated land and wasteland decreases. In the whole region, especially in Hanzhong basin and Ankang Basin, the urban built-up area and cultivated land have increased significantly. In the area around Danjiangkou Reservoir, the cultivated land and grassland have turned into water body. In Daba Mountain and Qinling mountain, the cultivated land around towns has turned into forest. Among these changes, the growth of cultivated land mainly depends on the large increase of population and the rapid development of regional economy, resulting in a surge in the demand for land [59,71,72].
In addition, the ecological environment pattern of the water source region has changed greatly under the driving effect of returning cropland to forest and relevant national policies. Since 2000, the state has continued to strengthen its efforts to protect the ecological environment, carrying out the “Natural Forest Protection Project”, “Returning cropland to Forest and grassland” and “Returning cropland to lakes”, thus increasing the intensity of nature protection in water source areas [73,74,75]. Around 2000, state clearly put forward the guiding ideology, objectives and tasks of ecological protection, demand across the country to carry out to determine the ecological function regionalization, ensuring the sustainable operation of social economy, in 2011, the State Council to the zoning for water conservation and soil and water conservation of national key ecological function areas, restricted areas and water sources in the area to set a development area. This is essential for the continued expansion of forest and water areas in the region.
The results show that the land use conversion in water source region is mainly from cultivated land to grassland and forest, and from unused land to urban construction land. It is proved that “natural forest protection project”, “returning cropland to forest and grassland project” and “returning cropland to lake project” have played a positive role in the ecological environment protection of the water source region, and also provided sustainable guarantee for the forest water yield. However, the continuous expansion of construction land also needs vigilance. With the continuous development of urbanization and industrialization, the land structure in the water source area will become the main problem affecting the ecological environment and hindering regional stability and development.

4.3. Suggestions on Protection of Water Producing Function in Water Source Area

Since 1985, the population of the water source area of the middle route of the South-to-North Water Diversion Project has grown rapidly and the economy has developed rapidly. ARCGIS software (Version, 10.6, Environmental Systems Research Institute, Redlands, USA) analysis shows that a large number of forests, shrubs and grasslands have been reclaimed and developed, and the fragmentation degree of the forest inside the water source area has intensified [57,75,76]. After 2000, cropland and grassland decreased, but settlements increased. Although rainfall was the main influencing factor of regional water yield, the effects of human disturbance on vegetation status, water conservation and water yield showed an increasing trend from 1985 to 2020. The water producing function of the water source area needs to be further improved. At the macro level, the water source region needs to strictly control the red line of cultivated land, rationally plan and use land according to law and the government should timely promulgate targeted policies and regulations and supervise their implementation according to law. They should also continue to pay attention to vegetation restoration, improve water conservation and soil conservation services within the region and reduce the spatial differences in ecosystem services within the water source region. Due to the unbalanced and inadequate economic development in the water source area due to the protection of water yield function, the harmony and balance between regional ecological protection and economic development can be realized through ecological compensation mechanism to improve the living standard of the people in the mountainous areas [77]. We should increase the intensity of ecological compensation in financial transfer payment, actively explore the market-based ecological compensation model, and constantly improve the comprehensive benefits of ecological compensation.

5. Conclusions

In this paper, by using the GEE cloud platform, spectrum, texture and topographic factors in the water source area are taken as the input features of the classifier to realize the intelligent recognition and classification of land cover information, complete the change analysis of land use pattern in the water source area from 1985 to 2020, and make the land use transfer matrix. The effects of precipitation and land use type transformation on water yield in water source region were analyzed. The specific countermeasures and methods to protect the water producing function of the water source area are also put forward. However, the annual and seasonal variations in water yield were ignored in the study, and there was no further analysis of water yield in the sub-basins such as the Danjiang River, Hanjiang River and Duhe River, only the analysis of the overall water yield and water yield depth in the water source region. The above reasons also weaken the influence of spatial difference of land use change on water yield. In addition, due to the influence of policies, there have been many large-scale conversions between land use types in the water source area. The conversion between construction land, arable land and forest is more frequent. This also results in increases or decreases in water yield being offset to some extent. For example, increasing construction land usually increases water yield, while increasing forests and decreasing cropland reduces water yield. However, the conversion among the three will make the impact of land use change on water yield not significant. Finally, in the process of using the InVEST model to produce water in this paper, the input data are from a wide range of sources, and the PAWC, precipitation, DEM and plant evapotranspiration coefficient lack unified standards and applicability evaluation, leading to a certain degree of uncertainty in the analysis of water yield. By analyzing the spatial-temporal pattern evolution of land use, land structure change and ecological environment quality, the research results can provide a scientific basis for the scientific and rational promotion of the project of converting cropland to forest (grassland) and sustainable development of the ecological environment in the water source area of the middle route of the South-to-North Water Diversion Project. In addition, this study can provide reference for regional social, economic and environmental collaborative development decisions. The determination of the Zhang coefficient is also lacking a more accurate test, and the actual verification of model simulation accuracy will be further strengthened in our future work.

Author Contributions

Conceptualization, P.P. and P.N.; methodology, P.N.; software, P.N.; validation, P.N. and E.Z.; investigation, P.N.; resources, E.Z.; data curation, P.N.; writing—original draft preparation, P.N. and Y.F.; writing—review and editing, P.N.; visualization, P.N. and E.Z.; investigation, P.N.; resources, E.Z.; data curation, P.N. and Y.F.; Writing Supervision, P.P.; All authors have read and agreed to the published version of the manuscript.

Funding

This research was funded by Nanyang Science and Technology Project, grant number: 2021KJGG204.

Institutional Review Board Statement

Not applicable.

Informed Consent Statement

Not applicable.

Data Availability Statement

Not applicable.

Acknowledgments

The authors sincerely thank the anonymous reviewers and the editors for their valuable comments and constructive suggestions.

Conflicts of Interest

The authors declare no conflict of interest.

References

  1. Xiang, H.; Zhang, J.; Mao, D.; Wang, Z.; Qiu, Z.; Yan, H. Identifying spatial similarities and mismatches between supply and demand of ecosystem services for sustainable Northeast China. Ecol. Indic. 2022, 134, 108501. [Google Scholar] [CrossRef]
  2. Wang, Y.; Zhao, J.; Fu, J.; Wei, W. Effects of the Grain for Green Program on the water ecosystem services in an arid area of China-Using the Shiyang River Basin as an example. Ecol. Indic. 2019, 104, 659–668. [Google Scholar] [CrossRef]
  3. Sayre, S.S.; Taraz, V. Groundwater depletion in India: Social losses from costly well deepening. J. Environ. Econ. Manag. 2019, 93, 85–100. [Google Scholar] [CrossRef]
  4. Peng, J.; Wang, A.; Luo, L.; Liu, Y.; Li, H.; Hu, Y.; Meersmans, J.; Wu, J. Spatial identification of conservation priority areas for urban ecological land: An approach based on water ecosystem services. Land Degrad. Dev. 2019, 30, 683–694. [Google Scholar] [CrossRef]
  5. Zhang, K.; Ruben, G.B.; Li, X.; Li, Z.; Yu, Z.; Xia, J.; Dong, Z. A comprehensive assessment framework for quantifying climatic and anthropogenic contributions to streamflow changes: A case study in a typical semi-arid North China basin. Environ. Model. Softw. 2020, 128, 104704. [Google Scholar] [CrossRef]
  6. Xu, H.; Ren, Y.; Zheng, H.; Ouyang, Z.; Jiang, B. Analysis of Runoff Trends and Drivers in the Haihe River Basin, China. Int. J. Environ. Res. Public Health 2020, 17, 1577. [Google Scholar] [CrossRef] [PubMed]
  7. Xu, F.; Jia, Y.; Niu, C.; Sobkowiak, L.; Zhao, L. Evaluating spatial differences in the contributions of climate variability and human activity to runoff change in the Haihe River basin. Hydrol. Sci. J. 2021, 66, 2060–2073. [Google Scholar] [CrossRef]
  8. Xin, Z.; Li, Y.; Zhang, L.; Ding, W.; Ye, L.; Wu, J.; Zhang, C. Quantifying the relative contribution of climate and human impacts on seasonal streamflow. J. Hydrol. 2019, 574, 936–945. [Google Scholar] [CrossRef]
  9. Wan, S.; Zhang, J.; Wang, G.; Zhang, L.; Cheng, L.; Elmahdi, A.; Liu, Y. Evaluation of changes in streamflow and the underlying causes: A perspective of an upstream catchment in Haihe River basin, China. J. Water Clim. Chang. 2020, 11, 241–257. [Google Scholar] [CrossRef]
  10. Sun, Z.; Li, S.; Zhu, K.; Yang, T.; Shao, C. Does actual cropland water consumption change with evaporation potential in the Lower Yellow River? Agric. Ecosyst. Environ. 2021, 316, 107468. [Google Scholar] [CrossRef]
  11. Mo, X.; Guo, R.; Liu, S.; Lin, Z.; Hu, S. Impacts of climate change on crop evapotranspiration with ensemble GCM projections in the North China Plain. Clim. Chang. 2013, 120, 299–312. [Google Scholar] [CrossRef]
  12. Mo, X.; Chen, X.; Hu, S.; Liu, S.; Xia, J. Attributing regional trends of evapotranspiration and gross primary productivity with remote sensing: A case study in the North China Plain. Hydrol. Earth Syst. Sci. 2017, 21, 295–310. [Google Scholar] [CrossRef]
  13. Li, Y.; He, D.; Li, X.; Zhang, Y.; Yang, L. Contributions of Climate Variability and Human Activities to Runoff Changes in the Upper Catchment of the Red River Basin, China. Water 2016, 8, 414. [Google Scholar] [CrossRef]
  14. Xi, Y.; Peng, S.; Ducharne, A.; Ciais, P.; Gumbricht, T.; Jimenez, C.; Poulter, B.; Prigent, C.; Qiu, C.; Saunois, M.; et al. Gridded maps of wetlands dynamics over mid-low latitudes for 1980–2020 based on TOPMODEL. Sci. Data 2022, 9, 347. [Google Scholar] [CrossRef]
  15. Wang, S.; Zhang, Z.; Sun, G.; Strauss, P.; Guo, J.; Yao, A.; Tang, Y. Assessing Hydrological Impacts of Changes in Land Use and Precipitation in Chaohe Watershed Using MIKESHE Model. J. Ecol. Rural Environ. 2012, 28, 320–325. [Google Scholar]
  16. Frederiksen, R.R.; Molina-Navarro, E. The importance of subsurface drainage on model performance and water balance in an agricultural catchment using SWAT and SWAT-MODFLOW. Agric. Water Manag. 2021, 255, 107058. [Google Scholar] [CrossRef]
  17. Fan, M.; Shibata, H. Simulation of watershed hydrology and stream water quality under land use and climate change scenarios in Teshio River watershed, northern Japan. Ecol. Indic. 2015, 50, 79–89. [Google Scholar] [CrossRef]
  18. Al-Khafaji, M.; Saeed, F.H.; Al-Ansari, N. The Interactive Impact of Land Cover and DEM Resolution on the Accuracy of Computed Streamflow Using the SWAT Model. Water Air Soil Pollut. 2020, 231, 416. [Google Scholar] [CrossRef]
  19. Rahman, K.U.; Quoc, B.P.; Jadoon, K.Z.; Shahid, M.; Kushwaha, D.P.; Duan, Z.; Mohammadi, B.; Khedher, K.M.; Duong, T.A. Comparison of machine learning and process-based SWAT model in simulating streamflow in the Upper Indus Basin. Appl. Water Sci. 2022, 12, 178. [Google Scholar] [CrossRef]
  20. Yu, Y.; Sun, X.; Wang, J.; Zhang, J. Using InVEST to evaluate water yield services in Shangri-La, Northwestern Yunnan, China. Peerj 2022, 10, e12804. [Google Scholar] [CrossRef]
  21. Yang, D.; Liu, W.; Tang, L.; Chen, L.; Li, X.; Xu, X. Estimation of water provision service for monsoon catchments of South China: Applicability of the InVEST model. Landsc. Urban Plan. 2019, 182, 133–143. [Google Scholar] [CrossRef]
  22. Li, M.; Liang, D.; Xia, J.; Song, J.; Cheng, D.; Wu, J.; Cao, Y.; Sun, H.; Li, Q. Evaluation of water conservation function of Danjiang River Basin in Qinling Mountains, China based on InVEST model. J. Environ. Manag. 2021, 286, 112212. [Google Scholar] [CrossRef] [PubMed]
  23. He, C.; Zhang, D.; Huang, Q.; Zhao, Y. Assessing the potential impacts of urban expansion on regional carbon storage by linking the LUSD-urban and InVEST models. Environ. Model. Softw. 2016, 75, 44–58. [Google Scholar] [CrossRef]
  24. Wu, C.; Qiu, D.; Gao, P.; Mu, X.; Zhao, G. Application of the InVEST model for assessing water yield and its response to precipitation and land use in the Weihe River Basin, China. J. Arid Land 2022, 14, 426–440. [Google Scholar] [CrossRef]
  25. Anjinho, P.D.S.; Barbosa, M.A.G.A.; Mauad, F.F. Evaluation of InVEST’s Water Ecosystem Service Models in a Brazilian Subtropical Basin. Water 2022, 14, 1559. [Google Scholar] [CrossRef]
  26. Kuang, W. Simulating dynamic urban expansion at regional scale in Beijing-Tianjin-Tangshan Metropolitan Area. J. Geogr. Sci. 2011, 21, 317–330. [Google Scholar] [CrossRef]
  27. Cademus, R.; Escobedo, F.; McLaughlin, D.; Abd-Elrahman, A. Analyzing Trade-Offs, Synergies, and Drivers among Timber Production, Carbon Sequestration, and Water Yield in Pinus elliotii Forests in Southeastern USA. Forests 2014, 5, 1409–1431. [Google Scholar] [CrossRef]
  28. Juksu, K.; Liu, Y.; Zhao, J.; Yao, L.; Sarin, C.; Sreesai, S.; Klomjek, P.; Traitangwong, A.; Ying, G. Emerging contaminants in aquatic environments and coastal waters affected by urban wastewater discharge in Thailand: An ecological risk perspective. Ecotoxicol. Environ. Saf. 2020, 204, 110952. [Google Scholar] [CrossRef]
  29. Pan, T.; Wu, S.; Dai, E.; Liu, Y. Spatiotemporal variation of water source supply service in Three Rivers Source Area of China based on InVEST model. Yingyong Shengtai Xuebao 2013, 24, 183–189. [Google Scholar]
  30. Moreira, M.; Fonseca, C.; Vergilio, M.; Calado, H.; Gil, A. Spatial assessment assessment of habitat conservation status in a Macaronesian island based on the InVEST model: A case study of Pico Island (Azores, Portugal). Land Use Policy 2018, 78, 637–649. [Google Scholar] [CrossRef]
  31. Gao, J.; Li, F.; Gao, H.; Zhou, C.; Zhang, X. The impact of land-use change on water-related ecosystem services: A study of the Guishui River Basin, Beijing, China. J. Clean Prod. 2017, 163, S148–S155. [Google Scholar] [CrossRef]
  32. Bao, Z.; Zhang, J.; Wang, G.; Chen, Q.; Guan, T.; Yan, X.; Liu, C.; Liu, J.; Wang, J. The impact of climate variability and land use/cover change on the water balance in the Middle Yellow River Basin, China. J. Hydrol. 2019, 577, 124343. [Google Scholar] [CrossRef]
  33. Yang, S.; Zhao, W.; Liu, Y.; Wang, S.; Wang, J.; Zhai, R. Influence of land use change on the ecosystem service trade-offs in the ecological restoration area: Dynamics and scenarios in the Yanhe watershed, China. Sci. Total Environ. 2018, 644, 556–566. [Google Scholar] [CrossRef] [PubMed]
  34. Zhou, S.; Chang, J.; Hu, T.; Luo, P.; Zhou, H. Spatiotemporal Variations of Land Use and Landscape Ecological Risk in a Resource-Based City, from Rapid Development to Recession. Pol. J. Environ. Stud. 2020, 29, 475–490. [Google Scholar] [CrossRef]
  35. Wang, H.; Qi, Y.; Lian, X.; Zhang, J.; Yang, R.; Zhang, M. Effects of climate change and land use/cover change on the volume of the Qinghai Lake in China. J. Arid Land 2022, 14, 245–261. [Google Scholar] [CrossRef]
  36. Wang, C.; Jiang, Q.; Shao, Y.; Sun, S.; Xiao, L.; Guo, J. Ecological environment assessment based on land use simulation: A case study in the Heihe River Basin. Sci. Total Environ. 2019, 697, 133928. [Google Scholar] [CrossRef]
  37. He, C.; Li, J.; Zhang, X.; Liu, Z.; Zhang, D. Will rapid urban expansion in, the drylands of northern China continue: A scenario analysis based on the Land Use Scenario Dynamics-urban model and the Shared Socioeconomic Pathways. J. Clean Prod. 2017, 165, 57–69. [Google Scholar] [CrossRef]
  38. Shahid, M.; Rahman, K.U.; Haider, S.; Gabriel, H.F.; Khan, A.J.; Quoc, B.P.; Pande, C.B.; Nguyen, T.T.L.; Duong, T.A. Quantitative assessment of regional land use and climate change impact on runoff across Gilgit watershed. Environ. Earth Sci. 2021, 80, 743. [Google Scholar] [CrossRef]
  39. Zhang, Z.; Li, X. The main problems and corresponding measures to water resource area of the Middle Route of Chinese South to North Water Transfer Project. J. Cent. China Norm. Univ. (Nat. Sci.) 2004, 38, 510–514. [Google Scholar]
  40. Wang, L.S.; Ma, C. A study on the environmental geology of the Middle Route Project of the South-North water transfer. Eng. Geol. 1999, 51, 153–165. [Google Scholar] [CrossRef]
  41. Yu, X.; Liao, W.; Liu, X. Spatio-Temporal Patterns of Water Yield and Its Influencing Factors in the Han River Basin. Resour. Environ. Yangtze Basin 2022, 31, 73–82. [Google Scholar]
  42. Zhang, X.; Duan, B.; He, S.; Wu, X.; Zhao, D. Assessment of the value of ecosystem services in water sources of the South-North Water Diversion Central Project: The case of Dengzhou City, Henan Province. Environ. Monit Assess. 2021, 193, 670. [Google Scholar] [CrossRef] [PubMed]
  43. Shen, Z.; Zhang, Q.; Yue, C.; Zhao, J.; Hu, Z.; Lv, N.; Tang, Y. The Spatial Pattern of Land Use/Land Cover in the Water Supplying Area of the Middle-Route of the South-to-North Water Diversion. Acta Geogr. Sin. 2006, 61, 633–644. [Google Scholar]
  44. Gorelick, N.; Hancher, M.; Dixon, M.; Ilyushchenko, S.; Thau, D.; Moore, R. Google Earth Engine: Planetary-scale geospatial analysis for everyone. Remote Sens. Environ. 2017, 202, 18–27. [Google Scholar] [CrossRef]
  45. Patel, N.N.; Angiuli, E.; Gamba, P.; Gaughan, A.; Lisini, G.; Stevens, F.R.; Tatem, A.J.; Trianni, G. Multitemporal settlement and population mapping from Landsat using Google Earth Engine. Int. J. Appl. Earth Obs. 2015, 35, 199–208. [Google Scholar] [CrossRef]
  46. Youssefi, F.; Zoej, M.J.; Hanafi-Bojd, A.A.; Dariane, A.B.; Khaki, M.; Safdarinezhad, A.; Ghaderpour, E. Temporal Monitoring and Predicting of the Abundance of Malaria Vectors Using Time Series Analysis of Remote Sensing Data through Google Earth Engine. Sensors 2022, 22, 1942. [Google Scholar] [CrossRef]
  47. Wang, C.; Jia, M.; Chen, N.; Wang, W. Long-Term Surface Water Dynamics Analysis Based on Landsat Imagery and the Google Earth Engine Platform: A Case Study in the Middle Yangtze River Basin. Remote Sens. 2018, 10, 1635. [Google Scholar] [CrossRef]
  48. Taheri Dehkordi, A.; Valadan Zoej, M.J.; Ghasemi, H.; Ghaderpour, E.; Hassan, Q.K. A New Clustering Method to Generate Training Samples for Supervised Monitoring of Long-Term Water Surface Dynamics Using Landsat Data through Google Earth Engine. Sustainability 2022, 14, 8046. [Google Scholar] [CrossRef]
  49. Xiong, J.; Thenkabail, P.S.; Tilton, J.C.; Gumma, M.K.; Teluguntla, P.; Oliphant, A.; Congalton, R.G.; Yadav, K.; Gorelick, N. Nominal 30-m Cropland Extent Map of Continental Africa by Integrating Pixel-Based and Object-Based Algorithms Using Sentinel-2 and Landsat-8 Data on Google Earth Engine. Remote Sens. 2017, 9, 1065. [Google Scholar] [CrossRef]
  50. Liu, X.; Hu, G.; Chen, Y.; Li, X.; Xu, X.; Li, S.; Pei, F.; Wang, S. High-resolution multi-temporal mapping of global urban land using Landsat images based on the Google Earth Engine Platform. Remote Sens. Environ. 2018, 209, 227–239. [Google Scholar] [CrossRef]
  51. Huang, X.; Li, J.; Yang, J.; Zhang, Z.; Li, D.; Liu, X. 30 m global impervious surface area dynamics and urban expansion pattern observed by Landsat satellites: From 1972 to 2019. Sci. China Earth Sci. 2021, 64, 1922–1933. [Google Scholar] [CrossRef]
  52. Yang, J.; Huang, X. The 30 m annual land cover dataset and its dynamics in China from 1990 to 2019. Earth Syst. Sci. Data 2021, 13, 3907–3925. [Google Scholar] [CrossRef]
  53. Fritz, S.; McCallum, I.; Schill, C.; Perger, C.; Grillmayer, R.; Achard, F.; Kraxner, F.; Obersteiner, M. Geo-Wiki.Org: The Use of Crowdsourcing to Improve Global Land Cover. Remote Sens. 2009, 1, 345–354. [Google Scholar] [CrossRef]
  54. Scepan, J. Thematic validation of high-resolution global land-cover data sets. Photogramm. Eng. Remote Sens. 1999, 65, 1051–1060. [Google Scholar]
  55. Pena-Barragan, J.M.; Ngugi, M.K.; Plant, R.E.; Six, J. Object-based crop identification using multiple vegetation indices, textural features and crop phenology. Remote Sens. Environ. 2011, 115, 1301–1316. [Google Scholar] [CrossRef]
  56. Foody, G.M. Status of land cover classification accuracy assessment. Remote Sens. Environ. 2002, 80, 185–201. [Google Scholar] [CrossRef]
  57. Teluguntla, P.; Thenkabail, P.S.; Oliphant, A.; Xiong, J.; Gumma, M.K.; Congalton, R.G.; Yadav, K.; Huete, A. A 30-m landsat-derived cropland extent product of Australia and China using random forest machine learning algorithm on Google Earth Engine cloud computing platform. ISPRS J. Photogramm. Remote Sens. 2018, 144, 325–340. [Google Scholar] [CrossRef]
  58. Shelestov, A.; Lavreniuk, M.; Kussul, N.; Novikov, A.; Skakun, S. Exploring Google Earth Engine Platform for Big Data Processing: Classification of Multi-Temporal Satellite Imagery for Crop Mapping. Front. Earth Sci. 2017, 5, 1–10. [Google Scholar] [CrossRef]
  59. Souza, C.M., Jr.; Shimbo, J.Z.; Rosa, M.R.; Parente, L.L.; Alencar, A.A.; Rudorff, B.F.T.; Hasenack, H.; Matsumoto, M.; Ferreira, L.G.; Souza-Filho, P.W.M.; et al. Reconstructing Three Decades of Land Use and Land Cover Changes in Brazilian Biomes with Landsat Archive and Earth Engine. Remote Sens. 2020, 12, 2735. [Google Scholar] [CrossRef]
  60. Scordo, F.; Lavender, T.M.; Seitz, C.; Perillo, V.L.; Rusak, J.A.; Cintia Piccolo, M.; Perillo, G.M.E. Modeling Water Yield: Assessing the Role of Site and Region-Specific Attributes in Determining Model Performance of the InVEST Seasonal Water Yield Model. Water 2018, 10, 1496. [Google Scholar] [CrossRef]
  61. Donohue, R.J.; Roderick, M.L.; McVicar, T.R. Roots, storms and soil pores: Incorporating key ecohydrological processes into Budyko’s hydrological model. J. Hydrol. 2012, 436, 35–50. [Google Scholar] [CrossRef]
  62. Zhang, L.; Dawes, W.R.; Walker, G.R. Response of mean annual evapotranspiration to vegetation changes at catchment scale. Water Resour. Res. 2001, 37, 701–708. [Google Scholar] [CrossRef]
  63. Zhang, Z.; Lin, H.; Hao, Z.; Pan, W. Research on safety diagnosis for water environment based on gray relational analysis—A case study of taizhou bay. J. Environ. Prot. Ecol. 2018, 19, 70–78. [Google Scholar]
  64. Li, J.; Ma, R.; Cao, Z.; Xue, K.; Xiong, J.; Hu, M.; Feng, X. Satellite Detection of Surface Water Extent: A Review of Methodology. Water 2022, 14, 1148. [Google Scholar] [CrossRef]
  65. Fan, M.; Shibata, H.; Wang, Q. Optimal conservation planning of multiple hydrological ecosystem services under land use and climate changes in Teshio river watershed, northernmost of Japan. Ecol. Indic. 2016, 62, 1–13. [Google Scholar] [CrossRef]
  66. Zhang, D.; Huang, Q.; He, C.; Wu, J. Impacts of urban expansion on ecosystem services in the Beijing-Tianjin-Hebei urban agglomeration, China: A scenario analysis based on the Shared Socioeconomic Pathways. Resour. Conserv. Recycl. 2017, 125, 115–130. [Google Scholar] [CrossRef]
  67. Shan, S. Effects of Increasing Height of Danjiangkou Reservoir Dam to Economy Sustainable Development of Ambient Areas. Irrig. Drain. 2002, 21, 61–63. [Google Scholar]
  68. Pessacg, N.; Flaherty, S.; Brandizi, L.; Solman, S.; Pascual, M. Getting water right: A case study in water yield modelling based on precipitation data. Sci. Total Environ. 2015, 537, 225–234. [Google Scholar] [CrossRef]
  69. Li, S.; Yang, H.; Lacayo, M.; Liu, J.; Lei, G. Impacts of Land-Use and Land-Cover Changes on Water Yield: A Case Study in Jing-Jin-Ji, China. Sustainability 2018, 10, 960. [Google Scholar] [CrossRef]
  70. Hamel, P.; Guswa, A.J. Uncertainty analysis of a spatially explicit annual water-balance model: Case study of the Cape Fear basin, North Carolina. Hydrol. Earth Syst. Sci. 2015, 19, 839–853. [Google Scholar] [CrossRef]
  71. Van Asselen, S.; Verburg, P.H. Land cover change or land-use intensification: Simulating land system change with a global-scale land change model. Glob. Chang. Biol. 2013, 19, 3648–3667. [Google Scholar] [CrossRef] [PubMed]
  72. Chen, L.; Huang, Z.; Gong, J.; Fu, B.; Huang, Y. The effect of land cover/vegetation on soil water dynamic in the hilly area of the loess plateau, China. Catena 2007, 70, 200–208. [Google Scholar] [CrossRef]
  73. Zagas, T.D.; Raptis, D.I.; Zagas, D.T. Identifying and mapping the protective forests of southeast Mt. Olympus as a tool for sustainable ecological and silvicultural planning, in a multi-purpose forest management framework. Ecol. Eng. 2011, 37, 286–293. [Google Scholar] [CrossRef]
  74. Wolfslehner, B.; Vacik, H. Evaluating sustainable forest management strategies with the Analytic Network Process in a Pressure-State-Response framework. J. Environ. Manag. 2008, 88, 1–10. [Google Scholar] [CrossRef] [PubMed]
  75. Cao, S.; Zhang, J.; Chen, L.; Zhao, T. Ecosystem water imbalances created during ecological restoration by afforestation in China, and lessons for other developing countries. J. Environ. Manag. 2016, 183, 843–849. [Google Scholar] [CrossRef]
  76. Miao, S.; Qiao, Y.; Zhang, F. Conversion of Cropland to Grassland and Forest Mitigates Global Warming Potential in Northeast China. Pol. J. Environ. Stud. 2015, 24, 1195–1203. [Google Scholar] [CrossRef]
  77. Quoc, B.P.; Kumar, M.; Di Nunno, F.; Elbeltagi, A.; Granata, F.; Islam, A.R.M.T.; Talukdar, S.; Nguyen, X.C.; Ahmed, A.N.; Duong, T.A. Groundwater level prediction using machine learning algorithms in a drought-prone area. Neural Comput. Appl. 2022, 34, 10751–10773. [Google Scholar] [CrossRef]
Figure 1. Sketch map of the water source area of the middle line of the South-to-North Water Diversion Project, China. The map is from the Chinese Standard Map (http://bzdt.ch.mnr.gov.cn/GS (accessed on 19 June 2022) (2019) 1822).
Water 14 02535 g001
Figure 2. Monthly frequency charts of Landsat5, Landsat7 and Landsat8 were observed in GEE.
Water 14 02535 g002
Figure 3. Flowchart of water yield performed in this study.
Water 14 02535 g003
Figure 4. Map of land use change in water source area: (a~e) are land use and land cover charts in 1985, 1990, 2000, 2010 and 2020, respectively.
Water 14 02535 g004
Figure 5. Transfer of land types in water source region from 1985 to 2020.
Water 14 02535 g005
Figure 6. The spatial pattern distribution of water producing depth in the water source region during 1985–2020. (a~e) represent the distribution of water yield in the water source region in 1985, 1990, 2000, 2010 and 2020, respectively.
Water 14 02535 g006
Figure 7. Annual water yield depth of different land types.
Water 14 02535 g007
Table 1. Image classification accuracy and Kappa index.
Land TypesCroplandForestShrubGrasslandWaterBarrenImpervious
Classification Accuracy (%)86.185.483.284.586.882.184.7
Kappa index0.87
Table 2. InVest model data structure and data information used in this paper.
VariableFormatParameter
Land use/land cover
(LULC)
tifThe spatial resolution: 30 m
Quantity: 5 issues in 1985, 1990, 2000, 2010 and 2020
(https://code.earthengine.google.com, accessed 3 April 20222)
PrecipitationtifThe spatial resolution: 30 m, Units: mm
Quantity: 5 issues in 1985, 1990, 2000, 2010 and 2020
(http://data.cma.cn/user/toLogin.html, accessed 19 April 2022)
Spatial distribution of temperaturetifThe spatial resolution: 30 m, Units: °C
Quantity: 5 issues in 1985, 1990, 2000, 2010 and 2020
(http://data.cma.cn/user/toLogin.html, accessed 10 June 2022)
Map of evapotranspiration valuestifThe spatial resolution: 30 m, Units: mm
Quantity: 5 issues in 1985, 1990, 2000, 2010 and 2020
(http://data.cma.cn/user/toLogin.html, accessed 12 June 2022)
Map of root restricting layer depthtifThe spatial resolution: 30 m, Units: mm
(HWSD v1.2, http://data.tpdc.ac.cn/zh-hans/data/844010ba-d359-4020-bf76-2b58806f9205/, accessed 9 May 2022)
Map of plant available water content (PAWC)tifThe spatial resolution: 30 m, Units: %
(HWSD v1.2, http://data.tpdc.ac.cn/zh-hans/data/844010ba-d359-4020-bf76-2b58806f9205/, accessed 6 June 2022)
Maximum root depth for plants in this LULC classxlsxUnits: mm (https://naturalcapitalproject.stanford.edu/, accessed 3 June 2022)
Evapotranspiration coefficient of different LULC classxlsxdimensionless (https://naturalcapitalproject.stanford.edu/, accessed 19 June 2022)
Digital elevation model (DEM)tifThe spatial resolution: 30 m, Units: m (https://code.earthengine.google.com, accessed 20 May 2022)
Watersheds and Sub-watershedsshpDimensionless
ARCGIS 10.6
Table 3. Simulation of water yield in water source region under different scenarios of constant land use and constant rainfall.
ScenarioYearWater Yield Depth (mm)The Amount of Change (mm)Water Yield (/108 m3)the Amount of Change (/108 m3)
Standard values2020521.20--568.20--
Precipitation change1990591.9970.79645.3677.17
2000697.51176.31760.40192.2
2010737.04215.84803.50235.3
Land use change1990520.32−0.88567.23−0.97
2000519.79−1.41566.66−1.54
2010520.50−0.70567.42−0.78
Publisher’s Note: MDPI stays neutral with regard to jurisdictional claims in published maps and institutional affiliations.

