
Orthogonal Experiments and Neural Networks Analysis of Concrete Performance

1
Institute of International Rivers and Eco-Security, Yunnan University, Kunming 650500, China
2
Southwest Investigation and Planning Institute, National Forestry and Grassland Administration, Kunming 650031, China
3
School of Earth Sciences, Yunnan University, Kunming 650050, China
4
College of Water Conservancy, Yunnan Agricultural University, Kunming 650201, China
*
Authors to whom correspondence should be addressed.
†
These authors contributed equally to this work.
Water 2022, 14(16), 2520; https://doi.org/10.3390/w14162520
Submission received: 9 July 2022
/
Revised: 5 August 2022
/
Accepted: 10 August 2022
/
Published: 16 August 2022
(This article belongs to the Special Issue Green Materials for Wastewater Treatment and Resource Recovery)
Abstract
:In order to explore the possibility that adding an appropriate amount of alkaline activator into fly ash cement may improve the early activity of fly ash and ensure the strength performance of concrete, this study analyzed the influence of 0–30% fly ash substitute on the early and late (3–28 days) compressive strength of concrete by using three methods, namely, the concrete laboratory test, orthogonal test, and neural network, under the condition of 0.5 water binder. We obtained the following results: (1) The strength of the concrete mixed with fly ash at the same alkali and the same age decreases with the increase of fly ash content and decreases with the decrease of age; the strength is the highest when the alkali content is 6% or 5%. (2) The higher the content of fly ash, the lower the strength of the mixture, and the greater the decrease of the early strength of the mixture, while the optimum dosage of NaOH is the same. (3) Orthogonal experimental design can be effectively used to analyze the primary and secondary degree of each factor and the best combination of them (cement, fly ash, NaOH, standard, water, etc.). (4) High correlations between the compressive strength and the component composition of concrete can be obtained using the prediction abilities of the neural networks. The above test results show that on the basis of the concrete compressive strength test, the comprehensive application of the orthogonal test and the neural network method can be used to analyze the relationship between strength and the variables and to test the influence of the variables and their interaction on concrete strength, and the results are accurate and reliable.
1. Introduction
Fly ash comes mainly from the waste produced by power plants. It contains harmful radioactive substances (Ra, Th, K, and other natural radionuclides) and is usually open-air stored, which pollutes the groundwater and the surrounding atmosphere. Thus, we need to find novel uses for the fly ash produced as thermal power industries continue to develop [1,2,3]. Usually, the price of fly ash is lower than that of cement, which has economic benefits. Nowadays, there are various methods to design the mix proportion of fly ash concrete. Using fly ash as a direct weight substitute for cement, the fly ash is prepared at a ratio of 10–30% of the total content of cementitious material following current Portland cement technology. Generally speaking, the compressive strength of concrete with fly ash is lower than that without fly ash, especially in the early age of concrete and when the replacement amount is 30% or more [4,5,6]. The appropriate alkali activator can effectively stimulate the early activity of fly ash, and fly ash mixed with alkali activator has excellent impermeability, durability, frost resistance, and corrosion resistance. This is because the alkali activator can make the Si–O and Al–O bonds of fly ash break, which speeds up the dissolution of silicon and aluminum ions. Under the condition of a low water/binder ratio of 0.35, the 28-day cube compressive strength of such concrete can reach 35–50 MPa without any difficulty. In recent decades, much research has focused on the strength–w/b relationship of concrete, although the importance need not be explained in detail. Regarding concrete, it is generally assumed that the quality of cement paste is inversely related to the water cement ratio, provided that the Portland cement is itself satisfactory. That is to say, the strength of concrete is a function of the total porosity. As a new variable, adding fly ash will affect the quality of paste and even the quality of concrete. Studies have shown that strength prediction becomes more accurate when the water/binder ratio (w/b) is used as the basis of mix design rather than the water/cement ratio. However, the quality of fly ash Portland cement paste may vary with the replacement rate of fly ash. Thus, the compressive strength of concrete with the same w/b ratio may be different. Therefore, as the composition of concrete becomes more diverse, it becomes more difficult to determine these relationships experimentally.
This paper studies the effect of alkali dosage and fly ash replacement on the 3-day and 28-day compressive strength of concrete through laboratory tests. The traditional experimental method to study the effects of different components is to change one component at a time without changing the others. The response strengths are then measured with different components. This process changes the other components one by one until all of them have been processed. This method may not be very effective due to the interaction between the components. Therefore, the method of establishing concrete strength model is not appropriate, because the interactions between strength factors are difficult to deal with. To solve this problem, we adopted the method of orthogonal experimental design (OED).
Industrial researchers often use two-level factorials as their first attempt at DOE [7,8,9]. These designs include all combinations of each factor at their high and low levels. Because of the multitude of factors, only small numbers of experiments need to be completed to estimate the main effects and simple interactions. However, when the response depends on the proportion of components, for example in chemistry or material formulation, the factor designs may not make sense.
The DOE method uses polynomial regressions to calculate the response surfaces of the parameters within the range of experimental data. However, the relationship between the strength and composition of concrete is complicated, and thus traditional regression analysis may not to establish an accurate model. The artificial neural network (ANN) is a system simulating the brain biological system [10,11]. Compared with conventional statistical methods, the ANN method is simpler and more direct, especially in the establishment of nonlinear multivariable relations [12,13,14]. Nowadays, we have made great progress in the application of neural networks in civil engineering materials. However, there is little research on the strength model of high fly ash and mixed alkali concrete based on neural networks and OED [15,16,17,18,19,20,21,22,23,24,25,26,27,28,29,30,31,32,33,34,35,36,37,38].
This paper studies the influence of alkali content and fly ash replacement on the compressive strength of concrete through experiments. Based on the existing test results, taking full account of the advantages and disadvantages of orthogonal tests and neural networks, the potential of OED and the artificial neural network are explored to study the influence of fly ash replacement from 0 to 30% and from 3 to 28 days, and alkali content from 3 to 8% on the early (3 days) and late (28 days) compressive strength.
2. Design of Experiments for Concrete Mixture
Before preparing the mortar, the alkali activator was dissolved with an appropriate amount of test water and cooled to room temperature. The mortar was prepared according to the ratio (Table 1) and vibrated. The test mold was placed at room temperature and cured for 24 (±3) h, then demolded and put into the curing box. The temperature of the curing box was controlled at 20 (±2) °C, and the relative humidity was kept below 90%. After curing to the age, the specimens were taken out from the laboratory to determine their flexural and compressive strength using the ISO method (GB/T17671-1999).
In the mixing test, the response at each mixing design points was observed, while the influence of components and their interactions were studied simultaneously.
Therefore, there were 7 × 3 = 21 testing data. They covered a strength range of 2.9–47.5 MPa and a slump workability level of about 5–25 cm. To be sure, these would constitute a representative group covering the full range of uses of concrete and would provide the fairly independent and complete information needed for such an assessment.
3. Introduction to Orthogonal Experimental Design
An orthogonal test is an effective method based on probability principles theory and mathematical statistics. It is a design method to study multi-factors and multi-levels. It also makes centralized optimization simple and quick and is widely used in industry, scientific research, economy, architecture, and other fields. In the orthogonal test, the test index, level, and factors are parameters to be considered, judging the test result by the test index. The test factor is the key variable of the experiment, and its level represents the different state. The test table is the core analysis tool of the orthogonal test. It designs experiments by creating a standard orthogonal array that considers the effects of many factors on the target value when submitting experimental plans. It allows the necessary data to be collected to determine which factors have a greater impact on the experiment than others in order to reduce time and resources required for the experiment.
Nowadays, the orthogonal test is widely used for the optimization of material mix design. Orthogonal experimental design is applied to the preparation of cement with alkali fly ash, and the optimum mix proportion can be obtained conveniently by scientific prediction and analysis. The blind test can be avoided by using the orthogonal table, which can greatly reduce the number of tests and development time. In order to consider four parameters, such as water binder ratio and replacement rate of fly ash content, and three levels for each factor, 81 tests are needed. However, the Taguchi method recommends using L9 orthogonal arrays based on minitab. In short, it only takes 9 experiments instead of 81 to fully consider and optimize these parameters. In this paper, five factors and a four level orthogonal table (L16(54)) was selected to optimize the concrete mix design, the specific distribution of the orthogonal test, as shown in Table 2.
4. About Neural Networks
A neural network is a computer model that basically simulates the process of acquiring knowledge from the human brain. It consists of a number of interconnected processing neurons. Neurons are divided into two or more layers and interact with each other. Each neuron is connected to all the next layers. There is an input layer, where the data is presented to the neural network, and an output layer, which holds the network’s response to the input. The middle layer, known as the hidden layer, enables these networks to represent complex associations with computational patterns. Each hidden and output neuron processes its input, multiplying each input by its weight, summing the product, and producing the result through a nonlinear function. S-shaped curves are usually used as transfer functions.
Neural networks learn by modifying the weights in response to the error between the actual output value and the target value. This study adopts the method of the back-propagation learning algorithm. In the back-propagation neural network, the mathematical relationship between variables is not clear. However, they learn from the examples provided and then sum up the correct responses, which are roughly similar to the learning phase data. In short, random weights are assigned during the first training cycle to each unit connection. The training is carried out until average sum square errors of all modes are minimized. The performance is monitored by RMS error during the training for a better understanding of network performance.
Once the training is complete, the values of the project’s input parameters are presented to the network. The network then uses the existing weights and thresholds to generate the node output during training. The output of the neural network to the actual input is almost instantaneous. Such a trained neural network can not only reproduce the trained results of its experiments, but also its generalization ability should be close to that of other experiments. The accuracy of this generalization depends on the degree of synthesis of the training set. If the input values are within the range used by the training set, the prediction should be reliable.
5. Response Surfaces of Strength
The predicted compressive strength is a function of all input variables when building the compressive strength neural network model. Although there are 8 input variables, it is more meaningful to study the response surface and relationship between the compressive strength and age, the ratio of water binder and fly ash binder, etc. Binder refers to cementitious material, namely, cement and fly ash. The ranges of each variable are as below:
- The water/binder ratio (w/b) is 0.5.
- The fly ash/binder ratio (fa/b) refers to the content of fly ash calculated by the weight of the binder, with a variation range of 10–30%.
- The age of concrete is different on the 3rd and 28th days. All other raw materials or their proportions remain unchanged.
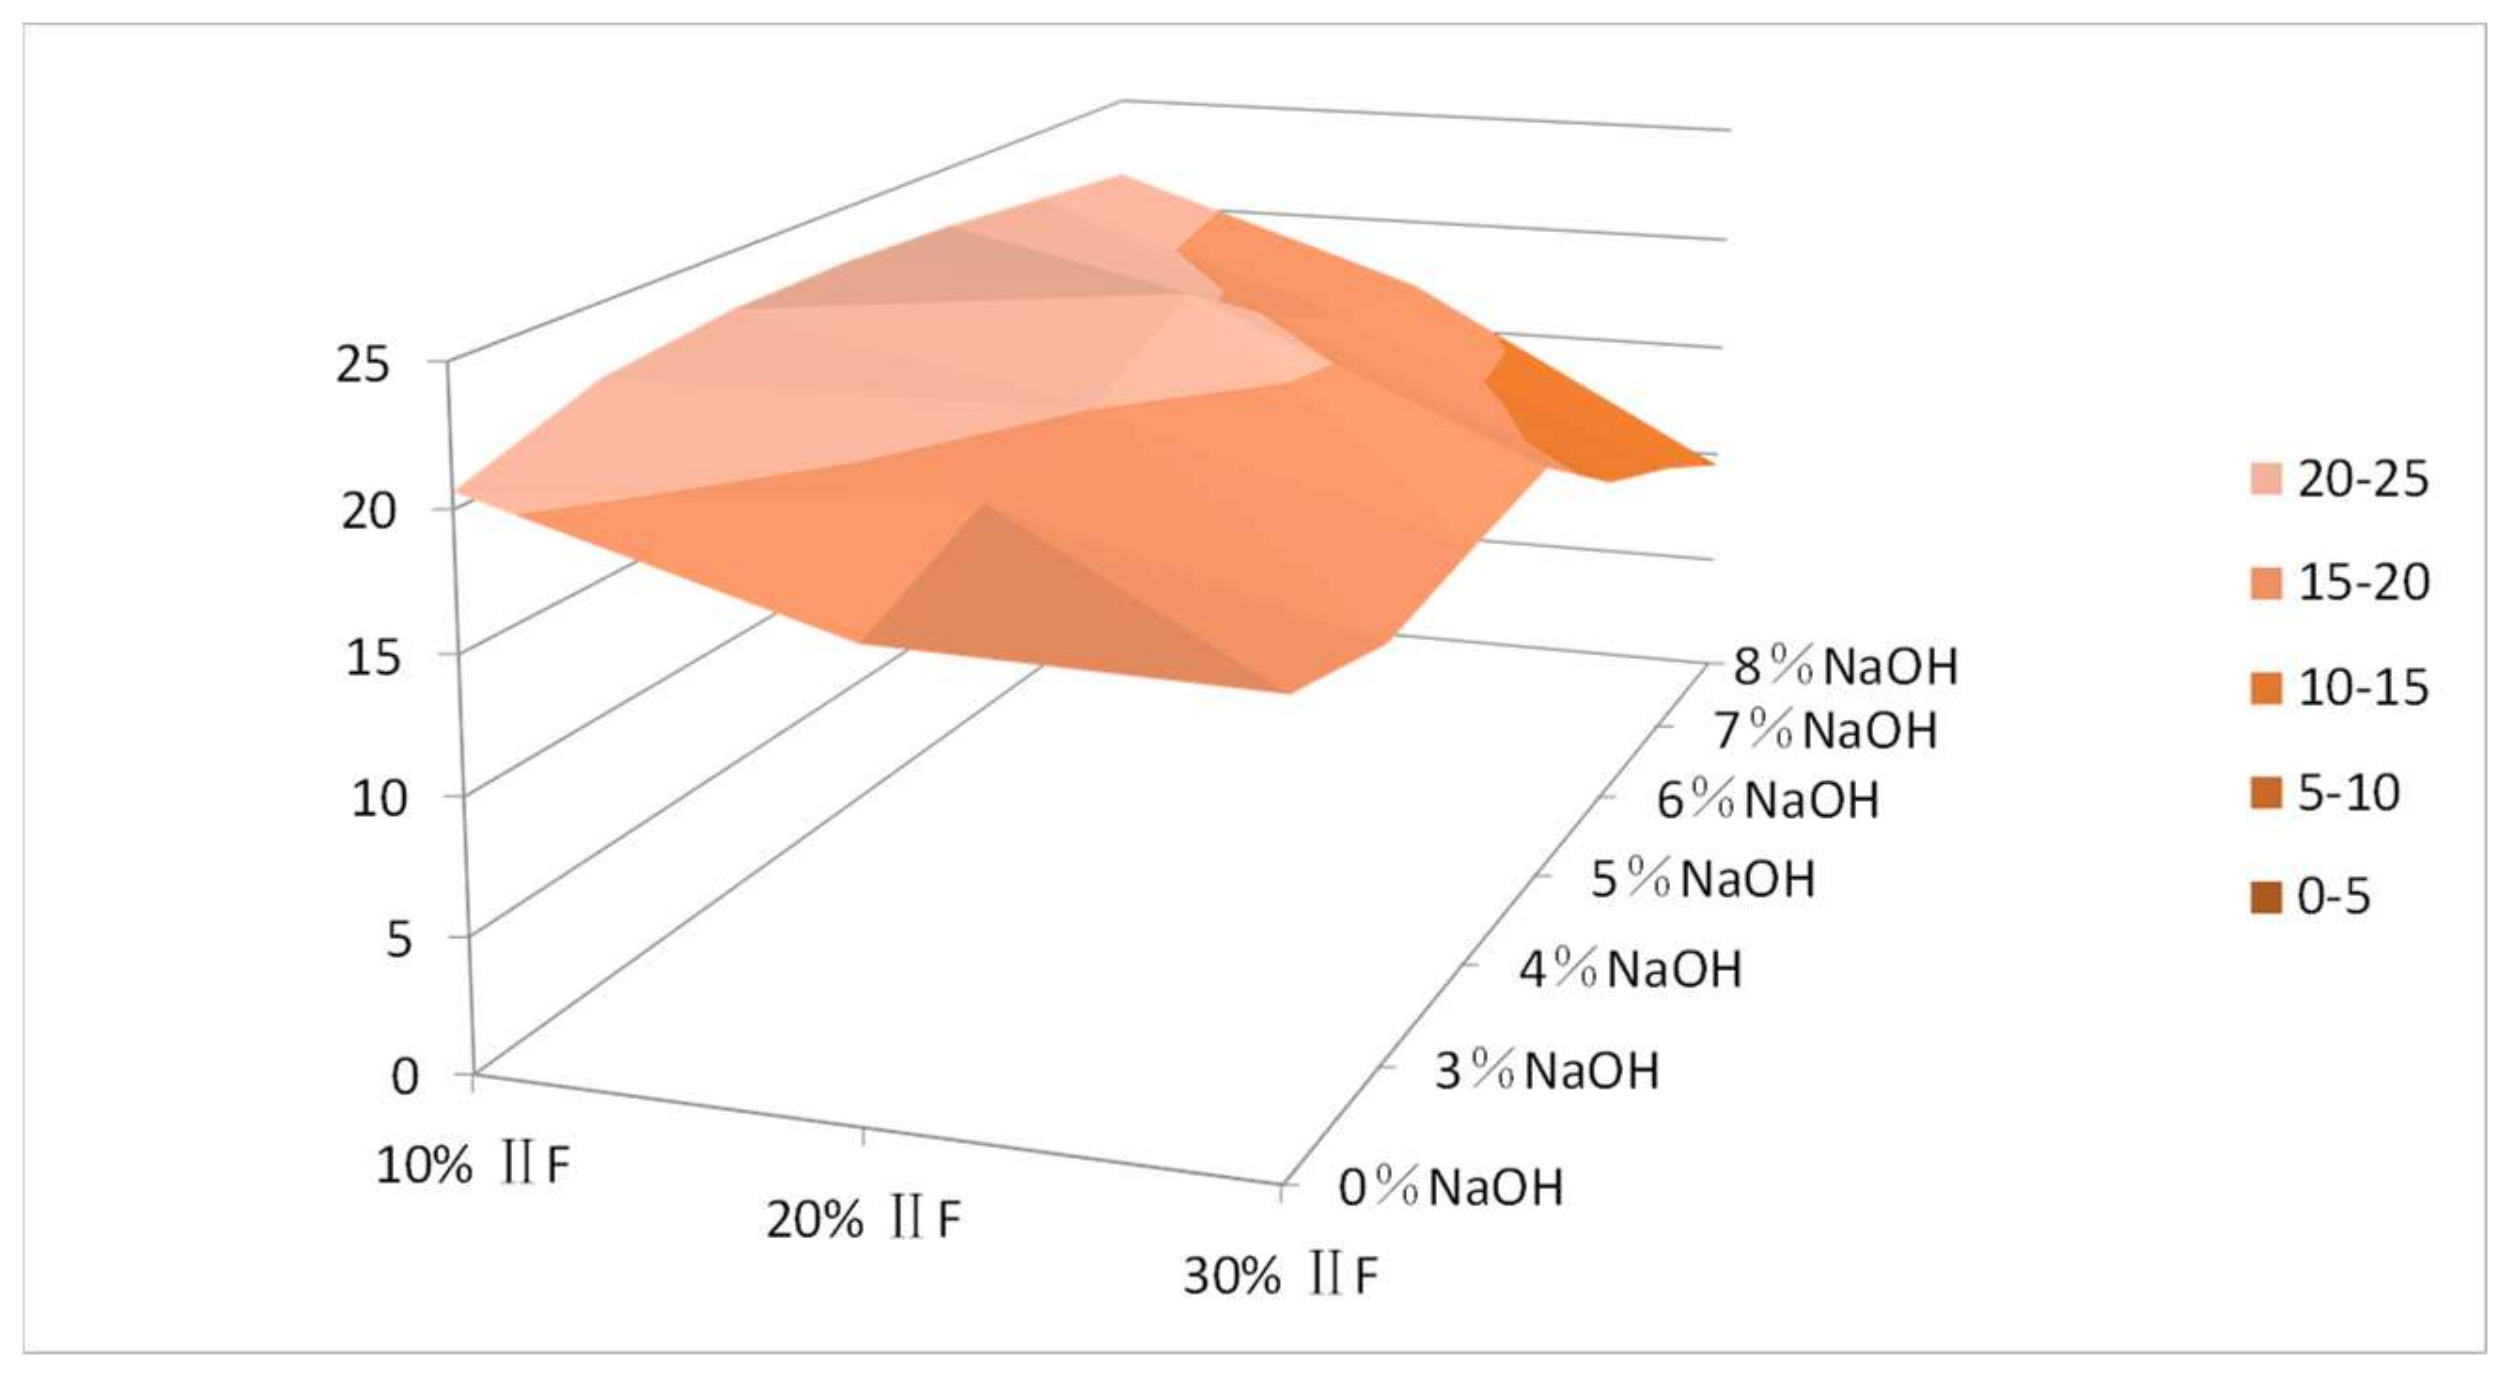
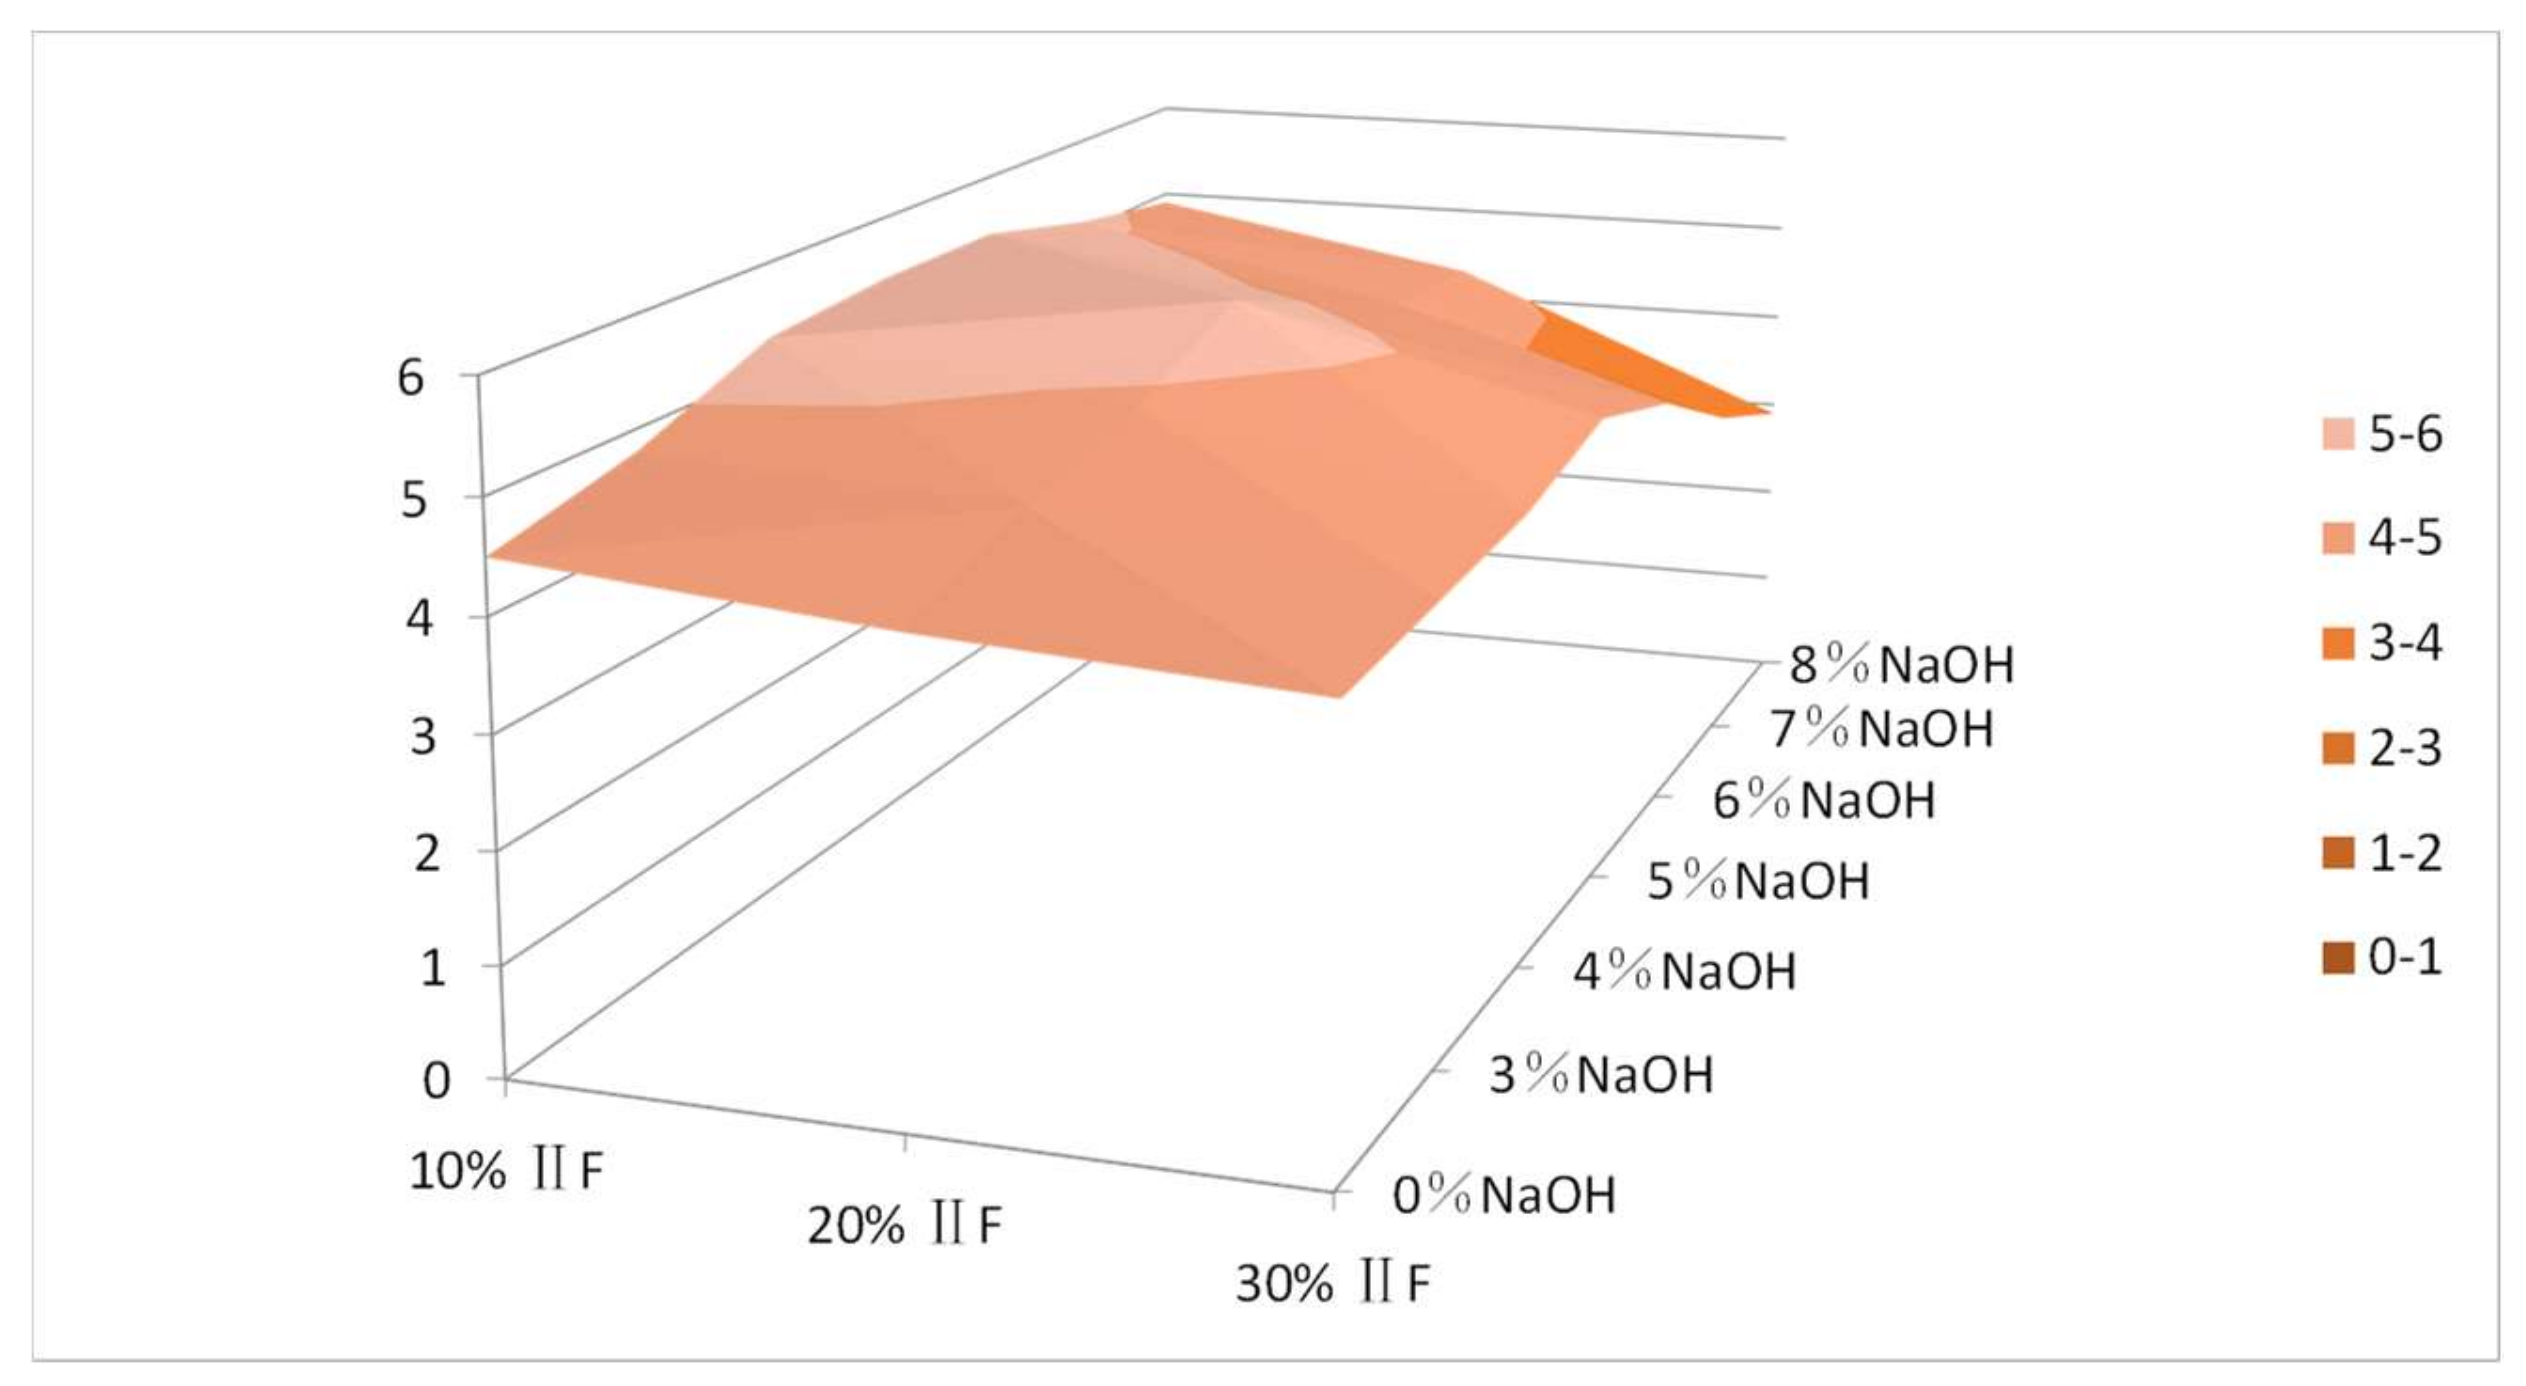
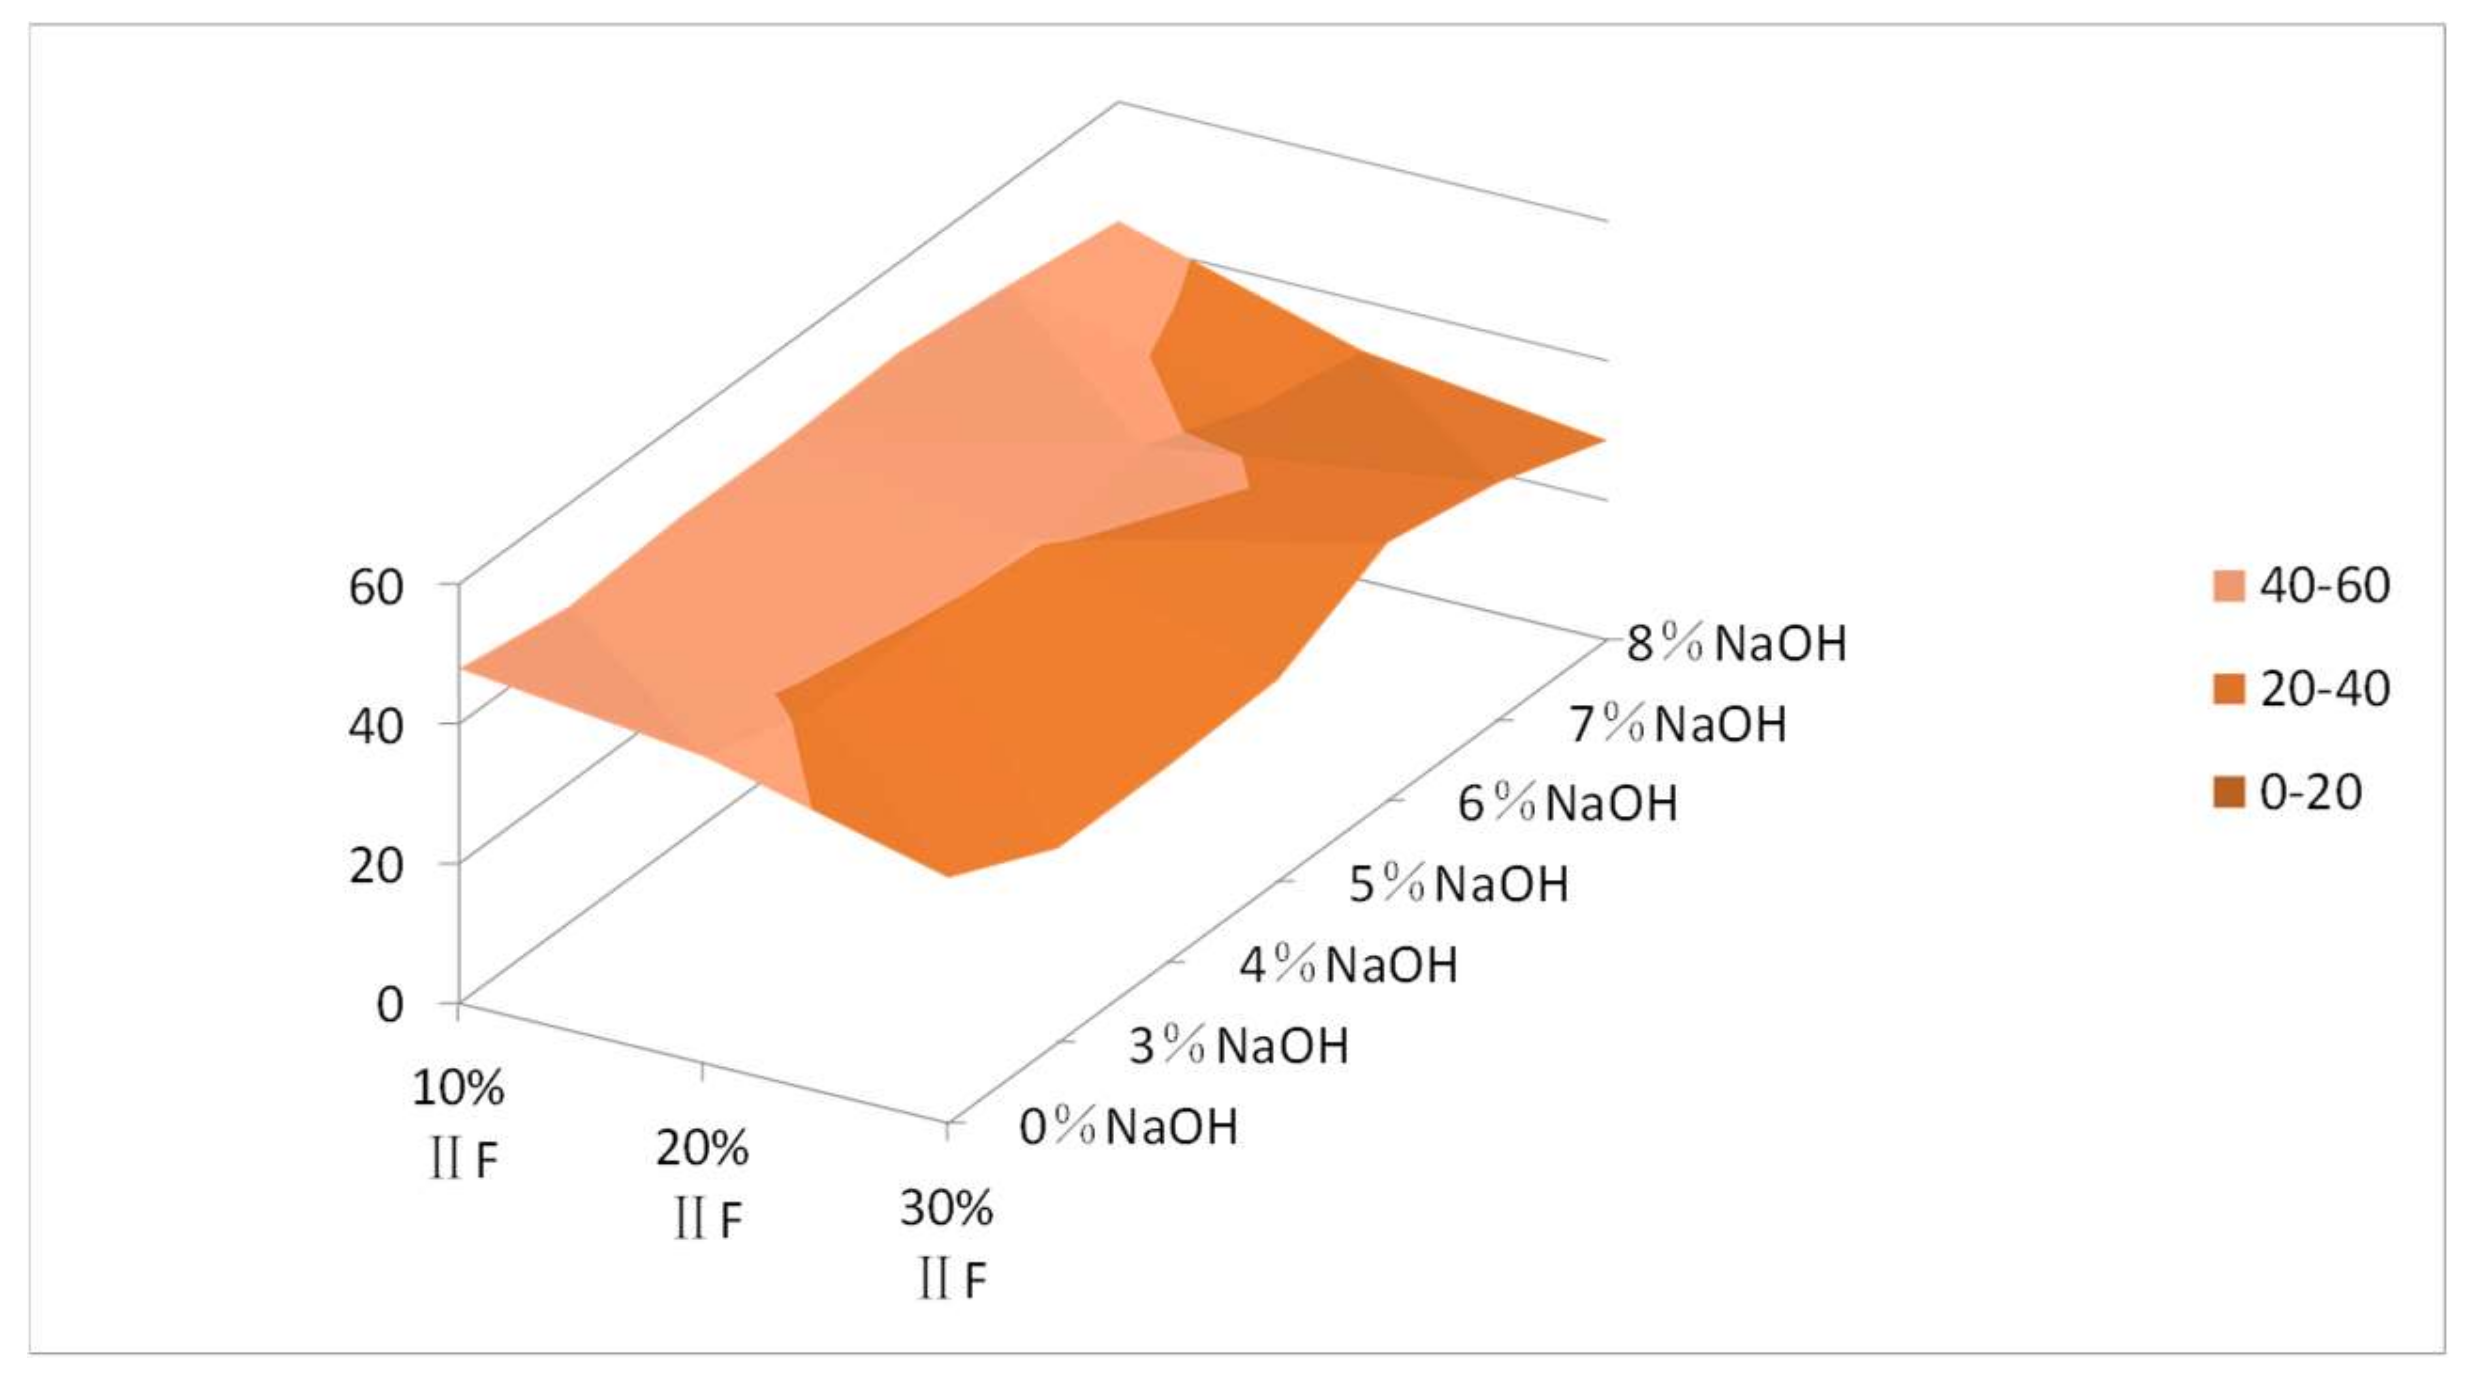
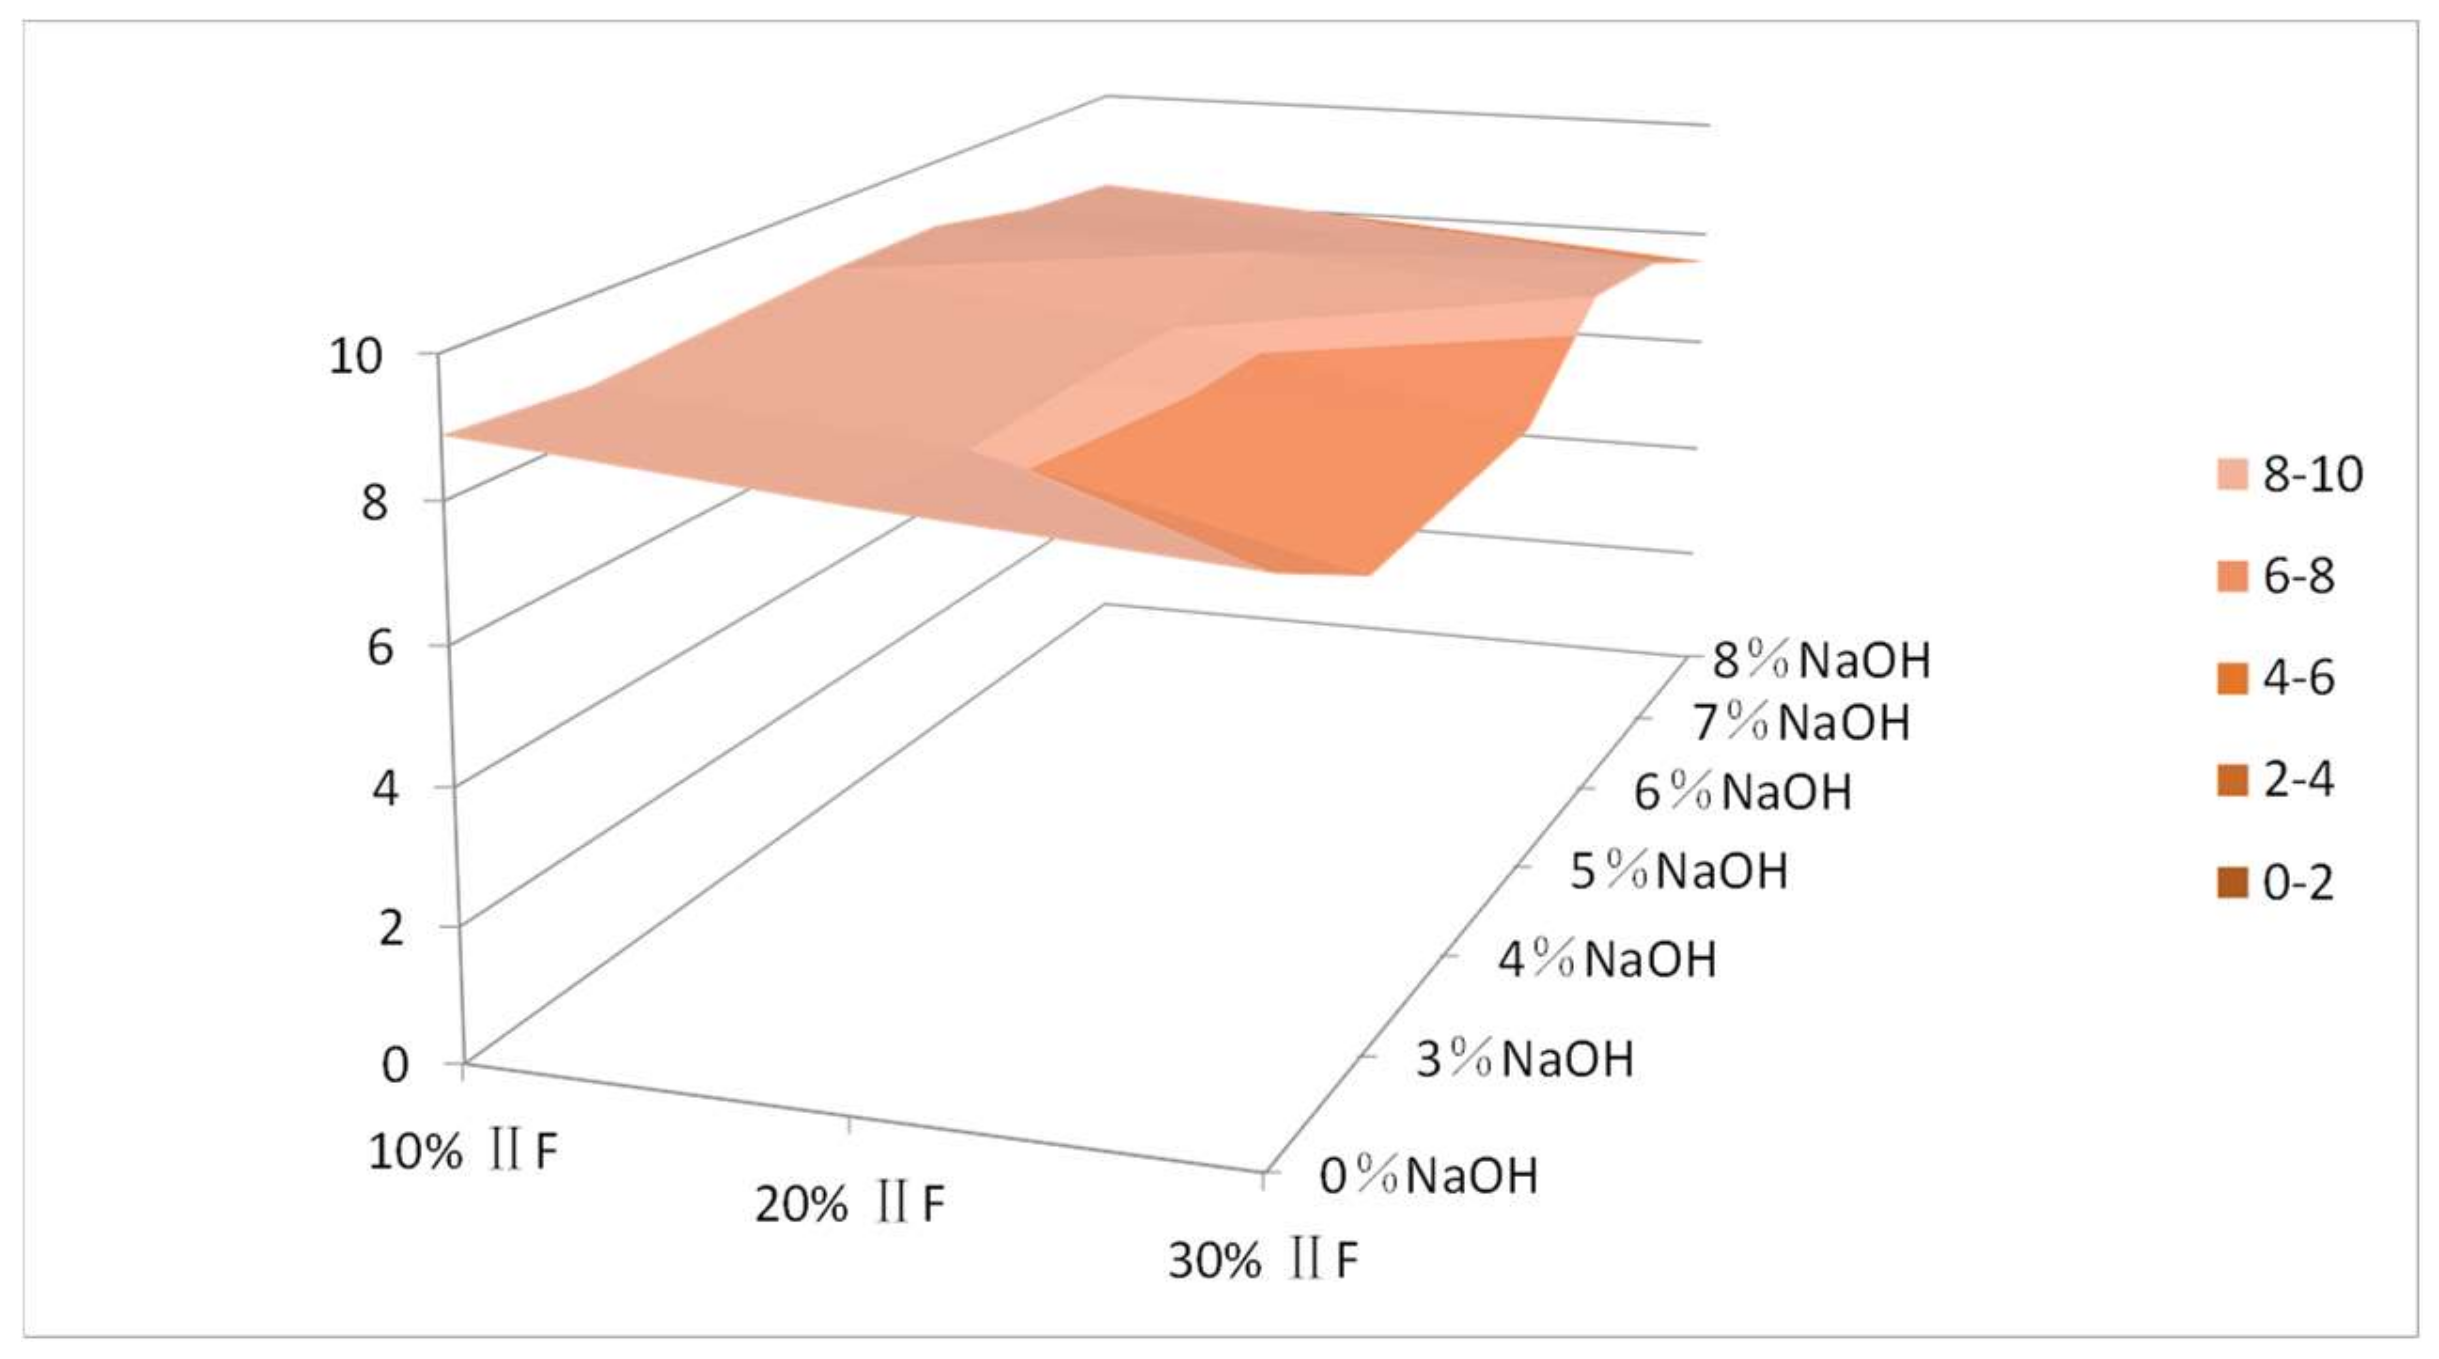
Using the training neural network developed in this study and the w/b–strength ratio curve generated by the above combination, Figure 1, Figure 2, Figure 3 and Figure 4 show five sets of curves of the effects of NaOH and fa/b at 3 and 28 days. Strength ratio refers to the strength percentage of concrete mix with fly ash or without fly ash on the basis of same w/b and age. Moreover, the five response surfaces in Figure 5, Figure 6, Figure 7 and Figure 8 analyzed the interaction between fa/b and NaOH at the 3rd and 28th days. Some conclusions are presented below.
5.1. Effects of fa/b
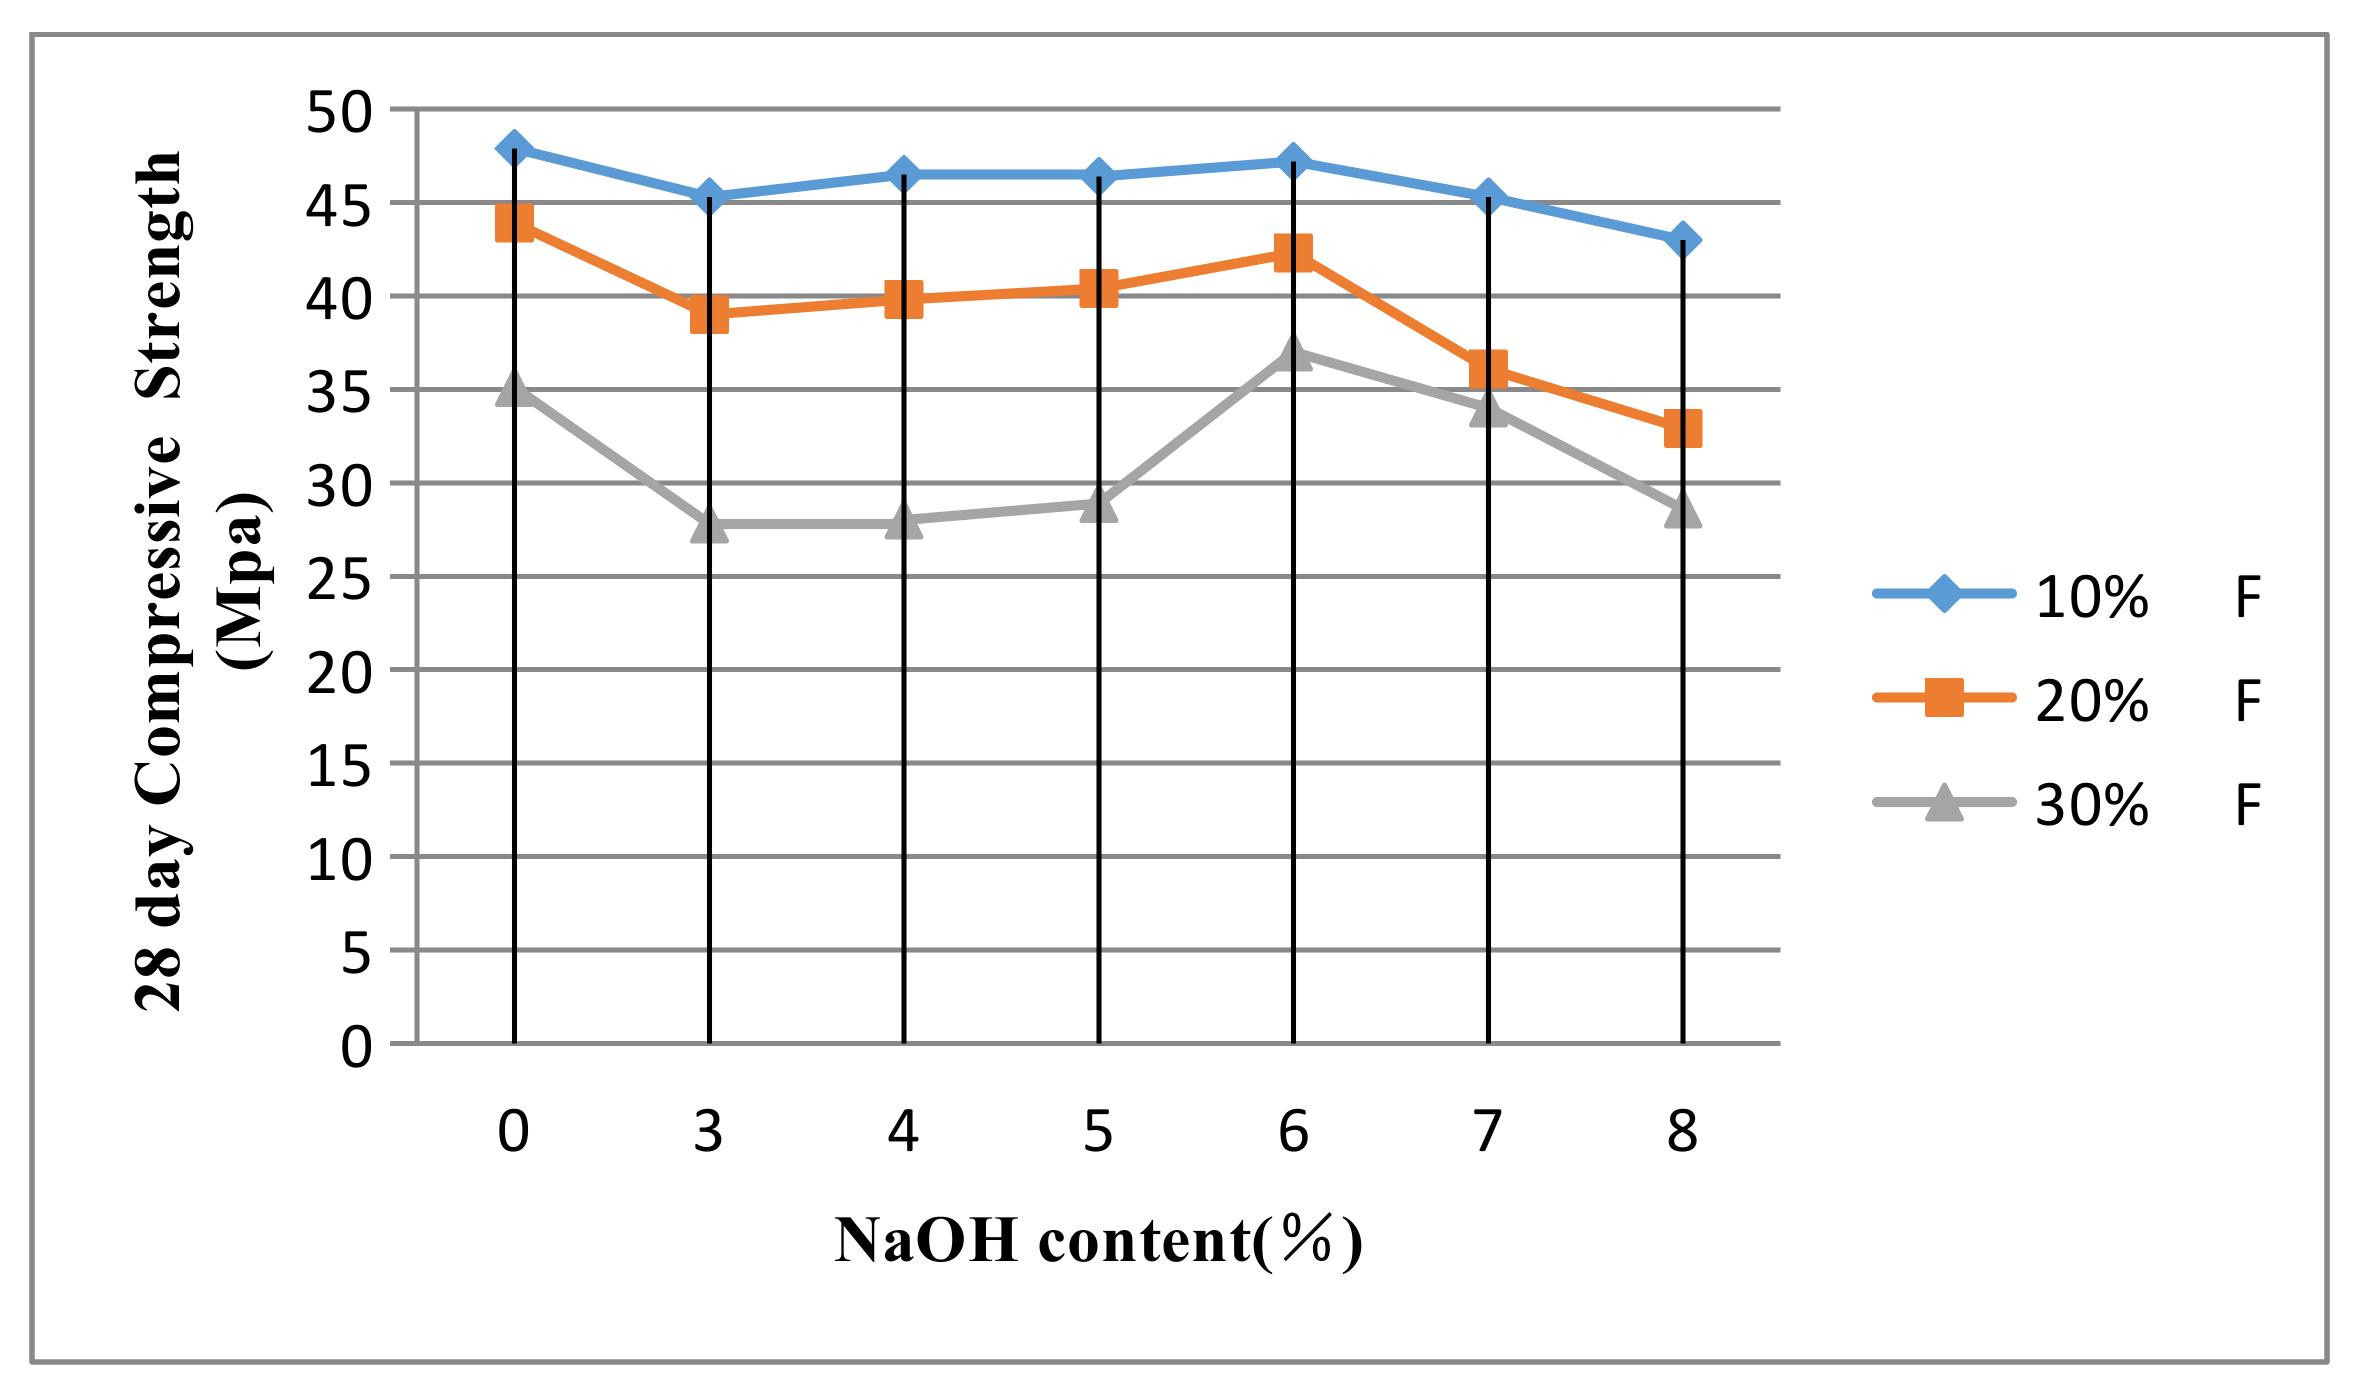
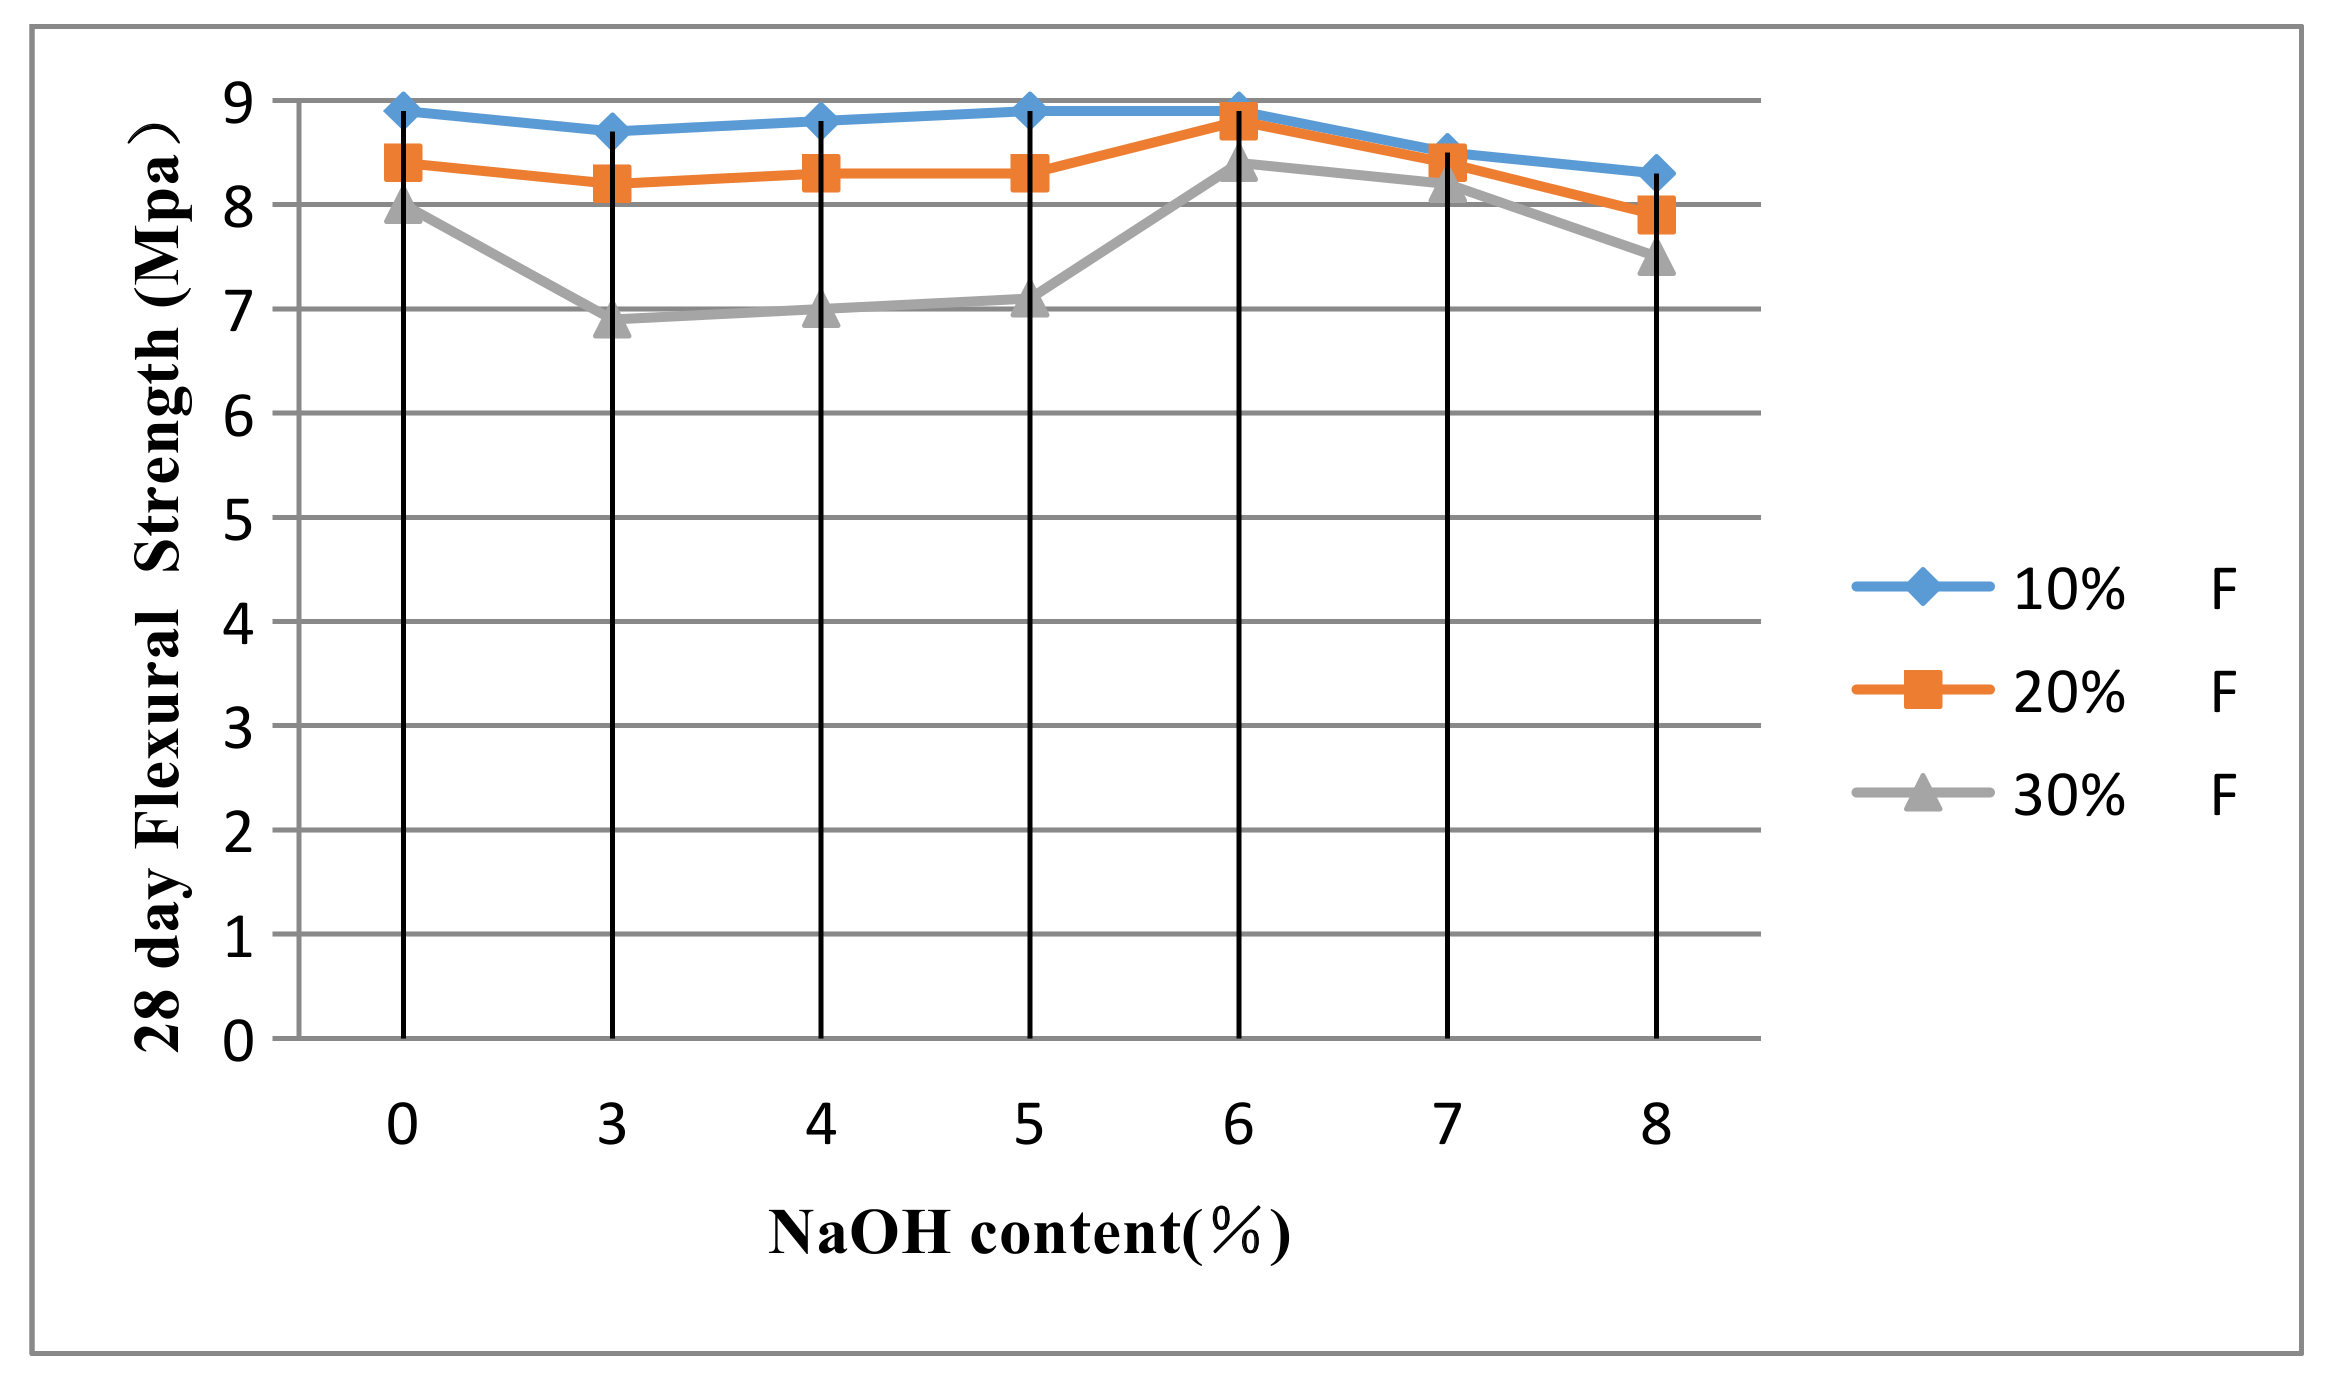
Under the same age and water/binder ratio, the influence of fly ash on concrete strength was proportional to the content of fly ash. For example, as seen in Figure 3 and Figure 4, at 28 days of age and w/b = 0.5, NaOH content was 5%, and the effect of the small substitute rate (10%) on the strength ratio decreased slightly (5%); however, the effect of a larger substitution (30%) on the strength ratio was significantly reduced (13%).
5.2. Effects of NaOH
Under the conditions of a high replacement rate of fly ash, the reduction of the strength ratio decreased the most under the condition of specific water/binder ratios. However, the results showed that the addition of sodium hydroxide could stimulate the early activity of fly ash. The analysis is as follows:
(1) After 3 days, the strongest cement was composed of 10% fly ash and 5% sodium hydroxide.
(2) The addition of alkali in cement was not enough to stimulate the early activity of fly ash.
The optimum amount of sodium hydroxide was 5%. With the increase in sodium hydroxide, the strength of the mortar initially increased but then decreased. In addition, no matter how much cement was added, the mortar was strongest when the sodium hydroxide accounted for 5% of the weight of fly ash at 3 days. The alkali in cement was not enough to stimulate the early activity of fly ash.
(3) When the cement contained 20% fly ash, the end of day 3 saw the highest flexural and compressive strength rates (increase rate = (alkali mixed strength value − no mixing strength value)/no mixing strength value).
The improvement rate revealed that at 10% fly ash, the flexural and compressive strength increase rates were 20% and 11%, respectively. When the fly ash was 20%, flexural and compressive strength increased to 29% and 34%, respectively. At 30% fly ash content, flexural and compressive strength increased by 13% and 4%, respectively. When 5% sodium hydroxide was added, the strength improvement rate of 20% fly ash was the highest.
(4) The early strength of fly ash mixed with sodium hydroxide developed rapidly.
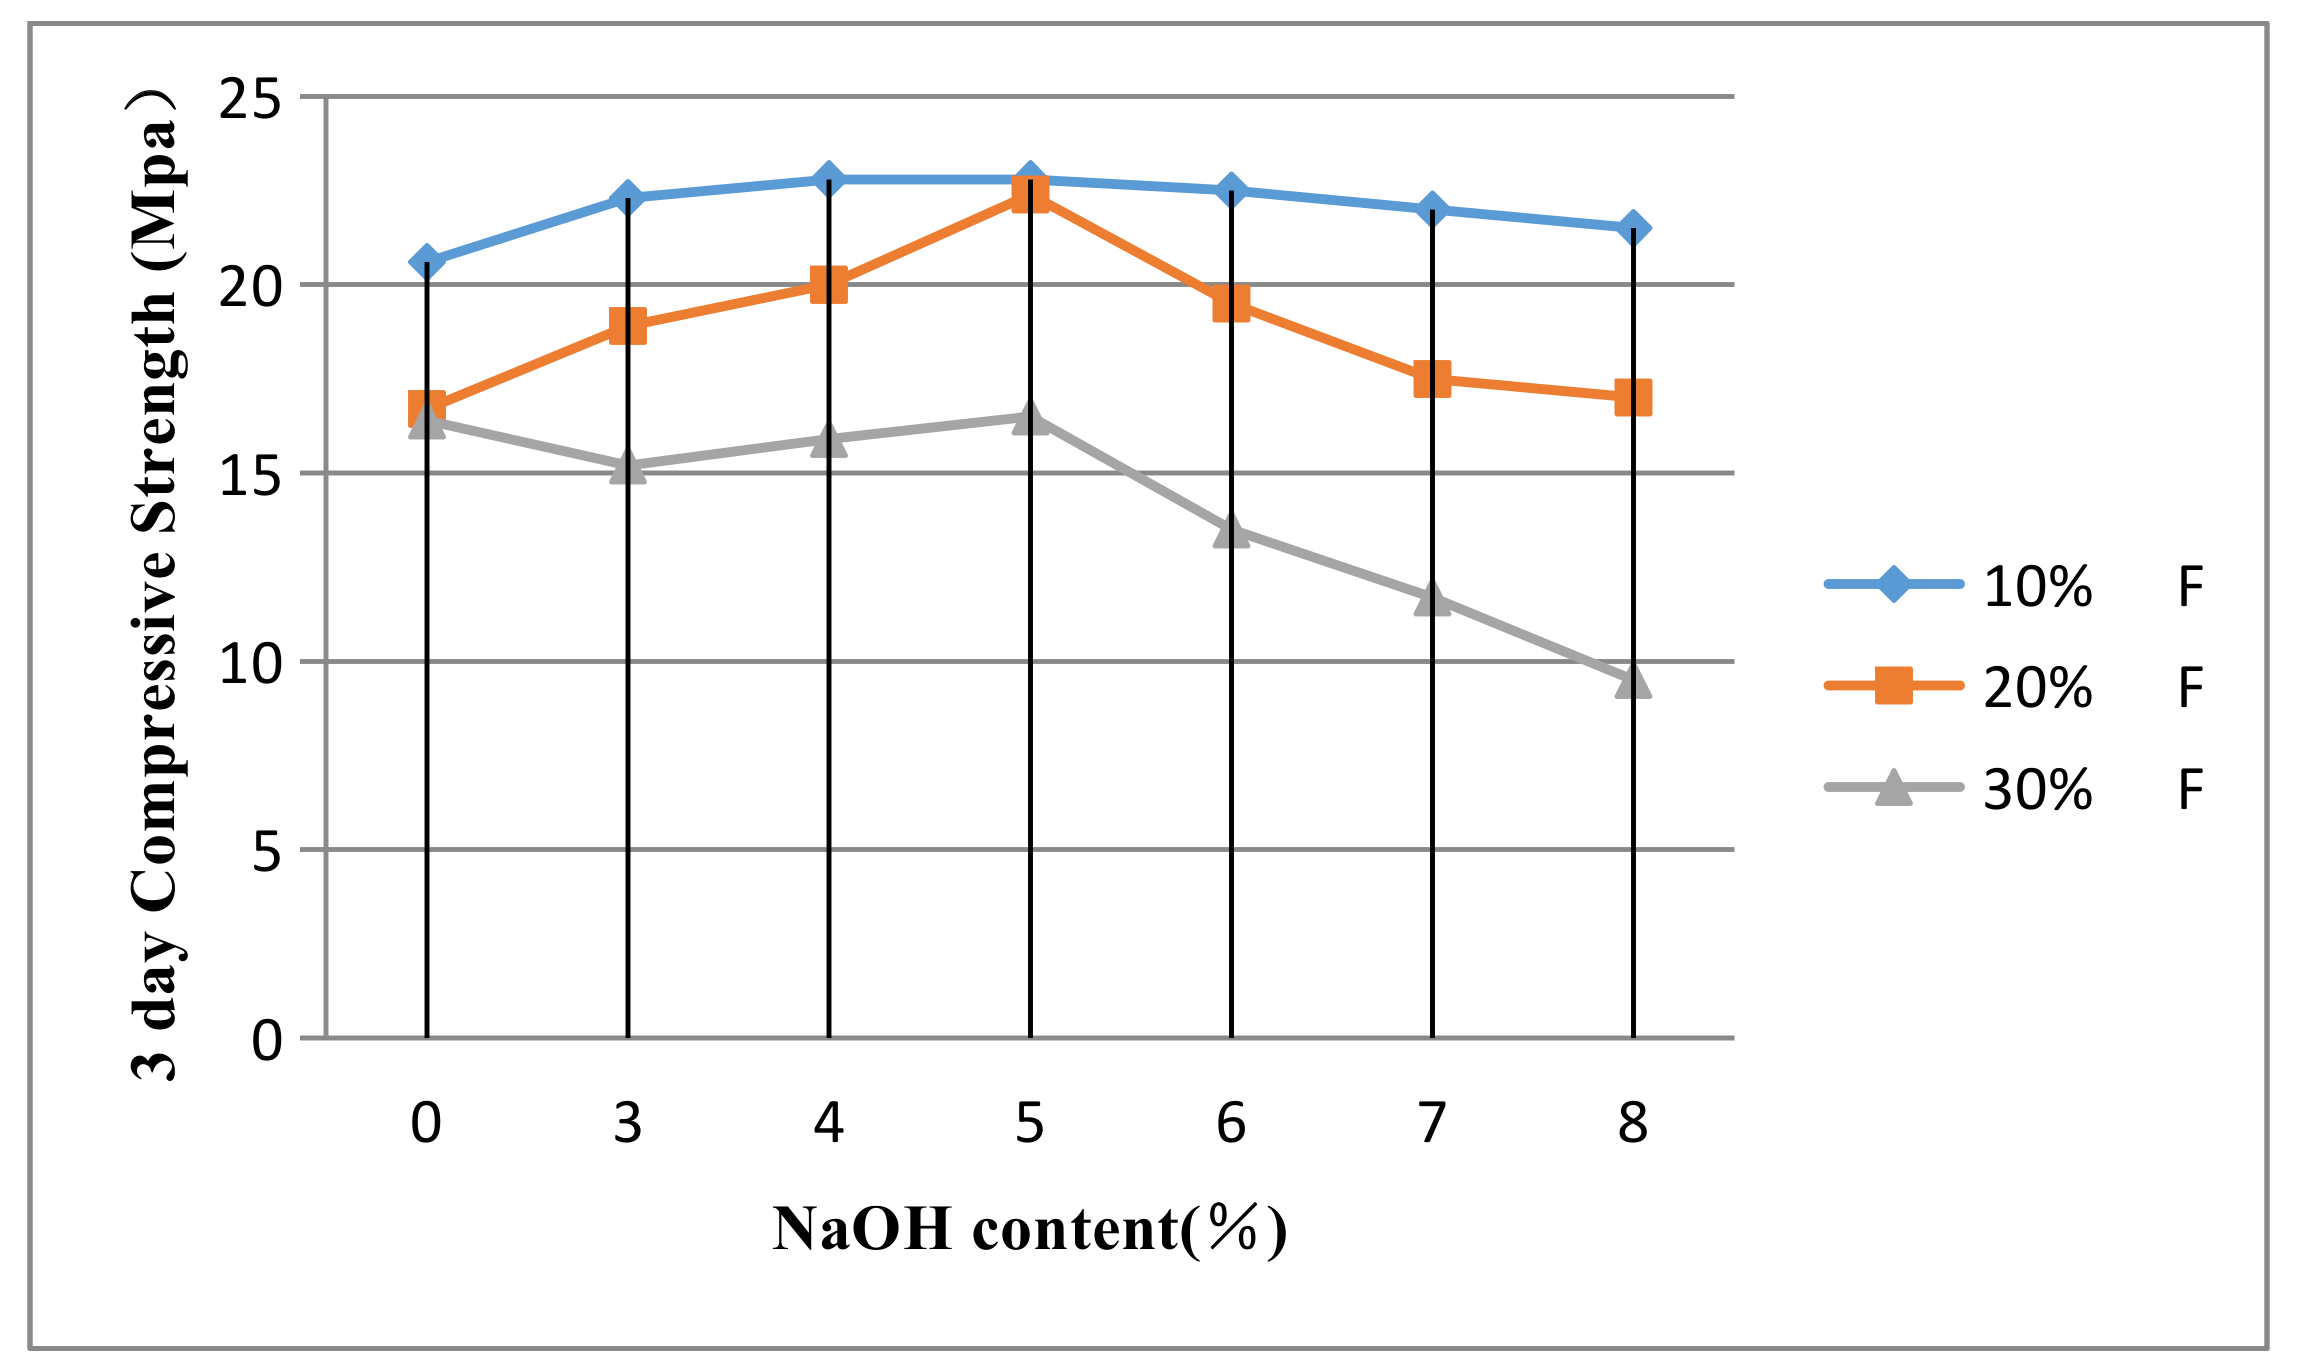
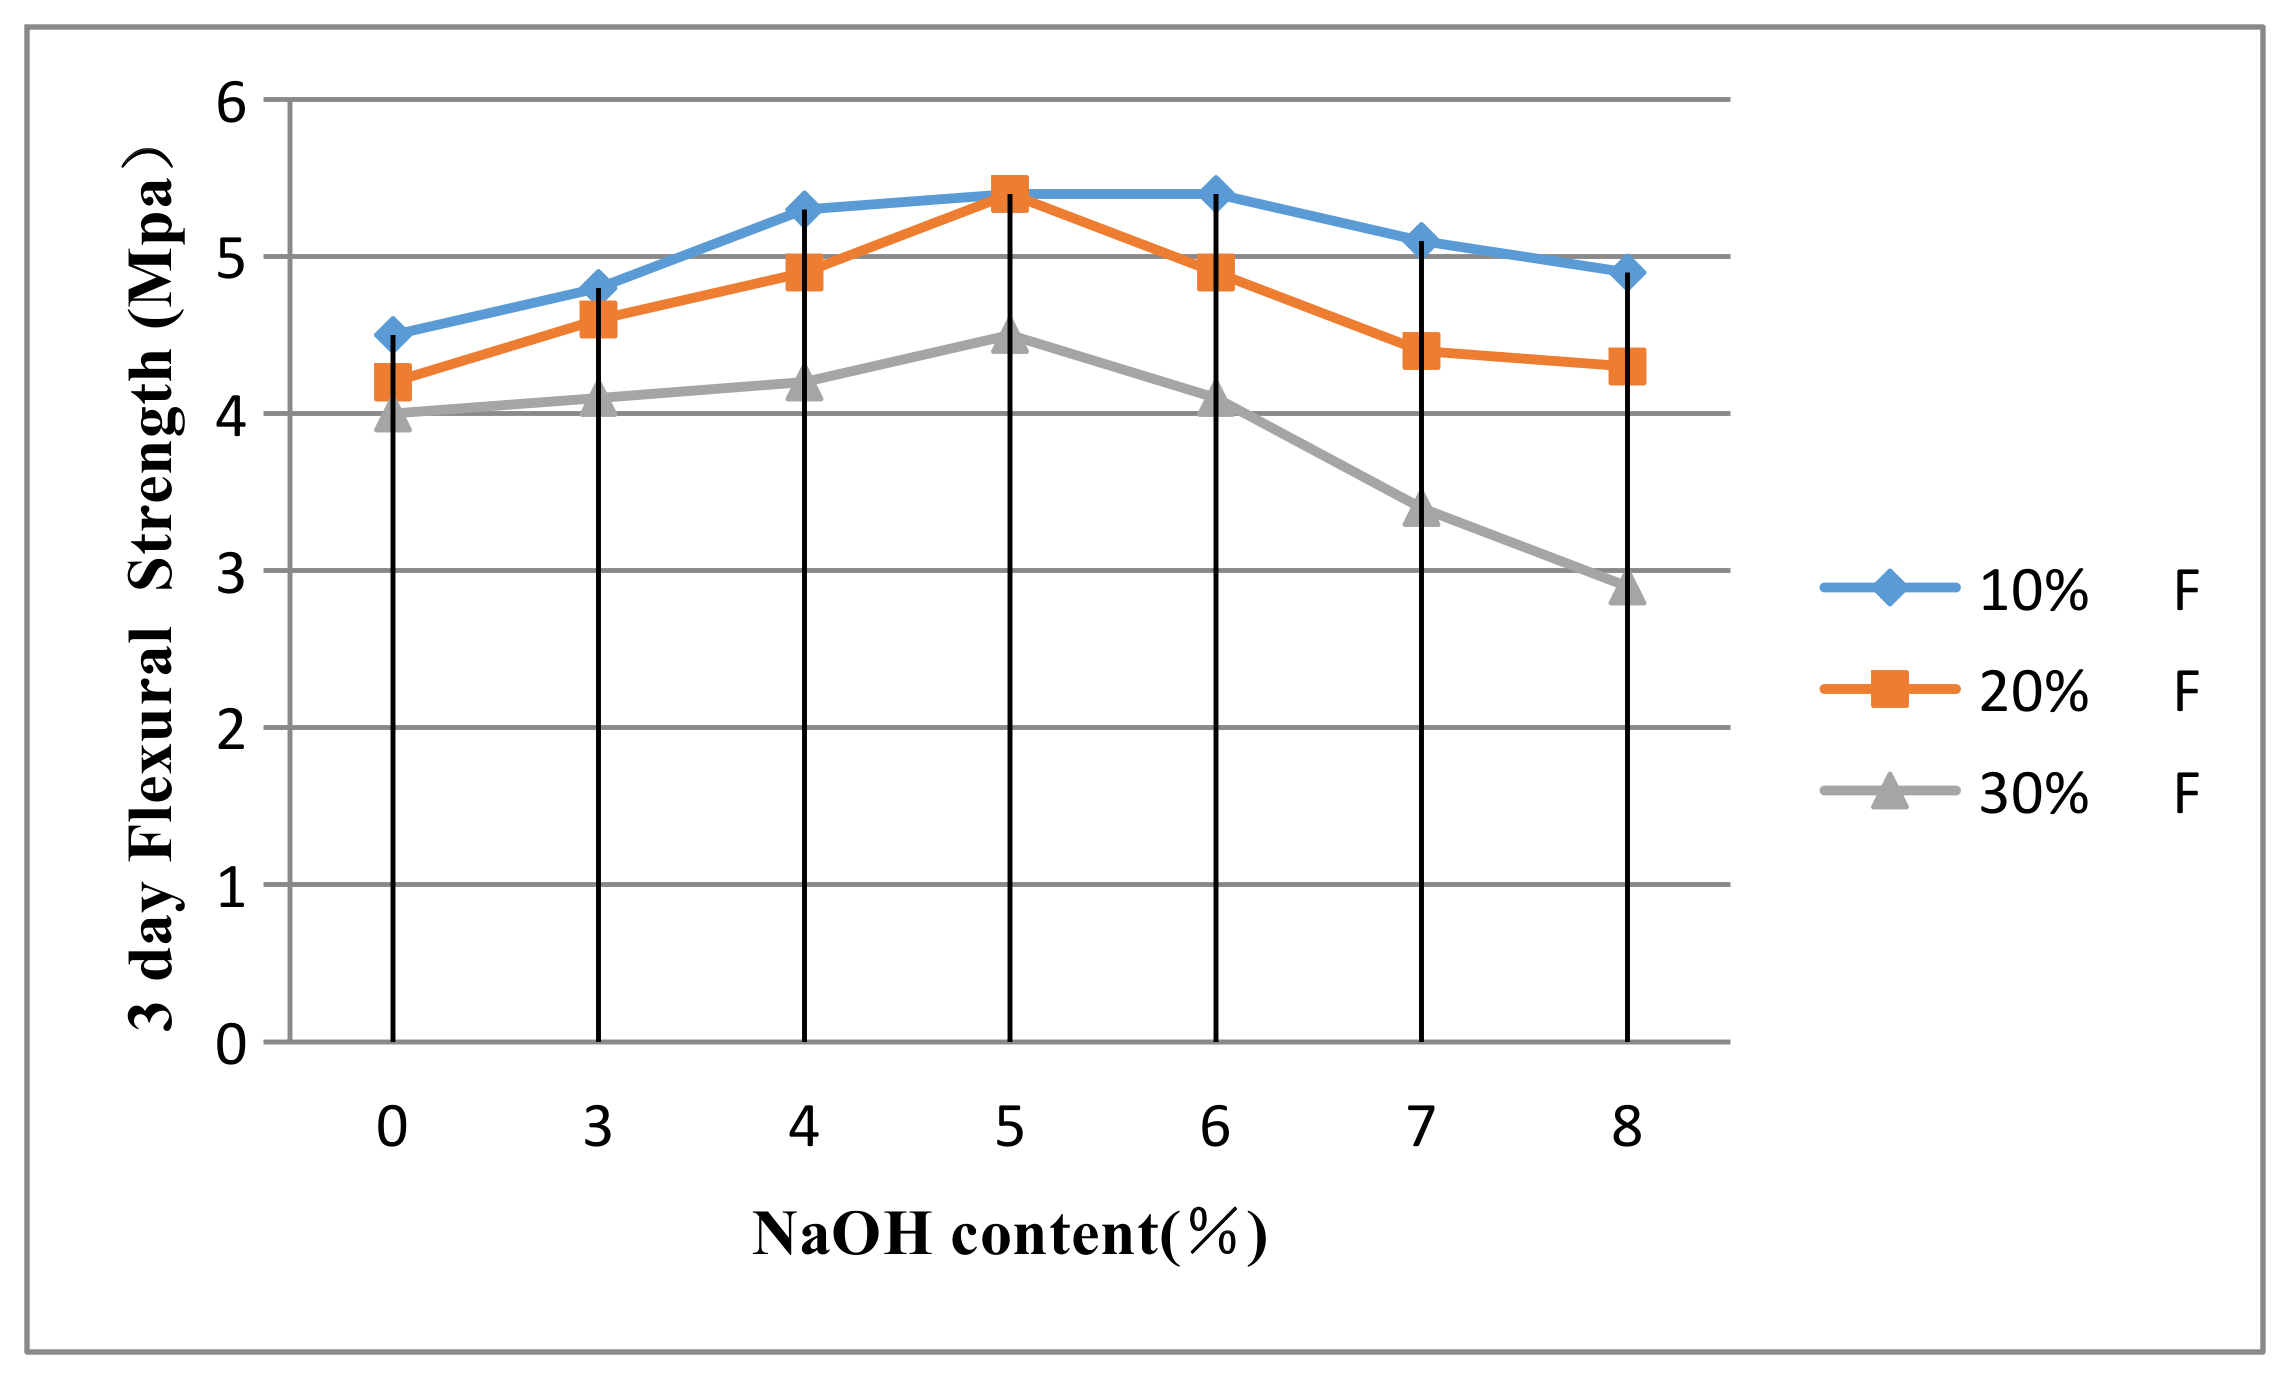
At 3 days, when 5% sodium hydroxide was added, and the content of fly ash was 20%, the flexural strength of mortar was 5.4 MPa compared to the 4.2 MPa of the reference group. The compressive strength under the same conditions was 22.4 MPa compared to the reference group, which is 16.7 MPa. All in all, the strength of the alkali mixed activator was higher than that of the reference group (Figure 1 and Figure 2).
5.3. Effects of Age
The higher the replacement amount of fly ash, the lower the early age strength, and there was also a slightly lower late age strength ratio. For instance, when w/b = 0.5, the strength of concrete mixed with 30% fly ash in 3 days, (Figure 1 and Figure 2) and 28 days (Figure 3 and Figure 4) were 50% and 85%, respectively, of concrete without fly ash. Figure 1, Figure 2, Figure 3 and Figure 4 show the following:
At 28 days, mortar strength reached the maximum when the fly ash accounted for 10% of the mixture, and the sodium hydroxide accounted for 6%.
(1) According to the results of orthogonal analysis, the 28-day compressive strength was maximized when the sodium hydroxide content was 0, but it was similar to the control group when the sodium hydroxide content was 6%. The sodium hydroxide content of the maximum flexural compressive strength at 28 days was 6%.
(2) The effects of sodium hydroxide depend on the age of the mortar. At 28 days, the 6% sodium hydroxide mixture was the strongest, while at 3 days, the 5% sodium hydroxide was the strongest.
The optimum dosage of alkali-activated fly ash changes with age because the content of calcium hydroxide produced by the early hydration of cement exceeds that produced later.
(3) Compared with the reference group, the increased rates of flexural and compressive strength were the highest with 30% fly ash at 28 days, and 20% fly ash at 3 days, respectively.
The compressive strength of mortar mixed with 10% and 20% fly ash under 5% sodium hydroxide failed to match the strength of the reference group at 28 days. After 28 days, at 5% sodium hydroxide and 30% fly ash, the mortar strength exceeded the reference group strength. Therefore, the optimum content of fly ash was found to be 30% at 28 days (Figure 3 and Figure 4).
(4) The strength of fly ash cement mixed with sodium hydroxide developed rapidly in the early stage but then slowed.
Under optimal conditions, the compressive and flexural strength values at 3 days were 29% and 34%, respectively, higher than the reference group. At 28 days, the compressive and flexural strength under optimal conditions increased only by 5% (Figure 3 and Figure 4). The strength of fly ash excited by sodium hydroxide increased rapidly at the early stage, but developed slowly in the later stage.
5.4. Interactions of fa/b and NaOH
- The effect of low and high content of fly ash replacement on the strength ratio had optimum strength and was roughly the same at 5% or 6% of NaOH. As shown in Figure 1 and Figure 2, at 3 days of age, the flexural strength of concrete with 10% fly ash at 5% or 6% of NaOH was the highest, and the compressive strength was the highest at 5% of NaOH. At 28 days, the flexural strength of concrete with 10% fly ash at 5% or 6% of NaOH was the highest, and compressive strength was the highest at 5% of NaOH.
- With the increase of fly ash, the strength decreased significantly at a high content of NaOH and decreased slightly lower at a low content of NaOH. For example, with NaOH contents of 0% and 8%, the compressive strength with 30% fly ash at 28 days of age was 74 and 66%, respectively, of concrete with 10% fly ash. At 28 days, the mortar strength reached the maximum when the fly ash accounted for 10% of the mixture, and the sodium hydroxide accounted for 6%.
5.5. Interactions of fa/b and Age
- In the early stage, fly ash contributed little to strength. As shown in Figure 1 and Figure 5, when the amount of NaOH was 5%, the compressive strength of concrete replaced with 10% fly ash decreased by 8% compared with that of concrete without fly ash, and the strength ratio of concrete replaced with 30% fly ash decreased by 40%.
5.6. Interactions of NaOH and Age
1. At early stages, there existed an optimal NaOH that had the highest strength. Taking 3 days as an example, as shown in Figure 5 and Figure 6, when the NaOH dosage = 5%, concrete compressive and flexural strength of 10% fly ash were 22.8 and 5.4 MPa, respectively. However, at NaOH dosage = 3% and 8%, the compressive ratio was 97% and 94%, respectively.
6. Analysis of Mechanical Properties Based on Orthogonal Test
Table 2 shows the mechanical performance results of orthogonal test analysis. According to the comprehensive equilibrium analysis, factor A was more dominant than factor B in any case. Factor A was chosen between A1 and A3. It was found that A1 and A3 had significant effects on fcu and ffu. When A1 was chosen, fcu and ffu at 28 days increased by 46.6% and 14.9%, respectively, compared with A3, so A1 was chosen. According to the comparison of B1 and B7, the 3-day fcu and ffu were 10.6% and 20% higher, respectively, than B1 when B4 was selected, but 28d ffu decreased by 3.1%, so B1 was selected.
In short, the optimal combination of 3-day intensity was A1B4, and the optimal combination of flexural strength at 28 days was A1B5. The optimal combination for 28 days compressive strength was A1B5 or A1B1.
7. Neural Networks for Modeling Strength Behavior
In order to accurately generate the response surface of concrete strength, the program used in this study was written in Python Programming Language and basically followed the Lippmann formula (that is, for the first training cycle, the random weight is allocated to the connections between units for training until the average sum of squares error of all training modes is minimized) rather than commercially available neural network software. In this paper, a neural network with 6 units in the input layer was established, respectively representing cement, fly ash, SP (sand ratio), coarse aggregate, water, and age, and with one unit in the output layer representing compressive strength. After many tests, the optimal network structure and parameters to minimize the RMS error of test data were screened, as shown below:
① Number of hidden layers = 1; ② Number of hidden units = 7; ③ Learning rate = 1.0; ④ Learning cycle = 1000.
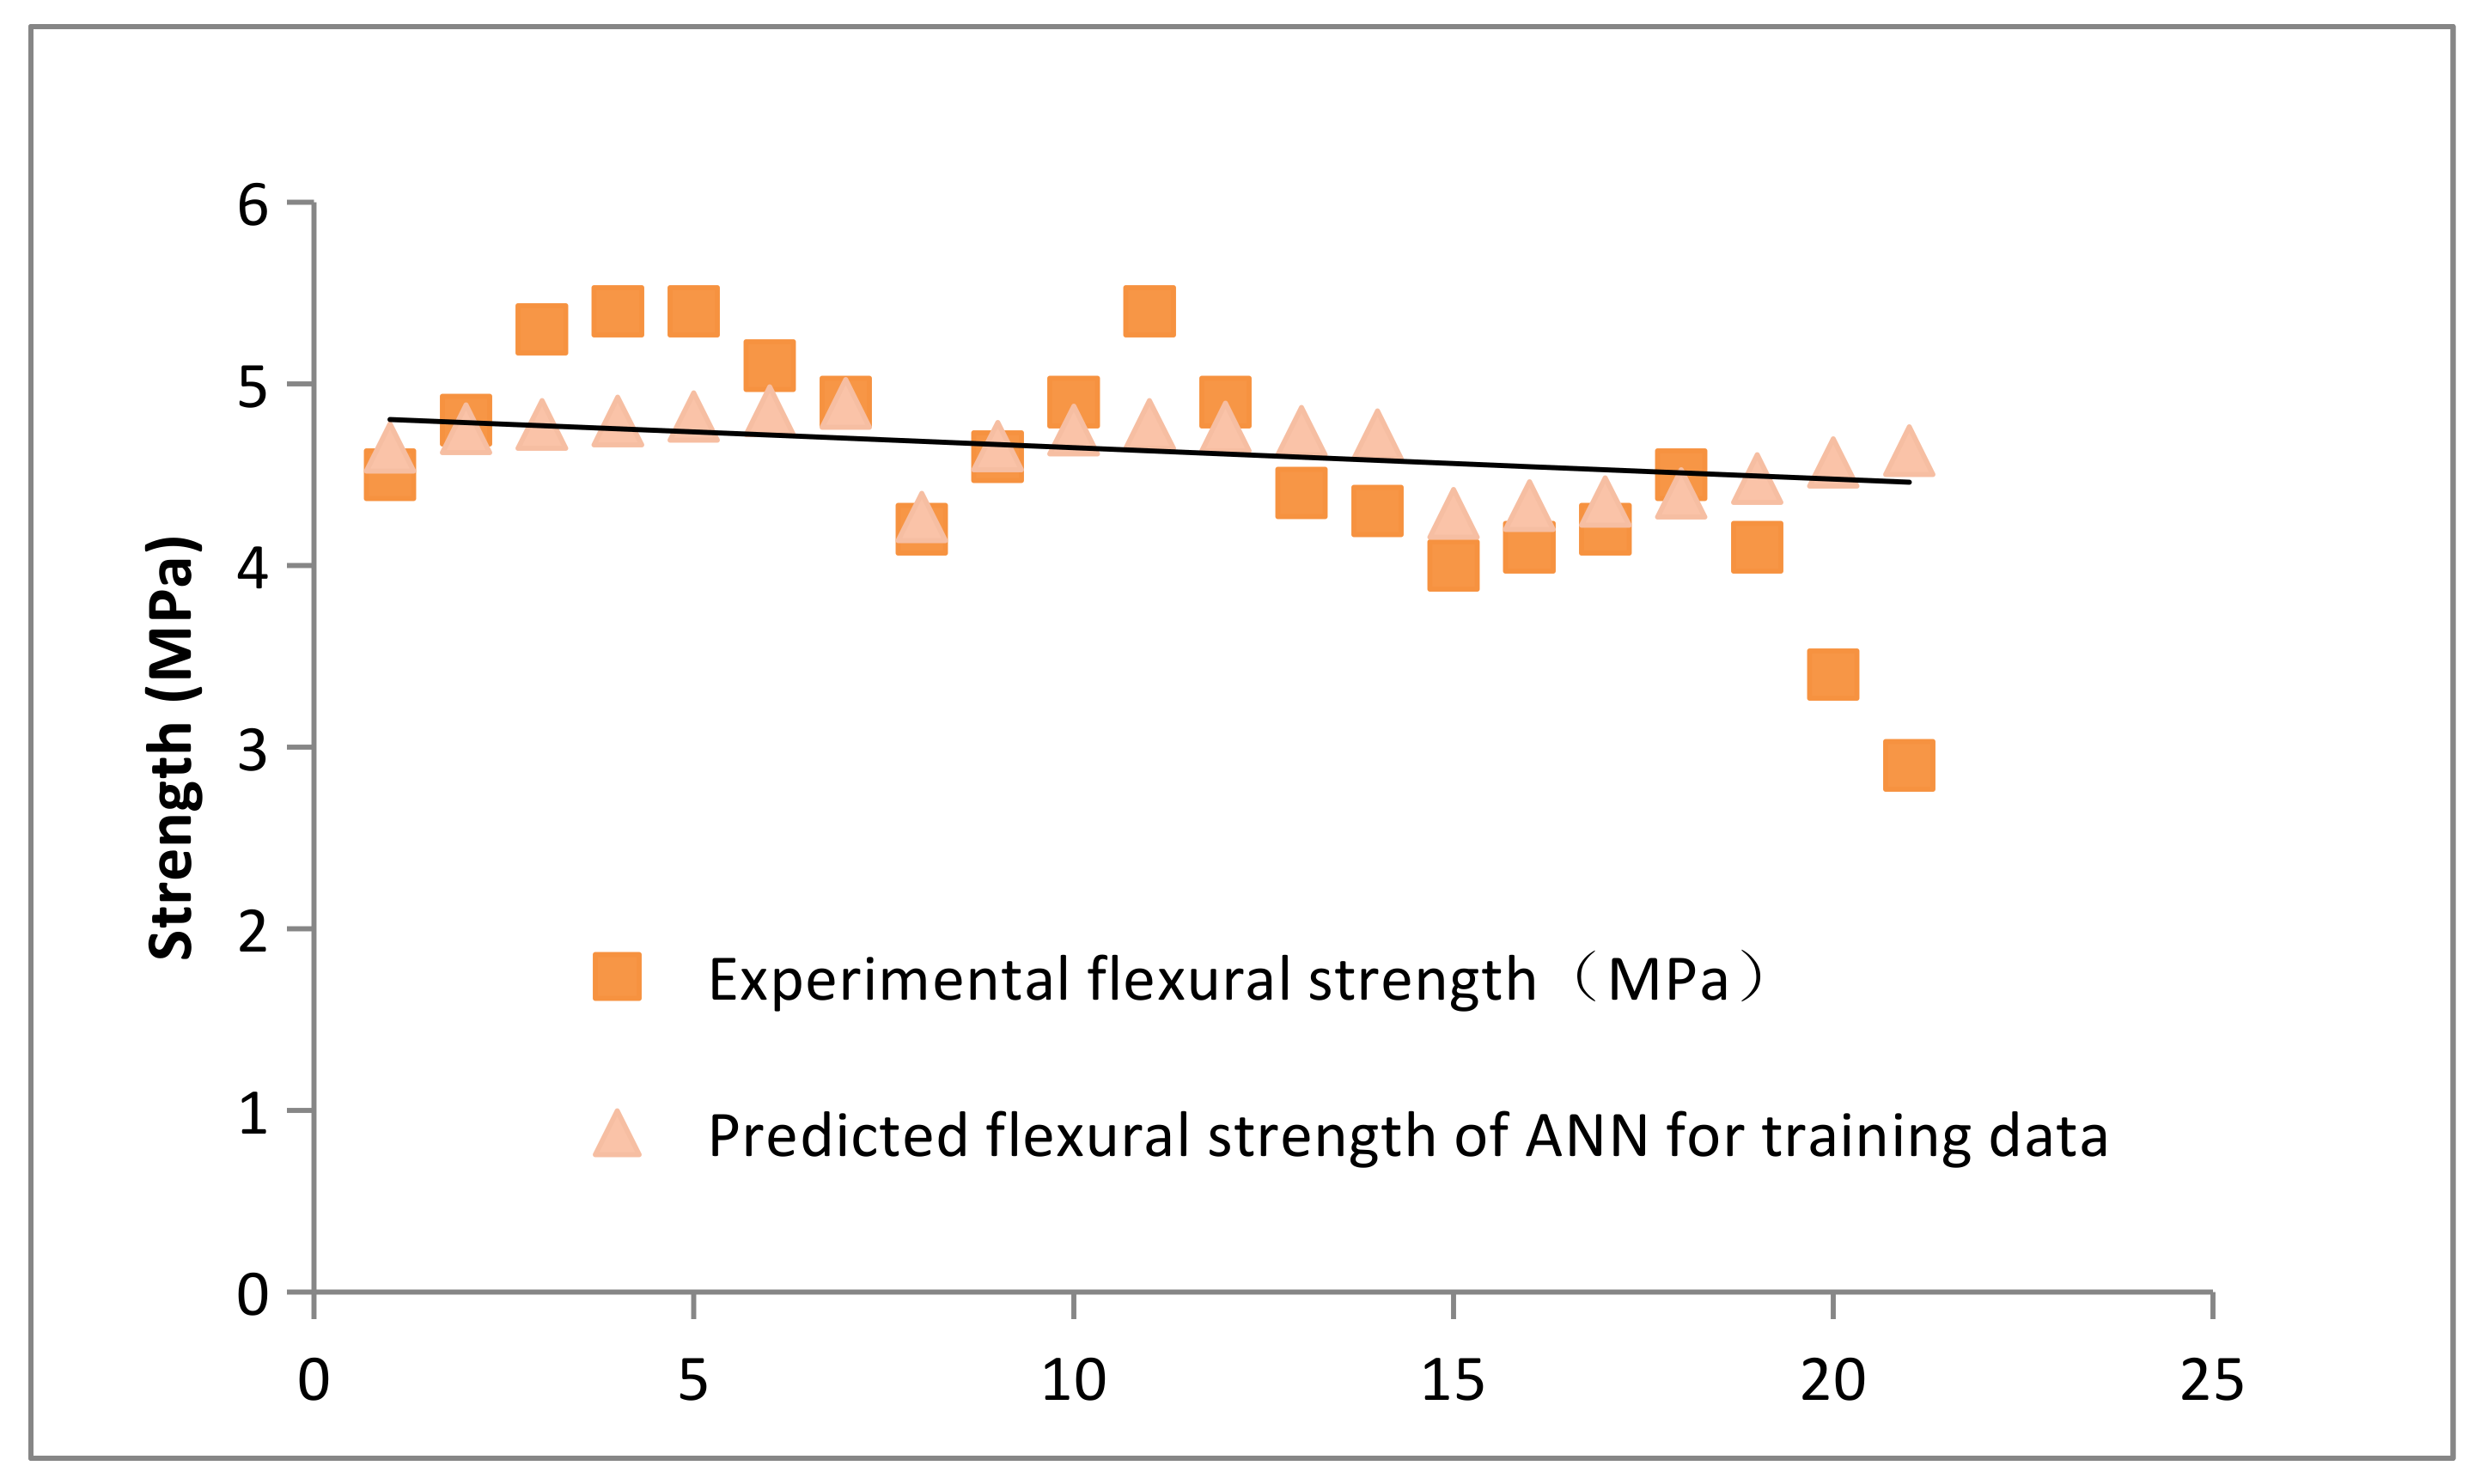
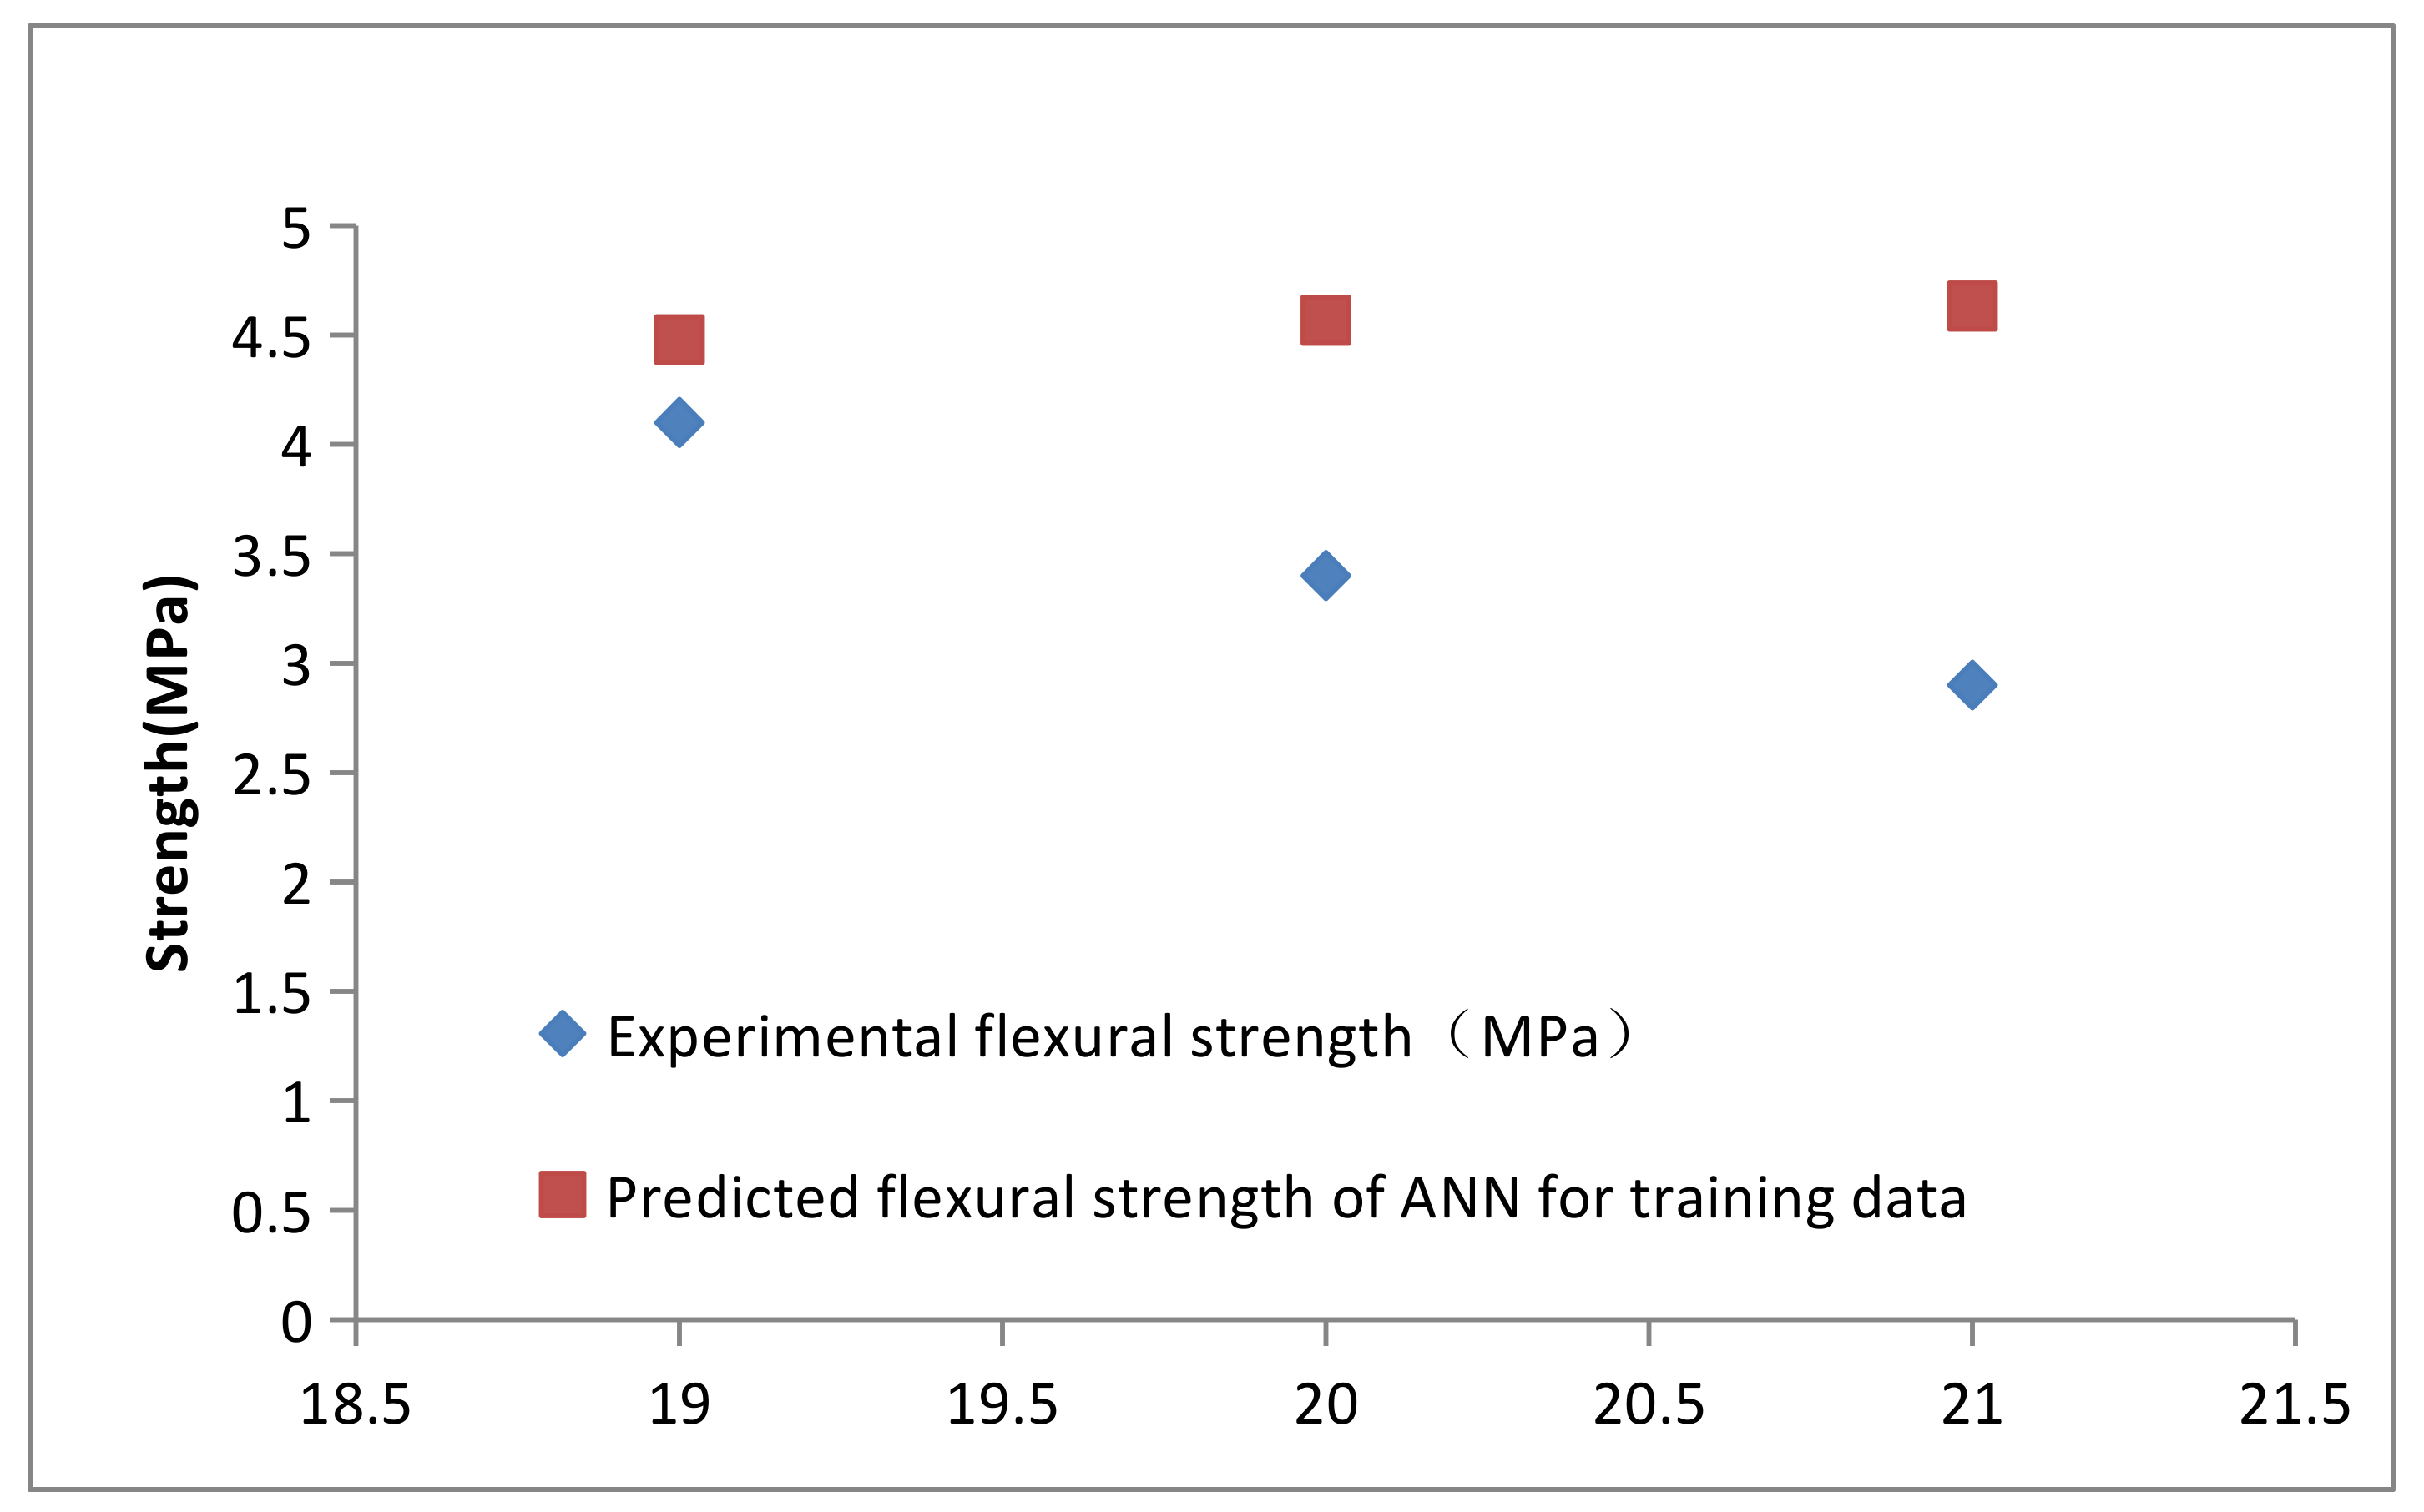
The training time on the PC was less than 5 min. The RMS errors of training data and test data were 0.02 MPa (R2 = 0.99) and 1.65 MPa (R2 = 0.98), respectively. The network was used to predict concrete strength from training data and test data, as shown in Figure 9 and Figure 10, respectively. By comparing Figure 9 and Figure 10, it can be seen that for the experimental data within the concrete strength range, the model obtained by the neural network could predict the experimental results more accurately.
8. Conclusions
Adding an appropriate amount of alkaline activator into fly ash cement can improve the early activity of fly ash and ensure the strength performance of concrete, and the economic benefit is remarkable. In this paper, through the combination of an indoor test, orthogonal test, and neural network, the influence of adding alkali into fly ash on the strength of concrete is studied and analyzed. The main conclusions of this study are as follows:
- On the basis of laboratory tests, the concrete strength analysis is conducted to test the influence of various variables and their interaction on strength. This information can be used to elicit some interesting findings about the role and interaction of factors.
- At the same NaOH and the same age, the strength ratio (the strength ratio of concrete with fly ash and concrete without (pure cement concrete)) decreases significantly with the increase of fly ash, and it decreases significantly with age. Strength is the highest roughly when the NaOH content is 6% or 5%.
- The higher the fly ash content, the lower the overall strength ratio of the mixture, the greater the early age strength reduction, and the same optimal amount of NaOH.
- When high fly ash is substituted, the strength ratio is higher than others at 5% or 6% NaOH. However, under the condition of low fly ash content, in the concrete mixture with a certain w/b content, the strength ratio reduction caused by NaOH dosage for cement is basically the same as that caused by high fly ash concrete.
- As the age decreases, the strength ratio decreases significantly, and the strength ratio decreases more when the fly ash replacement rate is high and the content of NaOH is constant.
- For concrete compressive strength, an orthogonal experimental design can analyze the primary and secondary factors and the best combination of them (cement, fly ash, NaOH, standard, water, etc.). The optimal combination of 3-day intensity was A1B4, and the optimal combination of flexural strength at 28 days was A1B5. The optimal combination of 28 days compressive strength was A1B5 or A1B1. The OED can effectively determine the importance of each factor.
- Based on the mixture data obtained from the mix design test results and orthogonal tests, using the generalization ability of the neural network, a high correlation between the strength and composition of concrete can be developed. The model can effectively simulate the compressive strength behavior of concrete. Therefore, the neural network is much more economical.
Author Contributions
Conceptualization, F.L. and S.T.; methodology, A.G.; investigation, J.X.; data curation, H.L.; writing—original draft preparation, F.L. and J.X. All authors have read and agreed to the published version of the manuscript.
Funding
This work was supported by Famous teacher of Yunnan Province’s “Xingdian talents support program” and the Basic Research Program of Yunnan Province (grant number 2019FD066).
Institutional Review Board Statement
Not applicable.
Informed Consent Statement
Not applicable.
Data Availability Statement
Some or all data, models, or code that support the findings of this study are available from the corresponding author upon reasonable request.
Conflicts of Interest
The authors declare no conflict of interest.
References
- Zhou, S.; Zhang, Y.; Zhou, D.; Wang, W.; Li, D.; Ke, Z. Experimental Study on Mechanical Properties of Fly Ash Stabilized with Cement. Adv. Civ. Eng. 2020, 2020, 6410246. [Google Scholar] [CrossRef]
- Onyari, E.K.; Ikotun, B.D. Prediction of compressive and flexural strengths of a modified zeolite additive mortar using artificial neural network. Constr. Build. Mater. 2018, 187, 1232–1241. [Google Scholar] [CrossRef]
- Herath, C.; Gunasekara, C.; Law, D.W.; Setunge, S. Performance of high volume fly ash concrete incorporating additives: A systematic literature review. Constr. Build. Mater. 2020, 258, 120606. [Google Scholar] [CrossRef]
- Jun, X.; Ding, Y.; Cao, M. Research progress on the design of self-compacting concrete ratio. Concrete 2013, 8, 105–109. (In Chinese) [Google Scholar]
- Medina, A.L.N.; García, J.A.; Castellanos, N.T. Flexural behavior of environmentally friendly ultra-high-performance concrete with locally available low-cost synthetic fibers. Eur. J. Environ. Civ. Eng. 2021, 1–24. [Google Scholar] [CrossRef]
- Prasad, V.D.; Prakash, E.L.; Abishek, M.; Dev, K.U.; Kiran, C.K.S. Study on concrete containing waste foundry sand, fly ash and polypropylene fibre using Taguchi method. Mater. Today Proc. 2018, 5, 23964–23973. [Google Scholar] [CrossRef]
- Sun, J.; Zhou, Y.; Ge, X.; Cai, J.; Han, Y.; Zhang, H.; Wang, J.; Zhang, L.; Chen, D.; Hua, H.; et al. Research on Multiobjective Optimization of Bulb Tubular Turbine Based on Orthogonal Test. Shock Vib. 2021, 2021, 5581455. [Google Scholar] [CrossRef]
- Yeh, I.-C. Analysis of Strength of Concrete Using Design of Experiments and Neural Networks. J. Mater. Civ. Eng. 2006, 18, 597–604. [Google Scholar] [CrossRef]
- Gao, S.; Liu, Q.; Han, F.; Fu, Y. Mix Design of Recycled Coarse Aggregate Self-Compacting Concrete Based on Orthogonal Test and Analysis of Mercury Intrusion Porosimetry. Adv. Mater. Sci. Eng. 2021, 2021, 4829673. [Google Scholar] [CrossRef]
- Hosein, N.; Amir, H.R.; Pouyan, F. Compressive strength prediction of environmentally friendly concrete using artificial neural networks. J. Build. Eng. 2018, 16, 213–219. [Google Scholar]
- Shahmansouri, A.A.; Yazdani, M.; Ghanbari, S.; Bengar, H.A.; Jafari, A.; Ghatte, H.F. Artificial neural network model to predict the compressive strength of eco-friendly geopolymer concrete incorporating silica fume and natural zeolite. J. Clean. Prod. 2021, 279, 123697. [Google Scholar] [CrossRef]
- Khambra, G.; Shukla, P. Novel machine learning applications on fly ash based concrete: An overview. Mater. Today Proc. 2021; in press. ISSN 2214-7853. [Google Scholar] [CrossRef]
- Ly, H.-B.; Nguyen, T.-A.; Mai, H.-V.T.; Tran, V.Q. Development of deep neural network model to predict the compressive strength of rubber concrete. Constr. Build. Mater. 2021, 301, 124081. [Google Scholar] [CrossRef]
- Mohammed, S.I.; Najim, K.B. Mechanical strength, flexural behavior and fracture energy of recycled concrete aggregate self-compacting concrete. Structure 2020, 23, 34–43. [Google Scholar] [CrossRef]
- Liu, Q.; Han, F.; Yu, G.; Xu, P. Basic mechanical properties of recycled coarse aggregate self-compacting concrete. J. Build. Mater. 2020, 23, 65–72. (In Chinese) [Google Scholar]
- Asteris, P.G.; Mokos, V.G. Concrete compressive strength using artificial neural networks. Neural Comput. Appl. 2020, 32, 11807–11826. [Google Scholar] [CrossRef]
- Liu, Q.; Iqbal, M.F.; Yang, J.; Lu, X.; Zhang, P.; Rauf, M. Prediction of chloride diffusivity in concrete using artificial neural network: Modelling and performance evaluation. Constr. Build. Mater. 2021, 268, 121082. [Google Scholar] [CrossRef]
- Cao, X. Study on the Variation Rule of Pore Structure of Natural Pumice Concrete Based on NMR Technology; Inner Mongolia University of Technology: Hohhot, China, 2020. [Google Scholar]
- Kapoor, K.; Singh, S.P.; Singh, B.; Singh, P. Effect of recycled aggregates on fresh and hardened properties of self compacting concrete. Mater. Today Proc. 2020, 32, 600–607. [Google Scholar] [CrossRef]
- Singh, A.; Mohapatra, P.K.; Kalyanasundaram, D.; Kumar, S. Self-functionalized ultrastable water suspension of luminescent carbon quantum dots. Mater. Chem. Phys. 2019, 225, 23–27. [Google Scholar] [CrossRef]
- Tang, W.C. Fresh properties of self-compacting concrete with coarse recycled aggregate. Adv. Mater. Res. 2012, 602–604, 938–942. [Google Scholar] [CrossRef]
- Kim, Y.; Hanif, A.; Usman, M.; Park, W. Influence of bonded mortar of recycled concrete aggregates on interfacial characteristics-porosity assessment based on pore segmentation from backscattered electron image analysis. Constr. Build. Mater. 2019, 212, 149–163. [Google Scholar] [CrossRef]
- Ge, Z.; Liu, X.; Li, Q. Study on properties of selfcompacting concrete with recycled fine aggregate. J. Build. Struct. 2019, 49, 672–676. (In Chinese) [Google Scholar]
- Xiang, X.; Zhao, R.; Li, F.; Liao, P. Experimental investigation of basic mechanical properties of self-compacting recycled aggregate concrete. J. Southwest Jiaotong Univ. 2019, 54, 359–365. (In Chinese) [Google Scholar]
- Hanif, A.; Kim, Y.; Lu, Z.; Park, C. Early-age behavior of recycled aggregate concrete under steam curing regime. J. Clean. Prod. 2017, 152, 103–114. [Google Scholar] [CrossRef]
- Zine-el-abidine, T.; Tien-Tung, N.; El Hadj, K.; Adrien, B.; Farid, D.; Salima, A. Effect of cement and admixture on the utilization of recycled aggregates in concrete. Constr. Build. Mater. 2017, 149, 91–102. [Google Scholar]
- Lavado, J.; Bogas, J.; De Brito, J.; Hawreen, A. Fresh properties of recycled aggregate concrete. Constr. Build. Mater. 2020, 233, 117322. [Google Scholar] [CrossRef]
- Barnhouse, P.W.; Srubar, W.V. Material characterization and hydraulic conductivity modeling of macroporous recycled-aggregate pervious concrete. Constr. Build. Mater. 2016, 110, 89–97. [Google Scholar] [CrossRef]
- Huo, J.; Cao, X.; Wang, X.; Ji, Y.; Li, H. Influence of natural pumice concrete pore structure on its compressive strength. Bull. Chin. Ceram. Soc. 2020, 39, 84–89. (In Chinese) [Google Scholar]
- Golewski, G.L. Effect of curing time on the fracture toughness of fly ash concrete composites. Compos. Struct. 2018, 185, 105–112. [Google Scholar] [CrossRef]
- Zhou, S.; Zhang, Y.; Zhou, D.; Wang, W.; Li, D.; Ke, Z. Hydration characteristic of low heat Portland cement mixtures with fly ash or slag. Port Waterw. Eng. 2019, 599, 63–69. [Google Scholar]
- Liu, F.; Gong, A.; Wang, L.; Yang, Y. Experimental study on mechanical properties of fly ash—Cement concrete with alkali-admixture. S. N. Water Divers. Water Conserv. Technol. 2014, 12, 134–137. (In Chinese) [Google Scholar]
- Liu, F.; Gong, A.; Peng, Y.; Long, L.; Wang, X. Experimental study on strength performance of fly ash—Cement rubber sand with alkali—Adding activator. Hydraul. Electrogener. 2014, 40, 100–102. (In Chinese) [Google Scholar]
- Liu, F.; Xu, J.; Gong, A.; Chen, C.; Xie, F.; Luo, C. Application of THREE-DIMENSIONAL numerical simulation in strength test of fly ash and cement mortar with alkali addition. Jiangxi Sci. 2020, 38, 388–393. (In Chinese) [Google Scholar]
- Liu, F.; Yang, R.; Xu, J.; Gong, A.; Xie, F.; Luo, C. Experimental study on the strength performance of fly ash cement doped with sodium hydroxide activator. Fly Ash Compr. Util. 2019, 6, 3–6+50. (In Chinese) [Google Scholar]
- Chen, Q.; Zhu, H.; Ju, J.; Yan, Z.; Wang, C.; Jiang, Z. A stochastic micromechanical model for fiber-reinforced concrete using maximum entropy principle. Acta Mech. 2018, 229, 2719–2735. [Google Scholar] [CrossRef]
- Chen, Q.; Zhu, H.; Ju, J.W.; Jiang, Z.; Yan, Z.; Li, H. Stochastic micromechanical predictions for the effective properties of concrete considering the interfacial transition zone effects. Int. J. Damage Mech. 2018, 27, 1252–1271. [Google Scholar] [CrossRef]
- Chen, Q.; Zhu, H.H.; Ju, J.W.; Guo, F.; Wang, L.B.; Yan, Z.G.; Deng, T.; Zhou, S. A Stochastic Micromechanical model for Multiphase Composite Containing Spherical Inhomogeneities. Acta Mech. 2015, 226, 1861–1880. [Google Scholar] [CrossRef]
Figure 1.
NaOH content–compressive strength curves at 3 days.

Figure 2.
NaOH content–flexural strength curves at 3 days.

Figure 3.
NaOH content–compressive strength curves at 28 days.

Figure 4.
NaOH content–flexural strength curves at 28 days.

Figure 5.
Response surface of compressive strength at 3 days.

Figure 6.
Response surface of flexural strength at 3 days.

Figure 7.
Response surface of compressive strength at 28 days.

Figure 8.
Response surface of flexural strength at 28 days.

Figure 9.
Tested and predicted flexural strength of ANN for training data.

Figure 10.
Tested and predicted flexural strength of ANN for testing data.


Table 1.
Mixing ratio of mortar.
| Cementitious Material/g | Standard Sand/g | Mixing Water/mL |
|---|---|---|
| 450 ± 2 | 1350 ± 5 | 225 ± 1 |
Table 2.
Orthogonal test design table.
| 3 Days Flexural | 3 Days Compression | 28 Days Flexural | 28 Days Compression | |||||
|---|---|---|---|---|---|---|---|---|
| A (Fly Ash) | B (NaOH) | A (Fly Ash) | B (NaOH) | A (Fly Ash) | B (NaOH) | A (Fly Ash) | B (NaOH) | |
| 5.06 | 4.23 | 22.07 | 17.9 | 8.71 | 8.43 | 45.94 | 42.3 | |
| 4.67 | 4.5 | 18.86 | 18.8 | 8.33 | 7.93 | 39.2 | 37.37 | |
| 3.89 | 4.8 | 14.1 | 19.57 | 7.59 | 8.03 | 31.34 | 38.1 | |
| 5.1 | 20.57 | 8.1 | 38.57 | |||||
| 4.8 | 18.5 | 8.7 | 42.17 | |||||
| 4.3 | 17.07 | 8.37 | 38.47 | |||||
| 4.03 | 16 | 7.9 | 34.83 | |||||
| R (the average poor) | 1.17 | 1.07 | 7.97 | 4.57 | 1.12 | 0.8 | 14.6 | 7.47 |
| Primary and secondary factors | A > B | A > B | A > B | A > B | ||||
| Optimal combination | A1B4 | A1B4 | A1B5 | A1B1 or A1B5 | ||||
Publisher’s Note: MDPI stays neutral with regard to jurisdictional claims in published maps and institutional affiliations. |
© 2022 by the authors. Licensee MDPI, Basel, Switzerland. This article is an open access article distributed under the terms and conditions of the Creative Commons Attribution (CC BY) license (https://creativecommons.org/licenses/by/4.0/).
Share and Cite
MDPI and ACS Style
Liu, F.; Xu, J.; Tan, S.; Gong, A.; Li, H. Orthogonal Experiments and Neural Networks Analysis of Concrete Performance. Water 2022, 14, 2520. https://doi.org/10.3390/w14162520
AMA Style
Liu F, Xu J, Tan S, Gong A, Li H. Orthogonal Experiments and Neural Networks Analysis of Concrete Performance. Water. 2022; 14(16):2520. https://doi.org/10.3390/w14162520
Chicago/Turabian StyleLiu, Feipeng, Jing Xu, Shucheng Tan, Aimin Gong, and Huimei Li. 2022. "Orthogonal Experiments and Neural Networks Analysis of Concrete Performance" Water 14, no. 16: 2520. https://doi.org/10.3390/w14162520
Note that from the first issue of 2016, this journal uses article numbers instead of page numbers. See further details here.