
Breakthrough Curves Prediction of Selenite Adsorption on Chemically Modified Zeolite Using Boosted Decision Tree Algorithms for Water Treatment Applications

 ,
,  , ,
, ,  ,
,  , and
, and
Abstract
:1. Introduction
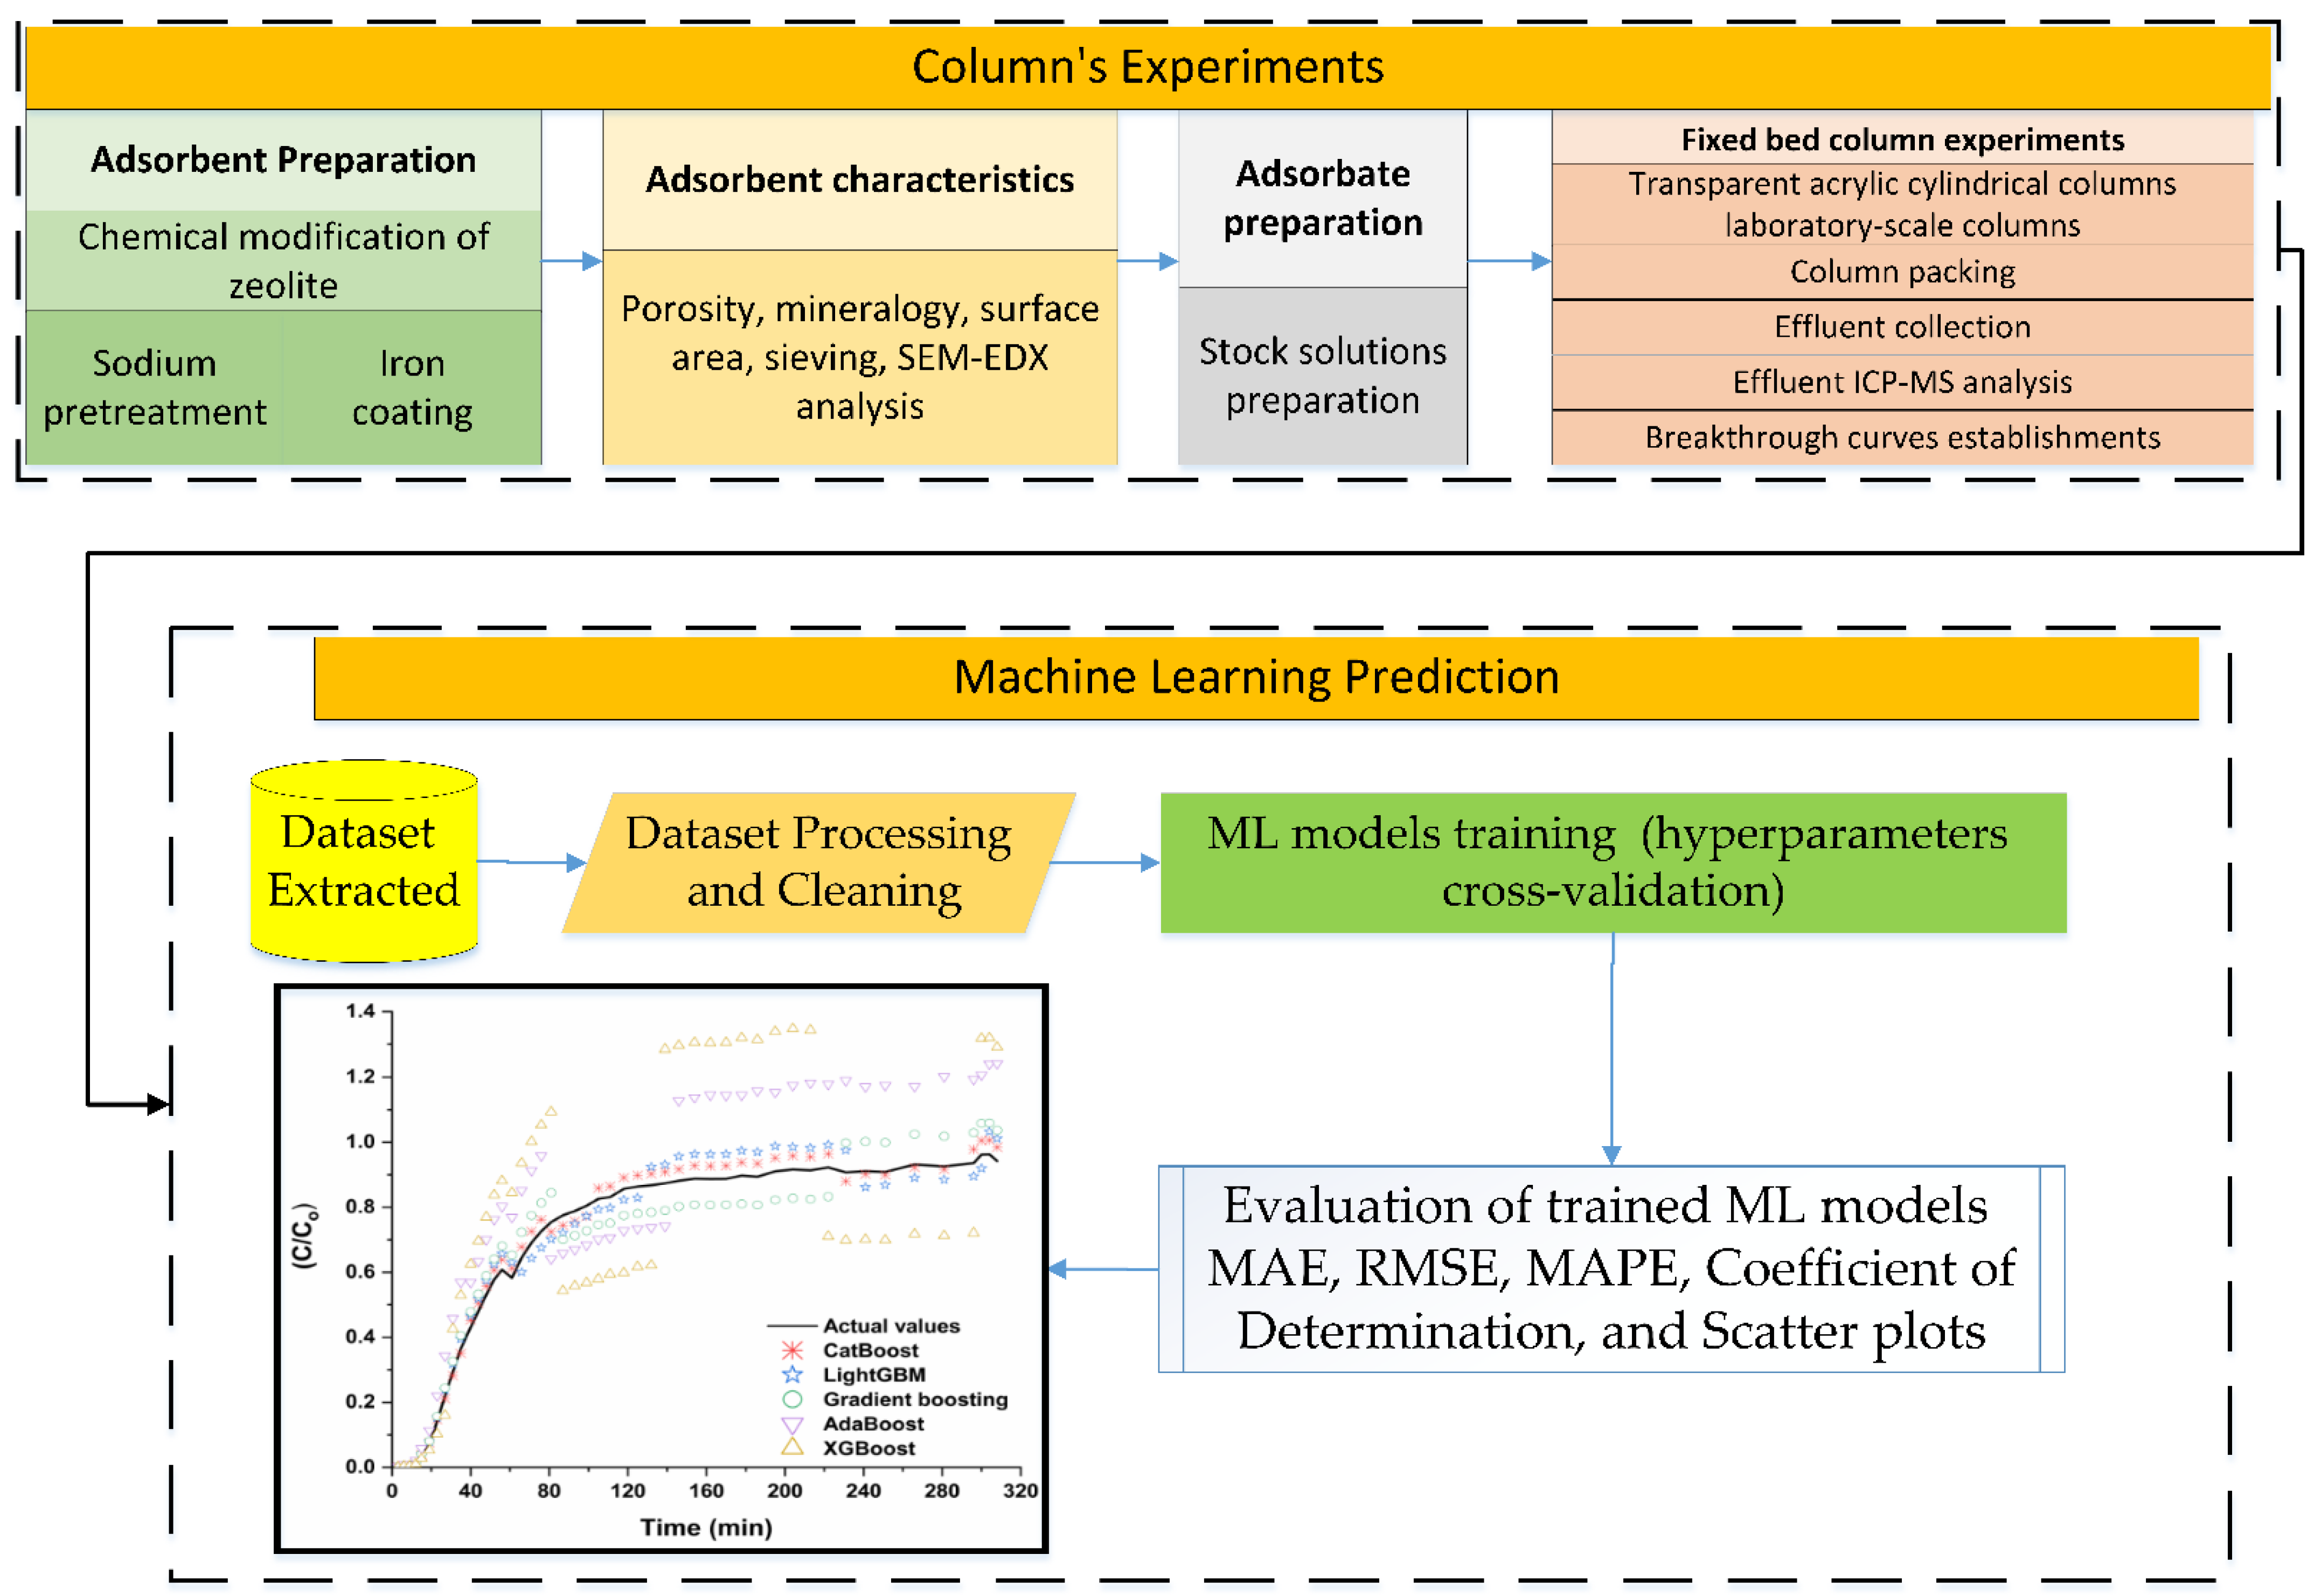
2. Methodology
2.1. Natural Zeolite Pretreatment and Iron Modification
2.2. Adsorbate Preparation
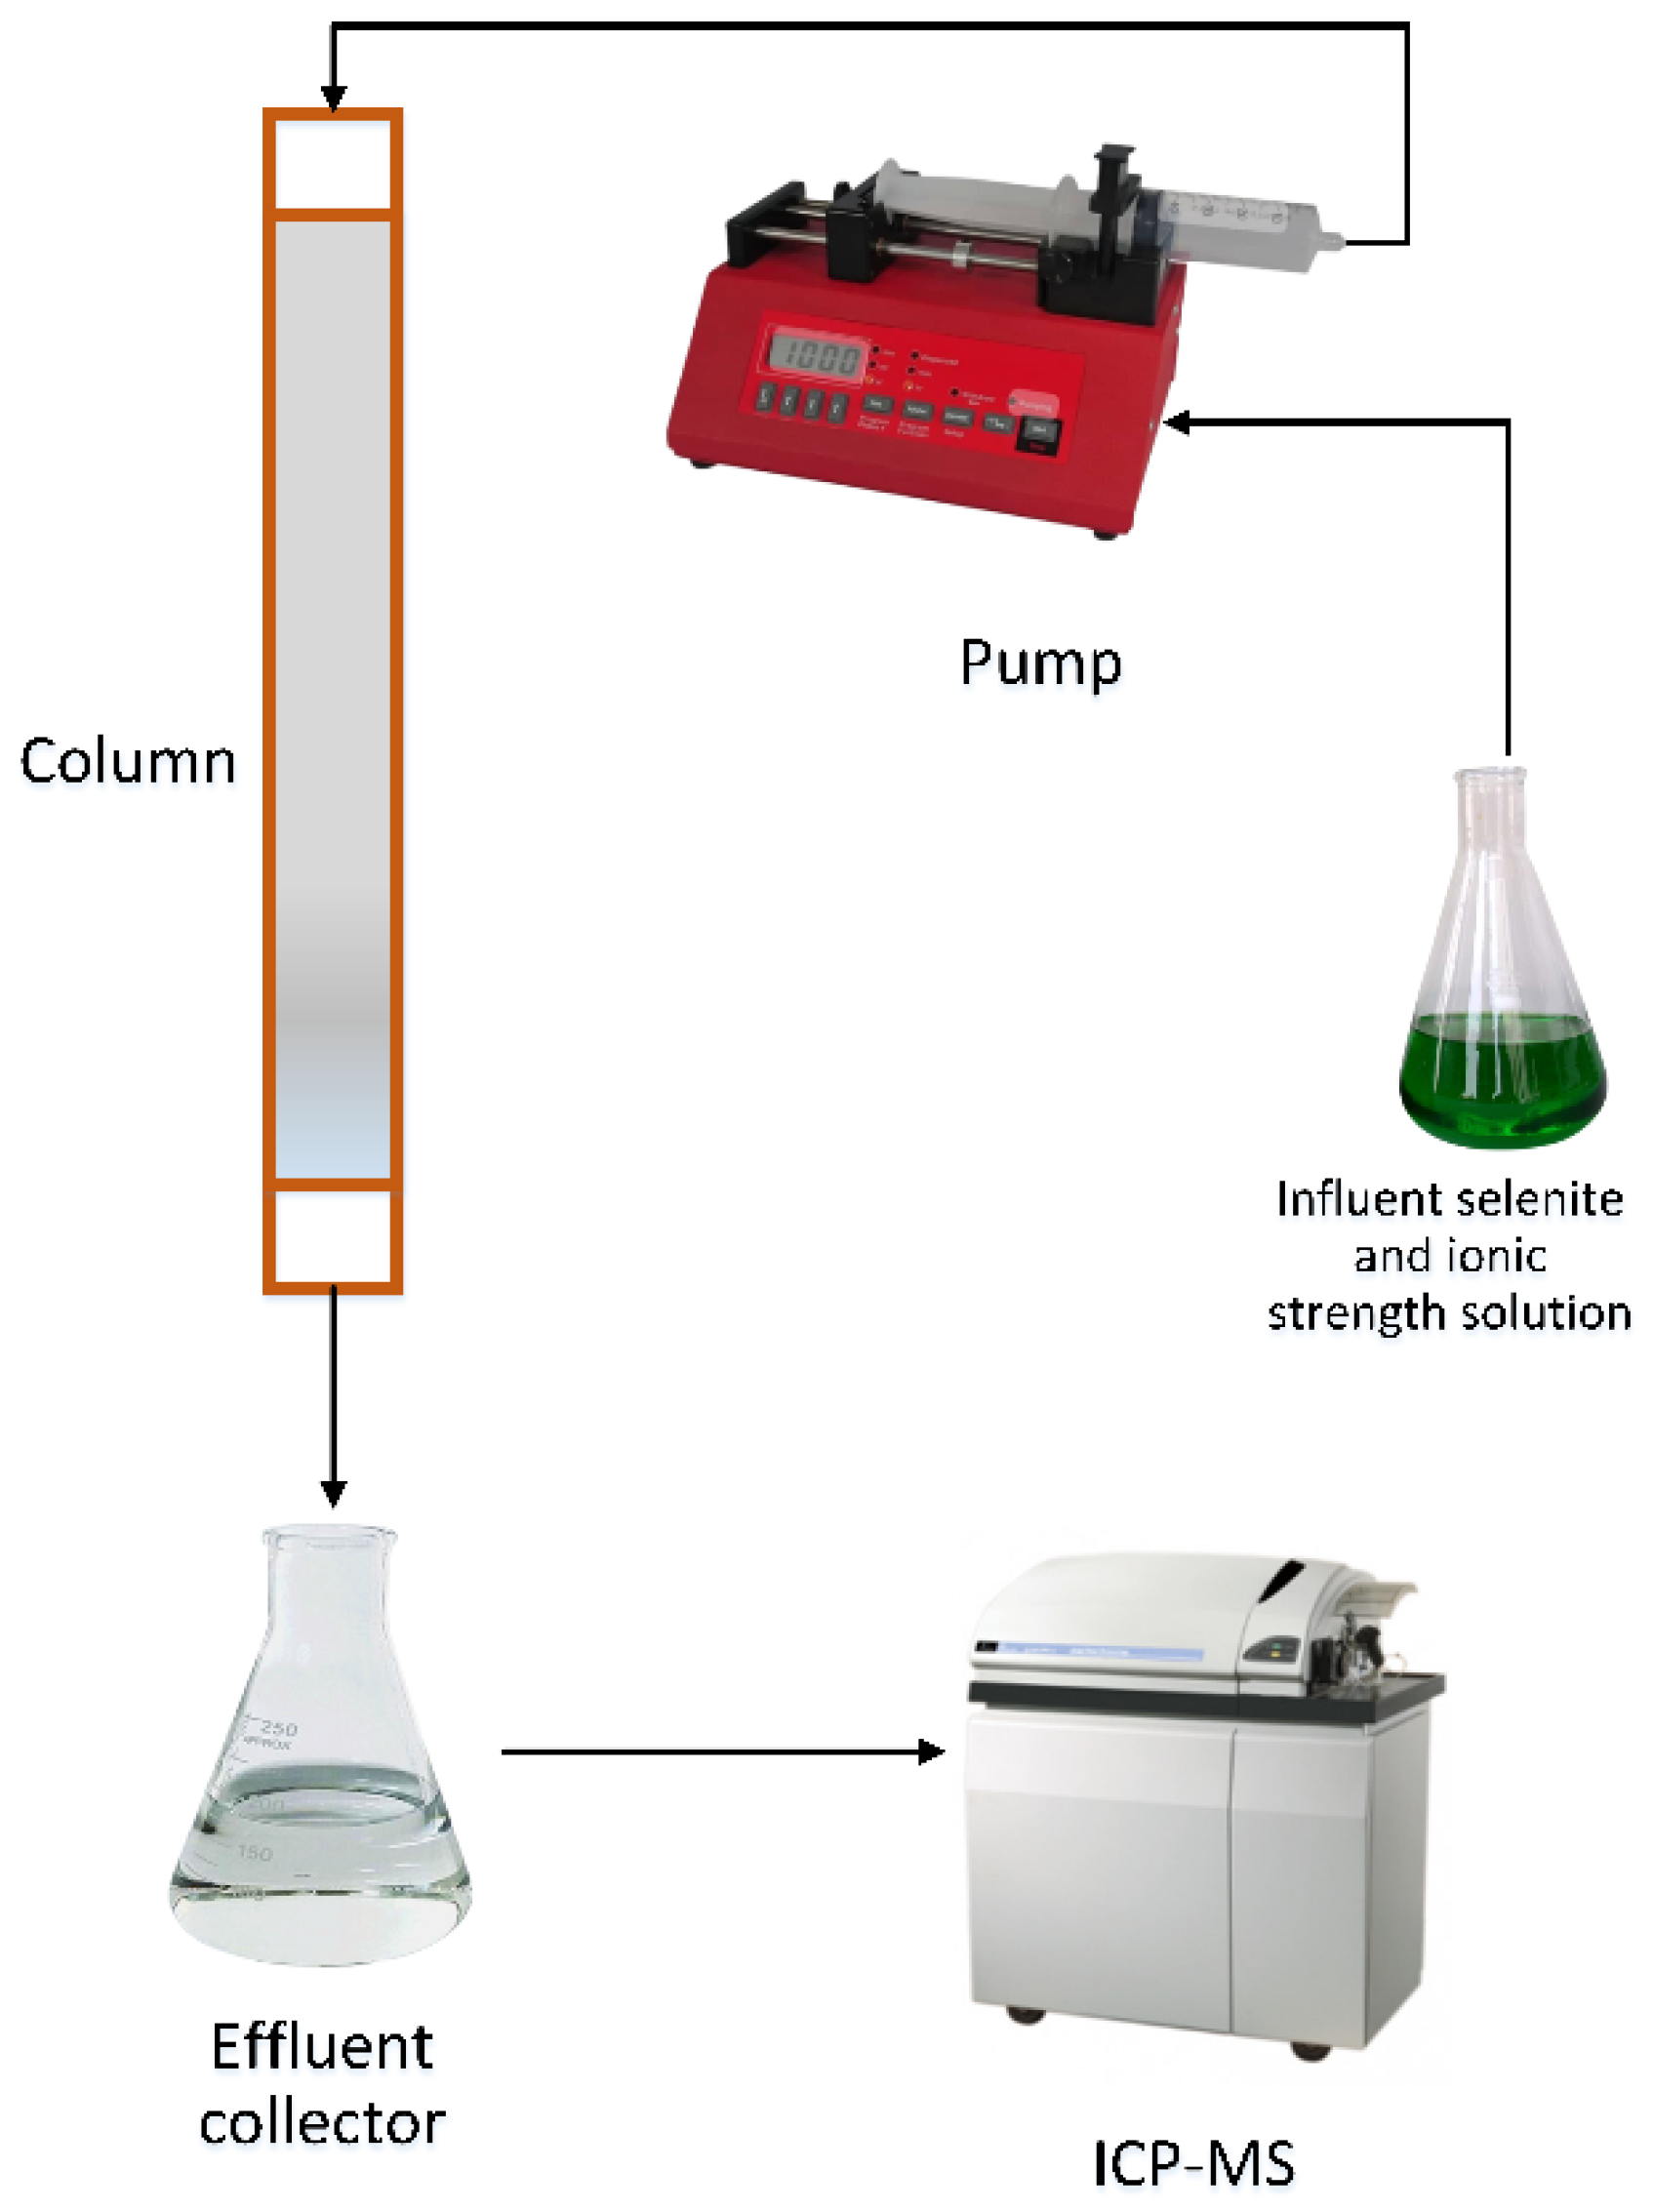
2.3. Determination of Breakthrough Curves for Selenite Adsorption on Modified Zeolite Using Packed-Bed Micro-Columns
2.4. Model Formulation
2.4.1. Multilinear and Non-Linear Regression
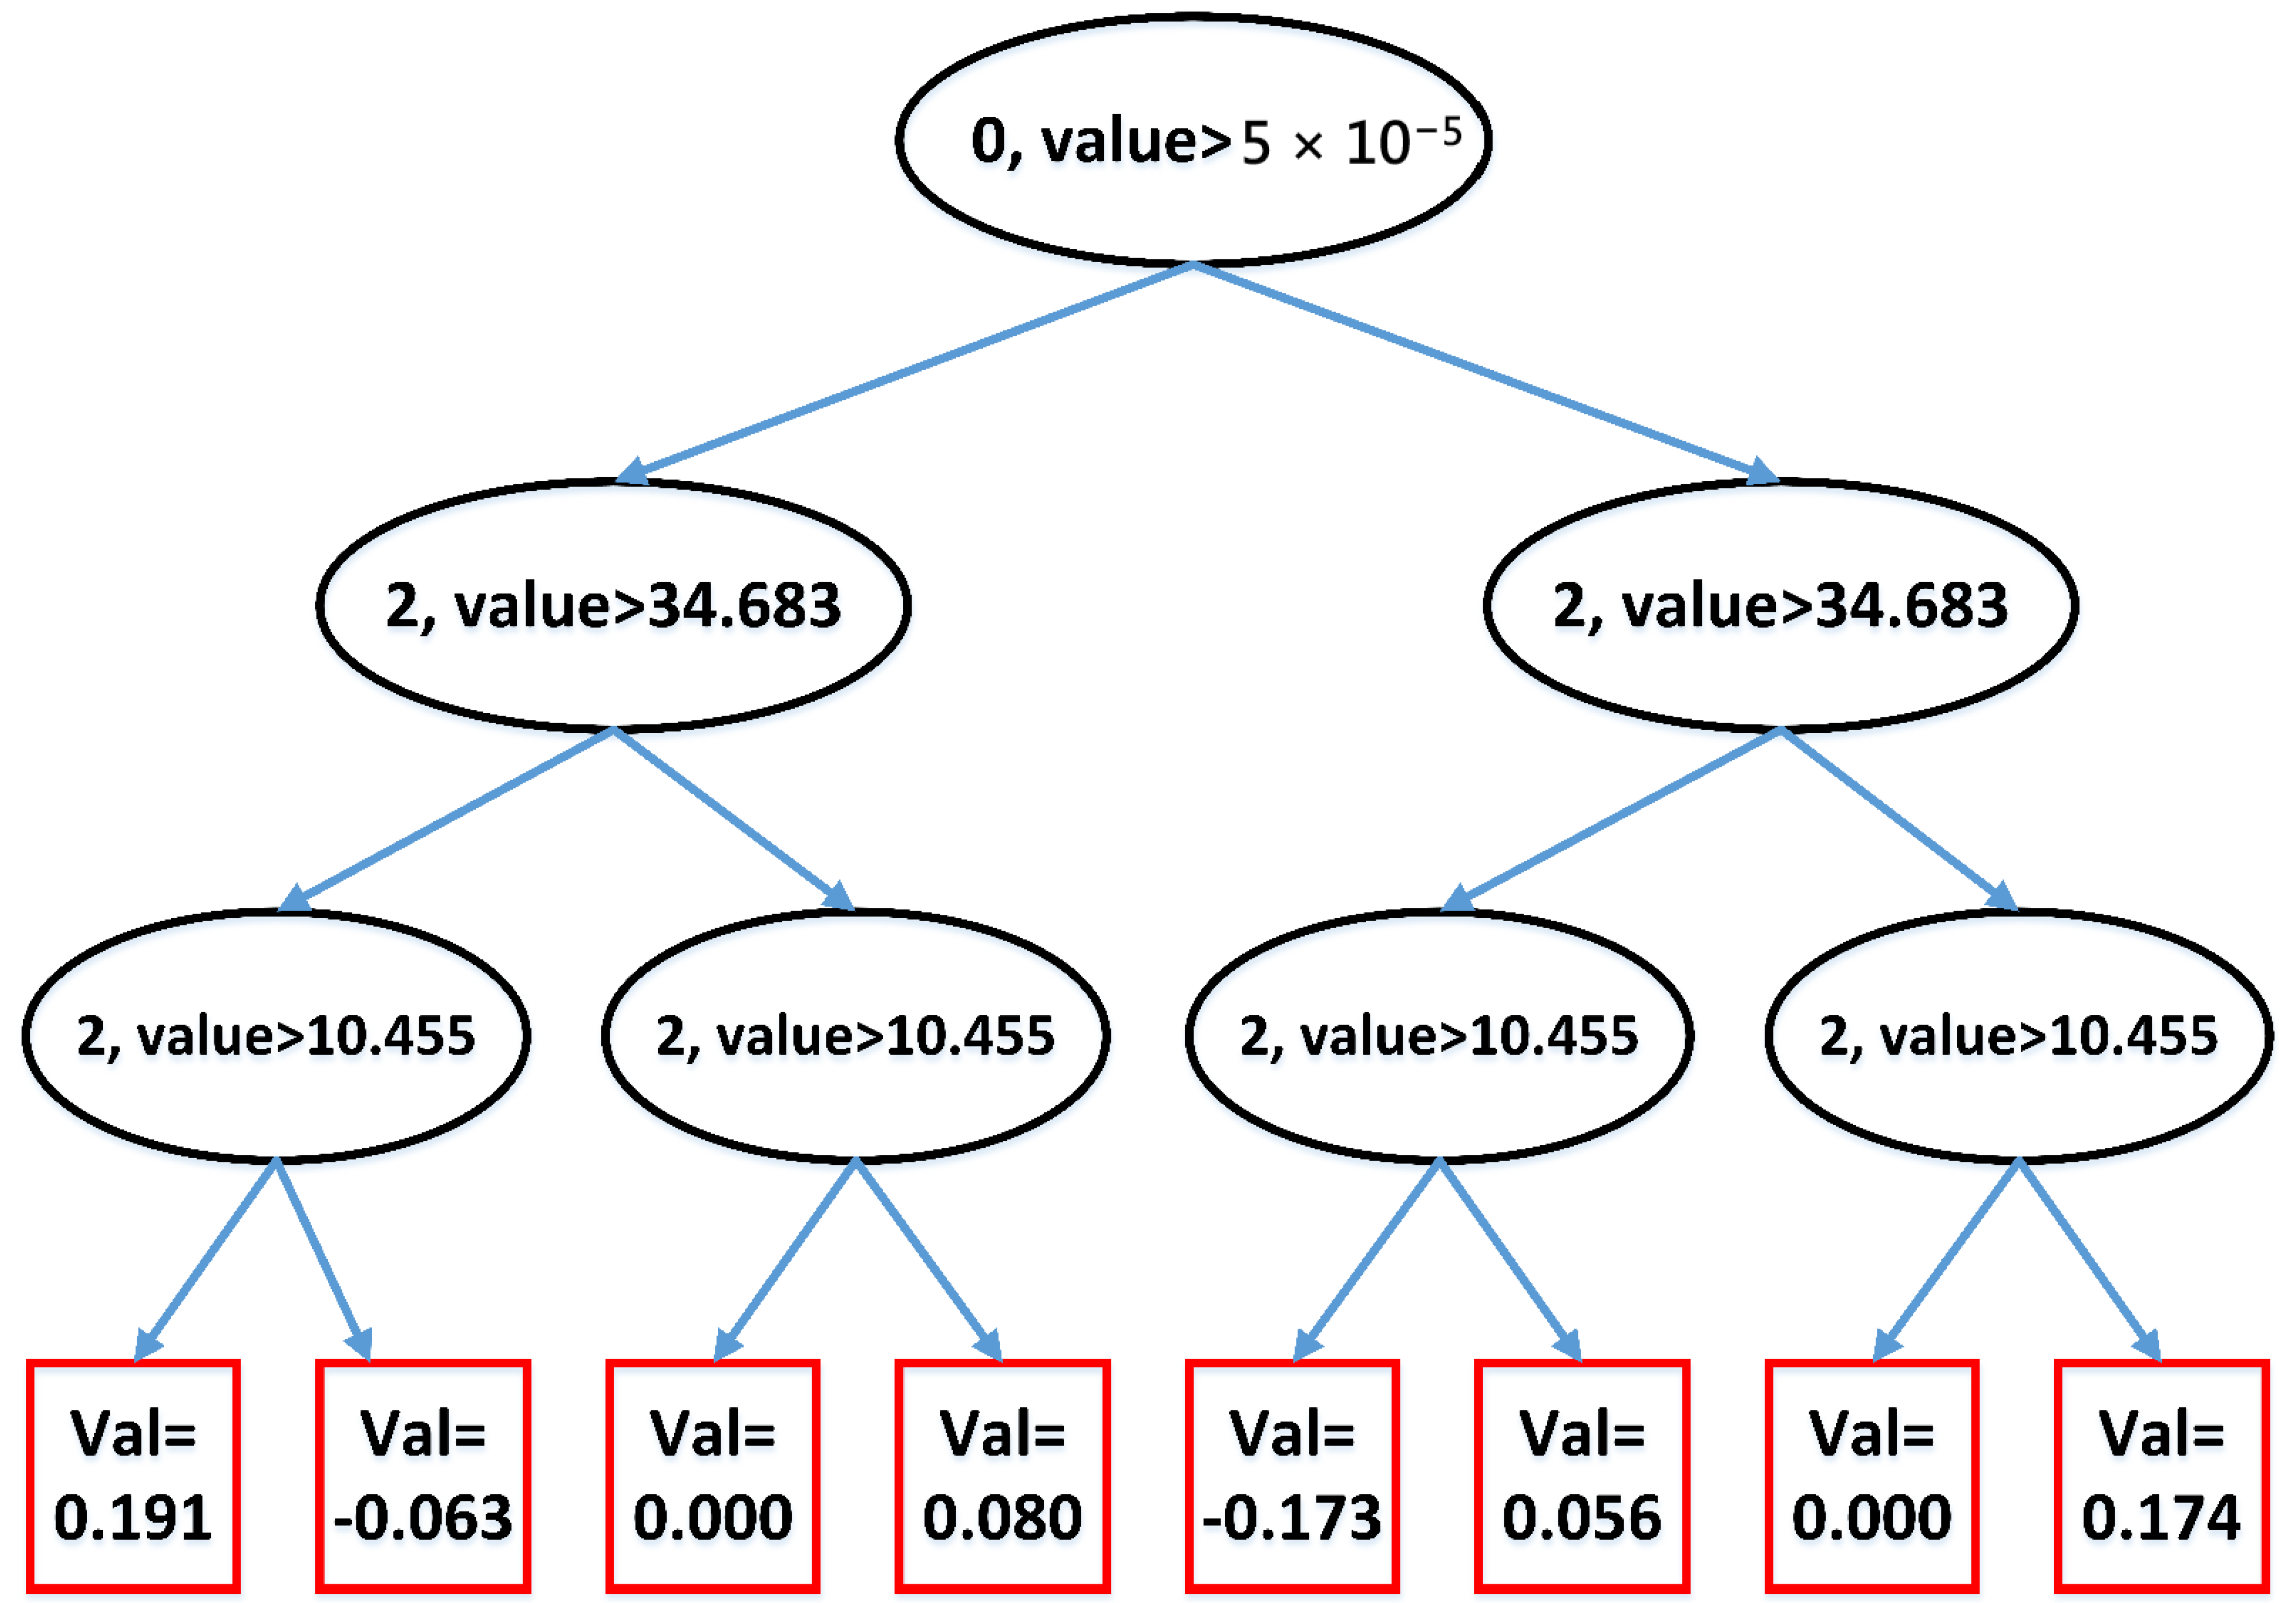
2.4.2. Boosted Decision Tree Algorithms
- -
- AdaBoost
- -
- Gradient Boosting
- -
- CatBoost
- -
- XGBoost
- -
- LightGBM
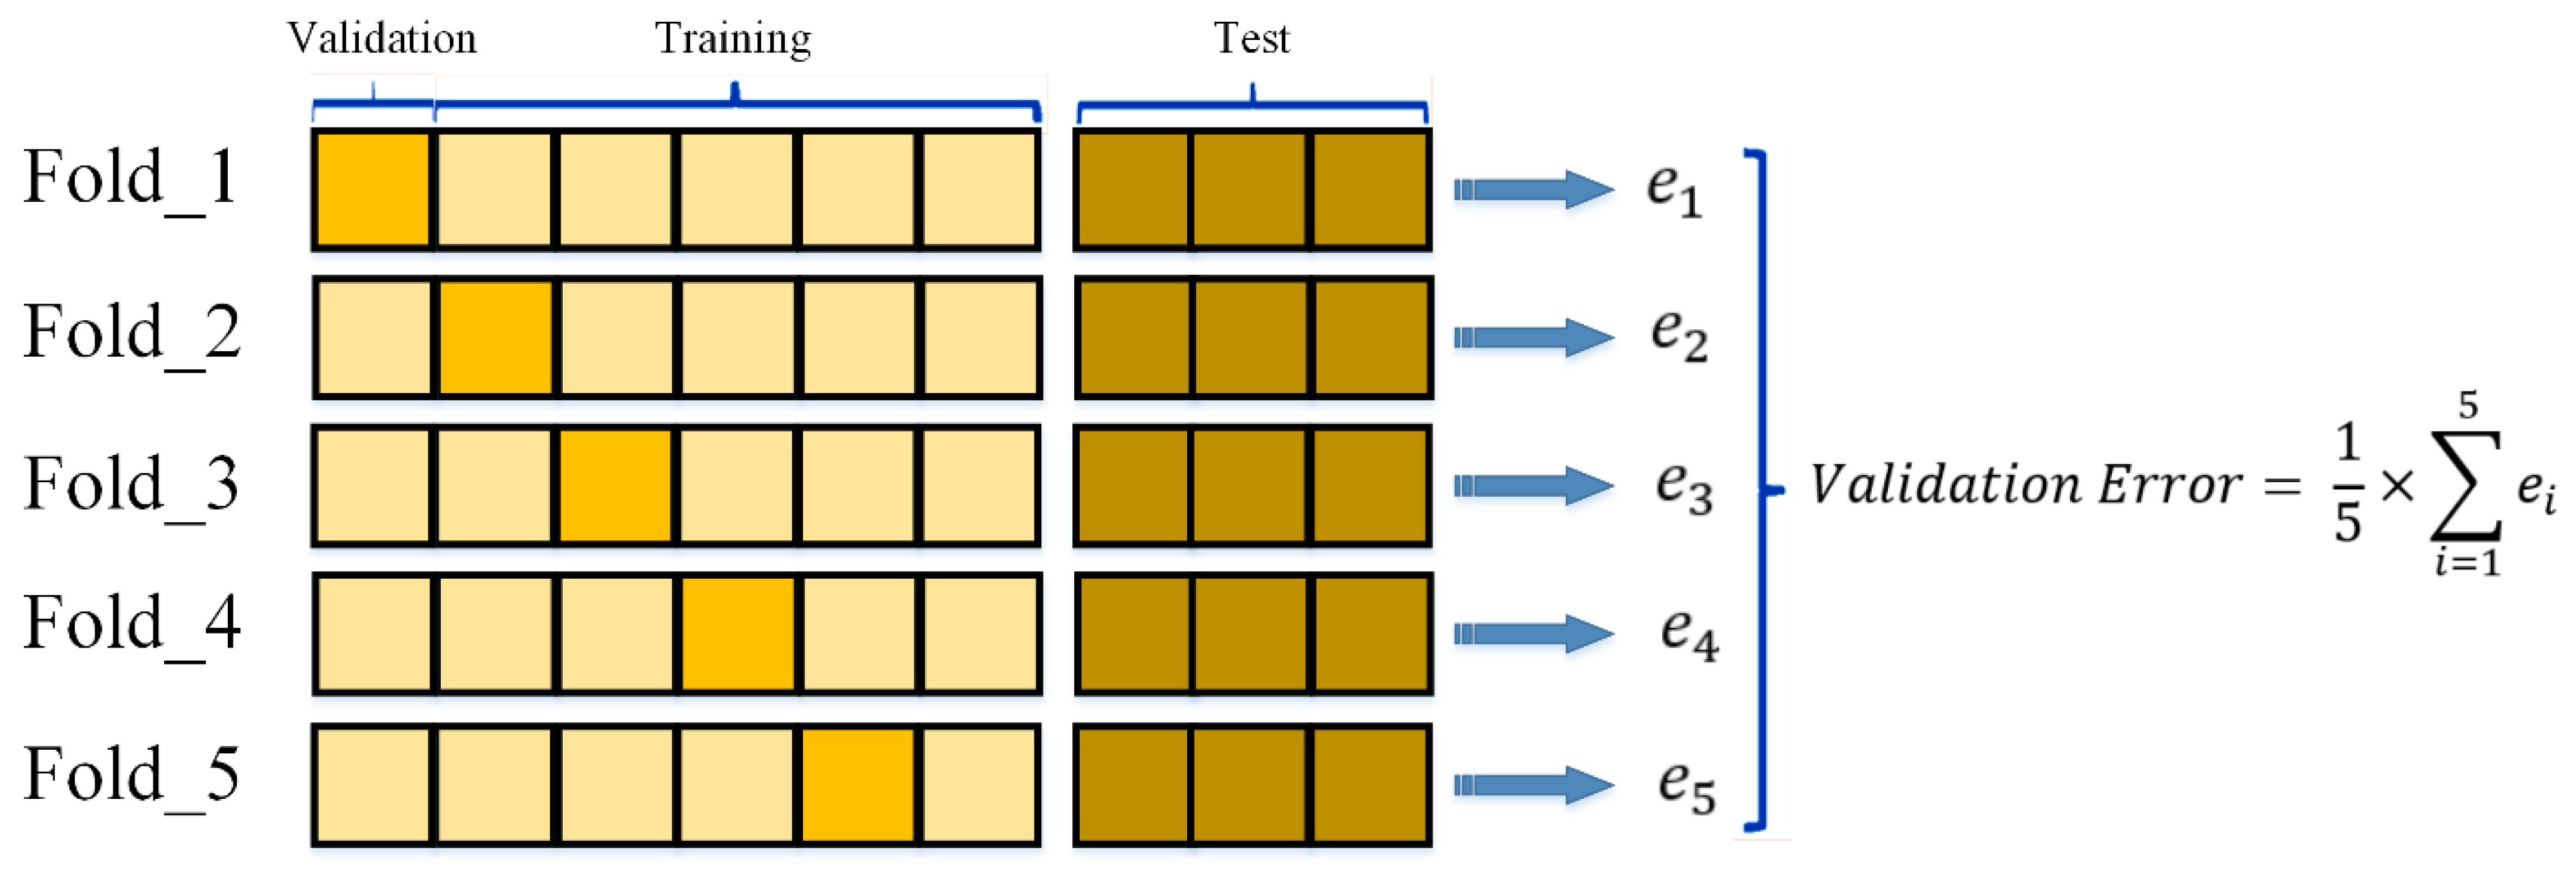
2.5. Cross-Validation
2.6. Evaluation Measurement
3. Selenite Adsorption Dataset (SAD)
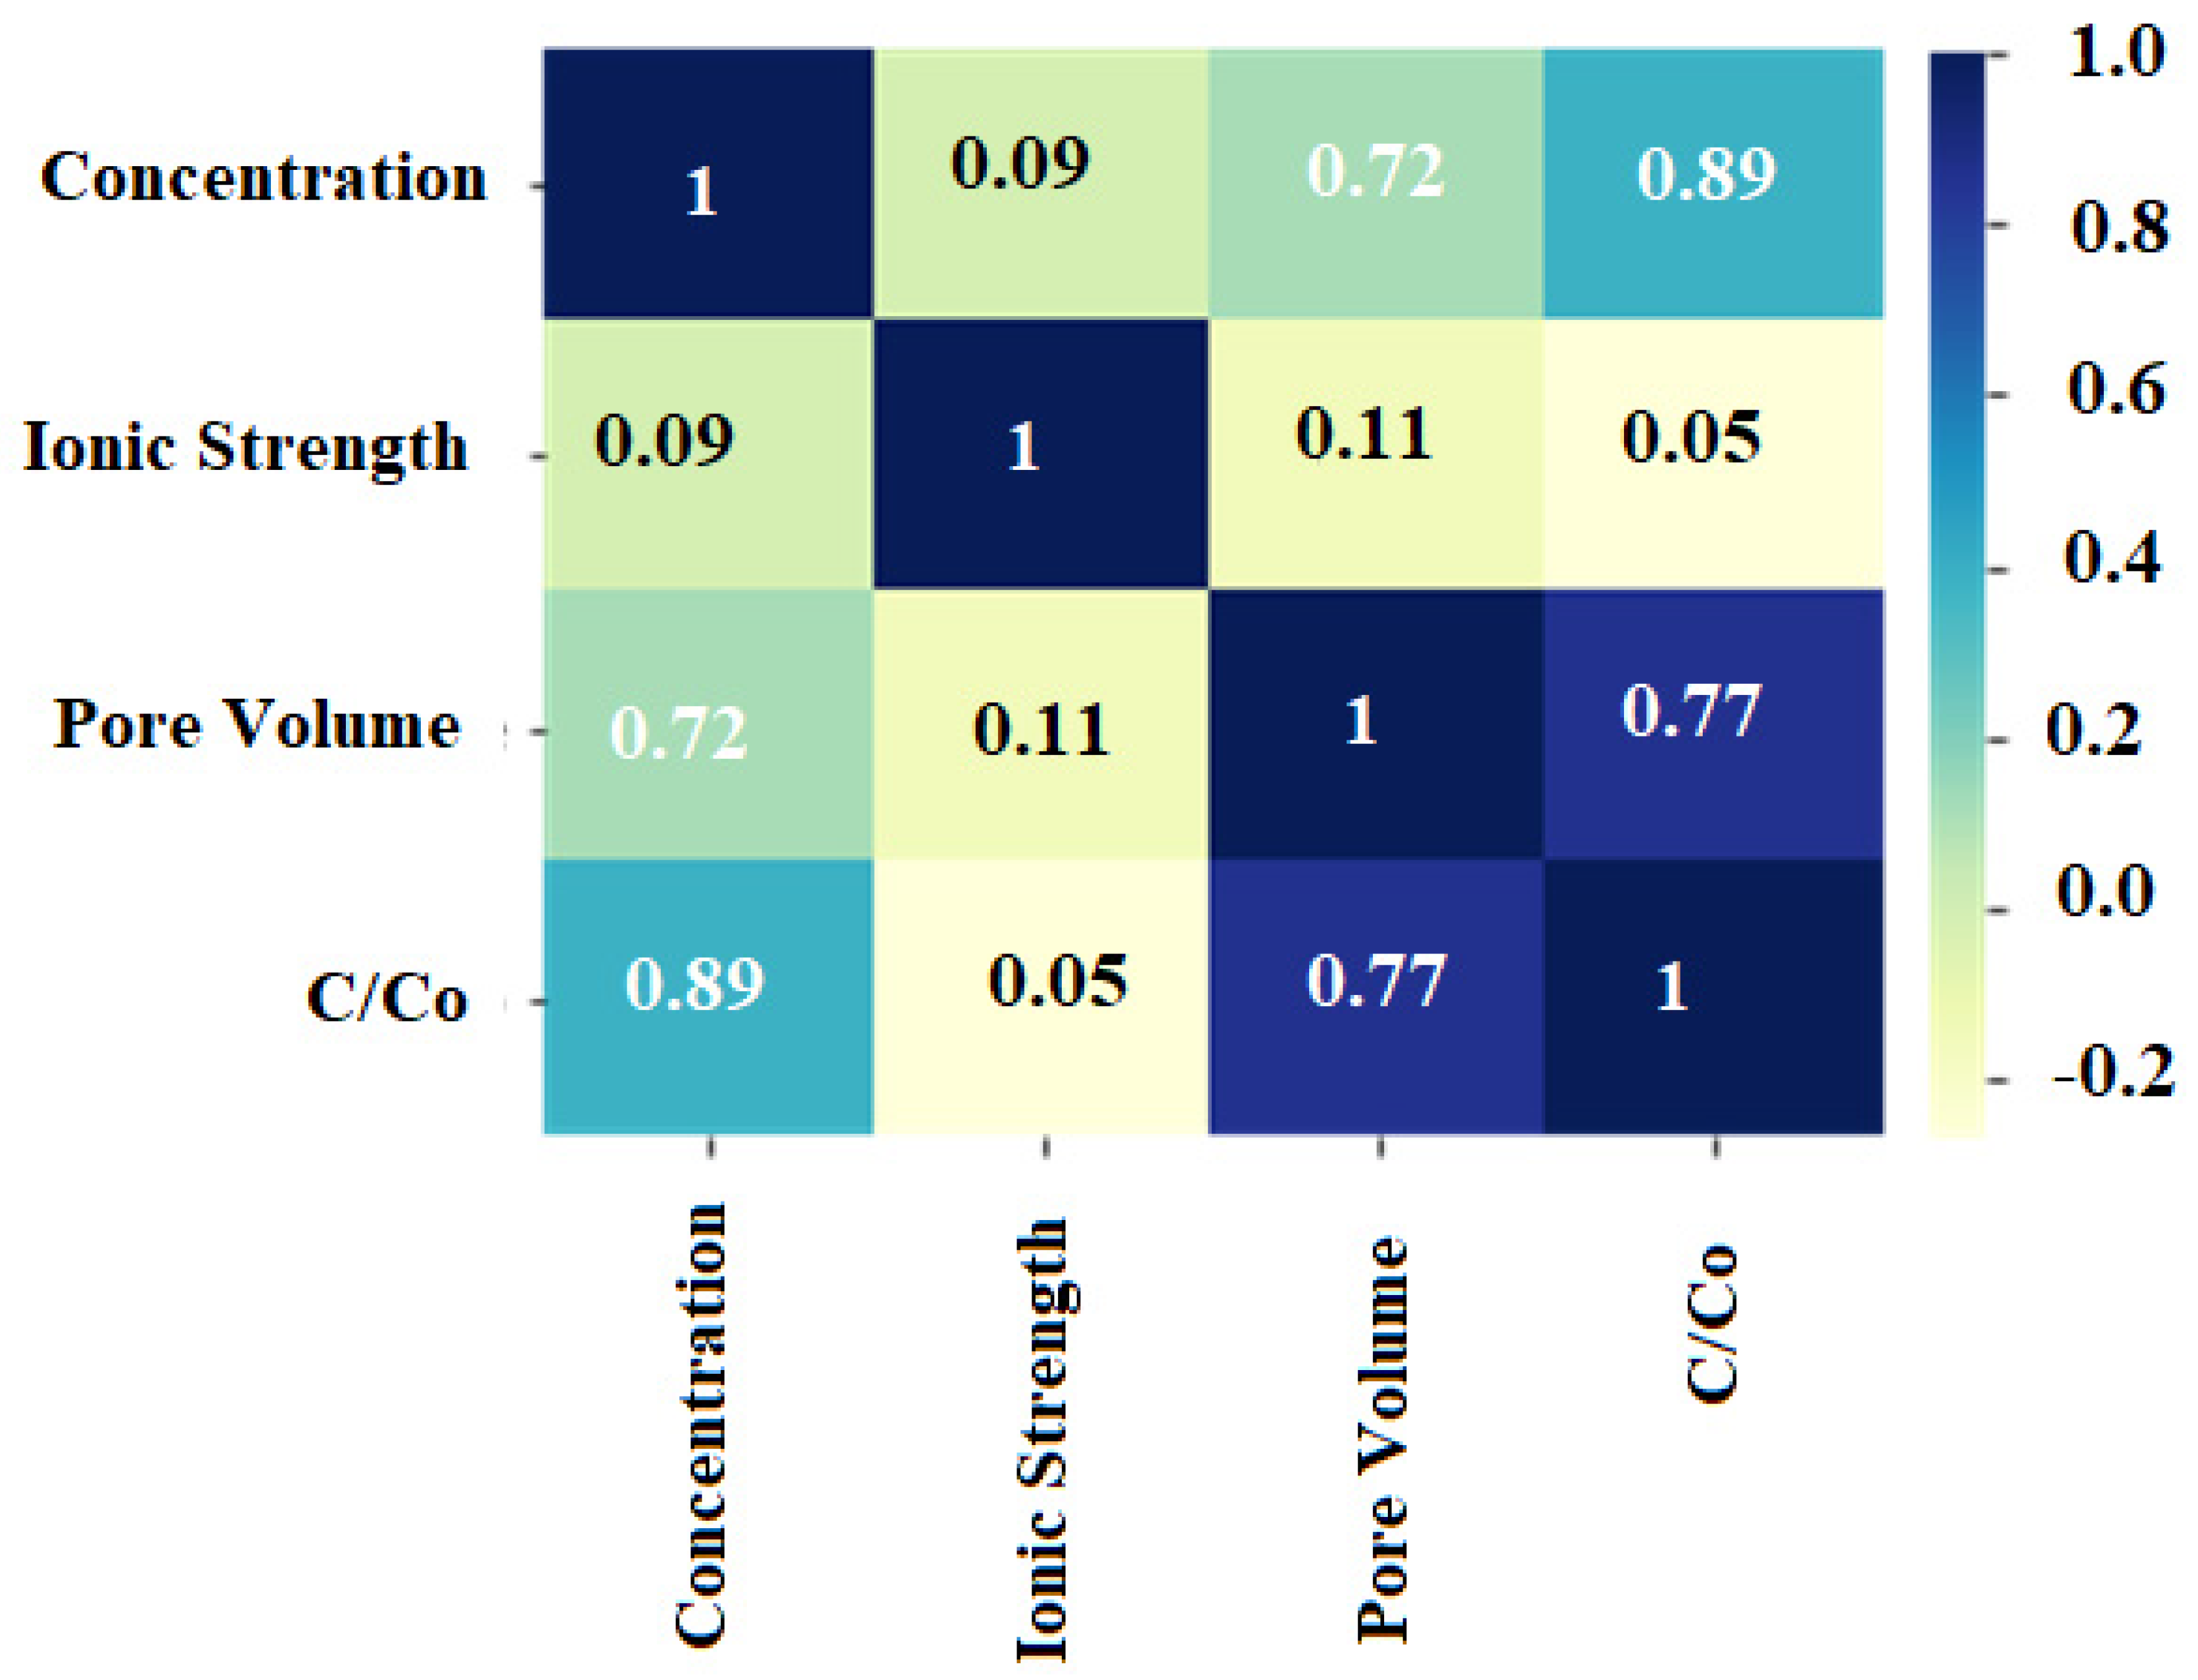
Correlation Matrix Analysis
4. Results and Discussion
4.1. Clinoptilolite Characterization
4.2. Continuous Adsorption Experiments
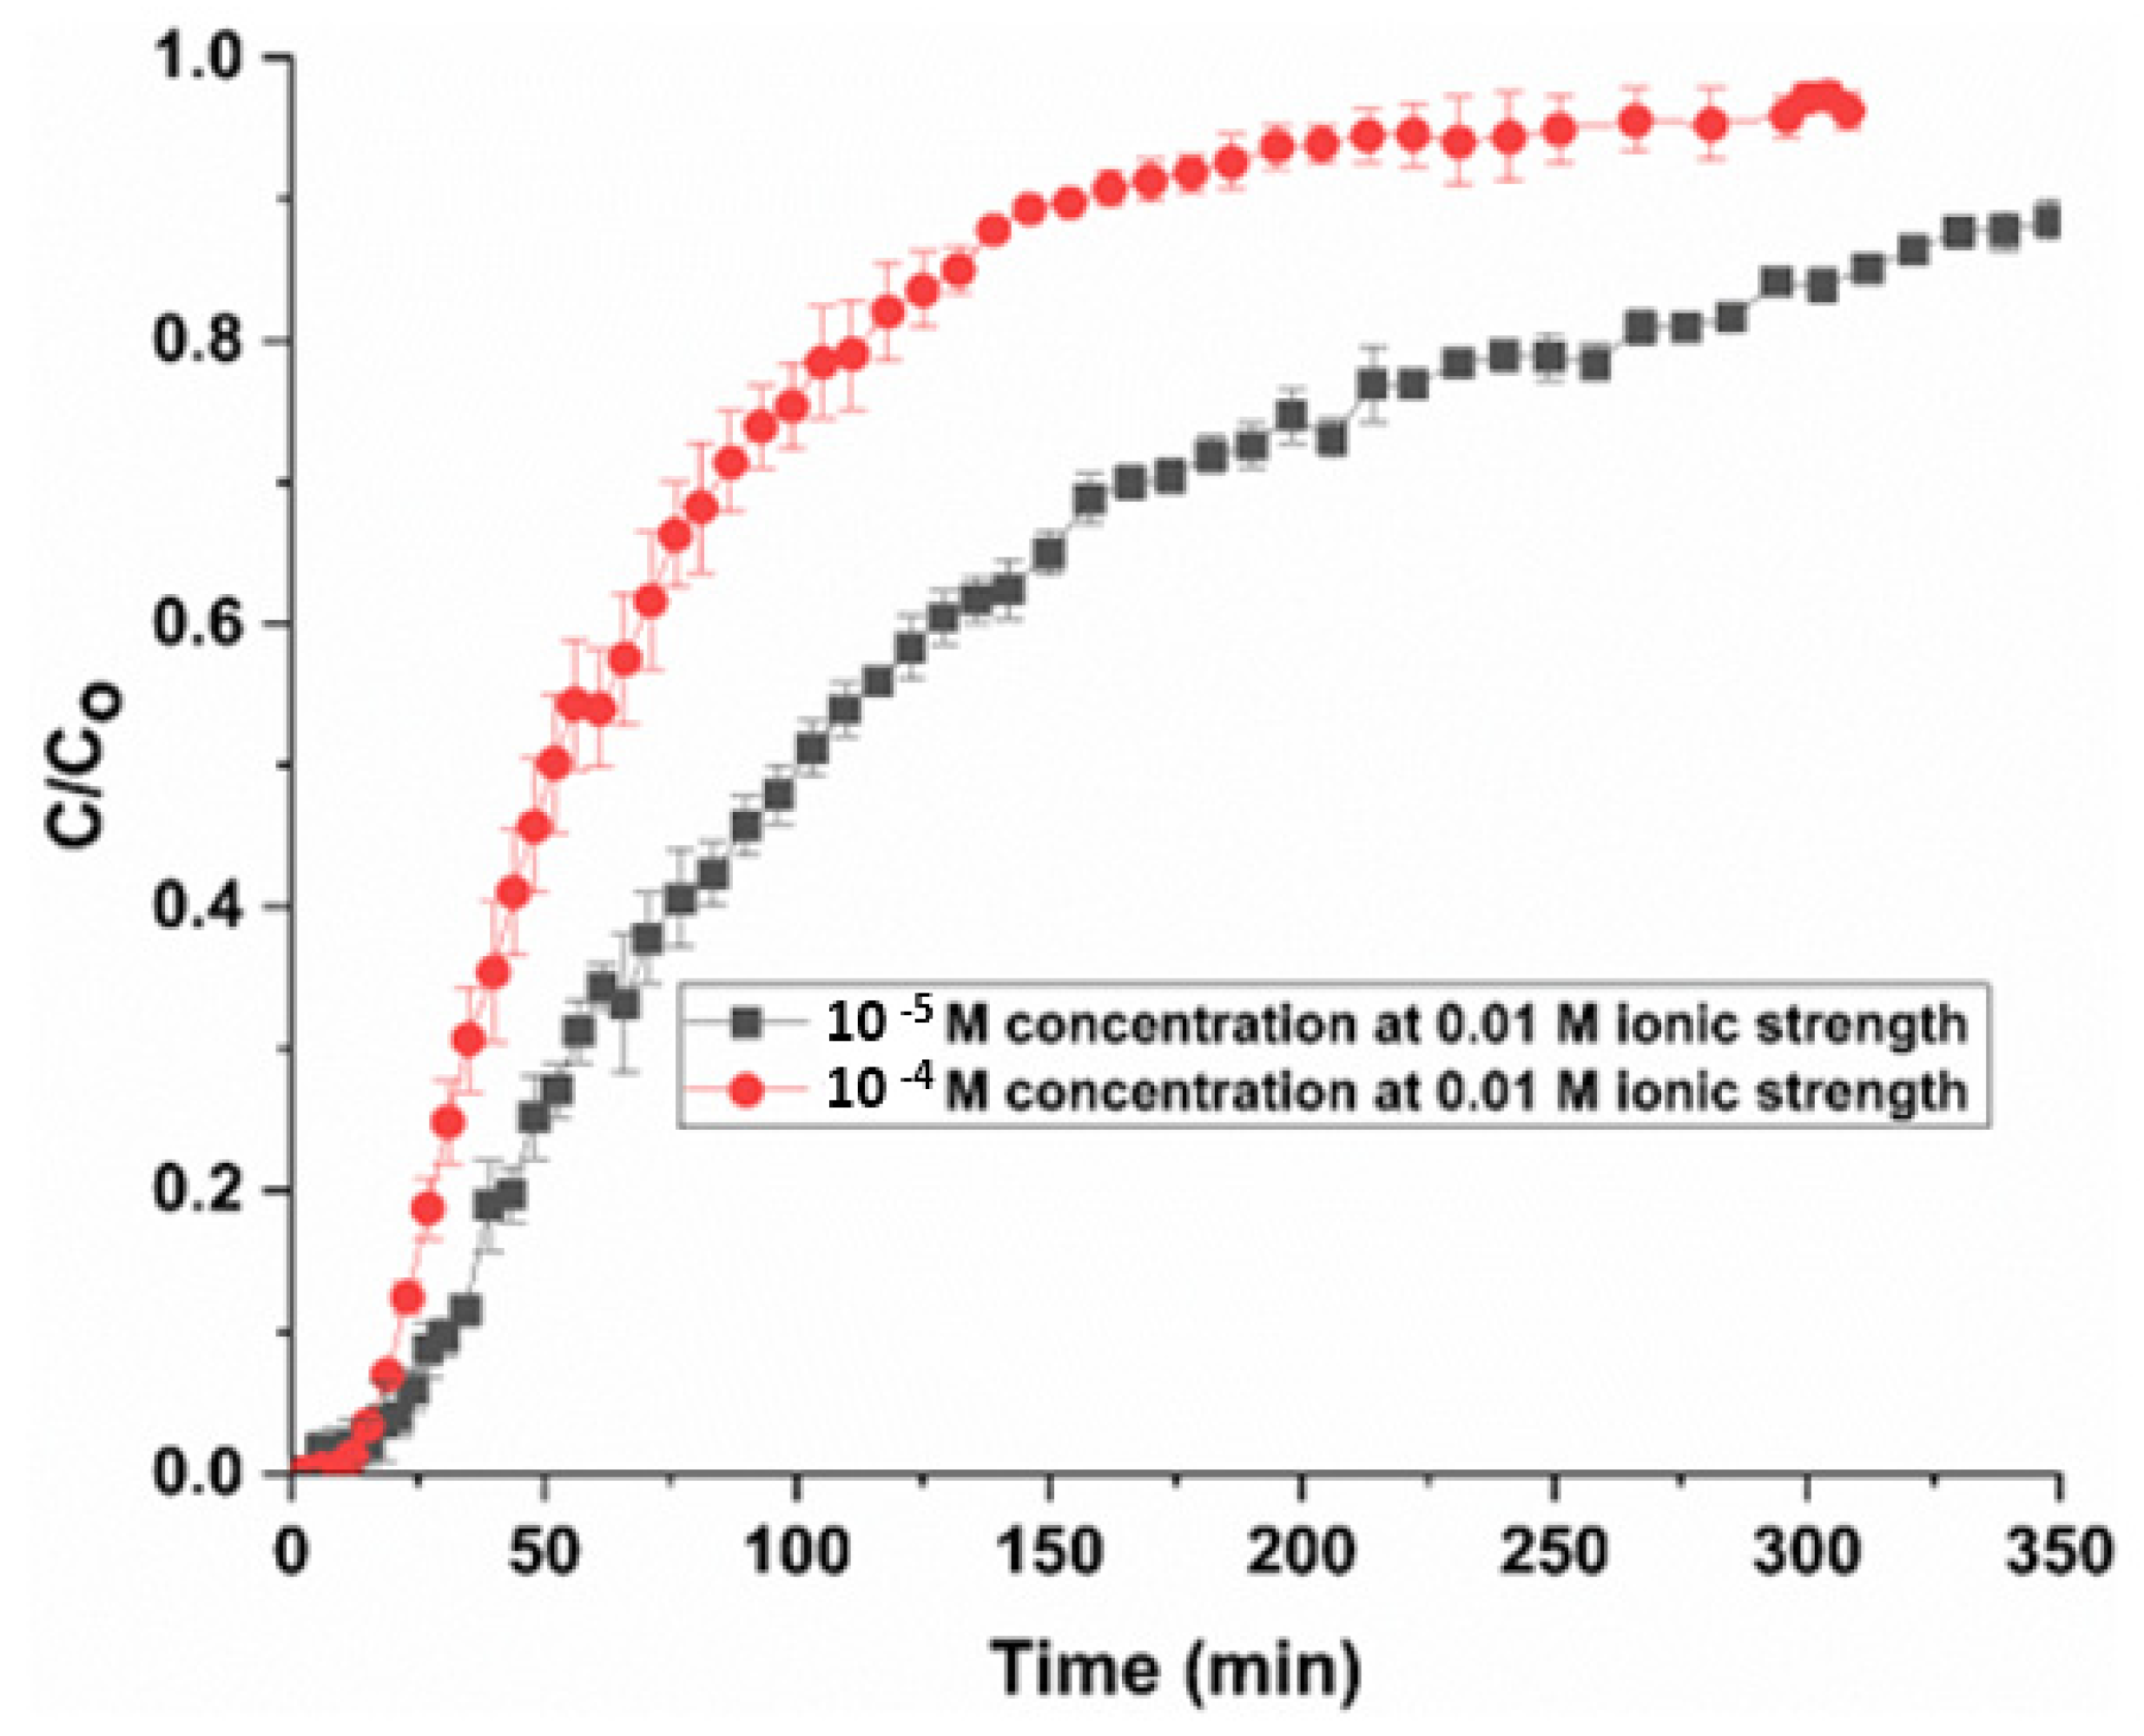
4.2.1. Effect of Initial Inlet Concentration on Breakthrough Curves
4.2.2. Effect of Ionic Strength on Breakthrough Curves
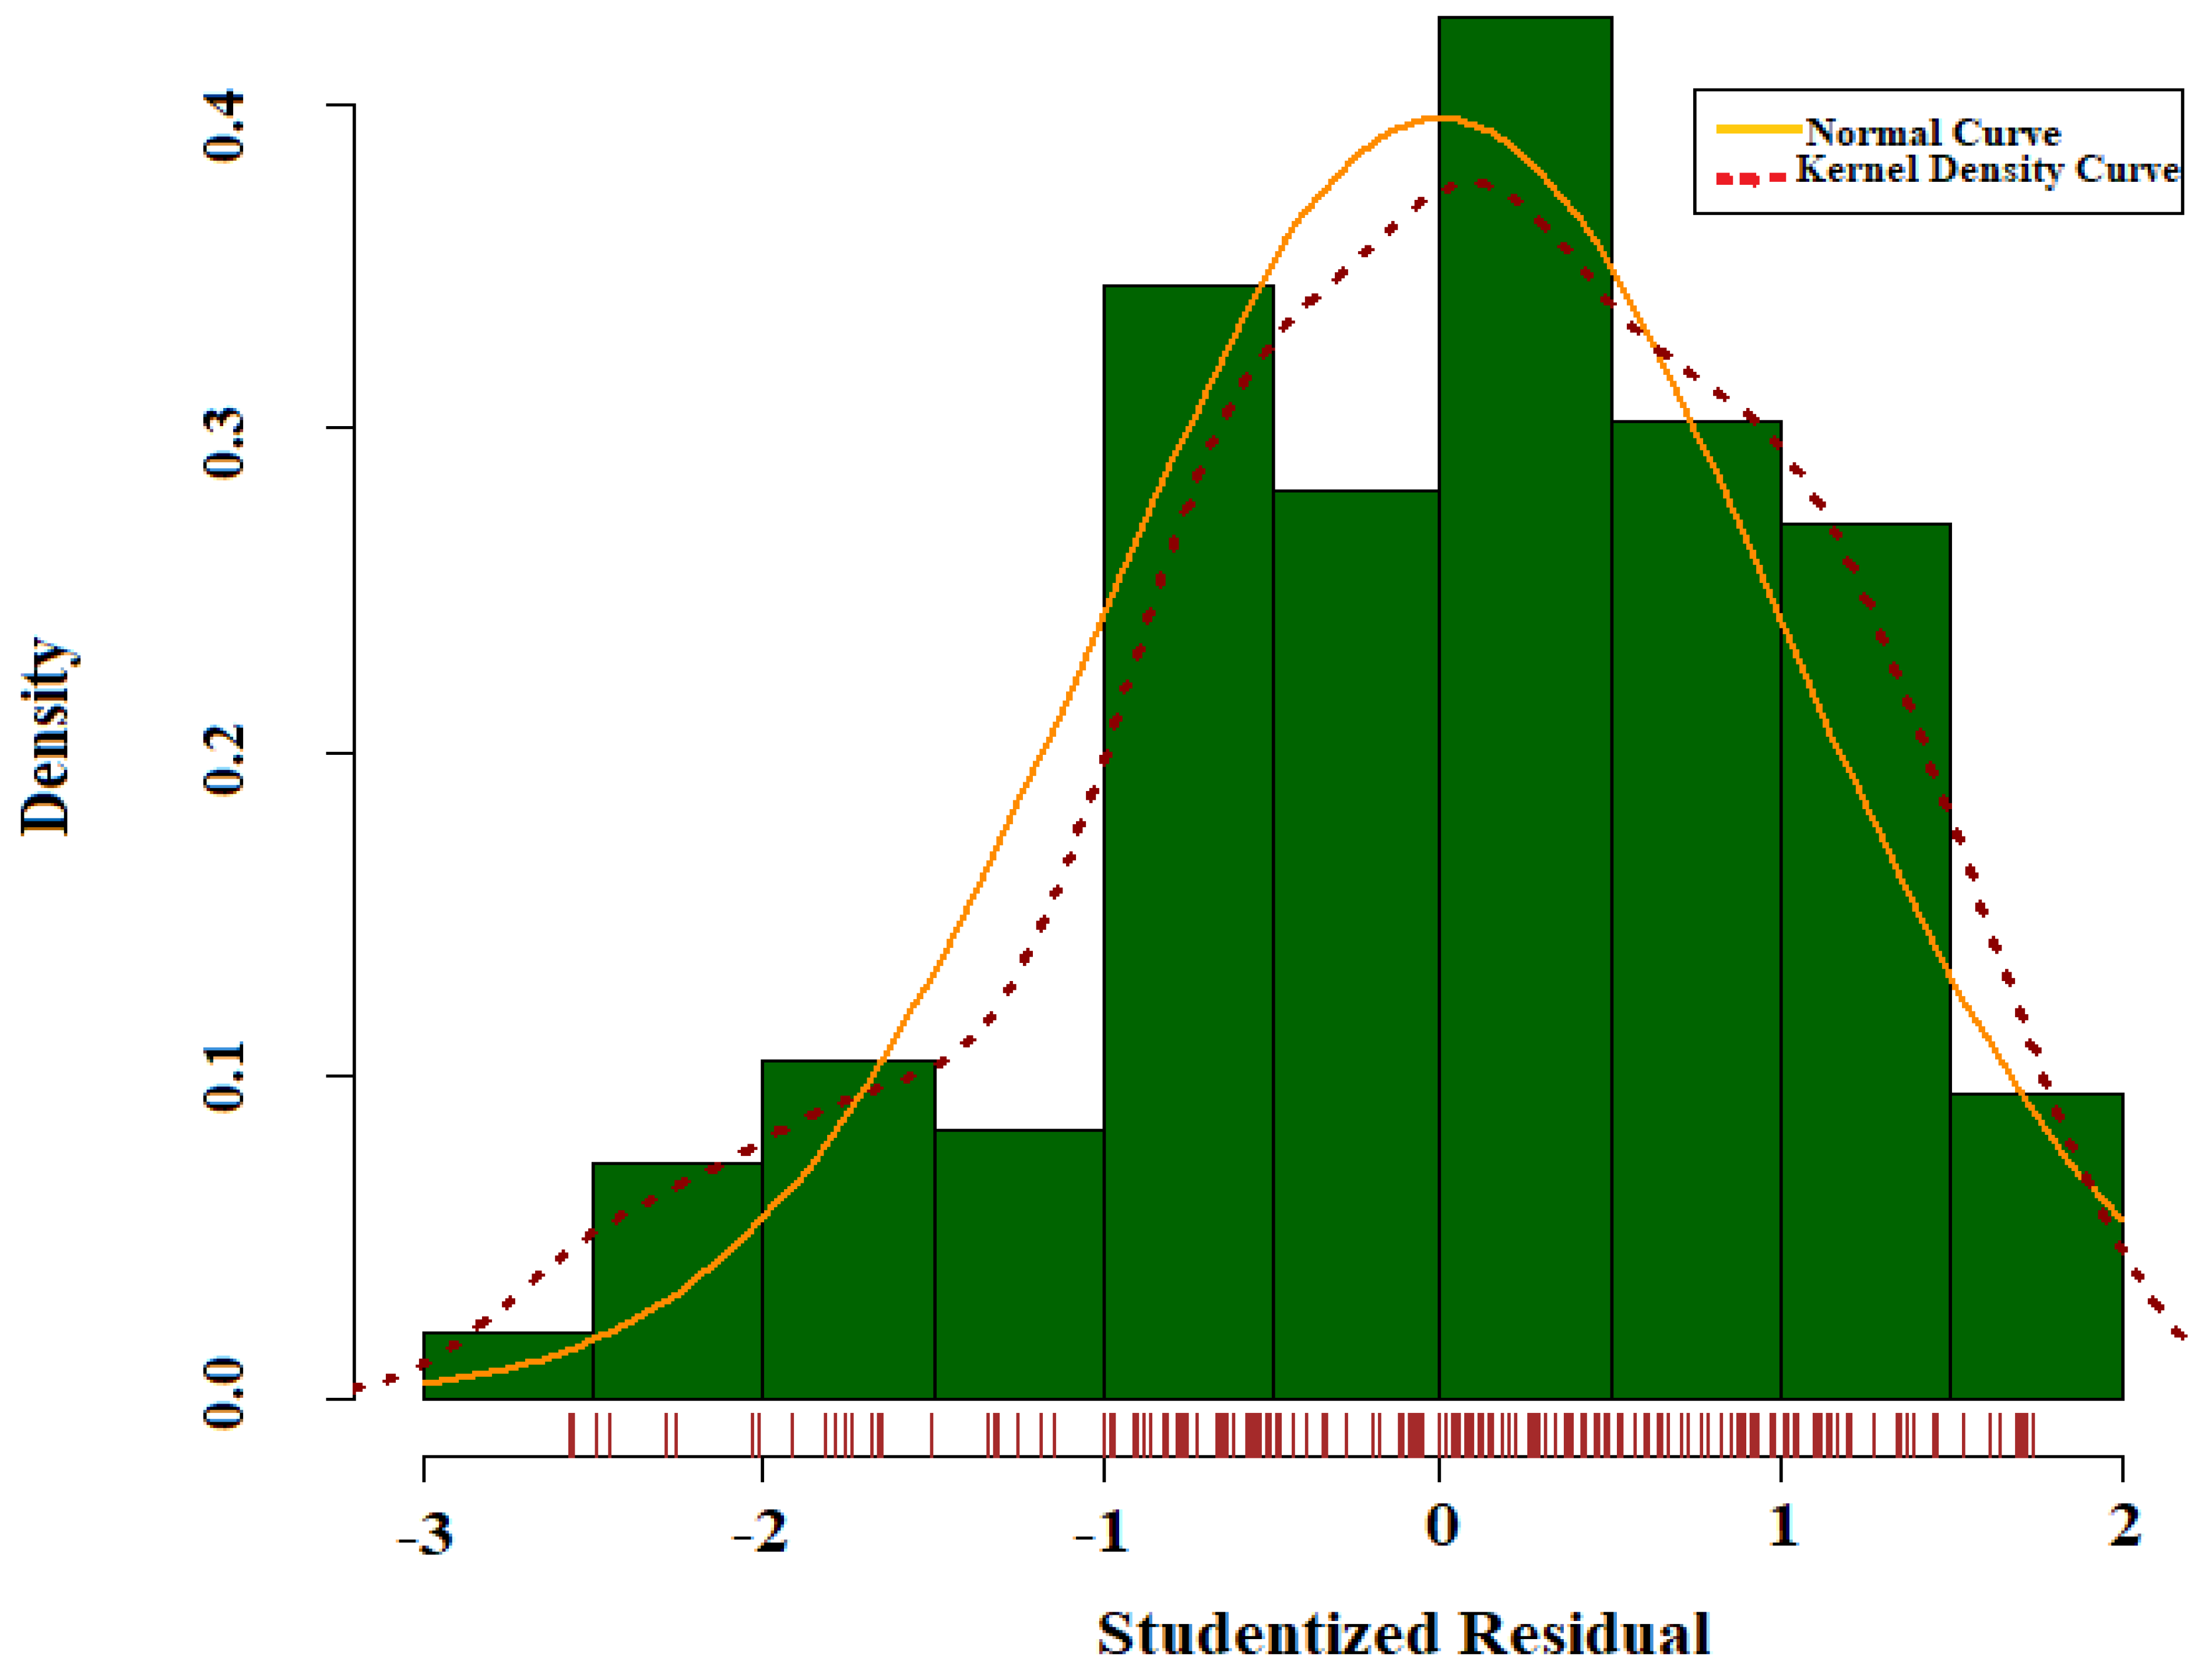
4.3. Statistical Analysis
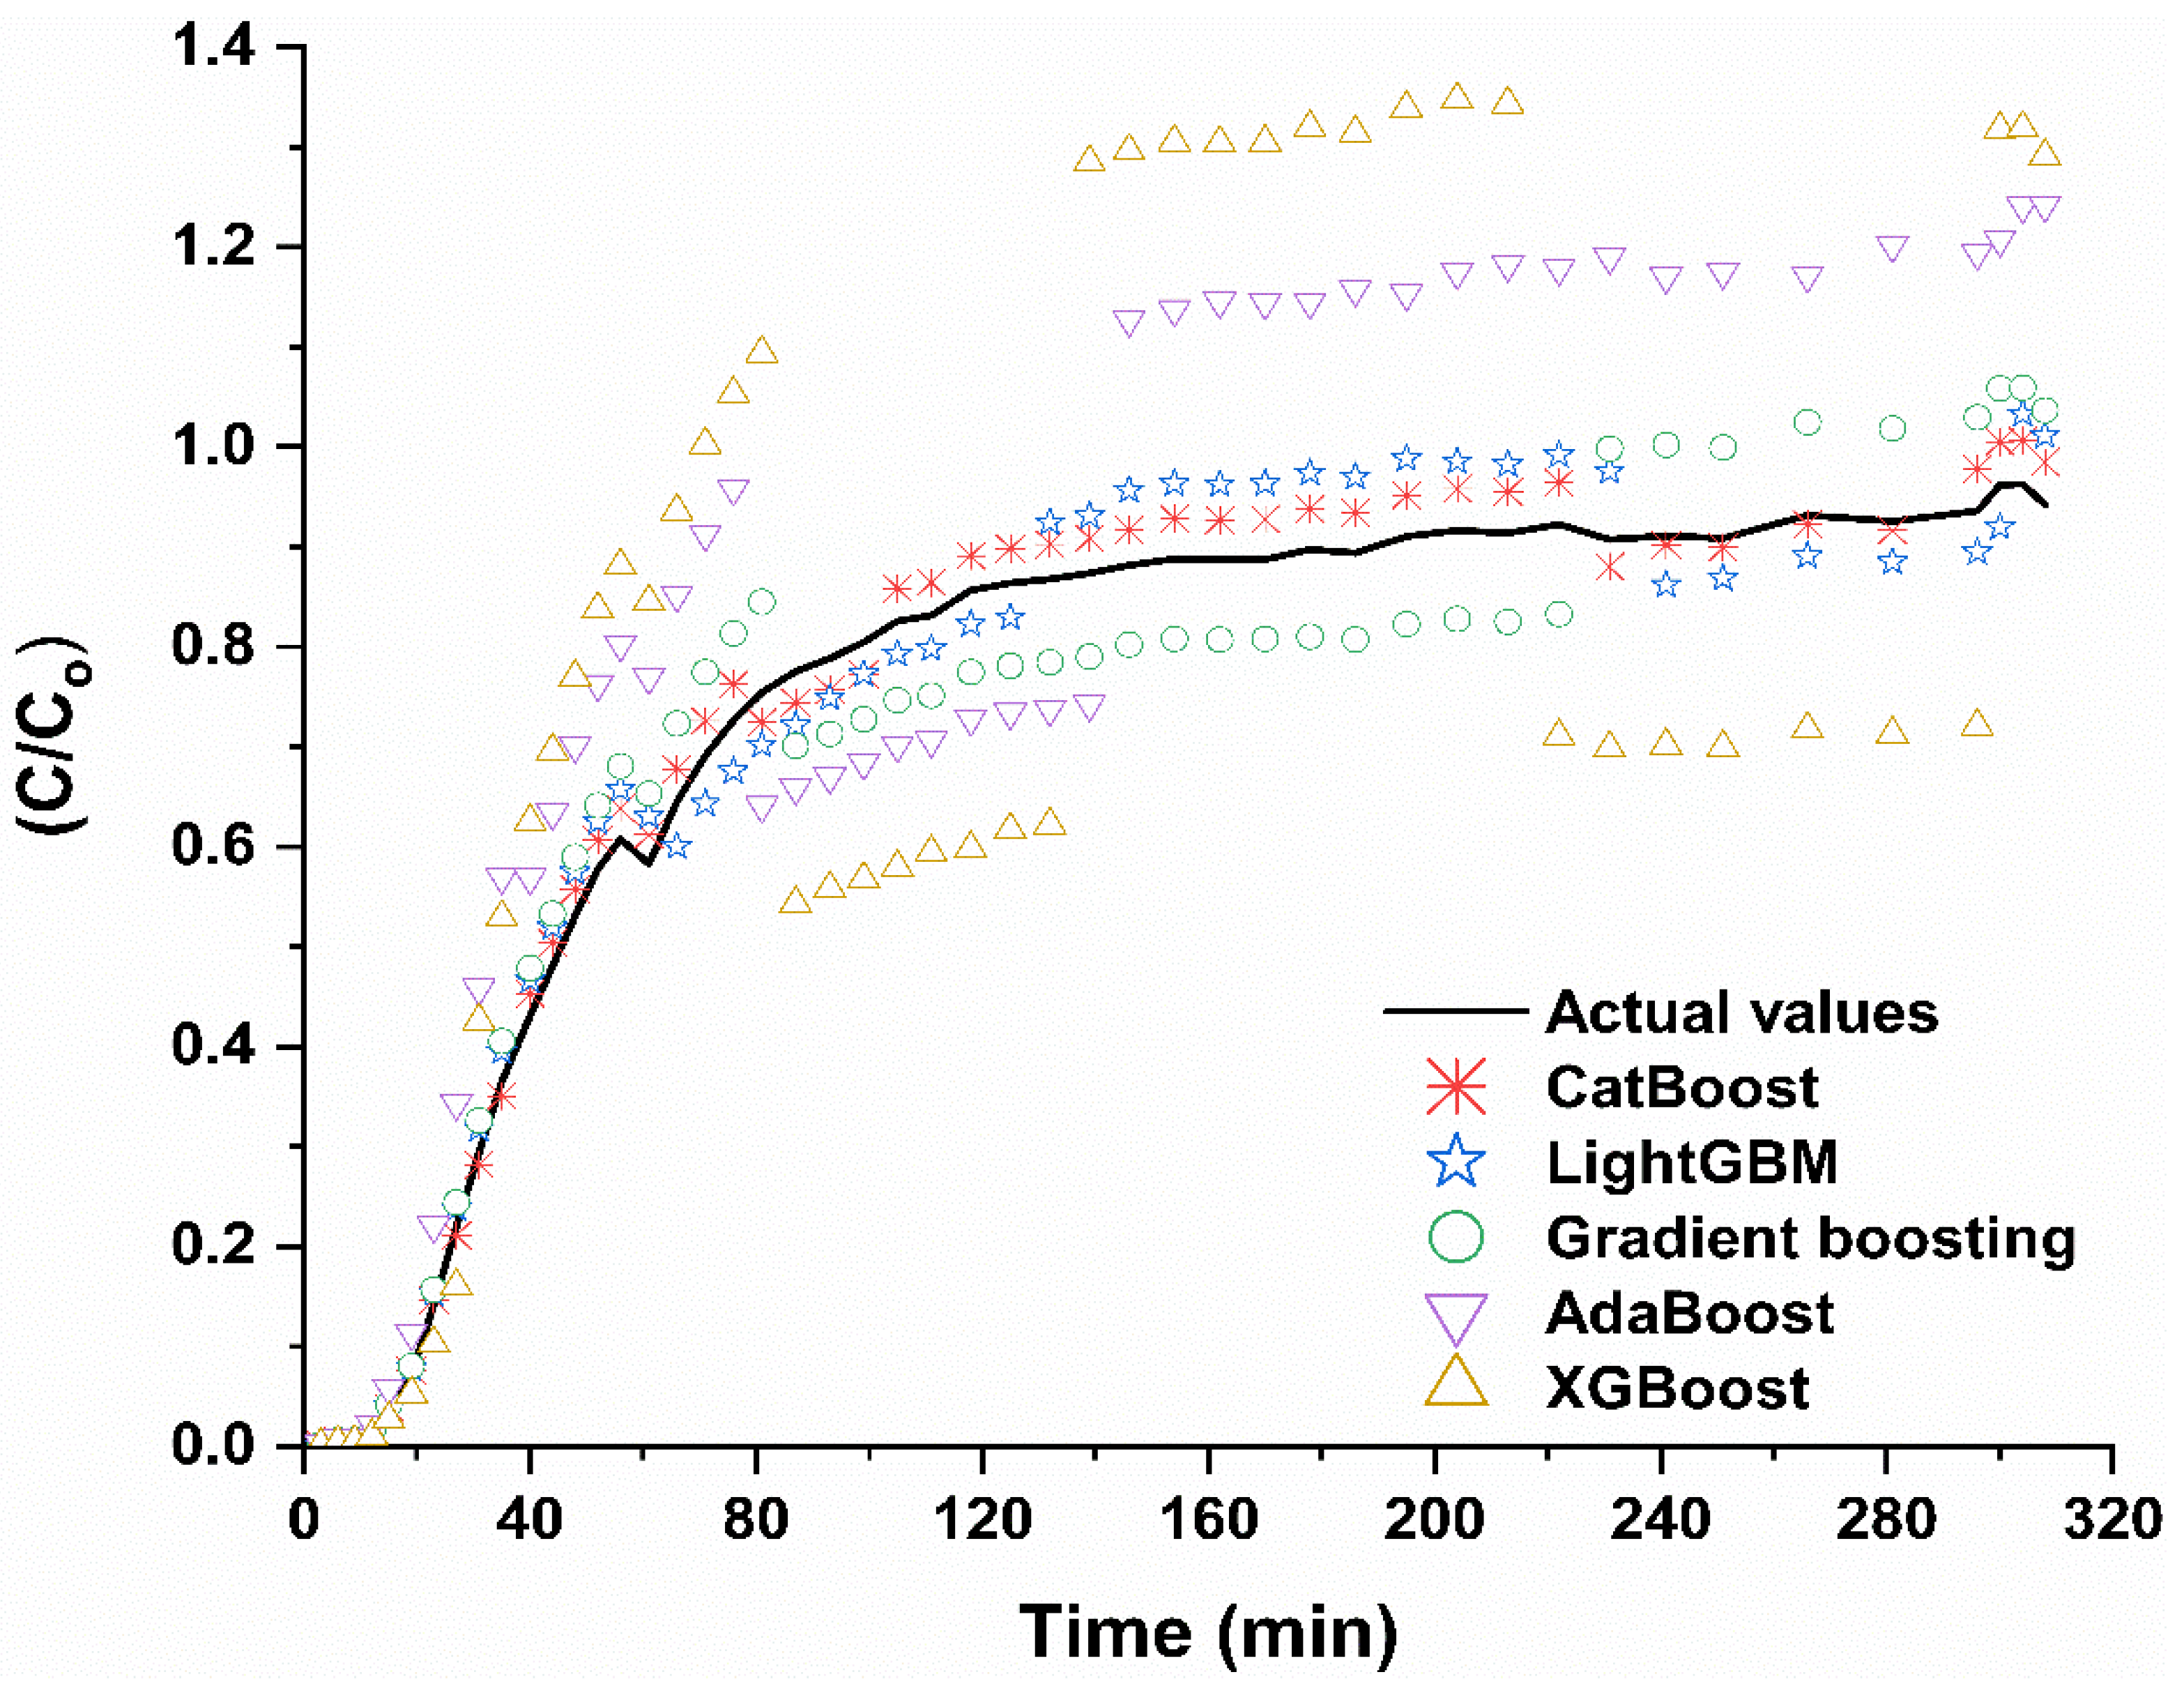
4.4. Performance of ML Algorithms
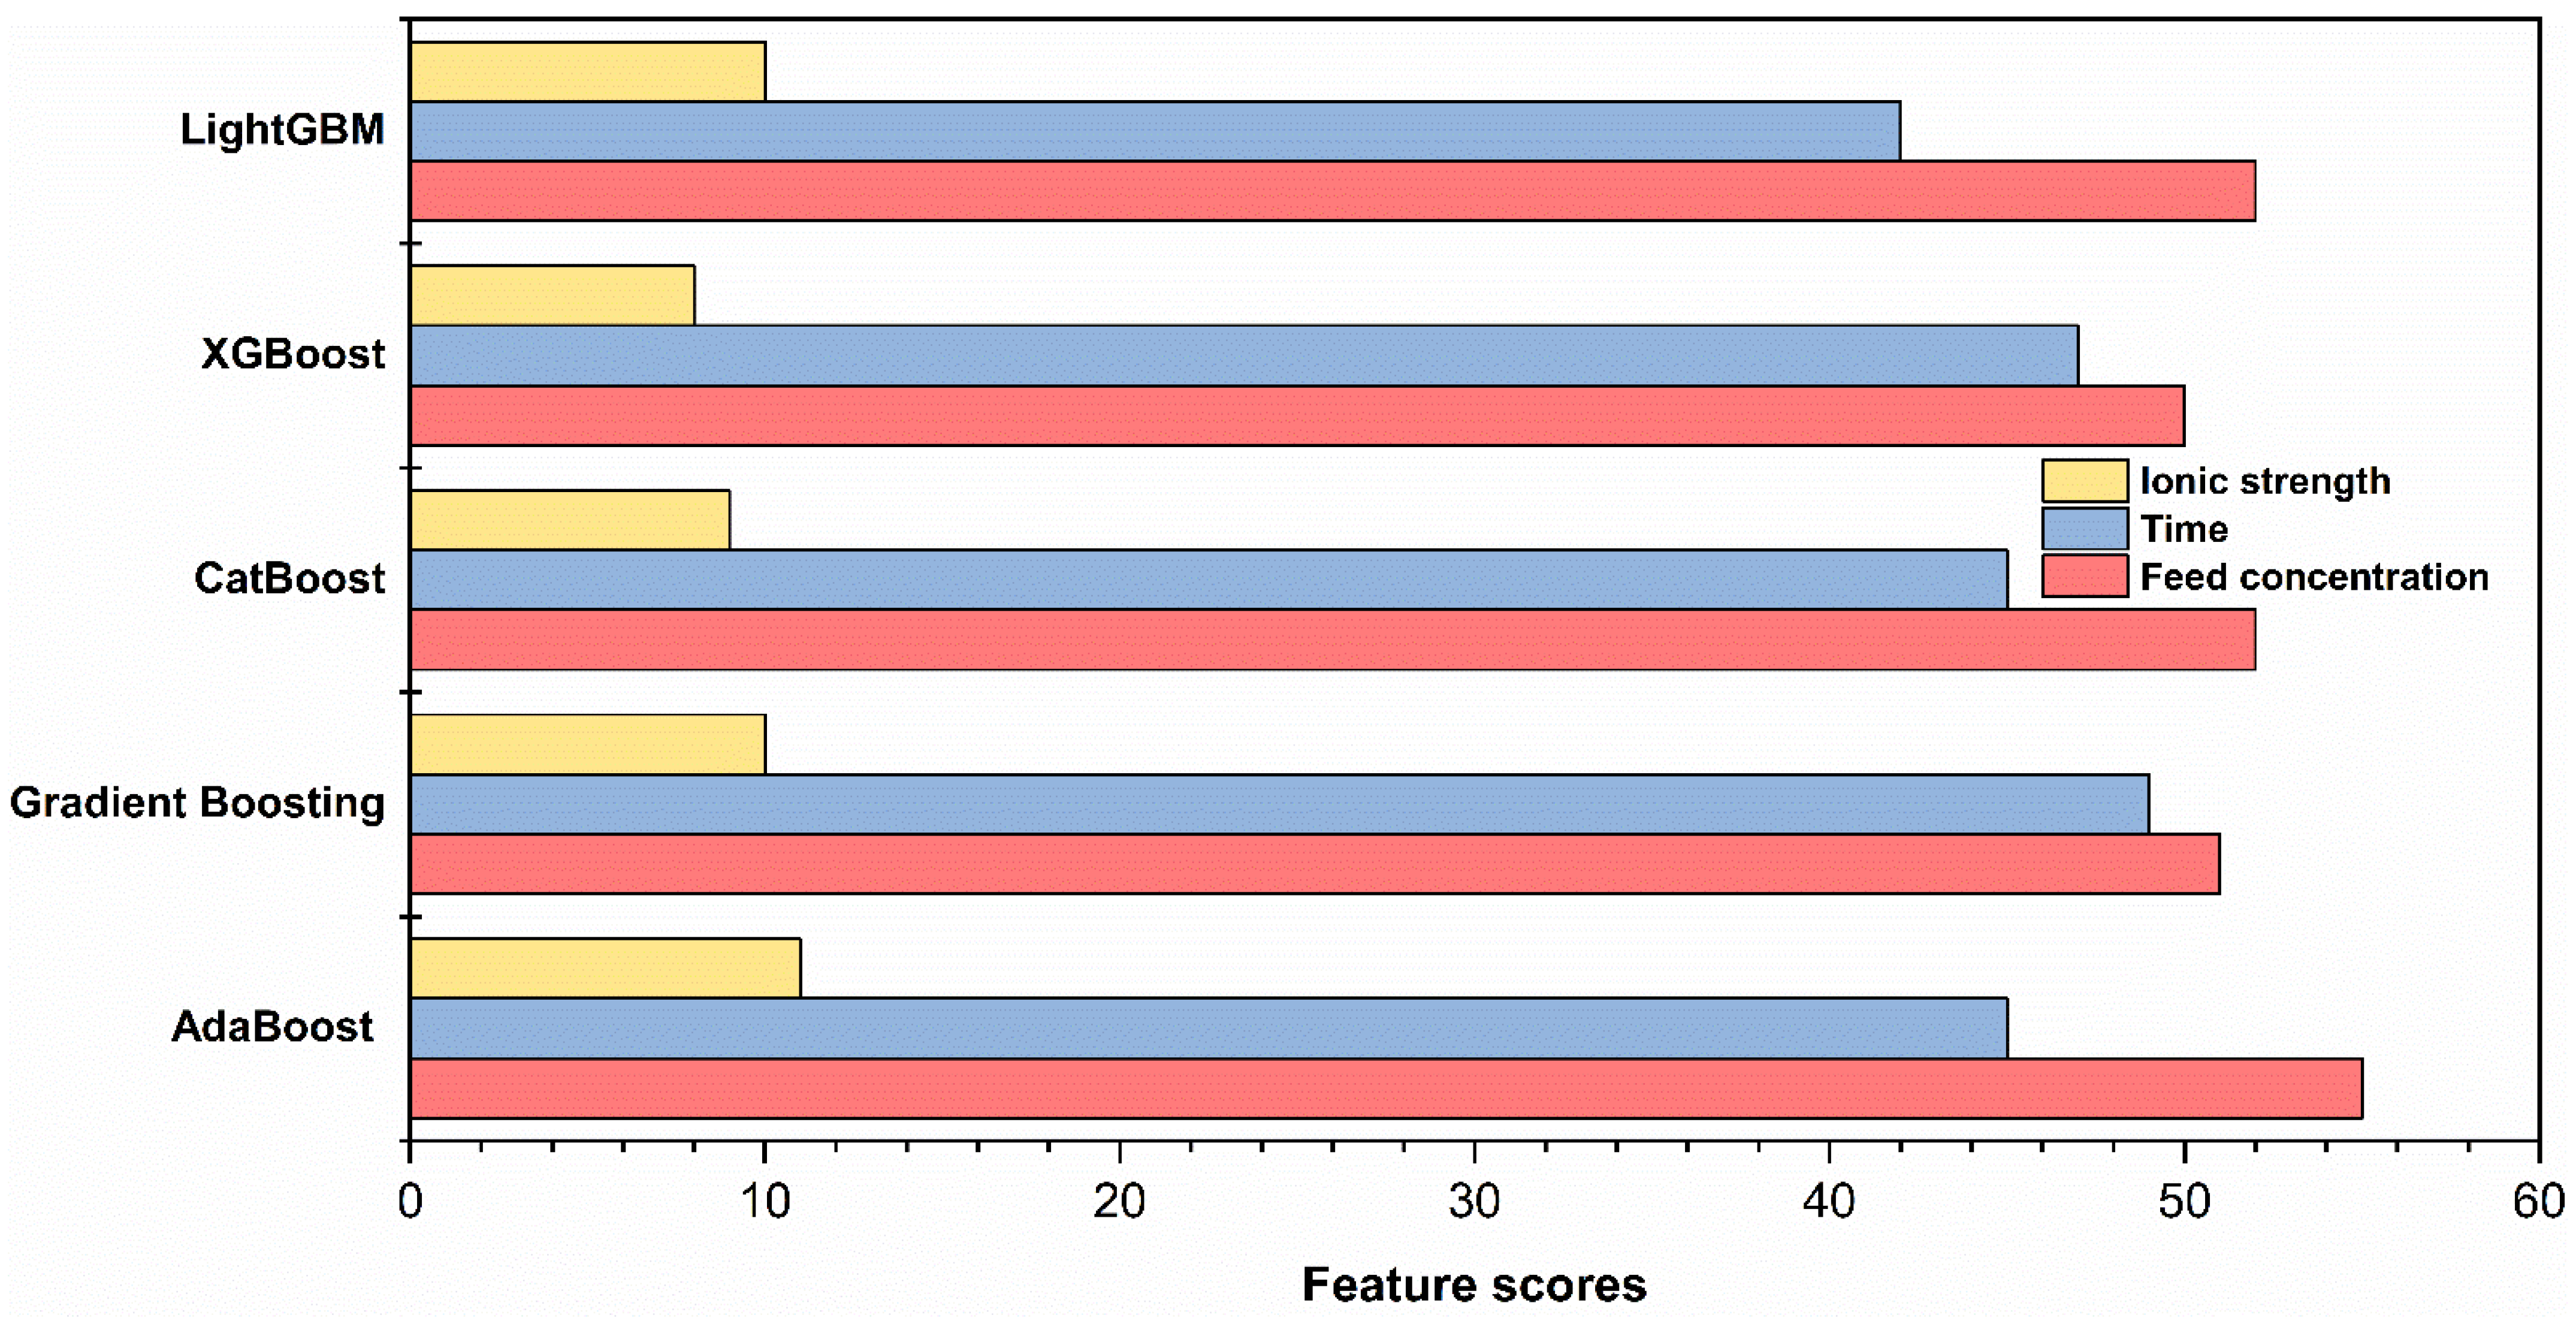
4.5. Feature Importance
5. Conclusions
Author Contributions
Funding
Institutional Review Board Statement
Informed Consent Statement
Data Availability Statement
Acknowledgments
Conflicts of Interest
References
- He, Y.; Xiang, Y.; Zhou, Y.; Yang, Y.; Zhang, J.; Huang, H.; Shang, C.; Luo, L.; Gao, J.; Tang, L. Selenium contamination, consequences and remediation techniques in water and soils: A review. Environ. Res. 2018, 164, 288–301. [Google Scholar] [CrossRef]
- Etteieb, S.; Magdouli, S.; Zolfaghari, M.; Brar, S. Monitoring and analysis of selenium as an emerging contaminant in mining industry: A critical review. Sci. Total Environ. 2019, 698, 134339. [Google Scholar] [CrossRef] [PubMed]
- Hay, M.B.; Leone, G.; Partey, F.; Wilking, B. Selenium attenuation via reductive precipitation in unsaturated waste rock as a control on groundwater impacts in the Idaho phosphate patch. Appl. Geochem. 2016, 74, 176–193. [Google Scholar] [CrossRef]
- Vinceti, M.; Filippini, T.; Wise, L.A. Environmental Selenium and Human Health: An Update. Curr. Environ. Health Rep. 2018, 5, 464–485. [Google Scholar] [CrossRef]
- Jacobson, A.T.; Fan, M. Evaluation of natural goethite on the removal of arsenate and selenite from water. J. Environ. Sci. 2019, 76, 133–141. [Google Scholar] [CrossRef]
- Qin, H.-B.; Zhu, J.-M.; Liang, L.; Wang, M.-S.; Su, H. The bioavailability of selenium and risk assessment for human selenium poisoning in high-Se areas, China. Environ. Int. 2013, 52, 66–74. [Google Scholar] [CrossRef] [PubMed]
- Okonji, S.; Achari, G.; Pernitsky, D. Environmental Impacts of Selenium Contamination: A Review on Current-Issues and Remediation Strategies in an Aqueous System. Water 2021, 13, 1473. [Google Scholar] [CrossRef]
- Pérez-Corona, T.; Madrid, Y.; Cámara, C. Evaluation of selective uptake of selenium (Se (IV) and Se (VI)) and antimony (Sb (III) and Sb (V)) species by baker’s yeast cells (Saccharomyces cerevisiae). Anal. Chim. Acta 1997, 345, 249–255. [Google Scholar] [CrossRef]
- Simmons, D.; Wallschläger, D. A critical review of the biogeochemistry and ecotoxicology of selenium in lotic and lentic environments. Environ. Toxicol. Chem. 2005, 24, 1331–1343. [Google Scholar] [CrossRef]
- Lv, H.; Chen, W.; Zhu, Y.; Yang, J.; Mazhar, S.H.; Zhao, P.; Wang, L.; Li, Y.; Azam, S.M.; Ben Fekih, I.; et al. Efficiency and risks of selenite combined with different water conditions in reducing uptake of arsenic and cadmium in paddy rice. Environ. Pollut. 2020, 262, 114283. [Google Scholar] [CrossRef]
- Evans, S.F.; Ivancevic, M.R.; Yan, J.; Naskar, A.K.; Levine, A.M.; Lee, R.J.; Tsouris, C.; Paranthaman, M.P. Magnetic adsorbents for selective removal of selenite from contaminated water. Sep. Sci. Technol. 2019, 54, 2138–2146. [Google Scholar] [CrossRef]
- Golder Associates. Literature Review of Treatment Technologies to Remove Selenium from Mining-Influenced Water; Technical Report; Golder Associates: Lakewood, CO, USA, 2009; p. 40. [Google Scholar]
- Staicu, L.C.; Morin-Crini, N.; Crini, G. Desulfurization: Critical step towards enhanced selenium removal from industrial effluents. Chemosphere 2017, 172, 111–119. [Google Scholar] [CrossRef] [PubMed]
- Okonji, S.O.; Yu, L.; Dominic, J.A.; Pernitsky, D.; Achari, G. Adsorption by Granular Activated Carbon and Nano Zerovalent Iron from Wastewater: A Study on Removal of Selenomethionine and Selenocysteine. Water 2020, 13, 23. [Google Scholar] [CrossRef]
- Jalbani, N.S.; Solangi, A.R.; Memon, S.; Junejo, R.; Bhatti, A.A.; Yola, M.L.; Tawalbeh, M.; Karimi-Maleh, H. Synthesis of new functionalized Calix[4]arene modified silica resin for the adsorption of metal ions: Equilibrium, thermodynamic and kinetic modeling studies. J. Mol. Liq. 2021, 339, 116741. [Google Scholar] [CrossRef]
- Al Sharabati, M.; Abokwiek, R.; Al-Othman, A.; Tawalbeh, M.; Karaman, C.; Orooji, Y.; Karimi, F. Biodegradable polymers and their nano-composites for the removal of endocrine-disrupting chemicals (EDCs) from wastewater: A review. Environ. Res. 2021, 202, 111694. [Google Scholar] [CrossRef]
- Kalaitzidou, K.; Nikoletopoulos, A.-A.; Tsiftsakis, N.; Pinakidou, F.; Mitrakas, M. Adsorption of Se(IV) and Se(VI) species by iron oxy-hydroxides: Effect of positive surface charge density. Sci. Total Environ. 2019, 687, 1197–1206. [Google Scholar] [CrossRef]
- Li, J.; Wang, X.; Zhao, G.; Chen, C.; Chai, Z.; Alsaedi, A.; Hayat, T.; Wang, X. Metal–organic framework-based materials: Superior adsorbents for the capture of toxic and radioactive metal ions. Chem. Soc. Rev. 2018, 47, 2322–2356. [Google Scholar] [CrossRef]
- Okonji, S.O.; Achari, G.; Pernitsky, D. Removal of Organoselenium from Aqueous Solution by Nanoscale Zerovalent Iron Supported on Granular Activated Carbon. Water 2022, 14, 987. [Google Scholar] [CrossRef]
- Al Bsoul, A.; Hailat, M.; Abdelhay, A.; Tawalbeh, M.; Al-Othman, A.; Al-Kharabsheh, I.N.; Al-Taani, A.A. Efficient removal of phenol compounds from water environment using Ziziphus leaves adsorbent. Sci. Total Environ. 2020, 761, 143229. [Google Scholar] [CrossRef]
- Al Bsoul, A.; Hailat, M.; Abdelhay, A.; Tawalbeh, M.; Jum’H, I.; Bani-Melhem, K. Treatment of olive mill effluent by adsorption on titanium oxide nanoparticles. Sci. Total Environ. 2019, 688, 1327–1334. [Google Scholar] [CrossRef]
- Abuwatfa, W.H.; Al-Muqbel, D.; Al-Othman, A.; Halalsheh, N.; Tawalbeh, M. Insights into the removal of microplastics from water using biochar in the era of COVID-19: A mini review. Case Stud. Chem. Environ. Eng. 2021, 4, 100151. [Google Scholar] [CrossRef]
- Ali, I.; Shrivastava, V. Recent advances in technologies for removal and recovery of selenium from (waste)water: A systematic review. J. Environ. Manag. 2021, 294, 112926. [Google Scholar] [CrossRef] [PubMed]
- Bandara, P.C.; Perez, J.V.D.; Nadres, E.T.; Nannapaneni, R.G.; Krakowiak, K.J.; Rodrigues, D.F. Graphene Oxide Nanocomposite Hydrogel Beads for Removal of Selenium in Contaminated Water. ACS Appl. Polym. Mater. 2019, 1, 2668–2679. [Google Scholar] [CrossRef]
- Hayes, K.F.; Papelis, C.; Leckie, J.O. Modeling ionic strength effects on anion adsorption at hydrous oxide/solution interfaces. J. Colloid Interface Sci. 1988, 125, 717–726. [Google Scholar] [CrossRef]
- Parida, K.M.; Gorai, B.; Das, N.N.; Rao, S.B. Studies on ferric oxide hydroxides: III. Adsorption of selenite (SeO2−3) on different forms of iron oxyhydroxides. J. Colloid Interface Sci. 1997, 185, 355–362. [Google Scholar] [CrossRef] [PubMed]
- Monteil-Rivera, F.; Fedoroff, M.; Jeanjean, J.; Minel, L.; Barthes, M.-G.; Dumonceau, J.-M. Sorption of Selenite (SeO32−) on Hydroxyapatite: An Exchange Process. J. Colloid Interface Sci. 2000, 221, 291–300. [Google Scholar] [CrossRef]
- Jordan, N.; Lomenech, C.; Marmier, N.; Giffaut, E.; Ehrhardt, J.-J. Sorption of selenium(IV) onto magnetite in the presence of silicic acid. J. Colloid Interface Sci. 2009, 329, 17–23. [Google Scholar] [CrossRef]
- Lo, S.L.; Chen, T.Y. Adsorption of Se (IV) and Se (VI) on an iron-coated sand from water. Chemosphere 1997, 35, 919–930. [Google Scholar] [CrossRef]
- Zhang, N.; Lin, L.-S.; Gang, D. Adsorptive selenite removal from water using iron-coated GAC adsorbents. Water Res. 2008, 42, 3809–3816. [Google Scholar] [CrossRef]
- Han, R.; Zou, L.; Zhao, X.; Xu, Y.; Xu, F.; Li, Y.; Wang, Y. Characterization and properties of iron oxide-coated zeolite as adsorbent for removal of copper(II) from solution in fixed bed column. Chem. Eng. J. 2009, 149, 123–131. [Google Scholar] [CrossRef]
- Giles, D.E.; Mohapatra, M.; Issa, T.B.; Anand, S.; Singh, P. Iron and aluminium based adsorption strategies for removing arsenic from water. J. Environ. Manag. 2011, 92, 3011–3022. [Google Scholar] [CrossRef] [PubMed]
- Šiljeg, M.; Stefanović, C.; Mazaj, M.; Tušar, N.N.; Arčon, I.; Kovač, J.; Margeta, K.; Kaučič, V.; Logar, N.Z. Structure investigation of As(III)- and As(V)-species bound to Fe-modified clinoptilolite tuffs. Microporous Mesoporous Mater. 2009, 118, 408–415. [Google Scholar] [CrossRef]
- Jevtić, S.; Arčon, I.; Rečnik, A.; Babić, B.; Mazaj, M.; Pavlović, J.; Matijaševic, D.; Nikšić, M.; Rajić, N. The iron(III)-modified natural zeolitic tuff as an adsorbent and carrier for selenium oxyanions. Microporous Mesoporous Mater. 2014, 197, 92–100. [Google Scholar] [CrossRef]
- Liu, Y.; Liu, F.; Ni, L.; Meng, M.; Meng, X.; Zhong, G.; Qiu, J. A modeling study by response surface methodology (RSM) on Sr(II) ion dynamic adsorption optimization using a novel magnetic ion imprinted polymer. RSC Adv. 2016, 6, 54679–54692. [Google Scholar] [CrossRef]
- Negrea, A.; Mihailescu, M.; Mosoarca, G.; Ciopec, M.; Duteanu, N.; Negrea, P.; Minzatu, V. Estimation on Fixed-Bed Column Parameters of Breakthrough Behaviors for Gold Recovery by Adsorption onto Modified/Functionalized Amberlite XAD7. Int. J. Environ. Res. Public Health 2020, 17, 6868. [Google Scholar] [CrossRef]
- Giri, A.; Patel, R.; Mahapatra, S. Artificial neural network (ANN) approach for modelling of arsenic (III) biosorption from aqueous solution by living cells of Bacillus cereus biomass. Chem. Eng. J. 2011, 178, 15–25. [Google Scholar] [CrossRef]
- Shafeeyan, M.S.; Daud, W.M.A.W.; Shamiri, A. A review of mathematical modeling of fixed-bed columns for carbon dioxide adsorption. Chem. Eng. Res. Des. 2014, 92, 961–988. [Google Scholar] [CrossRef]
- Hu, Q.; Huang, Q.; Yang, D.; Liu, H. Prediction of breakthrough curves in a fixed-bed column based on normalized Gudermannian and error functions. J. Mol. Liq. 2020, 323, 115061. [Google Scholar] [CrossRef]
- Alshboul, O.; Shehadeh, A.; Tatari, O.; Almasabha, G.; Saleh, E. Multiobjective and multivariable optimization for earthmoving equipment. J. Facil. Manag. 2022; ahead-of-publish. [Google Scholar] [CrossRef]
- Shehadeh, A.; Alshboul, O.; Hamedat, O. A Gaussian mixture model evaluation of construction companies’ business acceptance capabilities in performing construction and maintenance activities during COVID-19 pandemic. Int. J. Manag. Sci. Eng. Manag. 2021, 17, 112–122. [Google Scholar] [CrossRef]
- Lu, Y. Artificial intelligence: A survey on evolution, models, applications and future trends. J. Manag. Anal. 2019, 6, 1–29. [Google Scholar] [CrossRef]
- Alshboul, O.; Alzubaidi, M.A.; Al Mamlook, R.E.; Almasabha, G.; Almuflih, A.S.; Shehadeh, A. Forecasting Liquidated Damages via Machine Learning-Based Modified Regression Models for Highway Construction Projects. Sustainability 2022, 14, 5835. [Google Scholar] [CrossRef]
- Sergeev, A.; Buevich, A.; Baglaeva, E.; Shichkin, A. Combining spatial autocorrelation with machine learning increases prediction accuracy of soil heavy metals. CATENA 2019, 174, 425–435. [Google Scholar] [CrossRef]
- Chu, Y.; Liu, S.; Cai, G.; Bian, H. Artificial neural network prediction models of heavy metal polluted soil resistivity. Eur. J. Environ. Civ. Eng. 2021, 25, 1570–1590. [Google Scholar] [CrossRef]
- Lu, L.; Dao, M.; Kumar, P.; Ramamurty, U.; Karniadakis, G.E.; Suresh, S. Extraction of mechanical properties of materials through deep learning from instrumented indentation. Proc. Natl. Acad. Sci. USA 2020, 117, 7052–7062. [Google Scholar] [CrossRef]
- Ozdemir, A.; Polat, K. Deep Learning Applications for Hyperspectral Imaging: A Systematic Review. J. Inst. Electron. Comput. 2020, 2, 39–56. [Google Scholar] [CrossRef]
- Ou, D.; Tan, K.; Lai, J.; Jia, X.; Wang, X.; Chen, Y.; Li, J. Semi-supervised DNN regression on airborne hyperspectral imagery for improved spatial soil properties prediction. Geoderma 2021, 385, 114875. [Google Scholar] [CrossRef]
- Zhu, S.; Chen, Y.; Khan, M.A.; Xu, H.; Wang, F.; Xia, M. In-Depth Study of Heavy Metal Removal by an Etidronic Acid-Functionalized Layered Double Hydroxide. ACS Appl. Mater. Interfaces 2022, 14, 7450–7463. [Google Scholar] [CrossRef]
- Zhu, S.; Xia, M.; Chu, Y.; Khan, M.A.; Lei, W.; Wang, F.; Muhmood, T.; Wang, A. Adsorption and Desorption of Pb(II) on l-Lysine Modified Montmorillonite and the simulation of Interlayer Structure. Appl. Clay Sci. 2019, 169, 40–47. [Google Scholar] [CrossRef]
- Haenlein, M.; Kaplan, A. A Brief History of Artificial Intelligence: On the Past, Present, and Future of Artificial Intelligence. Calif. Manag. Rev. 2019, 61, 5–14. [Google Scholar] [CrossRef]
- Yaseen, Z.M. An insight into machine learning models era in simulating soil, water bodies and adsorption heavy metals: Review, challenges and solutions. Chemosphere 2021, 277, 130126. [Google Scholar] [CrossRef]
- Alshboul, O.; Shehadeh, A.; Al-Kasasbeh, M.; Al Mamlook, R.E.; Halalsheh, N.; Alkasasbeh, M. Deep and machine learning approaches for forecasting the residual value of heavy construction equipment: A management decision support model. Eng. Constr. Arch. Manag. 2021. [Google Scholar] [CrossRef]
- Alshboul, O.; Shehadeh, A.; Almasabha, G.; Almuflih, A.S. Extreme Gradient Boosting-Based Machine Learning Approach for Green Building Cost Prediction. Sustainability 2022, 14, 6651. [Google Scholar] [CrossRef]
- Blagojev, N.; Kukić, D.; Vasić, V.; Šćiban, M.; Prodanović, J.; Bera, O. A new approach for modelling and optimization of Cu(II) biosorption from aqueous solutions using sugar beet shreds in a fixed-bed column. J. Hazard. Mater. 2019, 363, 366–375. [Google Scholar] [CrossRef] [PubMed]
- Chu, K.H. Breakthrough curve analysis by simplistic models of fixed bed adsorption: In defense of the century-old Bohart-Adams model. Chem. Eng. J. 2020, 380, 122513. [Google Scholar] [CrossRef]
- Dutta, S.; Parsons, S.A.; Bhattacharjee, C.; Bandhyopadhyay, S.; Datta, S. Development of an artificial neural network model for adsorption and photocatalysis of reactive dye on TiO2 surface. Expert Syst. Appl. 2010, 37, 8634–8638. [Google Scholar] [CrossRef]
- Ghaedi, A.M.; Vafaei, A. Applications of artificial neural networks for adsorption removal of dyes from aqueous solution: A review. Adv. Colloid Interface Sci. 2017, 245, 20–39. [Google Scholar] [CrossRef]
- Rojas-Mayorga, C.K.; Bonilla-Petriciolet, A.; Sánchez-Ruiz, F.; Moreno-Perez, J.; Reynel-Ávila, H.; Aguayo, I.; Castillo, D.I.M. Breakthrough curve modeling of liquid-phase adsorption of fluoride ions on aluminum-doped bone char using micro-columns: Effectiveness of data fitting approaches. J. Mol. Liq. 2015, 208, 114–121. [Google Scholar] [CrossRef]
- Das, S.; Mishra, S. Artificial neural network (ANN) approach for prediction and modeling of breakthrough curve analysis of fixed-bed adsorption of iron ions from aqueous solution by activated carbon from Limonia acidissima shell. Int. J. Chem. React. Eng. 2021, 19, 1197–1219. [Google Scholar] [CrossRef]
- Bhagat, S.K.; Tung, T.M.; Yaseen, Z.M. Development of artificial intelligence for modeling wastewater heavy metal removal: State of the art, application assessment and possible future research. J. Clean. Prod. 2020, 250, 119473. [Google Scholar] [CrossRef]
- Wang, J.; Ji, H.; Wang, Q.G.; Li, H.; Qian, X.; Li, F.; Yang, M. Prediction of size-fractionated airborne particle-bound metals using MLR, BP-ANN and SVM analyses. Chemosphere 2017, 180, 513–522. [Google Scholar] [CrossRef]
- Tepanosyan, G.; Sahakyan, L.; Maghakyan, N.; Saghatelyan, A. Combination of compositional data analysis and machine learning approaches to identify sources and geochemical associations of potentially toxic elements in soil and assess the associated human health risk in a mining city. Environ. Pollut. 2020, 261, 114210. [Google Scholar] [CrossRef] [PubMed]
- Normile, H.J.; Papelis, C.; Kibbey, T.C.G. Remobilization Dynamics of Caffeine, Ciprofloxacin, and Propranolol following Evaporation-Induced Immobilization in Porous Media. Environ. Sci. Technol. 2017, 51, 6082–6089. [Google Scholar] [CrossRef]
- James, G.; Witten, D.; Hastie, T.; Tibshirani, R. An Introduction to Statistical Learning; Springer: New York, NY, USA, 2013; Volume 112. [Google Scholar]
- Clark, L.A.; Pregibon, D. Tree-based models. In Statistical Models in S; Routledge: Abington, UK, 2017. [Google Scholar]
- Freund, Y.; Schapire, R.E. A desicion-theoretic generalization of on-line learning and an application to boosting. In Proceedings of the European Conference on Computational Learning Theory, Barcelona, Spain, 13–15 March 1995; pp. 23–37. [Google Scholar]
- Hu, W.; Hu, W.; Maybank, S. AdaBoost-Based Algorithm for Network Intrusion Detection. IEEE Trans. Syst. Man, Cybern. Part B 2008, 38, 577–583. [Google Scholar] [CrossRef]
- Drucker, H. Improving regressors using boosting techniques. In Proceedings of the 14th International Conference on Machine Learning, Nashville, TN, USA, 8–12 July 1997. [Google Scholar]
- Shrestha, D.L.; Solomatine, D.P. Experiments with AdaBoost.RT, an Improved Boosting Scheme for Regression. Neural Comput. 2006, 18, 1678–1710. [Google Scholar] [CrossRef] [PubMed]
- Friedman, J.H. Greedy function approximation: A gradient boosting machine. Ann. Stat. 2001, 29, 1189–1232. [Google Scholar] [CrossRef]
- Prokhorenkova, L.; Gusev, G.; Vorobev, A.; Dorogush, A.V.; Gulin, A. CatBoost: Unbiased Boosting with Categorical Features. Available online: https://github.com/catboost/catboost (accessed on 1 May 2022).
- Chen, T.; Guestrin, C. XGBoost: A Scalable Tree Boosting System. In KDD ’16: Proceedings of the 22nd ACM SIGKDD International Conference on Knowledge Discovery and Data Mining, San Francisco, CA, USA, 13–17 August 2016; Association for Computing Machinery: New York, NY, USA, 2016; pp. 785–794. [Google Scholar] [CrossRef]
- Ke, G.; Meng, Q.; Finley, T.; Wang, T.; Chen, W.; Ma, W.; Ye, Q.; Liu, T. LightGBM: A Highly Efficient Gradient Boosting Decision Tree. Available online: https://github.com/Microsoft/LightGBM (accessed on 5 May 2022).
- Holmes, A.B.; Gu, F.X. Emerging nanomaterials for the application of selenium removal for wastewater treatment. Environ. Sci. Nano 2016, 3, 982–996. [Google Scholar] [CrossRef]
- Xu, R.; Wang, Y.; Tiwari, D.; Wang, H. Effect of ionic strength on adsorption of As(III) and As(V) on variable charge soils. J. Environ. Sci. 2009, 21, 927–932. [Google Scholar] [CrossRef]
- Selambakkannu, S.; Othman, N.A.F.; Abu Bakar, K.; Karim, Z.A. Adsorption studies of packed bed column for the removal of dyes using amine functionalized radiation induced grafted fiber. SN Appl. Sci. 2019, 1, 175. [Google Scholar] [CrossRef]
- Rožić, M.; Cerjan-Stefanović, Š.; Ćurković, L. Evaluation of Croatian Clinoptiloliteand Montmorillonite-rich tuffs for ammonium removal. Croatica Chem. Acta 2002, 75, 255–269. [Google Scholar]
- Huang, G.; Wu, L.; Ma, X.; Zhang, W.; Fan, J.; Yu, X.; Zeng, W.; Zhou, H. Evaluation of CatBoost method for prediction of reference evapotranspiration in humid regions. J. Hydrol. 2019, 574, 1029–1041. [Google Scholar] [CrossRef]


| Random samples of SAD | Features | |||
| Concentration (M) | Ionic Strength (M) | Time (min) | C/Co | |
| 10−5 | 0.01 | 3 | 0.004974 | |
| 10−5 | 0.01 | 6 | 0.036074 | |
| 10−5 | 0.01 | 9 | 0.040607 | |
| 10−5 | 1 | 59 | 0.125845 | |
| 10−5 | 1 | 63 | 0.197145 | |
| 10−5 | 1 | 67 | 0.220659 | |
| 10−4 | 0.01 | 300 | 0.962113 | |
| 10−4 | 0.01 | 304 | 0.962832 | |
| 10−4 | 0.01 | 308 | 0.942469 | |
| 10−4 | 1 | 129 | 0.774688 | |
| 10−4 | 1 | 136 | 0.77704 | |
| 10−4 | 1 | 143 | 0.788269 | |
| ⋮ ⋮ ⋮ ⋮ | ⋮ ⋮ ⋮ ⋮ | ⋮ ⋮ ⋮ ⋮ | ⋮ ⋮ ⋮ ⋮ | |
| Mean | 0.0000545 | 0.495 | 114 | 0.499 |
| Median | 0.00001 | 0.01 | 98 | 0.532 |
| Minimum | 0.00001 | 0.01 | 3 | 0.002 |
| Maximum | 0.0001 | 1 | 348 | 0.962 |
| Element | Weight % | |
|---|---|---|
| Natural Zeolite | Modified Zeolite | |
| O | 67.57 | 51.98 |
| Mg | 0.42 | 0.48 |
| Al | 4.36 | 4.99 |
| Si | 17.69 | 25.92 |
| K | 1.34 | 0.39 |
| Na | 0.53 | 1.18 |
| Ca | 2.71 | 1.17 |
| Fe | 0.54 | 8.04 |
| Others | 4.84 | 5.85 |
| Performance Metrics | Prediction Models | ||||
|---|---|---|---|---|---|
| AdaBoost | Gradient Boosting | XGBoost | LightGBM | CatBoost | |
| R2 | 63.78% | 97.97% | 43.27% | 99.00% | 99.57% |
| MAE | 0.15 | 0.03 | 0.19 | 0.02 | 0.015 |
| MAPE | 0.80 | 0.12 | 1.46 | 0.14 | 0.06 |
| RMSE | 0.16 | 0.04 | 0.22 | 0.03 | 0.02 |
Publisher’s Note: MDPI stays neutral with regard to jurisdictional claims in published maps and institutional affiliations. |
© 2022 by the authors. Licensee MDPI, Basel, Switzerland. This article is an open access article distributed under the terms and conditions of the Creative Commons Attribution (CC BY) license (https://creativecommons.org/licenses/by/4.0/).
Share and Cite
Halalsheh, N.; Alshboul, O.; Shehadeh, A.; Al Mamlook, R.E.; Al-Othman, A.; Tawalbeh, M.; Saeed Almuflih, A.; Papelis, C. Breakthrough Curves Prediction of Selenite Adsorption on Chemically Modified Zeolite Using Boosted Decision Tree Algorithms for Water Treatment Applications. Water 2022, 14, 2519. https://doi.org/10.3390/w14162519
Halalsheh N, Alshboul O, Shehadeh A, Al Mamlook RE, Al-Othman A, Tawalbeh M, Saeed Almuflih A, Papelis C. Breakthrough Curves Prediction of Selenite Adsorption on Chemically Modified Zeolite Using Boosted Decision Tree Algorithms for Water Treatment Applications. Water. 2022; 14(16):2519. https://doi.org/10.3390/w14162519
Chicago/Turabian StyleHalalsheh, Neda, Odey Alshboul, Ali Shehadeh, Rabia Emhamed Al Mamlook, Amani Al-Othman, Muhammad Tawalbeh, Ali Saeed Almuflih, and Charalambos Papelis. 2022. "Breakthrough Curves Prediction of Selenite Adsorption on Chemically Modified Zeolite Using Boosted Decision Tree Algorithms for Water Treatment Applications" Water 14, no. 16: 2519. https://doi.org/10.3390/w14162519