
Hydrological Regime and Fish Predation Regulate the Zooplankton Community Size Structure in a Tropical Floodplain Lake


1
School of Engineering, The University of Western Australia, 35 Stirling Highway, M051, Crawley, WA 6009, Australia
2
Research Centre for Limnology and Water Resources, National Research and Innovation Agency (BRIN), Jl. Raya Bogor Km. 46, Cibinong 16911, Indonesia
*
Author to whom correspondence should be addressed.
Water 2022, 14(16), 2518; https://doi.org/10.3390/w14162518
Submission received: 25 July 2022
/
Revised: 11 August 2022
/
Accepted: 11 August 2022
/
Published: 16 August 2022
(This article belongs to the Section Biodiversity and Functionality of Aquatic Ecosystems)
Abstract
:Floodplain ecosystems are characterised by alternating flood and drought periods that can affect the structure of the aquatic community. Dynamic changes in the hydrological regimes from flooding to dry periods influence the migration and dispersal of aquatic fauna and the exchange of particulate matter and nutrients. Riverine floodplains are among the most productive ecosystems; however, increasing pressure from anthropogenic activities has altered the hydrological regimes, threatening aquatic biodiversity. In this study, we examined the temporal patterns of zooplankton community size structure and fish density during three distinct hydrological events in a tropical floodplain lake, Lake Tempe, Indonesia. We included fish density data and three contrasting hydrological conditions, moderate-, high-, and low-water periods, as the environmental factors regulating zooplankton community structure. In high- and low-water conditions, the ecosystem heterogeneity was characterised by high chlorophyll-a, total nitrogen, and total phosphorus concentrations; high fish density; and high zooplankton abundance and biomass. During the early flood period, the ecosystem was characterised by lower concentrations of trophic indicators and significant decreases in zooplankton abundance and biomass, as well as decreased fish density. While there was no clear association between hydrological conditions and zooplankton size structure, our findings indicate that fish predation probably suppressed zooplankton size diversity in Lake Tempe, shown by the dominant contribution of small-sized zooplankton towards total abundance and biomass under all hydrological conditions. Our results indicate that the patterns of environmental variables, zooplankton community, and fish density are affected by hydrological conditions, highlighting the role of water level fluctuation as the driving factor for zooplankton community structure. Our results also indicated that fish predation led to the development of a small-sized population of zooplankton in Lake Tempe.
1. Introduction
Analysing and understanding the community shifts in response to environmental heterogeneity is a fundamental interest in ecology. In the context of increasing and unprecedented anthropogenic pressure on aquatic environments, more information is required to elucidate these impacts on community composition, especially in freshwater and riverine floodplain systems [1,2]. In floodplain ecosystems, the hydrological regimes, characterised by a natural shift between flooding and drought periods, can influence the structure of aquatic communities [3,4,5]. During floods, alternating rising and falling water levels facilitate the exchange of fauna, particulate matter, and nutrients among habitats, influencing aquatic community and ecosystems dynamics as a whole [3,6,7]. On the other hand, drought can cause habitat fragmentation, whereby community structure is influenced by more local factors such as environmental factors, resource availability, and competition [8]. The influence of alternating flood and drought cycles on zooplankton community structure has been observed in many studies [4,5,9,10]. The heterogeneity of zooplankton community structure is driven by both abiotic (e.g., physical and chemical parameters) and biotic factors (e.g., food availability, competition, and predation) [11,12,13]. Most of these parameters are also regulated by the changes in the hydrological regimes in the floodplain habitat [5,14,15]. Floodplain ecosystems can also be influenced by anthropogenic activities, such as intensive aquaculture activities. Aquaculture activities in floodplain lake ecosystems are widespread in subtropical and tropical regions, such as China, Bangladesh, Vietnam, Thailand, and Indonesia [16,17]. Aquaculture fisheries in these regions often involve species introduction for the purpose of fish restocking to maintain fish yield, meaning that predation by fish is usually intense.
Zooplankton are widely studied as ecological indicators due to their fast response to environmental changes and pressures [18,19] and their critical role in aquatic food webs, responding to changes in the top-down (predation by fish and larger invertebrates) and bottom-up (phytoplankton) controls within the trophic level [20]. Predation plays a significant role in controlling zooplankton community composition, especially the size and biomass structure, since prey selection is typically size-dependent [13,21,22]. Brooks and Dodson [23] showed that prey–predation relationship in pelagic ecosystems is influenced the structure of the zooplankton community in different lakes in the United States; their study introduced the hypothesis of size efficiency, which indicates that larger-sized zooplankton, such as Daphnia, filter food more efficiently than small zooplankton when they compete over similar resources. Large-sized zooplankton also usually consume algae of a wide range of sizes, and thus larger zooplankton dominate, outcompeting smaller plankton due to their filter-feeding efficiency [24,25,26]. However, when predation by fish is intense, larger zooplankton are removed and smaller groups become dominant [13,27], inducing a shift in the size structure of zooplankton [28,29,30,31].
Body size is one of the most important metrics in assessing community interaction in ecosystems, since most ecological and physiological characteristics of an organism are linked with body size [32,33]. Body size can also reflect the prey–predator interaction of all organisms in a population, thus affecting the top-down and bottom-up controls and the energy transfer in the trophic structure [28,34]. Studies have shown that both biotic and abiotic variables can affect the size diversity of aquatic organisms [28,30,35]. Recent studies point out that predation by planktivorous fishes has an important effect on the temporal shift of zooplankton community size composition, resulting in small-zooplankton-dominated systems [22,32,36]. Nevertheless, changes in the size spectrum of the zooplankton community also depends on the temporal dynamics of environmental variables and the involved population, for example, small zooplankton that are typically predominant in tropical lakes [37].
Zooplankton communities in tropical shallow lakes often comprise small crustaceans, such as small cladocerans and copepods, and rotifers [29,38]. The predation pressure by fish is usually high in tropical environments, and the small-sized zooplankton become more dominant over time. The overall objective of this study was to examine the effect of hydrological regimes on zooplankton assemblages in Lake Tempe, Indonesia, a shallow floodplain lake where fish predation is historically high. Specifically, the aims of this study were to: (1) identify changes in zooplankton community size structure following tropical hydrological changes during early flooding, post-flooding, and low-water periods; and (2) examine whether fish predation affects the zooplankton size structure in the lake. Lake Tempe is a shallow floodplain lake in a tropical region and is one of the most important habitats for freshwater fisheries in Indonesia. During the period 1957 to 1959, the total annual fish catch from this lake was estimated at 50,000 tonnes; however, over the years this number has continuously decreased. The fish stock assessment data from 2009 to 2011 indicated that the fish catch in Lake Tempe was 10,000 tonnes/annum, which was very low compared to the fish haul in the 1950s. Aiming to increase the fish stock in the lake, non-native fish were introduced in 1990, and this was later identified as one of the causes for the decreasing number of native fish in the lakes [39,40].
2. Materials and Methods
2.1. Study Site
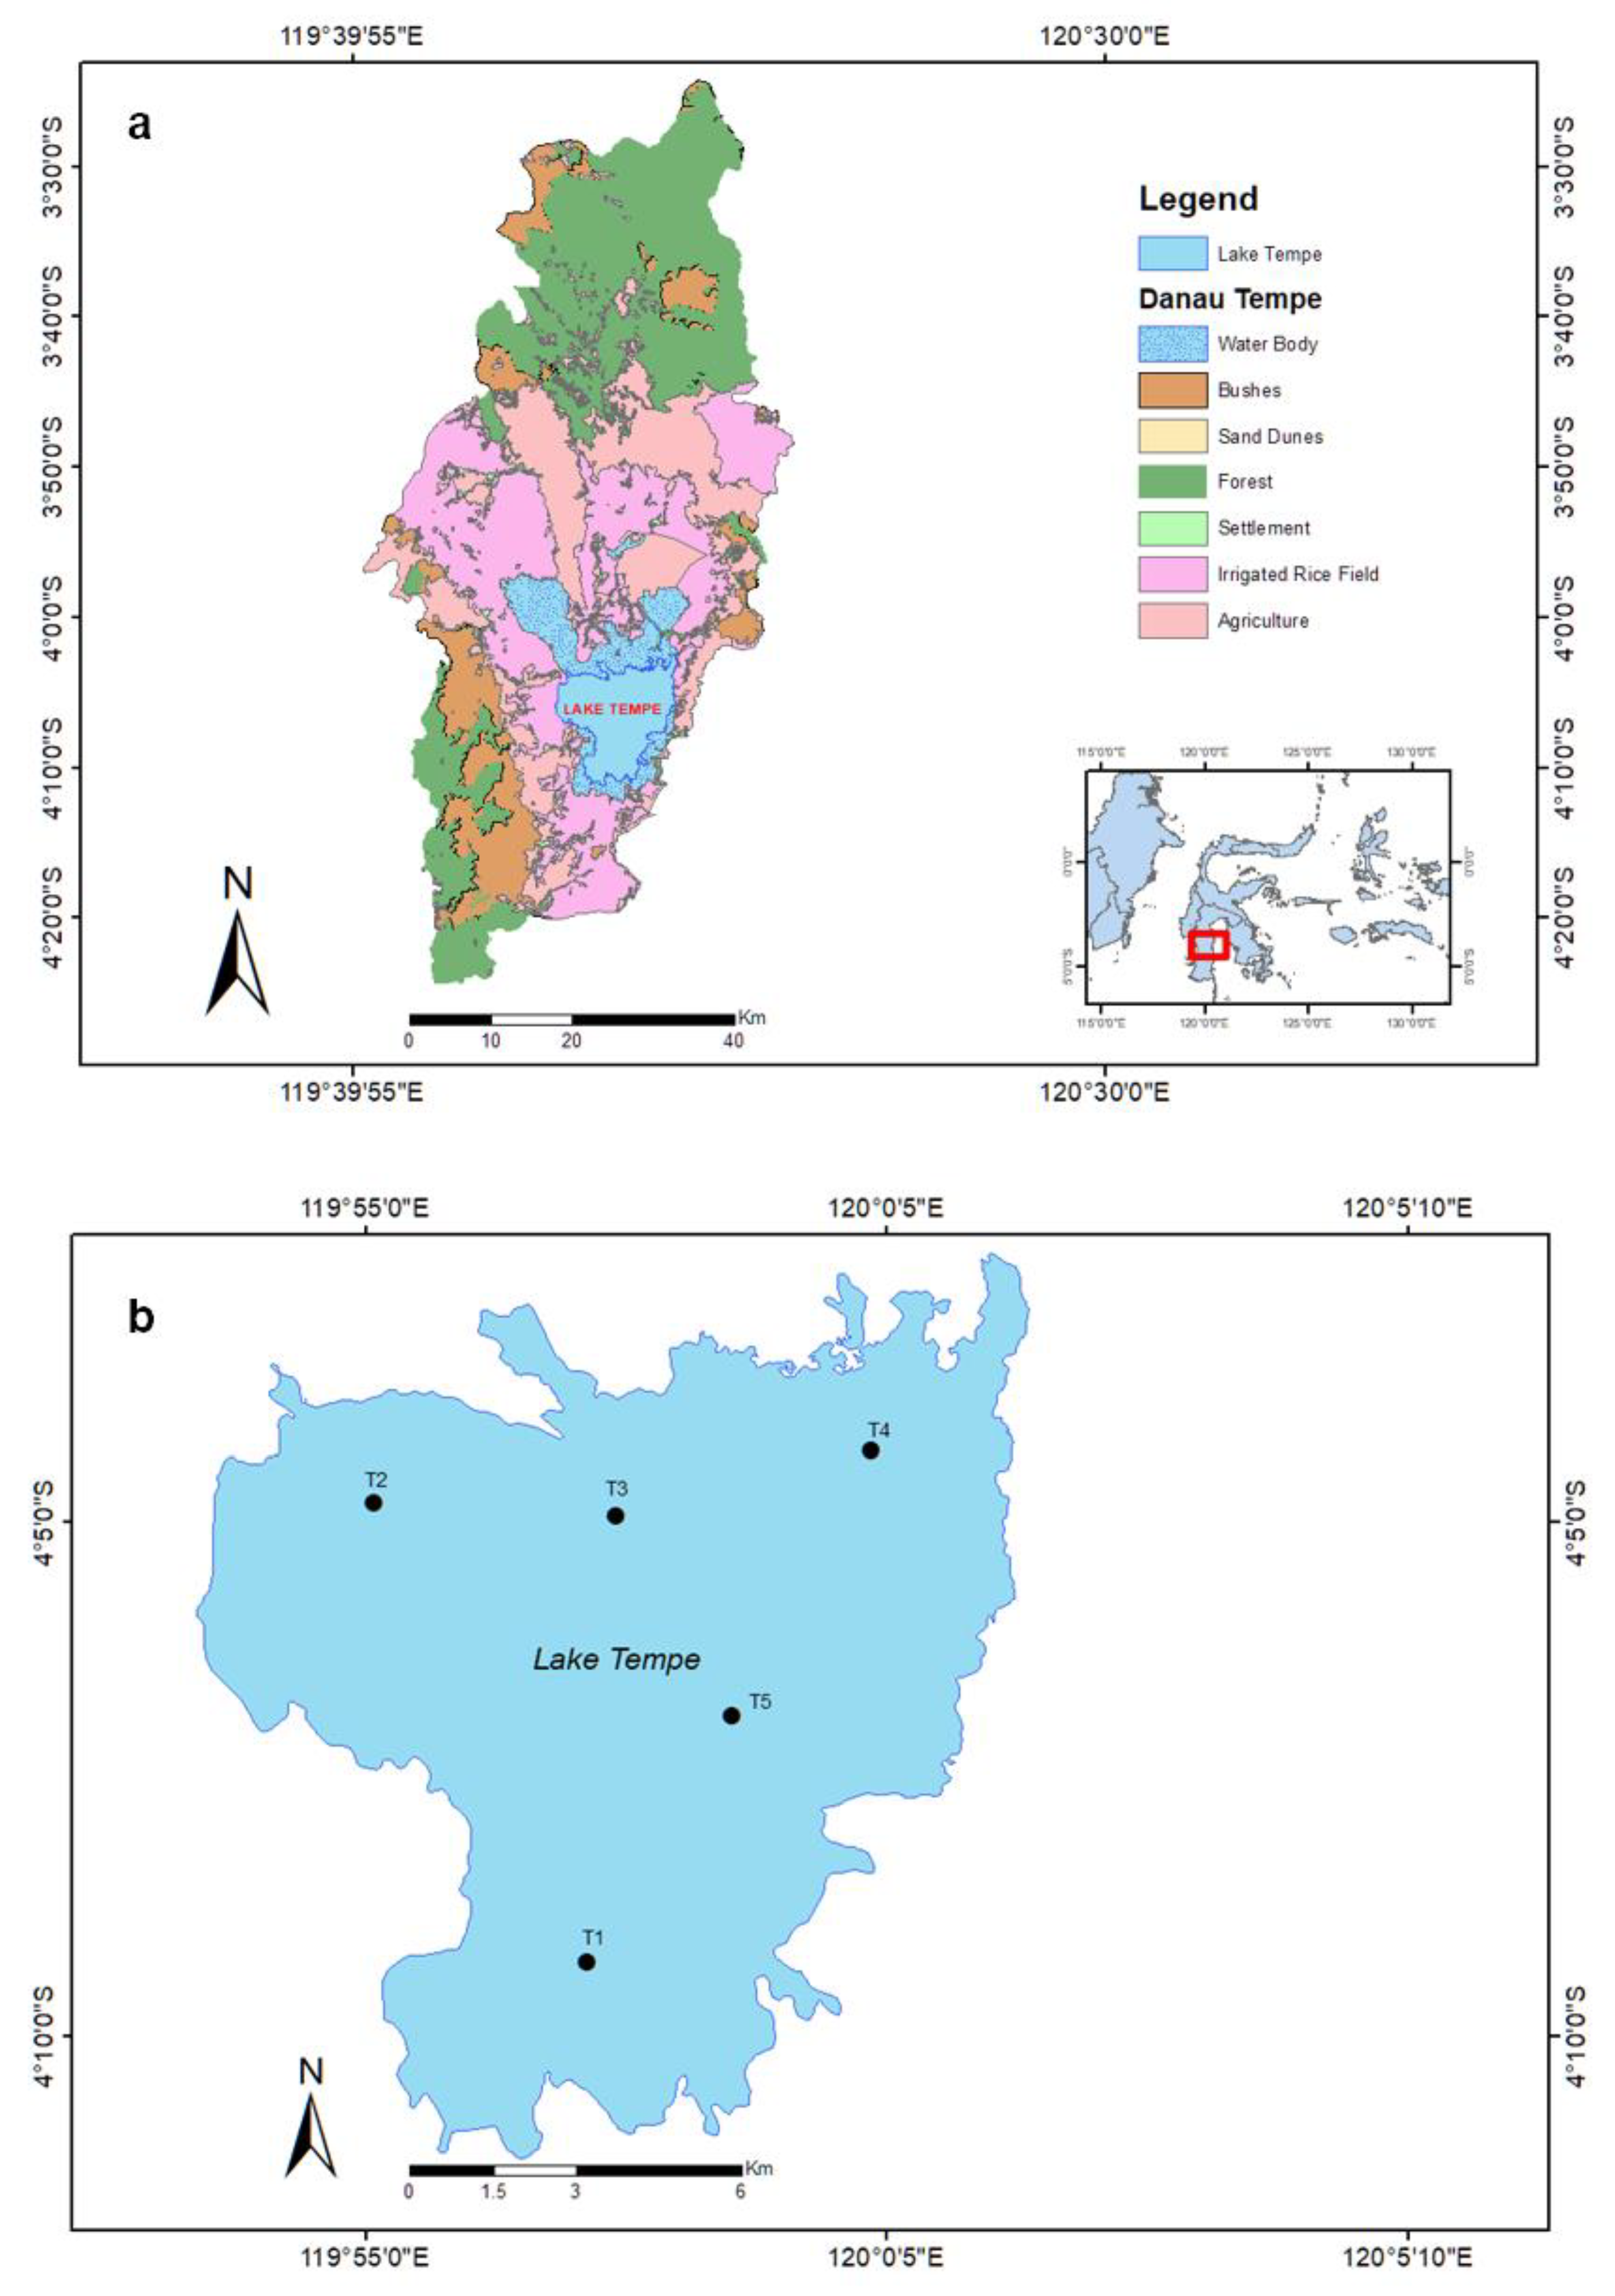
Lake Tempe (area = 478 km2, mean depth = 2.4 m, maximum depth = 4.9 m) is a riverine floodplain lake located on Sulawesi Island, Indonesia (Figure 1). The lake system was formed along the Wallanea-Cendranae River and is connected to three main riverine systems, namely Wallanae-Cendranae in the south, Bila in the north, and Batu-batu in the west. A total of 23 rivers drain into Lake Tempe, with only one outlet at River Cendranae. The total catchment area of the lake is 3288 km2, which is divided into three main subcatchments: Bila (1667 km2), Sidendreng (739 km2), and Batu-batu (733 km2). The total area of the lake itself is 478 km2, and the predominant land use in the catchment is irrigated rice and agricultural fields, resulting in significant nutrient input into the lake. Human activities surrounding the lake have also increased substantially, which has contributed to the increase in domestic sewage discharged directly into the lake. Nutrient enrichment and siltation in the lake have increased, mainly since the 1990s, due to land use changes in the catchment [41].
Despite the site having high ecological importance and being recognised as a potential Ramsar site of both national and international importance, the lake is highly vulnerable to environmental changes due to increasing anthropogenic activities along the catchment and tributaries. These include land use changes, sedimentation, flow regulation, and intensive aquaculture. This floodplain plays important social and economic roles in Indonesia, mostly due to aquaculture and tourism activities and because of its high biodiversity value.
2.2. Field Sampling
Field sampling was conducted during three different hydrological events in Lake Tempe. According to the annual water levels, we considered March as representing the flooding period, when the water level was starting to increase (moderate-water level period, MW); July as representing the high-water period (HW); and October as representing the dry period, when the water level receded (low-water period, LW). On each sampling campaign, routine limnological measurements including pH, dissolved oxygen, conductivity, water temperature, Secchi depth, and mean water depth were collected. Sampling was conducted at five sampling zones (T1, T2, T3, T4, and T5; Figure 1), with three sampling replicates in each zone, resulting in 13 samples for each sampling occasion. Local characteristics of each sampling zone are summarised in Table 1.
Water temperature, dissolved oxygen, pH, electric conductivity, and water turbidity were measured in situ with a Horiba U-51 Water Quality Checker (HORIBA Advanced Techno Co., Ltd.). Water depth was measured in centimetres, while water transparency was measured as Secchi depth (cm). Water samples for nutrient analysis, including total nitrogen (TN), total phosphorus (TP), and total chlorophyll-a (chl-a), were collected using a Van Dorn sampler (Eijkelkamp Soil & Water, Giesbeek, The Netherlands) from the subsurface (approximately 5 to 10 cm below the surface) at each sampling location. Following standard methods [42], TN was determined by a spectrophotometric method involving persulfate digestion, TP was determined by a spectrophotometric method with ascorbic acid, and total chl-a was determined by a spectrophotometric method involving acetone extraction. The total chl-a concentration was used as a proxy for phytoplankton biomass, and therefore for potential food resources for zooplankton. All analysis of water quality parameters was conducted by the Hydro-chemistry Laboratory at the Research Centre for Limnology, part of the National Research and Innovation Agency (BRIN; formerly known as the Indonesian Institute of Sciences, LIPI), Indonesia.
Zooplankton samples were collected from the pelagic zone at each sampling location with a 56 µm mesh size plankton net. Vertical net hauls over the entire water column (0.5–2.5 m) were performed at each sampling point. Zooplankton samples were then preserved in 4% sugar-buffered formaldehyde solution after being narcotised in the field with soda water. We used a Laser Optical Plankton Counter (LOPC; Rolls-Royce Naval Marine, Peterborough, Canada) to estimate the total zooplankton abundance and biomass. The zooplankton abundance and biomass were classified into three size classes (equivalent spherical diameter, ESD): small-sized, for those ranging from 300 to 500 µm; intermediate-sized for those ranging from 501 to 750 µm; and larger-sized, for those greater than 751 µm. Although the LOPC provides data for the 100 to 3500 µm ESD size fraction, our study only analysed the zooplankton size fraction between 300 and 2000 µm ESD, as we found that water bubbles in the lab circulator-mode LOPC prevented an accurate count of particles smaller than 300 µm, and an extremely low number of zooplankton larger than 2000 µm was found.
Fish samples were collected at each sampling point during the same sampling period as for zooplankton sampling. Fish were captured using three different techniques, gill nets, jabba trawl, and jabba kawat (locally sourced fishing gear), which were conducted for approximately 3 h at 5 sampling points. Fish data were expressed as species abundances in every sample and were indexed as the capture per unit effort (CPUE; number of individuals per sampling effort). Fish samples were identified and enumerated, and the voucher specimens were deposited at the Research Centre for Limnology. In order to indicate the potential predation of fish on zooplankton, we conducted a bibliographical study for tropical fishes based on a list available at http://www.fishbase.se (accessed on 16 February 2022).
2.3. Data Analysis
The environmental abiotic variables (water depth, water transparency, concentration of chl-a, TP, TN, and dissolved oxygen (DO)) and biotic variables (zooplankton abundance and biomass and fish density) for all hydrological conditions were log (x + 1) transformed for normalised distribution.
To assess the environmental variables, zooplankton, and fish community, multiparameter principal component analysis (PCA) was performed for all hydrological periods at once. Differences in the environmental variables and biotic indicators, such as zooplankton and fish community structures, between hydrological periods were tested with one-way analysis of variance (ANOVA). Fisher’s least significant difference (LSD) tests were used for post hoc comparison. Linear regression analyses were carried out, separately, to analyse the correlation between zooplankton aggregate community structure (abundance and biomass) and fish density, chl-a concentration, and nutrient parameters (such as TN and TP). TP, TN, chl-a, and fish density were treated as independent variables, while zooplankton abundance and biomass (according to the three different size classes: small, medium, and large) were treated as dependant variables. PCA analysis was performed in RStudio, while one-way ANOVA and linear regression analyses were performed in SigmaPlot (version 14.0, Systat Software, Inc., Chicago, IL, USA).
3. Results
3.1. Hydrological Conditions
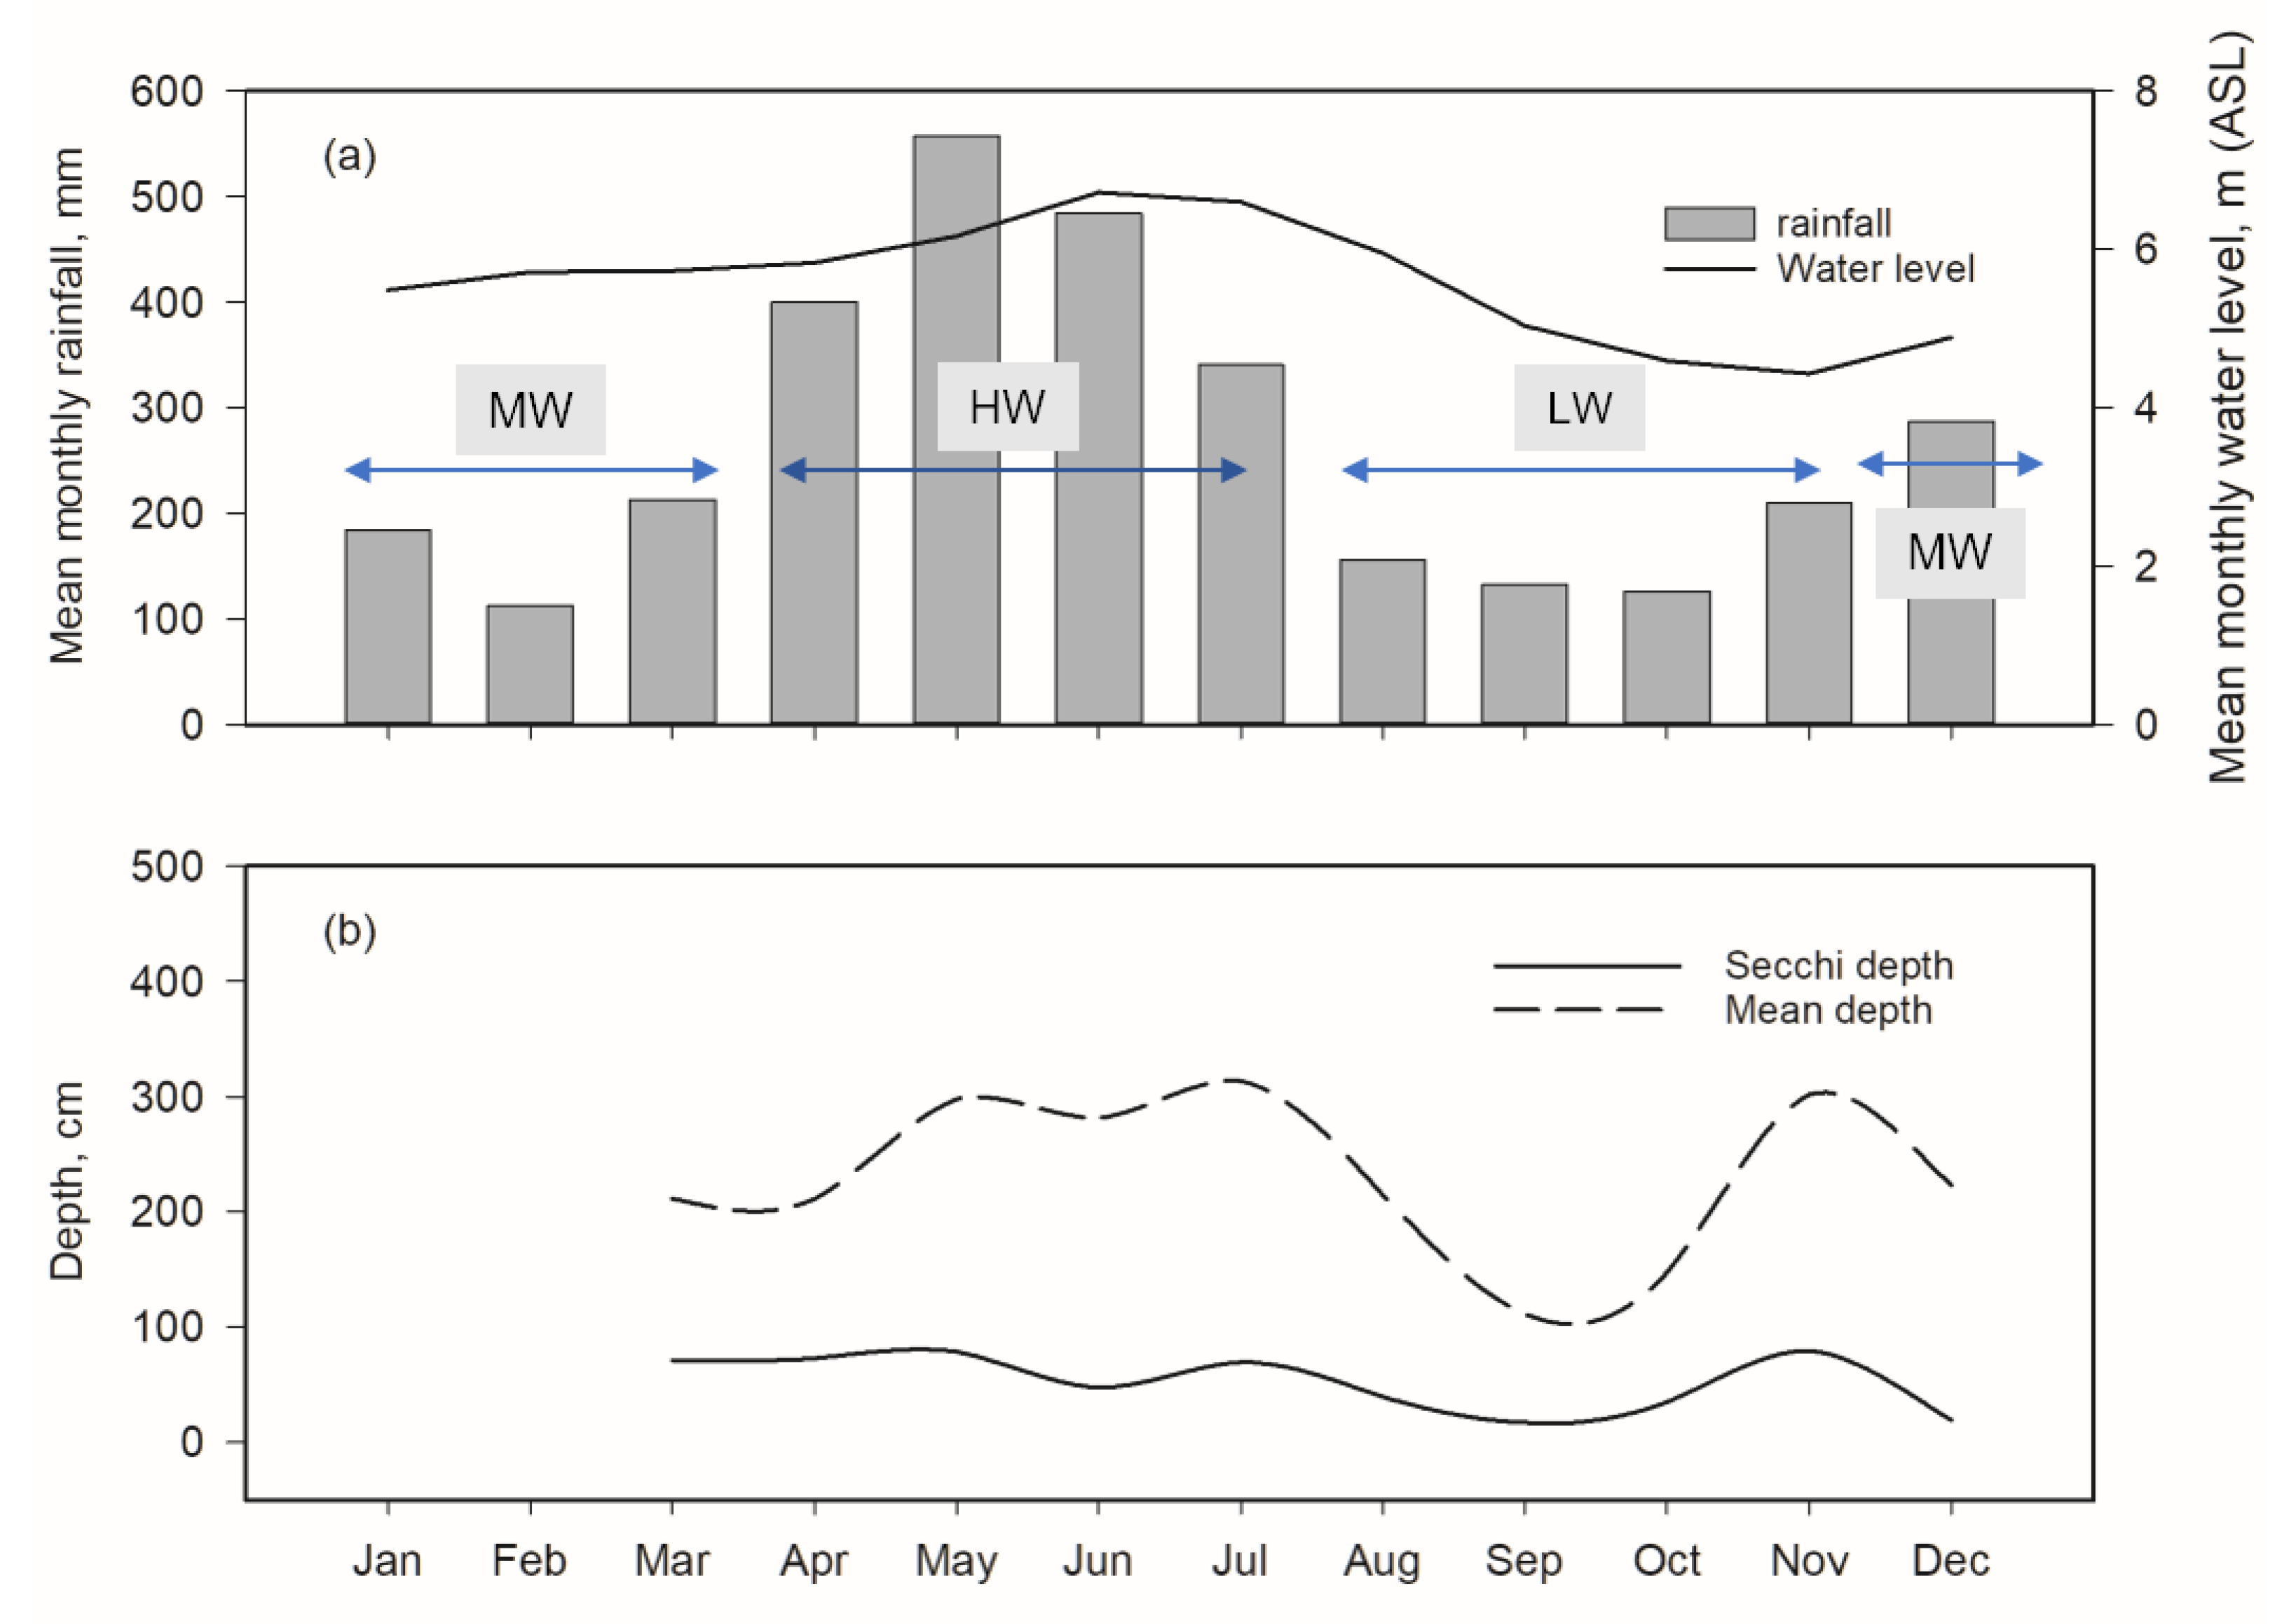
From 2000 to 2010, the mean monthly water levels at Lake Tempe ranged from 3.26m to 5.37 m above sea level (ASL), with the average being 4.3 m ASL. During the study period, March to December 2016, water levels ranged from 3.25 m to 8.67 m ASL, with an average value of 5.59 m ASL (Figure 2a). Most areas of Lake Tempe are very shallow, with water levels fluctuating seasonally, resulting in some areas being temporarily dry during the dry season. The water depth varied between 179 and 315 cm and 175 and 235 cm during the wet and dry seasons, respectively. Similarly, water transparency, measured as Secchi depth, was slightly lower in the dry season than in the wet season (Figure 2b). Our samples were collected three times to capture the three different hydrological periods: the flood period in March (moderate-water, MW); the post-flood period in July (high-water, HW); and the dry period in September (low-water, LW).
3.2. Physical and Chemical Parameters
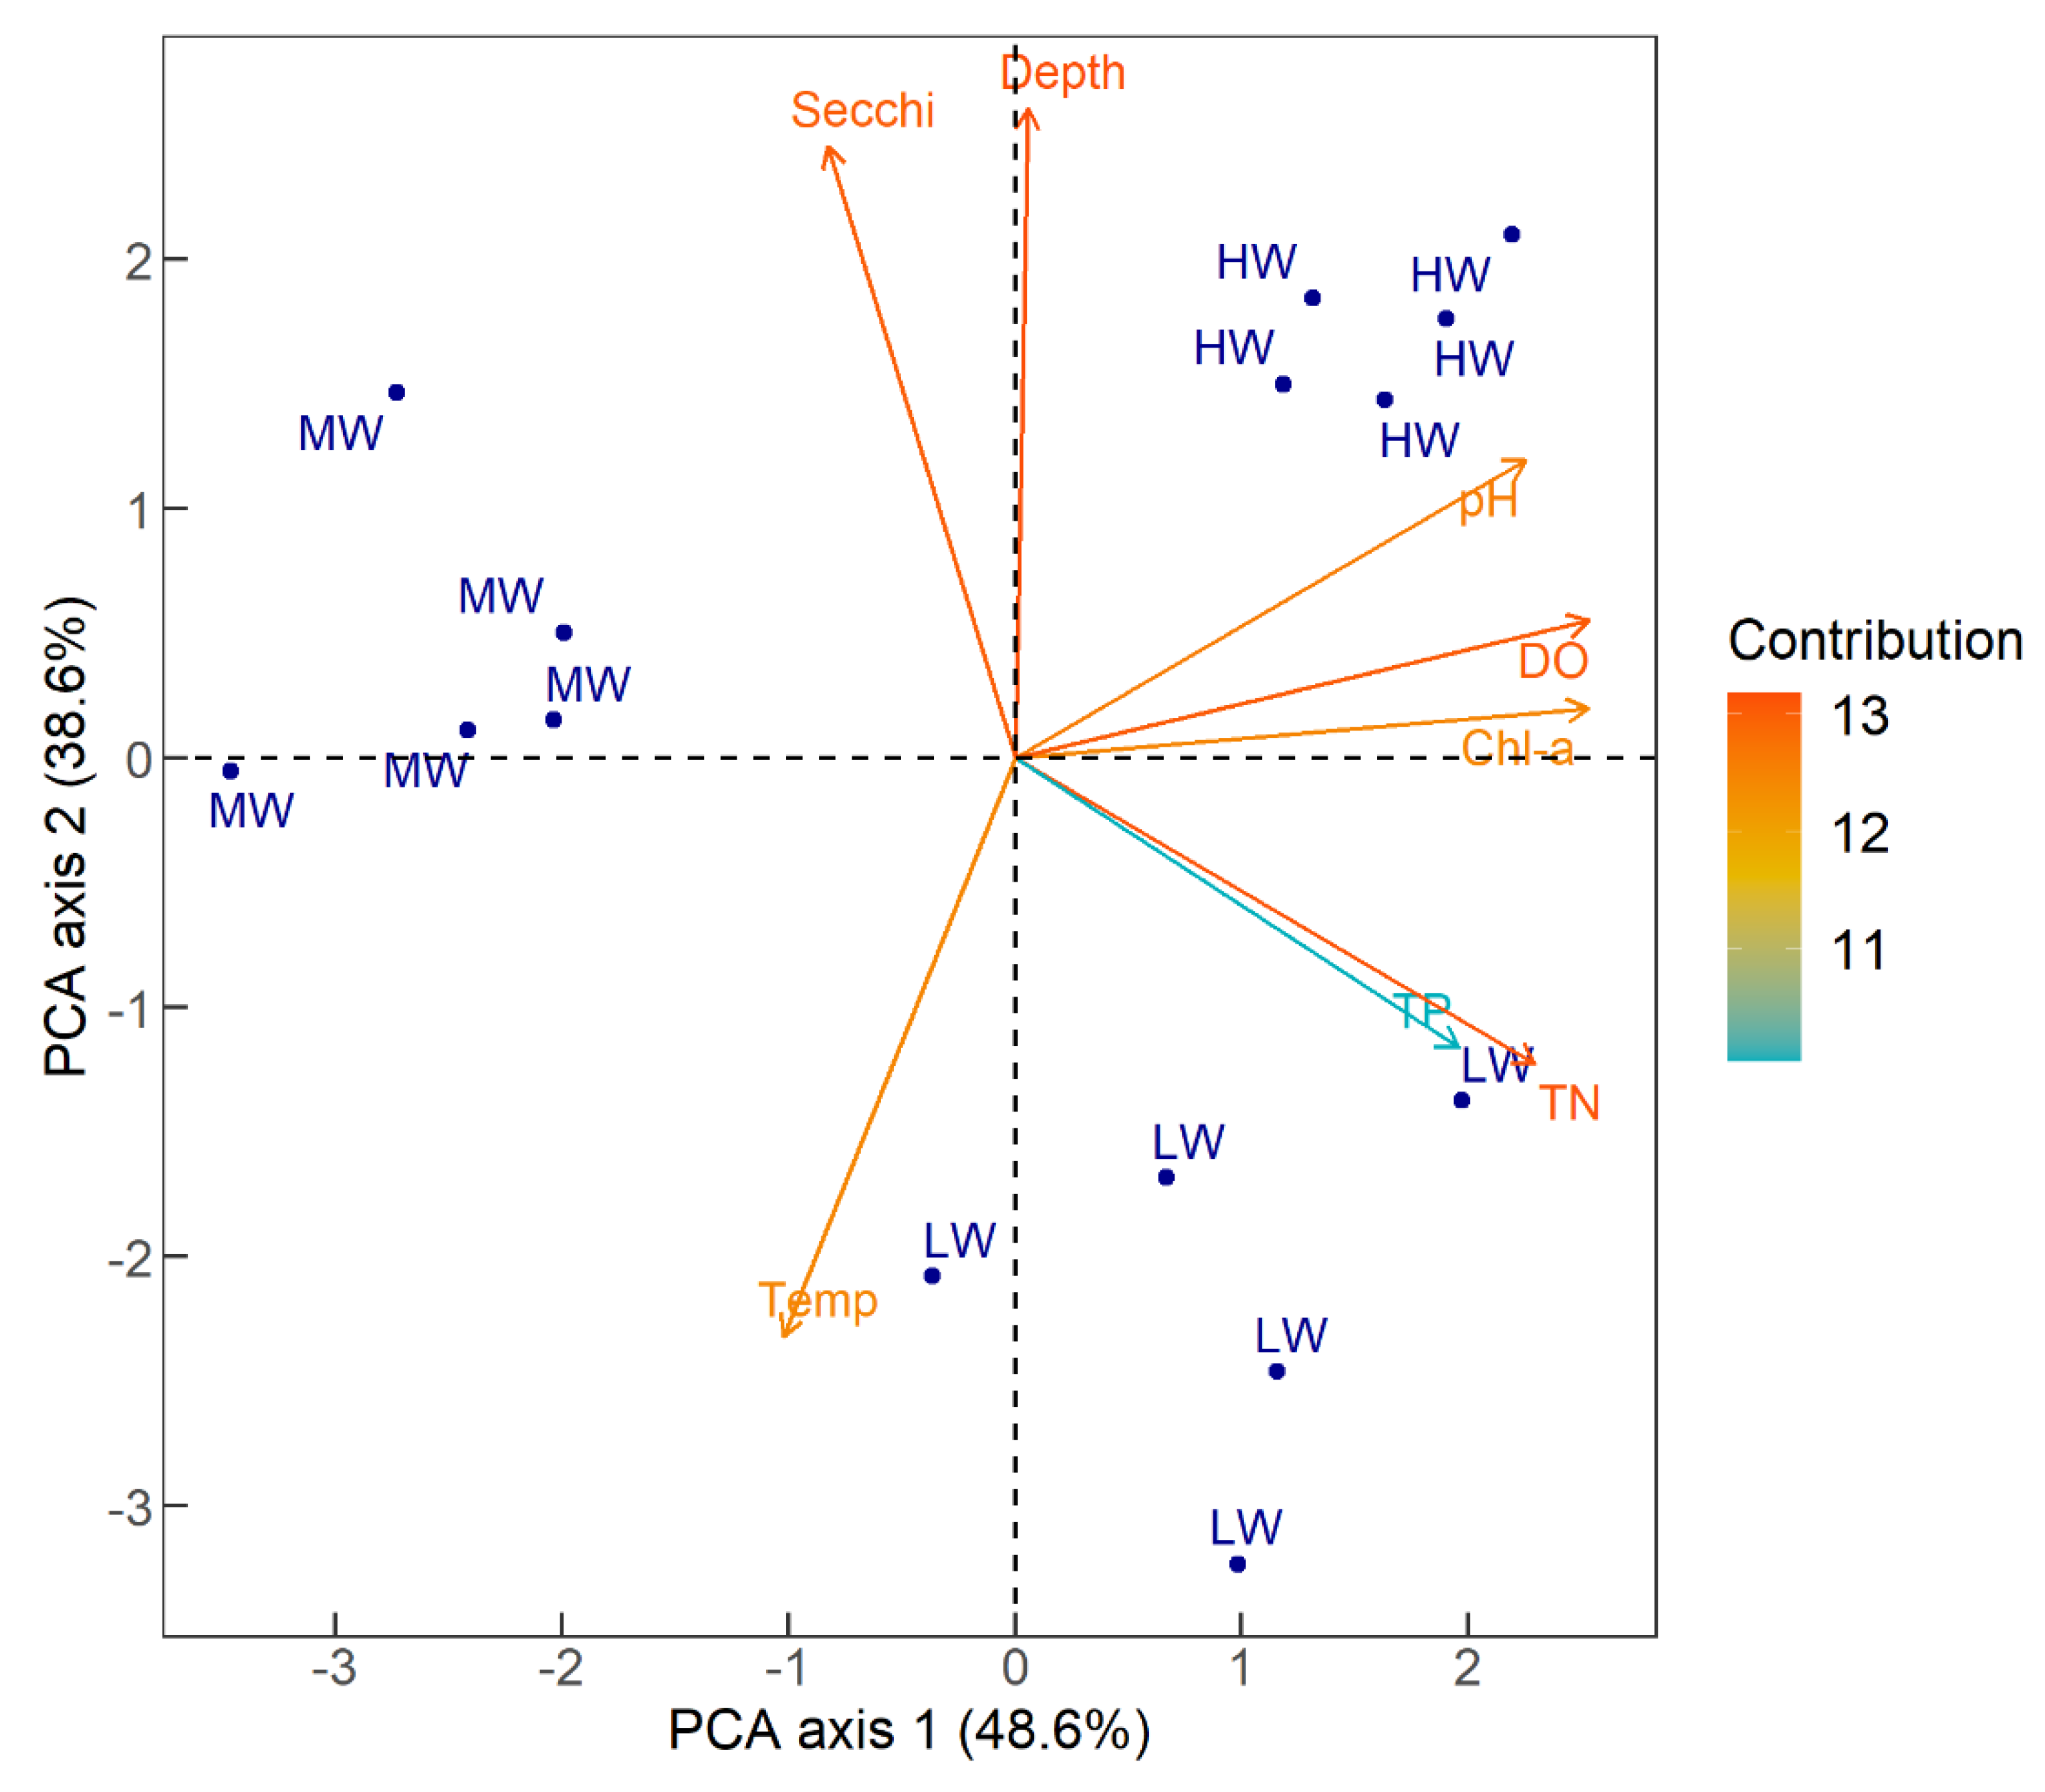
The limnological characteristics varied considerably during the study period and are summarised in Table 2. The PCA biplot ordination (Figure 3) shows the first two principal components representing environmental variables in Lake Tempe during MW, HW, and LW periods. The PCA ordination shows that 87% of the total variation was explained by pH, water depth, DO, TP, TN, and chl-a on the first axis (PC1) and Secchi depth and temperature on the second axis (PC2).
For most sampling points, the pH in the water column was circumneutral (7–8) during the MW period and slightly more alkaline during the HW and LW periods. The water temperature was relatively constant at all sampling points, ranging from 27.5 °C during the wet season to 31.5 °C during the dry season.
Lake Tempe is considered a eutrophic lake due to the high concentration of nutrients, as indicated by the TN, TP, and total chl-a. The TN ranged from 231 µg L−1 in the early flooding season (MW) to 1006 µg L−1 during HW. The TN concentration was significantly higher under LW conditions. Similarly, the TP was low in the early flooding period in March (MW) and increased significantly during the LW period. The average total chl-a concentration ranged from 3.57 mg m−3 in MW to 36.38 mg m−3 in HW.
The results of the analysis of variance (one-way ANOVA) showed that there were significant differences in the abiotic and biotic parameters between the three hydrological periods in Lake Tempe (Table 3). The TN concentrations were significantly different between MW, HW, and LW (p < 0.01), while the TP concentration differed between MW and LW only. The chl-a concentration varied significantly between all three water periods. Similarly, the mean water depth varied significantly across MW, HW, and LW, while the Secchi depth significantly differed between MW and LW and between HW and LW. In terms of the biotic components, there were significant differences in the zooplankton total abundance between MW and HW and between MW and HW, but no differences between HW and LW. As for fish density, the one-way ANOVA results indicated significant differences across all three hydrological periods.
3.3. Zooplankton Community Size Structure
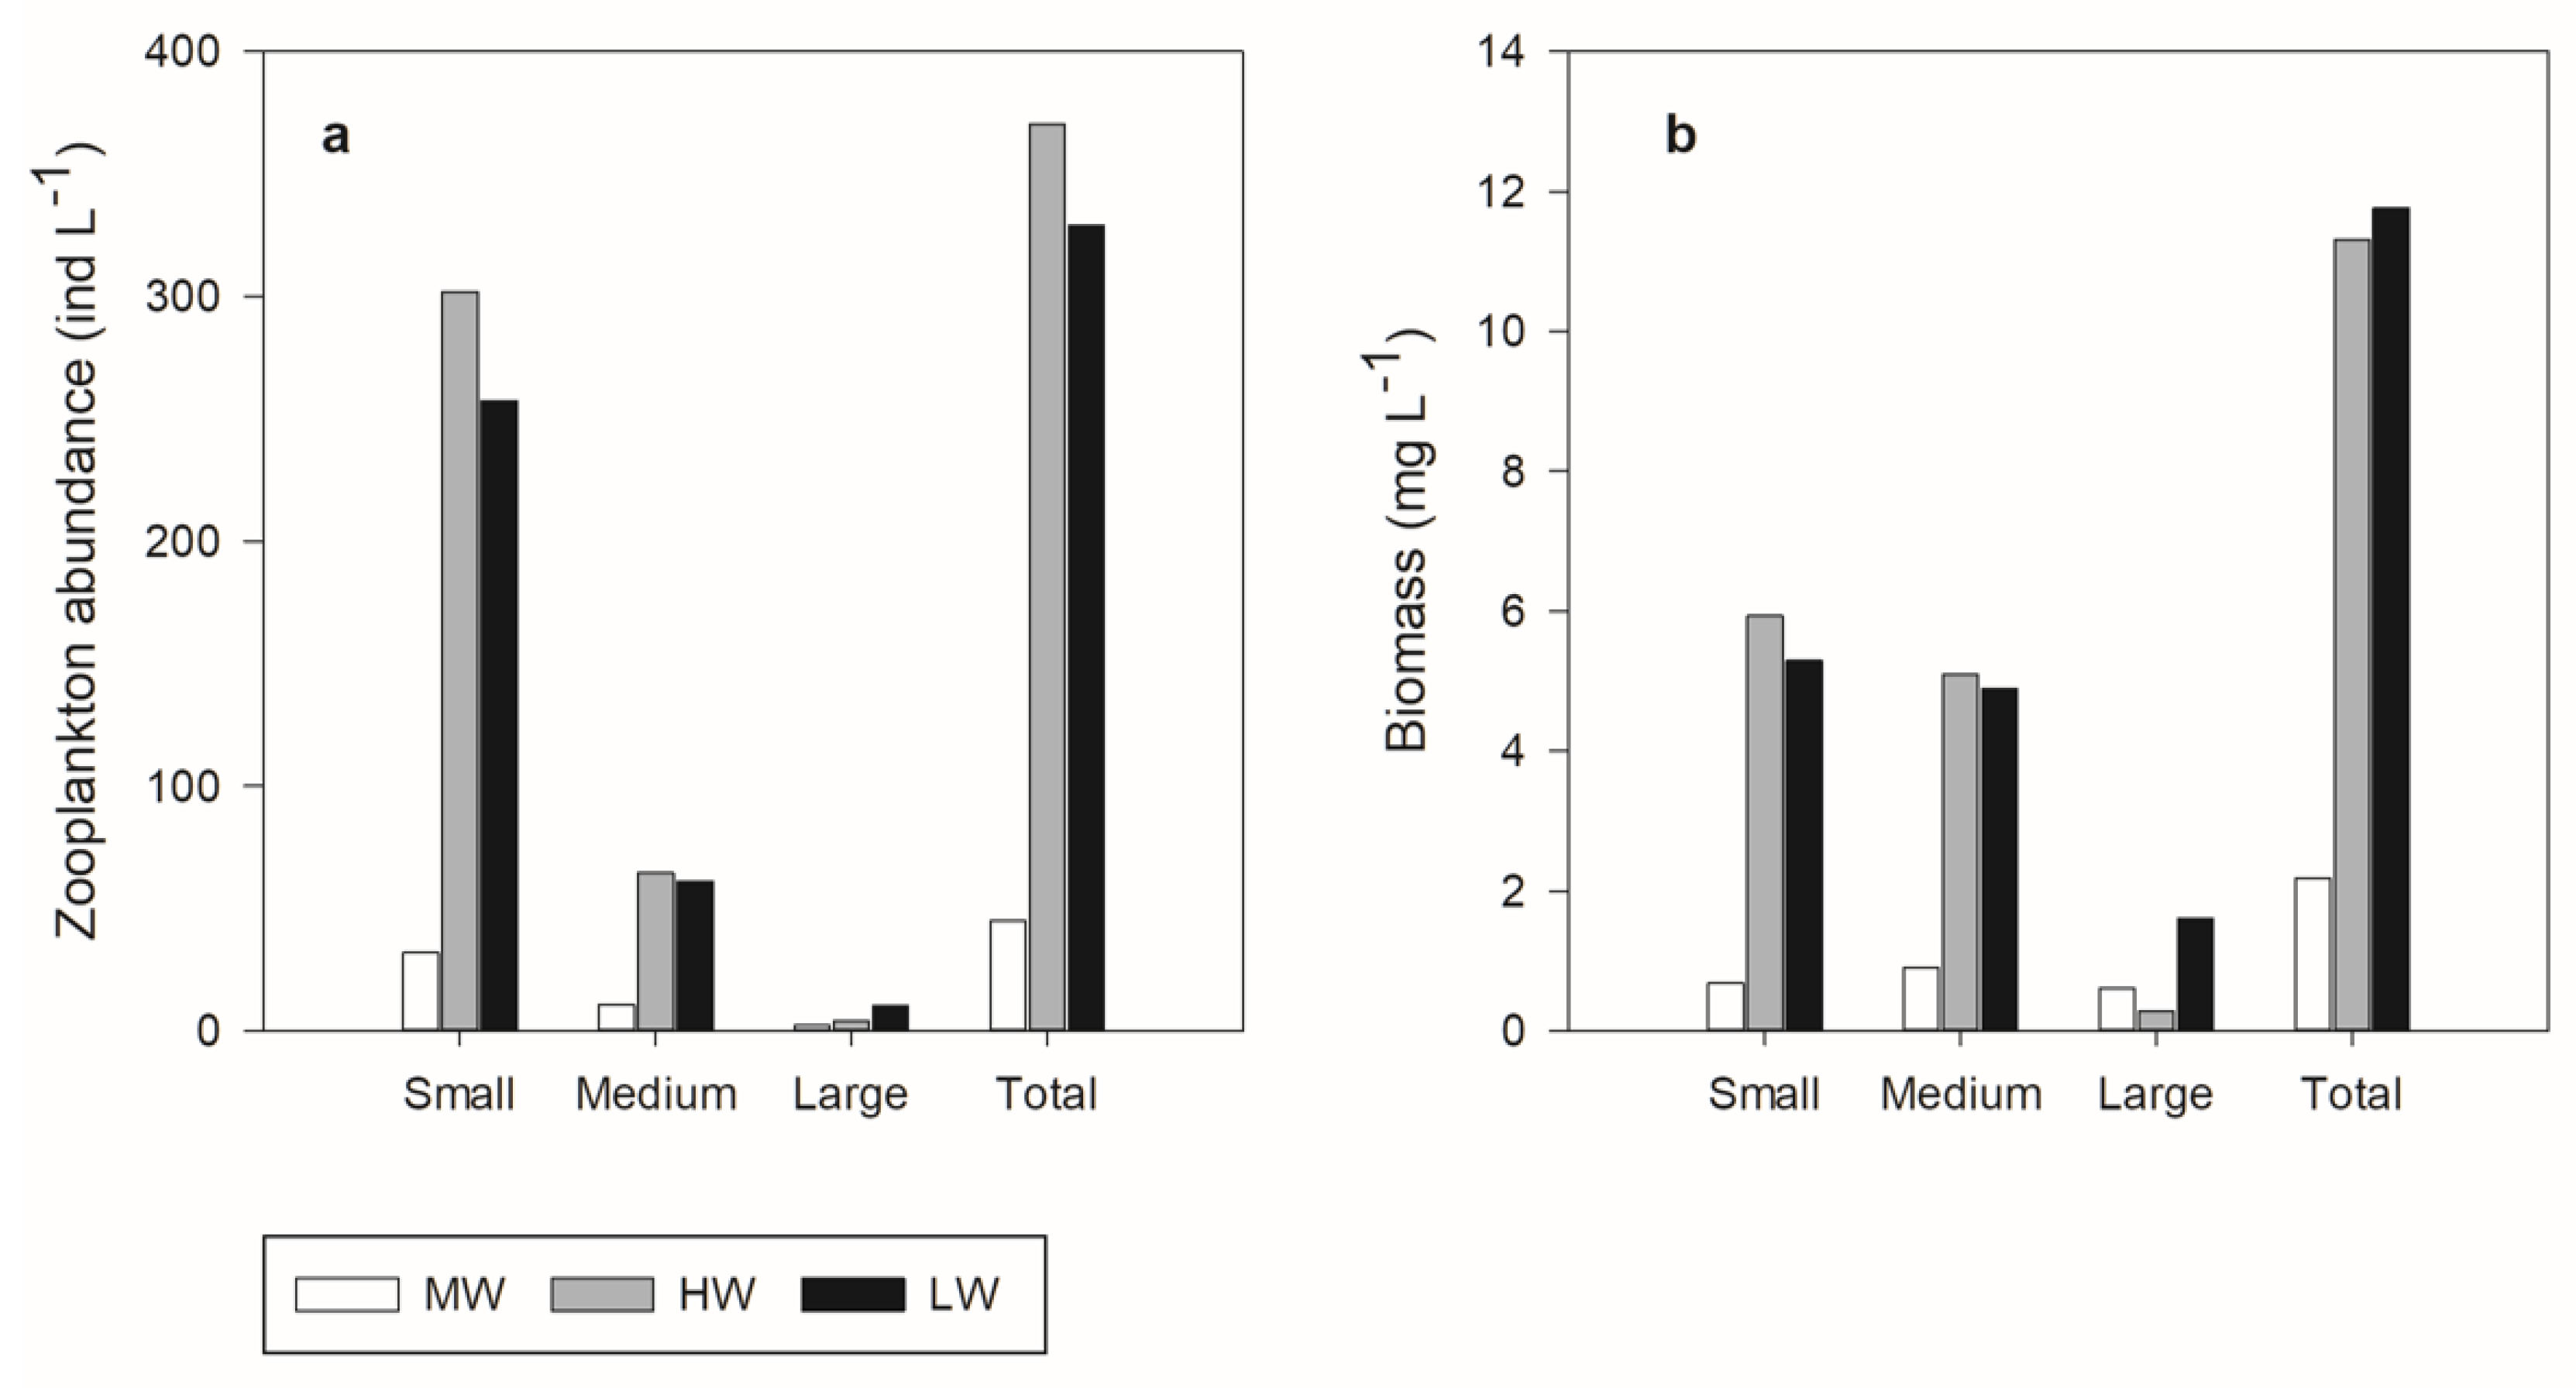
The zooplankton community in Lake Tempe was dominated by small-sized zooplankton (300–750 µm) across all sampling sites during all sampling periods. Zooplankton smaller than 750 µm were the main contributor to the total abundance and biomass across all sampling periods.
A summary of the zooplankton community size spectra, as indicated by the abundance, biomass, and normalised biomass size spectra (NBSS) parameters, is presented in Table 4 and Figure 4. The zooplankton mean total abundance ranged from 44 ind L−1 to 370 ind L−1. During the early flooding season, when the water level was moderate (MW), the lowest number of individual zooplankton was observed (44 ind L−1). As the water level increased in July (HW), the total abundance increased significantly to 370 ind L−1, before slightly decreasing to 328 ind L−1 as the water level receded following the dry season (LW). Similarly, the total biomass was lowest (2.18 mg L−1) during the initial flooding season (MW) and highest during both the HW and LW periods. The significant contribution of small-sized zooplankton towards the total biomass was reflected on the NBSS, with the mean NBSS slope ranging from −1.21 to −1.73.
3.4. Fish Assemblages
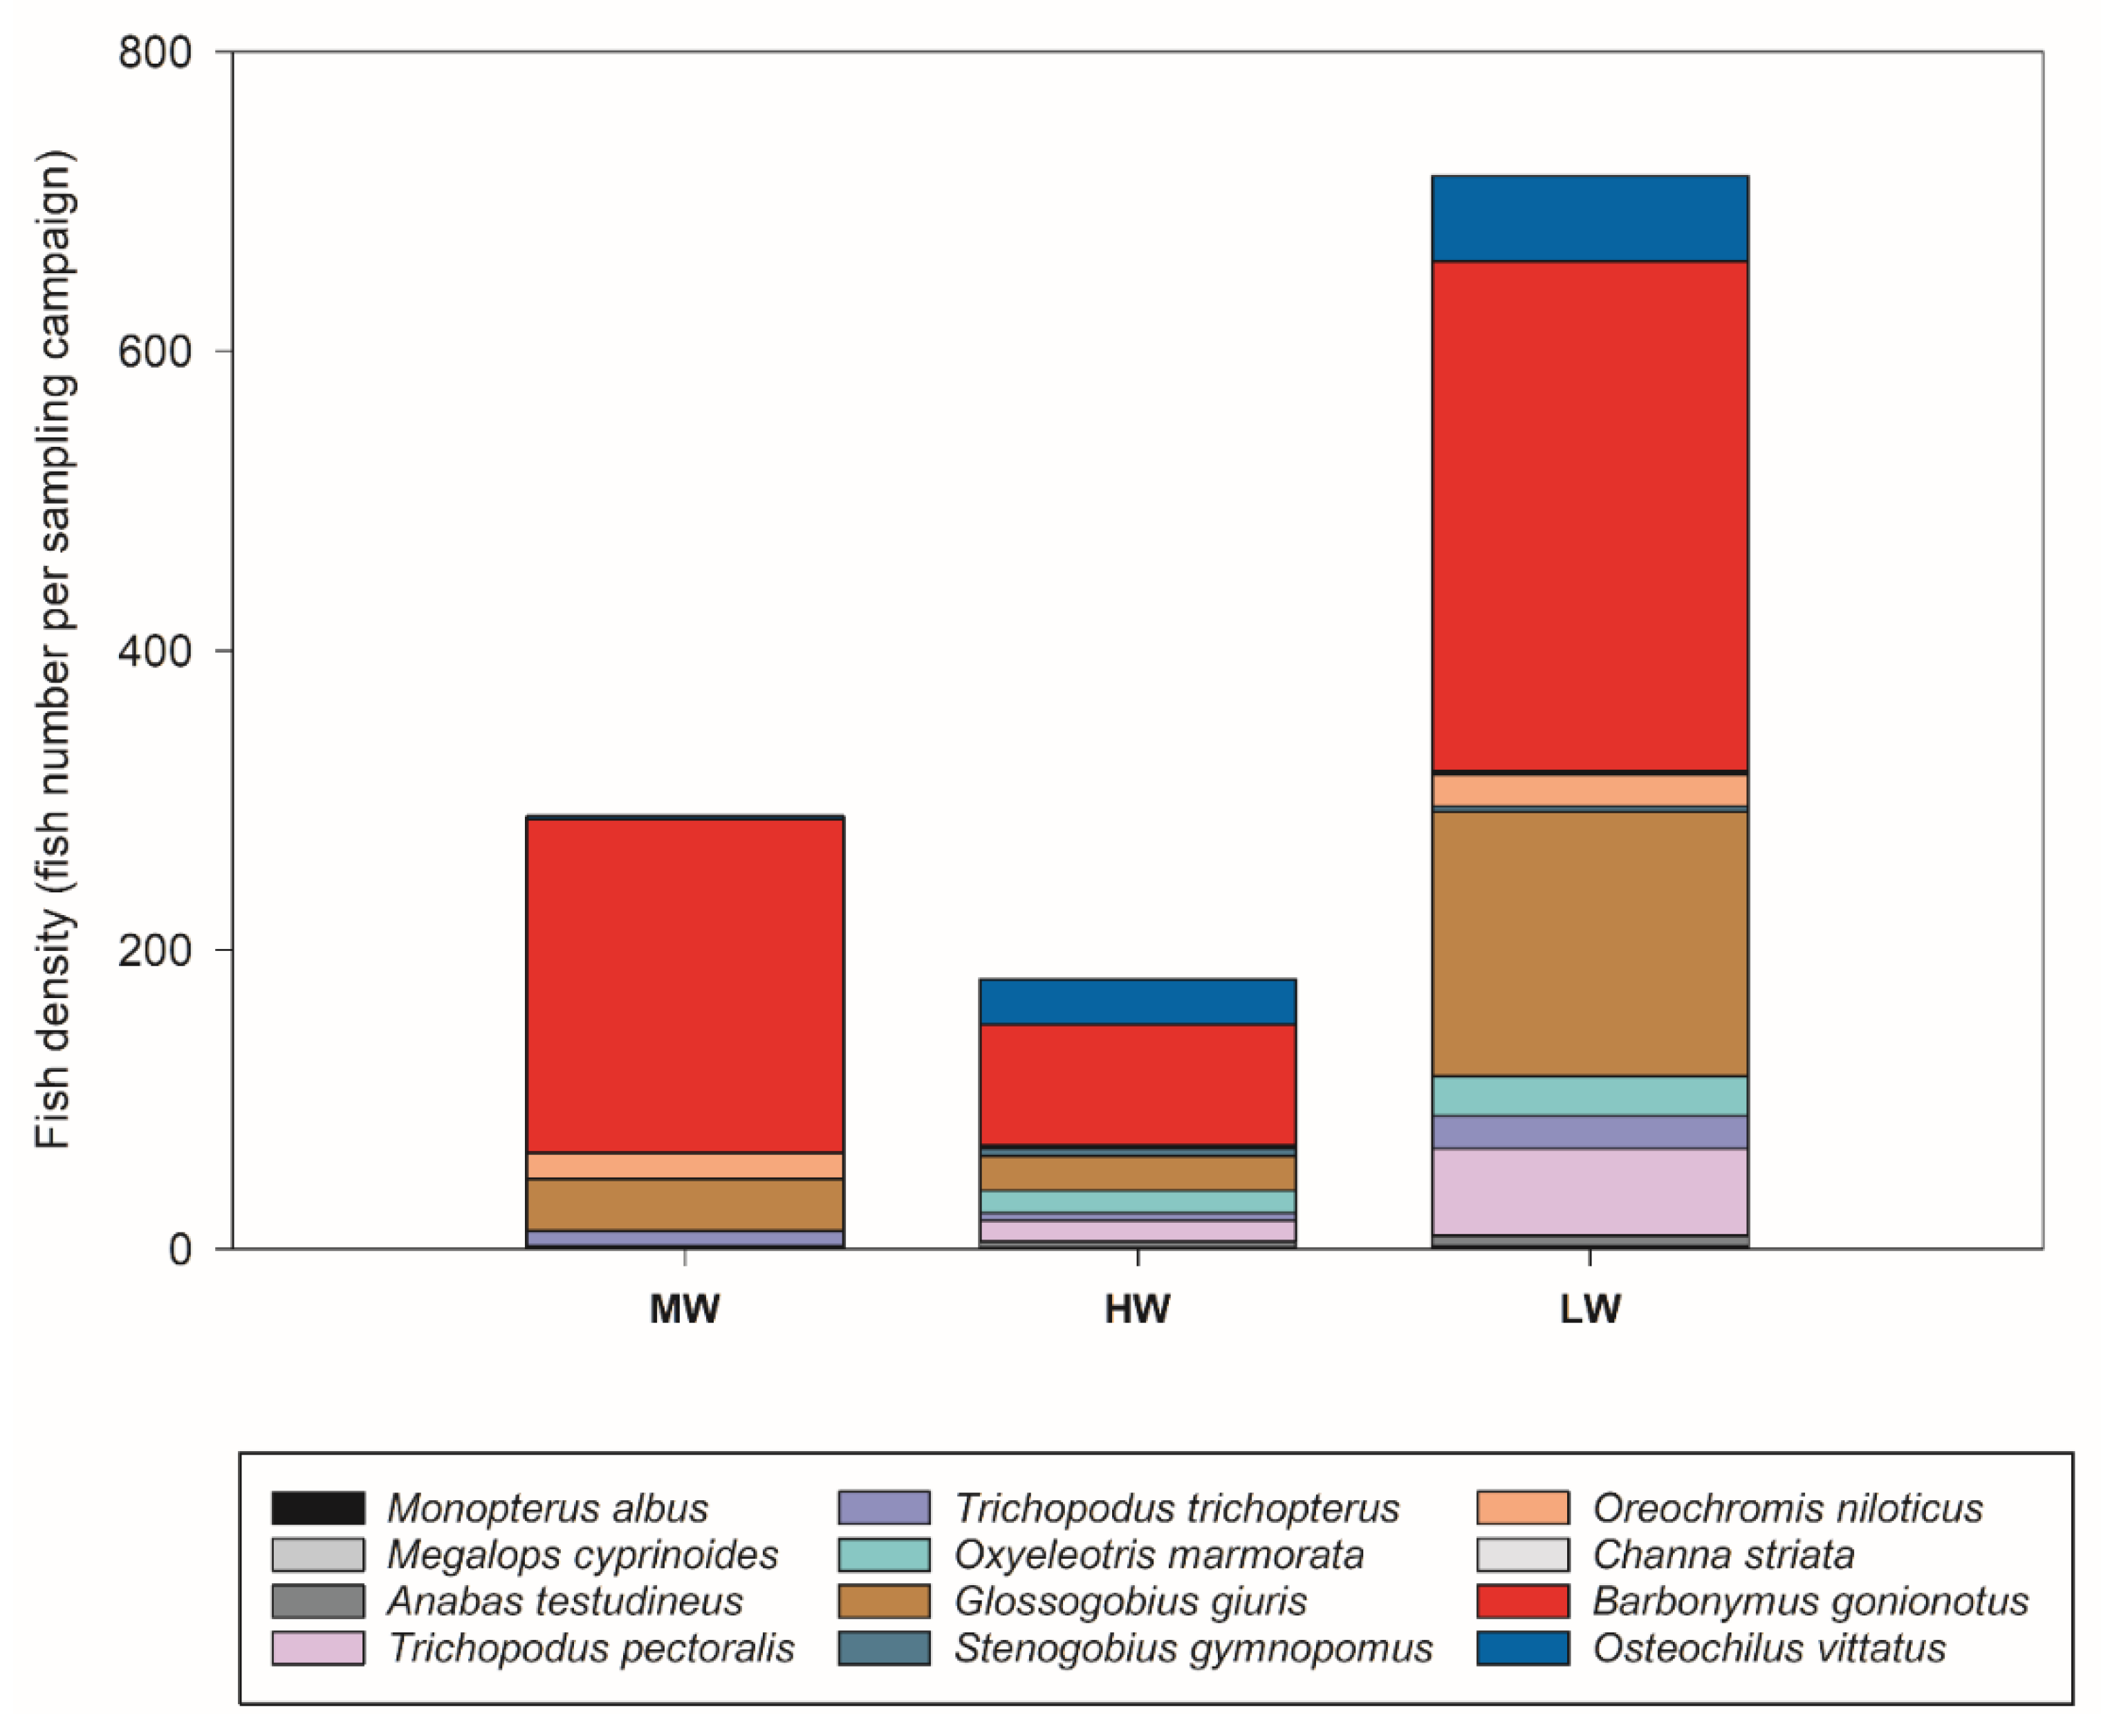
Twelve species of fish were recorded during the study period and are shown in Table 5. Amongst the twelve species, silver barb (Barbonymus gonionotus) was consistently the most abundant during all three hydrological periods in Lake Tempe (Figure 5). About 77% of the total fish catch was silver barb in MW, about 40% in HW, and 47% in LW. The total fish density (fish number per sampling effort) varied substantially across the three different hydrological periods. At the beginning of the flooding period in March (MW), the fish density was low at 256 individuals, before decreasing slightly to 180 fish when the lake became fully inundated and the water level was stable in July (HW), and then increasing significantly to 715 individuals as the water level receded in September (LW).
3.5. Correlation between Zooplankton Community, Fish Density, and Resource Availability
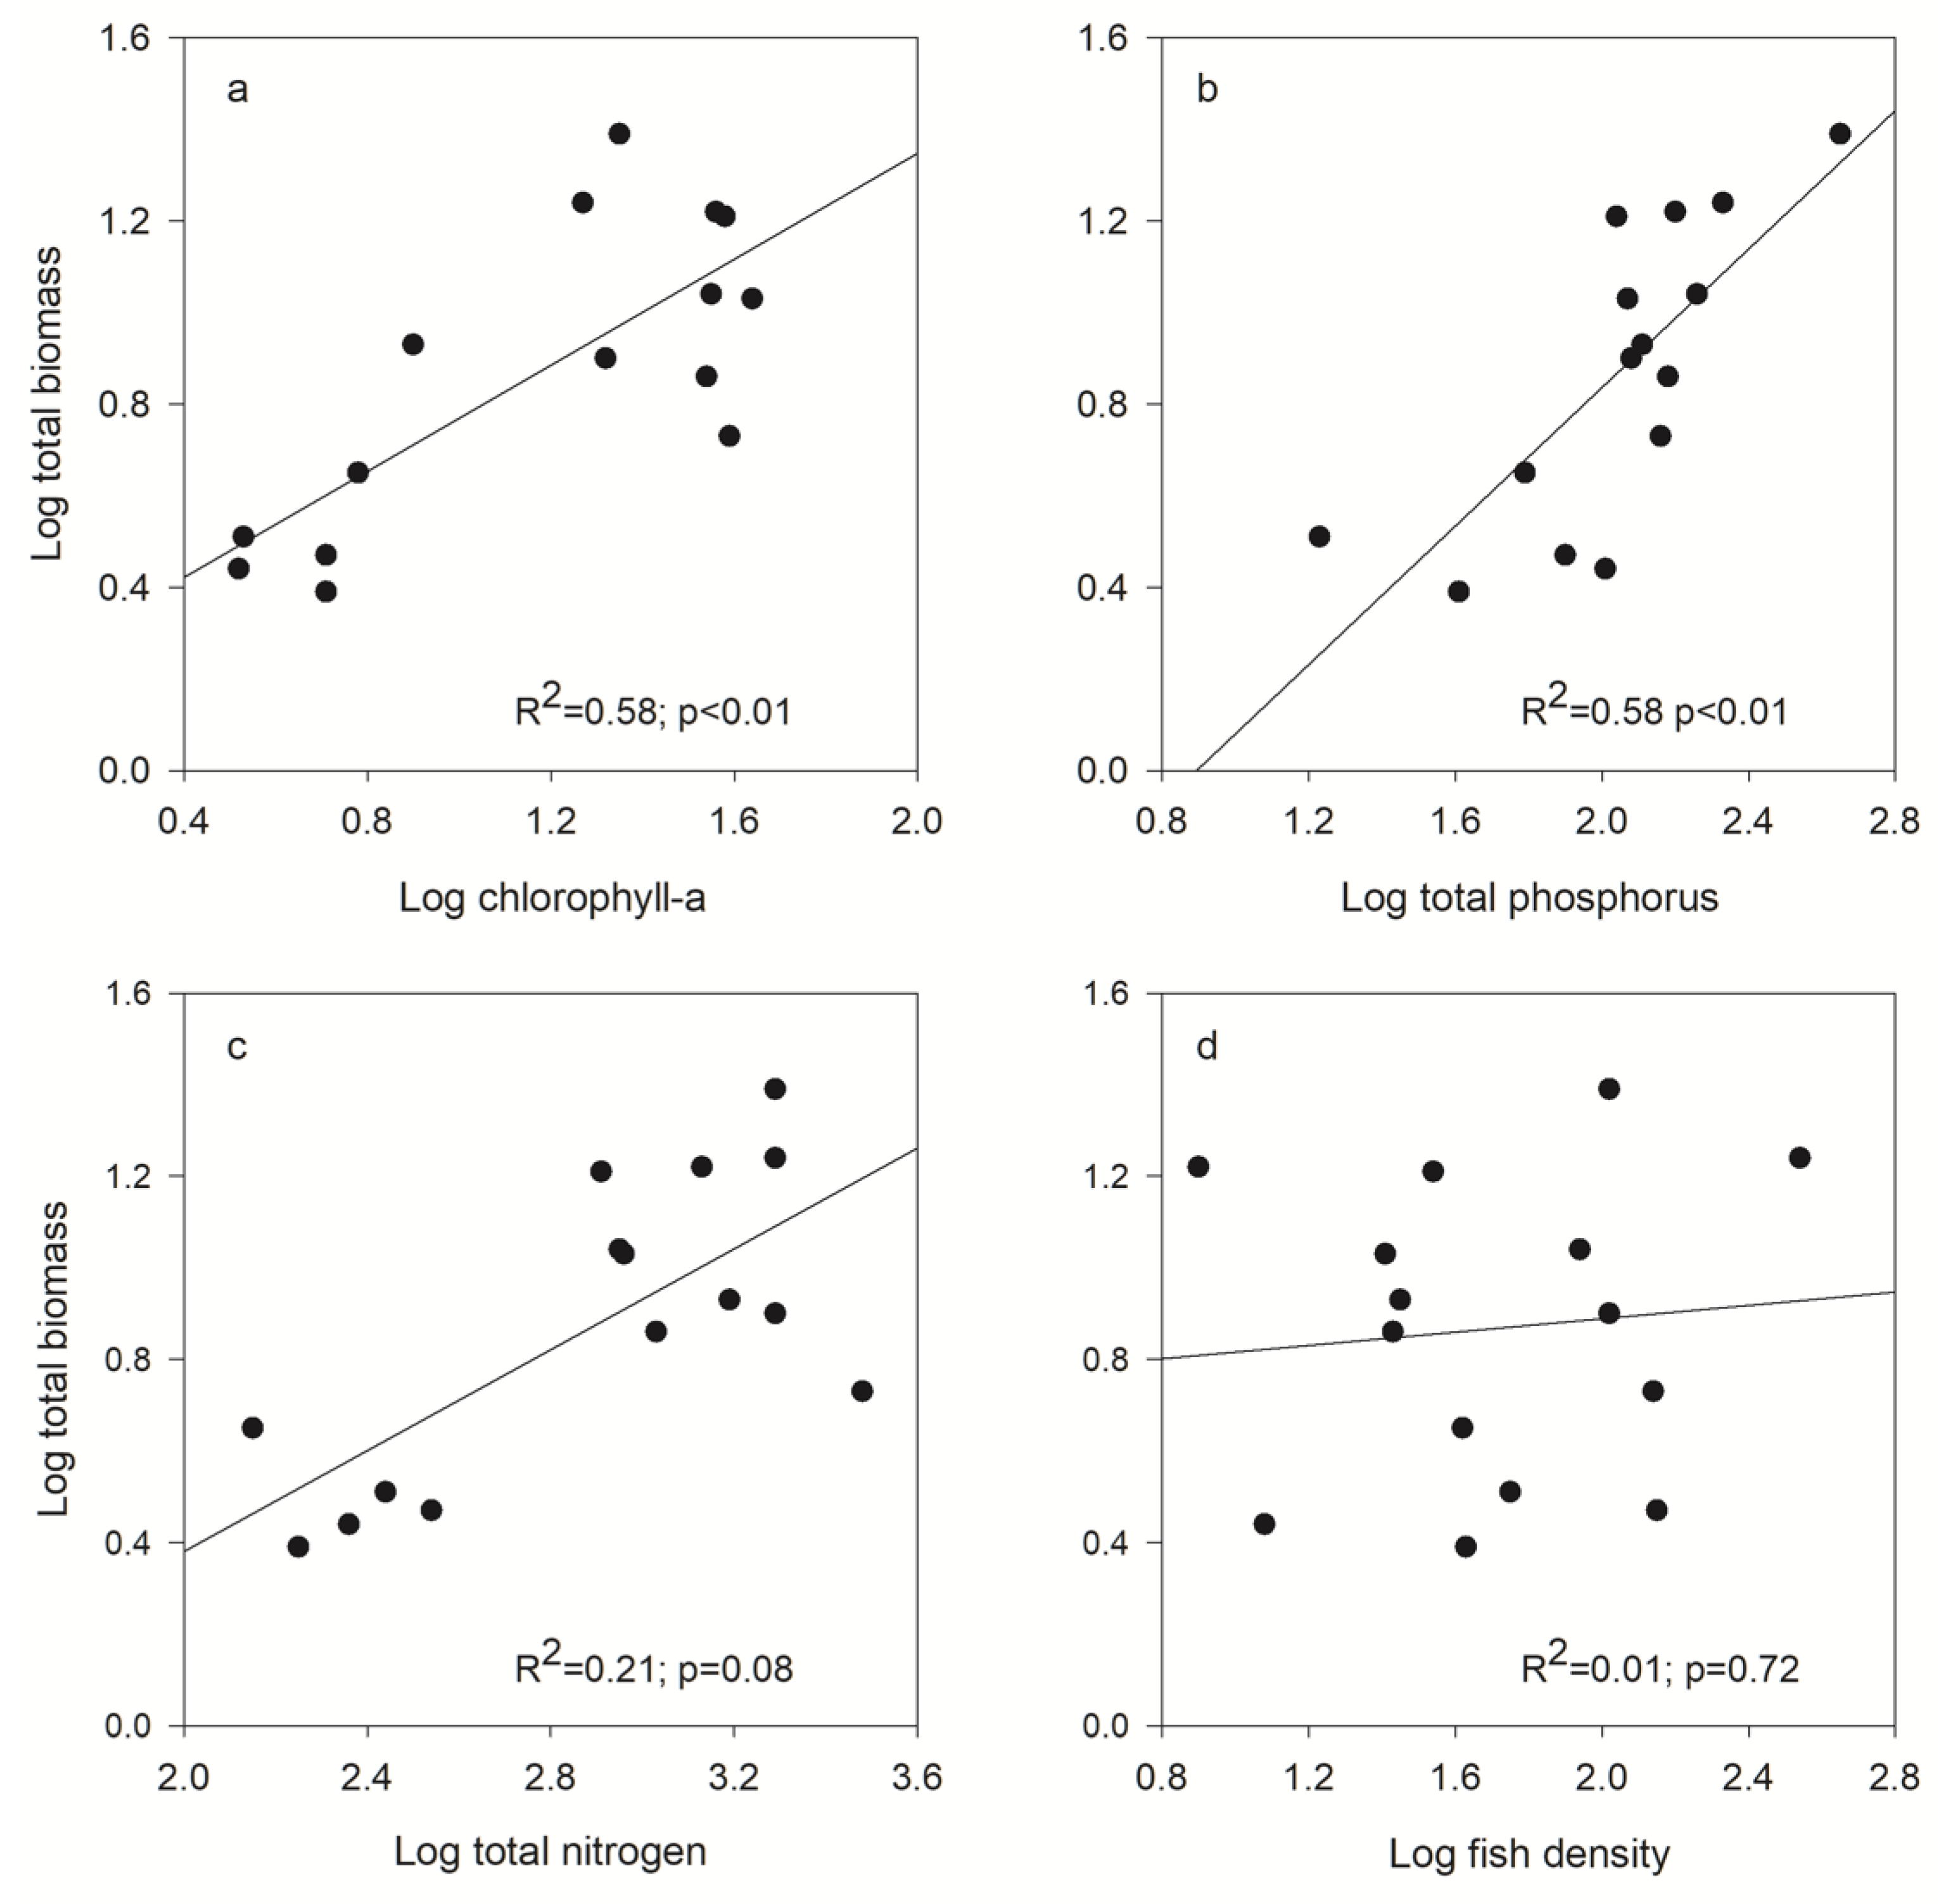
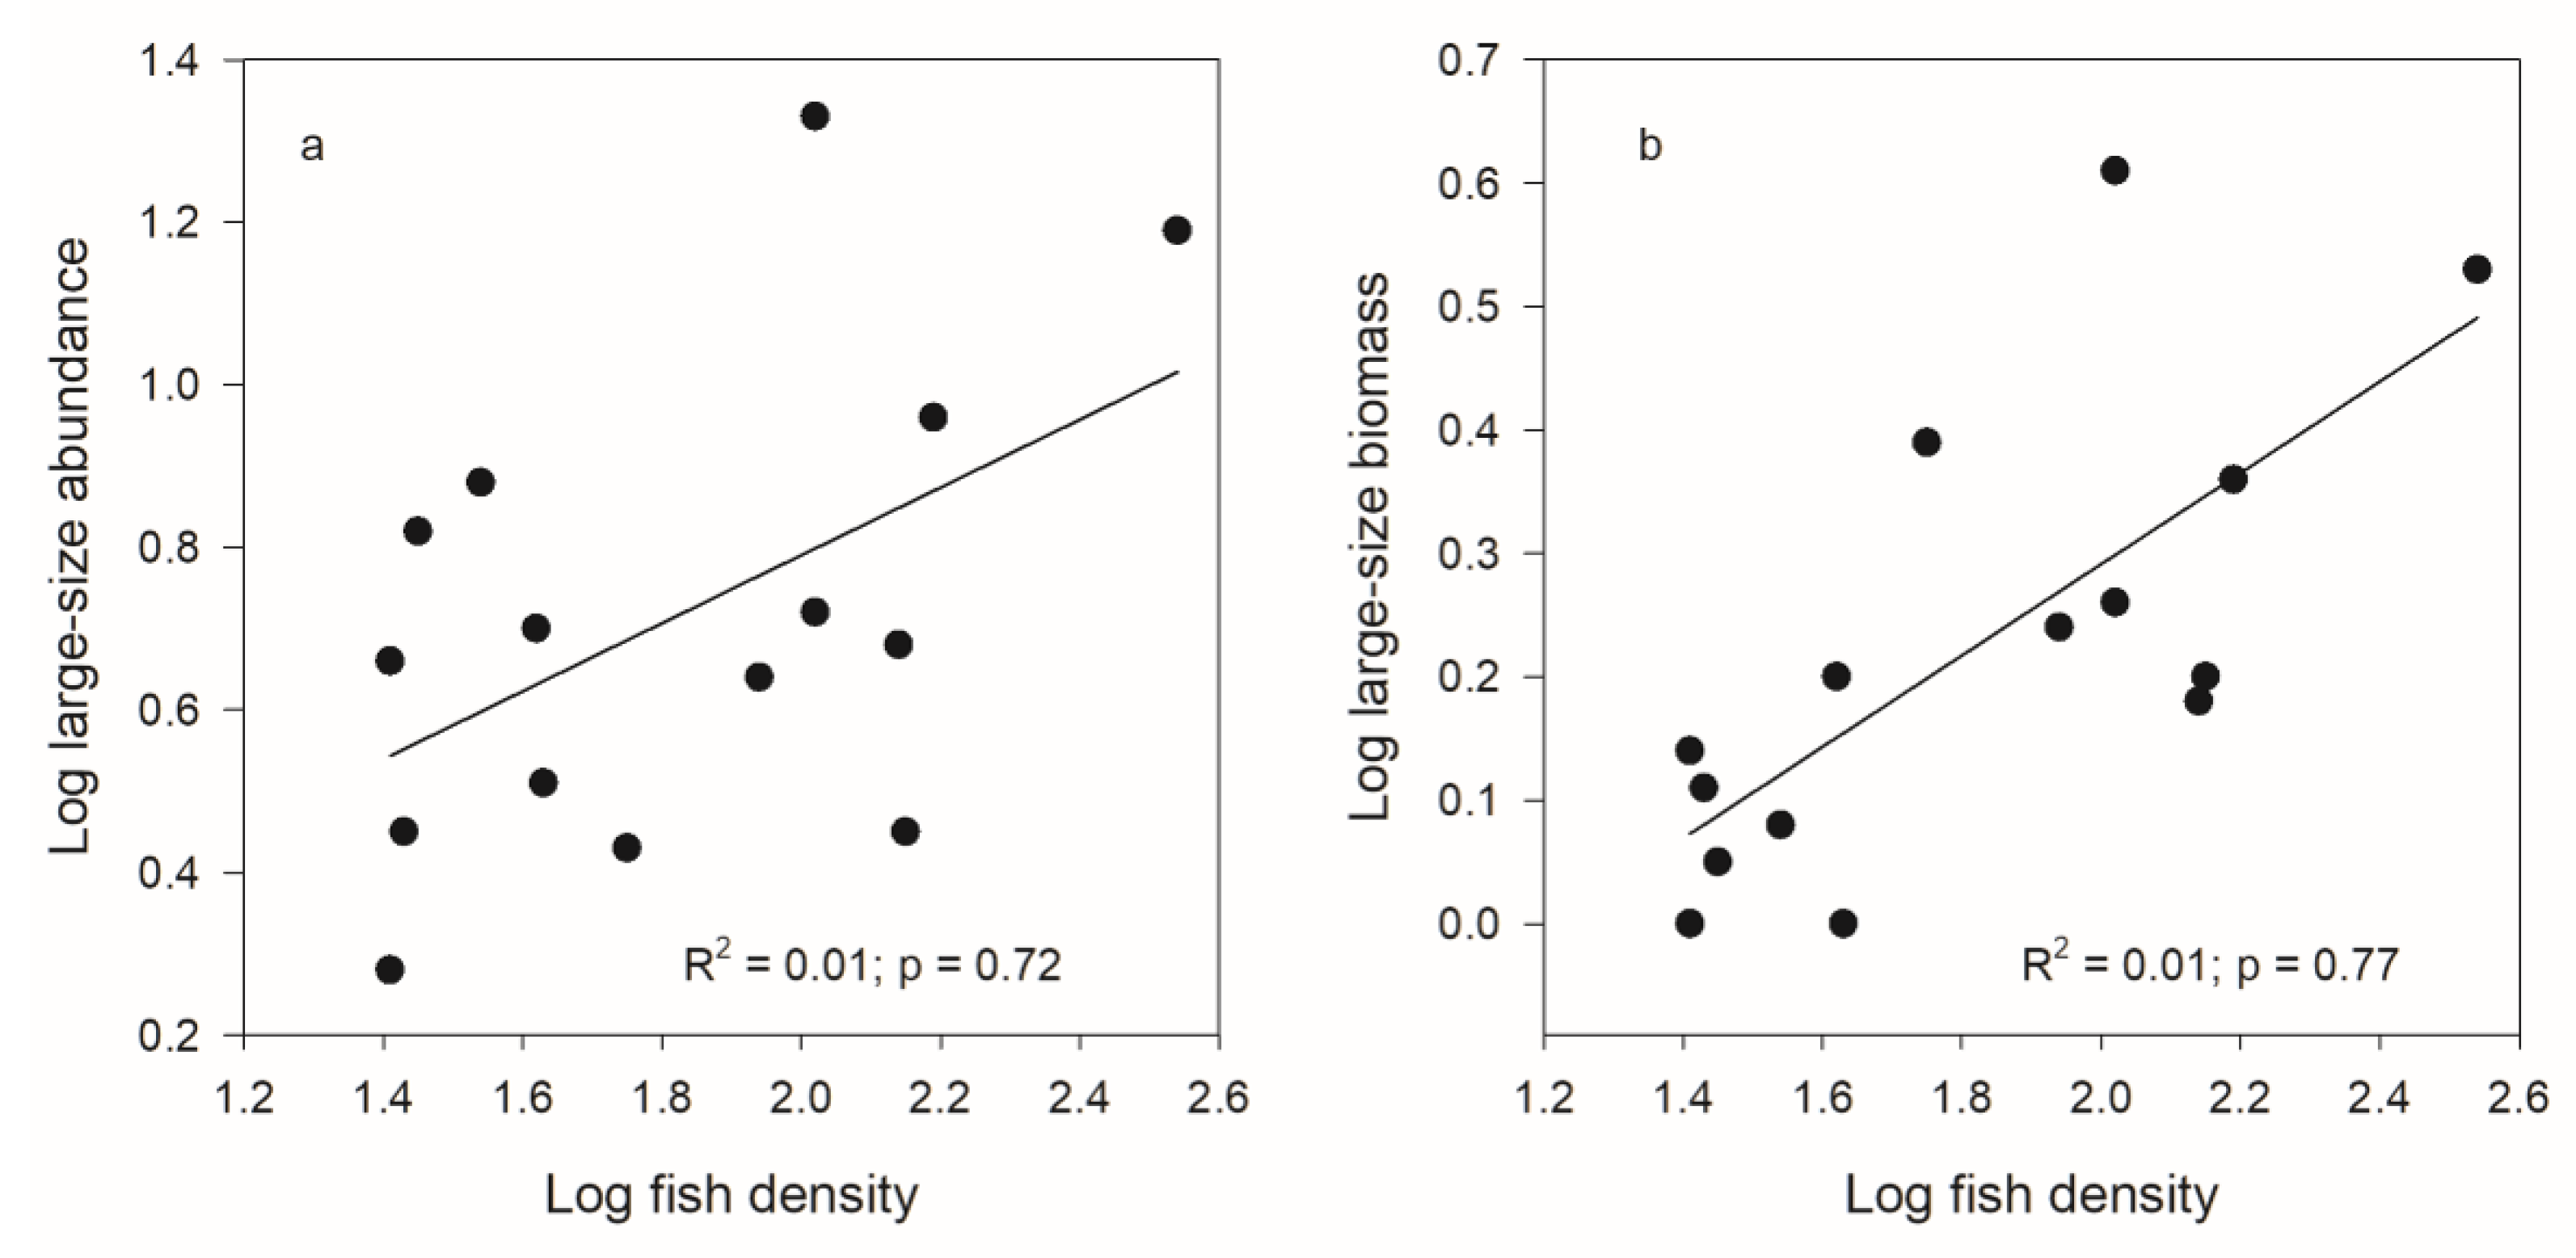
The size structure of the zooplankton community in terms of both total biomass and abundance showed a positive association with trophic indicators such as the chl-a concentration, TP, and TN (Figure 6 and Figure 7). There was also a significant correlation between the zooplankton individual size classes (small-, intermediate-, and large-sized) and the chl-a concentration, TP, and TN (Table 6). While there was no linear association between the total zooplankton abundance and biomass and fish density, the abundance and biomass of the large-sized zooplankton was correlated with the fish density (R2 = 0.51 for biomass, p < 0.01; R2 = 0.25 for abundance, p = 0.05) (Figure 8).
4. Discussion
4.1. Hydrological Regimes and Zooplankton Community
Lake Tempe is characterised by high fluctuations in the water levels depending on the annual rainfall and riverine inflow and outflow. According to the mean monthly rainfall, the monsoon rainy season usually occurs in November through to April, with the high-water periods occurring during May to August. Dry periods were observed in September to November, with the lowest water levels being recorded in September to October. During the dry period, most of the area of the lake was temporary dry, and the habitat within the lake was temporary fragmented. The dynamic changes in the water levels between the rainy and dry seasons in Lake Tempe are representative of its catchment and hydrological characteristics [43]. The water inflow into the lake comes from a 3288 km2 catchment area through three riverine systems, and there is only one outflow to the sea, with a relatively short length (69 km) and a low gradient, which slows the water flow out of the lake. This was particularly relevant to the long flooding periods in the lake during high-water periods.
Early in the flooding period, the water levels started to increase, thus reconnecting the temporarily dried and disconnected habitats and increasing habitat homogenisation across the lake. The flood pulse in the early flooding period also allows the exchange and distribution of particulate matter, nutrients, and aquatic fauna [3,7,44,45]. The flood pulse also causes a significant increase in the water volume in the lake, which allows for the dilution process and washes out free swimming aquatic biota, such as zooplankton [44,46]. Our results indicated that the dilution and washing-out phenomenon could be related to the low abundance and biomass of zooplankton during the early flooding period. Conversely, the hydrological connectivity between the river and the floodplain lake could provide food resources for the newly recruited zooplankton, which would in turn supply food for young fish [47]. In this study, we found that lake productivity, as indicated by the total chl-a concentration, increased alongside the zooplankton abundance and fish density during the post-flooding pulse period, when the water level had stabilised.
4.2. Environmental Variables Related to Temporal Variation in Zooplankton Community Size Structure
Temporal shifts in zooplankton community size structure are driven by changes in environmental variables, such as land use and water chemistry [48], temperature [49], and eutrophication [19,24]. Our study results indicated that trophic indicators, represented by the TP and chl-a concentration, had a strong effect on regulating the zooplankton abundance and biomass. According to the trophic index and efficiency determined by Pavluk and Bij de Vaate [50], Lake Tempe is considered highly eutrophic due to its high concentration of nutrients, such as TN and TP, and total chl-a (Table 2). The concentration of these trophic indicators was particularly high during the high-water period (post-flooding period), when the system was fully inundated. The concentrations of chl-a and TP both increased during the high-water periods and showed similar trends, indicating that the increase in lake productivity may be related to the local input as a result of macrophyte decomposition. Nutrient input to the lake system also derives from agricultural activities within the lake system, as the areas that are dry during the temporary dry periods are used for agriculture.
Other studies in shallow riverine floodplain lakes have reported that hydrological conditions and nutrient enrichment may have a strong influence on the species composition and size distribution of zooplankton [51,52,53]. Hydrological exchanges between riverine environments and the lateral floodplains usually regulate the nutrient input in these systems. Resource availability, as indicated by the nutrient availability, particularly that of phosphorus, determines phytoplankton biomass and thus zooplankton biomass [26,54,55]. An increase in the phosphorus and chl-a concentration during the post-flooding period in our study lake indicated that there was a significant addition of food resources into the system from both allochthonous and autochthonous sources, as flooding connected the temporary dry habitats and facilitated nutrient transport exchanges. These results coincided with the high abundance and biomass of zooplankton of all size classes (small, intermediate, and large).
4.3. Effect of Fish Predation on Zooplankton Size Structure
Several studies on the linkage between fish and zooplankton have shown that fish are the top-down regulators, shaping the evolution of freshwater zooplankton community structures [21,22,28]. Lakes without fish are usually dominated by large-sized crustaceans, such as Daphnia; however, when fish predation is intense, zooplankton populations are restricted to smaller size ranges, including cyclopoid copepods, rotifers, and small crustaceans (e.g., bosmids). Predation reduces the competitive effect between different size classes, promoting the development of populations of small-sized individuals and corroborating the effect of predation on the size-efficiency hypothesis [21,31,56]. The expected pattern of a small-sized zooplankton population was observed in our studied lake. Our study indicated that small-sized zooplankton were dominant in Lake Tempe, with those smaller than 500 µm being the main contributor towards the total abundance and total biomass. The extremely low proportion of zooplankton larger than 750 µm across the different hydrological periods and temporal changes in fish density suggest that a small-sized zooplankton population has developed in Lake Tempe. This result was also linearly correlated to a previous study on the Lake Tempe zooplankton community structure in 2013 [38], which reported that zooplankton such as rotifers, bosminidae, and chidoridae were the predominant groups in Lake Tempe, while large-size zooplankton, such as daphnids, were absent from the system.
In tropical systems, lake zooplankton communities are typically small, particularly due to high fish yields [4,29,37]. The high metabolic rate of young fish in the tropics demands more food, thus increasing the predation rate. On the other hand, the zooplankton/phytoplankton ratio is low, despite the relatively high productivity rate in tropical lakes. As such, the size and biomass of zooplankton is kept small due to continuous predation. Lake Tempe has historically demonstrated high fish productivity; in fact, it is one of the most productive lakes in terms of fish yield. Human interventions involving fish introduction have taken place since the 1990s, which have influenced the ecological structure of the aquatic biota in the lake, including the structure of the zooplankton community.
5. Conclusions
We investigated the zooplankton community size structure in a tropical riverine floodplain lake in relation to the hydrological regimes and the likely impact of high fish predation. Our study confirmed that the hydrological changes from low-water to moderate-water to high-water periods regulate the variability of abiotic and biotic factors in Lake Tempe. The flood pulse during the early flooding season significantly reduced both zooplankton abundance and biomass as well as the fish density in Lake Tempe. Both zooplankton and fish density were lowest during the early flooding period, when the water level was considered moderate, but when the floods had stabilised, the zooplankton total abundance and biomass increased significantly. Additionally, the zooplankton community in Lake Tempe was characterised by small-sized zooplankton with a mean body size smaller than 500 µm ESD, which was similar across all sampling periods. While the zooplankton total abundance and biomass increased with the increasing water level, the abundance of each size class also increased. Based on the environmental conditions, our study revealed that the zooplankton community size structure was strongly associated with trophic indicators, including TP, TN, and chl-a, suggesting that bottom-up factors (e.g., resource availability) have a significant influence on regulating the zooplankton community size structure in Lake Tempe. As with many other lakes in tropical regions, the fish predation in Lake Tempe was considered high. Although our study was unable to confirm a strong association between the zooplankton community size structure and fish density, we found that the abundance of large-sized zooplankton (750–2000 µm) was strongly correlated with increasing fish density. In temperate regions, long-term studies on the dynamic linkage between all biological properties in lake ecosystem are well documented; however, in the tropics, this complex interaction remains rarely studied, especially for lakes in Indonesia. The results of this study will be critical in the overall understanding of zooplankton community size structures in tropical lakes and represent a significant contribution towards floodplain lake management in Indonesia.
Author Contributions
R.L.T. and A.G. codesigned and developed the study plan for the field work as well as the laboratory investigation. R.L.T. conducted the field operation and collected and managed the data. R.D. collected field data and completed fish identification. A.G. provided supervision and guided the analyses. R.L.T. wrote the manuscript and L.X.C. and A.G. provided input and amendments in collaboration. All authors have read and agreed to the published version of the manuscript.
Funding
This research was funded by the Lake Tempe Research Project 2016-2017 of the Research Centre for Limnology, Indonesian Institute of Science (now known as the National Research and Innovation Agency), Republic of Indonesia. An Australian Research Council grant (DP0664751) provided funding for the purchase of the LOPC. Funding to R.L.T. was provided by the University of Western Australia and the Australian Government through the Australian Award Scholarship.
Data Availability Statement
Data are available from the authors on request.
Acknowledgments
From the Research Centre for Limnology, we would like to thank the project team: Rosidah, M.S. Syawal, Yustiawaty, T. Jasalesmana, Agus Waluyo, and Ira Akhdiana. Additionally, we would like to thank Yirui Lian for her assistance with R and Aldiano Rahmadya for his assistance with mapping. The authors also wish to thank Elke S. Reichwaldt for her contributions in the initial stages of the project.
Conflicts of Interest
The authors declare no conflict of interest.
References
- Vörösmarty, C.J.; McIntyre, P.B.; Gessner, M.O.; Dudgeon, D.; Prusevich, A.; Green, P.; Glidden, S.; Bunn, S.E.; Sullivan, C.A.; Liermann, C.R.; et al. Global threats to human water security and river biodiversity. Nature 2010, 467, 555–561. [Google Scholar] [CrossRef] [PubMed]
- Strayer, D.L.; Dudgeon, D. Freshwater biodiversity conservation: Recent progress and future challenges. J. N. Am. Benthol. Soc. 2010, 29, 344–358. [Google Scholar] [CrossRef]
- Junk, W.J.; Bayley, P.B.; Sparks, R.E. The flood pulse concept in River-Floodplain Systems. Can. Spec. Publ. Fish. Aquat. Sci. 1989, 106, 110–127. [Google Scholar]
- Golec-Fialek, C.; Lansac-Tôha, F.M.; Bonecker, C.C. Response of the zooplankton community to extreme hydrological variations in a temporary lake in a neotropical floodplain system. Limnologica 2021, 86, 125834. [Google Scholar] [CrossRef]
- Chaparro, G.; O’Farrell, I.; Hein, T. Multi-scale analysis of functional plankton diversity in floodplain wetlands: Effects of river regulation. Sci. Total Environ. 2019, 667, 338–347. [Google Scholar] [CrossRef]
- Tockner, K.; Pusch, M.; Borchardt, D.; Lorang, M.S. Multiple stressors in coupled river–floodplain ecosystems. Freshw. Biol. 2010, 55, 135–151. [Google Scholar] [CrossRef]
- Mayora, G.; Schneider, B.; Rossi, A. Turbidity and dissolved organic matter as significant predictors of spatio-temporal dynamics of phosphorus in a large river-floodplain system. River Res. Appl. 2018, 34, 629–639. [Google Scholar] [CrossRef]
- Dias, J.D.; Simões, N.R.; Meerhoff, M.; Lansac-Tôha, F.A.; Velho, L.F.M.; Bonecker, C.C. Hydrological dynamics drives zooplankton metacommunity structure in a Neotropical floodplain. Hydrobiologia 2016, 781, 109–125. [Google Scholar] [CrossRef]
- Schöll, K.; Kiss, A.; Dinka, M.; Berczik, Á. Flood-Pulse Effects on Zooplankton Assemblages in a River-Floodplain System (Gemenc Floodplain of the Danube, Hungary). Int. Rev. Hydrobiol. 2012, 97, 41–54. [Google Scholar] [CrossRef]
- Shiel, R.J.; Costelloe, J.F.; Reid, J.R.W.; Hudson, P.; Powling, J. Zooplankton diversity and assemblages in arid zone rivers of the Lake Eyre Basin, Australia. Mar. Freshw. Res. 2006, 57, 49–60. [Google Scholar] [CrossRef]
- Pinel-Alloul, B.; Patoine, A.; Marty, J. Multi-scale and multi-system perspectives of zooplankton structure and function in Canadian freshwaters. Can. J. Fish. Aquat. Sci. 2021, 78, 1543–1562. [Google Scholar] [CrossRef]
- Dodson, S.; Everhart, W.; Jandl, A.; Krauskopf, S. Effect of watershed land use and lake age on zooplankton species richness. Hydrobiologia 2007, 579, 393–399. [Google Scholar] [CrossRef]
- Jeppesen, E.; Lauridsen, T.; Mitchell, S.F.; Burns, C.W. Do planktivorous fish structure the zooplankton communities in New Zealand lakes? N. Zeal. J. Mar. Freshw. Res. 1997, 31, 163–173. [Google Scholar] [CrossRef]
- Molinari, B.; Stewart-Koster, B.; Adame, M.F.; Campbell, M.D.; McGregor, G.; Schulz, C.; Malthus, T.J.; Bunn, S. Relationships between algal primary productivity and environmental variables in tropical floodplain wetlands. Inland Waters 2021, 11, 180–190. [Google Scholar] [CrossRef]
- Zhao, C.; Liu, C.; Zhao, J.; Xia, J.; Yu, Q.; Eamus, D. Zooplankton in highly regulated rivers: Changing with water environment. Ecol. Eng. 2013, 58, 323–334. [Google Scholar] [CrossRef]
- Mohan Dey, M.; Rab, M.A.; Paraguas, F.J.; Bhatta, R.; Ferdous Alam, M.; Koeshendrajana, S.; Ahmed, M. Status and economics of freshwater aquaculture in selected countries of Asia. Aquac. Econ. Manag. 2005, 9, 11–37. [Google Scholar] [CrossRef]
- Cao, L.; Wang, W.; Yang, Y.; Yang, C.; Yuan, Z.; Xiong, S.; Diana, J. Environmental impact of aquaculture and countermeasures to aquaculture pollution in China. Environ. Sci. Pollut. Res. Int. 2007, 14, 452–462. [Google Scholar]
- Jeppesen, E.; Nõges, P.; Davidson, T.; Haberman, J.; Nõges, T.; Blank, K.; Lauridsen, T.; Søndergaard, M.; Sayer, C.; Laugaste, R.; et al. Zooplankton as indicators in lakes: A scientific-based plea for including zooplankton in the ecological quality assessment of lakes according to the European Water Framework Directive (WFD). Hydrobiologia 2011, 676, 279–297. [Google Scholar] [CrossRef]
- Van Egeren, S.; Dodson, S.; Torke, B.; Maxted, J. The relative significance of environmental and anthropogenic factors affecting zooplankton community structure in Southeast Wisconsin Till Plain lakes. Hydrobiologia 2011, 668, 137–146. [Google Scholar] [CrossRef]
- Lampert, W. Zooplankton research: The contribution of limnology to general ecological paradigms. Aquat. Ecol. 1997, 31, 19–27. [Google Scholar] [CrossRef]
- Jeppesen, E.; Søndergaard, M.; Jensen, J.P.; Mortensen, E.; Sortkjær, O. Fish-induced changes in zooplankton grazing on phytoplankton and bacterioplankton: A long-term study in shallow hypertrophic Lake Søbygaard. J. Plankton Res. 1996, 18, 1605–1625. [Google Scholar] [CrossRef]
- Bertolo, A. Predation on Zooplankton. In Encyclopedia of Inland Waters, 2nd ed.; Mehner, T., Tockner, K., Eds.; Elsevier: Oxford, UK, 2022; pp. 196–206. [Google Scholar]
- Brooks, J.L.; Dodson, S.I. Predation, Body Size, and Composition of Plankton. Science 1965, 150, 28–35. [Google Scholar] [CrossRef] [PubMed]
- Ghadouani, A.; Pinel-Alloul, B.; Prepas, E.E. Could increased cyanobacterial biomass following forest harvesting cause a reduction in zooplankton body size structure? Can. J. Fish. Aquat. Sci. 2006, 63, 2308–2317. [Google Scholar] [CrossRef]
- Finlay, B.J.; Esteban, G.F. Body size and biogegraphy. In Body Size: The Structure and Function of Aquatic Ecosystems; Hildrew, A.G., Raffaelli, D.G., Edmonds-Brow, R., Eds.; Cambridge University Press: Cambridge, UK, 2007; pp. 167–185. [Google Scholar]
- Wu, B.; Dai, S.; Wen, X.; Qian, C.; Luo, F.; Xu, J.; Wang, X.; Li, Y.; Xi, Y. Chlorophyll-nutrient relationship changes with lake type, season and small-bodied zooplankton in a set of subtropical shallow lakes. Ecol. Indic. 2022, 135, 108571. [Google Scholar] [CrossRef]
- Dodson, S.I. Zooplankton Competition and Predation: An Experimental Test of the Size-Efficiency Hypothesis. Ecology 1974, 55, 605–613. [Google Scholar] [CrossRef]
- Ersoy, Z.; Jeppesen, E.; Sgarzi, S.; Arranz, I.; Cañedo-Argüelles, M.; Quintana, X.D.; Landkildehus, F.; Lauridsen, T.L.; Bartrons, M.; Brucet, S. Size-based interactions and trophic transfer efficiency are modified by fish predation and cyanobacteria blooms in Lake Mývatn, Iceland. Freshw. Biol. 2017, 62, 1942–1952. [Google Scholar]
- Bonecker, C.C.; Azevedo, F.d.; Simões, N.R. Zooplankton body-size structure and biomass in tropical floodplain lakes: Relationship with planktivorous fishes. Acta Limnol. Bras. 2011, 23, 217–228. [Google Scholar] [CrossRef]
- Zhang, J.; Xie, P.; Tao, M.; Guo, L.; Chen, J.; Li, L.; Zhang, X.; Zhang, L. The Impact of Fish Predation and Cyanobacteria on Zooplankton Size Structure in 96 Subtropical Lakes. PLoS ONE 2013, 8, e76378. [Google Scholar] [CrossRef]
- Liu, X.; Dur, G.; Ban, S.; Sakai, Y.; Ohmae, S.; Morita, T. Planktivorous fish predation masks anthropogenic disturbances on decadal trends in zooplankton biomass and body size structure in Lake Biwa, Japan. Limnol. Oceanogr. 2020, 65, 667–682. [Google Scholar] [CrossRef]
- Litchman, E.; Ohman, M.D.; Kiørboe, T. Trait-based approaches to zooplankton communities. J. Plankton Res. 2013, 35, 473–484. [Google Scholar] [CrossRef]
- Peters, R.H. The Ecological Implication of Body Size, 1st ed.; Cambridge University Press: Cambridge, UK, 1983. [Google Scholar]
- Finlay, K.; Beisner, B.E.; Patoine, A.; Pinel-Alloul, B. Regional ecosystem variability drives the relative importance of bottom-up and top-down factors for zooplankton size spectra. Can. J. Fish. Aquat. Sci. 2007, 64, 516–529. [Google Scholar] [CrossRef]
- Sato, K.; Matsuno, K.; Arima, D.; Abe, Y.; Yamaguchi, A. Spatial and temporal changes in zooplankton abundance, biovolume, and size spectra in the neighboring waters of Japan: Analyses using an optical plankton counter. Zool. Stud. 2015, 54, 18. [Google Scholar] [CrossRef] [PubMed]
- Braun, L.-M.; Brucet, S.; Mehner, T. Top-down and bottom-up effects on zooplankton size distribution in a deep stratified lake. Aquat. Ecol. 2021, 55, 527–543. [Google Scholar] [CrossRef]
- Fernando, C.H. Zooplankton, fish and fisheries in tropical freshwaters. Hydrobiologia 1994, 272, 105–123. [Google Scholar] [CrossRef]
- Toruan, R.L.; Setiawan, F. Hydrological Regimes and Zooplankton Ecology at Tempe Floodplains, Indonesia: Preliminary Study Before the Operation of the Downstream Barrage. In Trends in Asian Water Environmental Science and Technology; Kurisu, F., Ramanathan, A.L., Kazmi, A.A., Kumar, M., Eds.; Springer International Publishing: Cham, Switzerland, 2017; pp. 117–125. [Google Scholar]
- Sukmayanti. Evaluasi perikanan tangkap dan prospek pengembangannya di Danau Tempe. In Research Report; Faculty of Fishery, Universitas Cokroaminoto: Makassar, Indonesia, 2007. [Google Scholar]
- Ramadhan, A.; Triyanti, R.; Koeshendrajana, S. Karakteristik dan nilai ekonomi sumberdaya perikanan komplek Danau Tempe. J. Kebijak. Dan Ris. Soc. Ekon. Kelaut. Perikan. 2008, 3, 89–102. [Google Scholar]
- Jasalesmana, T.; Nomosatryo, S.; Harsono, E.; Dina, R.; Ali, F. Keterkaitan Parameter Fisika, Kimia dan Biologi di Danau Tempe, Sulawesi Selatan. In Proceedings of the Seminar Nasional Limnologi VII, Bogor, Indonesia, 16 September 2014; Subehi, L., Haryani, G.S., Henny, C., Wibowo, H., Eds.; Pusat Penelitian Limnologi LIPI: Bogor, Indonesia, 2014. [Google Scholar]
- American Public Health Association (APHA). Standard Methods for the Examination of Water and Wastewater, 22nd ed.; American Public Health Association: Washington, DC, USA, 2013. [Google Scholar]
- Setiawan, F.; Wibowo, H. Karakteristik Danau Tempe Sebagai Danau Paparan Banjir. In Proceedings of the Pertemuan Ilmiah Masyarakat Limnologi, Cibinong, Indonesia, 3 December 2013; Chrismadha, T., Sulawesty, F., Fakhrudin, M., Nofdianto, Said, D.S., Eds.; Pusat Penelitian Limnologi: Cibinong, Indonesia, 2013. [Google Scholar]
- Catlin, A.K.; Collier, K.J.; Duggan, I.C. Zooplankton generation following inundation of floodplain soils: Effects of vegetation type and riverine connectivity. Mar. Freshw. Res. 2017, 68, 76–86. [Google Scholar] [CrossRef]
- Tockner, K.; Malard, F.; Ward, J.V. An extension of the flood pulse concept. Hydrol. Process. 2000, 14, 2861–2883. [Google Scholar] [CrossRef]
- Górski, K.; Collier, K.J.; Duggan, I.C.; Taylor, C.M.; Hamilton, D.P. Connectivity and complexity of floodplain habitats govern zooplankton dynamics in a large temperate river system. Freshw. Biol. 2013, 58, 1458–1470. [Google Scholar] [CrossRef]
- Ning, N.P.; Gawne, B.; Cook, R.; Nielsen, D. Zooplankton dynamics in response to the transition from drought to flooding in four Murray–Darling Basin rivers affected by differing levels of flow regulation. Hydrobiologia 2013, 702, 45–62. [Google Scholar] [CrossRef]
- Dodson, S.I.; Lillie, R.A.; Will-Wolf, S. Land Use, Water Chemistry, Aquatic Vegetation, and Zooplankton Community Structure of Shallow Lakes. Ecol. Appl. 2005, 15, 1191–1198. [Google Scholar] [CrossRef]
- Evans, L.E.; Hirst, A.G.; Kratina, P.; Beaugrand, G. Temperature-mediated changes in zooplankton body size: Large scale temporal and spatial analysis. Ecography 2020, 43, 581–590. [Google Scholar] [CrossRef]
- Pavluk, T.; Bij de Vaate, A. Trophic Index and Efficiency. In Encyclopedia of Ecology, 2nd ed.; Fath, B., Ed.; Elsevier: Amsterdam, The Netherlands, 2013; pp. 495–502. [Google Scholar]
- Badosa, A.; Boix, D.; Brucet, S.; López-Flores, R.; Gascón, S.; Quintana, X.D. Zooplankton taxonomic and size diversity in Mediterranean coastal lagoons (NE Iberian Peninsula): Influence of hydrology, nutrient composition, food resource availability and predation. Estuar. Coast. Shelf Sci. 2007, 71, 335–346. [Google Scholar] [CrossRef]
- Napiórkowski, P.; Bąkowska, M.; Mrozińska, N.; Szymańska, M.; Kolarova, N.; Obolewski, K. The Effect of Hydrological Connectivity on the Zooplankton Structure in Floodplain Lakes of a Regulated Large River (the Lower Vistula, Poland). Water 2019, 11, 1924. [Google Scholar] [CrossRef]
- Li, H.; Gu, Y.; Cai, Q.; Dong, X.; Ye, L. Zooplankton Size Structure in Relation to Environmental Factors in the Xiangxi Bay of Three Gorges Reservoir, China. Front. Ecol. Evol. 2022, 10. [Google Scholar] [CrossRef]
- Carpenter, S.R.; Kitchell, J.F.; Hodgson, J.R. Cascading Trophic Interactions and Lake Productivity. BioScience 1985, 35, 634–639. [Google Scholar] [CrossRef]
- Schindler, D.W. Evolution of Phosphorus Limitation in Lakes. Science 1977, 195, 260–262. [Google Scholar] [CrossRef]
- Collins, S.F.; Wahl, D.H. Size-specific effects of bighead carp predation across the zooplankton size spectra. Freshw. Biol. 2018, 63, 700–708. [Google Scholar] [CrossRef]
Figure 1.
Study area of (a) Lake Tempe and (b) sampling points in the Tempe floodplain system, where numbers indicate the sampling zones.
Figure 1.
Study area of (a) Lake Tempe and (b) sampling points in the Tempe floodplain system, where numbers indicate the sampling zones.

Figure 2.
Monthly variability of the hydrological characteristics of Lake Tempe. (a) Rainfall and mean monthly water level based on a 10-year average from 2000 to 2010; (b) mean and Secchi depth of the water during the study period from March to December 2016. The three hydrological periods in the lake are moderate-water (MW), high-water (HW), and low-water (LW).

Figure 3.
Principal component analysis (PCA) biplot of the biotic and abiotic characteristics of Lake Tempe in different hydrological periods: during the initial flooding period, when the water level was considered moderate (MW); during the post-flooding period, when the water level was maximum (HW); and during the dry period, when the water level was low (LW).

Figure 4.
(a) Zooplankton mean total abundance and mean abundance of each size class and (b) mean total biomass and mean biomass of each size class during the three different hydrological periods: moderate- (MW), high- (HW), and low-water (LW).
Figure 4.
(a) Zooplankton mean total abundance and mean abundance of each size class and (b) mean total biomass and mean biomass of each size class during the three different hydrological periods: moderate- (MW), high- (HW), and low-water (LW).

Figure 5.
Fish density and species composition across three different hydrological periods: during the initial flooding season, when the water level was considered moderate (MW); during the flooding season, when the water level was maximum (HW); and during the dry season, when the water level was at its lowest (LW).

Figure 6.
Association of the zooplankton total abundance with (a) chlorophyll-a, (b) total phosphorus, (c) total nitrogen, and (d) fish density. All data were log (x + 1) transformed prior to analysis.
Figure 6.
Association of the zooplankton total abundance with (a) chlorophyll-a, (b) total phosphorus, (c) total nitrogen, and (d) fish density. All data were log (x + 1) transformed prior to analysis.

Figure 7.
Association of the zooplankton total biomass with (a) chlorophyll-a, (b) total phosphorus, (c) total nitrogen, and (d) fish density. All data were log (x + 1) transformed prior to analysis.
Figure 7.
Association of the zooplankton total biomass with (a) chlorophyll-a, (b) total phosphorus, (c) total nitrogen, and (d) fish density. All data were log (x + 1) transformed prior to analysis.

Figure 8.
Association of (a) abundance and (b) biomass of large-sized zooplankton with fish density. All data were log (x + 1) transformed prior to analysis.
Figure 8.
Association of (a) abundance and (b) biomass of large-sized zooplankton with fish density. All data were log (x + 1) transformed prior to analysis.


Table 1.
Descriptions of each sampling location in Lake Tempe. Note: Bungka toddo is a local fishing technique using emerged aquatic macrophyte colonies as fish attractors; when water levels start to recede, bamboo fences are installed around the macrophyte colonies to trap fish.
Table 1.
Descriptions of each sampling location in Lake Tempe. Note: Bungka toddo is a local fishing technique using emerged aquatic macrophyte colonies as fish attractors; when water levels start to recede, bamboo fences are installed around the macrophyte colonies to trap fish.
| Zone | Description |
|---|---|
| Zone 1 (T1) |
|
| Zone 2 (T2) |
|
| Zone 3 (T3) |
|
| Zone 4 (T4) |
|
| Zone 5 (T5) |
|
Table 2.
Limnological characteristics of Lake Tempe in different hydrological periods: during the initial flooding season, when the water level was considered moderate; during the flooding season, when the water level was maximum; and during the dry season, when the water level was considered low. SD = standard deviation.
| Characteristic | Moderate-Water | High-Water | Low-Water | |||
|---|---|---|---|---|---|---|
| Mean | SD | Mean | SD | Mean | SD | |
| pH | 7.6 | 0.26 | 8.76 | 0.41 | 8.09 | 0.44 |
| Electric conductivity (µS cm−1) | 158.4 | 0.55 | 153 | 8.33 | 196 | 4.95 |
| Dissolved oxygen (mg L−1) | 5.21 | 0.79 | 8.17 | 0.64 | 6.98 | 1.14 |
| Temperature (°C) | 29.9 | 0.92 | 28.13 | 0.36 | 30.54 | 0.81 |
| Chlorophyll-a (mg m−3) | 3.57 | 1.18 | 36.38 | 3.5 | 20.79 | 11.2 |
| Total phosphorus (µg L−1) | 59.20 | 32.93 | 141.80 | 30.77 | 208.80 | 134.63 |
| Total nitrogen (µg L−1) | 231.40 | 79.87 | 1006.50 | 219.07 | 2092.40 | 561.97 |
| Secchi depth (cm) | 69 | 17.08 | 69.6 | 5.55 | 17.2 | 2.9 |
| Depth (cm) | 211 | 4.97 | 313.80 | 16.54 | 111.14 | 8.53 |
Table 3.
One-way analysis of variance (ANOVA) with Fisher’s least significant different (LSD) for abiotic and biotic factors across the three hydrological periods in Lake Tempe: moderate-water (MW), high-water (HW), and low-water (LW). The differences are significant when p = 0.05; NS = no significant differences.
| Factor | One-Way ANOVA, Fisher’s LSD (α = 0.05) | ||
|---|---|---|---|
| MW vs. HW | MW vs. LW | HW vs. LW | |
| Abiotic | |||
| Total nitrogen (TN) Total phosphorus (TP) Chlorophyll-a (chl-a) Secchi depth Mean depth | p < 0.01 NS p < 0.01 NS p < 0.01 | p <0.01 p = 0.01 p = 0.01 p < 0.01 p < 0.01 | p < 0.01 NS p <0.01 p < 0.01 p < 0.01 |
| Biotic | |||
| Zooplankton total abundance Zooplankton abundance small-sized Zooplankton abundance intermediate-sized Zooplankton abundance large sized Zooplankton total biomass Zooplankton biomass small-sized Zooplankton biomass medium-sized Zooplankton biomass large-sized Fish density | p < 0.01 p < 0.01 p < 0.01 p = 0.02 p = 0.02 p < 0.01 p = 0.02 NS p < 0.01 | p = 0.01 p = 0.01 p = 0.01 p = 0.01 p = 0.01 p = 0.01 p = 0.02 p = 0.04 p < 0.01 | NS NS NS NS p = 0.04 NS NS p = 0.01 p < 0.01 |
Table 4.
Summary of zooplankton average abundance (±standard deviation) and biomass of each size class during the three hydrological periods in Lake Tempe.
Table 4.
Summary of zooplankton average abundance (±standard deviation) and biomass of each size class during the three hydrological periods in Lake Tempe.
| Parameter | Hydrological Periods | ||
|---|---|---|---|
| Moderate-Water | High-Water | Low-Water | |
| Abundance (ind L−1) | |||
| Total | 44.74 (±15.82) | 370.34 (±107.17) | 328 (±233.505) |
| 300–500 µm (Small) | 31.84 (±8.26) | 301.82 (±80.99) | 257.39 (±188.45) |
| 501–750 µm (Medium) | 10.76 (±6.86)) | 64.33 (±30.75) | 61.14 (±39.28) |
| >750 µm (Large) | 2.14 (±1.16) | 4.19 (±1.87) | 10.17 (±7.05) |
| Biomass (mg L−1) | |||
| Total | 2.18 (±0.78) | 11.30 (±3.88) | 11.77 (±8.01) |
| 300–500 µm (Small) | 0.68 (±0.22) | 5.93 (±1.64) | 5.29 (±3.91) |
| 501–750 µm (Medium) | 0.90 (±0.58) | 5.10 (±2.48) | 4.88 (±3.08) |
| >750 µm (Large) | 0.63 (±0.54) | 0.27 (±0.18) | 1.59 (±1.06) |
| NBSS parameters | |||
| Slope (a) | −1.26 | −1.73 | −1.21 |
| Intercept (b) | 3.34 | 4.49 | 3.97 |
Table 5.
Fish mean total abundance in three different hydrological periods. Relative abundance of each species is given in parentheses.
Table 5.
Fish mean total abundance in three different hydrological periods. Relative abundance of each species is given in parentheses.
| Species | Fish Total Abundance | ||
|---|---|---|---|
| Moderate-Water (March) | High-Water (July) | Low-Water (September) | |
| Anabas testudineus Barbonymus gonionotus Channa striata Glossogobius giuris Megalops cyprinoides Monopterus albus Oreochromis niloticus Osteochilus vittatus Oxyeleotris marmorata Stenogobius gymnopomus Trichopodus pectoralis Trichopodus trichopterus | 0 (0%) 223 (77.2%) 0 (0%) 35 (12%) 0 (0.0%) 0 (0 %) 17 (6%) 2 (0.7%) 0 (0%) 0 (0) 2 (0.7%) 10 (3.5%) | 4 (2.2%) 81 (45%) 1 (0.6%) 23 (12.8%) 0 (0 %) 1(0.6%) 1 (0.6%) 30 (16.7%) 15 (8.3%) 5 (2.8%) 14 (7.8%) 5 (2.8%) | 7 (1%) 341 (47.6%) 2 (0.3%) 177 (24.7%) 1 (0.1%) 1 (0.1%) 21 (2.9%) 57 (7.9%) 26 (2.9%) 4 (0.6%) 2 (0.3%) 22 (3.1%) |
| Total abundance Total number of species | 256 6 | 180 11 | 715 12 |
Table 6.
Results of linear regression analysis model showing the correlation between zooplankton biomass and abundance and trophic indicators: chlorophyll-a (chl-a), total phosphorus (TP), total nitrogen (TN), and fish density. Values indicate the correlation coefficient (R2) and p-value; when p values are greater than 0.05, there is no significant relationship between the two variables.
| Zooplankton Size Spectra | Chl-a | TP | TN | Fish Density |
|---|---|---|---|---|
| Biomass | ||||
| Total | R2 = 0.58; p < 0.01 | R2 = 0.58; p < 0.01 | R2 = 0.21; p = 0.08 | R2 = 0.01; p = 0.77 |
| Small | R2 = 0.67; p < 0.01 | R2 = 0.67; p < 0.01 | R2 = 0.53; p < 0.01 | R2 = 0.02; p = 0.61 |
| Intermediate | R2 = 0.54; p < 0.01 | R2 = 0.53; p < 0.01 | R2 = 0.44; p < 0.01 | R2 = 0.01; p = 0.76 |
| Large | R2 = 0.01; p = 0.63 | R2 = 0.48; p < 0.01 | R2 = 0.15; p = 0.22 | R2 = 0.51; p < 0.01 |
| Abundance | ||||
| Total | R2 = 0.72; p < 0.01 | R2 = 0.65; p < 0.01 | R2 = 0.56; p < 0.01 | R2 = 0.01; p = 0.72 |
| Small | R2 = 0.74; p < 0.01 | R2 = 0.65; p < 0.01 | R2 = 0.59; p < 0.01 | R2 = 0.01; p = 0.73 |
| Intermediate | R2 = 0.59; p < 0.01 | R2 = 0.63; p < 0.01 | R2 = 0.46; p < 0.01 | R2 = 0.01; p = 0.75 |
| Large | R2 = 0.18; p < 0.12 | R2 = 0.42; p < 0.01 | R2 = 0.38; p = 0.02 | R2 = 0.25; p = 0.05 |
Publisher’s Note: MDPI stays neutral with regard to jurisdictional claims in published maps and institutional affiliations. |
© 2022 by the authors. Licensee MDPI, Basel, Switzerland. This article is an open access article distributed under the terms and conditions of the Creative Commons Attribution (CC BY) license (https://creativecommons.org/licenses/by/4.0/).
Share and Cite
MDPI and ACS Style
Toruan, R.L.; Dina, R.; Coggins, L.X.; Ghadouani, A. Hydrological Regime and Fish Predation Regulate the Zooplankton Community Size Structure in a Tropical Floodplain Lake. Water 2022, 14, 2518. https://doi.org/10.3390/w14162518
AMA Style
Toruan RL, Dina R, Coggins LX, Ghadouani A. Hydrological Regime and Fish Predation Regulate the Zooplankton Community Size Structure in a Tropical Floodplain Lake. Water. 2022; 14(16):2518. https://doi.org/10.3390/w14162518
Chicago/Turabian StyleToruan, Reliana Lumban, Rahmi Dina, Liah X. Coggins, and Anas Ghadouani. 2022. "Hydrological Regime and Fish Predation Regulate the Zooplankton Community Size Structure in a Tropical Floodplain Lake" Water 14, no. 16: 2518. https://doi.org/10.3390/w14162518
Note that from the first issue of 2016, this journal uses article numbers instead of page numbers. See further details here.