Article

Prediction of Water-Blocking Capability of Water-Seepage-Resistance Strata Based on AHP-Fuzzy Comprehensive Evaluation Method—A Case Study

1
Key Laboratory of Deep Coal Resources Mining, China University of Mining and Technology, Ministry of Education, Xuzhou 221116, China
2
School of Energy, Xi’an University of Science and Technology, Xi’an 710054, China
*
Author to whom correspondence should be addressed.
Water 2022, 14(16), 2517; https://doi.org/10.3390/w14162517
Submission received: 21 June 2022 / Revised: 11 August 2022 / Accepted: 12 August 2022 / Published: 15 August 2022

Abstract

:
Coal mining under the aquifer in Northwest China has brought a series of ecological problems, such as the decline of groundwater levels and the death of surface vegetation. The study of the impermeability of rock strata between coal seams and the overlying aquifers is of great significance to solve these problems and realize water-preserving coal mining (WPCM). Based on mining-induced overburden damage and permeability deterioration, the concept of the “three seepage zones” of overburden is proposed, namely the pipe flow zone, water seepage zone and nominal water-seepage-resistance zone (NWSRZ). Meanwhile, the concept of water-seepage-resistance strata (WSRS) is put forward from the aspects of initial permeability, structural strength, swelling and the stratigraphic structure of the overlying strata. AHP-fuzzy comprehensive evaluation (AHPF) is employed to construct a model to evaluate the water-blocking capacity (WBC) of the WSRS. The model includes three secondary factors and nine tertiary indicators, and the weights and membership functions of the indicators are determined. Subsequently, the model is generalized and applied to the Yu-Shen mining area. The membership degrees are spatially visualized by means of thematic maps. The comprehensive evaluation values Φ of the WBCWSRS of 400 boreholes in the mining area under backfill mining, narrow strip mining, slice mining and longwall cave mining are calculated. Then, the Kriging method is employed to plot the zoning maps of Φ under four different mining methods. In view of different grades of WBCWSRS, three corresponding countermeasures, i.e., mining methods optimization, curtain grouting and underground reservoir construction, are put forward. The fluid–solid coupling embedded in FALC3D software is employed to establish a numerical calculation model to simulate the water table fluctuation of the underground aquifer under the four mining methods, and the reliability of the model is verified indirectly. In this paper, mathematical theory is combined with WPCM to develop an evaluation model of WBCWSRS, which provides a reference for the coordinated development of coal extraction and water resource preservation in arid and semi-arid mining areas.

1. Introduction

With the gradual depletion of coal resources in the Middle East of China, mining activities have been rapidly transformed into arid and semi-arid mining areas in the northwest areas [1,2,3]. The northwest mining regions, whose coal reserves exceed 70% of the country’s total, are the main coal-producing areas in China [4,5,6]. In 2020, the coal output in the northwest areas was 2.3 billion tons, accounting for nearly 60% of the country’s total. However, the total amount of water resources in this area is nearly 4% of the country’s total [7]. As the main body of the Shaanbei coal base, which is one of the five major coal bases in Northwest China (Xinjiang, Ningdong, Shendong, Shanbei and Huanglong coal base), the Yu-Shen coal area is generally characterized by thick and shallow coal seams, water resource shortages and a fragile surface ecological environment [8,9,10]. Large-scale and high-intensity longwall cave mining has resulted in a series of problems, such as breakage and damage, the development of water-conducting fractures and the permeability deterioration of the overburden [11,12]. Severe mining disturbances cause the formation of water percolation channels between the mined-out areas and the overlying aquifers, which give rise to water inrush and water table lowering in the overlying aquifers. Not only does this phenomenon seriously threaten the mine’s safety but it also contributes to the vegetation withering and land desertification [13].
In view of these problems of phreatic water loss during coal extraction in the Yu-Shen mining area, Fan Limin first put forward the concept of WPCM and regarded the preservation and conservation of the ecological water level as the ultimate objective. He developed a model that included 34 sub-factors to evaluate the WPCM [14,15]. In addition, Wang Shuangming and Huang Qingxiang analyzed the spatial combination relationship of coal seams, aquifers and aquifuges, and put forward a partitioning scheme for WPCM [16,17]. Li Wenping et al. investigated the different characteristics and classified the types of eco-geological environment in the Yu-Shen mining area. They divided the phreatic water leakage into four areas, i.e., severe, moderate, slight and no water loss areas, from the perspective of the phreatic aquifer failure mechanism and effective thickness of the water-resistant layer [18,19]. Scholars abroad have also carried out large amounts of in-depth research on coal mining under the water body, despite the fact that the concept of WPCM has not been systematically defined in foreign countries. They hold the view that overlying water bodies should be considered as environmental constraints in longwall cave mining [20,21,22,23]. Furthermore, they have investigated and assessed the hydrological effects caused by coal mining in many foreign coal mines [24,25,26,27]. Furthermore, the sustainable development of groundwater resources for WPCM is also a popular topic regarding foreign coal mines [28]. In addition, researchers divided the overlying strata into the caving zone, connected fracture zone, disconnected fracture zone, micro-fracture zone and no fracture zone from the aspects of stress evolution, permeability deterioration and fracture development under longwall cave mining. The range of the caving zone and the interconnected zone is termed as the water-conducting fracture zone (WCFZ), where water can flow from the overlying aquifer to the mined-out area [29,30,31,32].
As an indispensable part of green mining, WPCM aims to ameliorate the migration, the fissure development, as well as the permeability deterioration of the overburden. It contributes to preventing the formation of effective water seepage channels between the overlying water bodies and the gob, so as to protect the water volume and water level and prevent water disasters. At present, the research of WPCM concentrates on the risk assessment of water inrush from the roof and floor [33]. Using a comprehensive evaluation method to develop a model for evaluating the risk degree of water inrush, and proposing countermeasures based on various hazard grades, is an important way to achieve WPCM [34,35,36,37,38,39]. The comprehensive evaluation methods include AHP, the fuzzy comprehensive evaluation method, the Delphi method, the weighted average method, the principal component analysis method and the BP neural network method [40,41,42,43,44,45,46,47,48]. AHP has a wide range of applications. In addition to evaluating the hydrochemical characteristics and water quality of groundwater [49], it can also be combined with other research methods to assess the development of macro- and micro-fractures under different conditions [50]. For instance, it can be employed to predict the developing law of surface fractures and compound crack propagation under impact load [51,52,53]. In addition, AHP can be utilized to evaluate the mining stress field and overburden movement, since water-conducting fissures are formed due to the deformation and stress exceeding the critical value of the overlying strata, so as to better study the water inrush from the roof [54,55,56,57]. AHPF can realize quantitative analysis and quantitative analysis simultaneously; it is therefore the most commonly employed method to solve complex problems affected by multiple indicators.
There are many factors affecting the WBCWSRS. In addition to the type, the vertical level and the integrity of the WSRS and the equivalent thickness of the NWSRZ, the water yield property, recharge and mining-induced water level lowering of the overlying aquifer should also be taken into account. Additionally, the mining methods and mining parameters of the coal extraction system should also be considered. The relationship between the influencing factors of the WBC is fuzzy, and the influence characteristics of each indicator on the WBC are also fuzzy. The permeability deterioration and the change law of the WBC under the action of coal extraction are also fuzzy. These characteristics determine that the WBCWSRS is fuzzy, which is consistent with the characteristics of fuzzy mathematics.
Therefore, on the basis of systematically illustrating the scientific connotations of the WSRS, AHPF will be employed to identify the influencing factors of the WBCWSRS to build a mathematical evaluation model of the WBC. Then, the model will be generalized and applied to the Yu-Shen mining area. The evaluation results of the WBC will be spatially visualized by means of thematic maps, and the membership degrees will be therefore determined. Combined with the weight distribution, the comprehensive evaluation values Φ of WBCWSRS for 400 boreholes under backfill mining, narrow strip mining, slice mining and longwall cave mining will be calculated. Subsequently, the zoning map of Φ in the entire coal area under four various mining methods will be plotted using the Kriging method. Based on the grade of WBC, control measures such as mining methods optimization, curtain grouting and underground reservoir construction will be put forward. Furthermore, with the aid of the FLAC3D fluid structure coupling module, the water table lowering of the underground aquifer under four mining methods will be simulated, which can indirectly verify the reliability of the prediction model. The research results can provide a theoretical basis for the realization of the harmonious development of coal extraction and water preservation in arid and semi-arid mining areas.

2. Research Background

2.1. Location and Climate

The Yu-Shen mining area, located in the north of Yulin City, Shaanxi Province, China, covers a total area of 5160 km2. The maximum length of the coal area is around 97 km from east to west, slightly greater than that of 95 km in the direction from south to north. The total coal reserve of the entire mining area is greater than 30 billion tons. The climate of the study area conforms to the characteristics of the continental monsoon climate of the middle temperate zone. Its average annual rainfall is only approximately 400 mm and occurs mainly in July to September, while the average annual evaporation is more than 1900 mm [5]. According to the definition of arid and semi-arid areas from the aspect of precipitation, areas whose annual precipitation is less than 350 mm are arid areas, while they belong to arid and semi-arid areas when the precipitation varies from 350 to 500 mm. The characteristics of the Yu-Shen mining area show good agreement with those of arid and semi-arid areas.

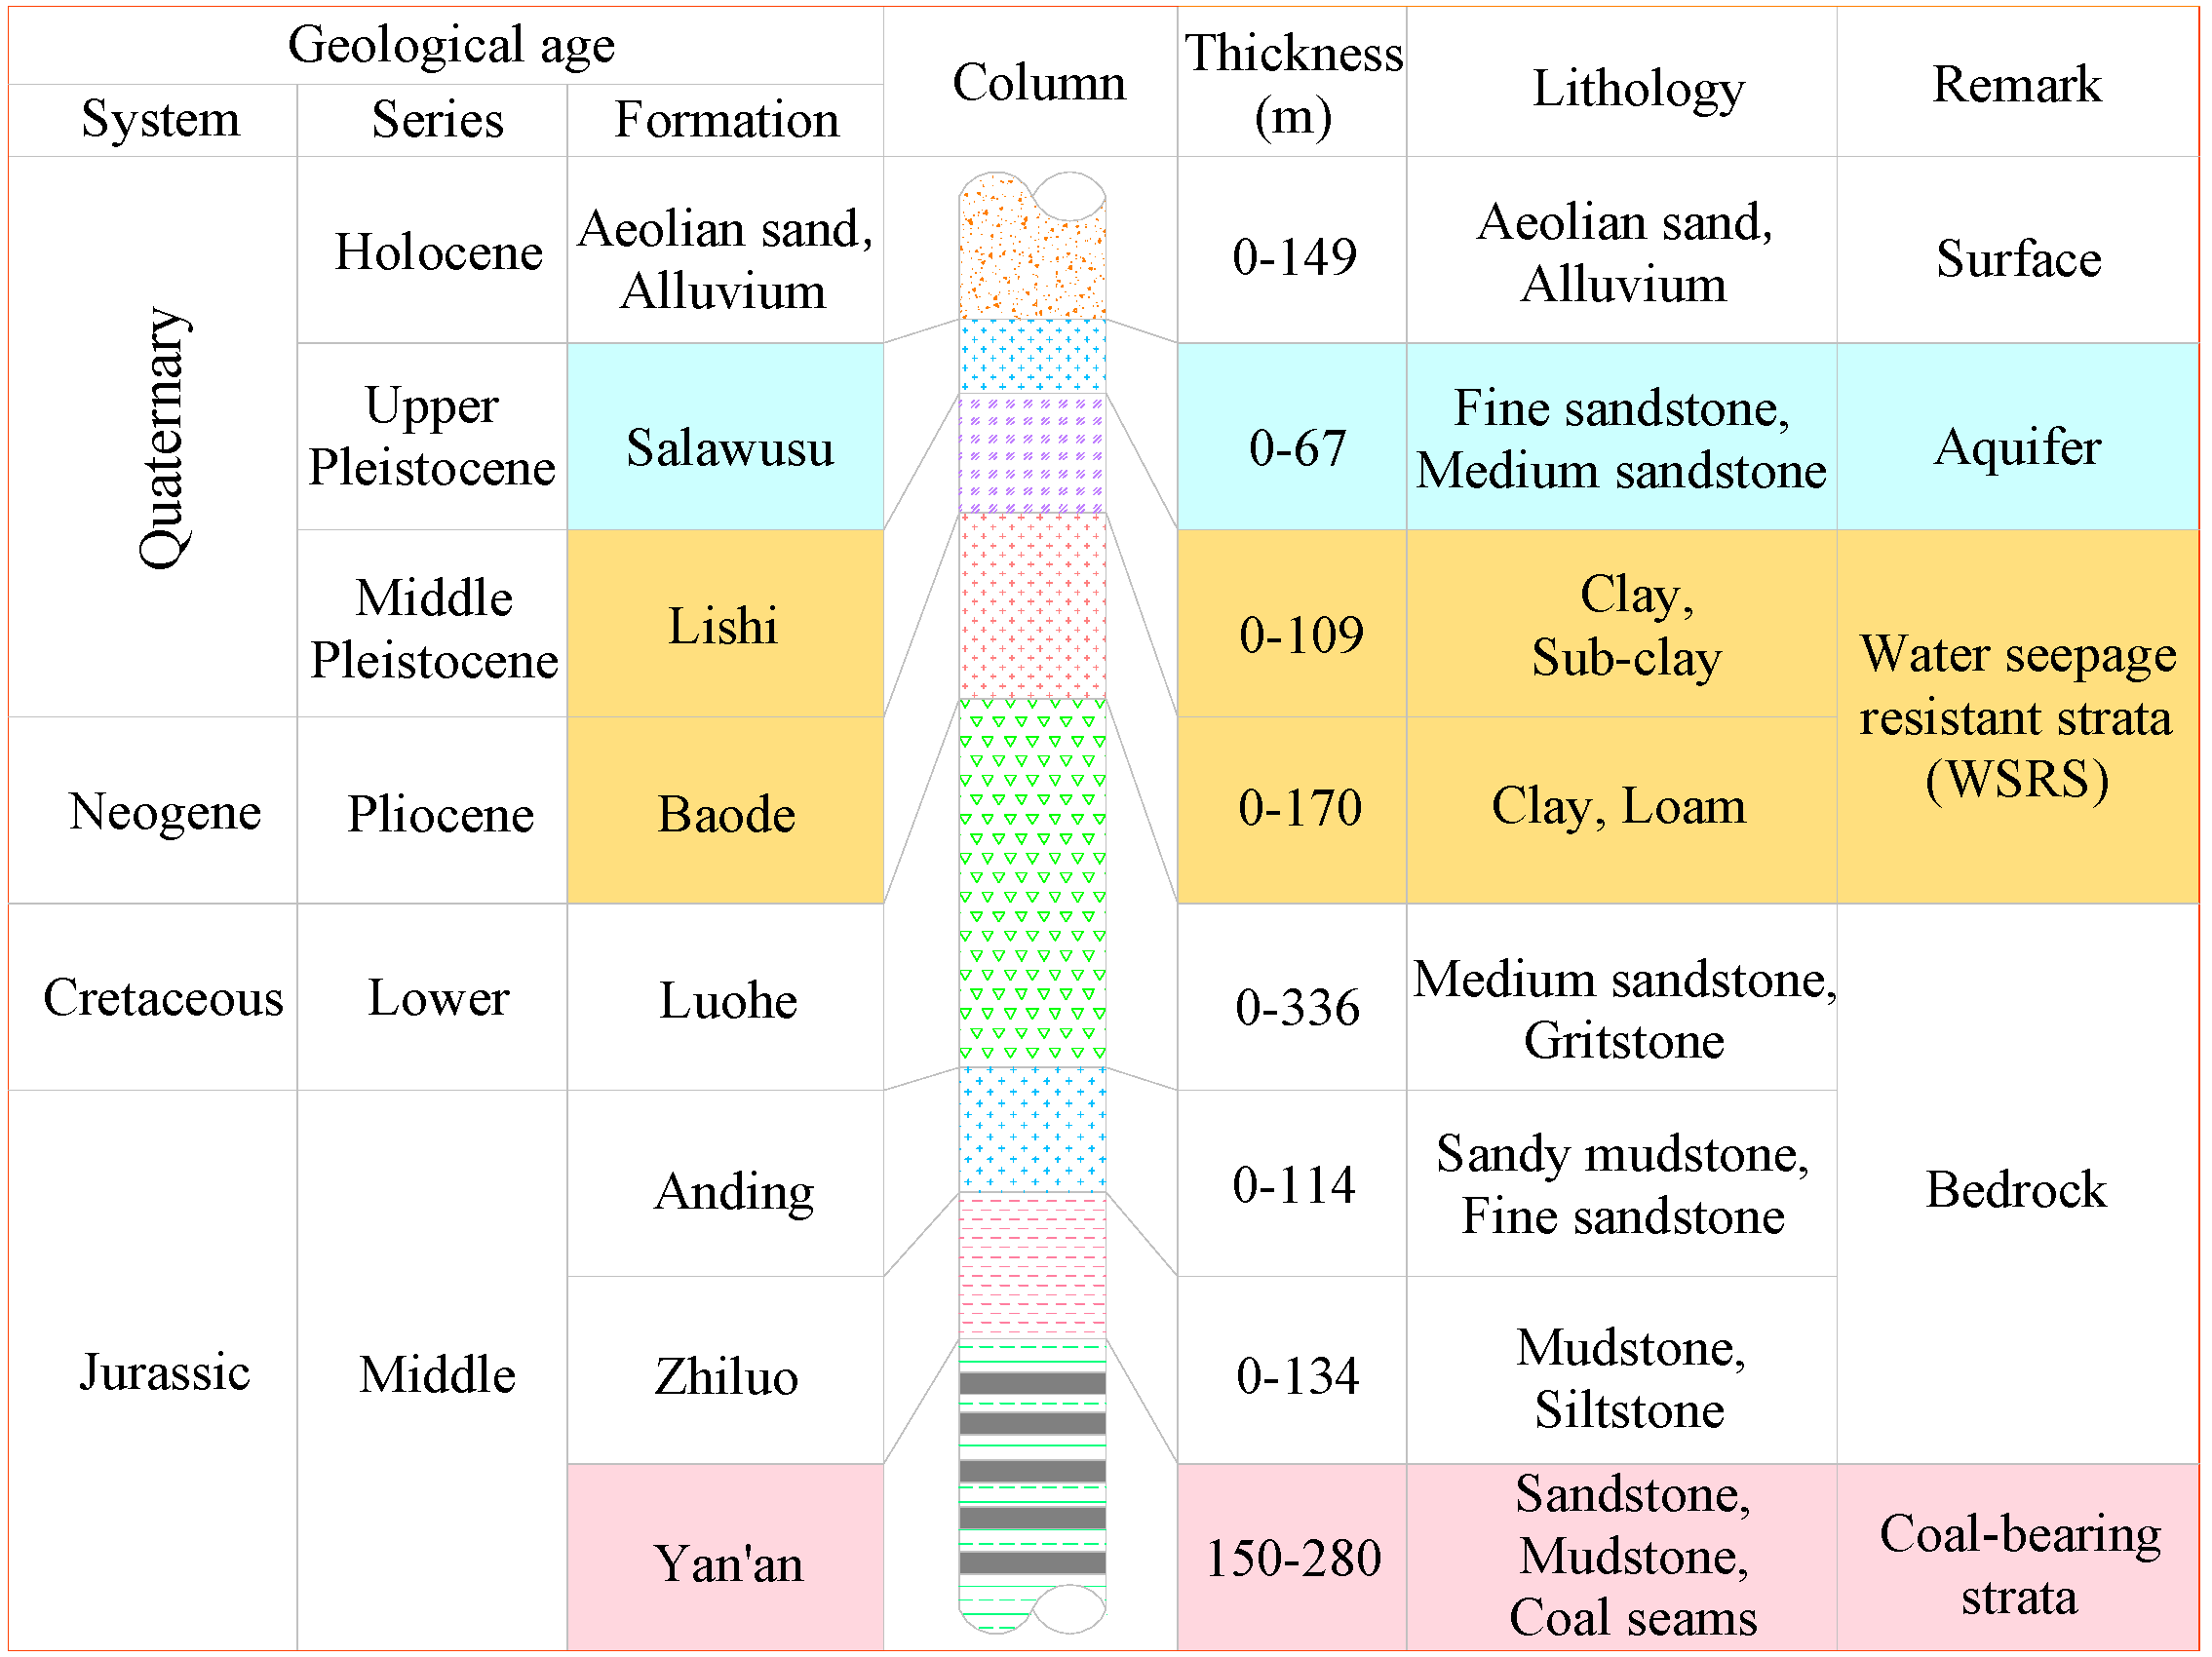
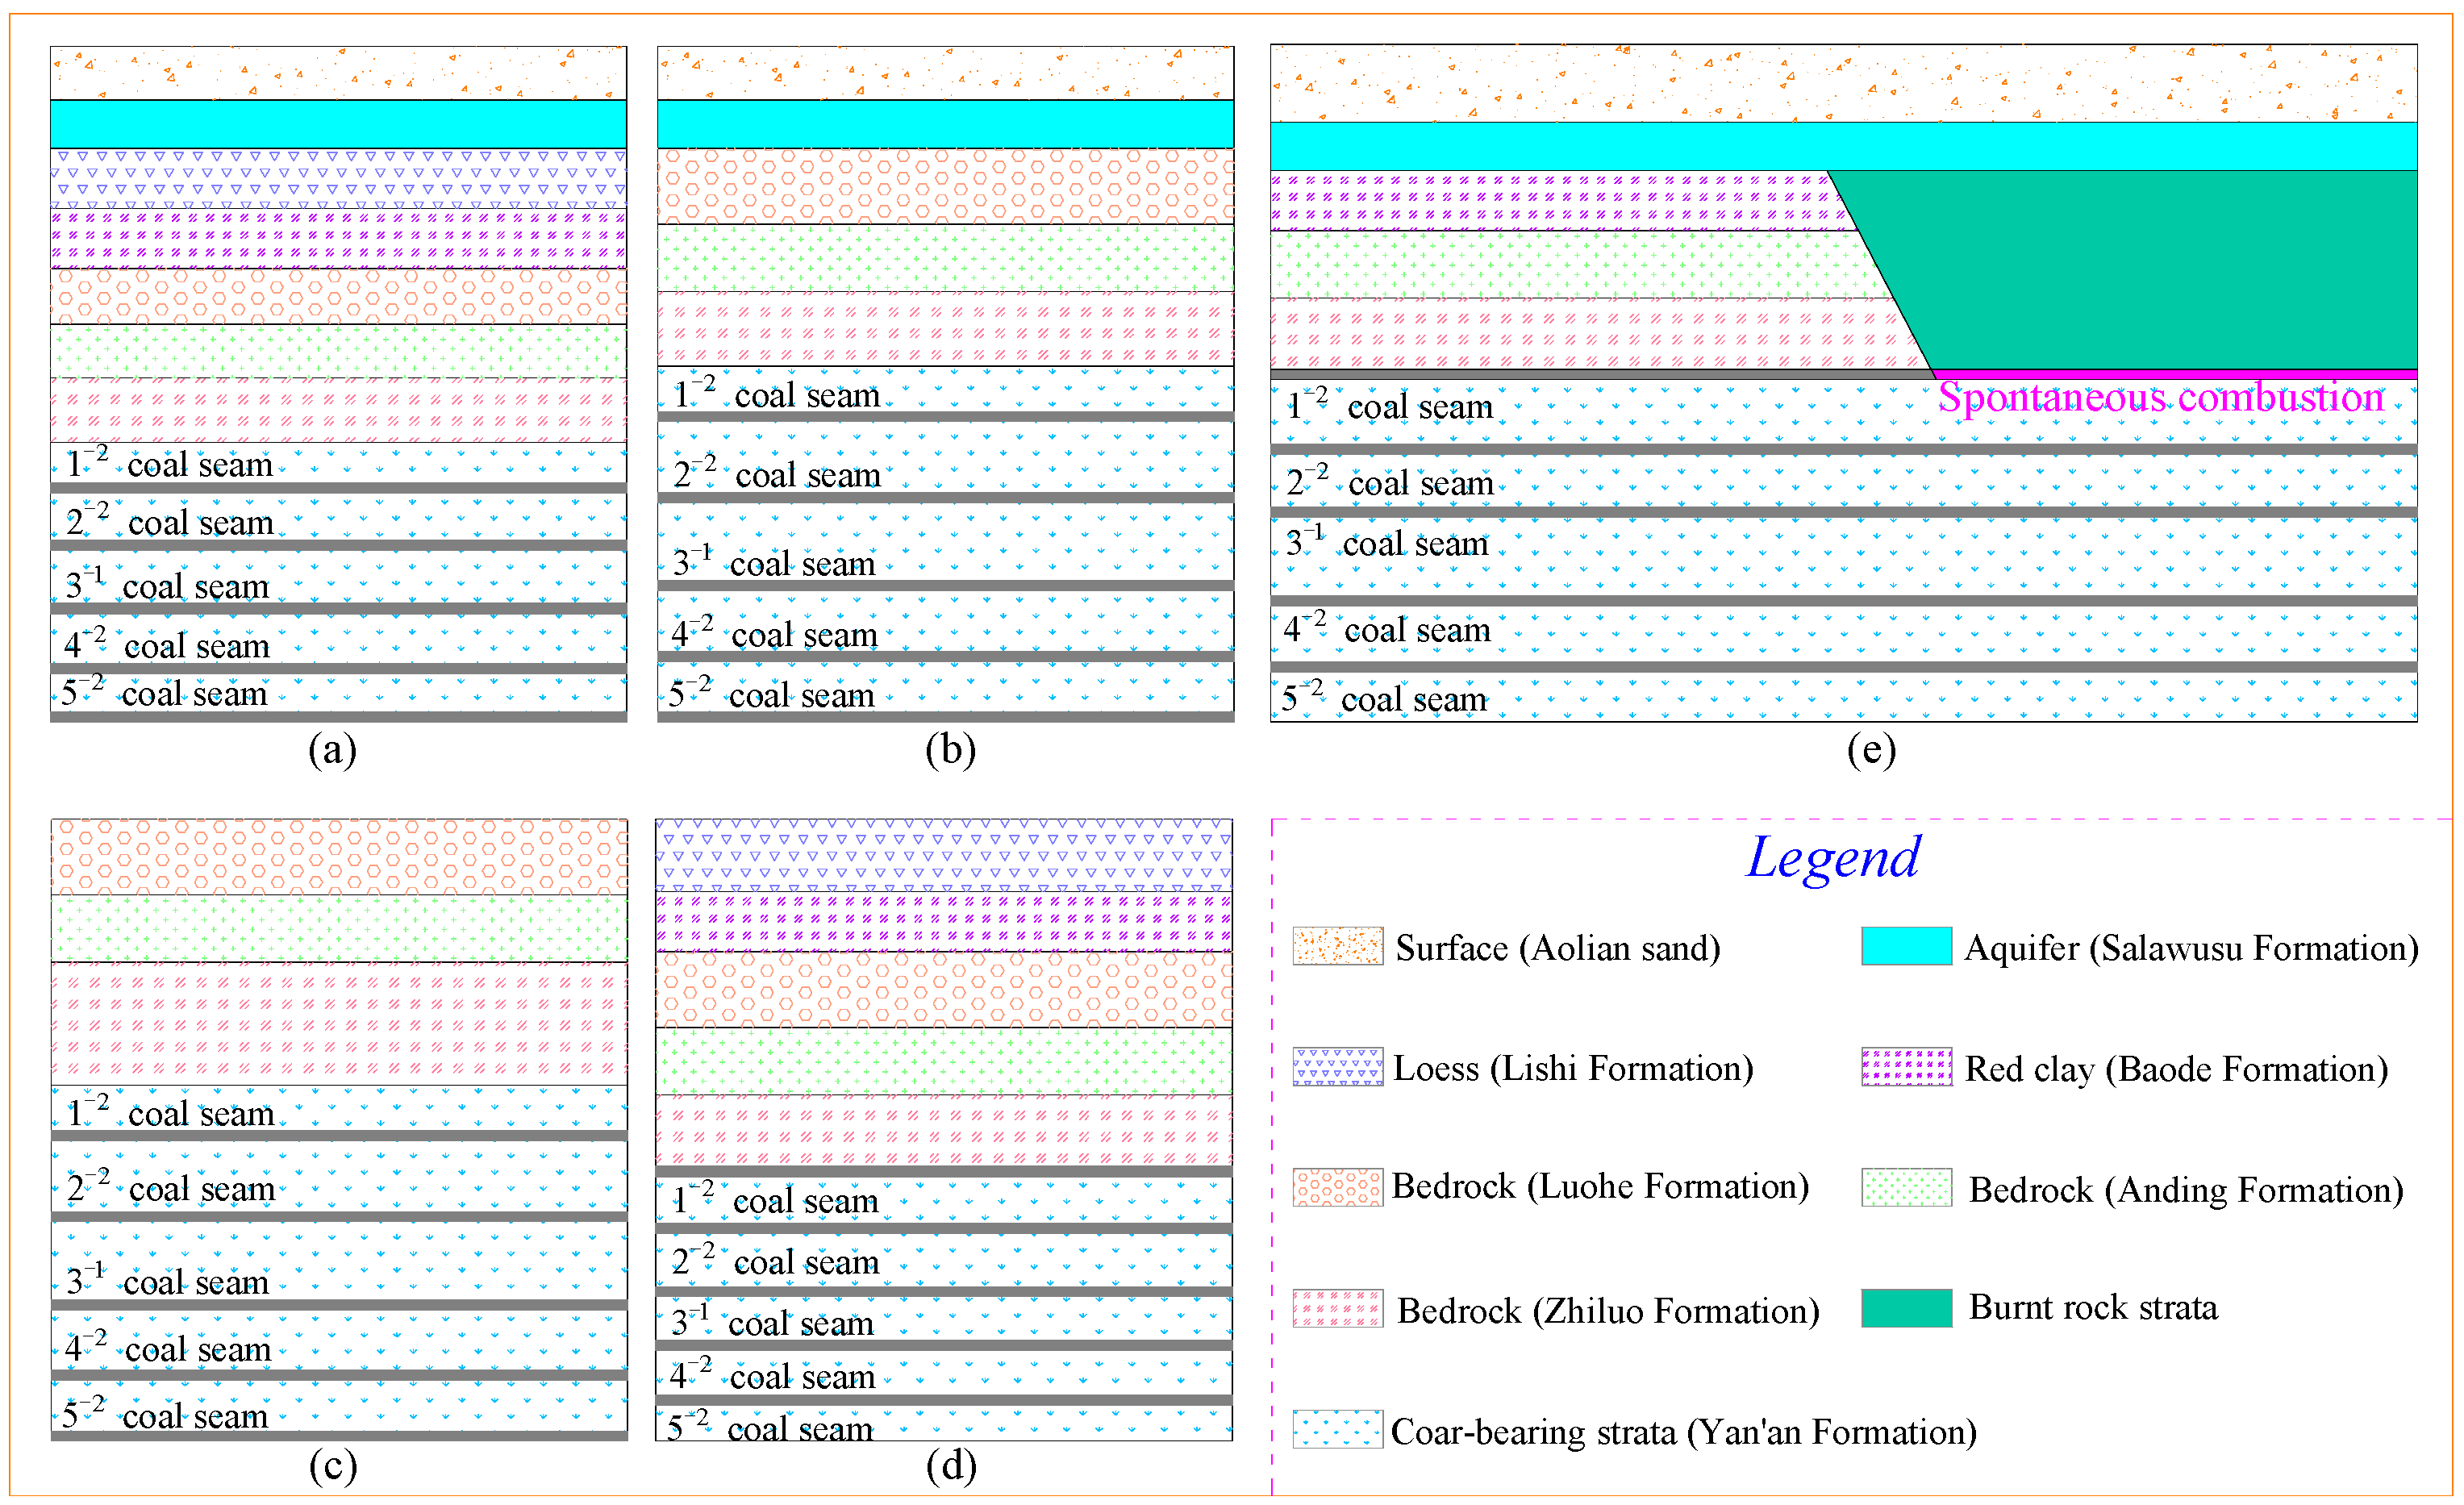
2.2. Geological Background

The typical comprehensive stratigraphic column of the Yu-Shen coal area and the lithological characteristics are shown in Figure 1. The surface is primarily covered by Quaternary strata, and bedrock outcrops are sporadically distributed in valleys. From youngest to oldest, the strata are: the Quaternary System (Q), the Neogene System (N), the Lower Cretaceous Luohe Formation (K1l), the Anding Formations (J2a), Zhiluo (J2z), the Yan’an (J2y) and the Lower Jurassic Fuxian Formation (J1f). The Salawusu Formation is the major underground aquifer that needs to be taken into account in the process of coal extraction. Moreover, the clay and sub-clay in the Lishi and Baode Formations, playing the role of resisting water percolation from the aquifer to the mined-out area, can be regarded as the one type of WSRS that resists water seepage by the lithology. The Yan’an Formation is the coal-bearing stratum, consisting of five minable coal seams.

2.3. Characteristics of Underground Aquifer

There are four aquifers occurring in the Yu-Shen coal area. The four aquifers can be classified into two types: the phreatic aquifer and the confined aquifer. The former is composed of the unconsolidated porous phreatic aquifer, the Salawusu Formation phreatic aquifer and the burnt rock phreatic aquifer, while the latter is the porous bedrock-confined aquifer, as demonstrated in Figure 2.
The porous bedrock-confined aquifer is characterized by limited porosity, high permeability, poor water richness and a restricted distribution range. The unconsolidated porous phreatic aquifer is the highest aquifer and it is close to the surface. It is thin and is primarily recharged from precipitation, forming a complete aquifer with its underlying Salawusu Formation aquifer in the majority of areas in the Yu-Shen mining area. The burnt rock phreatic aquifer cannot form a water-storing structure and is primarily recharged from its overlying Salawusu Formation aquifer. The Salawusu Formation aquifer is widely distributed in the mining area, and its maximum thickness can be up to 67.3 m. The water level is generally less than 10 m [5,6]. It is indispensable for the water demands of the surface ecology and domestic water use. Hence, the Salawusu Formation aquifer is the only one that needs to be considered in the process of evaluating the WBCWSRS in the Yu-Shen coal area.

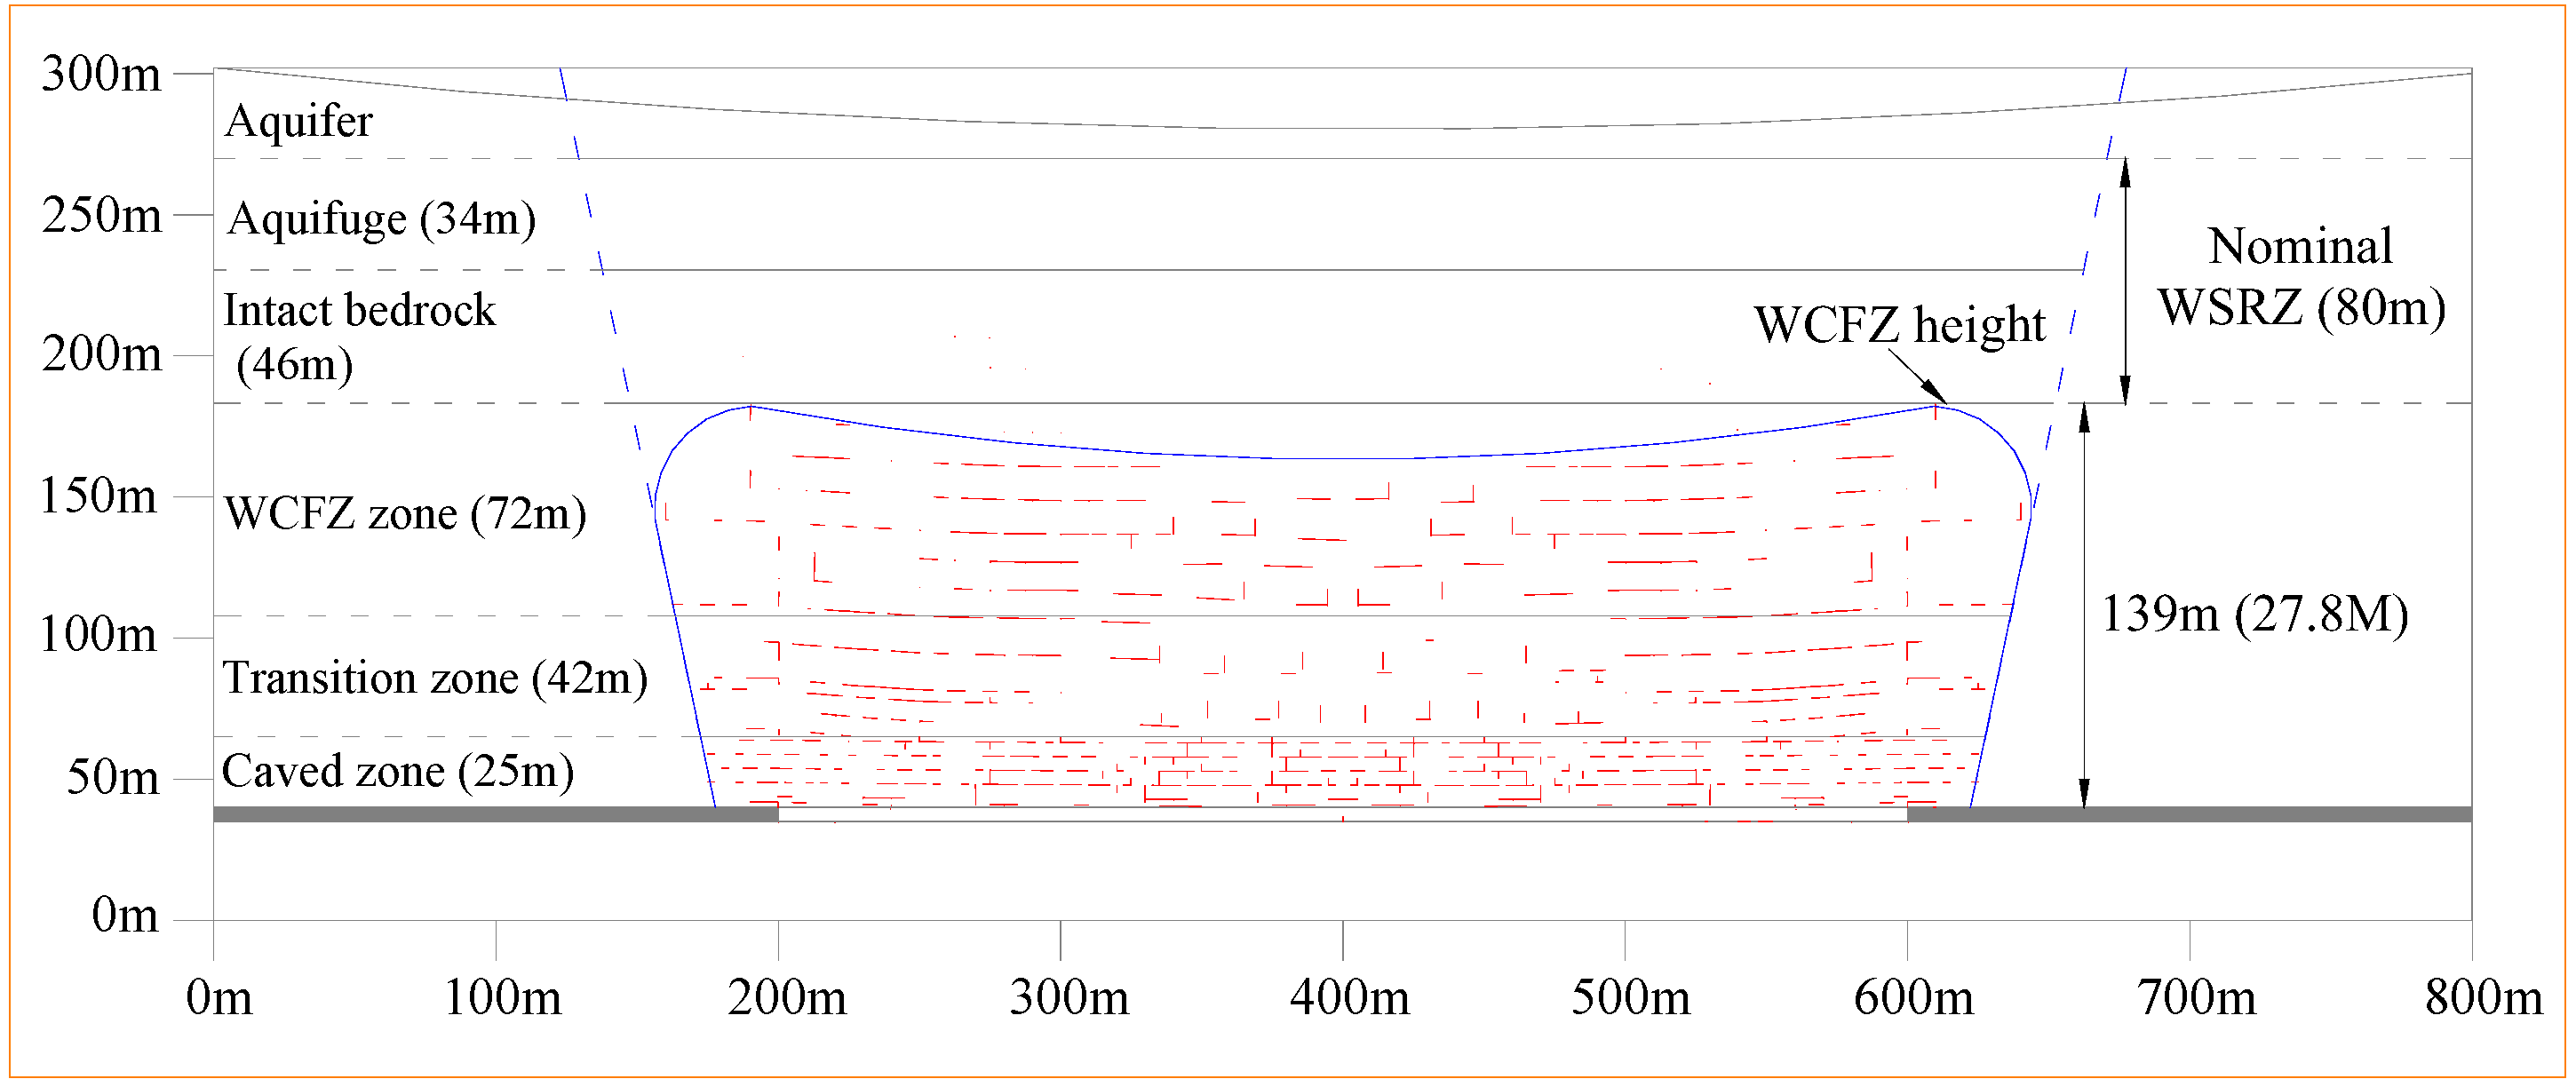
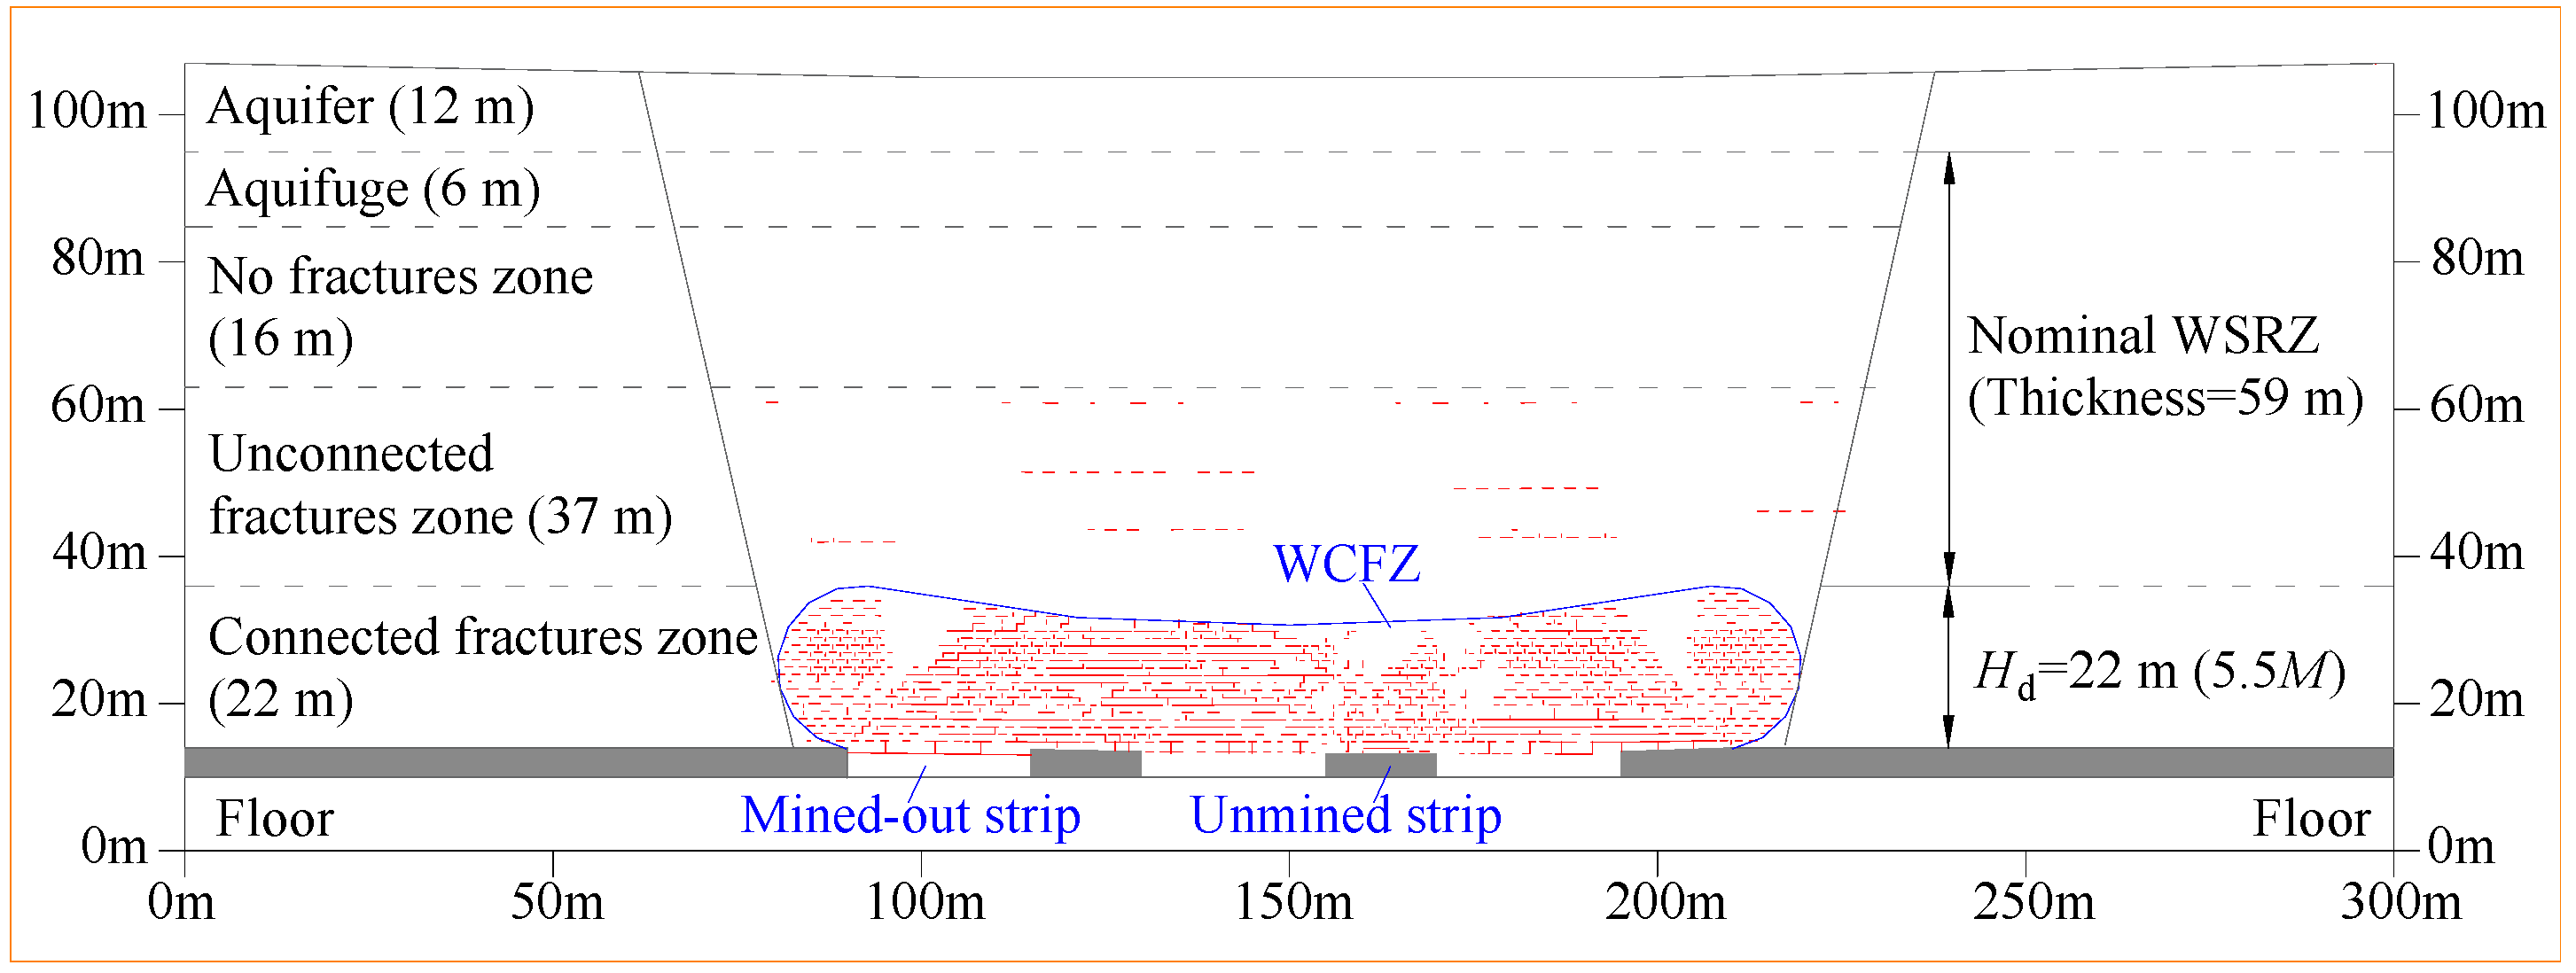
3. Scientific Connotations of WSRS and NWSRZ

3.1. Definition and Classification of WSRS

The classification of WSRS is illustrated in Figure 3. The stratum between the overlying aquifer and the coal seam plays different roles in preventing water seepage, due to the varying lithology and thickness [58]. For instance, the stratum of clay, loess or mudstone is characterized by low strength and initial permeability coefficient, as well as a high softening and swelling rate when soaked in water [59,60,61]. Therefore, it can be regarded as a type Ⅰ WSRS (single WSRS), as shown in Figure 3a. In addition, the deflection of the thick and hard rock layer (key stratum) between the coal seam and the aquifer is far less than that of its lower layer, leading to a separation space between them [62]. This can reduce the damage and deformation of the strata above the key stratum, and reduce the fracture development and permeability deterioration of its overlying layers. The key stratum acts as a structural impermeability barrier and can be regarded as a type II WSRS, as shown in Figure 3b.
Thirdly, the impermeability between soft rock and hard rock provides mutual promotion and assistance. On the one hand, hard rock has a decisive influence on the deformation damage and fracture development of the composite strata consisting of soft and hard strata. The high strength of hard rock is beneficial to restrain the movement and deformation of the laminate strata, so as to reduce its damage, fracture development and permeability deterioration. However, the initial permeability coefficient of hard rock is much higher than that of soft rock, contributing to its impermeability effect being much smaller than that of soft rock. Therefore, it makes little contribution to the impermeability of the composite strata. On the other hand, the initial permeability coefficient of the soft stratum is far less than that of the hard rock. It is a natural impermeable stratum (water-resisting layer). However, it features low strength and mining disturbance, resulting in its breakage, contributing to the loss of its water-blocking capability completely without the support of a hard stratum. Therefore, the composite strata composed of soft strata and hard strata can be defined as type Ⅲ WSRS, as shown in Figure 3c. Fourth, if all the strata between the coal seam and the aquifer are characterized by low strength and minor thickness, and they do not include soft strata such as clay or thick and hard strata, their impermeability is far less than the first three types of WSRS, and they can therefore be defined as type Ⅳ WSRS, as shown in Figure 3d. Fifth, if there is only one rock stratum (such as burnt rock), with large porosity and extremely developed initial fissures between the coal seam and the aquifer, it will immediately break and become unstable, affected by coal extraction, leading to mine water and sand inrush. In order to realize WPCM under this stratigraphic structure, curtain grouting and other measures should be employed to maintain its WBC. In this case, it can be considered that there is no WSRS, as shown in Figure 3e.

3.2. Scientific Connotations of NWSRZ

At present, scholars occupied in WPCM usually take the mining-induced WCFZ developing to the aquifer or the fractures penetrating the aquiclude as the criterion for WPCM. The influence of the initial permeability and the ratio of permeability deterioration (k/k0) of the undamaged strata between the coal seam and the overlying aquifer after mining on the WBC or water diversion capability are ignored. In fact, although there is a certain thickness of the complete strata between the top of the WCFZ and the aquifer, if the primary fracture is well developed and the initial permeability is high, water seepage may still occur under the action of a head pressure difference. Moreover, relevant scholars have put forward the concept of the water resistance index, which has promoted the development of the theory of WPCM. However, it only roughly characterizes the water-resisting index based on the strength of strata, the mechanism of water blocking or water diversion of the aquifuge or intact strata from the perspective of the initial permeability, and mining-induced permeability deterioration is still not considered. Furthermore, prior to coal extraction, the water-resisting key strata are qualitatively described as the strata where water finally needs to penetrate or is finally blocked. Its structural instability and seepage instability do not consider other intact rock layers besides itself. Therefore, it is necessary to systematically characterize the impermeability of the intact strata from two aspects: the initial seepage field (primary fracture field) of strata and the evolution of the seepage field after coal extraction.
Therefore, according to the damage degree and the ratio of permeability deterioration of overlying strata after mining, the overburden is divided into “three seepage zones” from bottom to top, namely the “pipe flow zone”, “water seepage zone” and “NWSRZ” (complete rock stratum after longwall cave mining). The NWSRZ is composed of various types of WSRS or even without WSRS, as illustrated in Figure 4. The criteria for the “three seepage zones” are given based on the permeability deterioration rate, i.e., pipe flow zone (k/k0 > 1000), water seepage zone (1000 > k/k0 > 20), NWSRZ (20 > k/k0 > 1). Due to different mining stress environments, the ratio of permeability deterioration in the horizontal direction of the water seepage zone also varies widely. In the vicinity of the left and right sides of the surrounding line of the WCFZ, the ratio of permeability deterioration ranges from 500 to 1000 due to the joint action of tensile and shear stress. This place can be defined as the seepage increased zone. In contrast, in the middle of the WCFZ, the permeability of the mining fractured rock mass recovers to a certain extent under the action of compressive stress, giving rise to its permeability deterioration rate ranging from 20 to 100. This area can be regarded as the seepage recovery zone.
In the area between the seepage increased zone and the seepage recovery zone, the strata are only subject to tensile stress, and the permeability degradation rate usually ranges from 100 to 500. It is worth noting that the WSRS is a concept before coal mining, while the NWSRZ is only a concept after mining. Furthermore, the WSRS and NWSRZ interact with each other. The structural combinations and mechanical characteristics of WSRS determine the range of NWSRZ, while the impermeability (equivalent permeability coefficient) of NWSRZ can also reflect the water-resisting capability of WSRS. The NWSRZ is significant while evaluating the water-blocking ability of WSRS and thus should be taken into consideration.

4. Indicators and Membership Functions of WBCWSRS

The indicators affecting WBCWSRS are complex and fuzzy, showing good agreement with the characteristics of fuzzy mathematics. The fuzzy comprehensive evaluation method can solve many multi-leveled and complex problems, so as to achieve an overall evaluation of objects affected by many indicators. By using the membership function and obtaining the membership degree of each indictor, it can shift qualitative problems into quantitative ones. In this paper, AHPF was employed to develop a triple-leveled model on the premise of determining the influencing factors of WBCWSRS. In the AHP model, three factors were chosen as secondary indicators, i.e., the WSRS system, underground aquifer system and coal extraction system, while nine indicators—namely the types, integrity and vertical level of WSRS, the equivalent permeability of NWSRZ, the water richness, recharge and water table lowering of the underground aquifer as well as the mining methods and mining parameters—were determined as tertiary factors, as shown in Figure 5. The membership function of each indicator was constructed by means of analyzing the field measurement results and referring to previous researchers’ achievements, which will provide the basis for the prediction of the WBCWSRS.

4.1. WSRS System

4.1.1. Classification of WSRS (T)

According to the hardness, initial permeability, expansion rate and the combination characteristics of strata, the WSRS can be classified into four categories.
  • Type I WSRS: a single low-permeability, thick and soft strata. The permeability coefficient is usually less than 10−7 cm/s, and the Protodyakonov coefficient is generally less than 2. In contrast, it features good softening and swelling rate when soaked in water and good fissure self-healing properties. The lateral expansion rate is generally greater than 40%. This type of WSRS mainly uses its lithology to resist water seepage and thus realize WPCM.
  • Type II WSRS is usually a thick and hard stratum with high original permeability. Its initial permeability coefficient is generally greater than 10−4 cm/s, and there is no low-permeability soft rock formation, such as clay, loess, mudstone, etc., in this type of WSRS. It usually has poor lithological WBC, while it has high mechanical strength. The WSRS can still maintain its structural integrity under mining disturbances and has good WBC.
  • Type III WSRS is a composite stratum composed of soft and hard strata. The Protodyakonov coefficient of the hard rock layer is generally greater than 8. Although the permeability coefficient of hard strata is larger than that of soft rock layers, it can ameliorate the migration and breakage of the overlying strata and ensure that the WSRS maintains structural stability. This type of WSRS has the best WBC.
  • Type IV WSRS neither has soft rock formation nor hard rock with extremely high hardness. However, this type of stratum structure still has WBC to some extent.
The degree of difficulty in realizing WPCM of different types of WSRS is as follows: type IV > type II > type I > type III.
μ 1 a T = 1.0 , Type III WSRS 0.8 , Type I WSRS 0.6 , Type II WSRS 0.4 , Type IV WSRS 0 , Without WSRS ,

4.1.2. Vertical Level of WSRS (Hs)

It is assumed that the WSRS occurs directly in the lower part of the aquifer. According to the vertical level, the WSRS can be divided into three types. First, the high-level WSRS is from the top boundary of WCFZ to the overlying aquifer, i.e., the range of the traditional protection zone. Second, the spatial level of the medium-level WSRS is from the top boundary of the caved zone to that of WCFZ. Third, the elevation of the low-level WSRS is lower than the top boundary of the caving zone. The high-level WSRS, which is higher than the height of the WCFZ, can significantly withstand the downward water seepage from the overlying water body to the gob.
For moderate-level WSRS, the vertical level of the WSRS is less than the height of the WCFZ and greater than the height of the caving zone, and the water-conducting fractures penetrate the aquifer. At this time, if the fractures of the WSRS cannot be healed by swelling soaked in water and the overlying water can flow freely through the WSRS into the mined-out area, it will lead to water resource loss and water table lowering of the underground aquifer. If the mining-induced fractures in the WSRS are completely healed after encountering water expansion, there will be a short-term water seepage through the WSRS, and large-scale leakage or piping flow will not occur. The groundwater is only slowly infiltrated through the WSRS, and no water inrush hazards will occur. If the WSRS is less than the height of the caving zone, it will be completely destroyed under the action of drastic mining disturbances, resulting in water inrush and sand bursting. Under this circumstance, the groundwater flows into the goaf in a large scale, and broad water table lowering will occur. The WBCWSRS of the lowest vertical level of WSRS is also the lowest. Hence, the membership function of the vertical level of WSRS is:
μ 1 b H s = 1.0 , H s > H f 0.3 , H c H s H f 0 , H s < H c
where Hc is the height of the caving zone, m; Hf refers to the height of WCFZ in longwall cave mining, m; Hs denotes the vertical level of WSRS, m.

4.1.3. Equivalent Permeability of NWSRS (ke)

The equivalent permeability coefficient of the NWSRZ is an important index with which to evaluate the degree of water loss from the overlying aquifer. The smaller the equivalent permeability coefficient, the lower the risk of groundwater loss. During previous research on WPCM in the Yu-Shen mining area, the authors found that a type Ⅰ WSRS composed of a 12 m clay stratum can effectively prevent water infiltration from the overlying aquifer, while a clay formation with a thickness of 40 m can completely realize the seepage isolation of the overlying aquifer. Compared with clay, other rock strata, including sandstone, sandy mudstone, shale and mudstone, have a certain degree of weakening of WBC. The permeability coefficients of strata with various lithologies are listed in Table 1.
The equivalent permeability coefficient of the NWSRZ can be calculated according to Formula (3).
k e = H H 1 k 1 + H 2 k 2 + + H n k n = H i = 1 n H i k i ,
where ke denotes the equivalent permeability coefficient of the NWSRZ, cm/s; H is the thickness of the NWSRZ, m; Hi is the thickness of the i-th overlying stratum in NWSRZ, m; ki is the permeability coefficient of the i-th overlying stratum in NWSRZ, cm/s.
The time when the water in the overlying aquifer flows through the NWSRZ is H/ke. If H/ke > 12/kc, the NWSRZ is incapable of resisting water seepage. In contrast, when H/ke < 40/kc, it can completely withstand water seepage from the overlying water body. Therefore, the membership function of the equivalent coefficient ke of the NWSRZ is:
μ 1 c k e = 0 , H · k c / 12 > k e H · k c 12 k e / 28 k e , H · k c / 40 k e H · k c / 12 1 , H · k c / 40 < k e ,
where kc is the permeability coefficient of the clay layer, cm/s; ke is the equivalent permeability coefficient of the NWSRZ, cm/s.

4.1.4. Integrity of the WSRS (Si)

The integrity of the WSRS is a significant indicator for blocking the overlying groundwater flow and realizing WPCM. However, if the high-level WSRS located on both sides of the valley is eroded by the cutting effect, it contributes to the establishment of a hydraulic connection between the underground aquifer and the water in the valley. The water in the valley can leak laterally into the underlying strata of the WSRS, and the WSRS loses its capability of preventing water flow. Furthermore, the fault cuts the WSRS and destroys the integrity and continuity of the WSRS, and also provides a connected water diversion channel for groundwater to flow into the mined-out area. During coal extraction, the strategy of leaving the lateral coal pillars unmined can prevent the water leakage from the valley or overlying aquifers under the conditions of lateral cutting and faults. On the other hand, due to the uneven spatial distribution of coal measure strata, there is no WSRS in some areas. Due to the absence of WSRS, the water flow in longwall cave mining is inevitable.
μ 1 d S i = 0.0 , S i   =   Occurrence   loss 0.2 , S i   =   Fault   damage 0.5 , S i   =   Lateral   erosion 1.0 , S i   =   Intergral   occurrence ,

4.2. Underground Aquifer System

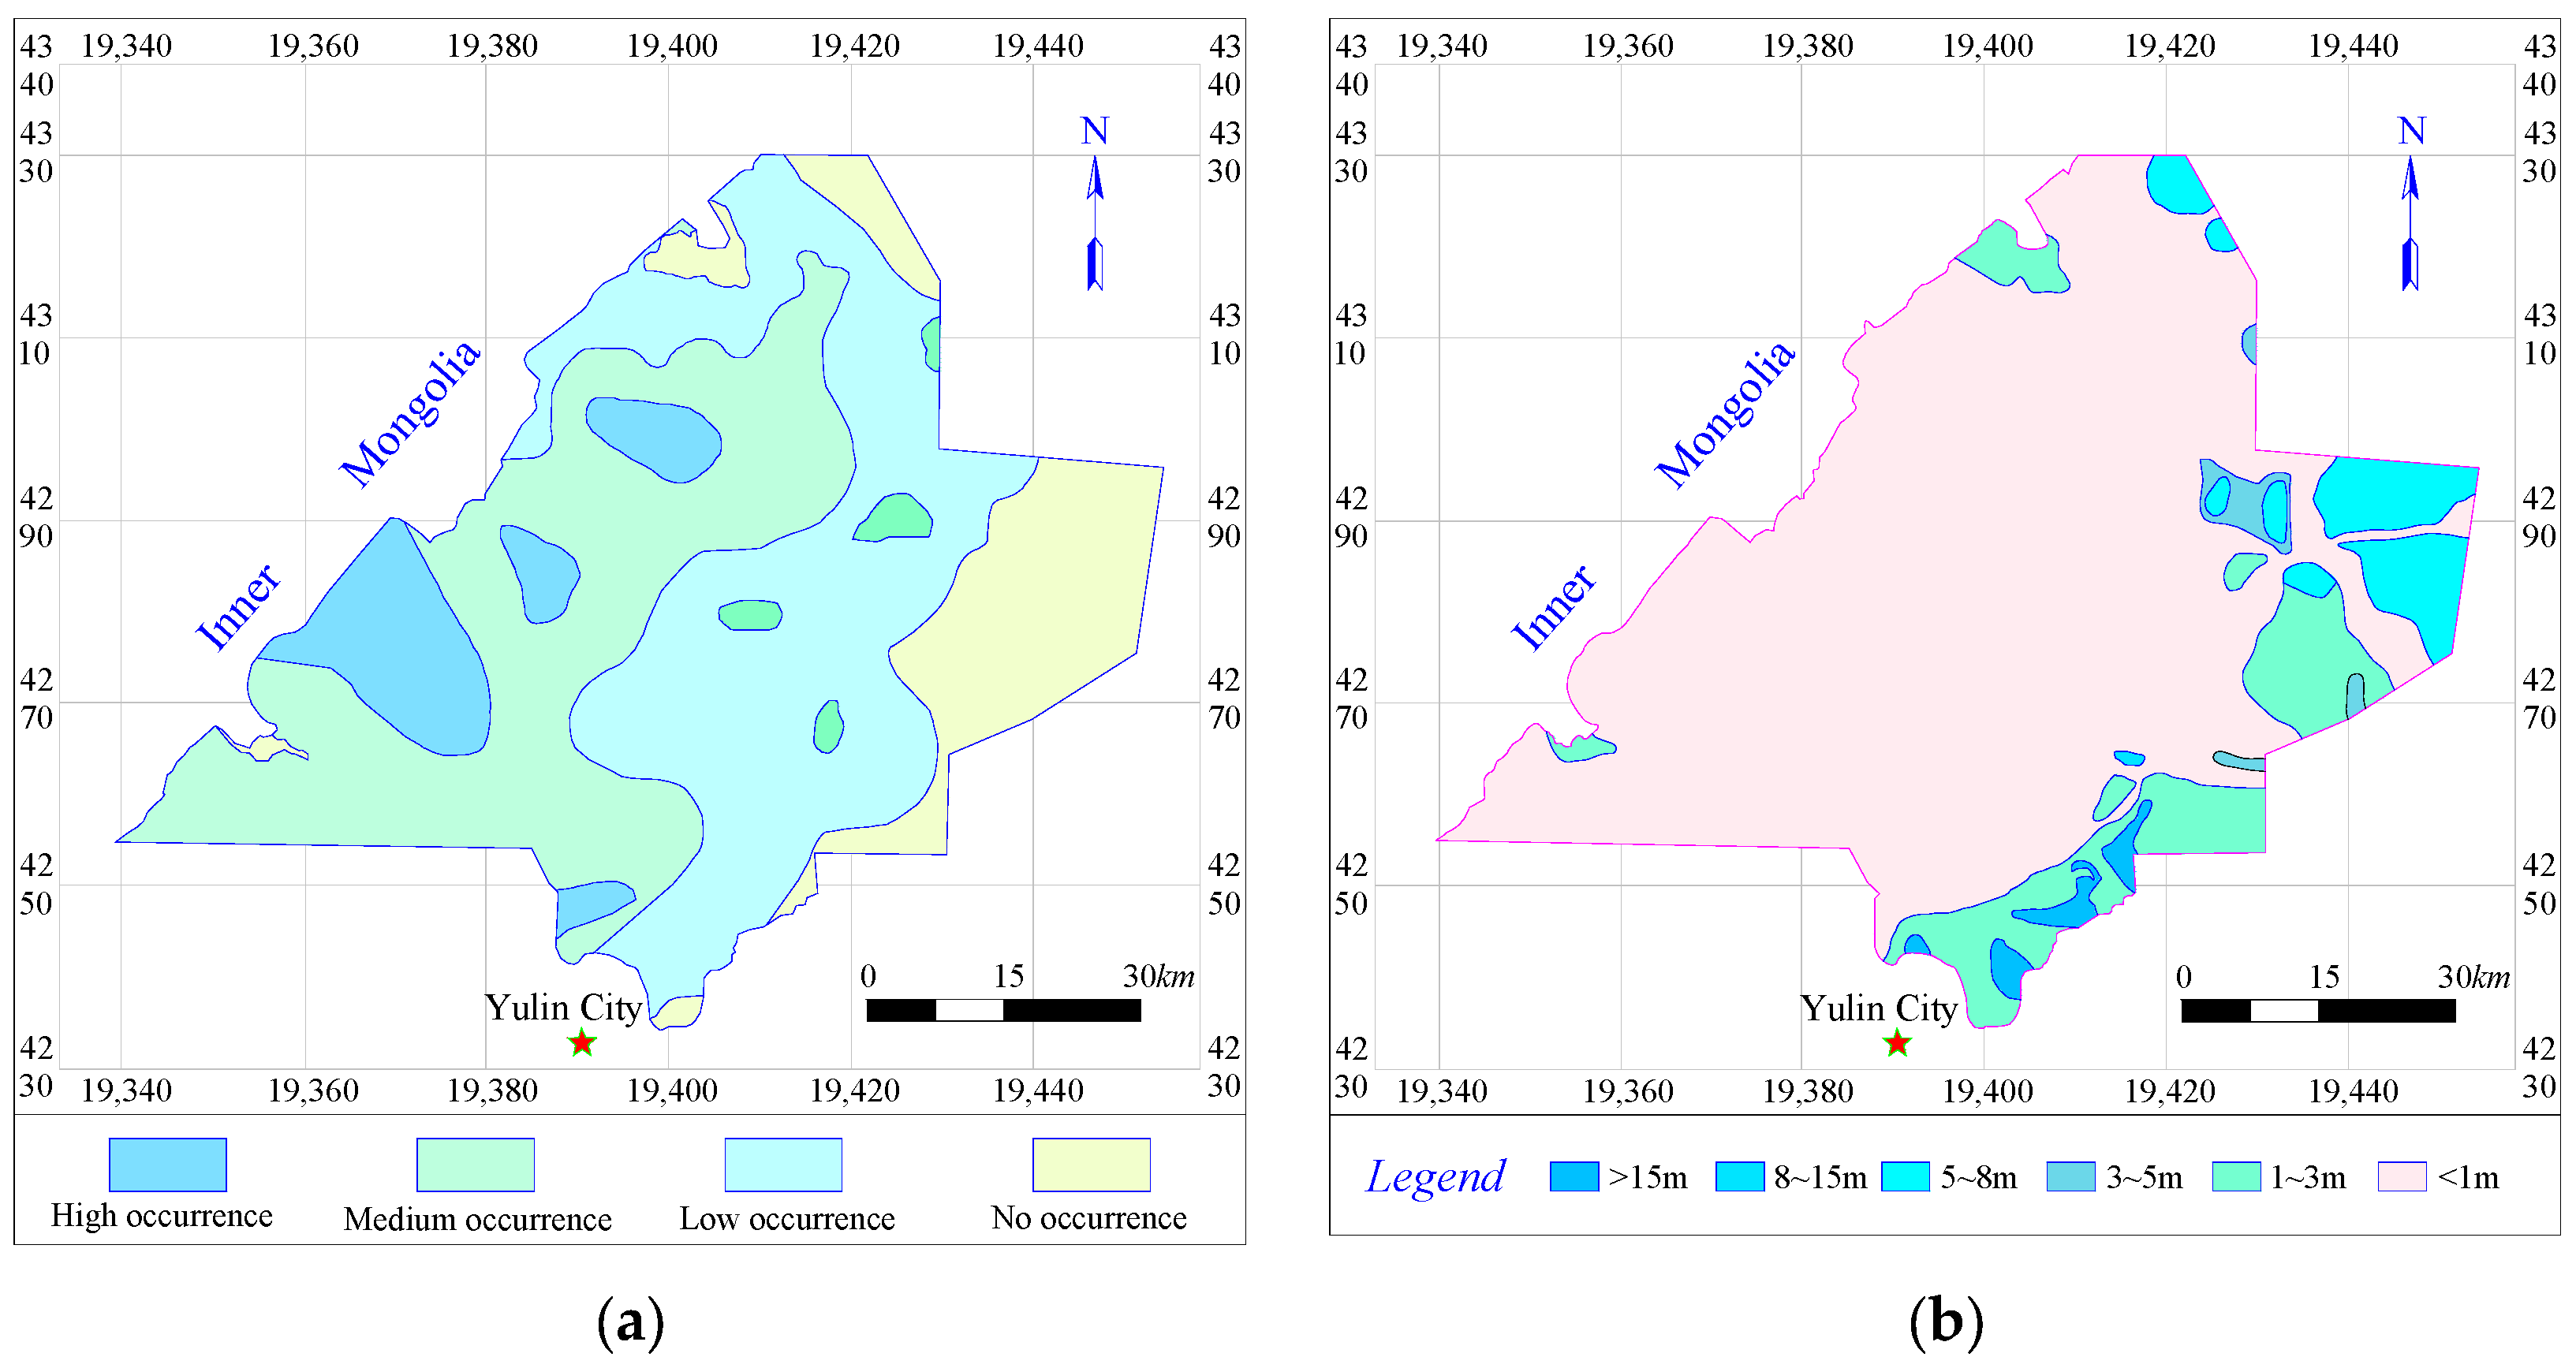
4.2.1. Water Yield Property (Aw)

The water richness of an aquifer has a positive correlation with its capability of being recharged and storing water. Meanwhile, the ability to recharge and store water of an aquifer increases with the ascending thickness and permeability. See Table 2 for the classification of the water abundance properties of underground aquifers. It is obvious that the higher the water richness, the lower the capability of the WSRS to prevent downward water seepage. The membership function of the water richness of an aquifer is:
μ 2 a A w = 1.0 , A w   =   Low 0.7 , A w   =   Medium 0.3 , A w   =   High ,

4.2.2. Water Table Lowering (Lc)

Arid and semi-arid areas are ecologically fragile, featuring sparse surface vegetation, water resource shortages and land desertification. The Quaternary Salawusu Formation aquifer is of great significance for both water demands for ecology and domestic use. The water level fluctuation of an underground aquifer is likely to cause the death of surface vegetation, which is not conducive to the realization of WPCM. The broader the decline in the water level, the weaker the WBCWSRS. The water table lowering after coal extraction is selected as the evaluation index.
μ 2 b L c = 1.0 , L c 1.0 0.7 , 1.0 < L c < 3.0 0.3 , 3.0 < L c < 5.0 0.0 , L c 5.0   ,

4.2.3. Recharge of Underground Aquifer (α)

The majority of the underground aquifers in Northwest China are primarily recharged by precipitation, followed by lateral flow and irrigation infiltration. The greater the rainfall infiltration capacity, the more difficult it is for the WSRS to block water seepage. The precipitation recharge coefficient is selected as the evaluation standard:
μ 2 c α = 1 , α < 0.1 4 10 α / 3 , 0.1 α 0.4 0 , α > 0.4 ,

4.3. Coal Extraction System

4.3.1. Coal Mining Method (Mm)

Different mining methods exert various mining disturbances on the overburden, and the development of water-flowing fissures varies. Hence, the influence on the ratio of the permeability deterioration of the WSRS also varies. Longwall cave mining can only be employed under the condition of the coal–water spacing being far greater than the height of the WCFZ and thus the WBC of NWSRZ being great enough. WPCM mining methods are essential for coal extraction under close water bodies. It mainly includes partial mining, coordinated mining and backfill mining. The partial mining methods are primarily height-restricted mining, strip mining, narrow strip mining, room and pillar mining, etc. These methods tend to leave part of the coal resources unextracted to support the roof, so as to ameliorate the migration, fracture development and permeability deterioration of the overburden. In this context, the WBCWSRS can be maintained and the WPCM is easy to achieve. However, the recovery rates of these partial mining methods are generally lower than 40% since they abandon a large amount of the coal resources by means of leaving permanent coal pillars to support the roof, which is a serious waste of resources. In addition, harmonic mining involves primarily the optimization of the working face layout and slice mining. The former optimizes the arrangement, mining sequence, mining direction and mining time of multiple adjacent mining faces to counteract overburden deformation to some extent. This method has a large mining range and tends to be restricted by the positions of surface buildings and structures. Backfill mining is currently the most effective method to mitigate the movement of the overburden and maintain the stability of WBCWSRS. Therefore, the membership function of the mining method is:
μ 3 a M m = 1.0 ,   M m = Backfill   mining 0.8 ,   M m = Partial   mining 0.5 ,   M m = Harmonic   mining   0.3 ,   M m = Longwall   mining   ,

4.3.2. Mining Parameters (P)

Mining parameters are primarily the mining height, advancing speed, as well as the length and advancing length of the working face. Various mining parameters lead to different degrees of mining disturbance in the overburden. Hence, the development of mining-induced fissures and the permeability deterioration degree of the overburden also vary. If the ratio of permeability deterioration of the WSRS is greater than the critical value, the water in the aquifer will flow into the goaf through the WSRS, resulting in water inrush accidents. At this time, the WSRS is in an unstable state and the WBCWSRS is nearly equal to 0.
During the process of field investigation, the authors found that when the length of the working face is less than 100 m, the damage and permeability deterioration of the overburden can be ameliorated to a large extent. In contrast, the overlying strata above the mining face whose length is greater than 300 m suffer from drastic mining disturbances and tend to break easily, giving rise to the decline of the WBCWSRS. Additionally, the authors have previously studied the relationship between the advancing speed of the working face and the changing law of the water level. We found that the water table drops sharply when the speed is less than 3 m/d, whereas, when it varies between 3 and 10 m/d, the rate of water table lowering decreases significantly. When the advancing speed is greater than 15 m/d, the effect of the advancing speed on the water level fluctuation is no longer obvious. Moreover, if the buried depth of the coal seam is shallower than 100 m, the WSRS is easily damaged since the coal–water spacing is small. In contrast, when it is deeper than 800 m, the deep buried depth with high in situ stress is likely to cause the horizontal unloading of the WSRS, contributing to the propagation of fractures and the aggravation of the permeability deterioration of the WSRS. Meanwhile, horizontal unloading occurs in a small range, and its influence on the crack propagation of the WSRS is thus restricted. Therefore, the multivariate membership function of the mining parameters is:
μ 3 b ( P ) = 0.055 0.02771 x 1 + 0.0155 x 2 + 0.002007 x 3 + 0.00023 x 4 ,
where x1 is the mining height, m; x2 is the advancing speed, m/d; x3 and x4 is the length and advancing length of the working face, respectively, m.

5. Mathematical Modeling and Weight Determination of WBCWSRS

5.1. Establishment of Mathematical Evaluation Model for WBCWSRS

The WBCWSRS is characterized by great fuzziness, many uncertain factors and dynamic evaluation. AHPF is a method that applies the principle of fuzzy transformation and relationship synthesis to comprehensively analyze and evaluate the grade of the objects restricted by multiple indicators. The boundaries and extensions of the influencing factors do not have precise affirmation and negation since they have a certain degree of fuzziness. AHPF can effectively combine qualitative description with quantitative analysis, and use a fuzzy algorithm to quantitatively synthesize the nonlinear evaluation to obtain the results of quantitative evaluation. Therefore, it is employed to evaluate the WBCWSRS. Six factors and nine sub-factors are determined. In the AHP model, A refers to the overall target, B represents the level of criteria and C denotes the level of sub-criteria.
The judgment matrix is constructed by using this hierarchy to quantify the WBCWSRS. The influencing indicators are as follows:
U = {u1, u2, u3},
It is assumed that the fuzzy subset V refers to the discourse domain of WBCWSRS. The compression evaluation value Φ, which suggests the grade of WBCWSRS, is the membership degree of U in V. The fuzzy subset V can be expressed as follows:
V = {I, II, III, IV, V},
The value of Φ can be determined using the following equation:
Φ = i = 1 n w i u i ( u i ) ,
where wi denotes the weight of the i-th indicator and ui(ui) represents the membership degree of the i-th index.
The WBCWSRS can be classified into five grades, namely very high, high, moderate, low and extremely low, as listed in Table 3. Then, the grade of WBCWSRS will be determined by calculating the value of Φ and referring to the standard in Table 3.

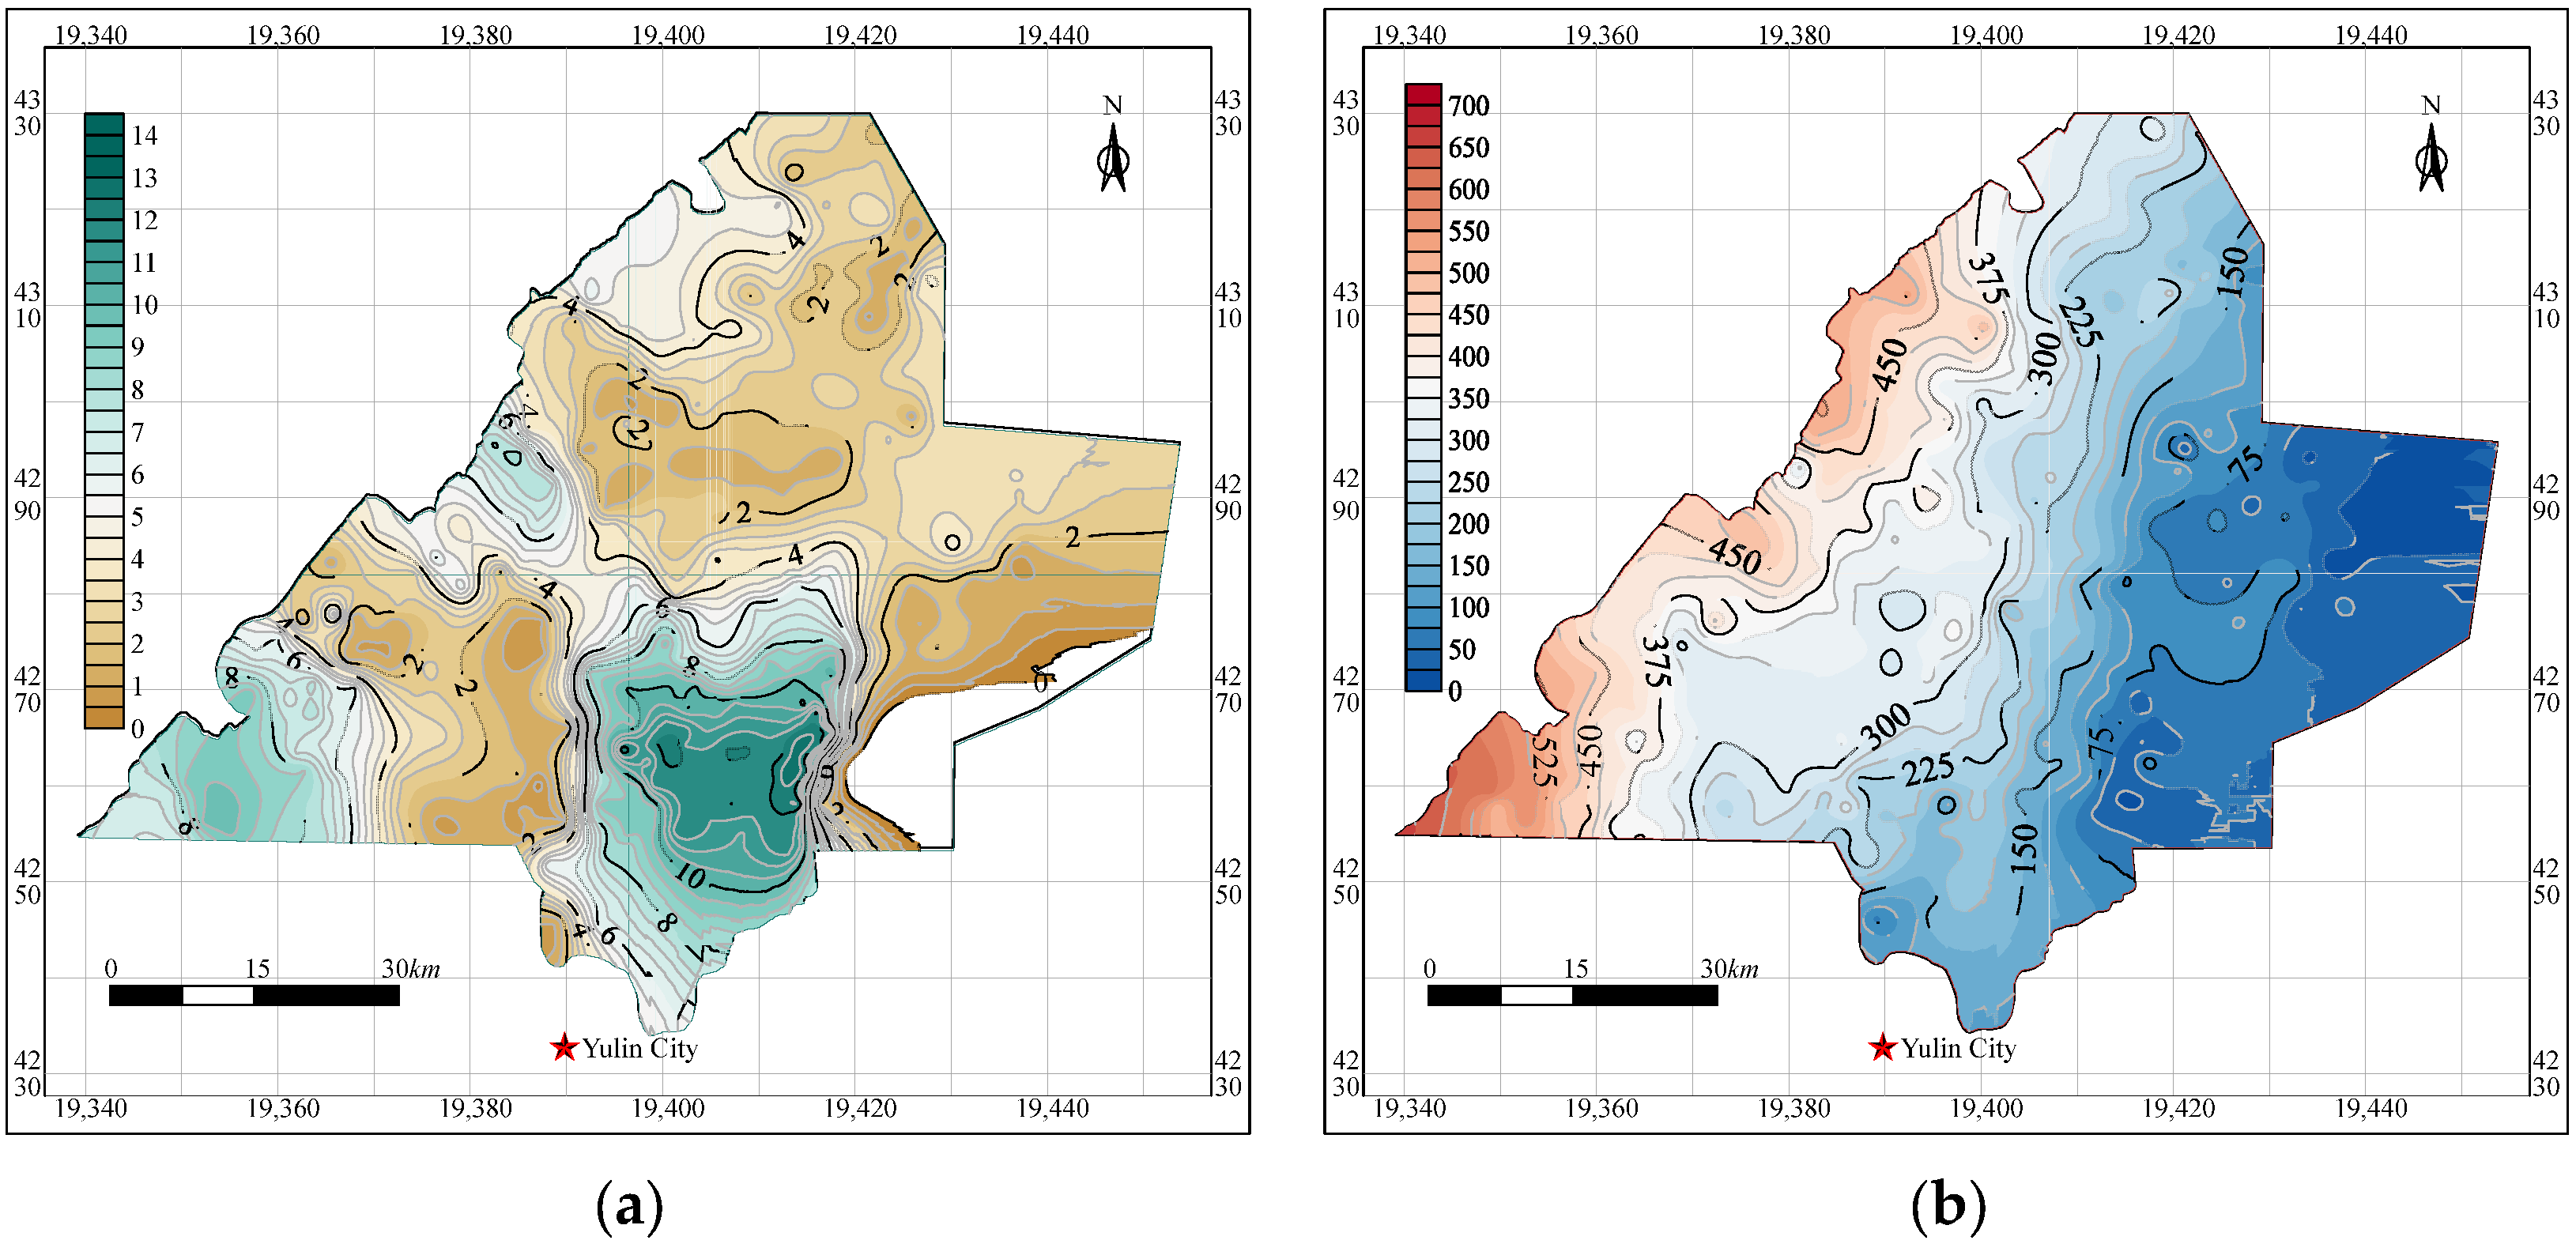
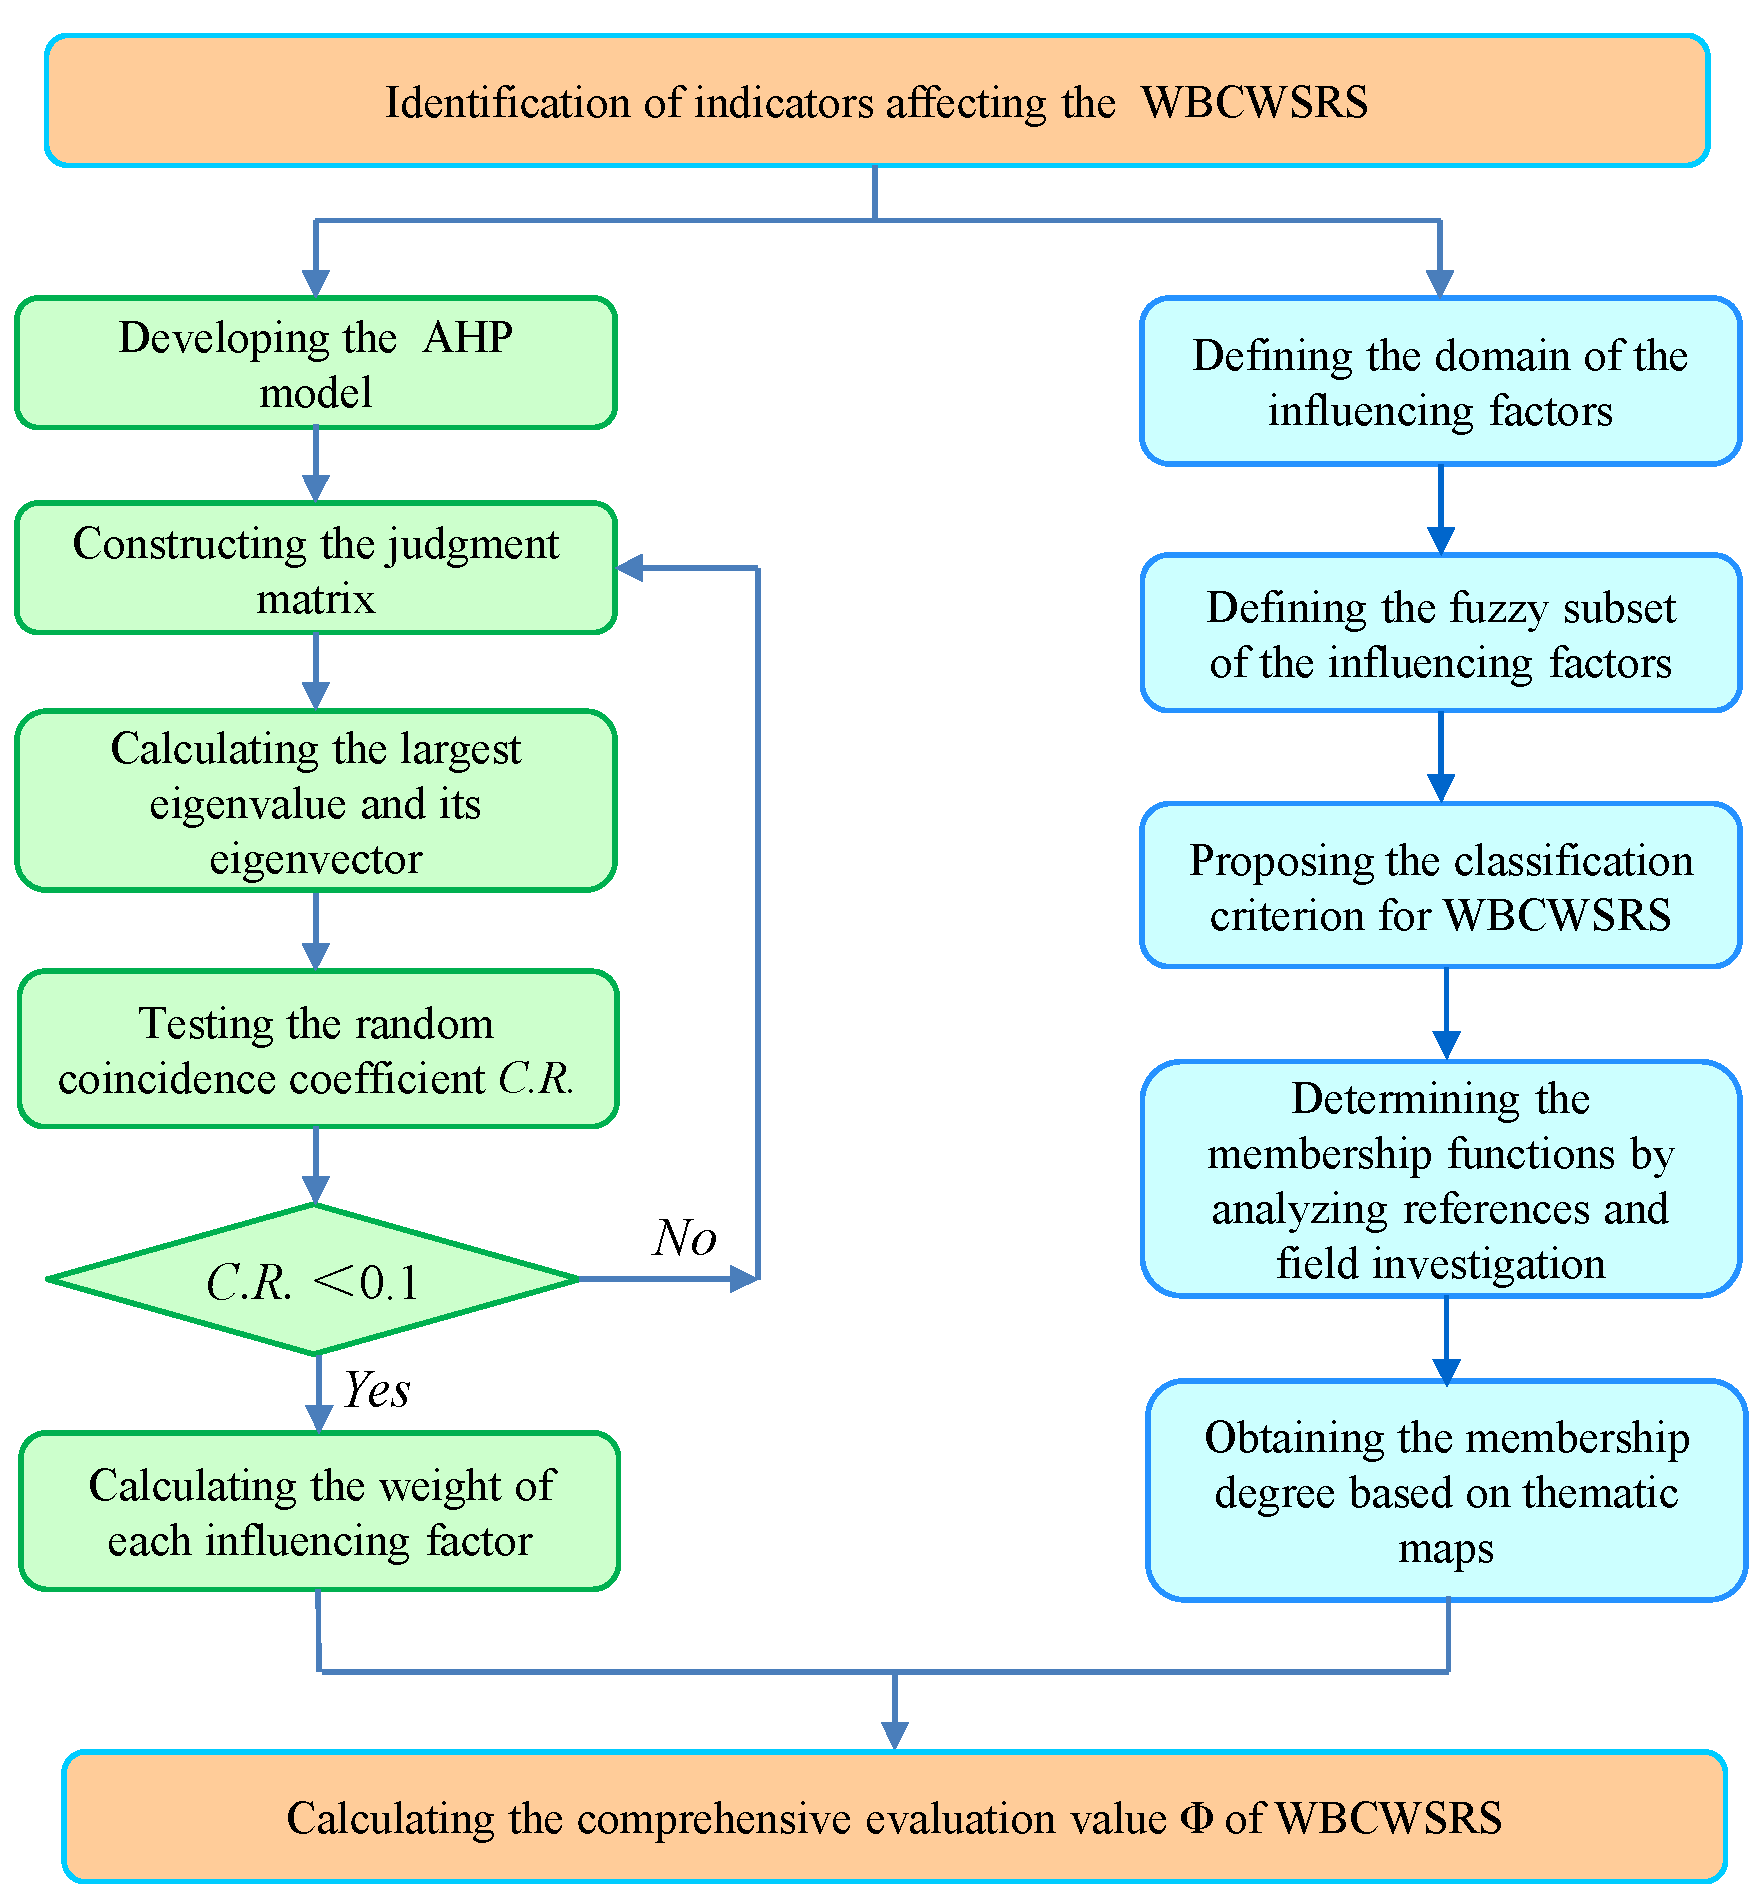
5.2. Weight Distribution of Indicators of WBCWSRS

Scholars and experts occupied in WPCM, the prediction of WCFZ and the evaluation of water inrush were invited to assess the relative importance among the indicators of WBCWSRS in the AHP model. rij is a positive integer from 1 to 9 and its reciprocal, and indicates the relative importance of the i-th indicator relative to the j-th one. The judgment matrix is a positive and negative matrix and can be expressed as:
R = r i j n × n = 1 r 12 r 1 n 1 / r 12 1 r 2 n 1 / r 1 n 1 / r 2 n 1 ,
The following judgment matrixes are determined on the basis of feedback from the experts:
R A ~ B = 1 3 3 1 / 3 1 3 / 2 1 / 2 2 / 3 1   R B 1 ~ C = 1 1 / 2 1 / 3 1 2 1 2 / 3 2 3 3 / 2 1 3 1 2 / 3 1 / 3 1   R B 2 ~ C = 1 2 4 1 / 2 1 2 1 / 4 1 / 2 1   R B 3 ~ C = 1 3 1 / 3 1
Taking the relative weight calculation of sub-factors of the WSRS system, for instance, the judgment matrix R B 1 ~ C is as follows:
R B 1 ~ C = 1 1 / 2 1 / 3 1 2 1 2 / 3 2 3 3 / 2 1 3 1 2 / 3 1 / 3 1
Step 1: The largest eigenvalue and corresponding eigenvector calculation.
  • Calculate the product Mi of each row indicator of the judgment matrix:
M i = j = 1 n r i j i , j = 1 , 2 , n ,
2.
Calculate the n-th power root of Mi and obtain Vi:
V i = M i n ,
3.
Normalize Vi:
W i = V i / V i ,
4.
The obtained Wi is the eigenvector of the judgment matrix:
W i = W 1 , W 2 , , W n   ,
5.
Calculate the maximum eigenvalue λmax of the matrix R B 1 ~ C :
λ max = 1 n i = 1 n R W i W i ,
The largest eigenvalue λmax of the matrix R B 1 ~ C is 4.0817 and the corresponding eigenvector W = (0.1413, 0.2830, 0.4240, 0.1517).
Step 2: The consistency test of the judgment matrix R B 1 ~ C .
Formulas (20) and (21) were utilized to implement the consistency test:
C . I . = λ max n / n 1 ,
C . R . = C . I . / R . I . ,
where C.I. denotes the consistency indicator; C.R. refers to the consistency ratio; R.I. represents the average consistency index; λmax is the largest eigenvalue; n refers to the number of indexes of the matrix R B 1 ~ C .
The relative weights of every two indexes should be redistributed and the matrix should be reconstructed under the condition that C.R. ≥ 0.1. Otherwise, the weight distribution is acceptable and reasonable. The C.R. of the matrix R B 1 ~ C is 0.031 < 0.1, suggesting that the relative weight distribution is reasonable. The sort vector W of the matrix is obtained and the weight of the WSRS system is 0.5502. Therefore, the weight distribution of the matrix R B 1 ~ C can be obtained by calculating 0.5502 × W = (0.0777, 0.1557, 0.2333, 0.0835).
In order to make the weight distribution as reasonable as possible, many well-known and pioneering experts and scholars engaged in WPCM and mining-induced overburden permeability deterioration were invited to evaluate the relative weights of every two influencing factors in each judgment matrix of the AHP model. The consistency test results and the final mean value of the weight of each influencing factor are listed in Table 4 and Table 5, respectively.
As Table 5 shows, the weight of the WSRS system is greater than that of the underground aquifer system and coal mining system. The equivalent permeability of NWSRZ is more important than the other three influencing factors of the WSRS system. Among the underground aquifer system, water richness has the greatest impact, followed by water table lowering and recharge. In the category of the coal extraction system, the impact of the coal extraction method on WBCWSRS is much greater than that of the mining parameters.

6. Generalization and Application of the Evaluation Model

6.1. Membership Degree Determination of the Indictors

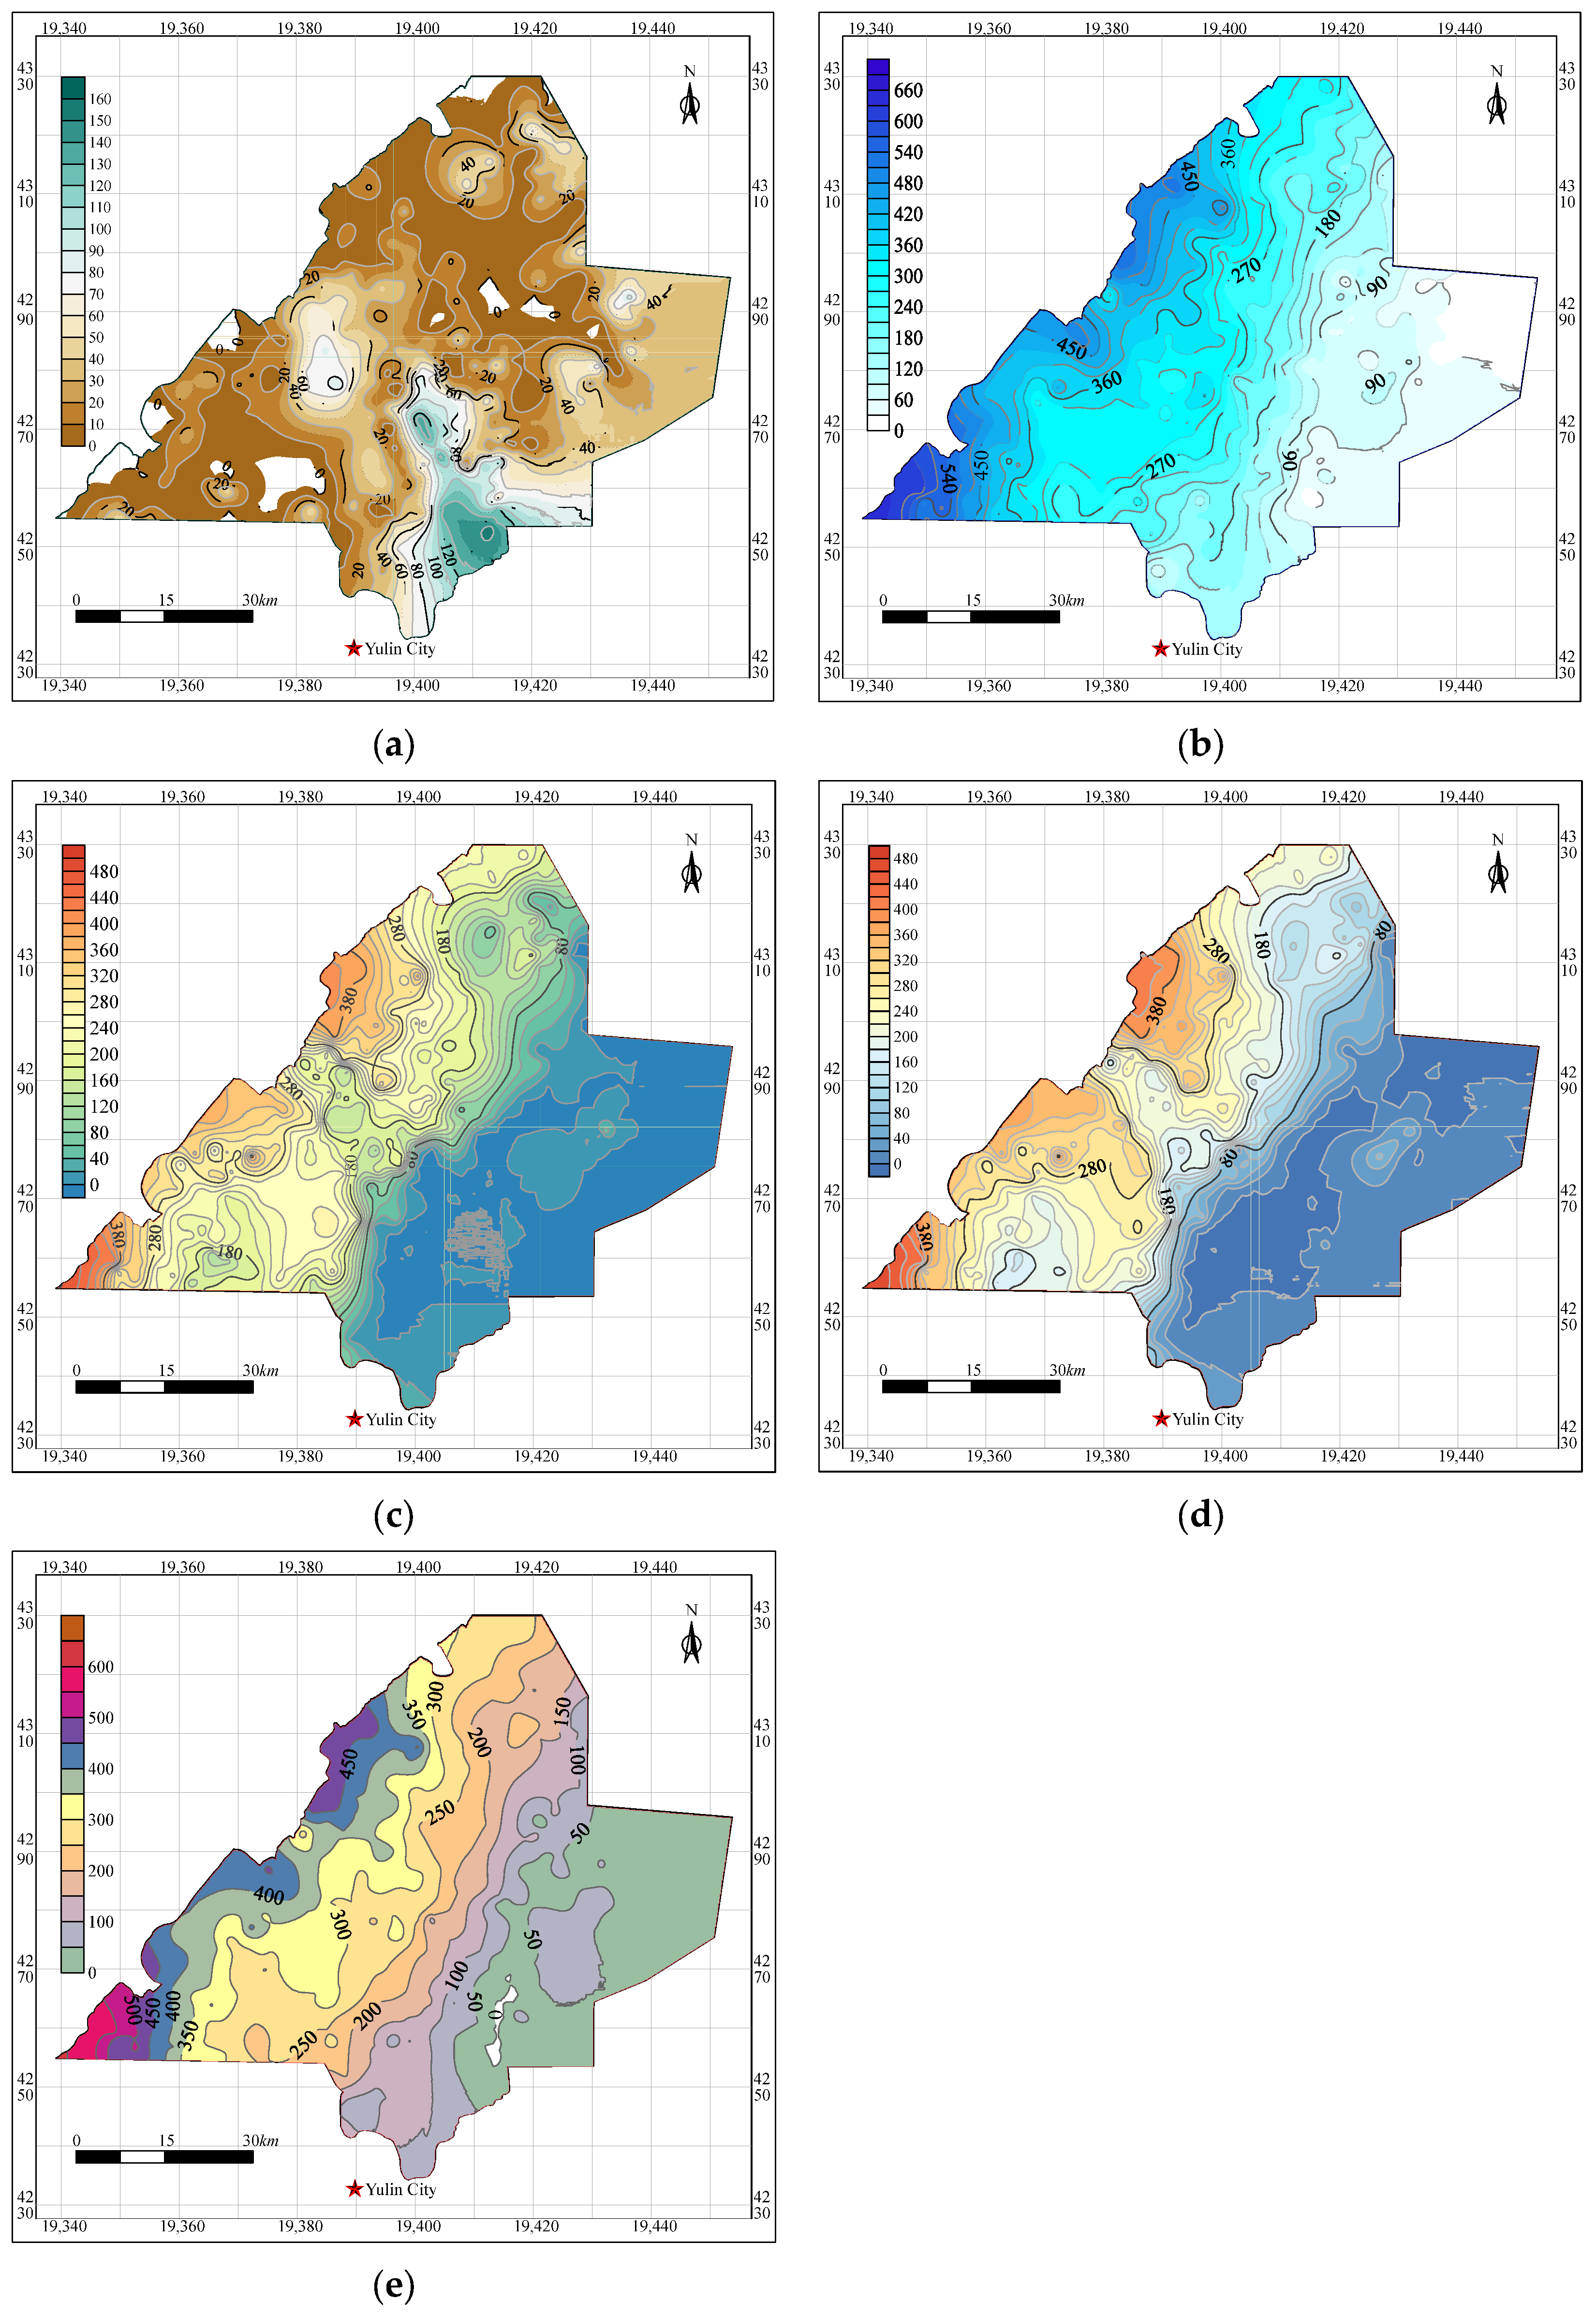
6.1.1. Thematic Maps of Indicators of WSRS System
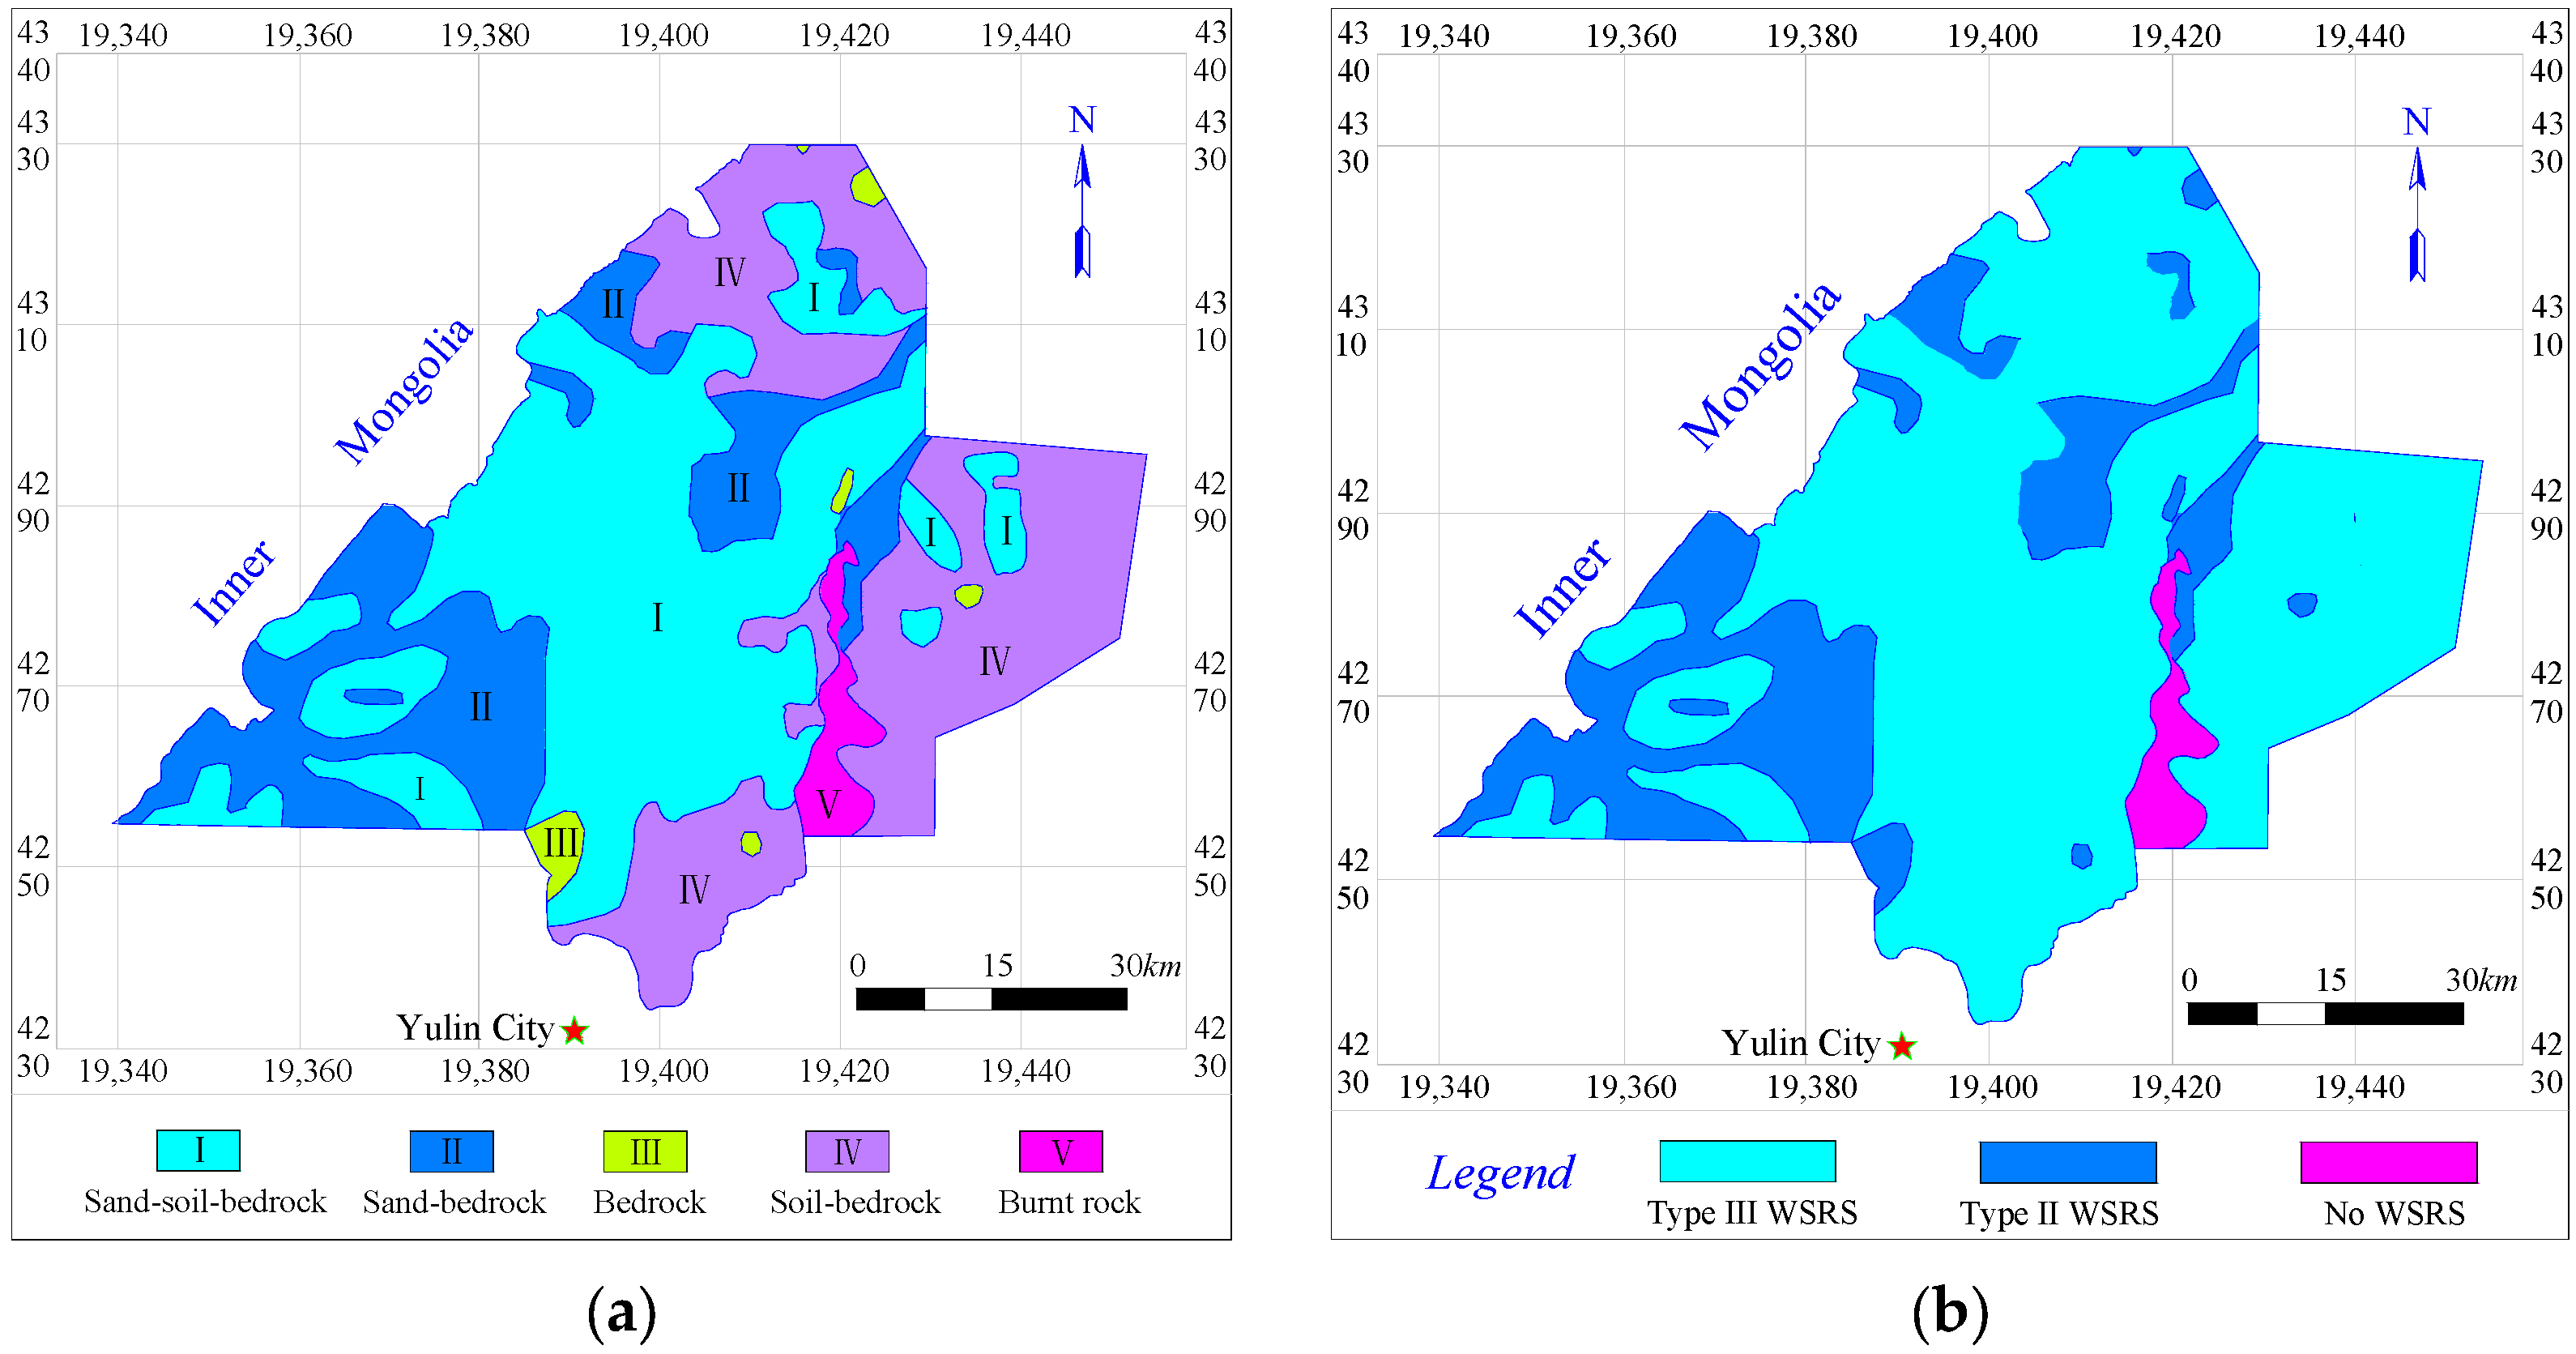
Types of WSRS

According to the spatial level and the combination relationship of the overlying strata with various lithologies, the authors divided the stratigraphic structure in the Yu-Shen coal area into five types, i.e., sand–soil–bedrock (I), sand–bedrock (II), bedrock (III), soil–bedrock (IV) and burnt rock (V). The geological profile is illustrated in Figure 6. The overlying layers of sand–soil–bedrock refer to a lithologic structure composed of sand, water-resisting soil and bedrock. In addition, the soil–bedrock overburden consists of a waterproof soil layer and bedrock. The impermeable soil layer is primarily the loess from the Lishi Formation and the clay from the Baode Formation. Due to the occurrence of the higher soil layer and lower bedrock, these two types of stratigraphic structures belong to type Ⅲ WSRS, which is composed of soft rock and hard rock. As it bears no water, water preservation is not taken into account in the area with a soil–bedrock structure. The overburden of the bedrock is composed of bedrock only and it is exposed to the Earth’s surface directly. It is unnecessary to consider water conservation here due to the extremely low water yield property of the porous bedrock-confined aquifer. The overburden of sand–bedrock is composed of sand and bedrock, and the phreatic aquifer occurs directly over the bedrock, without a continuous clay aquifuge separating them. Meanwhile, the bedrock above the coal-bearing strata is thick enough, indicating this structure is the key area for WPCM. These two types of stratigraphic structure belong to class Ⅱ WSRS, which has the structural hard rock only.
The burnt rock overburden, formed by the spontaneous combustion of coal seams, is completely broken, with high initial porosity. The mining-induced water-conducting fractures reach the surface directly and the permeability deterioration is extremely serious. The longwall cave mining directly leads to water and sand inrush in the working face. It belongs to the area where there is no WSRS occurring and hence is the key WPCM area. The distribution of different stratigraphic structures in the Yu-Shen mining area is shown in Figure 7a, and the zoning map of the types of WSRS is shown in Figure 7b.

Vertical Level of WSRS

Several collieries, such as Hanglaiwan, Jinjitan and Yuyang et al., in the Yu-Shen mining area have obtained the height of the caved zone and WCFZ by field measurement under longwall cave mining. However, the mining height of these mines is less than 5 m, and the maximum height of the coal seams in this area can reach 12 m. Therefore, based on the comprehensive geological histogram and field measured data of this coal mine, the Universal Distinct Element Code (UDEC) software is employed to simulate the height of the caving zone and WCFZ under various stratigraphic structures and mining heights. The parameters of the numerical model are continuously optimized until the results are consistent with those from field measurement. The fracture distribution under longwall cave mining is shown in Figure 8.
Subsequently, the prediction formula of the height of the caving zone and the WCFZ under longwall cave mining is obtained, by comprehensively analyzing the results from numerical simulation and field measurement. It is noted that, for the overburden of burnt rock, the mining depth is generally shallower than 150 m, and the mining-induced water-conducting fractures will immediately develop and reach the surface following the coal extraction. Therefore, it is unnecessary to conduct numerical simulation under this stratigraphic structure.
H c = 100 M 0.6 M + 14.1 ,
H f = 21.75 M + 28.28 R 2 = 0.99 ( Sand soil bedrock ) H f = 22.20 M + 37.13 R 2 = 0.97 ( Sand bedrock ) H f = 16.70 M + 30.80 R 2 = 0.97 ( Bedrock ) H f = 21.97 M + 28.42 R 2 = 0.98 ( Soil bedrock ) ,
where Hc refers to the height of the caved zone, m; Hf denotes the height of WCFZ, m; M is the mining height, m.
In addition, based on the measured data of fracture development under narrow strip mining in the Yubujie colliery, the UDEC numerical calculation software is also employed to obtain the distribution law of fissures, as shown in Figure 9.
Single-factor regression analysis on the sensitivity of the mining height, width of extracted and unextracted strips, hard rock lithology ratio (stratigraphic structure) and mining depth to the height of WCFZ was carried out. Then, a formula for predicting the height of WCFZ under narrow strip mining was obtained by using the multiple linear regression method as well as SPSS Statistics 22 software.
H d = 5.60 M + 0.013 H + 17.86 R h + 29.02 ln w m 2.68 w p 61.6 R 2 = 0 . 92 ,
where Hd denotes the height of WCFZ in narrow strip mining, m; M is the mining height, m; H is the mining depth, m; Rh represents the hard rock lithology ratio; wm is the width of the extracted strip, m; wp is the span of the unextracted strip, m.
Based on the thickness of the first-mined coal seam and the overburden lithology of 400 boreholes in the Yu-Shen mining area, the height of the caving zone and WCFZ of each borehole in longwall cave mining, as well as the height of the WCFZ in narrow strip mining, are calculated. The Kriging interpolation method is employed to plot thematic contour maps, as shown in Figure 10. On this basis, the membership degree of the vertical level of WSRS in longwall cave mining and narrow strip mining can be determined.

Equivalent Permeability Coefficient of the NWSRZ

(1) Determination of the range of NWSRZ.
The type I WSRS in the Yu-Shen mining area is mainly composed of loess in the Lishi Formation and red soil in the Pliocene Baode Formation. The lithology of Lishi loess is dominated by grayish yellow sandy soil, silty clay and loam. Its maximum thickness can reach up to 110 m, with an average of 23 m. The red clay from the Baode Formation is brownish red clay and loam and it is 30 m thick on average. According to the data of 400 boreholes in the Yu-Shen mining area, the contour map of the thickness of the type I WSRS is as shown in Figure 11a. The contour map of the distance from the first-mined coal seam and the overlying aquifer is shown in Figure 11b. Because the permeability of bedrock (type Ⅱ WSRS) is far larger than that of type I WSRS, it is necessary to separately determine the thickness of type I WSRS and type Ⅱ WSRS in the process of calculating the equivalent permeability of the NWSRZ. The thickness of the bedrock can be obtained by subtracting the thickness of type I WSRS from the distance between the first-mined coal seam and the aquifer, as shown in Figure 11c. The thickness of NWSRZ is obtained by subtracting the height of WCFZ from the distance between coal seam and aquifer. Combining the contour map of the height of WCFZ of longwall cave mining and narrow strip mining shown in Figure 10b,c, the contour maps of the thickness of NWSRZ under the two mining methods are obtained, as shown in Figure 11d,e.
(2) Calculation of the equivalent permeability coefficient of the NWSRZ.
The initial permeability coefficients of various lithologic strata listed in Table 1 and the mining-induced permeability deterioration of strata (k/k0) in the NWSRZ were comprehensively considered. The equivalent permeability coefficient of the NWSRZ under backfill mining, narrow strip mining, slice mining and longwall cave mining was calculated by using Equation (3). The Kriging method was then employed to draw the contour map of the equivalent permeability coefficient of the NWSRZ under the four mining methods, as shown in Figure 12.
When the height of WCFZ is less than the thickness of bedrock, the NWSRZ consists of bedrock and type I WSRS. If it is greater than the height of bedrock but less than the upper interface of the type I WSRS, the NWSRZ is only partially composed of type I WSRS. However, if the water-conducting fractures develop to the Salawusu Formation aquifer above the type I WSRS, the NWSRZ does not exist. It is worth noting that in the process of plotting, the thickness of bedrock and type I WSRS varies widely, since the characteristics of the stratigraphic structures in diverse areas in mining area are various. There is no NWSRZ in the northeast and south boundary areas of the mining area, namely the unfilled and blank parts in Figure 12.

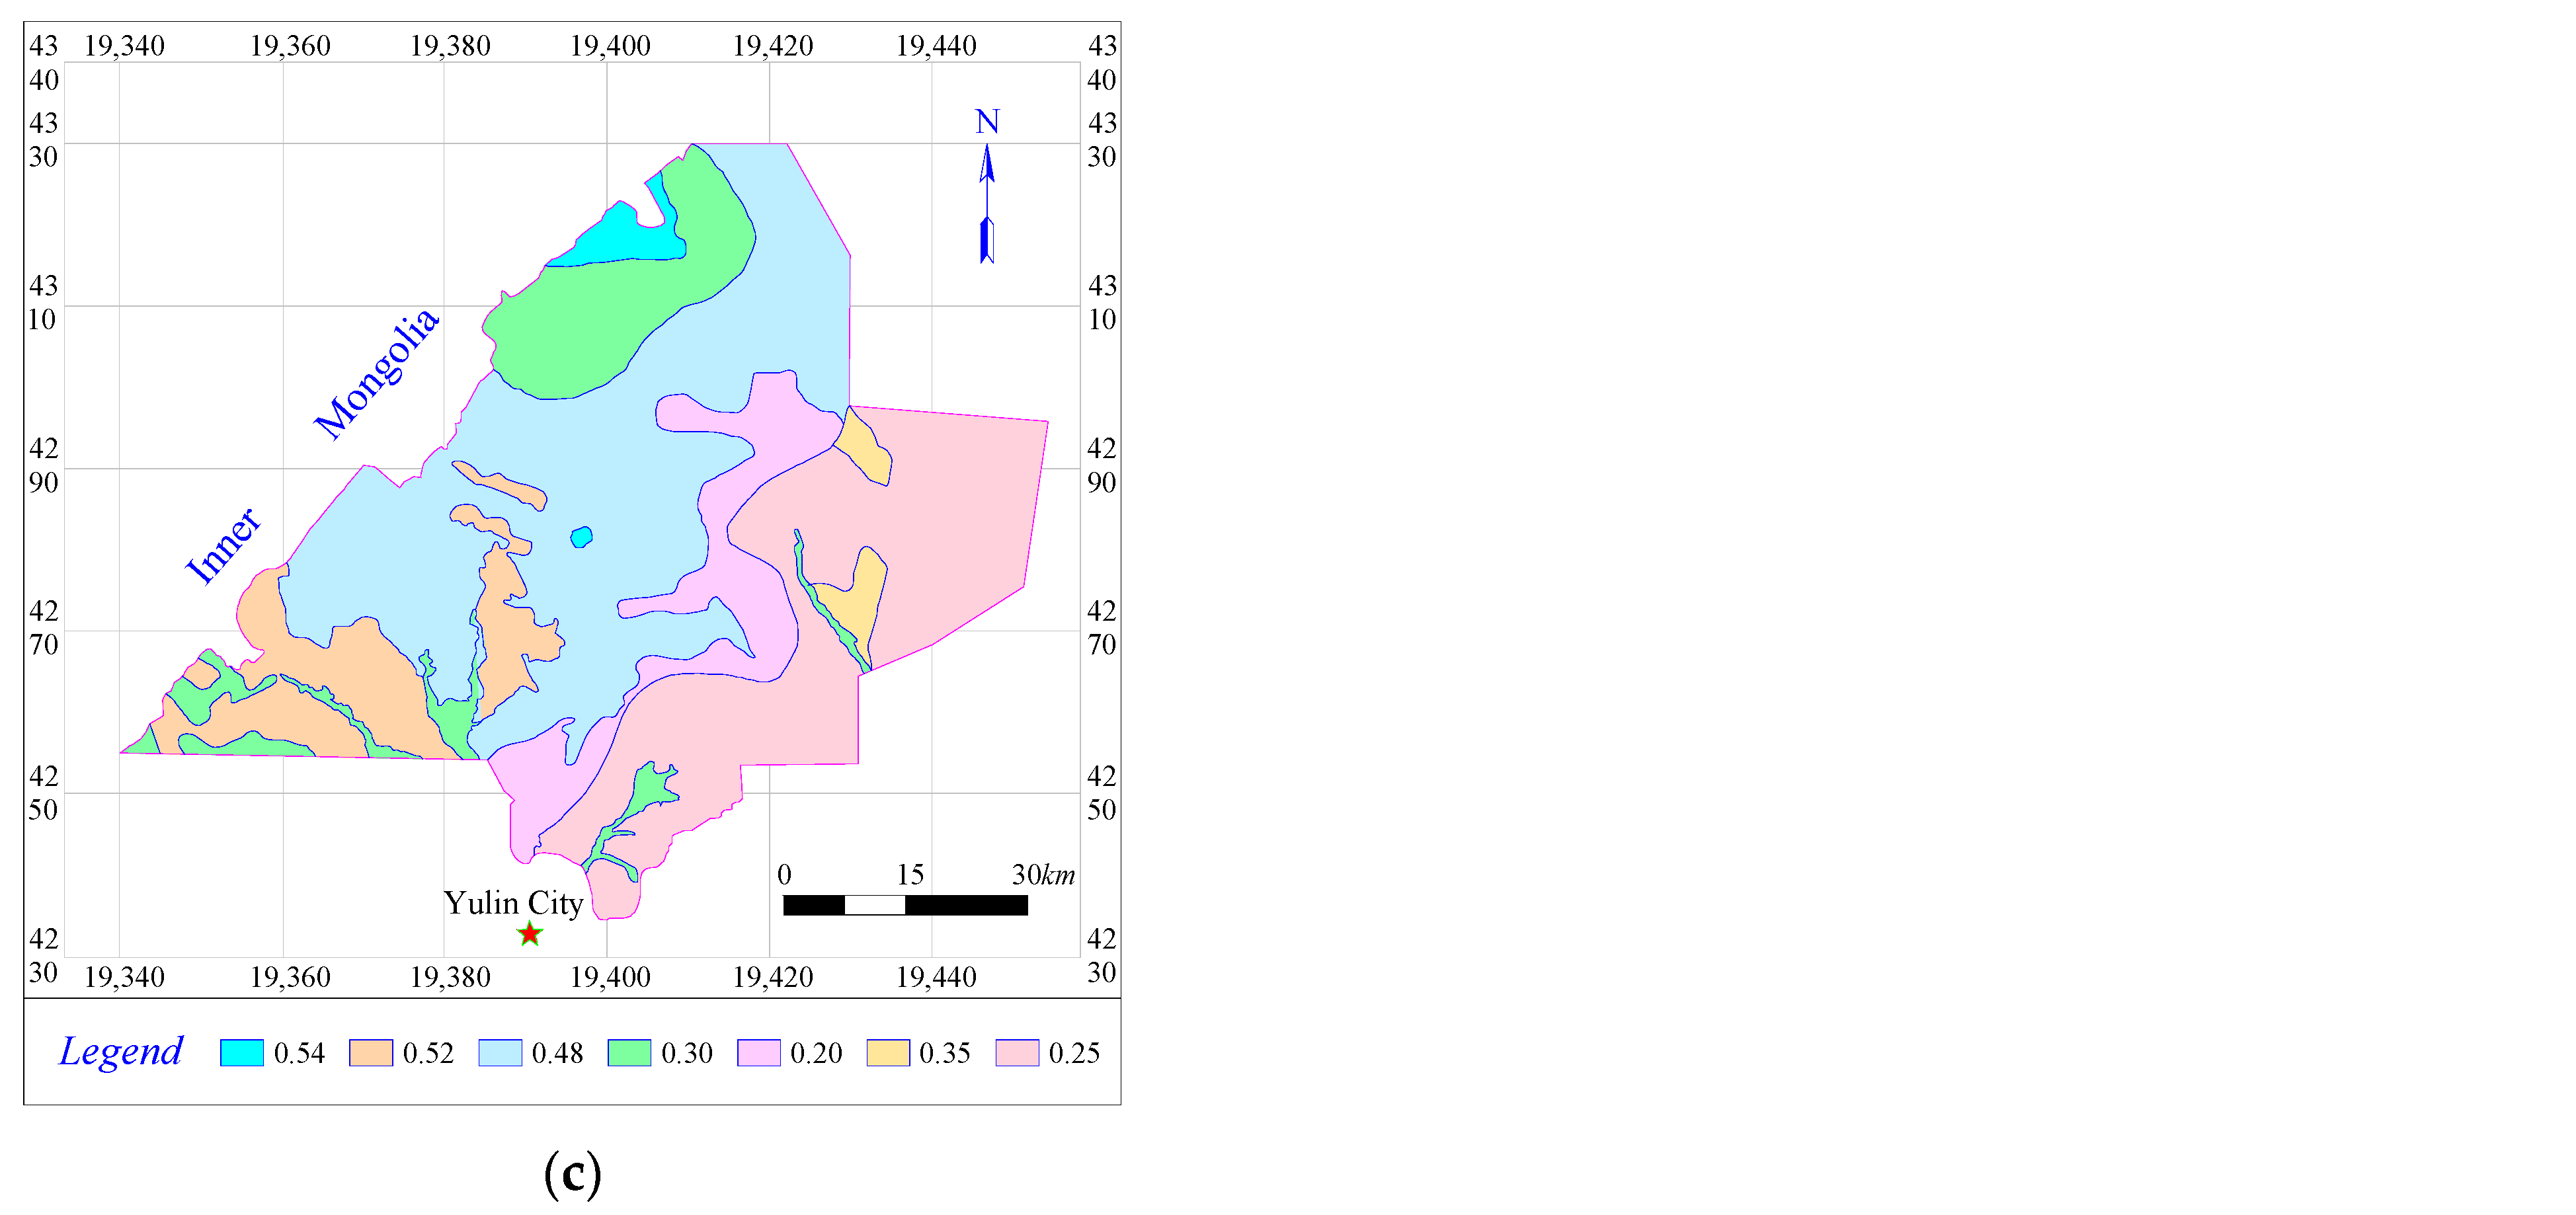
6.1.2. Thematic Maps of Indicators of Underground Aquifer System

As the primary supply source for domestic water use and surface vegetation water use, the Salawusu Formation aquifer is of great significance for the local residents and ecological environment of the study area. It is the main aquifer that should be taken into account in the process of WPCM in the Yu-Shen mining area. This aquifer is widely distributed in the mining area and its lithology is dominated by medium sandstone, siltstone and fine sandstone. The total high-yield area of the aquifer is more than 500 km2, while both the medium- and low-yield regions cover a total area of more than 1900 km2, as illustrated in Figure 13a. Furthermore, the groundwater level in the majority of areas in the mining area has decreased by less than 1 m after coal extraction. However, at the southeast and northeast boundaries of the study area, the water level dropped sharply, with a maximum drop of more than 15 m; the water table lowering in various regions of the coal area is demonstrated in Figure 13b. Additionally, the coefficient of recharge from precipitation in the study area varies from 0.2 to 0.54, decreasing from northwest to southeast as a whole, as shown in Figure 13c.

6.1.3. Thematic Maps of Indicators of Coal Extraction System

There are five main mineable coal seams in the Jurassic Yan’an Formation stratum, which is a coal-bearing stratum. The dip angle of the coal seams ranges from 1 to 3° and the thickness of the first-mined coal seam varies widely, ranging between 0 and 14 m. The burial depth of the first-mined coal seam decreases from west to east in the whole area, and the greatest depth can reach 700 m. The contour maps of the thickness and the buried depth of the first-mined coal seam are shown in Figure 14.

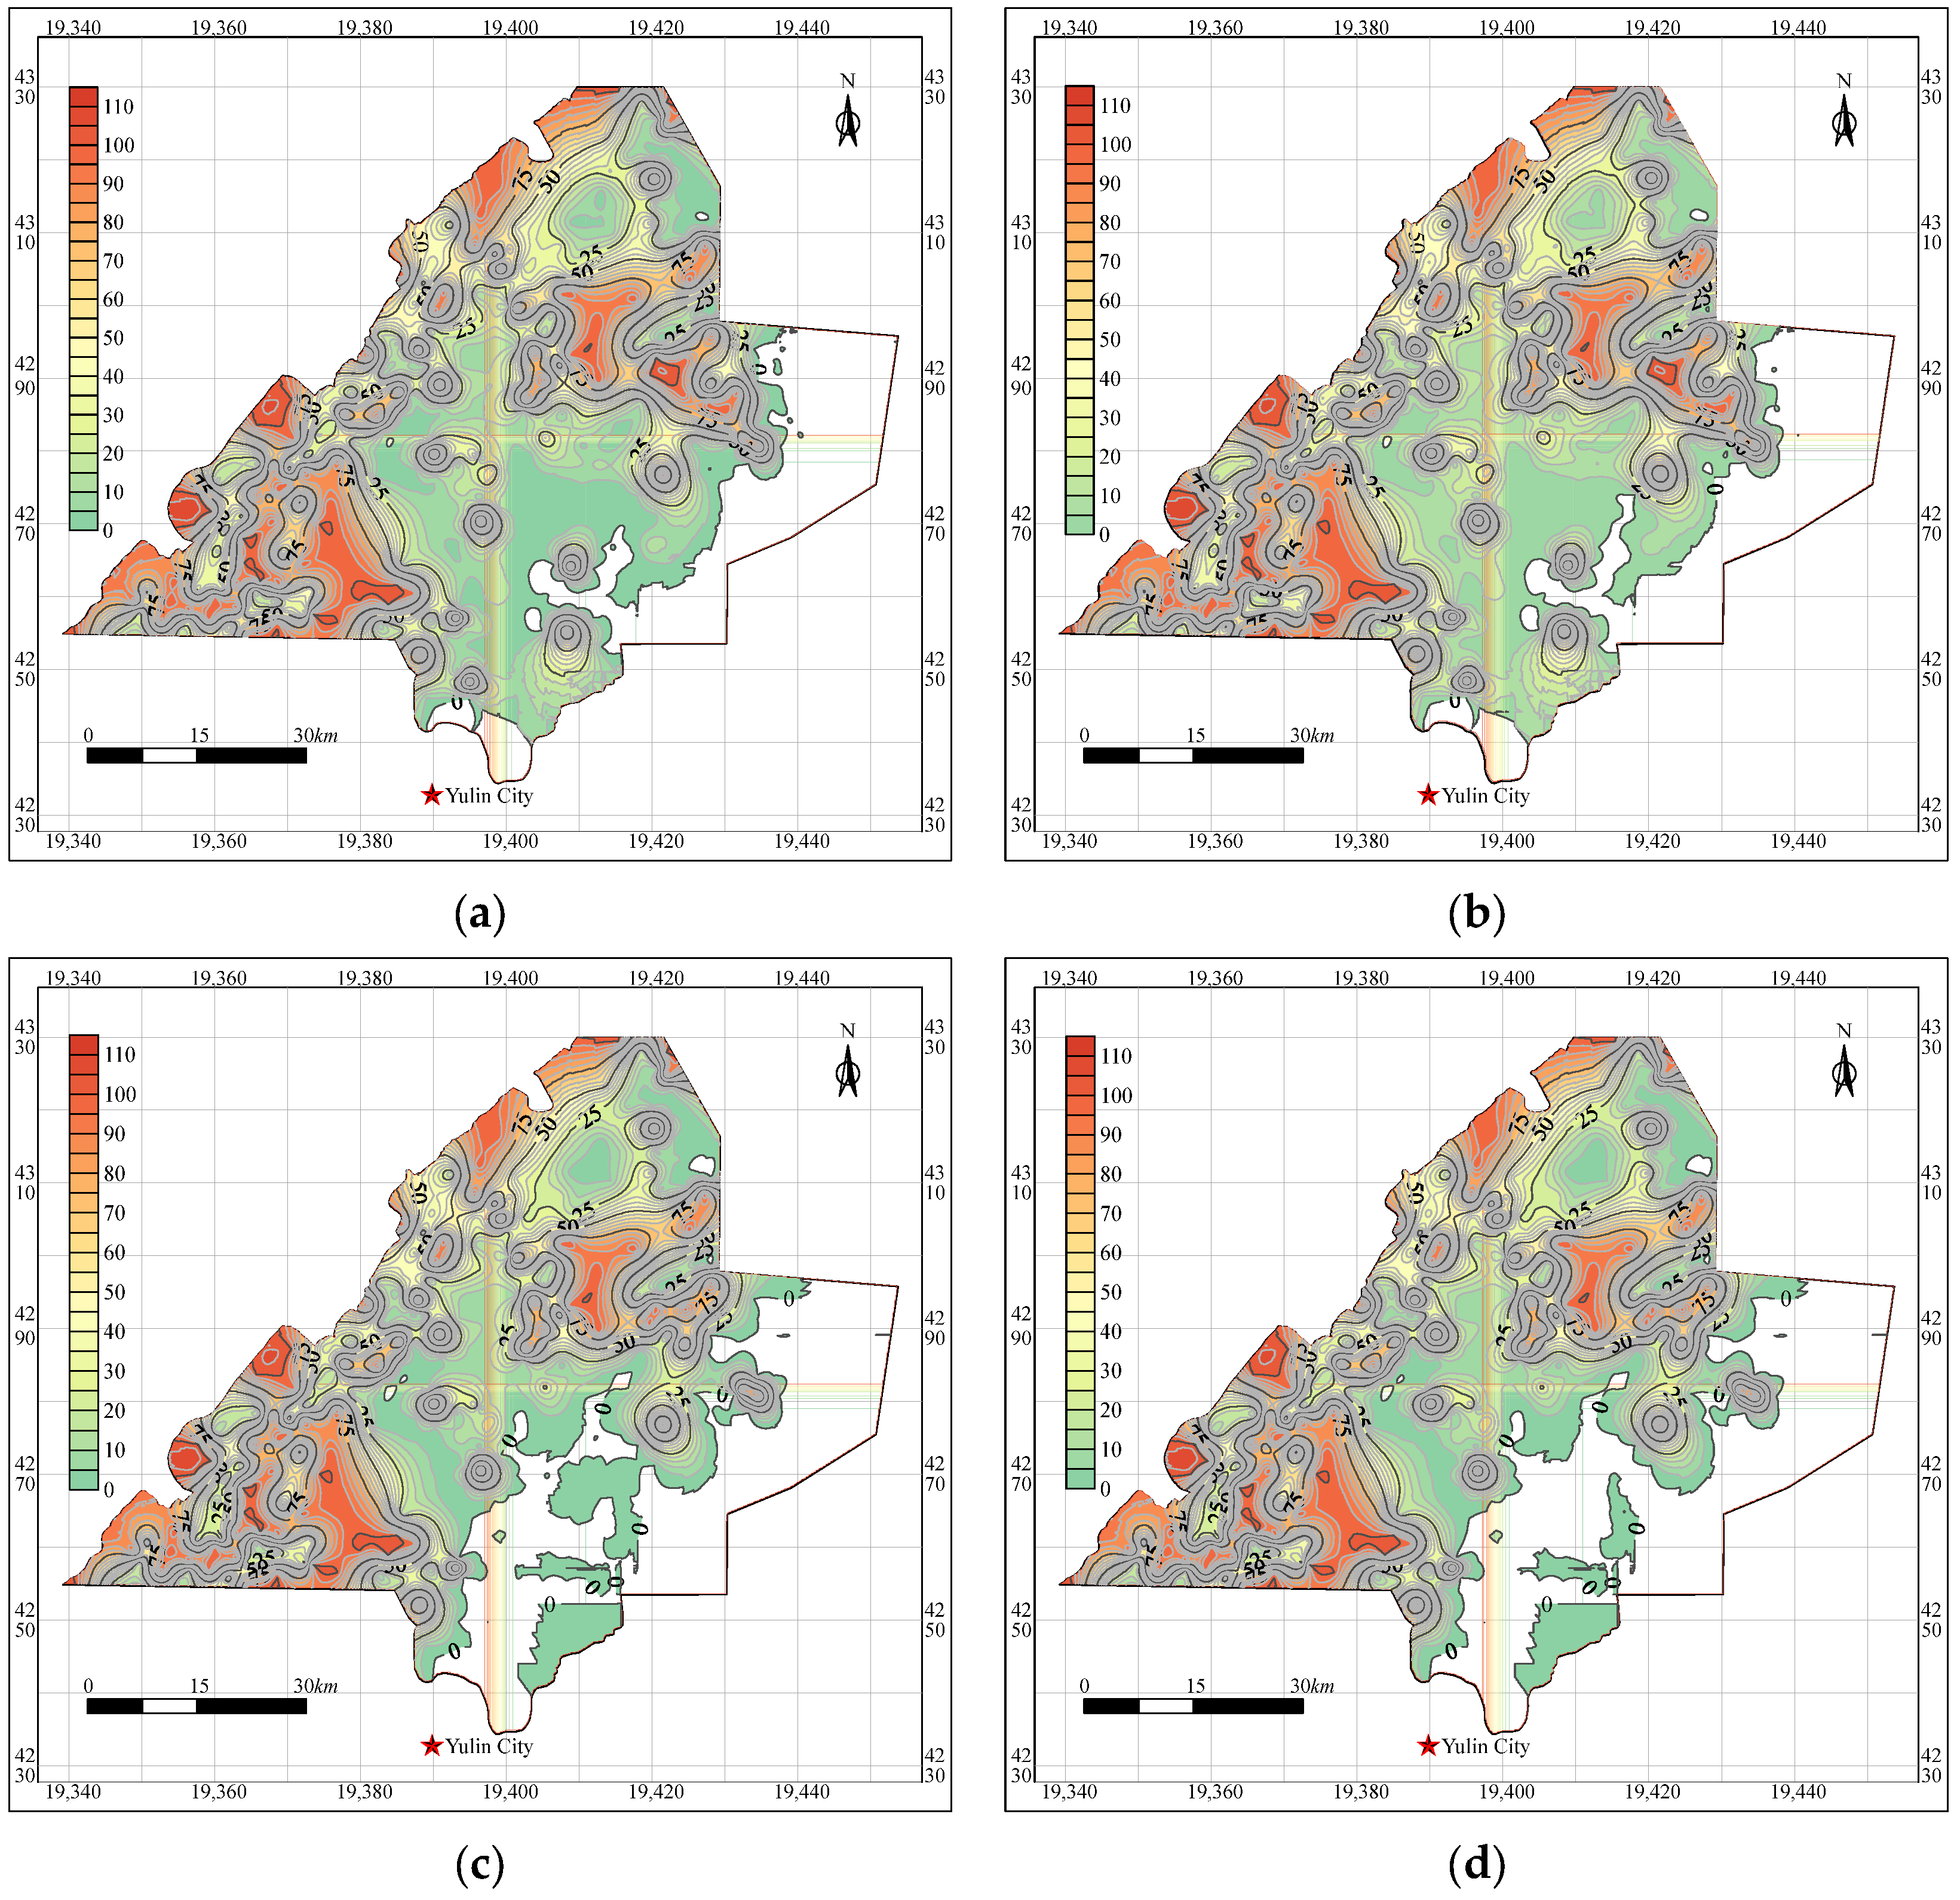
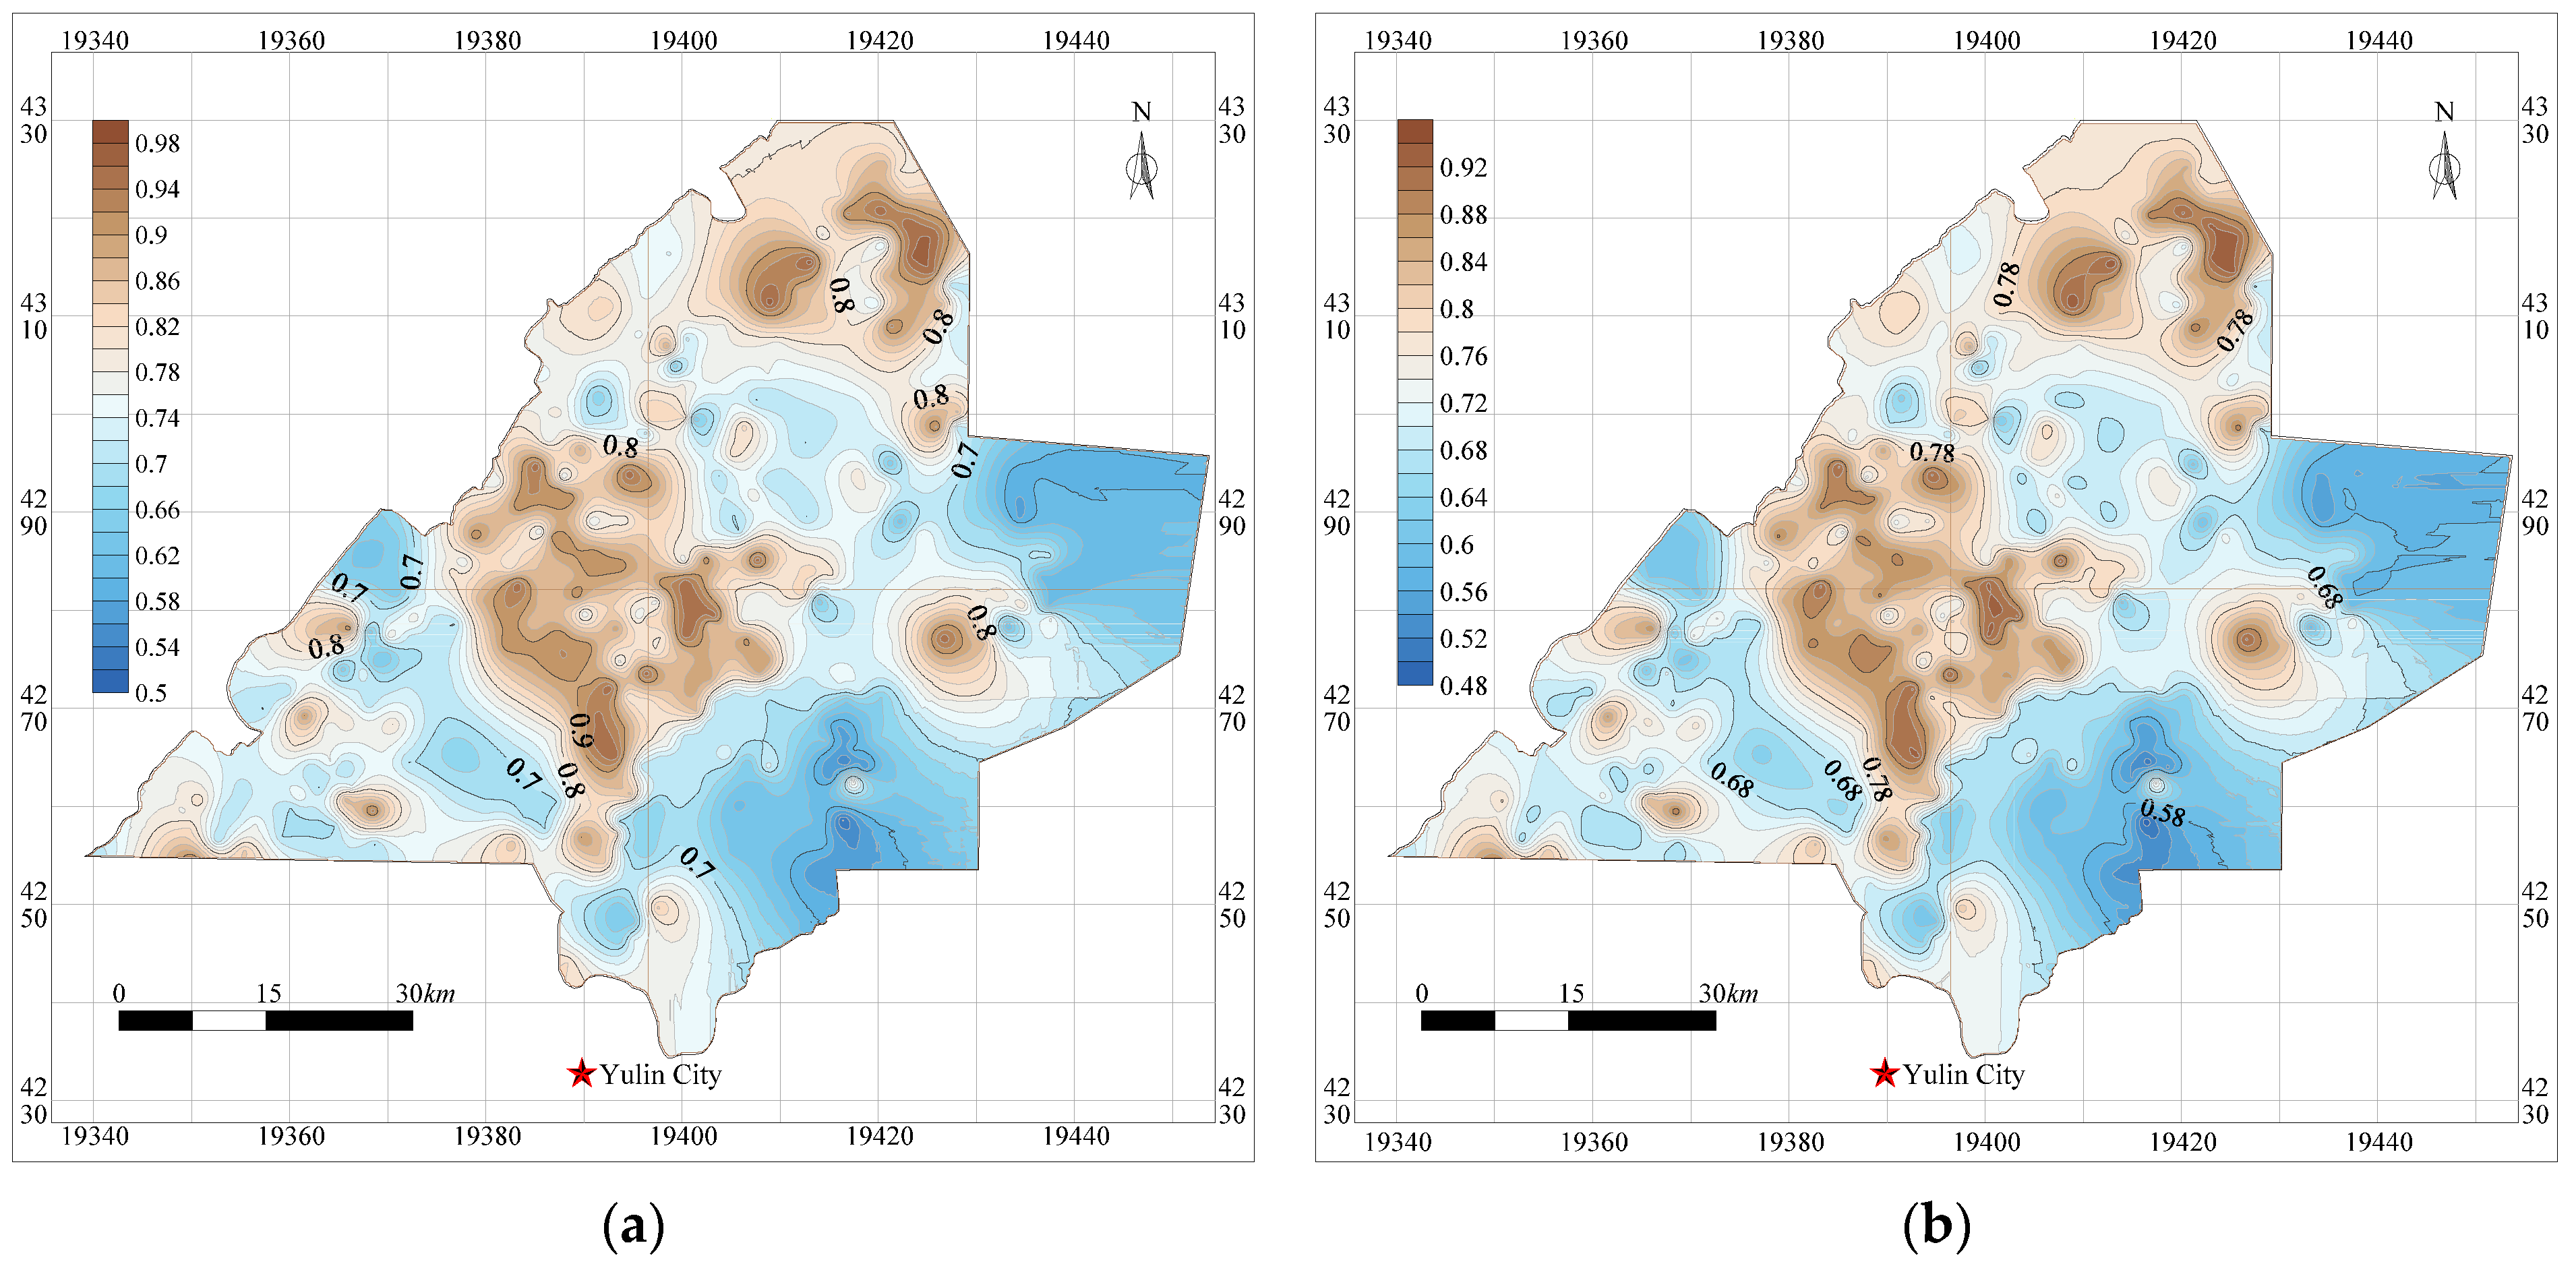
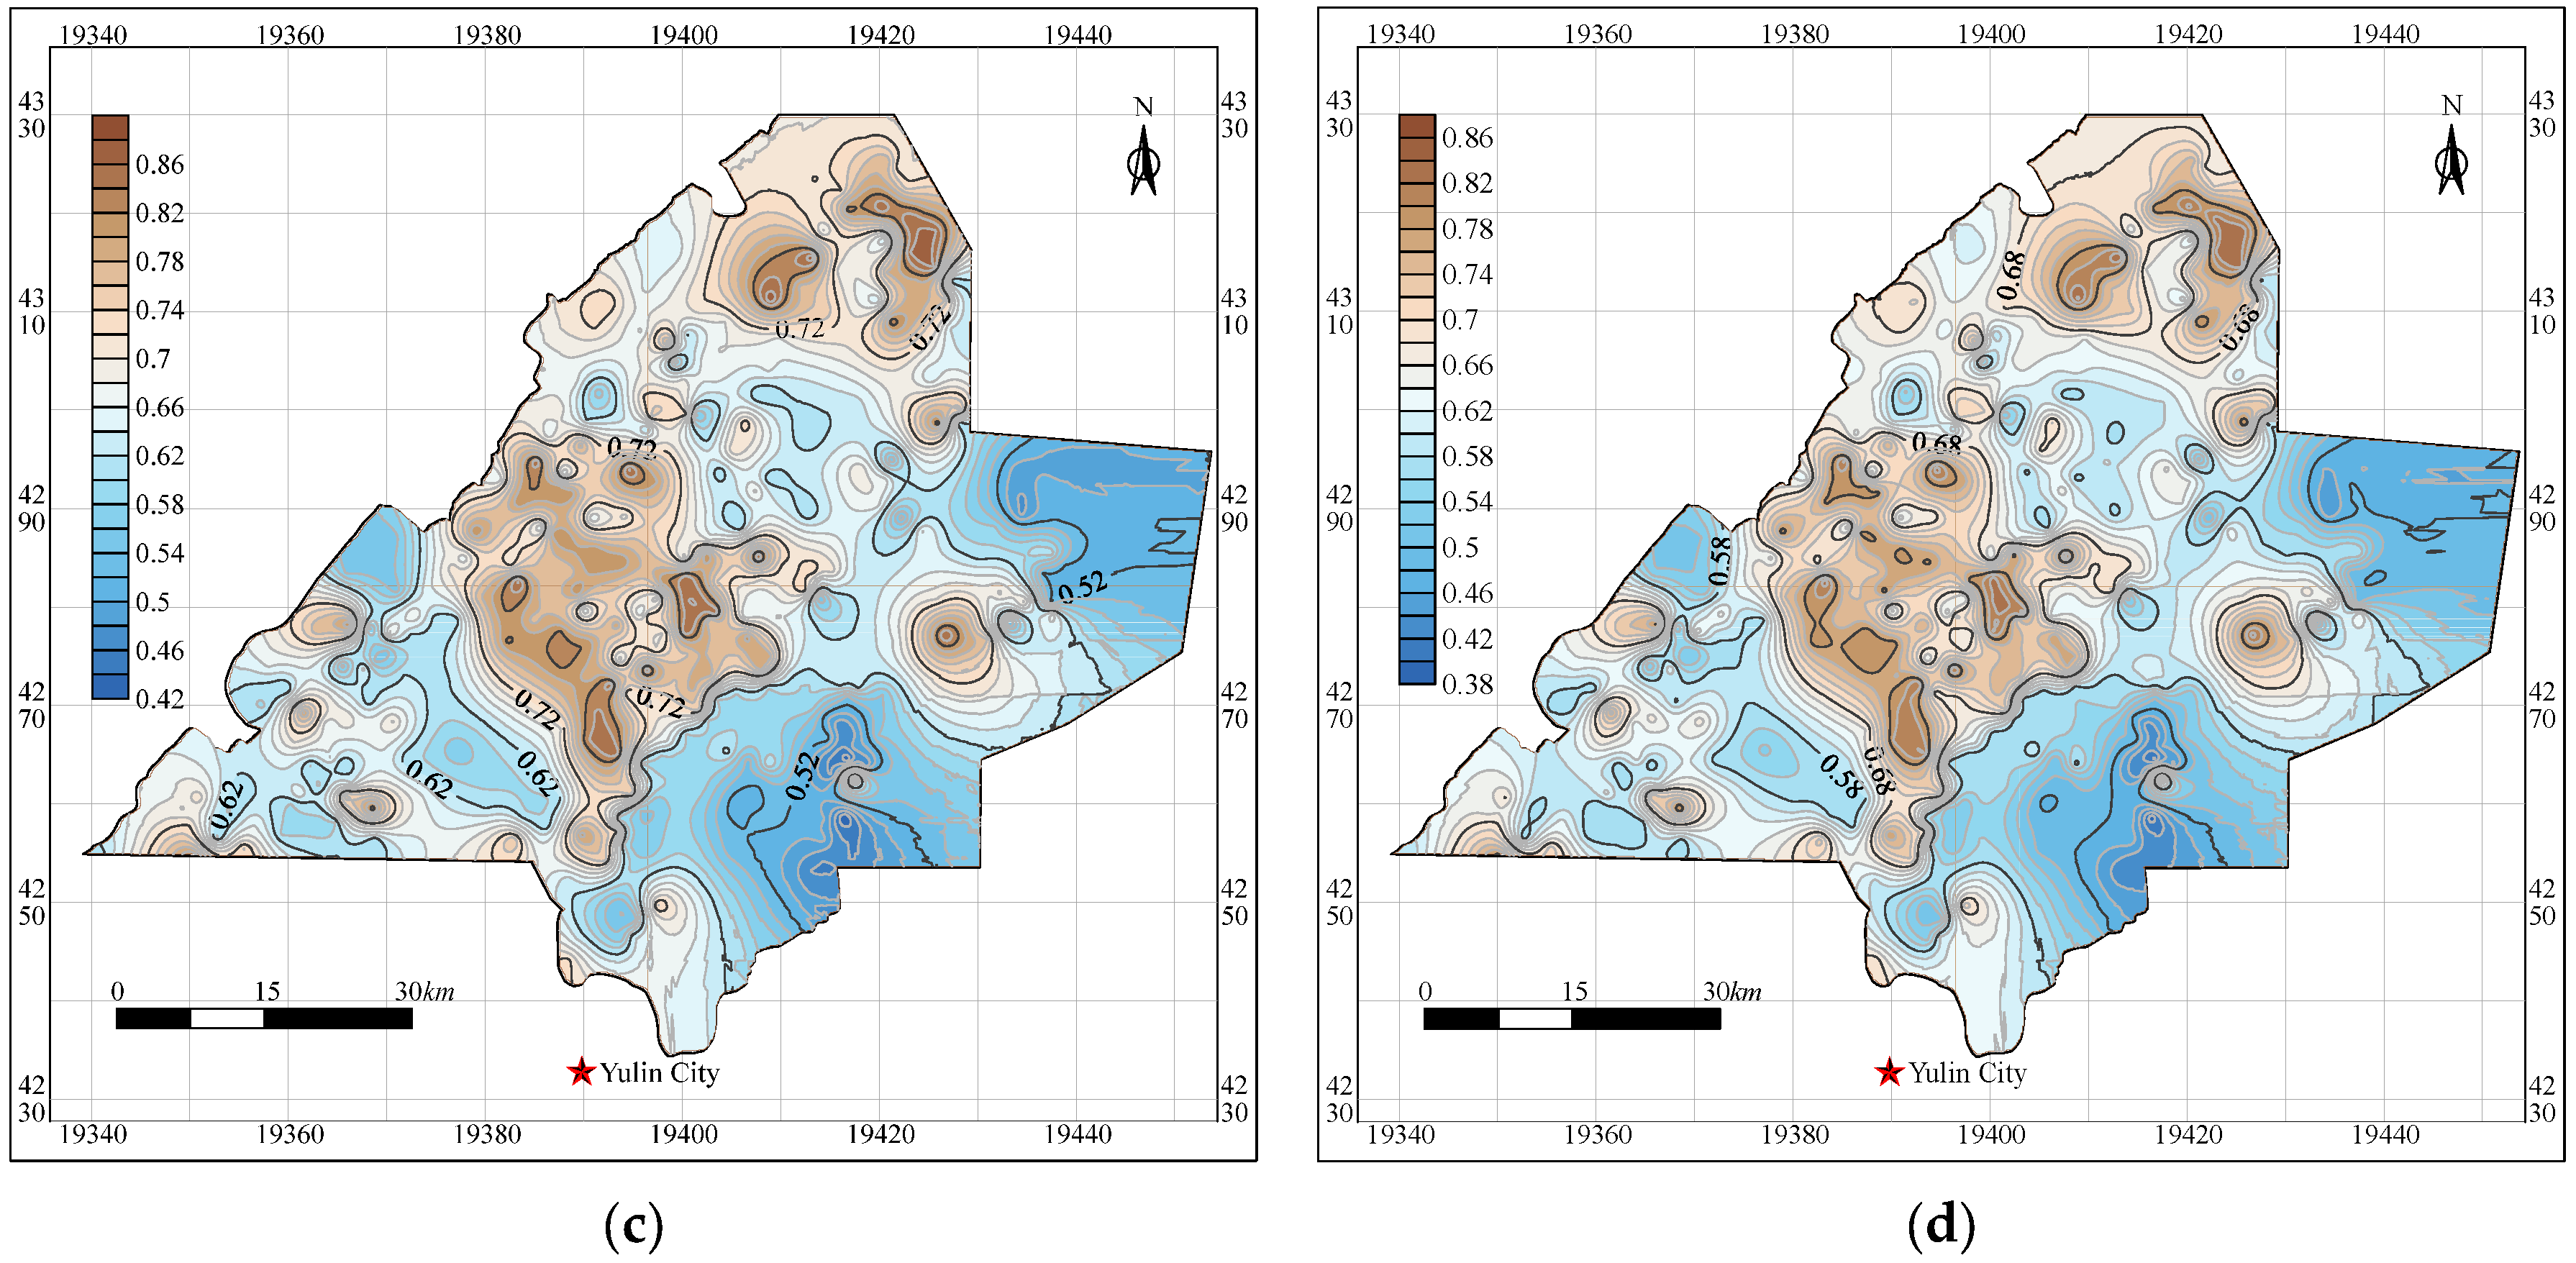
6.2. Comprehensive Evaluation of the WBCWSRS for Yu-Shen Coal Area

According to the thematic maps of the Yu-Shen mining area, the membership degree of each indicator affecting the WBCWSRS is determined. Subsequently, the comprehensive evaluation values Φ of the WBCWSRS for 400 drilling holes, under backfill mining, narrow strip mining, slice mining and longwall cave mining, are calculated by combining the weight distributions listed in Table 5. The process of calculating Φ is illustrated in Figure 15. Then, the Kriging interpolation method is employed to plot the contour maps of Φ under the four mining methods in the Yu-Shen mining area, as shown in Figure 16.
As Figure 16 shows, the distribution range of the grade of WBCWSRS under the four distinct mining methods is almost the same, and only the values of Φ are divergent. Because the heights of WCFZ corresponding to different mining methods are diverse, the thicknesses and the equivalent permeability coefficients of the NWSRZ are various. Meanwhile, the equivalent permeability coefficient of the NWSRZ has the largest weight, indicating its significant influence on the WBCWSRS. Additionally, the collected data from the field investigation of a borehole under diversion mining methods are the same, so the values of Φ under various mining methods are varied, whereas the distribution laws are the same. The maximum value of Φ is located in the midwest and northern boundaries of the mining area, because the thicknesses of the bedrock and soil layer (type Ⅰ WSRS) in these two areas are large, and thick bedrock can ensure the structural stability and integrity of type Ⅰ WSRS. Meanwhile, the thick and complete type Ⅰ WSRS can effectively prevent the infiltration of the overlying aquifer, since its permeability coefficient is far less than that of the bedrock. Furthermore, although the WBCWSRS of the southwest, northeast and southeast boundaries of the mining area are all low, the reasons are different among them. The WSRS of the southwest boundary belongs to type II WSRS. The thickness of the bedrock is large, while the thickness of the soil layer in this area is almost equal to 0. At the same time, the large thickness of the coal seam results in the high development of WCFZ, contributing to the low thickness of the NWSRZ, so it belongs to a low WSRS zone. The northeast boundary is a soil–bedrock overburden, and it is a type III WSRS. Meanwhile, the thickness of the bedrock is much less than that of the soil layer, and the WBC is close to a type I WSRS. There is no bedrock with large thickness to mitigate the mining disturbance to the soil layer in this area, causing the water-conducting fissures to penetrate the soil layer directly. This will lead to the absence of the NWSRZ. However, this area bears no water and belongs to the anhydrous coal mining area. It is meaningless to study the impermeability of the WSRS in this area. Additionally, the southeast boundary is mainly the overburden of burnt rock, without WSRS existing. Once the coal seam is extracted, the WCFZ directly connects the overlying aquifer with the mined-out area, bringing about water table lowering and water and sand inrush into the goaf. Therefore, it belongs to the high-permeability area.
The maximum value of Φ in backfill mining is 1, which can completely resist water seepage. In addition, it is 0.96 under narrow strip mining, which is slightly lower than that of backfill mining. In contrast, the maximum value of Φ for slice mining and longwall cave mining is 0.9 and 0.88, respectively. Without taking the area without an underground aquifer into account, the acreage of the area where the Φ is more than 0.7 accounts for nearly 100% of the whole mining area when backfill mining is employed. By contrast, the proportion of narrow strip mining, slice mining and longwall cave mining is approximately 85%, 40% and 30%, respectively. Therefore, the impact of backfill mining and narrow strip mining on WSRS is far lower than that of slice mining and longwall cave mining, which also shows the limitation of slice mining in ameliorating the mining disturbance.

6.3. Countermeasures for Maintaining the WBCWSRS

Taking longwall cave mining as an example, for the area where there is no underground aquifer or the grade of WBCWSRS is extremely high (0.9 < Φ < 1), longwall cave mining is a suitable method to extract coal resources safely and efficiently. For collieries with high WBCWSRS (0.8 < Φ < 0.9), the coordinated mining method may be the ideal one. By adjusting the layout of the working face, mining direction and mining sequence, it enables the overburden to sink as a whole, so as to control the development of WCFZ and mitigate the permeability deterioration of the WSRS. Under this circumstance, the impact of coal extraction on the underground aquifer will be reduced to a certain extent, contributing to the realization of WPCM. Moreover, for the area whose WSRSWBC grade is medium (0.7 < Φ < 0.8), the coal extraction further aggravates the mining disturbance of the overlying layers. The development degree of the mining-induced fissures in overlying strata deepens, and thus the grade of WBCWSRS decreases accordingly. Therefore, partial mining methods such as strip mining, height-limited mining as well as room and pillar mining should be adopted. All of these mining methods mitigate the overburden’s migration and fracture development by sacrificing a fraction of the coal resources, so as to reduce the permeability deterioration of WSRS and maintain its WBC to the overlying aquifer.
In addition, when the WBCWSRS is low (0.6 < Φ < 0.7), in order to avoid shallow water seepage caused by drastic migration, fracture development and permeability deterioration of WSRS, it is necessary to adopt backfill mining to achieve WPCM. Furthermore, there is no WSRS occurring in the area where the stratigraphic structure is of the burnt rock type. Its WBC is extremely low (Φ < 0.6). The traditional longwall backfill mining has a large exposed space, while it takes a long time for the filling body to reach the design strength. Therefore, the movement and permeability degradation of the overburden cannot be strictly limited, and the loss of water resources is still inevitable. In order to protect the underground aquifer and surface ecological environment, the advantages of the interception method and dredging method should be comprehensively compared and analyzed. Firstly, curtain grouting can be employed to reconstruct the WSRS. This method injects filling slurry into the pores, voids and fissures of the rock stratum between the aquifer and the coal seam to form a continuous water-blocking curtain. The concept is herein termed the reconstruction of WSRS. This method can block the hydraulic transmission channel between the coal seam and the overlying water body, and prevent the water resources from percolating from the aquifer to the mined-out area, contributing to mine water inrush disasters.
In addition, constructing an underground reservoir to store and utilize mine water is also an optional method to realize WPCM in burnt rock areas. By using the corresponding pumping and water-purifying installation, the polluted ponding in the goaf will be purified. The treated mine water will be pumped and utilized for surface vegetation, irrigation and production and domestic water use. The method can make full use of polluted water resources and reduce direct groundwater extraction, which is conducive to WPCM. However, if the cost of extraction and sewage treatment is higher than the coal sales revenue, the coal extraction shall be stopped.

7. Influence of Mining Methods on Underground Aquifer and WSRS

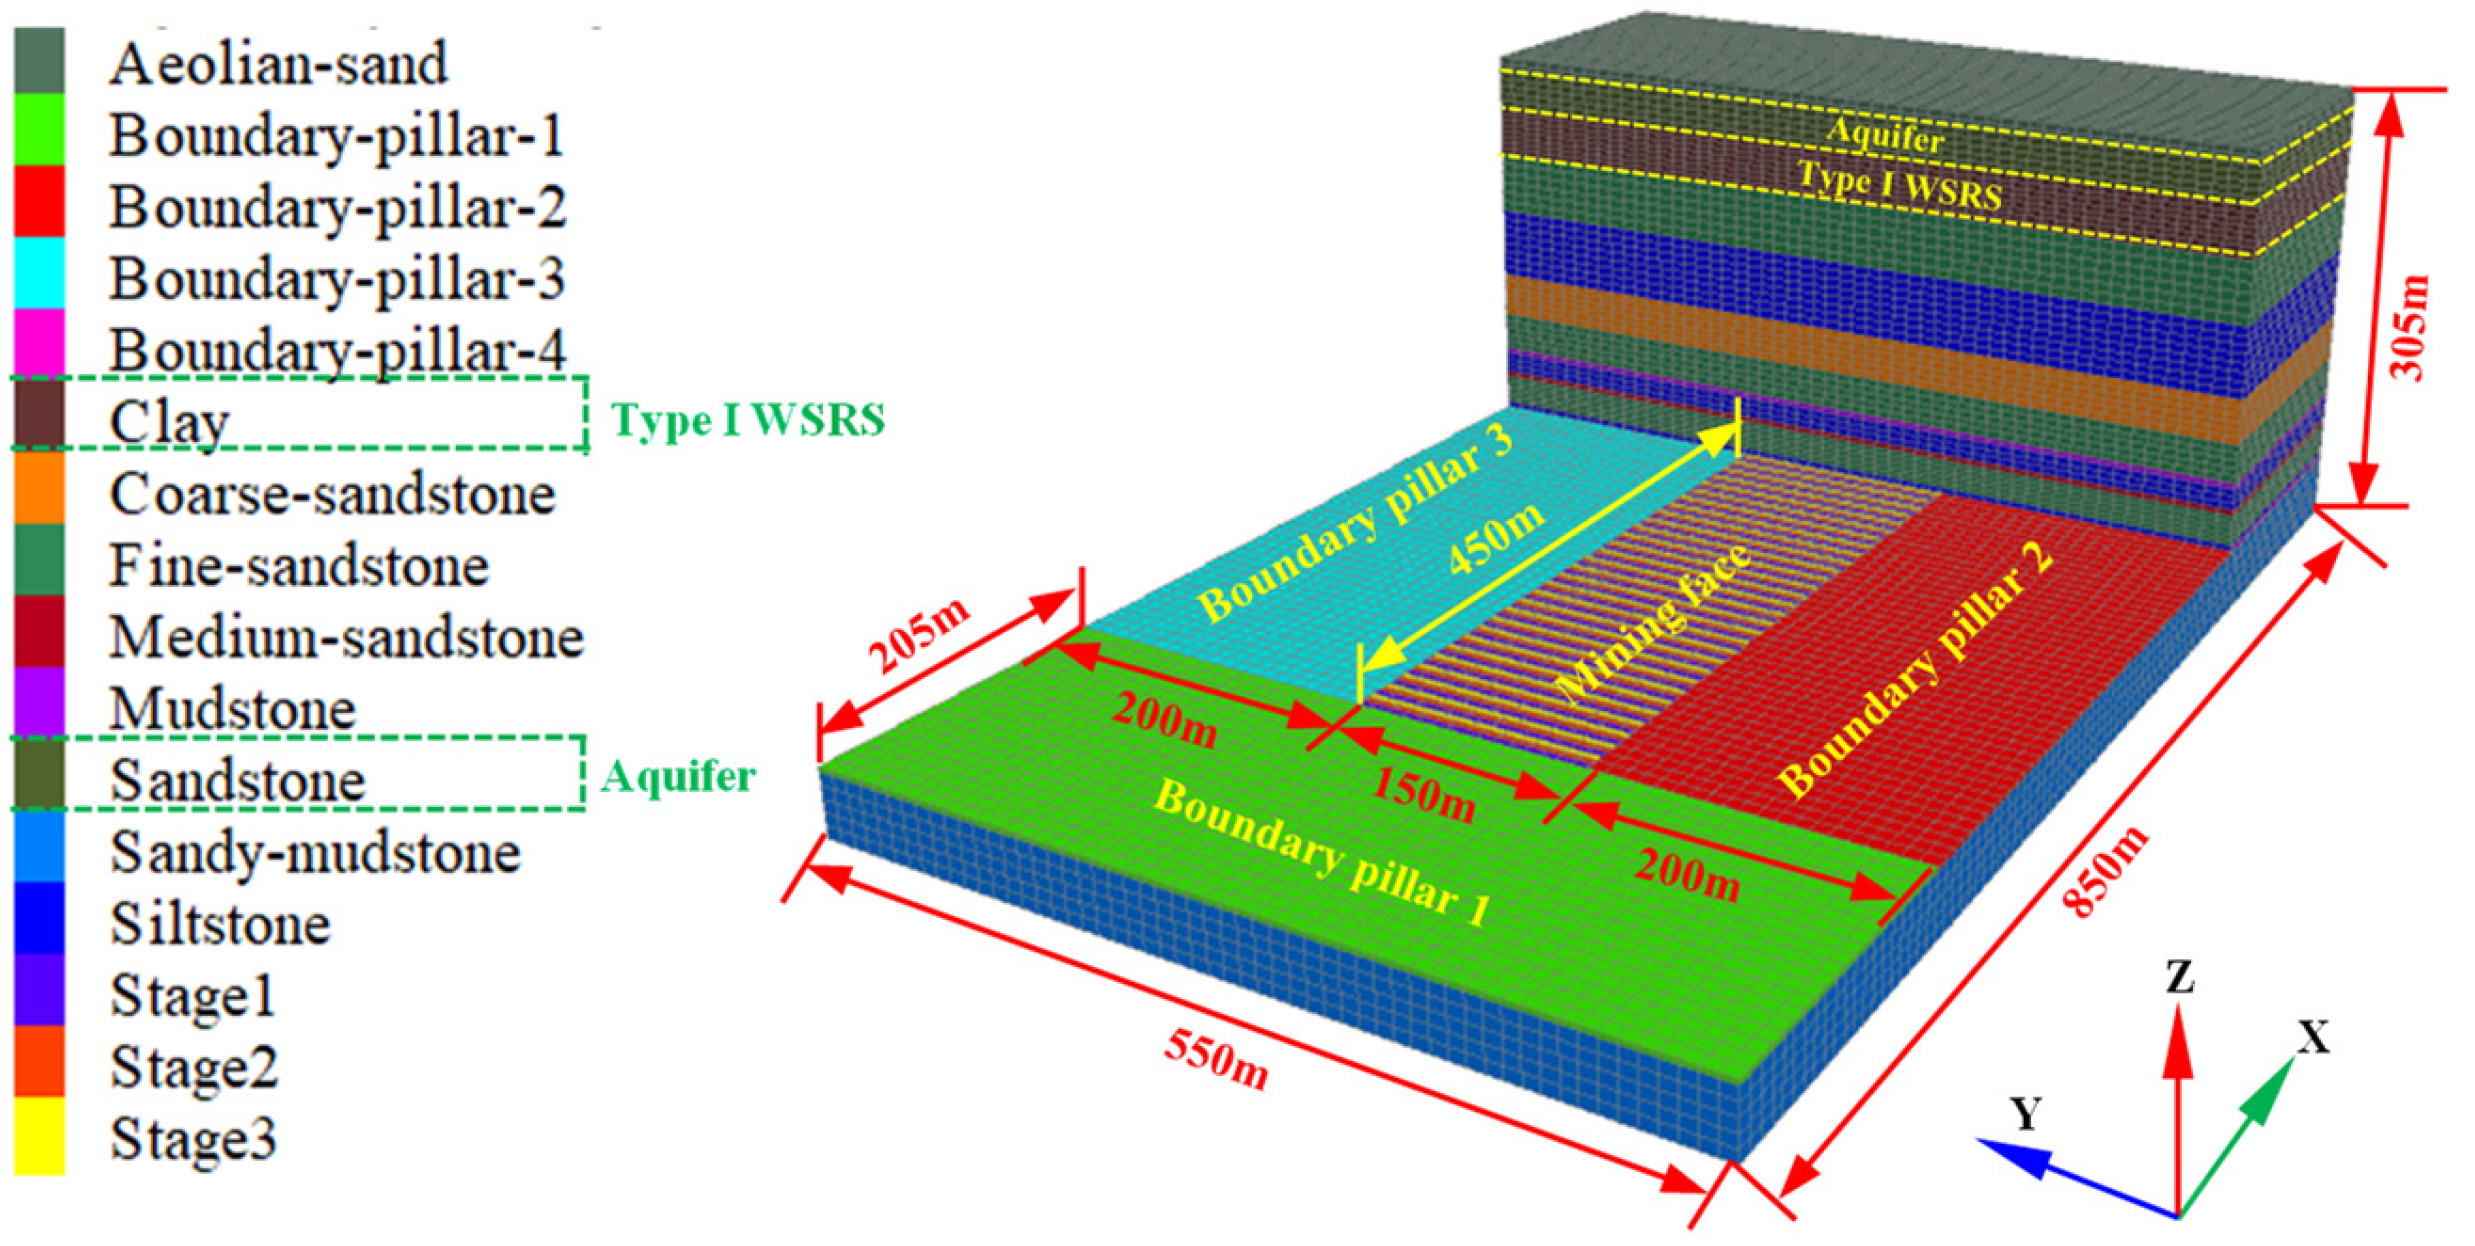
7.1. Construction of Fluid–Solid Coupling Numerical Model

Fast Lagrangian Analysis of Continua (FLAC3D), a three-dimensional finite difference program developed by ITASCA, is one of the most widely employed numerical simulation software programs in geotechnical engineering and underground mining. Based on the engineering and geological conditions of the Yubujie coal mine in the Yu-Shen mining area, strata with similar lithology are appropriately simplified and merged, and thirteen strata are determined from bottom to top. A three-dimensional numerical calculation model is established, as shown in Figure 17. The fluid–solid coupling module of FLAC3D is used to simulate the water table fluctuation of the aquifer above the WSRS, under backfill mining, narrow strip mining (partial mining), slice mining (harmonic mining) and longwall cave mining [65,66].
With due consideration of the critical mining and boundary effect, the size of the numerical model is finally determined to be 850 m × 550 m × 305 m (X × Y × Z). The dimension of the working face is 450 m × 150 m (strike × dip). The width of the boundary pillar in the strike direction is 205 m, which is slightly broader than that of 200 m in the dip direction. The thickness of the coal seam is 4 m and the dip angle is 0. The three boundaries located in the starting point of the X axis, Y axis and Z axis are fixed, and meanwhile two boundaries situated at the ending point of the X axis and Y axis are also anchored. The displacement and velocity of these five boundaries are equal to 0. In contrast, the top boundary is set as the free boundary, which can migrate in the vertical and horizontal directions.
In order to determine the mechanical parameters of various rock strata, the FLAC3D numerical calculation software is employed to conduct the uniaxial compression test of rocks from various overlying strata. The obtained stress–strain curves are compared with the curves obtained from indoor tests, and the simulation parameters are continuously optimized until the stress–strain curves from simulation are broadly in line with those from the indoor tests. Thus, the mechanical parameters of each stratum in the numerical model are determined.
The Mohr–Coulomb constitutive model is utilized for the roof and floor strata and coal seam, while the strain-softening model is employed for the filling body in backfill mining. By comparing the failure form and plastic shear strain of the backfill from the indoor uniaxial mechanical test and the uniaxial numerical simulation, as well as the stress–strain curves, the numerical simulation parameters of the elastic stage and the plastic yield stage of the backfill are calibrated. In order to optimize the procedure of numerical calculation, the simulation considers that with the increase in plastic shear strain, the cohesion and friction angle of the filling body decrease. Their values are the residual values when the plastic shear strain is 0.01. The mechanical parameters of strata, coal seam and backfill are listed in Table 6.

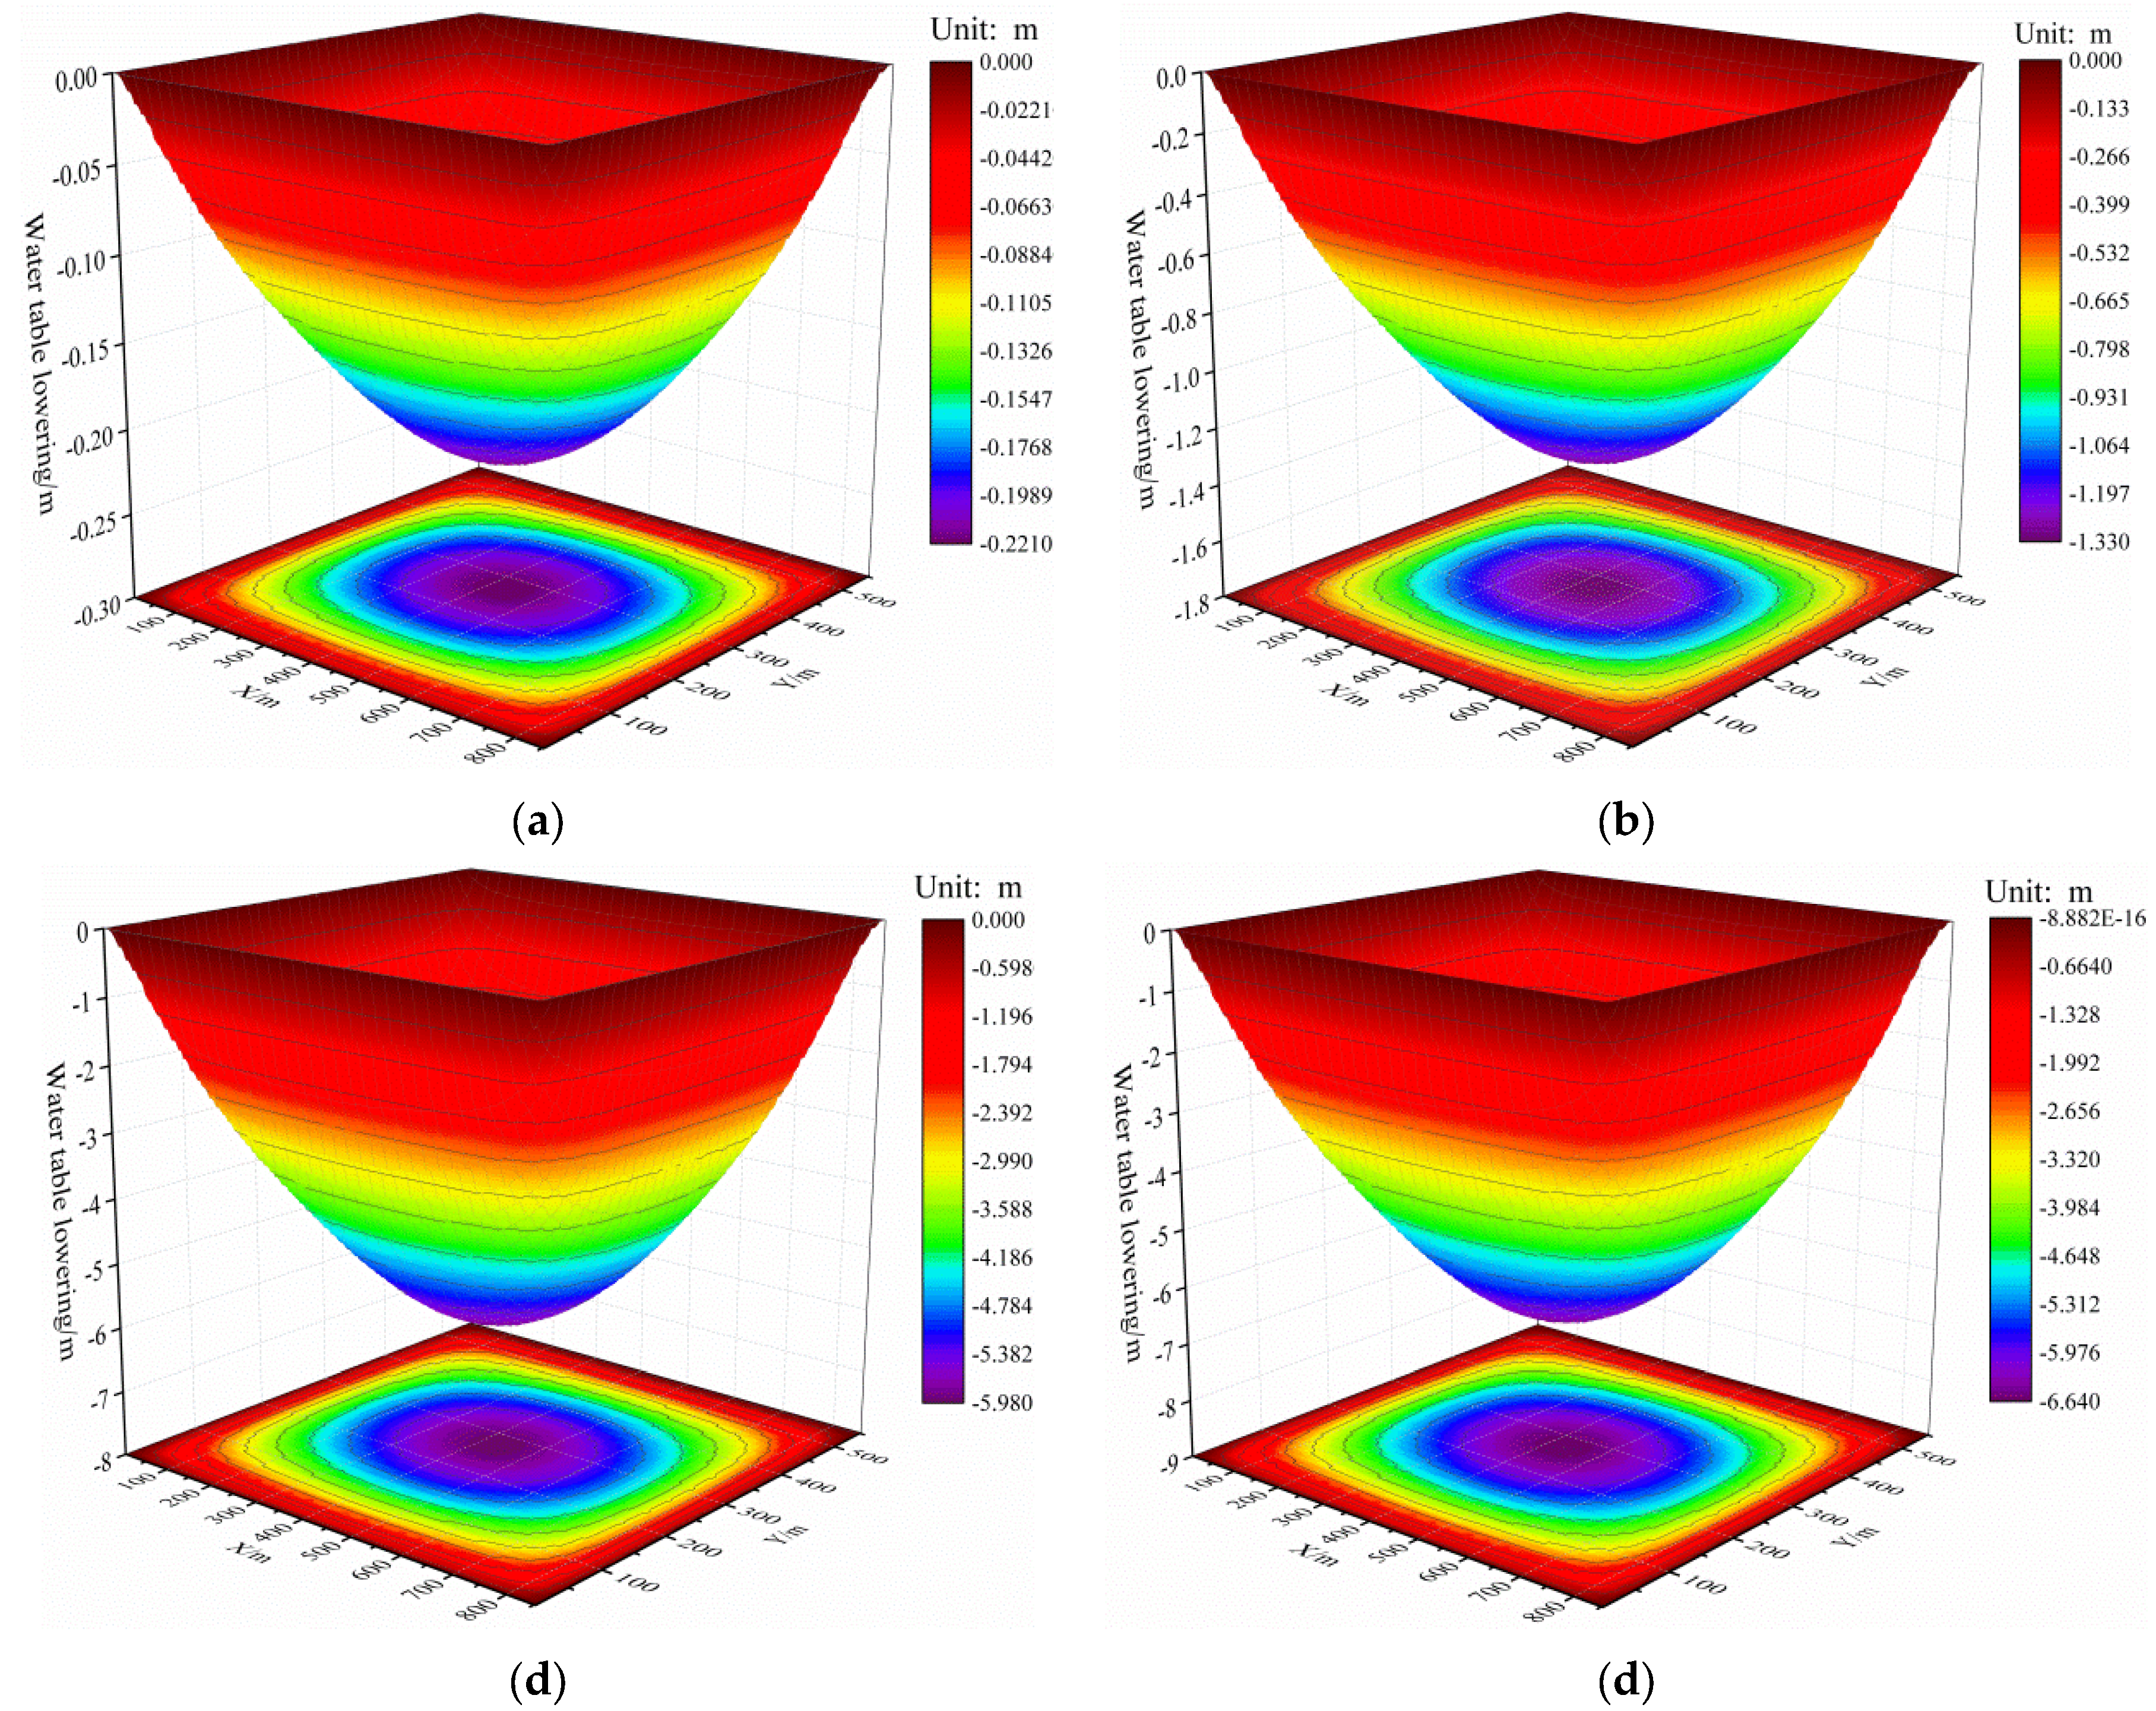
7.2. Water Table Lowering under Various Mining Methods

During fluid–solid coupling simulation, the seepage mode is activated by adding the “CONGIG fluid” code to the mechanical calculation. The pore pressure and pore water pressure gradient are set by utilizing the “Initial PP” code. Moreover, the permeability coefficients of the overlying and underlying strata, coal seam and filling body are regarded as an isotropic seepage model. The permeability coefficient of clay, which is defined as type Ⅰ WSRS, is less than 10−7 cm/s. For other rocks, including fine sandstone, medium sandstone, siltstone, etc., the initial permeability coefficients are assigned according to Table 1. The porosity is set to 0.5 and the tensile strength of fluid is set to 109 MPa. Both the Biot coefficient and saturation are set to 1. The default boundary of the FLAC3D model is impermeable. There is no fluid exchange between the nodes on the boundary and the outside, and the pore water pressure value on the boundary nodes can change freely. A fixed pore pressure indicates the previous boundary condition. Along the permeable boundary, the fluid can flow into or out of the model. If the pore pressure is fixed to zero, the saturation will change. Otherwise, the saturation will be 1, and the fixed value of pore pressure cannot be less than that of the tensile strength of the fluid. The overlying aquifer near the top boundary is set as a free surface, and the surrounding and bottom boundaries are set as pervious boundaries using the “Fix pp” code.
According to the numerical simulation results of fluid–solid coupling, the groundwater drawdown funnel and the contour map of the water table lowering under the four different mining methods are drawn, as shown in Figure 18. The groundwater level of backfill mining only decreases by 0.22 m, indicating that the mining disturbance to the WSRS is very low. The water level of the overlying aquifer of narrow strip mining diminishes by 1.33 m, indicating slight water table lowering. The narrow strip with a width of 15 m, being left as a permanent coal pillar to support the roof and ameliorate the deformation and permeability deterioration of WSRS, may account for the subtle water level fluctuation. Therefore, this mining method is conducive to maintaining the impermeability of the WSRS, so as to better protect the overlying Salawusu Formation aquifer. In contrast, the water level of the Salawusu Formation aquifer declines by 5.98 m and 6.64 m, respectively, under slice mining and longwall cave mining. This suggests that it is feasible to reduce the mining disturbance to the WBCWSRS, and finally mitigate the mining impact on the overlying aquifer. On the other hand, the water table lowering of slice mining is only 10% less than that of longwall cave mining, suggesting that its capability to protect the WSRS is limited.

7.3. Constraints of Ecological Vegetation on Mining Methods and Mining Parameters

The surface vegetation in the study area is dominated by Salix psammophila, Artemisia annua, Populus euphratica and Salix. The depth of the Salawusu Formation aquifer varies from 0.5 to 1.8 m, and the surface vegetation is luxuriant. Based on the field investigation conducted by Wang Shuangming [67], the relationship between the groundwater level and the growth conditions of the four aforementioned vegetation types are demonstrated, as shown in Table 7. When the depth of the underground aquifer is deeper than 3.0 m, the growth of surface vegetation will be inhibited and degraded. Therefore, the range of water table lowering cannot be greater than 1.2–2.5 m. In order to ensure the successful growth of the vegetation above the mining block, the drawdown of the groundwater level should be strictly controlled within 1.2 m.
As illustrated in Figure 18, backfill mining leads to a maximum decrease of 0.22 m in the Salawusu aquifer, which meets the requirements for the successful growth of vegetation. Moreover, the maximum value of water table lowering in narrow strip mining is 1.33 m, which is greater than 1.2 m. Therefore, optimizing the mining parameters of this mining method is an effective means to control the decline in the groundwater level. For instance, it is reasonable to appropriately broaden the width of the unextracted strip pillar while narrowing down the span of the extracted strip pillar to control the water level decline of the underground aquifer. The maximum drawdown of the water level corresponding to slice mining and longwall cave mining is 5.98 m and 6.64 m, respectively. It seems that, regardless of how the mining parameters are adjusted, it is impossible to meet the requirement of the maximum water table lowering being less than 1.2 m. It is obvious that the two mining methods cannot be employed in the study area since neither of them can effectively maintain the WBCWSRS and ecological water level. Hence, backfill mining is an ideal method to preserve the underground aquifer and thus protect the surface vegetation. Meanwhile, if this method is confronted with the filling scale being smaller than that of the filling demand due to high filling costs and insufficient sources of raw materials, optimizing the mining parameters of the narrow strip mining method is an alternative to make it feasible for groundwater lowering to be less than the critical value.

8. Discussion

(1)
In previous studies, relevant scholars used the AHP method to identify the influencing indicators of the WBC of the water-resisting layer, and ranked the importance of the factors according to the weight distribution [68,69,70]. In addition, there are also some scholars who employed AHPF to evaluate the WBC of an aquiclude in a mining area, but all of them take an average value to represent the whole mining area to determine the membership degree of the influencing factors [71,72,73]. Their prediction results are obviously unreasonable, inaccurate and irrational, because the hydrogeological conditions at different locations in the same mining area are obviously varied [74]. Furthermore, different from the traditional evaluation of the WBC of an aquifuge, from the perspective of the mining-induced permeability deterioration rate of the overburden, the concept of “three seepage zones” is firstly put forward in this paper, and the scientific connotations of the nominal WSRZ (after coal extraction), which is important for WPCM, are systematically defined. Additionally, the concept of WSRS (before mining) is proposed, and it is classified into five various types on the basis of the initial permeability, thickness, strength, porosity and the stratigraphic structure of the WSRS [75]. The influence mechanism of the type of WSRS on the vertical level and thickness of the nominal WSRZ is revealed. Subsequently, a comprehensive evaluation mathematical model for predicting the WBCWSRS based on AHPF is established. The innovation of this paper is that the membership degree of the factors of the WSRS for various boreholes is accurately determined based on the hydrogeological conditions of each borehole, and the comprehensive evaluation value of the WBCWSRS of each borehole is obtained precisely. The zoning map of the grade of WBCWSRS for the whole mining area that has been plotted is undoubtedly more accurate than that of the previous research, so as to better guide the implementation of WPCM [76].
(2)
The prediction model has wide applicability and can be applied to most mining areas in China. However, in the process of generalizing and applying the model, it should be noted that it cannot be employed in mining areas where the hydrogeological conditions vary greatly from those of the Yu-Shen mining area. For instance, the model cannot be applied to some of the mining areas in Xinjiang province, since the coal seams are generally extremely thick and their mining process is completely different from that of other common mining areas such as the Yu-Shen mining area [77]. Therefore, to accurately predict the impermeability of the WSRS in the process of coal mining in these mining areas, experts and scholars working on WPCM in these coal fields should be invited to analyze the weight distribution of the influencing factors and the membership function again, and then determine the impermeability of the WSRS according to the drilling data at different positions in the mining area.
(3)
When using the fluid–solid coupling module of FLAC3D, our predecessors generally only studied the variation in the pore water pressure of the aquifer. They argue that the amplitude of pressure fluctuation can indirectly reflect the impact of coal extraction on the aquifer [78,79,80]. The authors hold the view that the water level fluctuation induced by coal extraction is responsible for the pore water pressure variation of the Quaternary Salawusu formation aquifer. Hence, a simple formula is utilized to convert the variation in pore water pressure into that of the water level of the aquifer. The water table fluctuation reflects the degree of mining disturbance and the permeability deterioration of the WSRS indirectly; thus, it can verify the rationality and accuracy of the prediction model of the WBCWSRS. Moreover, with due consideration of the water table lowering corresponding to four different coal mining methods and the ideal ecological water level of surface vegetation, this paper proposes a mining control method, i.e., macro-adjustment of mining methods and minor adjustment of mining parameters, to achieve ecological preservation and conservation in coal mining.

9. Conclusions

The conclusions drawn from the research are as follows:
(1)
With due consideration of the initial permeability, strength, thickness, rock combination and swelling when soaked in water of the overlying strata, the concept of WSRS is first proposed. The classification system of WSRS is constructed and the WSRS is divided into four types. Based on the mining-induced damage and permeability deterioration of the overlying strata, the overburden is divided into the “pipe flow zone”, “water seepage zone” and “NWSRZ” from bottom to top. The partition standard of the new “three zones” from the perspective of mining-induced permeability deterioration is given, i.e., pipe flow zone (k/k0 > 1000), water seepage zone (20 < k/k0 < 1000) and NWSRZ (1 < k/k0 < 20).
(2)
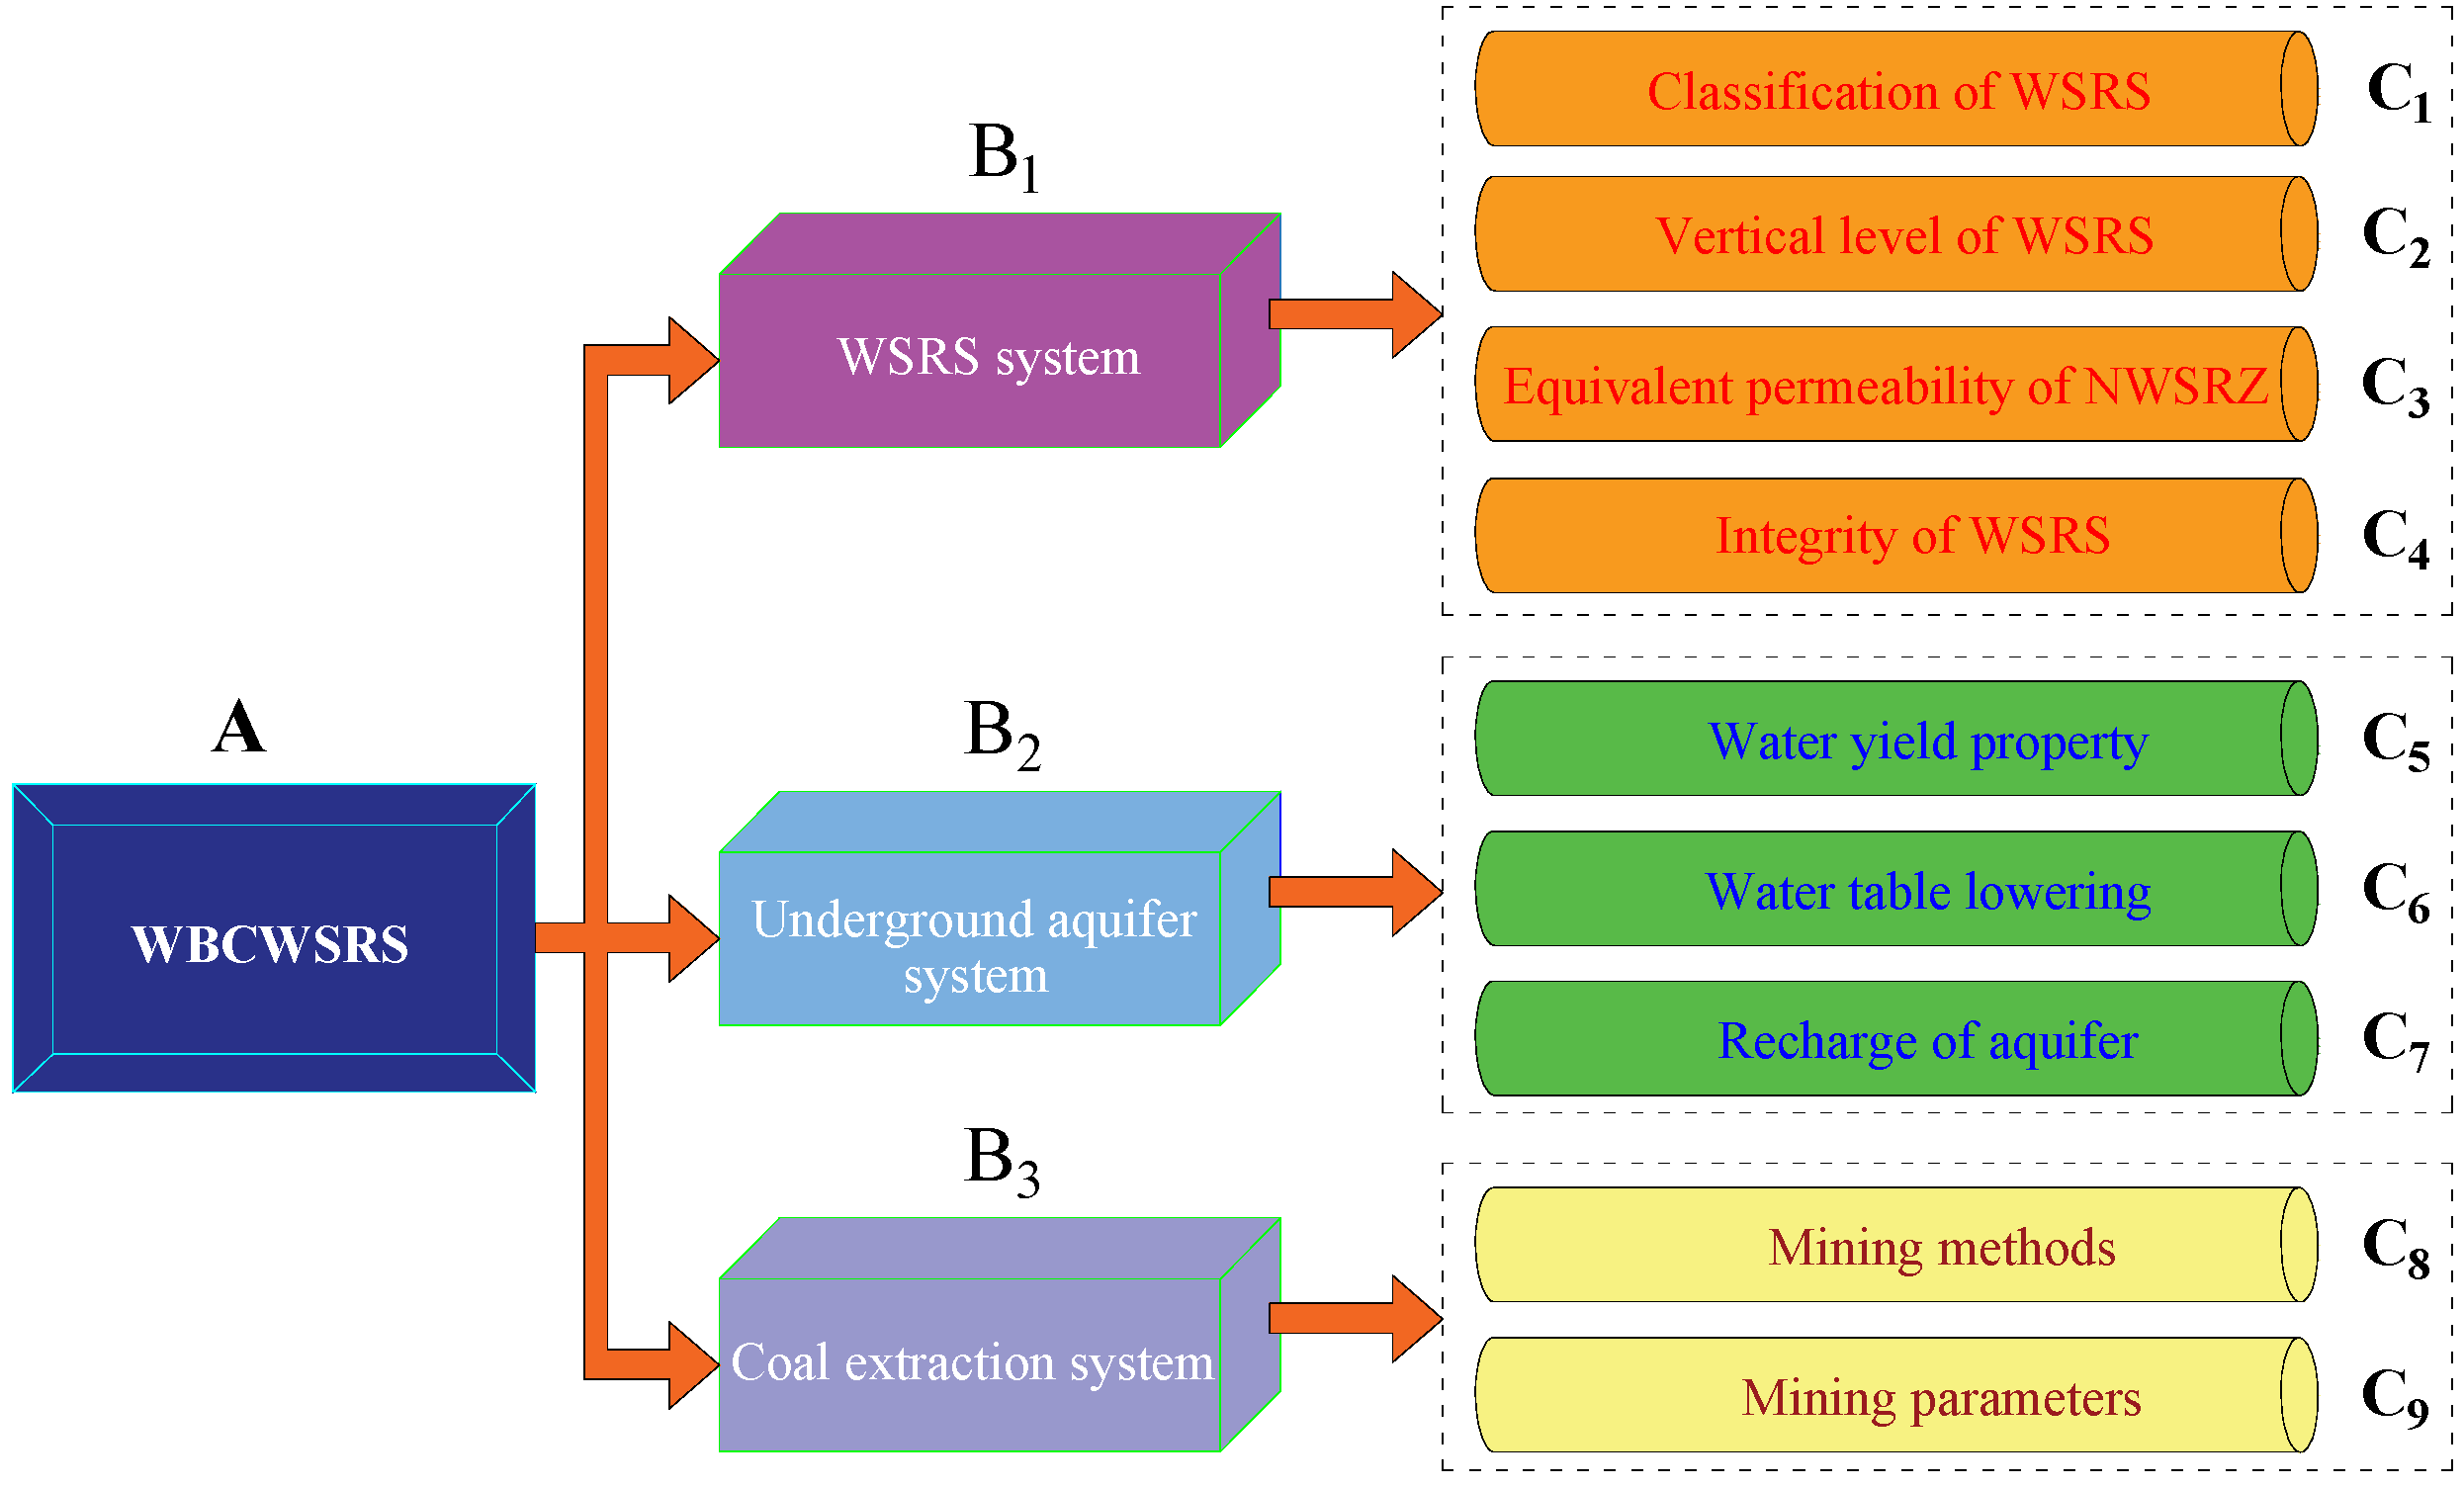
The AHPF is employed to construct a prediction model of the WBCWSRS. In the AHP model, three indicators, i.e., WSRS system, underground aquifer system and coal extracting system, are selected as sub-factors, and nine factors, such as the vertical level of WSRS, are selected as third-tier indicators. The weight distribution of influencing factors at all levels is determined. Among the secondary indicators, the WSRS system is the most important one. The equivalent permeability coefficient of NWSRZ is the most significant factor among the third-level indicators, followed by the vertical level of WSRS and the mining method.
(3)
The thematic maps of factors affecting the WBCWSRS in the Yu-Shen mining area are drawn. According to the established membership functions of the third-tier factors, the membership degrees of the indicators at the third level are determined. Combined with the weight distribution, the comprehensive evaluation values of the WBCWSRS for 400 boreholes in the whole mining area are calculated under backfill mining, narrow strip mining, slice mining and longwall cave mining. The Kriging interpolation method is employed to draw the contour map of Φ. According to the zoning map of Φ in the entire coal area, the WBCWSRS in the mining area is classified into five categories, namely extremely high (0.9 < Φ < 1), high (0.8 < Φ < 0.9), medium (0.7 < Φ < 0.8), low (0.6 < Φ < 0.7) and extremely low (Φ < 0.6).
(4)
Corresponding countermeasures are put forward for the WSRS with various WBC. For areas with no Salawusu aquifer or with extremely high WBCWSRS, longwall cave mining can be selected. The coordinated mining methods, such as slice mining, can be employed to achieve WPCM in the areas with high WBCWSRS. For areas with medium WBCWSRS, the partial mining methods, including narrow strip mining, room-and-pillar mining and height-limited mining, can be employed. Moreover, backfill mining is an ideal method to realize WPCM for areas with low WBCWSRS. In view of the areas with extremely low WBCWSRS, such as the stratigraphic structure of burnt rock, WSRS reconstruction or underground reservoir construction can be employed to achieve WPCM in the sense of blocking and dredging.
(5)
The fluid–solid coupling module of FLAC3D is employed to simulate the variation law of the groundwater level under backfill mining, narrow strip mining, slice mining and longwall cave mining. The water level drop of the Salawusu aquifer corresponding to the four mining methods is 0.22 m, 1.33 m, 5.98 m and 6.64 m, respectively, which indirectly suggests the various impacts of the four mining methods on the stability and integrity of the WBCWSRS. Two mining methods, such as backfill mining and narrow strip mining, which have been optimized in terms of their mining parameters, are determined to meet the water demand of ecological vegetation in the study area.

Author Contributions

Conceptualization, Y.X. and L.M.; methodology, Y.X.; formal analysis, I.N.; investigation, Y.W. and L.H.; resources, Y.X.; data curation, J.Z. and Y.X.; writing—original draft preparation, L.M.; writing—review and editing, L.M. and Y.X.; supervision, L.M.; project administration, L.M.; funding acquisition, L.M. All authors have read and agreed to the published version of the manuscript.

Funding

This paper was funded by the National Natural Science Foundation of China (51874280) and the Fundamental Research Funds for the Central Universities (2021ZDPY0211).

Institutional Review Board Statement

Not applicable.

Informed Consent Statement

Not applicable.

Data Availability Statement

All data that support the findings of this study are available from the corresponding author upon reasonable request.

Acknowledgments

This paper was supported by the National Natural Science Foundation of China (51874280) and the Fundamental Research Funds for the Central Universities (2021ZDPY0211).

Conflicts of Interest

The authors declare no conflict of interest.

Abbreviations

WPCMwater-preserving coal mining
NWSRZnominal water-seepage-resisting zone
WSRSwater-seepage-resistance strata
WBCwater-blocking capacity
WBCWSRSwater-blocking capacity of water-seepage-resistance strata
AHPFAHP-fuzzy comprehensive evaluation
WCFZwater-conducting fracture zone

References

  1. Zhang, D.; Fan, G.; Ma, L.; Wang, X. Aquifer protection during longwall mining of shallow coal seams: A case study in the Shendong Coalfield of China. Int. J. Coal. Geol. 2011, 86, 190–196. [Google Scholar] [CrossRef]
  2. Ma, L.; Jin, Z.; Liang, J.; Sun, H.; Zhang, D.; Li, P. Simulation of water resource loss in short-distance coal seams disturbed by repeated mining. Environ. Earth Sci. 2015, 74, 5653–5662. [Google Scholar] [CrossRef]
  3. Wang, A.; Ma, L.; Wang, Z.; Zhang, D.; Li, K.; Zhang, Y.; Yi, X. Soil and water conservation in mining area based on ground surface subsidence control: Development of a high-water swelling material and its application in backfilling mining. Environ. Earth Sci. 2016, 75, 779. [Google Scholar] [CrossRef]
  4. Wang, S.; Ma, L. Characteristics and control of mining induced fractures above longwall mines using backfilling. Energies 2019, 12, 4604. [Google Scholar] [CrossRef]
  5. Xu, Y.; Ma, L.; Yu, Y. Water preservation and conservation above coal mines using an innovative approach: A case study. Energies 2020, 13, 2818. [Google Scholar] [CrossRef]
  6. Xu, Y.; Ma, L.; Khan, N.M. Prediction and maintenance of water resources carrying capacity in mining area-a case study in the Yu-shen mining area. Sustainability 2020, 12, 7782. [Google Scholar] [CrossRef]
  7. Sun, K.; Fan, L.; Xia, Y.; Li, C.; Chen, J.; Gao, S.; Wu, B.; Peng, J.; Ji, Y. Impact of coal mining on groundwater of Luohe Formation in Binchang mining area. Int. J. Coal Sci. Technol. 2021, 8, 88–102. [Google Scholar] [CrossRef]
  8. Li, L.; Li, F.M.; Zhang, Y.; Yang, D.M.; Liu, X. Formation mechanism and height calculation of the caved zone and water-conducting fracture zone in solid backfill mining. Int. J. Coal Sci. Technol. 2020, 7, 208–215. [Google Scholar] [CrossRef]
  9. Hou, E.; Wen, Q.; Ye, Z.; Chen, W.; Wei, J. Height prediction of water-flowing fracture zone with a genetic-algorithm support-vector-machine method. Int. J. Coal Sci. Technol. 2020, 7, 740–751. [Google Scholar] [CrossRef]
  10. Lian, X.; Hu, H.; Li, T.; Hu, D. Main geological and mining factors affecting ground cracks induced by underground coal mining in Shanxi Province, China. Int. J. Coal Sci. Technol. 2020, 7, 362–370. [Google Scholar] [CrossRef]
  11. Wang, J.; Yang, S.; Wei, W.; Zhang, J.; Song, Z. Drawing mechanisms for top coal in longwall top coal caving (LTCC): A review of two decades of literature. Int. J. Coal Sci. Technol. 2021, 8, 1171–1196. [Google Scholar] [CrossRef]
  12. Yang, D.; Ning, Z.; Li, Y.; Lv, Z.; Qiao, Y. In situ stress measurement and analysis of the stress accumulation levels in coal mines in the northern Ordos Basin, China. Int. J. Coal Sci. Technol. 2021, 8, 1316–1335. [Google Scholar] [CrossRef]
  13. Jangara, H.; Ozturk, A.C. Longwall top coal caving design for thick coal seam in very poor strength surrounding strata. Int. J. Coal Sci. Technol. 2021, 8, 641–658. [Google Scholar] [CrossRef]
  14. Fan, L.; Ma, X. A review on investigation of water-preserved coal mining in western China. Int. J. Coal Sci. Technol. 2018, 5, 411–416. [Google Scholar] [CrossRef]
  15. Fan, L.; Ma, L.; Yu, Y.; Wang, S.; Xu, Y. Water-conserving mining influencing factors identification and weight determination in northwest China. Int. J. Coal Sci. Technol. 2019, 6, 95–101. [Google Scholar] [CrossRef]
  16. Wang, S.; Huang, Q.; Fan, L.; Yang, Z.; Shen, T. Study on overburden aquiclude and water protection mining regionalization in the ecological fragile mining area. J. China Coal Soc. 2010, 35, 7–14. [Google Scholar]
  17. Huang, Q. Impermeability of overburden rock shallow buried coal seam and classification of water conservation mining. Chin. J. Rock Mech. Eng. 2010, 29, 3622–3627. [Google Scholar]
  18. Yang, Z.; Li, W.; Pei, Y.; Qiao, W.; Wu, Y. Classification of the type of eco-geological environment of a coal mine district: A case study of an ecologically fragile region in Western China. J. Clean. Prod. 2018, 174, 1513–1526. [Google Scholar] [CrossRef]
  19. Liu, S.; Li, W.; Wang, Q. Zoning method for environmental engineering geological patterns in underground coal mining areas. Sci. Total Environ. 2018, 634, 1064–1076. [Google Scholar] [CrossRef]
  20. Booth, C.J. Groundwater as an environmental constraint of longwall coal mining. Environ. Earth Sci. 2006, 49, 796–803. [Google Scholar] [CrossRef]
  21. Howladar, M.F. Coal mining impacts on water environs around the Barapukuria coal mining area, Dinajpur, Bangladesh. Environ. Earth Sci. 2012, 70, 215–226. [Google Scholar] [CrossRef]
  22. Gandhe, A.; Venkateswarlu, V.; Gupta, R.N. Extraction of coal under a surface water body—A strata control investigation. Rock Mech. Rock Eng. 2005, 38, 399–410. [Google Scholar] [CrossRef]
  23. Hill, J.G.; Price, D.R. The impact of deep mining on an overlying aquifer in western Pennsylvania. Ground Water Monit. R. 1983, 3, 138–143. [Google Scholar] [CrossRef]
  24. Stoner, J.D. Probable hydrologic effects of subsurface mining. Ground Water Monit. R. 1983, 3, 128–137. [Google Scholar] [CrossRef]
  25. Arkoc, O.; Ucar, S.; Ozcan, C. Assessment of impact of coal mining on ground and surface waters in Tozakli coal field, Kırklareli, northeast of Thrace, Turkey. Environ. Earth Sci. 2016, 75, 514. [Google Scholar] [CrossRef]
  26. Newman, C.; Agioutantis, Z.; Leon, G.B.J. Assessment of potential impacts to surface and subsurface water bodies due to longwall mining. Int. J. Min. Sci. Tech. 2017, 27, 57–64. [Google Scholar] [CrossRef]
  27. Booth, C.J. The effects of longwall coal mining on overlying aquifers. Geol. Soc. 2002, 198, 17–45. [Google Scholar] [CrossRef]
  28. Robertson, J. Challenges in sustainably managing groundwater in the Australian Great Artesian Basin: Lessons from current and historic legislative regimes. Hydrogeol. J. 2020, 28, 343–360. [Google Scholar] [CrossRef]
  29. Palchik, V. Formation of fractured zones in overburden due to longwall mining. Environ. Geol. 2003, 44, 28–38. [Google Scholar] [CrossRef]
  30. Majdi, A.; Hassani, F.P.; Nasiri, M.Y. Prediction of the height of destressed zone above the mined panel roof in longwall coal mining. Int. J. Coal Geol. 2012, 98, 62–72. [Google Scholar] [CrossRef]
  31. Adhikary, D.P.; Guo, H. Measurement of longwall mining induced strata permeability. Geotech. Geol. Eng. 2014, 32, 617–626. [Google Scholar] [CrossRef]
  32. Adhikary, D.P.; Guo, H. Modelling of longwall mining-induced strata permeability change. Rock Mech. Rock Eng. 2015, 48, 345–359. [Google Scholar] [CrossRef]
  33. Wu, Q.; Liu, Y.; Zhou, W.; Li, B.; Zhao, B.; Liu, S.; Sun, W.; Zeng, F. Evaluation of water inrush vulnerability from aquifers overlying coal seams in the Menkeqing coal mine, China. Mine Water Environ. 2015, 34, 258–269. [Google Scholar] [CrossRef]
  34. Meng, Z.; Li, G.; Xie, X. A geological assessment method of floor water inrush risk and its application. Eng. Geol. 2012, 143, 51–60. [Google Scholar] [CrossRef]
  35. Qiu, M.; Shi, L.; Teng, C.; Zhou, Y. Assessment of water inrush risk using the fuzzy delphi analytic hierarchy process and grey relational analysis in the Liangzhuang coal mine, China. Mine Water Environ. 2017, 36, 39–50. [Google Scholar] [CrossRef]
  36. Yang, W.; Xia, X.; Pan, B.; Gu, C.; Yue, J. The fuzzy comprehensive evaluation of water and sand inrush risk during underground mining. J. Intell. Fuzzy Syst. 2016, 30, 2289–2295. [Google Scholar] [CrossRef]
  37. Liu, J.; Zhang, D.; Yang, B.; Liu, S.; Wang, Y.; Xu, K. Suitability of aquifer-protection mining in ecologically fragile areas in western China. Environ. Earth Sci. 2020, 79, 1–17. [Google Scholar] [CrossRef]
  38. Zhu, T.; Li, W.; Chen, W. Risk assessment of Cretaceous water inrush in the Ordos Basin based on the FAHP-EM. Water Policy 2021, 23, 1249–1265. [Google Scholar] [CrossRef]
  39. Wang, Y.; Yang, W.; Li, M.; Liu, X. Risk assessment of floor water inrush in coal mines based on secondary fuzzy comprehensive evaluation. Int. J. Rock Mech. Min. Sci. 2012, 52, 50–55. [Google Scholar] [CrossRef]
  40. Saranya, T.; Saravanan, S. Groundwater potential zone mapping using analytical hierarchy process (AHP) and GIS for Kancheepuram District, Tamilnadu, India. Model. Earth Syst. Env. 2020, 6, 1105–1122. [Google Scholar] [CrossRef]
  41. Razandi, Y.; Pourghasemi, H.R.; Neisani, N.S.; Rahmati, O. Application of analytical hierarchy process, frequency ratio, and certainty factor models for groundwater potential mapping using GIS. Earth Sci. Inform. 2015, 8, 867–883. [Google Scholar] [CrossRef]
  42. Rahmati, O.; Nazari, S.A.; Mahdavi, M.; Pourghasemi, H.R.; Zeinivand, H. Groundwater potential mapping at Kurdistan region of Iran using analytic hierarchy process and GIS. Arab. J. Geosci. 2015, 8, 7059–7071. [Google Scholar] [CrossRef]
  43. Jothibasu, A.; Anbazhagan, S. Modeling groundwater probability index in Ponnaiyar River basin of South India using analytic hierarchy process. Model. Earth Syst. Environ. 2016, 2, 1–14. [Google Scholar] [CrossRef]
  44. Murmu, P.; Kumar, M.; Lal, D.; Sonkerb, I.; Singhc, S.K. Delineation of groundwater potential zones using geospatial techniques and analytical hierarchy process in Dumka district, Jharkhand, India. Groundw. Sustain. Dev. 2019, 9, 100239. [Google Scholar] [CrossRef]
  45. Ghosh, D.; Mandal, M.; Banerjee, M.; Karmakar, M. Impact of hydro-geological environment on availability of groundwater using analytical hierarchy process (AHP) and geospatial techniques: A study from the upper Kangsabati river basin. Groundw. Sustain. Dev. 2020, 11, 100419. [Google Scholar] [CrossRef]
  46. Ozegin, K.O.; Oseghale, A.O. Geophysical characterization of shallow aquifers in a sedimentary area: A case study. Adv. Appl. Sci. Res. 2012, 3, 469–474. [Google Scholar]
  47. Aryafar, A.; Yousefi, S.; Ardejani, F.D. The weight of interaction of mining activities: Groundwater in environmental impact assessment using fuzzy analytical hierarchy process (FAHP). Environ. Earth Sci. 2013, 68, 2313–2324. [Google Scholar] [CrossRef]
  48. Odintsev, V.N.; Miletenko, N.A. Water inrush in mines as a consequence of spontaneous hydrofracture. J. Min. Sci. 2015, 51, 423–434. [Google Scholar] [CrossRef]
  49. Yu, H.; Gui, H.; Zhao, H.; Wang, M.; Li, J.; Fang, H.; Jiang, Y.; Zhang, Y. Hydrochemical characteristics and water quality evaluation of shallow groundwater in Suxian mining area, Huaibei coalfield, China. Int. J. Coal Sci. Technol. 2020, 7, 825–835. [Google Scholar] [CrossRef]
  50. Yu, H.; Jia, H.; Liu, S.; Liu, Z.; Li, B. Macro and micro grouting process and the influence mechanism of cracks in soft coal seam. Int. J. Coal Sci. Technol. 2021, 8, 969–982. [Google Scholar] [CrossRef]
  51. Wang, J.; Yang, J.; Wu, F.; Hu, T.; Faisal, A.S. Analysis of fracture mechanism for surrounding rock hole based on water-filled blasting. Int. J. Coal Sci. Technol. 2020, 7, 704–713. [Google Scholar] [CrossRef]
  52. Gao, R.; Kuang, T.; Zhang, Y.; Zhang, W.; Quan, C. Controlling mine pressure by subjecting high-level hard rock strata to ground fracturing. Int. J. Coal Sci. Technol. 2021, 8, 1336–1350. [Google Scholar] [CrossRef]
  53. Li, C.; Guo, D.; Zhang, Y.; An, C. Compound-mode crack propagation law of PMMA semicircular-arch roadway specimens under impact loading. Int. J. Coal Sci. Technol. 2021, 8, 1302–1315. [Google Scholar] [CrossRef]
  54. Wu, R.; Zhang, P.; Kulatilake, P.H.S.W.; Luo, H.; He, Q. Stress and deformation analysis of gob-side pre-backfill driving procedure of longwall mining: A case study. Int. J. Coal Sci. Technol. 2021, 8, 1351–1370. [Google Scholar] [CrossRef]
  55. Lou, J.; Gao, F.; Yang, J.; Ren, Y.; Li, J.; Wang, X.; Yang, L. Characteristics of evolution of mining-induced stress field in the longwall panel: Insights from physical modeling. Int. J. Coal Sci. Technol. 2021, 8, 938–955. [Google Scholar] [CrossRef]
  56. Vervoort, A. Various phases in surface movements linked to deep coal longwall mining: From start-up till the period after closure. Int. J. Coal Sci. Technol. 2021, 8, 412–426. [Google Scholar] [CrossRef]
  57. Chi, X.; Yang, K.; Wei, Z. Breaking and mining-induced stress evolution of overlying strata in the working face of a steeply dipping coal seam. Int. J. Coal Sci. Technol. 2021, 8, 614–625. [Google Scholar] [CrossRef]
  58. Cao, D.; Wang, A.; Ning, S.; Li, H.; Guo, A.; Chen, L.; Liu, K.; Tan, J.; Zheng, Z. Coalfield structure and structural controls on coal in China. Int. J. Coal Sci. Technol. 2020, 7, 220–239. [Google Scholar] [CrossRef]
  59. Mao, S. Development of coal geological information technologies in China. Int. J. Coal Sci. Technol. 2020, 7, 320–328. [Google Scholar] [CrossRef]
  60. Song, Z.; Ji, H.; Liu, Z.; Sun, L. Study on the critical stress threshold of weakly cemented sandstone damage based on the renormalization group method. Int. J. Coal Sci. Technol. 2020, 7, 693–703. [Google Scholar] [CrossRef]
  61. Sun, C.; Li, G.; Gomah, E.M.; Xu, J.; Rong, H. Experimental investigation on the nanoindentation viscoelastic constitutive model of quartz and kaolinite in mudstone. Int. J. Coal Sci. Technol. 2021, 8, 925–937. [Google Scholar] [CrossRef]
  62. Guo, P.; Gu, J.; Su, Y.; Wang, J.; Ding, Z. Effect of cyclic wetting–drying on tensile mechanical behavior and microstructure of clay-bearing sandstone. Int. J. Coal Sci. Technol. 2021, 8, 956–968. [Google Scholar] [CrossRef]
  63. Xu, Y. Study on “Five Maps, Three zones and Two Zoning Plans” Water Conservation Mining Method in Yu-Shen Mining Area. Master’s Thesis, China University of Mining Science & Technology, Xuzhou, China, 2019; p. 6. [Google Scholar]
  64. Xu, Y.J.; Ma, L.Q.; Ngo, I.H.; Zhai, J.T. Prediction of the height of water-conductive fractured zone under continuous extraction and partial backfill mining method—A case study. Energies 2022, 14, 6582. [Google Scholar] [CrossRef]
  65. Xu, Y.J.; Ma, L.Q.; Ngo, I.H.; Zhai, J.T. Continuous extraction and continuous backfill mining method using carbon dioxide mineralized filling body to preserve shallow water in Northwest China. Energies 2022, 15, 3614. [Google Scholar] [CrossRef]
  66. Ajayi, S.A.; Ma, L.; Spearing, A.J.S. Ground stress analysis and automation of workface in continuous mining continuous backfill operation. Minerals 2022, 12, 754. [Google Scholar] [CrossRef]
  67. Wang, S.; Huang, Q. Coal Mining and Ecological Water Level Protection in Ecologically Fragile Areas, 3rd ed.; Science Press: Beijing, China, 2010; pp. 92–106. [Google Scholar]
  68. Du, W.; Jiang, Y.; Ma, Z.; Jiao, Z. Assessment of water inrush and factor sensitivity analysis in an amalgamated coal mine in China. Arab. J. Geosci. 2017, 10, 1–9. [Google Scholar] [CrossRef]
  69. Wang, W.; Dong, C.; Dong, W.; Yang, C.; Ju, T.; Huang, L.; Ren, Z. The design and implementation of risk assessment model for hazard installations based on AHP–FCE method: A case study of Nansi Lake Basin. Ecol. Inform. 2016, 36, 162–171. [Google Scholar] [CrossRef]
  70. Lin, K.; Huang, W.; Finkelman, B.; Chen, J.; Yi, S.; Cui, X.; Wang, Y. Distribution, modes of occurrence, and main factors influencing lead enrichment in Chinese coals. Int. J. Coal Sci. Technol. 2020, 7, 1–18. [Google Scholar] [CrossRef]
  71. Xue, J.; Shi, L.; Wang, H.; Ji, Z.; Shang, H.; Xu, F.; Zhao, C.; Huang, H.; Luo, A. Water abundance evaluation of a burnt rock aquifer using the AHP and entropy weight method: A case study in the Yongxin coal mine, China. Environ. Earth Sci. 2021, 80, 1–12. [Google Scholar] [CrossRef]
  72. Yan, M.; Zhu, S.; Duan, H. Risk assessment of water inrush from Ordovician limestone based on analytic hierarchical process modelling and water resistance. Arab. J. Geosci. 2021, 14, 1–13. [Google Scholar] [CrossRef]
  73. Liu, J.; Yang, B.; Yuan, S.; Li, Z.; Yang, M.; Duan, L. A Fuzzy analytical process to assess the risk of disaster when backfill mining under aquifers and buildings. Mine Water Environ. 2021, 40, 891–901. [Google Scholar] [CrossRef]
  74. Xu, Y.; Ma, L.; Ngo, I.; Wang, Y.; Zhai, J.; Hou, L. Prediction of the adaptability of using continuous extraction and continuous backfill mining method to sequestrate CO2—A case study. Minerals 2022, 12, 936. [Google Scholar] [CrossRef]
  75. Hu, G.; Liu, G.; Wu, D.; Zhang, W.; Fu, B. Method for evaluation of the cleanliness grade of coal resources in the Huainan Coalfield, Anhui, China: A case study. Int. J. Coal Sci. Technol. 2021, 8, 534–546. [Google Scholar] [CrossRef]
  76. Chu, H.; Xu, G.; Yasufuku, N.; Yu, Z.; Liu, P.; Wang, J. Risk assessment of water inrush in karst tunnels based on two-class fuzzy comprehensive evaluation method. Arab. J. Geosci. 2017, 10, 1–12. [Google Scholar] [CrossRef]
  77. Zhang, K.; Li, H.; Han, J.; Jiang, B.; Gao, J. Understanding of mineral change mechanisms in coal mine groundwater reservoir and their influences on effluent water quality: A experimental study. Int. J. Coal Sci. Technol. 2021, 8, 154–167. [Google Scholar] [CrossRef]
  78. Fallgren, P.; Chen, L.; Peng, M.; Urynowicz, M.; Jin, S. Facultative-anaerobic microbial digestion of coal preparation waste and use of effluent solids to enhance plant growth in a sandy soil. Int. J. Coal Sci. Technol. 2021, 8, 767–779. [Google Scholar] [CrossRef]
  79. Chen, L.; Feng, X.; Xu, D.; Zeng, W.; Zheng, Z. Prediction of water inrush areas under an unconsolidated, confined aquifer: The application of multi-information superposition based on GIS and AHP in the Qidong coal mine, China. Mine Water Environ. 2018, 37, 786–795. [Google Scholar] [CrossRef]
  80. Li, X.; Cai, J.; Chen, D.; Feng, Q. Characteristics of water contamination in abandoned coal mines: A case study on Yudong River area, Kaili, Guizhou Province, China. Int. J. Coal Sci. Technol. 2021, 8, 1491–1503. [Google Scholar] [CrossRef]
Figure 1. Comprehensive geological histogram of the Yu-Shen coal area.
Water 14 02517 g001
Figure 2. The main types of underground aquifers in the Yu-Shen coal area.
Water 14 02517 g002
Figure 3. The columns of various types of WSRS. (a) Type Ⅰ WSRS; (b) Type Ⅱ WSRS; (c) Type Ⅲ WSRS; (d) Type Ⅳ WSRS; (e) Without WSRS.
Water 14 02517 g003
Figure 4. Schematic map of “three seepage zones” and the various components of NWSRZ: (a) consisting of type Ⅰ WSRS and intact strata; (b) consisting of type Ⅱ WSRS and intact strata; (c) consisting of type Ⅲ WSRS; (d) consisting of type Ⅳ WSRS.
Water 14 02517 g004
Figure 5. Indicators of AHP hierarchy for evaluating the WBCWSRS.
Water 14 02517 g005
Figure 6. Schematic diagram of geological section of five various stratigraphic structures in the Yu-Shen mining area. (a) Sand–soil–bedrock; (b) sand–bedrock; (c) bedrock; (d) soil–bedrock; (e) burnt rock.
Water 14 02517 g006
Figure 7. Thematic map of the stratigraphic structure and the types of WSRS in the Yu-Shen mining area. (a) Zoning map of stratigraphic structure; (b) zoning map of the types of WSRS.
Water 14 02517 g007
Figure 8. The distribution of water-conducting fractures under longwall cave mining (the mining height is 5 m) [63]. Adapted from Ref. [63].
Water 14 02517 g008
Figure 9. The distribution of water-conducting fractures under narrow strip mining (the width of the extracted and unextracted strip is 25 m and 15 m, respectively) [64]. Adapted from Ref. [64].
Water 14 02517 g009
Figure 10. Thematic maps of the vertical level of the WSRS. (a) Contour map of the height of the caved zone in longwall cave mining; (b) contour map of the height of WCFZ in longwall cave mining; (c) contour map of the height of WCFZ in narrow strip mining (the width of the extracted and unextracted strip is 25 m and 15 m, respectively).
Water 14 02517 g010
Figure 11. Thematic maps of the WSRS system in the Yu-Shen coal area. (a) The thickness of the loess and red clay (type Ⅰ WSRS); (b) the distance between the overlying aquifer and the first-mined coal seam; (c) the thickness of the bedrock (type Ⅱ WSRS); (d) the thickness of NWSRZ under longwall cave mining; (e) the thickness of NWSRZ under narrow strip mining (the width of the extracted and unextracted strip is 25 m and 15 m, respectively).
Water 14 02517 g011
Figure 12. The equivalent permeability coefficient (×106) of the NWSRZ in the Yu-Shen coal area while using various mining methods. (a) Backfill mining; (b) narrow strip mining; (c) slice mining; (d) longwall cave mining.
Water 14 02517 g012
Figure 13. Field-measured data of the underground aquifer system. (a) Zoning map of water yield property of Salawusu Formation aquifer; (b) zoning map of water table lowering of aquifer after coal extraction; (c) zoning map of the coefficient of recharge from precipitation.
Water 14 02517 g013aWater 14 02517 g013b
Figure 14. Thematic maps of the coal extraction system. (a) Contour map of the thickness of the first-mined coal seam; (b) contour map of the buried depth of the first-mined coal seam.
Water 14 02517 g014
Figure 15. Flow chart of AHP-fuzzy comprehensive evaluation for predicting the WBCWSRS.
Water 14 02517 g015
Figure 16. Thematic map of the comprehensive evaluation values Φ of the WBCWSRS in the Yu-Shen mining area while using four different mining methods. (a) Backfill mining; (b) partial mining; (c) slice mining; (d) longwall cave mining.
Water 14 02517 g016aWater 14 02517 g016b
Figure 17. Numerical simulation model of Yubujie colliery.
Water 14 02517 g017
Figure 18. Fluid–solid coupling simulation results of groundwater depression cone and the contour map of water table lowering using four different mining methods. (a) Backfill mining; (b) narrow strip mining; (c) slice mining; (d) longwall cave mining.
Water 14 02517 g018
Table 1. Permeability coefficient of the overlying strata with various lithologies.
LithologyPermeability Coefficient (cm/s)
Clay<10−7
Loess3 × 10−4–6 × 10⁻³
Siltstone6 × 10−4–1 × 10⁻³
Fine sandstone1 × 10−3–6 × 10⁻³
Medium sandstone6 × 10−3–2 × 10⁻²
Coarse sandstone2 × 10−2–6 × 10⁻²
Circular gravel6 × 10−2–1 × 10⁻¹
Gravel1 × 10−1–6 × 10⁻¹
Table 2. Classification of water abundance properties of underground aquifers [5].
Water RichnessThickness (m)Unit Water Inflow (L·s−1·m−1)Permeability Coefficient (m·d−1)
Very high>30>10>50
High15–305–1010–50
Medium5–150.1–51–10
Low1–50.005–0.10.01–1
Very low<1<0.005<0.01
Table 3. Criteria for evaluating the WBCWSRS.
GradeTypeΦ ValueRemark
Very highΦ > 0.90The underground aquifer can completely be preserved and conserved since the WSRS is fully capable of resisting water seepage.
High0.90 ≥ Φ > 0.80Mining activities exert little influence on the WBCWSRS. Micro water seepage may occur in the WSRS. However, it is too small to be emphasized, and the WPCM can still be achieved under this situation.
Moderate0.80 ≥ Φ > 0.70Mining-induced migration of overburden aggregates, and fractures with moderate aperture are generated and developed in the WSRS, contributing to the degradation of WBCWSRS. Underground water is prone to penetrating through the WSRS and then percolating into the mined-out area. However, this is controllable by taking countermeasures, such as partial mining and harmonic mining.
Low0.70 ≥ Φ ≥ 0.60The WSRS has been slightly broken and interconnected fractures with wide aperture from the bottom to the top of WSRS have been formed. It is necessary to use backfill mining to maintain the integrity of WSRS. Otherwise, water inrush may happen without any countermeasures being taken.
Extremely low0.60 > ΦThe WSRS is totally broken and water and sand inrush will occur; the mining activities should be strictly prohibited.
Table 4. Results of consistency test of the judgment matrices of Yu-Shen mining area.
MatrixSort VectorλmaxC.I.R.I.C.R.
A~B(0.5502, 0.2395, 0.2103)3.07220.03610.520.0690
B1~C(0.1413, 0.2830, 0.4240, 0.1517)4.08170.02720.890.0310
B2~C(0.5453, 0.2726, 0.1821)3.00170.00090.520.0016
B3~C(0.7500, 0.2500)2000
Table 5. Influencing indicators and weight distribution of WBCWSRS.
Weights of Layer BWeights of Layer C
WSRS system B1
0.5502
The classification of the WSRS C1
0.0777
The vertical level of WSRS C2
0.1557
The equivalent permeability of NWSRZ C3
0.2333
The integrity of WSRS C4
0.0835
Underground aquifer system B2
0.2395
Water yield property C5
0.1306
Water table lowering C6
0.0653
Recharge C7
0.0436
Coal extraction system B3
0.2103
Mining methods C8
0.1577
Mining parameters C9
0.0526
Total of layer B
1.0000
Total of layer C
1.0000
Table 6. The physical and mechanical parameters of strata and filling body.
StrataBulk Density
(kN/m3)
Bulk Modulus
(GPa)
Shear Modulus
(GPa)
Friction
Angle (°)
Cohesion
(MPa)
Tensile Strength
(MPa)
Fine sandstone2630.820.3355.64.0
Sandstone252.52.3362.21.3
Clay190.280.093250.850.35
Siltstone2416.111.6212.01.2
Gritstone2520.811.9233.01.4
Mudstone228.34.3252.11.0
Medium sandstone2523.114.52.84.42.0
Coal/filling body18/172.2/0.130.76/0.1120/361/0.1918.8/18.0
Table 7. Relationship between water level and the growth of ecological vegetation from field investigation [67].
Vegetation TypeWater Level and the Growth of Vegetation
Salix mongolica<1.5 m (Flourishing)1.5–3.0 m (Decent)3.0–5.0 m (Regular)>5.0 m (Terrible)
Artemisia annua<1.5 m (Flourishing)1.5–3.0 m (Decent)3.0–5.0 m (Regular)>5.0 m (Terrible)
Populus diversifolia<1.5 m (Flourishing)1.5–3.0 m (Decent)3.0–5.0 m (Regular)>5.0 m (Terrible)
Dryland willow<3.0 m (Flourishing)3.0–7.0 m (Decent)7.0–12.0 m (Regular)>12.0 m (Terrible)
Publisher’s Note: MDPI stays neutral with regard to jurisdictional claims in published maps and institutional affiliations.

