Article

The PlaceMarker Survey: A Place-Based Tool for Supporting the Monitoring and Appraisal of River-Related Projects and Natural Capital Assessments

1
School of Geography, Queen Mary University of London, London E1 4NS, UK
2
National Environmental Assessment & Sustainability (NEAS) Environment Agency, Exeter EX2 7LQ, UK
3
Cartographer Studios Ltd., Brighton BN1 4GD, UK
*
Author to whom correspondence should be addressed.
Water 2022, 14(16), 2514; https://doi.org/10.3390/w14162514
Submission received: 31 July 2022 / Revised: 8 August 2022 / Accepted: 9 August 2022 / Published: 15 August 2022
(This article belongs to the Special Issue River Restoration: Monitoring, Appraisal and Management)

Abstract

:
The PlaceMarker Survey is an operational tool to support the delivery of the core aims of England’s Environment Agency (EA) in helping to increase resilience to climate change, manage flood risk, and create a better place for people and wildlife. It was developed in response to a recognised need by the EA’s National Environmental Assessment and Sustainability (NEAS) team for a broad-based survey undertaken in the field to get to know the site and prior to more specialist surveys. The key aim of the survey is to capture in a systematic and consistent way the character and condition of a place where river-related projects such as flood risk management and river restoration schemes are proposed to inform discussions around the design and planning of a project and provide the baseline for future place-based monitoring. The tool comprises: a Study Area Survey and one or more River Surveys, which provide measurements to generate metrics and information to support assessments of Habitat and Biodiversity, Landscape, Amenity, and Heritage. Data are stored, analysed, retrieved, shared, and displayed through a web-based information system. It is intended that a PlaceMarker Survey will be conducted on at least three occasions in the lifetime of a project or asset: pre-inception of a project to understand the broad environmental baseline and assist in the design of a scheme; immediately post-project to confirm the “as-built condition”; and post-recovery from the works to monitor the environmental response to interventions at the site. Tracking the assessments over time informs evaluations of environmental enhancements and supports decision-making around adaptive management.

1. Introduction

The environment is arguably our most valuable asset, and the importance of valuing nature both in economic and non-economic terms is widely accepted [1,2,3]. Thus, the U.K. Government in its 25-year Plan has pledged to “take into account the often hidden additional benefits in every aspect of the environment for national well-being, health, and economic prosperity” [4] (p. 9). The Plan responds to the Natural Capital Committee’s conclusion that, across the country, benefits are not being fully realized. Thus, a commitment was made “… to put the environment at the heart of planning and development to create better places for people to live and work” [4] (p. 32), [5] … “and seek to embed a ‘net environmental gain’ principle for development to deliver environmental improvements locally and nationally” [4] (p. 33). This is reinforced by the U.K.’s Environment Act (2021), which has provisions to maintain environmental standards outside the EU through targets, improvement plans, and monitoring, including Biodiversity gain in planning.
River-related projects, such as flood alleviation and river restoration schemes, increasingly consider the development of both blue and adjoining green spaces and have enormous potential to make space for water [6] and nature [7] and deliver a wide range of benefits or ecosystem services [8,9,10,11,12] as part of sustainable development [5,13]. However, more widespread and improved monitoring and appraisal is needed to build a better baseline for identifying potential enhancement options, as well as risks. The delivery and longer-term benefits of a project can then be measured against this environmental baseline. The need to meet the legislative requirements of the Flood and Water Management Act (2010) and Water Framework Directive (WFD) [14] has also emphasised the importance of monitoring to evaluate flood risk management and river restoration projects [15,16].
The PlaceMarker Survey was conceived of and commissioned in response to a recognised need by the Environment Agency’s (EA’s) National Environmental Assessment and Sustainability (NEAS) team for a broad place-based survey. This was deemed essential to support their work on Flood Risk Management projects [4,17,18] and to fit within the wider context of Natural Capital Assessment [12,19,20], the National Planning Policy Framework [5], and Biodiversity Net Gain requirements [21]. NEAS oversees the effective management of environmental risk and identifies and helps deliver environmental enhancements that leave a better place for both people and wildlife. They achieve this through strategic and early assessment of a project and ongoing monitoring following the completion of projects. Thus, the survey would need to be field-based, necessitating a walk-over of the whole site, allowing information on the character and condition of a place to be captured in a systematic and consistent way. Through this process, the survey would help identify a wide range of options, as well as possible risks and also create a baseline. For low-risk sites where EA projects do not require planning or Environmental Impact Assessments, this baseline would ensure that environmental opportunity helps inform options. At other sites, PlaceMarker would underpin a suite of specialist surveys and products including: Environmental Site Appraisals; Environmental Design Concept Reports; Indicative Landscape Plans; Options Plans; Landscape Visual Impact Assessments; Landscape Master Plans; Detailed Design Drawings; Phase 1 Habitat Surveys [22]; and desk-based Heritage assessments. For Planning Consent, PlaceMarker surveys would also support Planning Applications through, for example, baseline information for impact assessments and in relation to Disability Access to Amenity facilities at the site. NEAS also identified the potential for an early place-based survey in supporting their consideration of WFD-related issues when assessing EA development plans and options for water body improvement, but importantly, the tool does not substitute for current monitoring strategies. Upon completion of a project, a second PlaceMarker survey could be used to inform Public Realm Safety Assessments for Amenity and check a scheme’s compliance in terms of environmental, Landscape, and Heritage consent conditions. Finally, PlaceMarker Surveys have the potential to provide useful site information prior to river condition assessments [23] for Biodiversity Net Gain assessments, a methodology for measuring and accounting for Biodiversity losses and gains resulting from development or land management change across England [21,24,25].
In this paper, we describe the key features of the PlaceMarker Survey and report on the findings from the development and initial applications of the prototype version. With an original working title Ecostatus, the tool was renamed the PlaceMarker Survey in November 2018 to better reflect the broader, place-based character of the survey tool and how it is used to establish baseline conditions from which to monitor and mark changes over time.

2. The PlaceMarker Survey
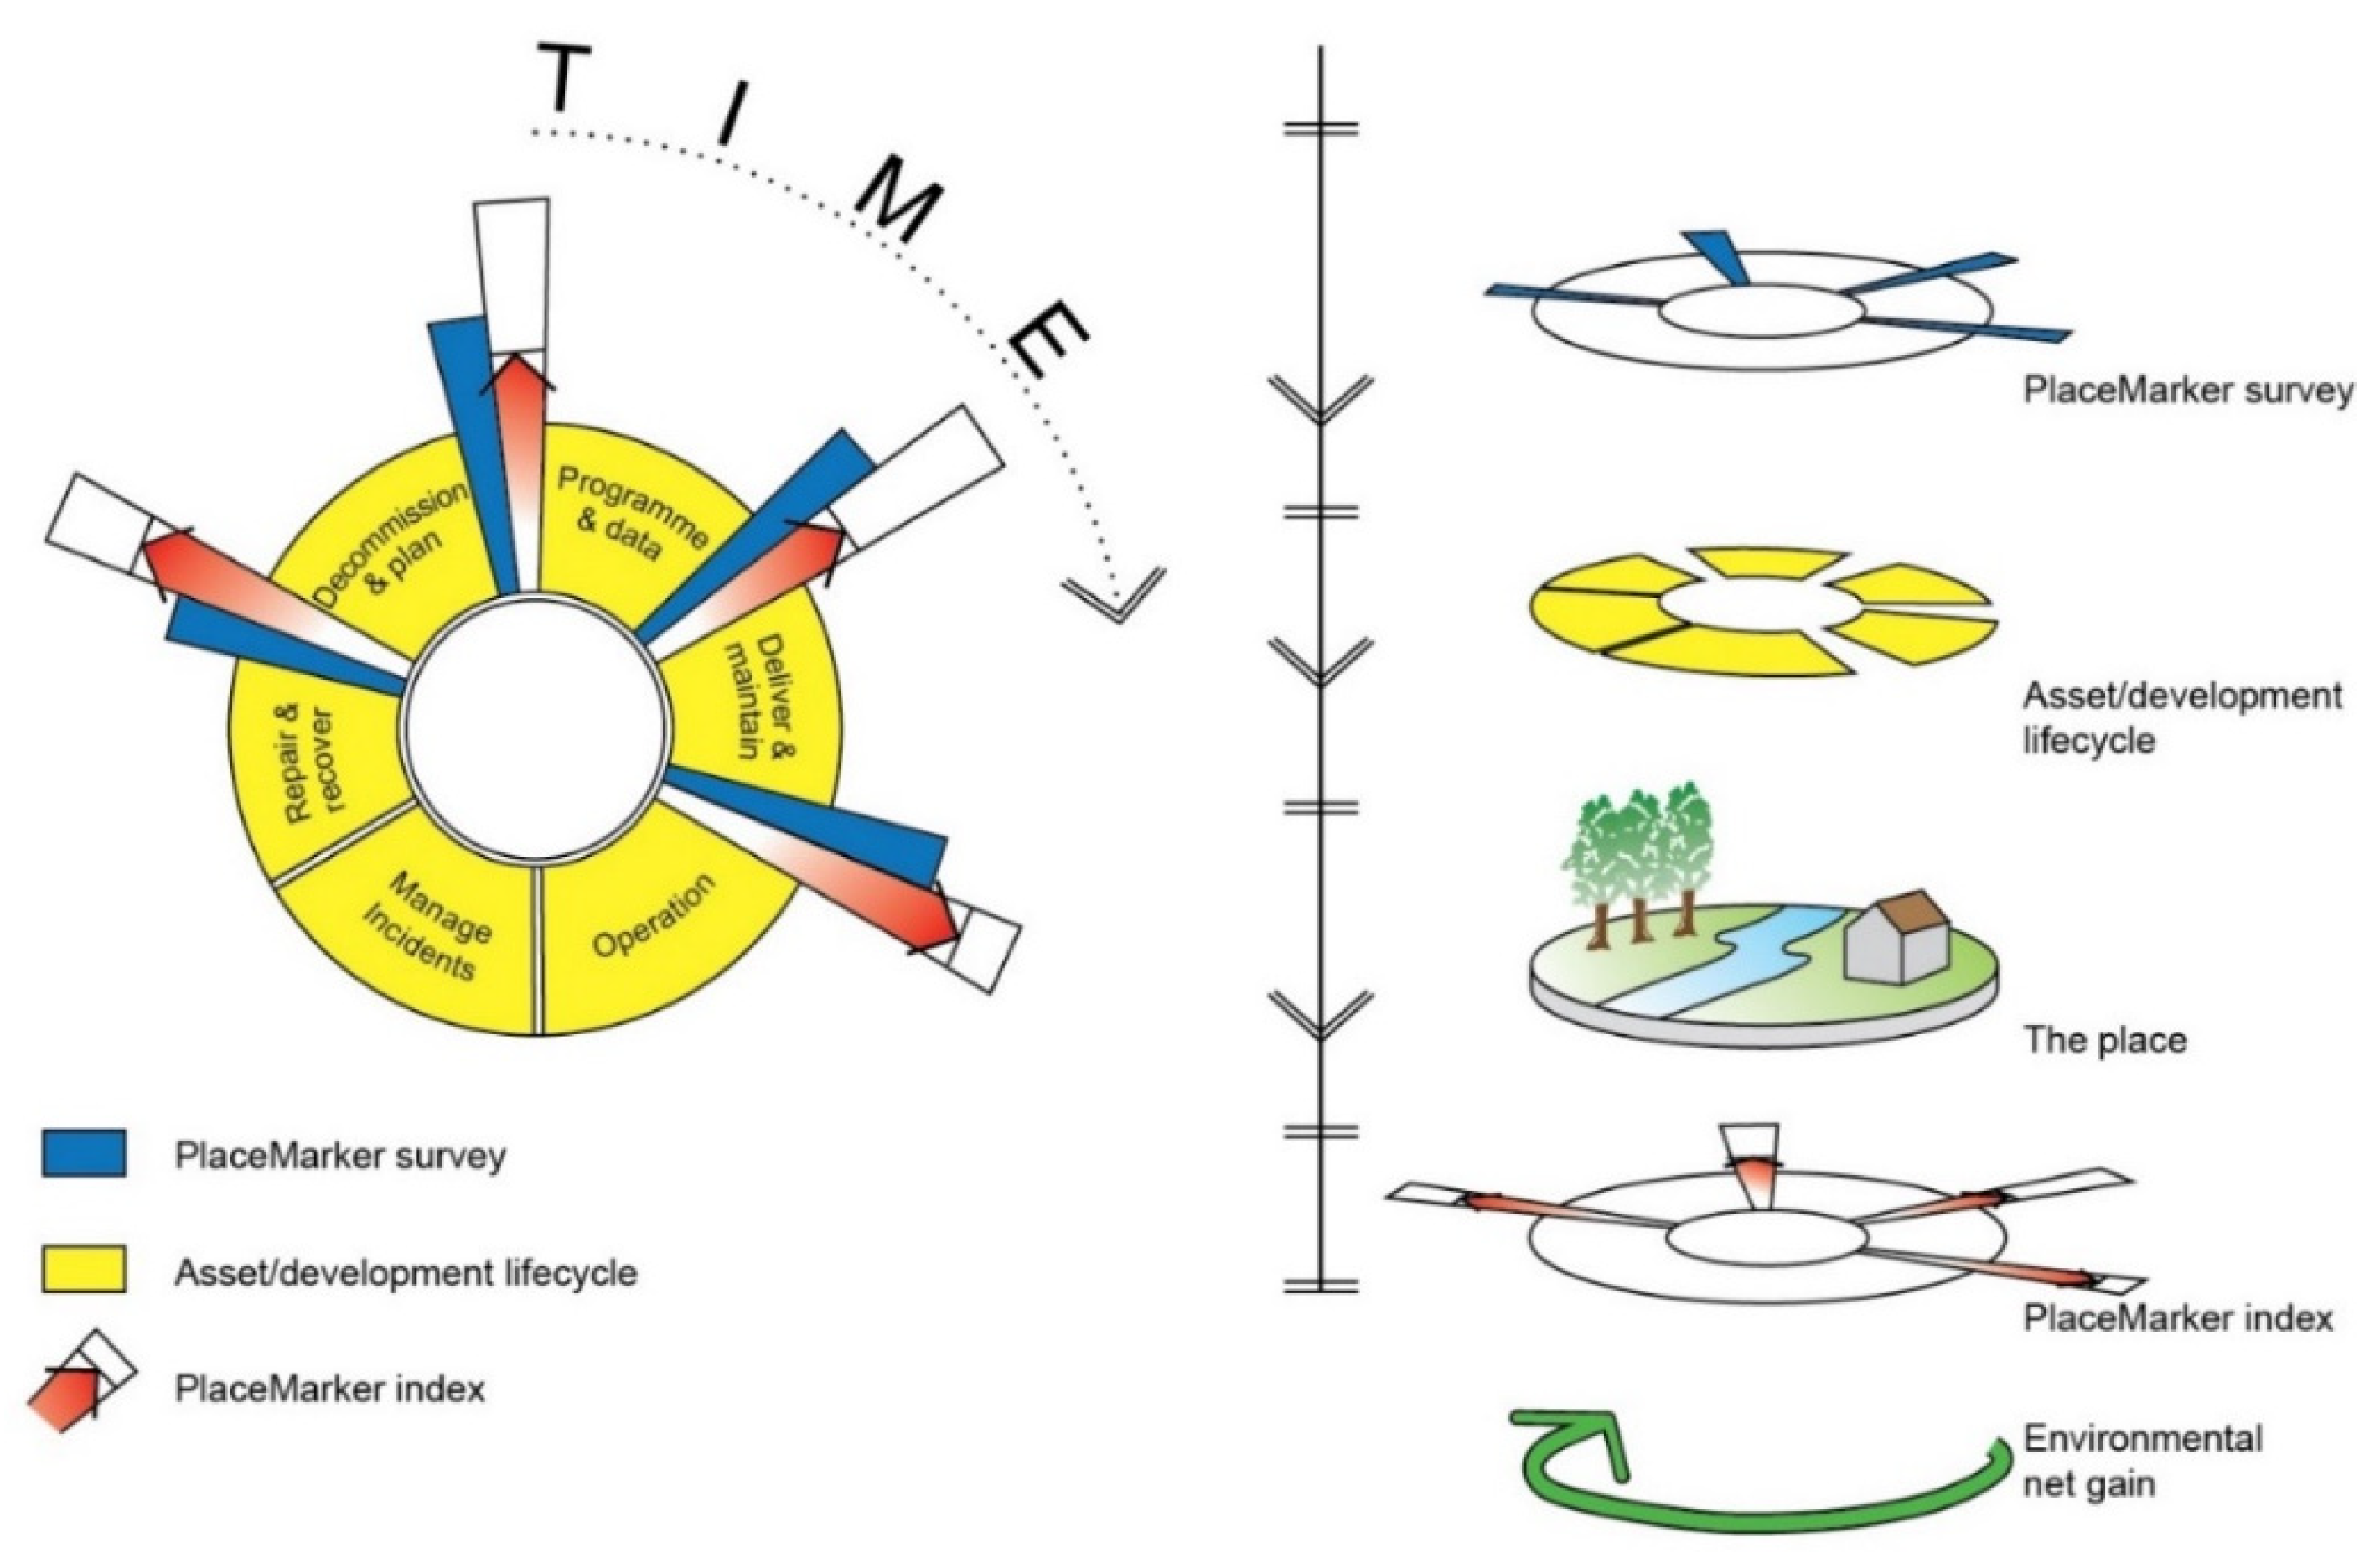
2.1. Key Features

PlaceMarker is a field-based survey that enables trained surveyors to look at a place in a structured way and gather consistent site information to inform the design, monitoring, and appraisal of river-related projects such as flood alleviation schemes. The tool was developed over a four-year period (2014–2018) through a series of training workshops for NEAS surveyors, which allowed for repeated testing and refinement of the training process, field survey forms and guidance materials, and the online data entry and storage system.
In a PlaceMarker Survey, measurements, indices, and impression-based assessments are combined to characterize and understand the nature of “the place” and to establish a broad environmental baseline against which changes can be “marked” throughout the whole lifecycle of a project or asset. Here, we describe the main features, but full details of the survey tool can be found in the Supplementary Information (SI1 Technical Manual; SI2 Classifications and Indices).
It is intended that a PlaceMarker Survey be conducted on at least three occasions. Ideally, pre-project surveys should be carried out at the pre-inception stage (i.e., when a flooding problem is identified, but a solution is not yet identified and there is the potential for river and floodplain restoration). The pre-project survey identifies risks and opportunities for delivering multiple benefits for people and wildlife and informs the scoping report, project design, and development phases. A second survey should be undertaken immediately post-project to establish the “as-built” conditions and identify any issues from the implementation of the scheme or interventions at the site. A third survey assesses post-recovery from the works (e.g., 5–10 years post-project) to document changes at the site and inform on-going adaptive management through the asset’s lifecycle, which could be over 50 years. These key features of the survey tool are conceptualized in the PlaceMarker model (Figure 1).

2.2. Structure of the PlaceMarker Survey, Measurements, Indices, and Impression-Based Assessments

The PlaceMarker Survey has two main parts, a River Survey and a Study Area Survey. For the prototype survey tool, the River Survey component was developed from the Urban River Survey (URS) [26,27,28,29] and designed to be fully compatible with the pre-existing River Habitat Survey [30,31] developed by the EA and widely employed by the EA and other statutory bodies in the U.K. It can therefore be applied to U.K. rivers in urban and rural locations and along the full spectrum of engineering modifications to support decision-making in relation to river restoration [32]. River surveys are conducted along river stretches and their margins (ca 500 m stretches (minimum 300 m) of a single engineering type as in the URS (see www.http://urbanriversurvey.org/for details (accessed on 5 May 2022)) extending to ca. 10 m from the bank top).
PlaceMarker has three main spatial components: the Project Site, the Study Area, and the Fringe, which surveyors delineate on a map or Google Image prior to the site visit. The Project Site is defined as the area likely to be directly influenced by the project, which is the river and the area immediately bordering it. The Study Area includes the project site and the adjacent area that is indirectly affected by the project, but where risks and opportunities to or from the development could exist, such as the potential for Habitat and Amenity enhancements. The Fringe surrounds the Study Area, representing the “visual envelope” of the site and enabling the wider implications of a scheme to be considered. In large projects, several River Surveys may be undertaken for a single Study Area Survey. For example, a series of representative river stretches may be identified rather than surveying the whole river length, and these should include “controls”, preferably upstream of the scheme, which can be used to control for changes that have not been caused by the scheme. Furthermore, River and Study Area Surveys conducted across several sites will enable an informed picture of the wider catchment system to be developed over time to underpin asset management.
These spatial components of the PlaceMarker Survey are illustrated in the example of Mayesbrook Park, East London (Figure 2). Stretches of the river flowing through the park were restored in 2010-2011 through re-meandering, re-profiling of riverbanks to re-connect the river to its floodplain, and constructed wetlands to deliver flood storage and flow attenuation and improvements in Habitat and Biodiversity, Landscape, and Amenity. The lower diagram indicates: the extent of the Project Site (grey) directly affected by the scheme; the additional area (green) (Study Area) that will be significantly indirectly affected (visually or in terms of connectivity with water-related activities, features, and Habitats); and a Fringe around these areas (pink), which on this flat site extends only a short horizontal distance (approximately 50 m). The first line of housing at the park edge is included in the Fringe (because it is likely to be affected by the scheme because of visibility into the Study Area and Project Site). Playing fields and bordering transport infrastructure are included in the Fringe for the same reasons. By including these in the Fringe, the potential broader benefits and impacts are considered.
A PlaceMarker assessment considers four themes: Habitat and Biodiversity; Landscape; Amenity; and Heritage, as illustrated in Figure 3, which depicts the structure of a PlaceMarker Survey. The grey column on the left identifies the Survey Unit (River Stretch and Study Area (and Fringe)); the themes assessed (Habitat and Biodiversity, Landscape, Amenity, and Heritage); and the type of assessments undertaken (index-based and impression-based). Key Points support the impression-based assessments. The Stretch Habitat Quality Index (SHQI) is an index-based assessment of stretch Habitat quality and potential Biodiversity. The Habitat and Biodiversity Quality Assessment (HaQA) is a high-level impression-based assessment of Habitat quality and potential Biodiversity. Landscape Quality Assessment (LQA) is a high-level impression-based assessment of the Landscape quality of the Study Area. Amenity Quality Assessment (AQA) is a high-level impression-based assessment of the Amenity quality of the Study Area. Heritage Quality Assessment (HeQA) is a high-level impression-based assessment of the Heritage quality of the Study Area.
A PlaceMarker Survey collates measurements and observations in the field, including photographs and sketch maps, to derive indices and impression-based assessments (Table 1). For each river stretch, information is gathered using three River Survey forms and two supporting code sheets to assess Habitat and Biodiversity (SI1 pp. 10–28). In summary, the River Survey forms capture survey details, site information (including representative photographs), stretch engineering, and channel dimensions. Physical attributes (e.g., bank materials and bank protection), bank top land use and vegetation structure, and channel vegetation are recorded at ten equally spaced spot checks along the river stretch. Lastly, cumulative measurements provide an overall assessment of the character of the surveyed stretch comprising the bank profile and protection, indicators of channel dynamics (e.g., opposite banks eroding indicating channel widening), artificial influences (e.g., bridges and weirs), extent of pollution (sources such as inlet pipes and indicators such as surface scum and/or odour and poor water clarity), habitat features and flow types, and special features such as side channels and water meadows. Habitat features are captured on the River Survey forms through a combination of measurements (e.g., channel dimensions), counts (e.g., habitat features and flow types), categories (e.g., bank top land use, vegetation structure, bank profile, bank protection), and proportions (e.g., indicators of channel dynamics); see [26,27,28,29,33] for details on the Urban River Survey.
From these River Survey measurements, 70 river indices were derived (summarised in Table 2; for further details, see SI2 pp. 3–13). Based on these indices, surveyed river stretches were classified according to their Materials, Physical Habitat, and Vegetation [27]. The Stretch Habitat Quality Index (SHQI) was derived from these three-component classifications and provides a simple basis for understanding the condition of a stretch of river to support an evaluation of Habitat and Biodiversity.
Information assembled from the Study Area Survey assesses all four elements (Figure 3). A three-page survey form captures Study Area measurements yielding 20 Study Area indices to contribute to assessment of Landscape, Amenity, and Heritage (see Table 3 and SI1 pp. 29–36 for full details). High-level impression-based assessments of the Study Area and Fringe are captured on four survey forms each supported by guidance notes (detailed in SI1 pp. 37–45). The structure of the survey forms forces the surveyor(s) to walk the whole site and see the river in the context of the Study Area and Fringe. These impression-based assessments are informed by the functional approaches used to conceptualize how people react to and form a judgement of the visual environment [34], also known as Visual Landscape Perception or Landscape Visual Impact Assessment. This approach has been used from the mid-1960s in many countries for Landscape planning and environmental impact assessment studies in response to changing legislative drivers and a wide range of Landscape management, planning, and design issues [35] and is widely accepted as an appropriate way to capture perceptions/impressions of a place during a first visit for a baseline survey. These impression-based assessments help us to understand and react to our environment and are invaluable in getting to know a place and assessing its multi-functional aspects [36].
In PlaceMarker, impression-based assessments are recorded for Habitat, Landscape, Amenity, and Heritage (Figure 3) on a 1–5 scale (Very Good, Good, Average, Poor, Very Poor). The Habitat Quality Assessment (HaQA) is a single high-level assessment of Habitat and potential Biodiversity based on impressions gained from the River Survey(s) and the Study Area Survey, whereas the single high-level impression-based assessments of Landscape (LQA), Amenity (AQA), and Heritage (HeQA) are gained from walking the Study Area. LQA captures the assemblage of land cover types from semi-natural to entirely human-constructed. AQA relates to the convenience, comfort, and pleasure provided by the Study Area for people and relates to both informal and formal activities. Field measurements from the Study Area Survey, relating to accessibility and connectivity, recreation, education, health and safety, and economic value, support the high-level impression-based assessment of Amenity. HeQA relates to the historic environment of the Study Area and includes designated structures and any (potentially) historic features that are observed within the Study Area and/or Fringe. Importantly, all these high-level impression-based assessments are informed and justified by Key Points with accompanying photographs as necessary (Table 1) and impressions of the Study Area’s Complexity (diversity or richness), Coherence (the sense of place), Interest (Kaplan’s “mystery”) [34], and Condition (e.g., state of repair of amenities at the site (see Figure 3). Surveyors also record an assessment of their level of confidence (High, Medium, Low) alongside all selected scores.
The field-based PlaceMarker Survey is supported by a web-based information system (Cartographer) designed for the entry, storage, sharing, and retrieval of survey data; data analysis (calculation of indices); and the presentation of assessments in map-based and graphical formats (Figure 4). The online system also allows Supporting Information such as maps, photographs, and notes to be uploaded and archived. Logins are issued to trained surveyors, and data and Supporting Information are uploaded by the surveyor using their specific log-in. Uploaded surveys are checked by the QMUL team or experienced NEAS team leads and approved in the absence of any queries or when any follow up queries have been addressed. Once approved, the online surveys can only by edited by the approved assessors. The software allows up to five (sketch) maps of the Study Area to be uploaded to provide reference locations for other material in the survey. One of these must show the extent of the Study Area and Fringe, but the others could be used to record the position of key features. Up to four additional maps are allowed in case the surveyor wishes to record Habitat and Biodiversity, Landscape, Amenity, and Heritage features on separate maps. All maps are visible when viewing any of the High-Level Assessment data pages of the online system. Finally, data and information from the field surveys of the river and Study Area can be combined with desk-based information and may inform a decision to commission specialist surveys.

3. Development and Testing of the PlaceMarker Survey: Some Early Results and Implications

The development and testing phase (2014–2018) generated 77 River Surveys and 55 Study Area Surveys by 39 trained NEAS surveyors. The surveys were undertaken across England with concentrations in London and the SE, the Midlands, and NW and NE England. These surveys were used to aid decision-making and monitoring of a range of river projects, predominantly flood alleviation schemes with environmental enhancement opportunities. Here, we present some early results from an analysis of the data and indices from the current online records. Findings are presented as frequency distributions for the River Survey Stretch Habitat Quality Index (SHQI) (Figure 5a) with the distributions for the three component classifications of the Materials, Physical Habitat, and Vegetation characteristics (Figure 6a–c). Frequency distributions for the Study Area Quality Assessments for Habitat and Biodiversity (HaQA), Landscape (LQA), Amenity (AQA), and Heritage (HeQA) are presented in Figure 5b–e. Four case study examples of pre-project survey assessments taken from the online database illustrate different SHQI values for the river stretches and impression-based assessment scores from the Study Area Survey, with a summary of the supporting Key Points. These four examples are presented in Supplementary Information 3 (SI3). Case Study (d) provides an example where two river stretches were surveyed within a single Study Area.
The frequency distributions of SHQI values (Figure 5a) and the Materials, Physical Habitat, and Vegetation classes (Figure 6a–c) show that the surveys conducted so far capture river stretches across all categories, reflecting the inclusion of highly engineered to more natural stretches in the database. For the SHQI values (Figure 5a), the modal class is Average (scores 7–9), and more schemes are Average and above compared to Below Average, Poor, or Very Poor. Examples of Average stretches are shown in SI3 for Case Studies a, b, and d (River Stretch 1), with SHQI values ranging from 9 to 7. An example of a good river stretch (SHQI = 6) is shown in Case Study (c). Finally, Case Study (d) provides an example of two River Surveys completed within a single Study Area showing contrasting river stretch characteristics and SHQI values of 7 (Average) for River Stretch 1, but 14 (Poor) for River Stretch 2.
Material classes range from semi-natural to very heavily engineered stretches. The Semi-Natural Coarse (SNC), Mixed (SNM), and Fine (SNF) classes essentially reflect the different alluvial sediments bounding the river channel. The remaining classes of Lightly Engineered (LE), Engineered (EN), and Heavily Engineered (HE)) reflect an increasing extent and rigidity of bank reinforcement from high proportions of biodegradable protection (e.g., willow spiling, biotex/coir) to high proportions of solid bank protection (e.g., concrete and laid stone). The frequency distribution of Material classes (Figure 6a) shows that the current PlaceMarker database contains river stretches across all six Material classes with Lightly Engineered emerging as the modal class.
Physical Habitat classes reflect the degree to which the channel bank profiles are “natural” and the degree to which the channel is displaying different physical Habitat features indicative of the erosion and deposition of sediment (i.e., geomorphic activity). The Semi-Natural Active (SNAct), Moderately Active (SNMAct), and Stable (SNSt) classes reflect largely “natural” bank profiles and show high, moderate to low levels of geomorphic activity (Habitat Complexity and Turnover). The Adjusting (Adj) and Stable (St) classes both reflect a moderate presence of “natural” bank profiles, but Adj stretches display more physical Habitat features indicative of erosion and deposition of sediment than St stretches. The two remaining classes (UAdj and USt) capture largely artificial bank profiles, but UAdj reflects a greater number of physical Habitat features indicative of erosion and deposition of sediment than USt. The frequency distribution of the seven Physical Habitat classes (Figure 6b) reflects a wide range of river stretches in the current database in terms of their stability and bank profile naturalness. Stable channels are more abundant with semi-natural, stable stretches the most frequent, although more than one-third are active or adjusting.
Vegetation classes reflect the extent of riparian tree cover (Low, Moderate, and High) and in-channel Vegetation and the degree to which riparian trees are connected to the channel (e.g., through tree features such as large wood, exposed roots, trailing branches). Current PlaceMarker River Surveys contain river stretches with Low, Moderate, and High riparian tree cover (Figure 6c). As expected, river stretches with in-channel Vegetation are more frequent when riparian tree cover is low or moderate, whereas unvegetated channels are most common when riparian tree cover is high.
SHQI values are not only important in characterising a stretch of river as part of the environmental baseline of a place, but in providing suggestions for management. In terms of the development and initial testing of the PlaceMarker survey tool, it is positive that the database already includes the full range of SHQI categories, which can offer examples of potential management options to maintain or achieve Low (i.e., Very Good) scores.
These management options may range from protecting a Very Good site from development through to minor improvements at Good sites such as the removal of remnants of channel reinforcements to promote sinuosity and more extensive rehabilitation measures at sites that are classed as Average through to Very Poor (see Table 4 and the examples in SI3 a–d). The River Survey data recorded for Materials, Physical Habitat, and Vegetation can inform the focus of the rehabilitation such as measures to improve the Complexity of riparian Vegetation in response to low recorded riparian tree cover.
The frequency distributions of the Study Area high-level impression-based assessments are shown in Figure 5b–e. As with the SHQI plot (Figure 5a), the frequency distributions of the Study Area assessments (Figure 5b–e) show that surveyors are using the full range of scores. Only for the Landscape Quality Assessments is the database lacking any records of the poorest examples (score 5: “the Landscape elements and assemblage of the Study Area within the visual envelope of the fringe offer limited complexity, coherence or interest and the condition is very poor in the context of the character of the Landscape under study”).
The examples presented in SI3 (a–d) provide illustrations of different Study Area assessments from four contrasting pre-project surveys. The survey in SI3 (a) shows a Study Area with Poor Habitat Quality (HaQA = 4), but Very Good Heritage Quality (HeQA = 1) and Good Landscape (LQA = 2) and Amenity Quality (AQA = 2). In contrast, the example in SI3 (b) has Good Habitat Quality (HaQA = 2), but Very Poor Heritage (HeQA = 5) and Amenity Quality (AQA = 5) with Average Landscape Quality (LQA = 3). In the third example (SI3 (c)) Amenity Quality is Good (AQA = 2), Habitat and Landscape Quality are reported as Average (HQA and LQA both scoring 3), and Heritage is Poor (HeQA = 4). Poor scores for Habitat and Landscape Quality (HaQA and LQA both reported as 4) and Very Poor Heritage Quality (HeQA) characterise the final example in SI3 (d), but some new recreational facilities have placed the Amenity Quality as Average (AQA = 3). These examples provide an illustration of how the high-level impression-based assessments, supported by Key Points, can begin to identify opportunities for improving the quality of a place for people and wildlife as part of multi-functional schemes that consider the blue and adjoining green spaces.

4. Discussion

Overall, this first analysis of the PlaceMarker database provides valuable insights into the ability of the survey tool to capture key characteristics of these river project sites and their surrounding areas. Ensuring consistent, high-quality data collection has been central to the development of a robust, operational tool. We worked to achieve this through a collaborative and iterative approach between QMUL, NEAS, and Cartographer Studios Ltd. to develop the field survey forms, online platform, training courses, and supporting technical guidance. The development of the prototype survey tool was informed by early scoping consultations with NEAS staff having expertise in Environmental Impact Assessment, Ecology, Landscape, and Heritage. All training workshops comprised classroom, field survey, and data entry training over three full days for 10–12 trainees and were delivered by the authors (QMUL, NEAS, and Cartographer) and funded by NEAS at a cost of c. GBP 500 per trainee.
These workshops and early applications of the survey yielded important feedback and refinement of the tool to ensure the survey was comprehensive and clear. The training process emphasises consistency in completing the surveys, and highly structured survey forms supported by guidance materials help to ensure consistent recording, while the surveyors are encouraged to make notes on the forms and take photographs for follow up discussions if necessary. As it is designed to be a broad-based survey, surveyors do not need specialist training in all areas of PlaceMarker, but we strongly advise that surveyors with different backgrounds work in pairs to complete the surveys (also important for H&S) to facilitate the discussion on site and later, as required. For the impression-based assessments in the Study Area Survey, surveyors are required to list Key Points that support and explain their scores. Surveyors are also required to complete a section indicating their Level of Confidence in completing the Study Area sections, which is helpful for quality control and scrutiny by team members including decisions around whether to commission more specialist surveys and/or future monitoring and appraisal. Once surveys are entered in the online system Cartographer, they are quality controlled by the QMUL trainers or experienced NEAS team leads. During the training workshops, all the field and classroom elements have debriefing sessions for trainees to compare their scores and the rationale for these. Our experience from the training workshops is that the process of recording Key Points leads to a high level of consistency in the impression-based assessments.
The analysis of the current database of 77 River Surveys and 55 Study Area Surveys reported in this paper indicates that data are being collected in a consistent way and the tool is robust and operational. However, it has been difficult to test specifically for operator variance because the survey sites are spread across England. After a pause in training due to COVID-19 restrictions and with new staff joining NEAS since the last training workshop in April 2019, we are about to begin a second programme of training in September 2022, fully funded by NEAS. This is part of a 5-year agreement with NEAS with the goal of training over 100 staff to provide the capacity for undertaking post-project monitoring and appraisal, as well as baseline surveys for new projects. Mayesbook Park, London, and Perry Hall Park, Birmingham, are the planned training locations, and this provides an opportunity to design a study to test operator variance as a part of on-going training courses.

5. Conclusions

PlaceMarker was developed for use by the Environment Agency’s (EA) National Environmental and Sustainability (NEAS) team to enable them to actively engage in the design and appraisal of river-related projects. It supports EA initiatives that are putting in place metrics to glean more data to underpin benefits’ realisation through the whole life of infrastructure projects, some of which can be over 50 years. Each major project will include funding of long-term monitoring, which will use tools including PlaceMarker.
PlaceMarker is currently being employed by NEAS at sites across England where the baseline assessments have informed or are informing project design to ensure the consideration of a wide range of options for the delivery of multi-benefit flood alleviation and river restoration schemes. As projects are implemented, these baseline data and metrics will be the marker against which changes at a place can be tracked by NEAS through post-project surveys and against which schemes are evaluated in terms of environmental improvements. For example, a post-recovery survey may indicate improvements in the river’s Habitat and Biodiversity through changes in the SHQI values, but scope for improvement in Amenity.
With the continued addition of field survey data to the online database, the derived indices can be further tested and, where necessary, manipulated to create new, more effective ones that ensure the continued utility and robustness of the tool. Furthermore, feedback from experienced PlaceMarker surveyors (PlaceMarker Engagement Workshop, November 2018) has reinforced the importance of getting out of the office and into the field to gather site information at an early stage in the life cycle of a project, the value of structured, consistent observation, and the establishment of a robust baseline of understanding, whether or not other more specialist surveys and assessments are also undertaken. Going forward, NEAS is continuing to build on the proven benefits of PlaceMarker Surveys to support collaboration between the EA, delivery partners, and local communities for an increasing number of flood risk management and river restoration projects. Additionally, a mobile app for iOS and Android has recently been commissioned and is currently being tested to allow for more efficient real-time uploading of the site record and easier repeat surveys with on-site comparisons of completed surveys.
Finally, although PlaceMarker has been developed in England to address the need for a broad-based field survey, the structure and methodological approach have the potential to inform the development of similar national surveys by agencies in other countries to support the monitoring and appraisal of river-related projects.

Supplementary Materials

The following supporting information can be downloaded at: https://www.mdpi.com/article/10.3390/w14162514/s1. SI1: PlaceMarker Survey Technical Manual; SI2: PlaceMarker Classifications and Indices; SI3: PlaceMarker Survey Case Studies.

Author Contributions

The aims and content of the paper were scoped by G.W., A.M.G. and M.R.; the methodology (PlaceMarker Survey) was developed by G.W., A.M.G., M.R. and D.P.-G. (who wrote all the software for Cartographer); the data analysis and interpretation were undertaken by A.M.G. and G.W. G.W. wrote the first full draft of the manuscript; G.W., A.M.G. and M.R. contributed to the review and editing. All authors have read and agreed to the published version of the manuscript.

Funding

This research received no external funding.

Institutional Review Board Statement

Not applicable.

Informed Consent Statement

Not applicable.

Data Availability Statement

Not applicable.

Acknowledgments

The PlaceMarker Survey was developed in close collaboration with staff from the Environment Agency’s National Environmental Assessment and Sustainability (NEAS). We acknowledge the R&D financial support provided by NEAS, and we thank the many NEAS staff who contributed to the development of the PlaceMarker methodology, including those who were consulted about specific aspects (Deborah Dunsford, Kathryn Edwards, Ross Marshall, Pam Molyneux, Bruce Munro, Mark Ross, Rebecca Skinner), those who spent several days testing the method out and suggesting improvements (Penny Burt, Kathryn Edwards, Catherine Grindey, Joshua Peacock, Rebecca Skinner, Claire Vetori), and those who attended the early training workshops and gave feedback, which resulted in significant improvements to the methodology (Anthony Bishop, Amy Cocker, Jen Connell, Alice Cooper, Ian Davie, Joanne Dodworth, Deborah Dunsford, Louise Forder, Karl Fuller, Phil Griffiths, Jo Guy, Richard Hellier, Steve Kemp, Sarah Kingdom, Louise Lewin, Amanda McDonnell, Sharon Naylor, Stuart Rolley, Amelia Russell, Rebecca Skinner, Ollie Sykes, Paul Warrington, John Wilmott-French, Ed Wilson, Richard Woodward). We are also grateful to Lydia Burgess-Gamble for helping to organise the PlaceMarker engagement workshop (9 November 2018) and all those who participated in that event, which provided some of the perspectives reported in this paper. The image in Figure 2 was extracted from Google Earth, and the image data provider was Bluesky (Image © 2018 Bluesky). In using this image, we conformed to the guidelines available at http://www.google.com/permissions/geoguidelines/attr-guide.html (accessed on 1 September 2018), including image attributions in the figure caption that conform to “the text of your attribution must say the name “Google” and the relevant data provider(s), such as “Map data: Google, DigitalGlobe””. We have not obtained written permission to use these images because the guidelines state that “Due to limited resources and high demand, we’re unable to sign any letter or contract specifying that your project or use has our explicit permission.” We thank Ed Oliver for assistance in producing Figure 1 and Figure 3, and we are grateful to the anonymous Reviewers for their insightful and positive comments on an earlier version of the manuscript.

Conflicts of Interest

The authors declare no conflict of interest.

References

  1. Adams, W.M. The value of valuing nature. Science 2014, 346, 549–551. [Google Scholar] [CrossRef]
  2. De Vries, S.; Verheij, R.A.; Groenewegen, P.P.; Spreeuwenberg, P. Natural Environments—Healthy Environments? An Exploratory Analysis of the Relationship Between Greenspace and Health. Environ. Plan. A 2003, 35, 1717–1731. [Google Scholar] [CrossRef]
  3. Available online: www.valuing-nature.net (accessed on 5 May 2022).
  4. HM Government. A Green Future: Our 25 Year Plan to Improve the Environment; HM Government: London, UK, 2018; 151p. Available online: www.gov.uk/government/publications (accessed on 5 May 2022).
  5. HM Government. National Planning Policy Framework; HM Government: London, UK, 2019; ISBN 978-1-5286-1033-9. Available online: www.gov.uk/government/publications (accessed on 5 May 2022).
  6. Defra Making Space for Water: Developing a New Government Strategy for Flood and Coastal Erosion Risk Management in England; A Consultation Exercise; Department for Environment, Food and Rural Affairs: London, UK, 2004; 155p. Available online: www.defra.gov.uk (accessed on 5 May 2022).
  7. Lawton, J.H.; Brotherton, P.N.M.; Brown, V.K.; Elphick, C.; Fitter, A.H.; Forshaw, J.; Haddow, R.W.; Hilborne, S.; Leafe, R.N.; Mace, G.M.; et al. Making Space for Nature: A review of England’s wildlife sites and ecological network. In Report to Defra; Department for Environment, Food and Rural Affairs: London, UK, 2010. [Google Scholar]
  8. Millennium Ecosystem Assessment. Ecosystems and Human Well-Being: Synthesis; Island Press: Washington, DC, USA, 2005. [Google Scholar]
  9. Fish, R.; Church, A.; Willis, C.; Winter, M.; Tratalos, J.A.; Haines-Young, R.; Potschin, M. Making space for cultural ecosystem services: Insights from a study of the UK nature improvement initiative. Ecosyst. Serv. 2016, 21 Pt B, 329–343. [Google Scholar] [CrossRef]
  10. Jones, L.; Holland, R.A.; Ball, J.; Sykes, T.; Taylor, G.; Ingwall-Kings, L.; Snaddon, J.L.; Peh, K.S.-H. A place-based participatory mapping approach for assessing cultural ecosystem services in urban green space. People Nat. 2020, 2, 123–137. [Google Scholar] [CrossRef]
  11. Scott, A.; Hölzinger, O.; Sadler, J. Making Plans for Green Infrastructure in England: Review of National Planning and Environmental Policies and Project Partners’ Plans; Published as Part of the NERC Funded Project ‘Injecting a Natural Capital Planning Tool into GreenBlue Infrastructure Management’ (Grant Ref:, NE/N017587/1); Northumbria University: Newcastle upon Tyne, UK; University of Birmingham: Birmingham, UK, 2017. [Google Scholar]
  12. UK NEA. UK National Ecosystem Assessment: Technical Report; UNEP-WCMC: Cambridge, UK, 2011. [Google Scholar]
  13. Constanza, R.; Daly, H.E. Natural Capital and Sustainable Development. Conserv. Biol. 1992, 6, 37–46. [Google Scholar] [CrossRef]
  14. European Commission (EC). Directive 2000/60/EC of the European Parliament and of the Council of 23 October 2000 establishing a framework for community action in the field of water policy. Off. J. Eur. Communities 2000, L327, 1–72. [Google Scholar]
  15. England, J.; Skinner, K.S.; Carter, M.G. Monitoring, river restoration and the Water Framework Directive. Water Environ. J. 2008, 22, 227–234. [Google Scholar] [CrossRef]
  16. Smith, B.; Clifford, N.J.; Mant, J. The changing nature of river restoration. WIREs Water 2014, 1, 249–262. [Google Scholar] [CrossRef]
  17. Environment Agency: Creating a Better Place. Our Ambition to 2020. Defra/EA. June 2018. Available online: https://www.gov.uk/government/publications/environment-agency-our-ambition-to-2020 (accessed on 5 May 2022).
  18. HM Government. A Green Future: Our 25 Year Plan to Improve the Environment; Annex 1: Supplementary Evidence Report; HM Government: London, UK, 2018; 145p. Available online: www.gov.uk/government/publications (accessed on 5 May 2022).
  19. Available online: https://www.gov.uk/guidance/enabling-a-natural-capital-approach-enca (accessed on 5 May 2022).
  20. Rice, P.; Lusardi, J.; Lord, A.; Sunderland, T. Natural Capital Evidence Handbook: To Support Place-Based Planning and Decision-Making; Natural England Research Report, Number 092; Natural England: York, UK, May 2021; 41p. [Google Scholar]
  21. Panks, S.; White, N.; Newsome, A.; Nash, M.; Potter, J.; Heydon, M.; Mayhew, E.; Alvarez, M.; Russell, T.; Cashion, C.; et al. Biodiversity Metric 3.1: Auditing and Accounting for Biodiversity—User Guide; Natural England: York, UK, 2022. [Google Scholar]
  22. JNCC. Handbook for Phase 1 Habitat Survey—A Technique for Environmental Audit (Revised 2010); JNCC: Peterborough, UK, 2010. [Google Scholar]
  23. Gurnell, A.M.; Scott, S.J.; England, J.; Gurnell, D.J.; Jeffries, R.; Shuker, L.; Wharton, G. Assessing river condition: A multiscale approach designed for operational application in the context of biodiversity net gain. River Res. Appl. 2020, 36, 1559–1578. [Google Scholar] [CrossRef]
  24. CIEEM; CIRIA; IEMA. 2016 Biodiversity Net Gain—Good Practice Principles for Development. Available online: https://www.cieem.net/data/files/Publications/Biodiversity-Net-Gain-Principles.pdf (accessed on 5 May 2022).
  25. Crosher, I.; Gold, S.; Heaver, M.; Heydon, M.; Moore, L.; Panks, S.; Scott, S.; Stone, D.; White, N. The Biodiversity Metric 2.0: Auditing and Accounting for Biodiversity Value; User Guide (Beta Version, July 2019); Natural England: York, UK, 2019. [Google Scholar]
  26. Boitsidis, A.J.; Gurnell, A.M. Environmental Sustainability Indicators for Urban River Management. In Sustainable Management of Urban Rivers and Floodplains (SMURF); Kings College London: London, UK, 2004; LIFE02 ENV/UK/000144. [Google Scholar]
  27. Boitsidis, A.J.; Gurnell, A.M.; Scott, M.; Petts, G.E.; Armitage, P.D. A decision support system for identifying the habitat quality and rehabilitation potential of urban rivers. Water Environ. J. 2006, 20, 1–11. [Google Scholar] [CrossRef]
  28. Davenport, A.J.; Gurnell, A.M.; Armitage, P.D. Classifying urban rivers. Water Sci. Technol. 2001, 43, 147–155. [Google Scholar] [CrossRef]
  29. Davenport, A.J.; Gurnell, A.M.; Armitage, P.D. Habitat survey and classification of urban rivers. River Res. Appl. 2004, 20, 687–704. [Google Scholar] [CrossRef]
  30. Raven, P.J.; Holmes, N.T.H.; Dawson, F.H.; Fox, P.J.A.; Everard, M.; Fozzard, I.R.; Rouen, K.J. River Habitat Quality the Physical Character of Rivers and Streams in the UK and Isle of Man; River Habitat Survey Report No. 2; Environment Agency: Bristol, UK, 1998; p. 86. [Google Scholar]
  31. Raven, P.J.; Holmes, N.T.H.; Naura, M.; Dawson, F.H. Using river habitat survey for environmental assessment and catchment planning in the U.K. Hydrobiologia 2000, 422–423, 359–367. [Google Scholar] [CrossRef]
  32. Shuker, L.; Gurnell, A.M.; Raco, M. Some simple tools for communicating the biophysical condition of urban rivers to support decision-making in relation to river restoration. Urban Ecosyst. 2012, 15, 389–408. [Google Scholar] [CrossRef]
  33. Available online: http://www.urbanriversurvey.org (accessed on 5 May 2022).
  34. Kaplan, S. The analysis of perception via preference: A strategy for studying how the environment is experienced. Landsc. Plan. 1985, 12, 161–176. [Google Scholar] [CrossRef]
  35. Zube, E.H.; Sell, J.L.; Taylor, J. Landscape Perception: Research, Application and Theory. Landsc. Plan. 1982, 9, 1–33. [Google Scholar] [CrossRef]
  36. Mander, U.; Uuemaa, E. Landscape assessment for sustainable planning (editorial). Ecol. Indic. 2010, 10, 1–3. [Google Scholar] [CrossRef]
Figure 1. A conceptual model of the PlaceMarker Survey (figure by Mark Ross).
Water 14 02514 g001
Figure 2. The spatial components of the PlaceMarker Survey. Image obtained from Google Earth, Image © 2018 Bluesky.
Water 14 02514 g002
Figure 3. Conceptual flow diagram showing the structure of the PlaceMarker Survey and assessments.
Water 14 02514 g003
Figure 4. Screenshot from Cartographer showing SHQI values derived from River Surveys and displayed in graphical and map-based formats.
Water 14 02514 g004
Figure 5. Frequency distributions of (a) SHQI, (b) HaQA, (c) LQA, (d) AQA, and (e) HeQA values from the River and Study Area Surveys (completed 2014-18). Full definitions and descriptions of the indices are provided in the Supplementary Information (2) PlaceMarker: Classifications and Indices.
Water 14 02514 g005
Figure 6. Frequency distributions of (a) Materials, (b) Physical Habitat, and (c) Vegetation classes from the PlaceMarker River Survey data (2014-18). Full definitions and descriptions of indices are provided in the Supplementary Information (2) PlaceMarker: Classifications and Indices. In particular, refer to Table S1 (pp. 3–13), Tables S4–S6 (pp. 21–23).
Water 14 02514 g006
Table 1. Summary of information collected as part of a PlaceMarker Survey (see also Figure 3 and for full details and Supplementary Information (1) Technical Manual and (2) Classifications and Indices).
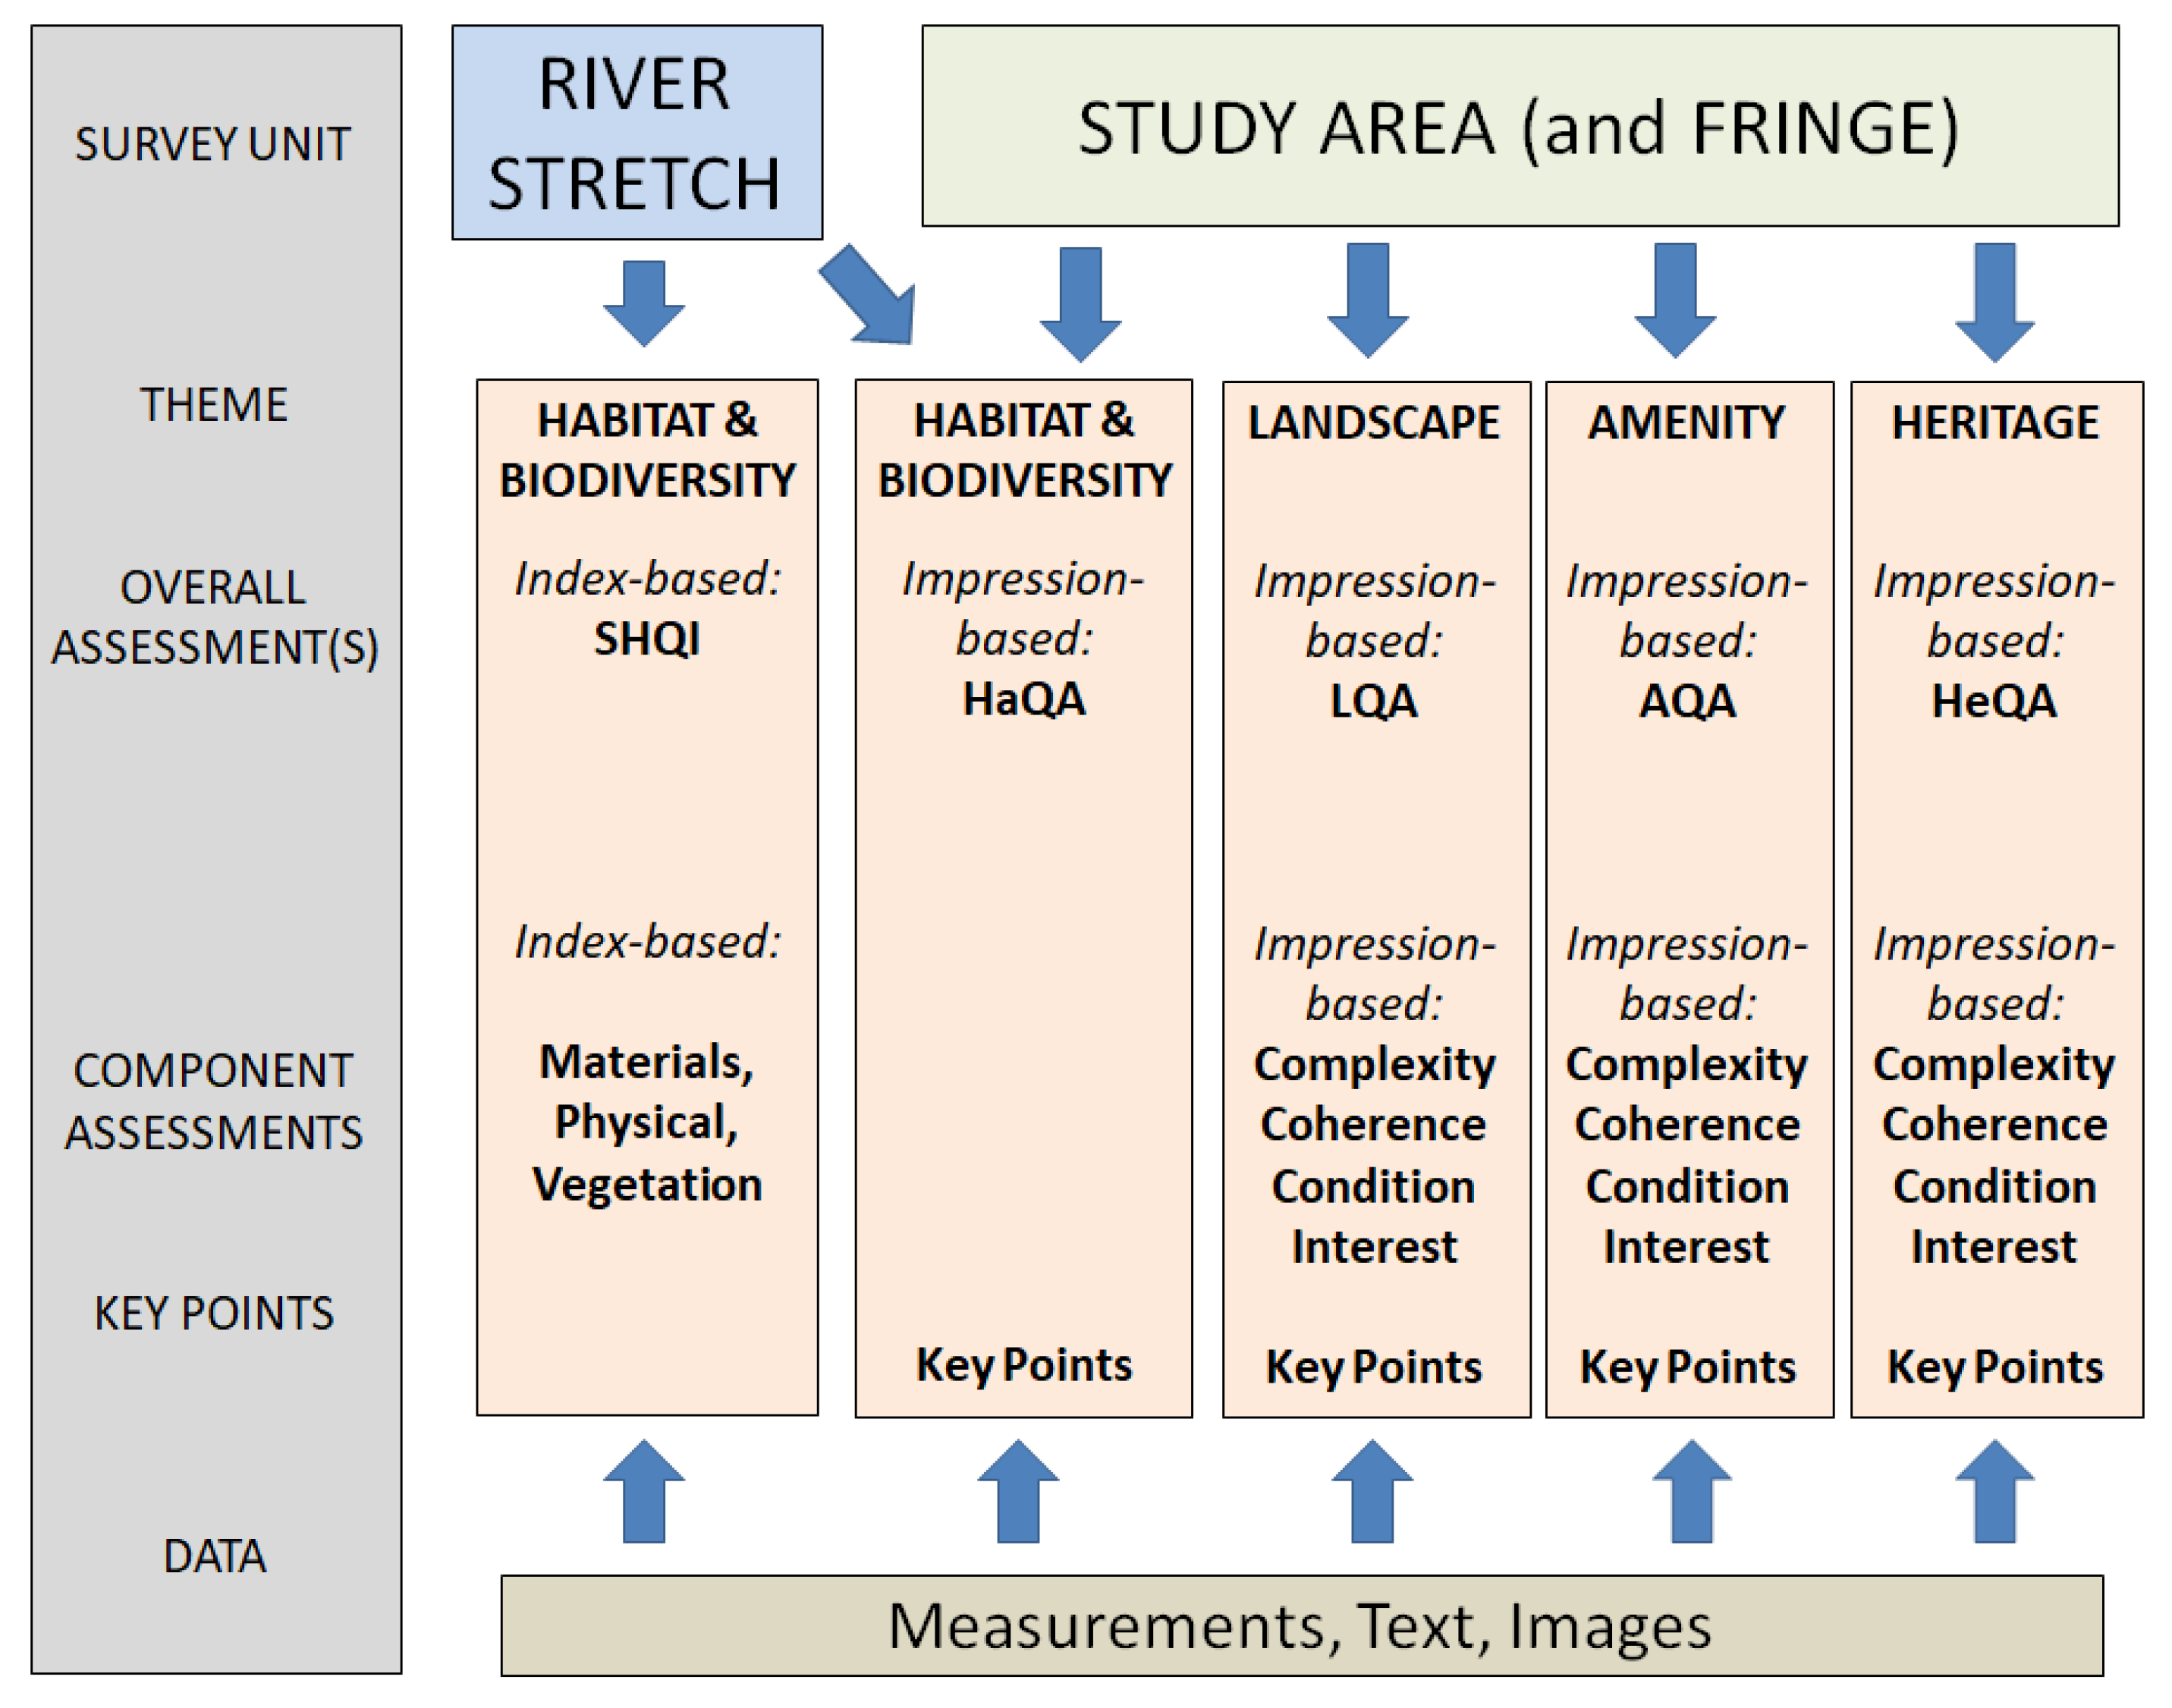
Measurements: Quantitative and semi-quantitative measurements are recorded on a 4-page River Survey form, supported by two code sheets and a 3-page Study Area form.
Indices and Index-based Assessments: These are calculated automatically once the field survey measurements have been entered into the online system, checked, and approved.
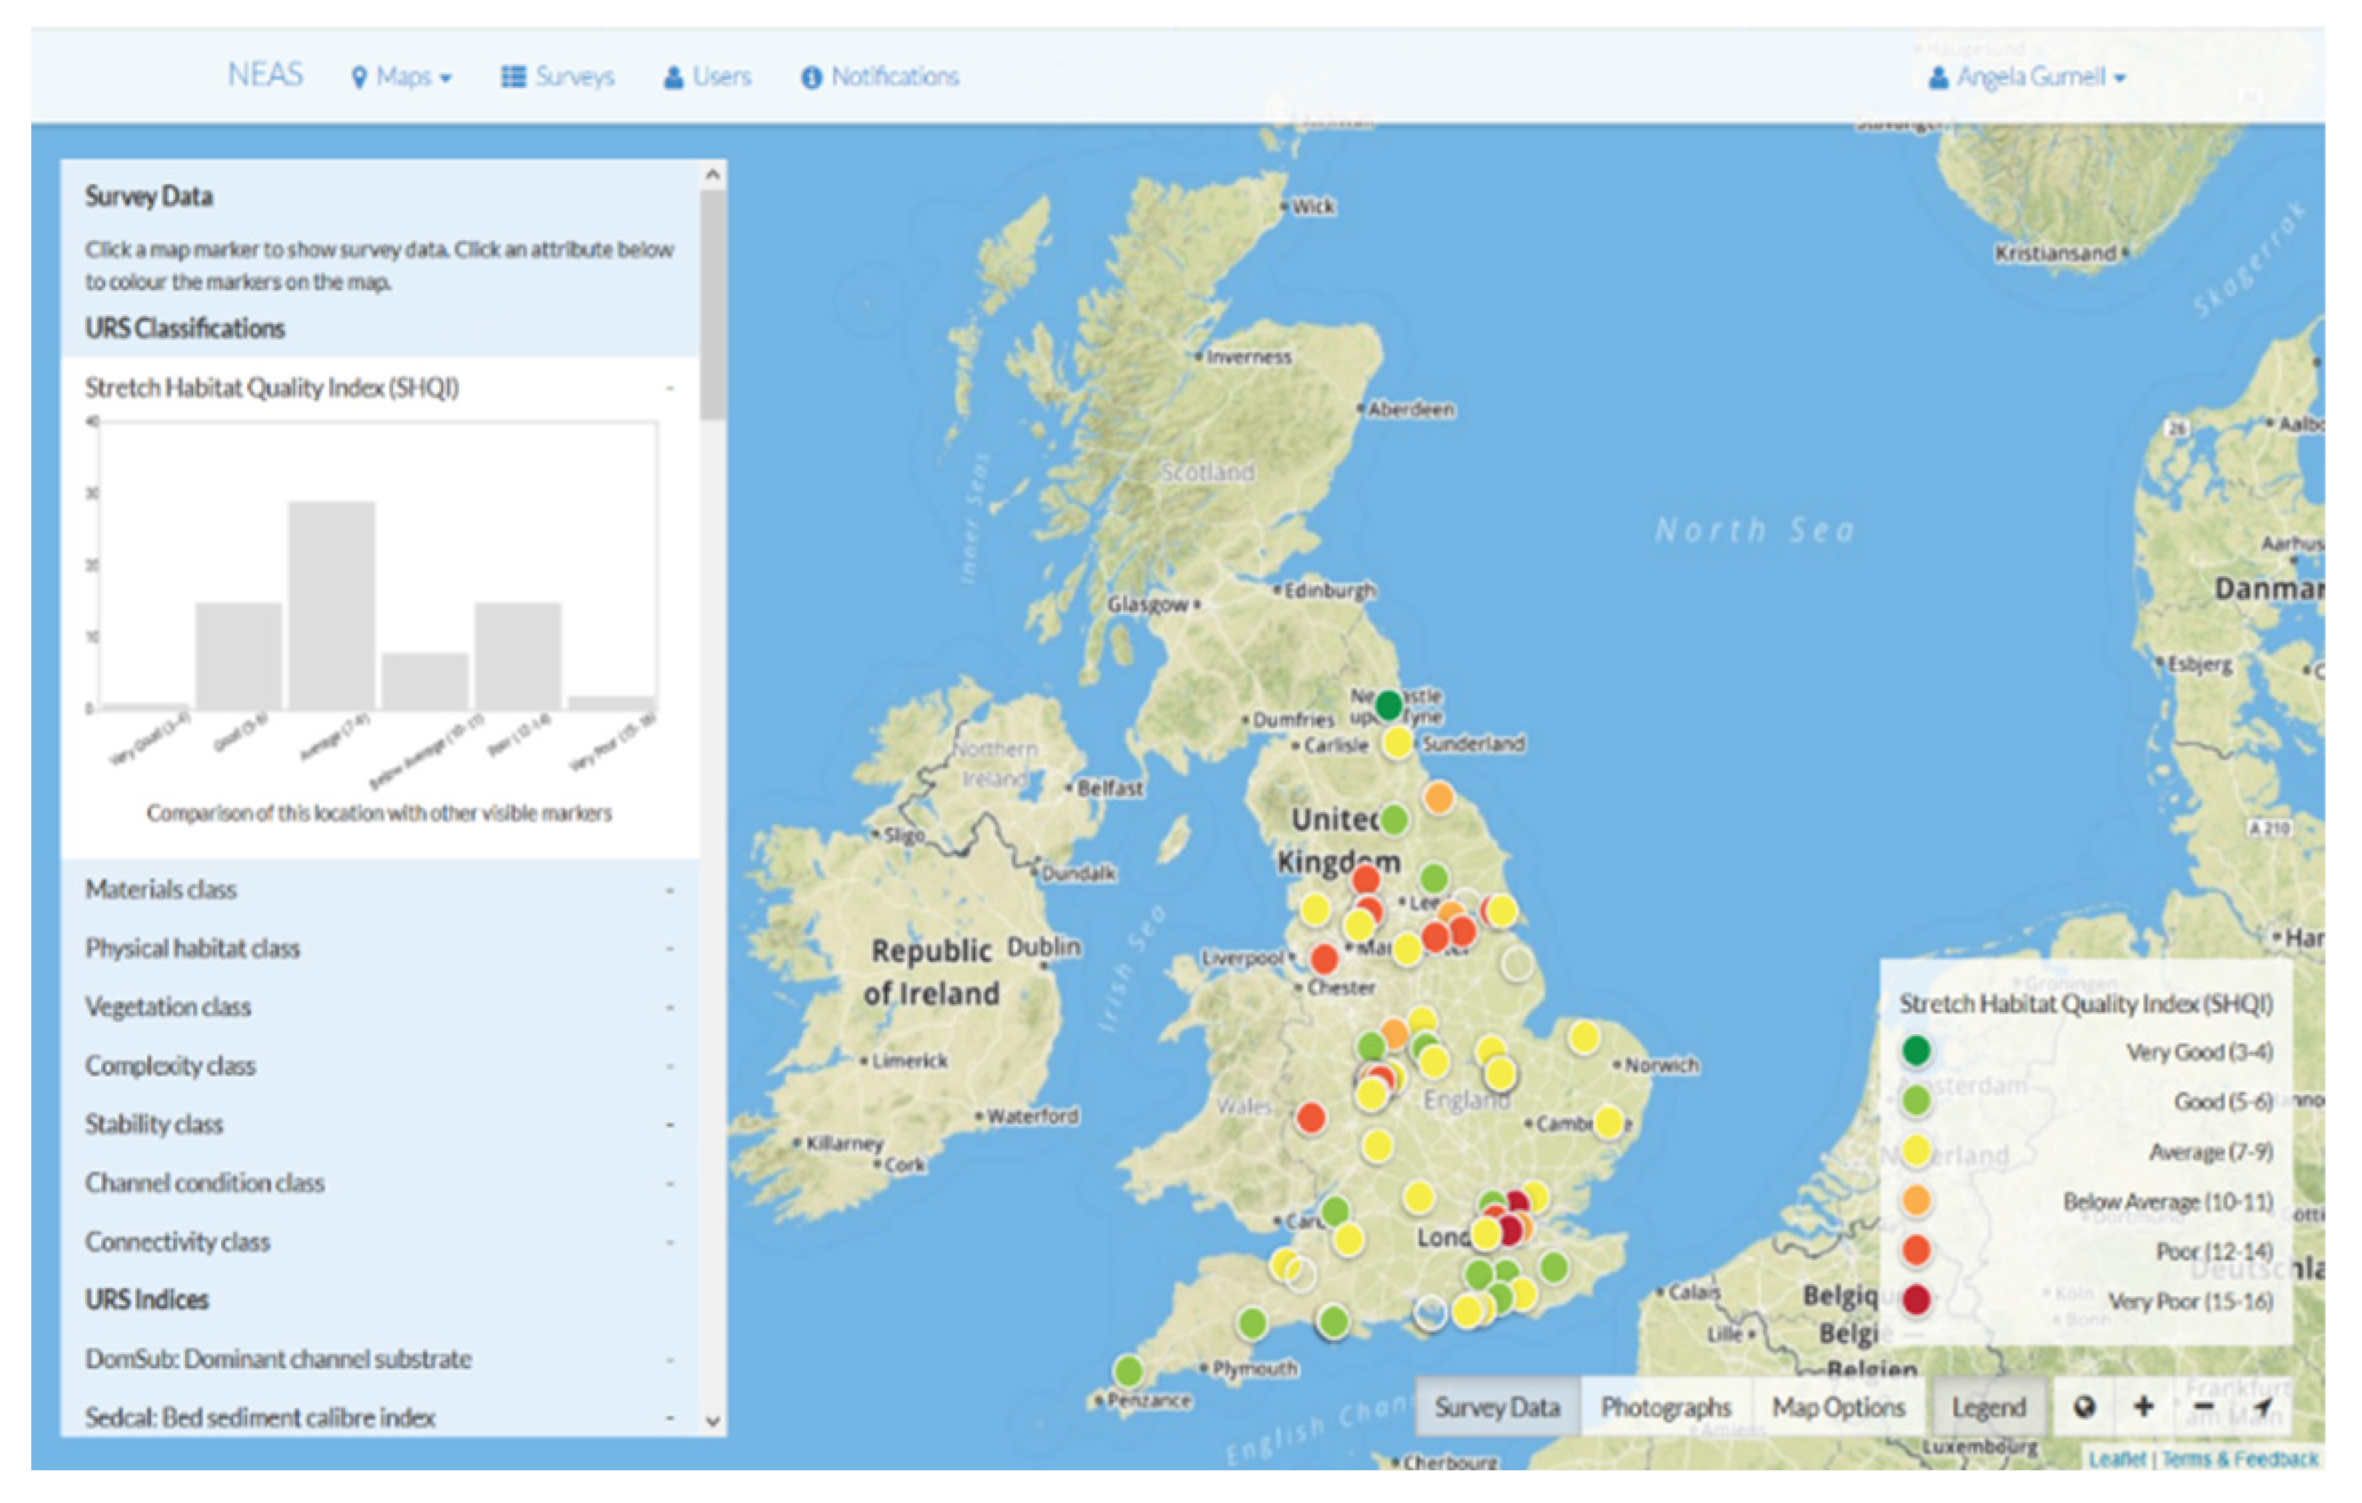
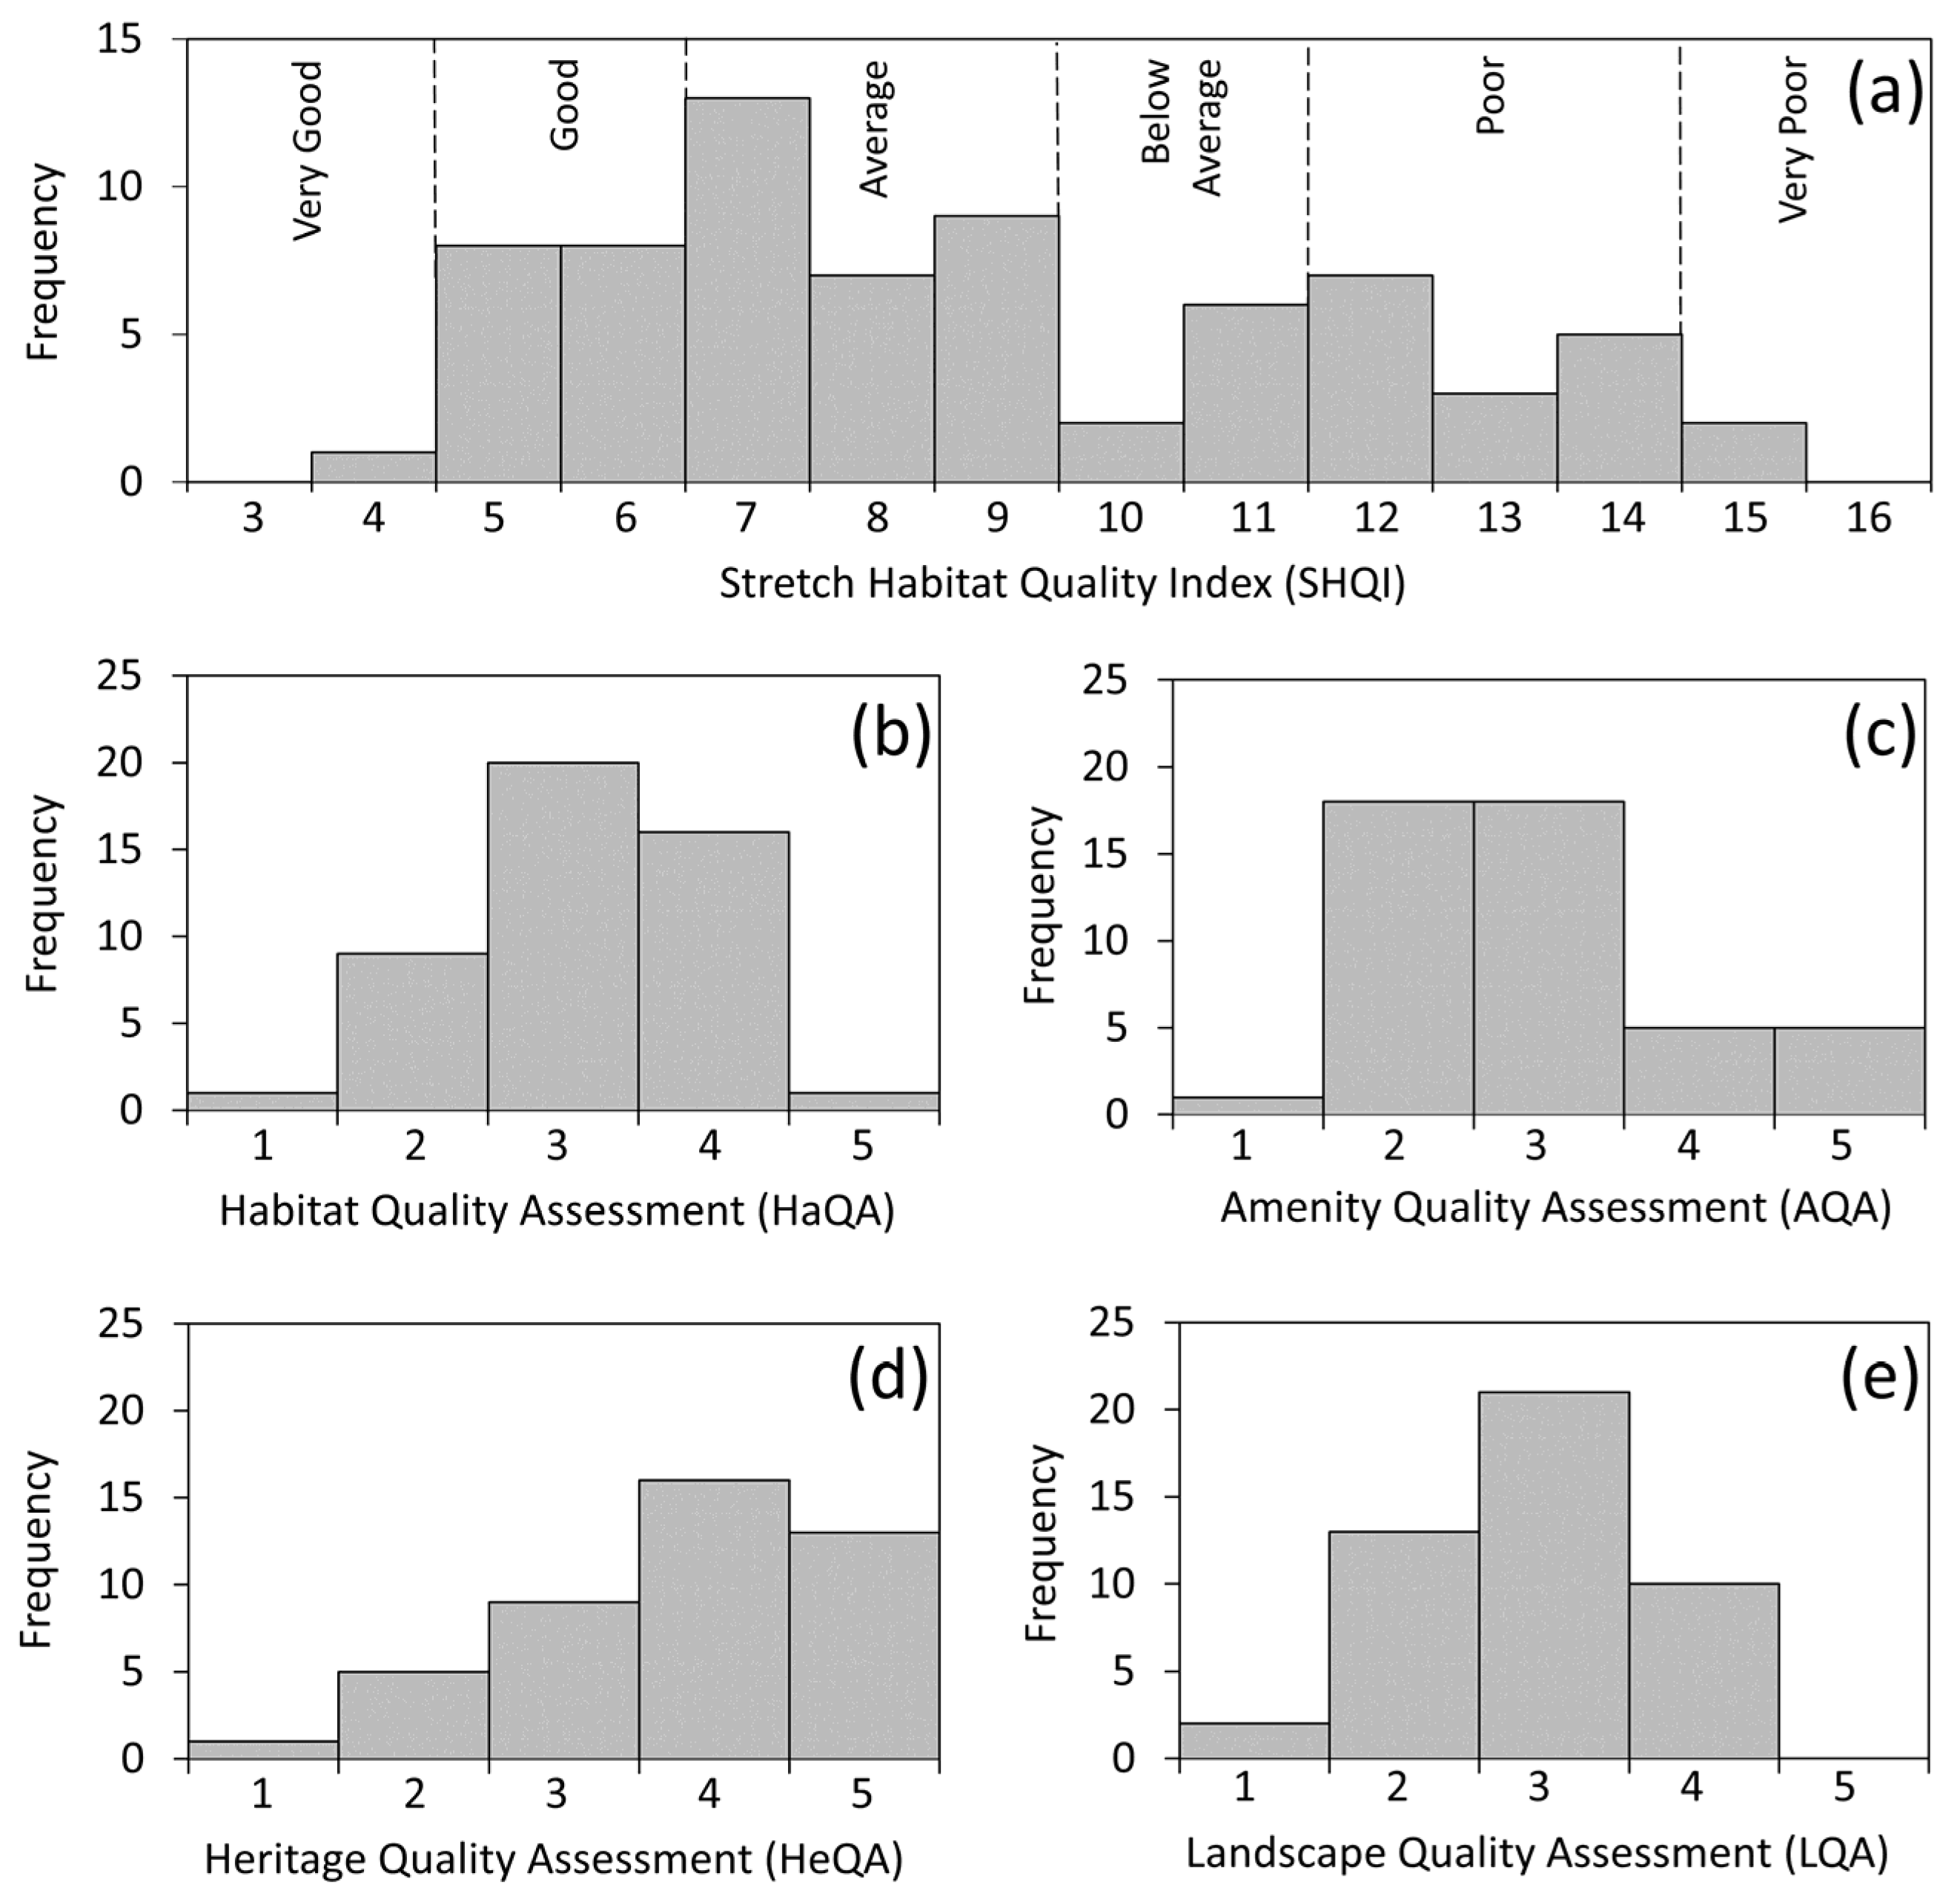
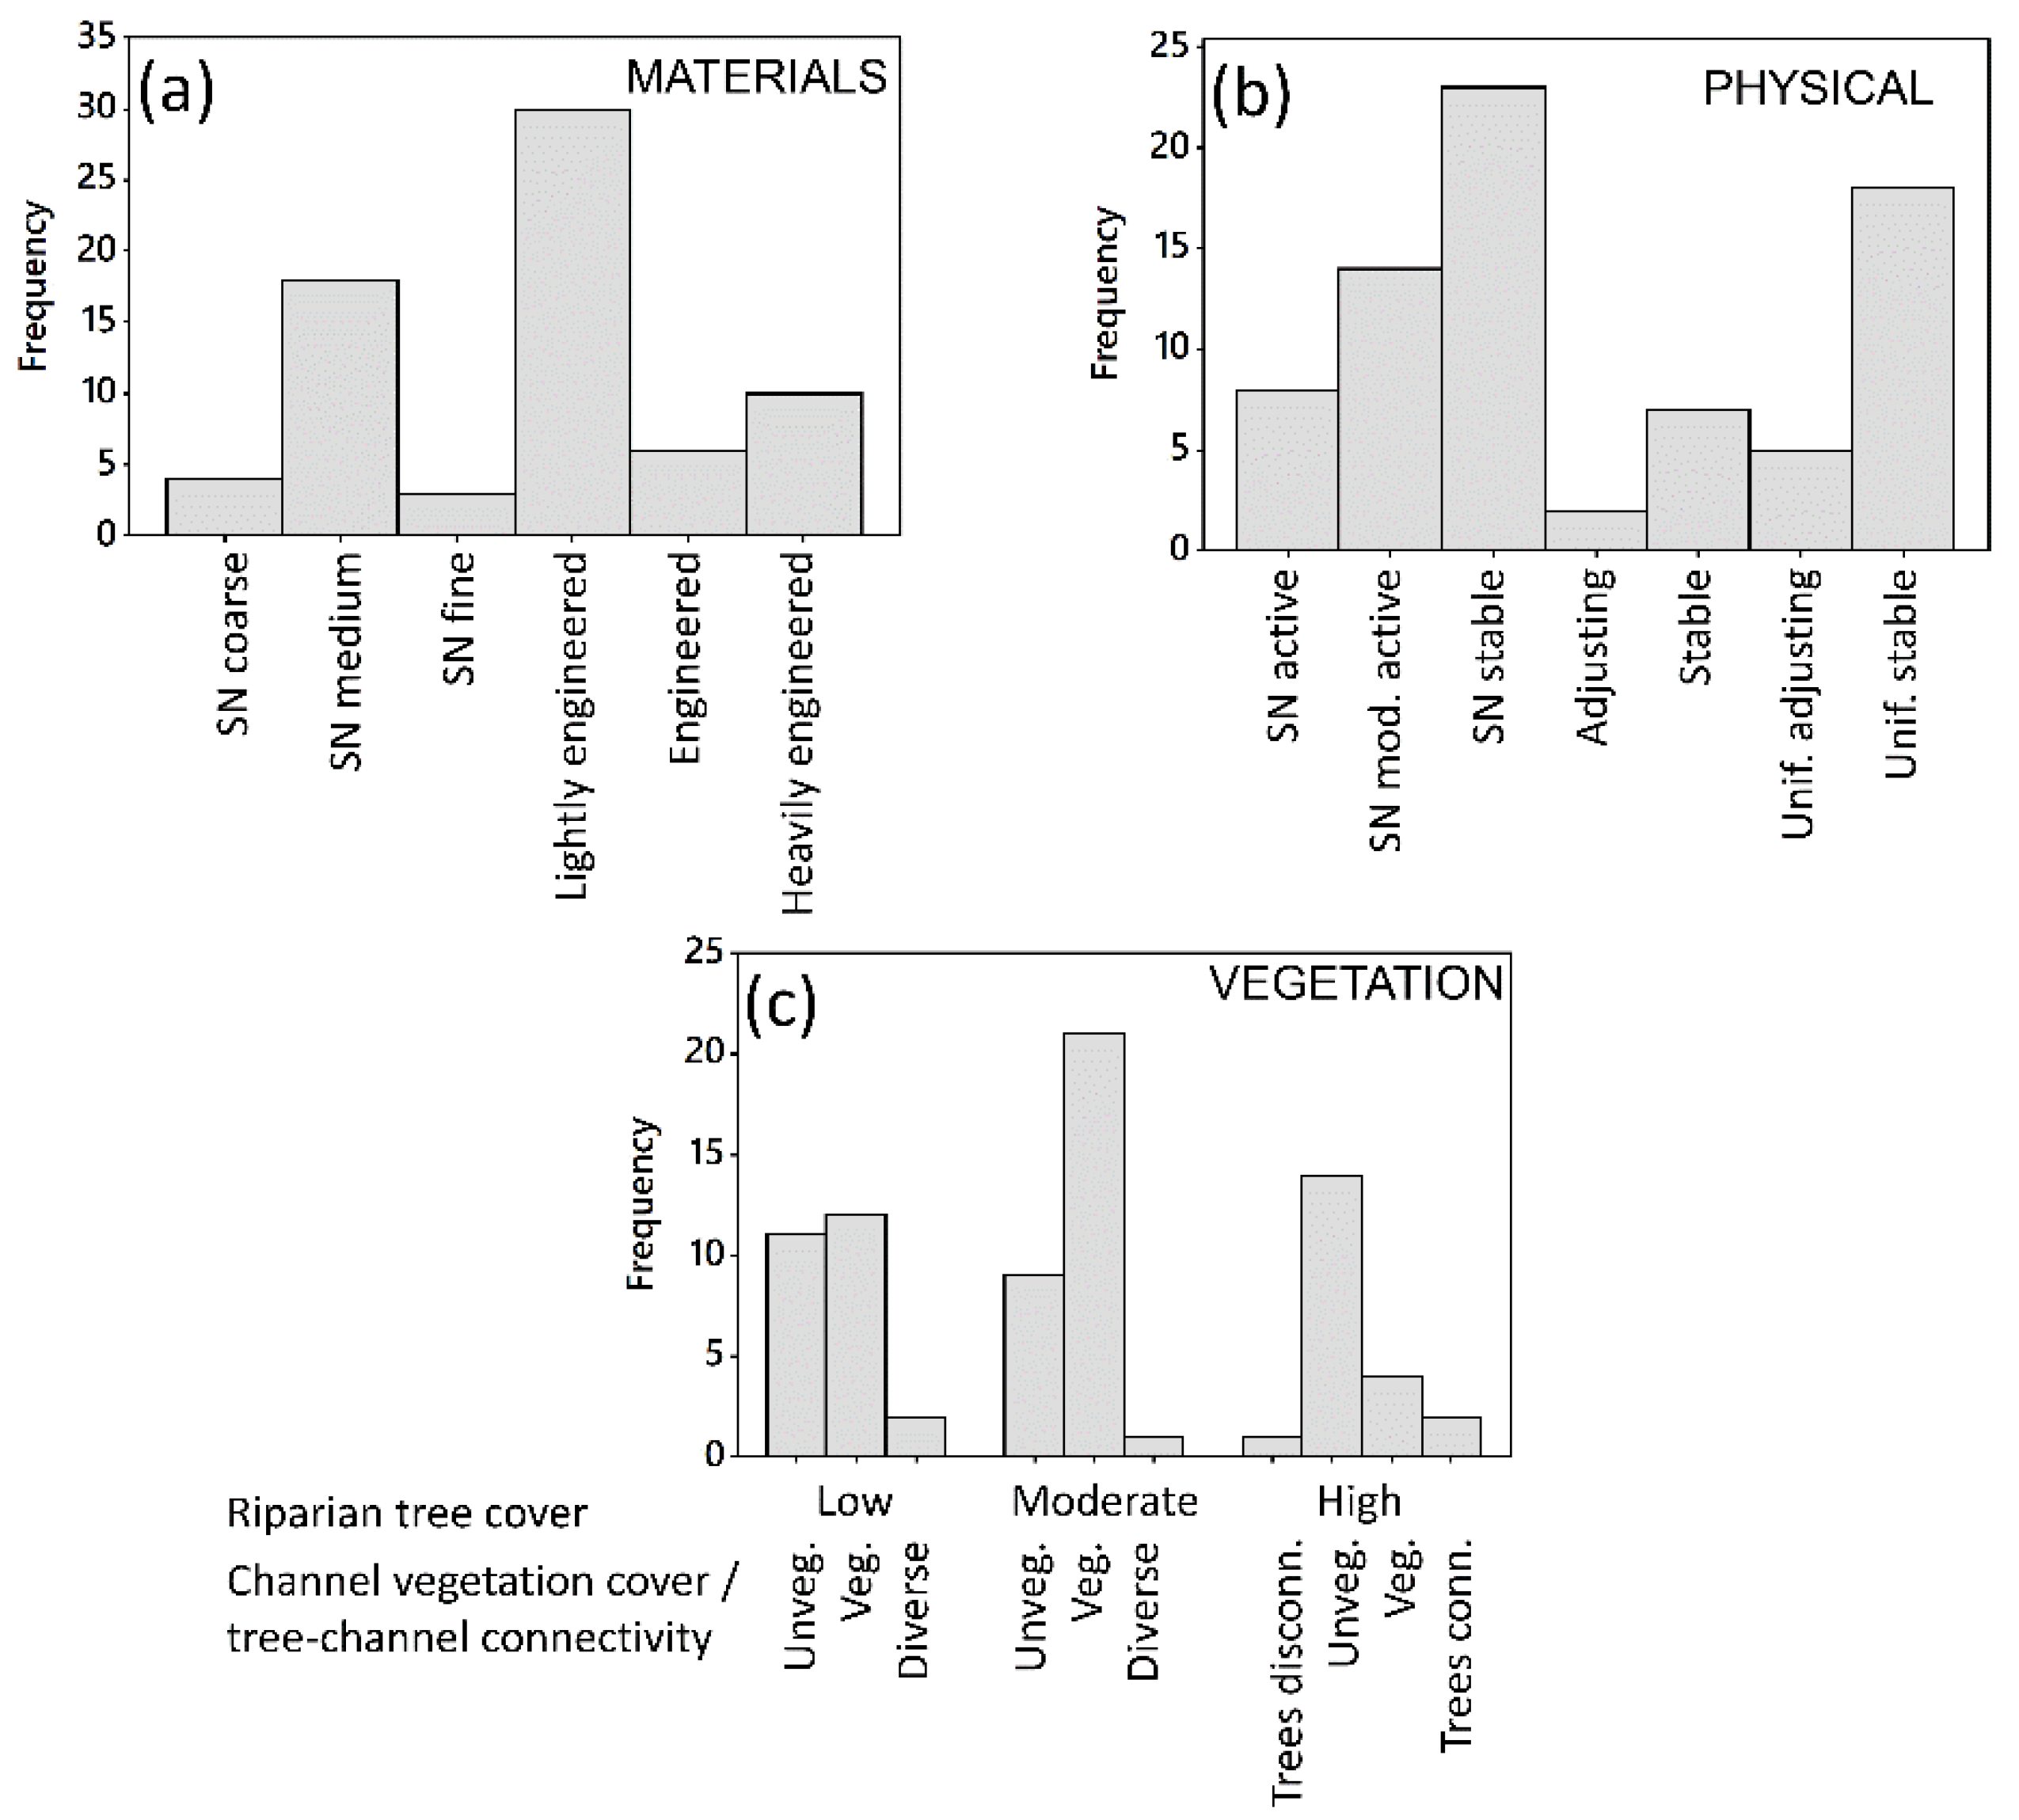
River Survey Indices (n = 70): These are derived from River Survey measurements (based on indices used in the Urban River Survey) to describe the following characteristics of the river and its margins: sediment calibre; flow types; bar types; bank profile types; vegetation; bank protection; pollution and nuisance plant species; channel stability; channel adjustment (refer to Supplementary Information (2) Table S1 pp. 3–13 for full details). Based on these indices, surveyed river stretches are classified according to their Materials, Physical Habitat, and Vegetation [27]. The Stretch Habitat Quality Index (SHQI) is derived from these three component classifications and supports the evaluation of Habitat and Biodiversity. SHQI values range from 3 to 16 with the lowest scores representing the highest-quality stretches.
Study Area Indices (n = 20): These are derived from measurements of the Study Area to describe characteristics, including: land cover; human accessibility and connectivity; recreation; education facilities; health and safety; economic and social value (refer to Supplementary Information (2) Table S2 pp. 14–17 for full details).
Key Points: These record the impressions gained by the surveyor while walking the whole site to complete the River and Study Area Surveys and are assembled in the field after completing the River and Study Area forms. They include summary points, ideally accompanied by images (e.g., photographs, maps, documents, annotated field sketches) and accurate locations of features of importance at the time of the survey. See for example Supplementary Information (3). Key points are crucial in supporting the high-level impression-based assessments of Habitat, Landscape, Amenity, and Heritage.
Impression-based Assessments: These reflect the surveyor’s overview of the “quality” of the Study Area and its river and generate four impression-based assessments: Habitat Quality Assessment (HaQA,; Landscape Quality Assessment (LQA), Amenity Quality Assessment (AQA), and Heritage Quality Assessment (HeQA). The assessments are recorded in the field on four forms, each with a guidance sheet. A single score is assigned and based on a 5-point scale, where 1 represents Very Good or optimum quality for the site, 2 Good, 3 Average, 4 Poor, and 5 Very Poor. Assessments of the Complexity, Coherence, Interest, and Condition, also recorded on a 5-point scale, a measure of the Level of Confidence of the surveyor (High, Medium, Low), and the Key Points all support the single high-level impression-based assessments of Landscape, Amenity, and Heritage. Refer to Supplementary Information (1) Technical Manual for full descriptions of the impression-based assessments and assignment of scores.
Table 2. PlaceMarker River Survey indices.
Sediment Calibre IndicesBank Protection Indices
Dominant Channel Substrate Type
Bed Sediment Calibre Index
Dominant Bank Material Type
Bank Sediment Calibre Index
Number of Mineral Bed Sediment Classes
Dominant Bank Material Protection Type
Dominant Bank Protection Class
Number Bank Protection Types
Proportion Biodegradable Bank Protection
Proportion Open Matrix Bank Protection
Proportion Solid Bank Protection
Proportion Immobile Bank Materials
Proportion Immobile Substrate
Flow Type IndicesPollution and Nuisance Plant Species Indices
Dominant Flow Types
Number of Flow Types
Number of Flow Habitats
Proportion of Pools
Proportion of Marginal Dead Water
Proportion of Glides
Proportion of Riffles
Proportion of Runs
Number of Pollution Indicators
Extent of Trash and Gross Pollution
Number of Nuisance Plant Species
Extent of Nuisance Plant Species
Severity of invasion by Nuisance Plant Species
Number of Input Pipes
Number of Leach Points
Number of Input and Leach Points
Potential River Pollution Intensity
Bar Type IndicesChannel Stability Indices
Count of Vegetated Side Bars
Count of Unvegetated Side Bars
Count of Sand/Silt Deposits
Count of Unvegetated and Vegetated Mid-channel Bar
Count of Unvegetated and Vegetated Point Bars
Number of Bar Types
Heavily Vegetated Banks and Bars
Negligible bank erosion
Extensive Mature Trees along Banks
Stable Channel
Bank Profile Type IndicesChannel Adjustment Indices
Dominant Natural Bank Profile Type
Number of Natural Bank Profile Types
Number of Natural Bank Habitats
Dominant Artificial Bank Profile Type
Number of Artificial Bank Profile Types
Proportion Natural Bank Profiles
Proportion No Bank Protection
Proportion Artificial Bank Profiles
Evidence for Lateral Migration
Evidence for Channel Widening
Evidence for Channel Narrowing
Potential Channel Bed Incision
Evidence for Bed and/or Bank Aggradation
Vegetation IndicesOther
Average Channel Vegetation Cover
Number of Channel Vegetation Types
Dominant Channel Vegetation Type
Count of Tree Features
Complexity Bank Face Structure
Complexity Bank Top Structure
Complexity Tree Cover
Number of Vegetation Habitats
Number of River and Margin Habitats
Extent of Disruption of Longitudinal Continuity by In-channel Structures
Number of Special Features
Source: Refer to Supplementary Information (2) PlaceMarker: Classifications and Indices for full details.
Table 3. PlaceMarker Study Area indices.
Land Cover Indices
-
Number of “green” land cover types in the Study Area
Human Connectivity and Accessibility
-
Accessibility into the Study Area for people
-
Indicates accessibility provided by footpaths
-
Indicates accessibility provided by cycle paths
-
Indicates accessibility available to wheelchairs
-
Visibility of river from Study Area
-
Visibility of urban–industrial transport from Study Area
-
Quality of visual connectivity
-
Aggregate Study Area connectivity
Recreation Indices
-
Range of recreational facility types available
-
Average Condition of recreational facilities
-
Presence and Condition of ‘wildlife areas’ areas
Education Indices
-
Presence and Condition of interpretation boards
-
Presence and Condition of formal education facilities
-
Aggregate educational value of Study Area
Health and Safety Indices
-
Presence of toilet and drinking water facilities
-
Presence of litter across the Study Area
-
Presence of litter disposal facilities across the Study Area
-
Facilities and indicators of personal safety
Economic and Social Values Indices
-
Potential economic and social value of the Study Area
Source: Refer to Supplementary Information (2) PlaceMarker: Classifications and Indices for full details.
Table 4. SHQI values and categories, associated characteristics, and management recommendations to improve physical habitat quality and diversity (developed from [26,27]).
SHQI ValuesSHQI CategoriesCharacteristicsManagement Recommendations
3–4Very GoodPredominantly semi-natural stretches or those that are recovering strongly from past interventions. Well-developed riparian vegetation, tree cover, and in some cases, diverse channel vegetation.Leave these stretches free of management and protect them from development.
5–6 GoodSemi-natural, recovering, and a few uniform channels displaying some activity, with good vegetation complexity and tree cover.Remove any remaining reinforcement to allow the channel to recover more freely and protect it from further development.
7–9AverageStretches with varying levels of engineering, but displaying some level of either recovery or activity, with reduced riparian vegetation complexity.Target for rehabilitation opportunities. Where possible, reduce the levels of immobile substrates and bank materials and increase sinuosity. Tree cover and bank top and face vegetation should be managed to provide increased variety and complexity.
10–11Below AverageStretches with varying levels of modification, but showing high levels of activity, combined with low bank vegetation complexity, and often, channels are choked with macrophytes.Target for rehabilitation opportunities. Where possible, reduce or alter the level and/or type of reinforcement and increase channel sinuosity where possible. Where macrophyte cover is excessive, increase tree cover through planting to provide partial shade and/or narrow the channel to increase shear stresses.
12–14 PoorModerate to heavily engineered channels with low to moderate levels of activity, low complexity of bank vegetation, and often, algal-dominated channels.Assess the water quality for improvement of in-channel vegetation diversity and assess the level of rehabilitation required to improve the physical condition of the channel. Where possible, reduce the level and/or type of reinforcement and increase channel sinuosity.
15–16 Very PoorHeavily engineered, often algal-dominated, stable channels with little vegetation complexity. Improve water quality and undertake aesthetic rehabilitation in the short term followed by some reduction in the level of reinforcement and an increase in channel sinuosity where possible.
Publisher’s Note: MDPI stays neutral with regard to jurisdictional claims in published maps and institutional affiliations.

