
Monitoring and Analysis of Drought Characteristics Based on Climate Change in Burundi Using Standardized Precipitation Evapotranspiration Index


College of Hydraulic Science and Engineering, Yangzhou University, Yangzhou 225009, China
*
Author to whom correspondence should be addressed.
Water 2022, 14(16), 2511; https://doi.org/10.3390/w14162511
Submission received: 17 June 2022
/
Revised: 1 August 2022
/
Accepted: 6 August 2022
/
Published: 15 August 2022
(This article belongs to the Section Hydrology)
Abstract
:Drought is a global issue with profound implications worldwide on biodiversity, equal safety, poverty eradication, sustainable development, and social-economic stability due to the significant role that water resources play in the growth of the world economy. Burundi is one of the highly vulnerable countries to the effects of climate change-related events because of its low adaptive capacity and high dependence on rainfed agriculture for livelihood. This research aimed to identify drought incidents and their characteristics in terms of duration, severity, and intensity and analysis of their trends in Burundi using the Standardized Precipitation Evapotranspiration Index (SPEI). Monthly precipitation and temperature data of seven meteorological stations across Burundi (1981–2020) were obtained from Burundi Geographical Institute (IGEBU). The SPEI index of -2, -6 and -24 month timescales were generated to understand drought characteristics and the Mann–Kendall (MK) test combined with Sen’s slope estimator were utilized to analyze the drought trend based on the calculated SPEI values. The overall analysis of the computed SPEI time series demonstrated that drought is more frequent and severe in Burundi, especially in the northern and eastern parts. The results showed that the most prolonged and severe drought occurred during the 1990–2010 decades, and 1993, 1994, 1995, 1999, 2000, 2001, 2004, 2005, 2006, 2009, and 2016 were extremely dry years. Proactive drought mitigation activities, climate change mitigation and water resources management policy are highly recommended in order to reduce drought risk and its effect on both population and the natural environment.
1. Introduction
Droughts are natural catastrophes that occur in all parts of the world but their duration, severity, and intensity vary from one region to another and country to country depending on the topography. Depending on the drought severity and duration, drought can have dangerous consequences for both humanity and the environment, notably affecting societal, economic and ecological systems. Natural phenomena such as climate change and weather variability are mostly responsible for drought; however, human activities such as mining and deforestation can exacerbate the frequency and severity of drought [1,2,3,4,5]. Desertification is a global issue with profound implications worldwide on biodiversity, equal safety, poverty eradication, sustainable development, and social-economic stability due to the significant role that water resources play in the growth of the World economy. For instance, the global estimations on natural hazards, including flood and drought impacts, indicate that a total number of 432 disastrous incidents were registered globally in 2021; as a result, a population of over 101.8 million was directly affected and approximately 10,492 people died, together with an estimate of economic losses of about USD 252.1 billion [6]. The African continent is more affected by drought than other continents, especially in sub-Saharan regions that experience dramatic consequences of climate change hazards resulting in failure of crop production [7]. Many studies have indicated that the occurrence and the severity of drought have been increasing due to climate change and the growth of the population, which is linked to the high demand for water and the degradation of land in east African countries [8,9,10]. In recent decades, scholars, decision makers, and scientists have been paying increased attention to the monitoring and assessment of drought worldwide to establish predicting or early warning systems to lessen economic losses or to mitigate other effects of drought in case of occurrence [11,12,13,14,15]. Several studies have highlighted that both temperature and rainfall play a significant role in drought response [16,17]. Hence, different methods and various drought indices are utilized to quantify, monitor, and analyze the characteristics of drought such as duration, frequency, severity, and intensity. Some of the widely used drought indices are the Standardized Precipitation Index (SPI) as pioneered by Mckee et al. [18], the Standardized Precipitation Evapotranspiration Index introduced by Vicente et al. [19], the Palmer Drought Severity Index introduced by Palmer [20], the China Z Index that was first utilized and developed by National Climate Centre of China in 1995, the Rainfall Anomaly Index presented by Van Rooy [21], etc. These indices have been commonly employed in assessing drought in different regions on the globe. For instance, Kalisa et al. [22] employed the SPI to study drought conditions across the East Africa region between 1920 and 2015, and the drought characteristics such as duration, magnitude, and intensity explained the severity levels of drought in the region. Additionally, Rolbiecki et al. [23] applied the SPI to analyze drought occurrence in three provinces Adana, Mersin, and Osmaniye, in the Çukurova region in Turkey during the maize growing seasons and successfully calculated the magnitude, duration, severity, recurrence, and frequency of drought. The SPI method has been a choice of many researchers to monitor and identify drought events across different regions worldwide due to its simplicity in calculation and the fact that it requires only one single data input [12,24,25,26,27,28]. On the other hand, due to the complexity of drought, some researchers prefer to utilize the SPEI that incorporates both precipitation and Potential Evapotranspiration (PET) to assess and monitor the drought over spatial and temporal scales [29,30,31,32,33,34,35]. For instance, Polong et al. [36] used the SPEI to investigate the spatial and temporal evolution of dry and wet incidents and determine their characteristics such as duration, severity, and intensity in the Tana River Basin in Kenya. The study highlighted that the SPEI is the most appropriate index due to its ability to consider the potential impacts of climate change. Additionally, based on the SPEI, Ayugi et al. [37] examined drought and wet events across Kenya from 1981 to 2016. The study concluded by confirming the good performance and robustness of the SPEI in capturing the underlying mechanisms of dryness and wetness conditions. Likewise, Nguvava et al. [38] stated that the SPEI is more robust than the SPI in a study that combined precipitation and PET to examine the impacts of global warming on drought across East Africa.
Although different drought indices have been utilized to analyze the occurrence of drought in the East Africa region and other region worldwide [39,40,41,42,43], in Burundi, the SPEI index has not yet been employed. It is very important to have information on drought and climate change to monitor drought and mitigate its impacts on human health and wealth at the regional and national levels. Drought monitoring provides crucial information that helps minimize the consequences of drought, and it is useful for drought risk management and water resources planning and operation. However, drought has not been investigated in many parts of the country. Furthermore, technical and scientific study methods on drought duration, severity and intensity in Burundi have not been well studied and documented. However, it is drought-prone, especially in the northern and eastern parts. Thus, these situations motivated the authors to consider this investigation in order to provide indispensable information. Therefore, in order to fill these gaps, this is the first study that aimed at monitoring drought duration, severity, and intensity by using the SPEI index at various timescales in Burundi. It will serve as a reference in studies yet to come and as assistance to decision makers in setting up drought management measures and early warning systems.
2. Materials
2.1. Description of the Study Area and Datasets
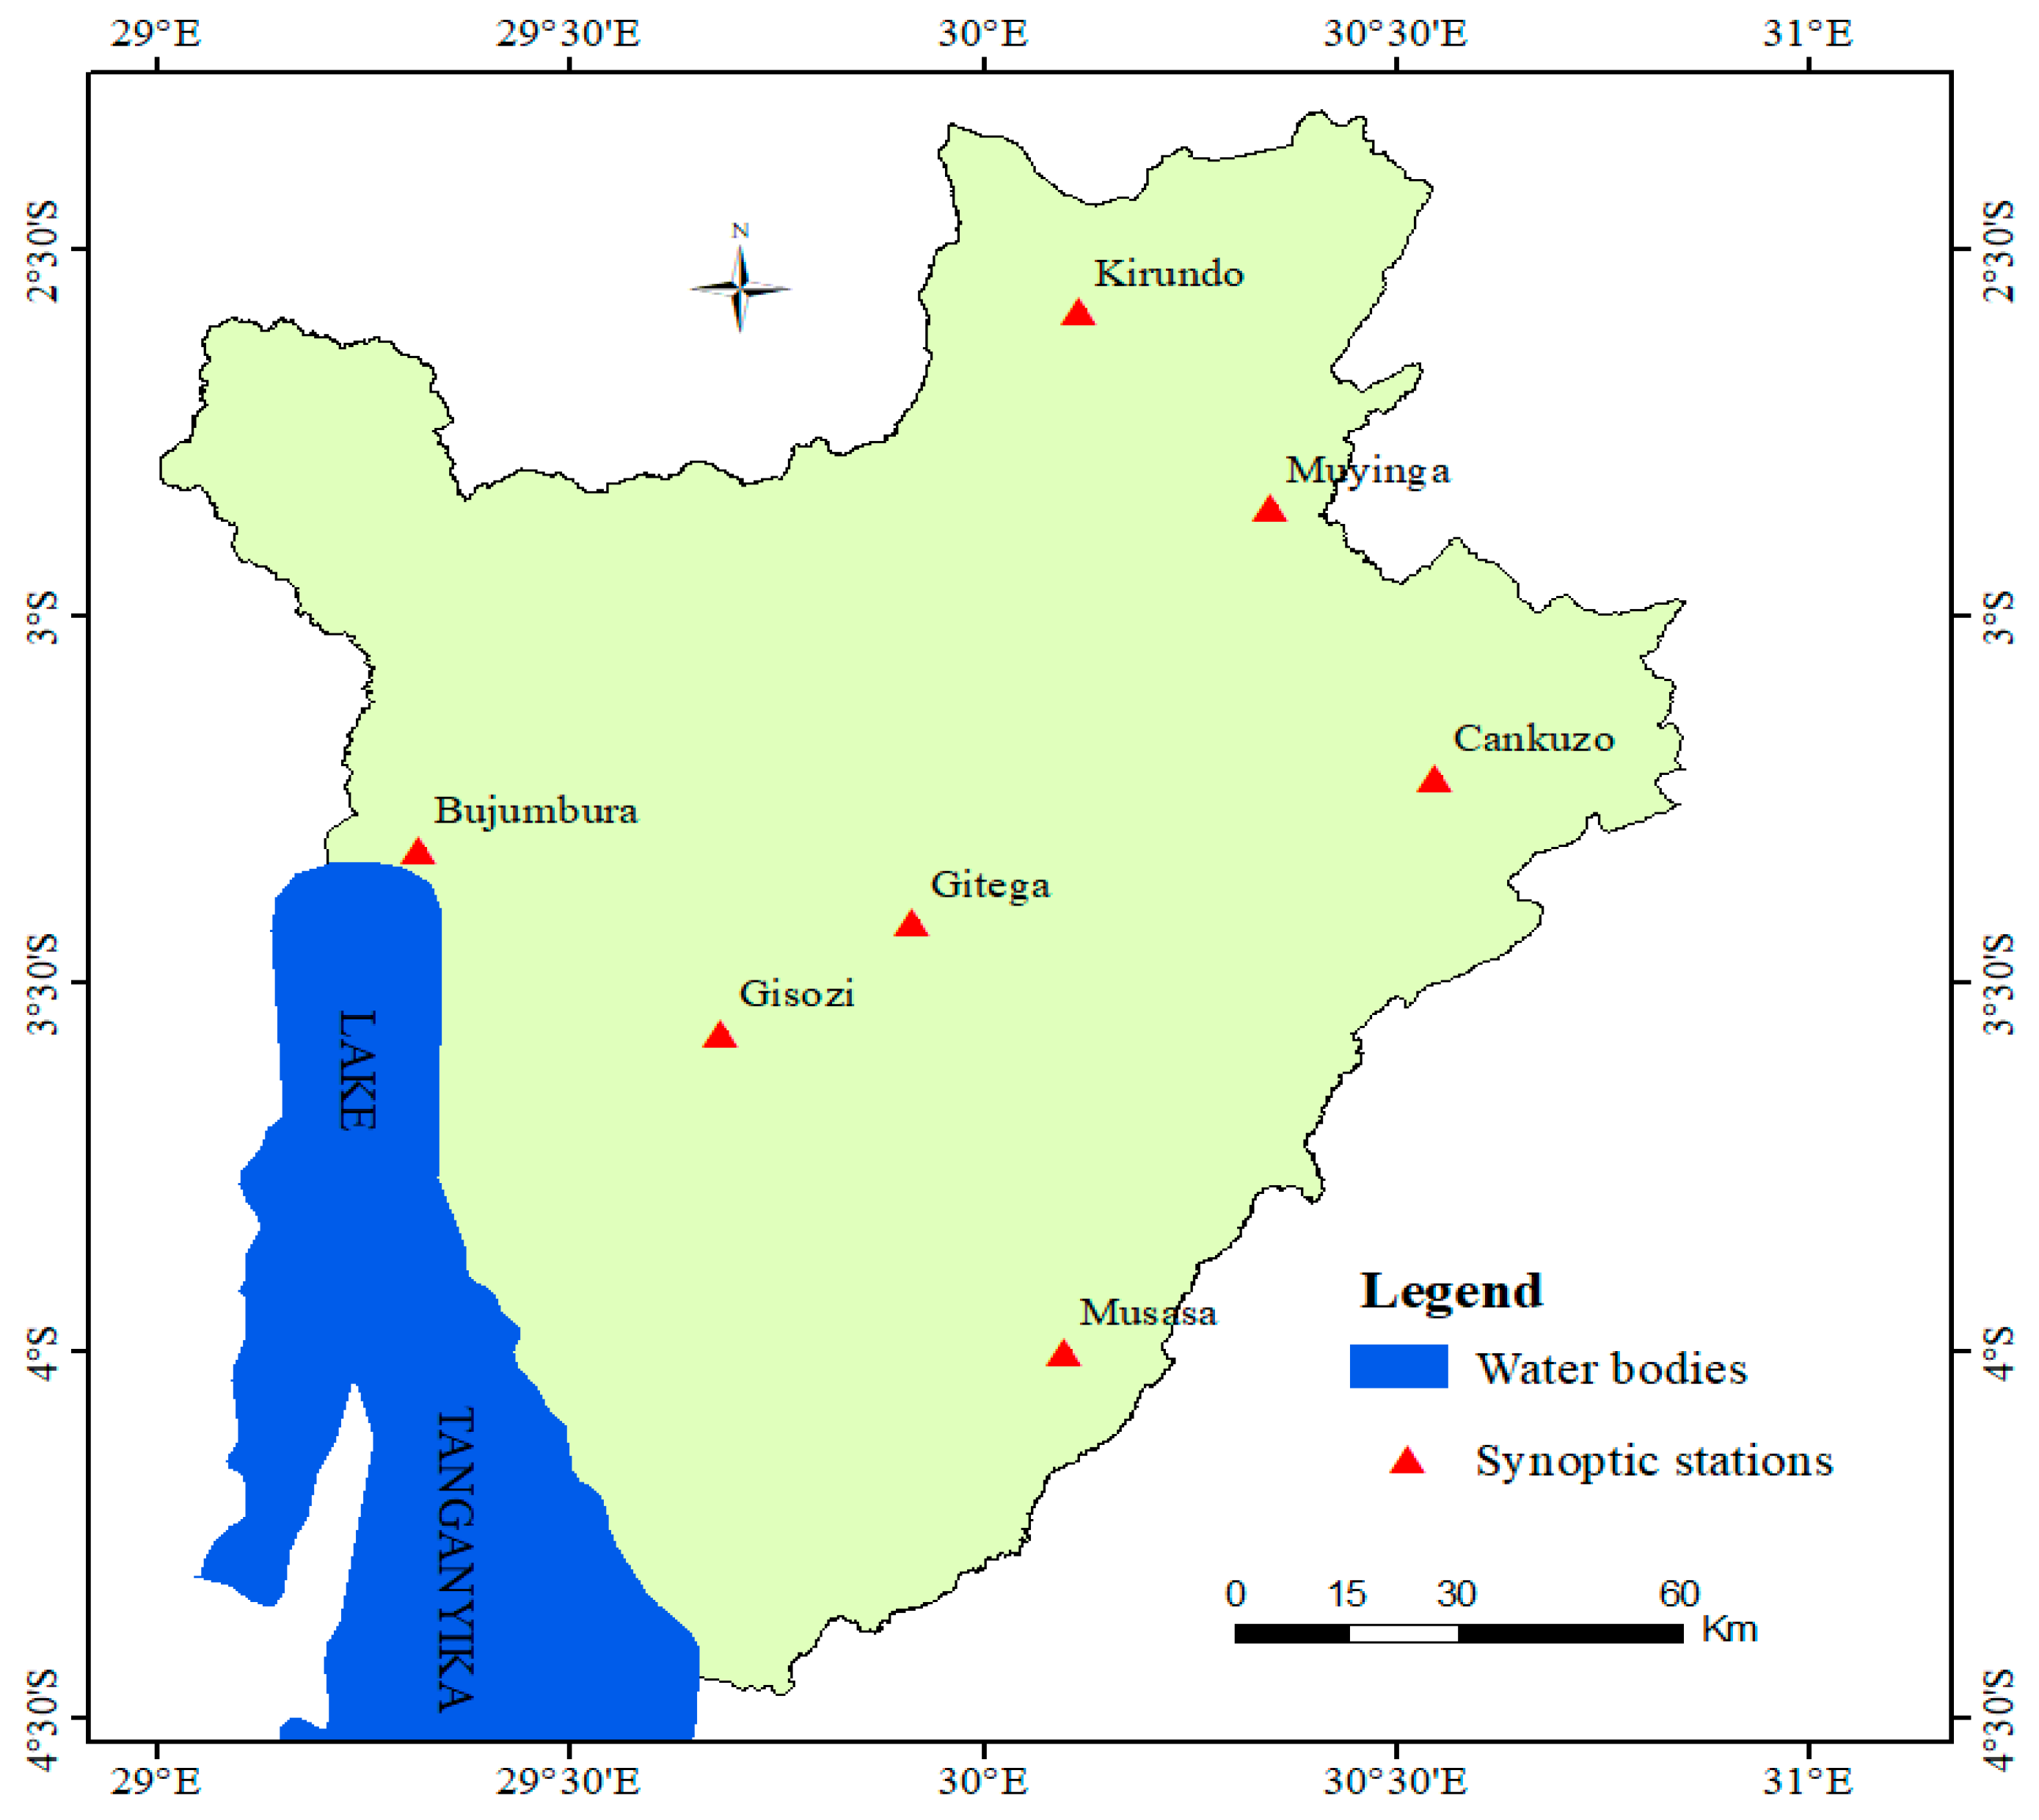
Burundi is a landlocked country bordered to the north by Rwanda, to the south and east by Tanzania, and to the west by the Democratic Republic of Congo (DRC). The country has a tropical climate due to its location in the equatorial band. The topography of Burundi is characterized by five diversities micro-climatic regions: the northern and eastern parts that are characterized by depressions and plains; the escarpments of Mirwa; in the western part, the Congo–Nile ridge divides Burundi’s water resources into two main basins; and in the center there is a plateau. In Burundi the climate is characterized by bimodal precipitation patterns that correspond to the circulation of the Intertropical Convergence Zone from the Northern to the Southern hemispheres and vice versa. Hence, Burundi typically experiences four seasons, including two rainy seasons, one that runs from September to December and another that runs from March to May, and two dry seasons, the short one of which runs from January to February, while the long dry season runs from June to August. The temperature and precipitation vary with the topography and elevation. In this, the depressions in the northern and eastern parts and the plains in the western part are regarded as semi-dry regions with yearly rainfall records of less than 1000 mm, and the temperature can easily reach 25 °C. On the other hand, the Escarpment of Mirwa records annual rainfall between 1000 and 1400 mm. The Congo–Nile Ridge zone experiences the highest precipitation, which varies between 1400 and 1700 mm, and temperature ranging between 14 and 17 °C due to its location in a mountainous region with higher altitude. The central part, which is principally dominated by a plateau, registers annual precipitation varying between 1100 and 1400 mm. Figure 1 shows a map of the study area that was generated in ArcGIS version 10.3.1.
2.2. Datasets
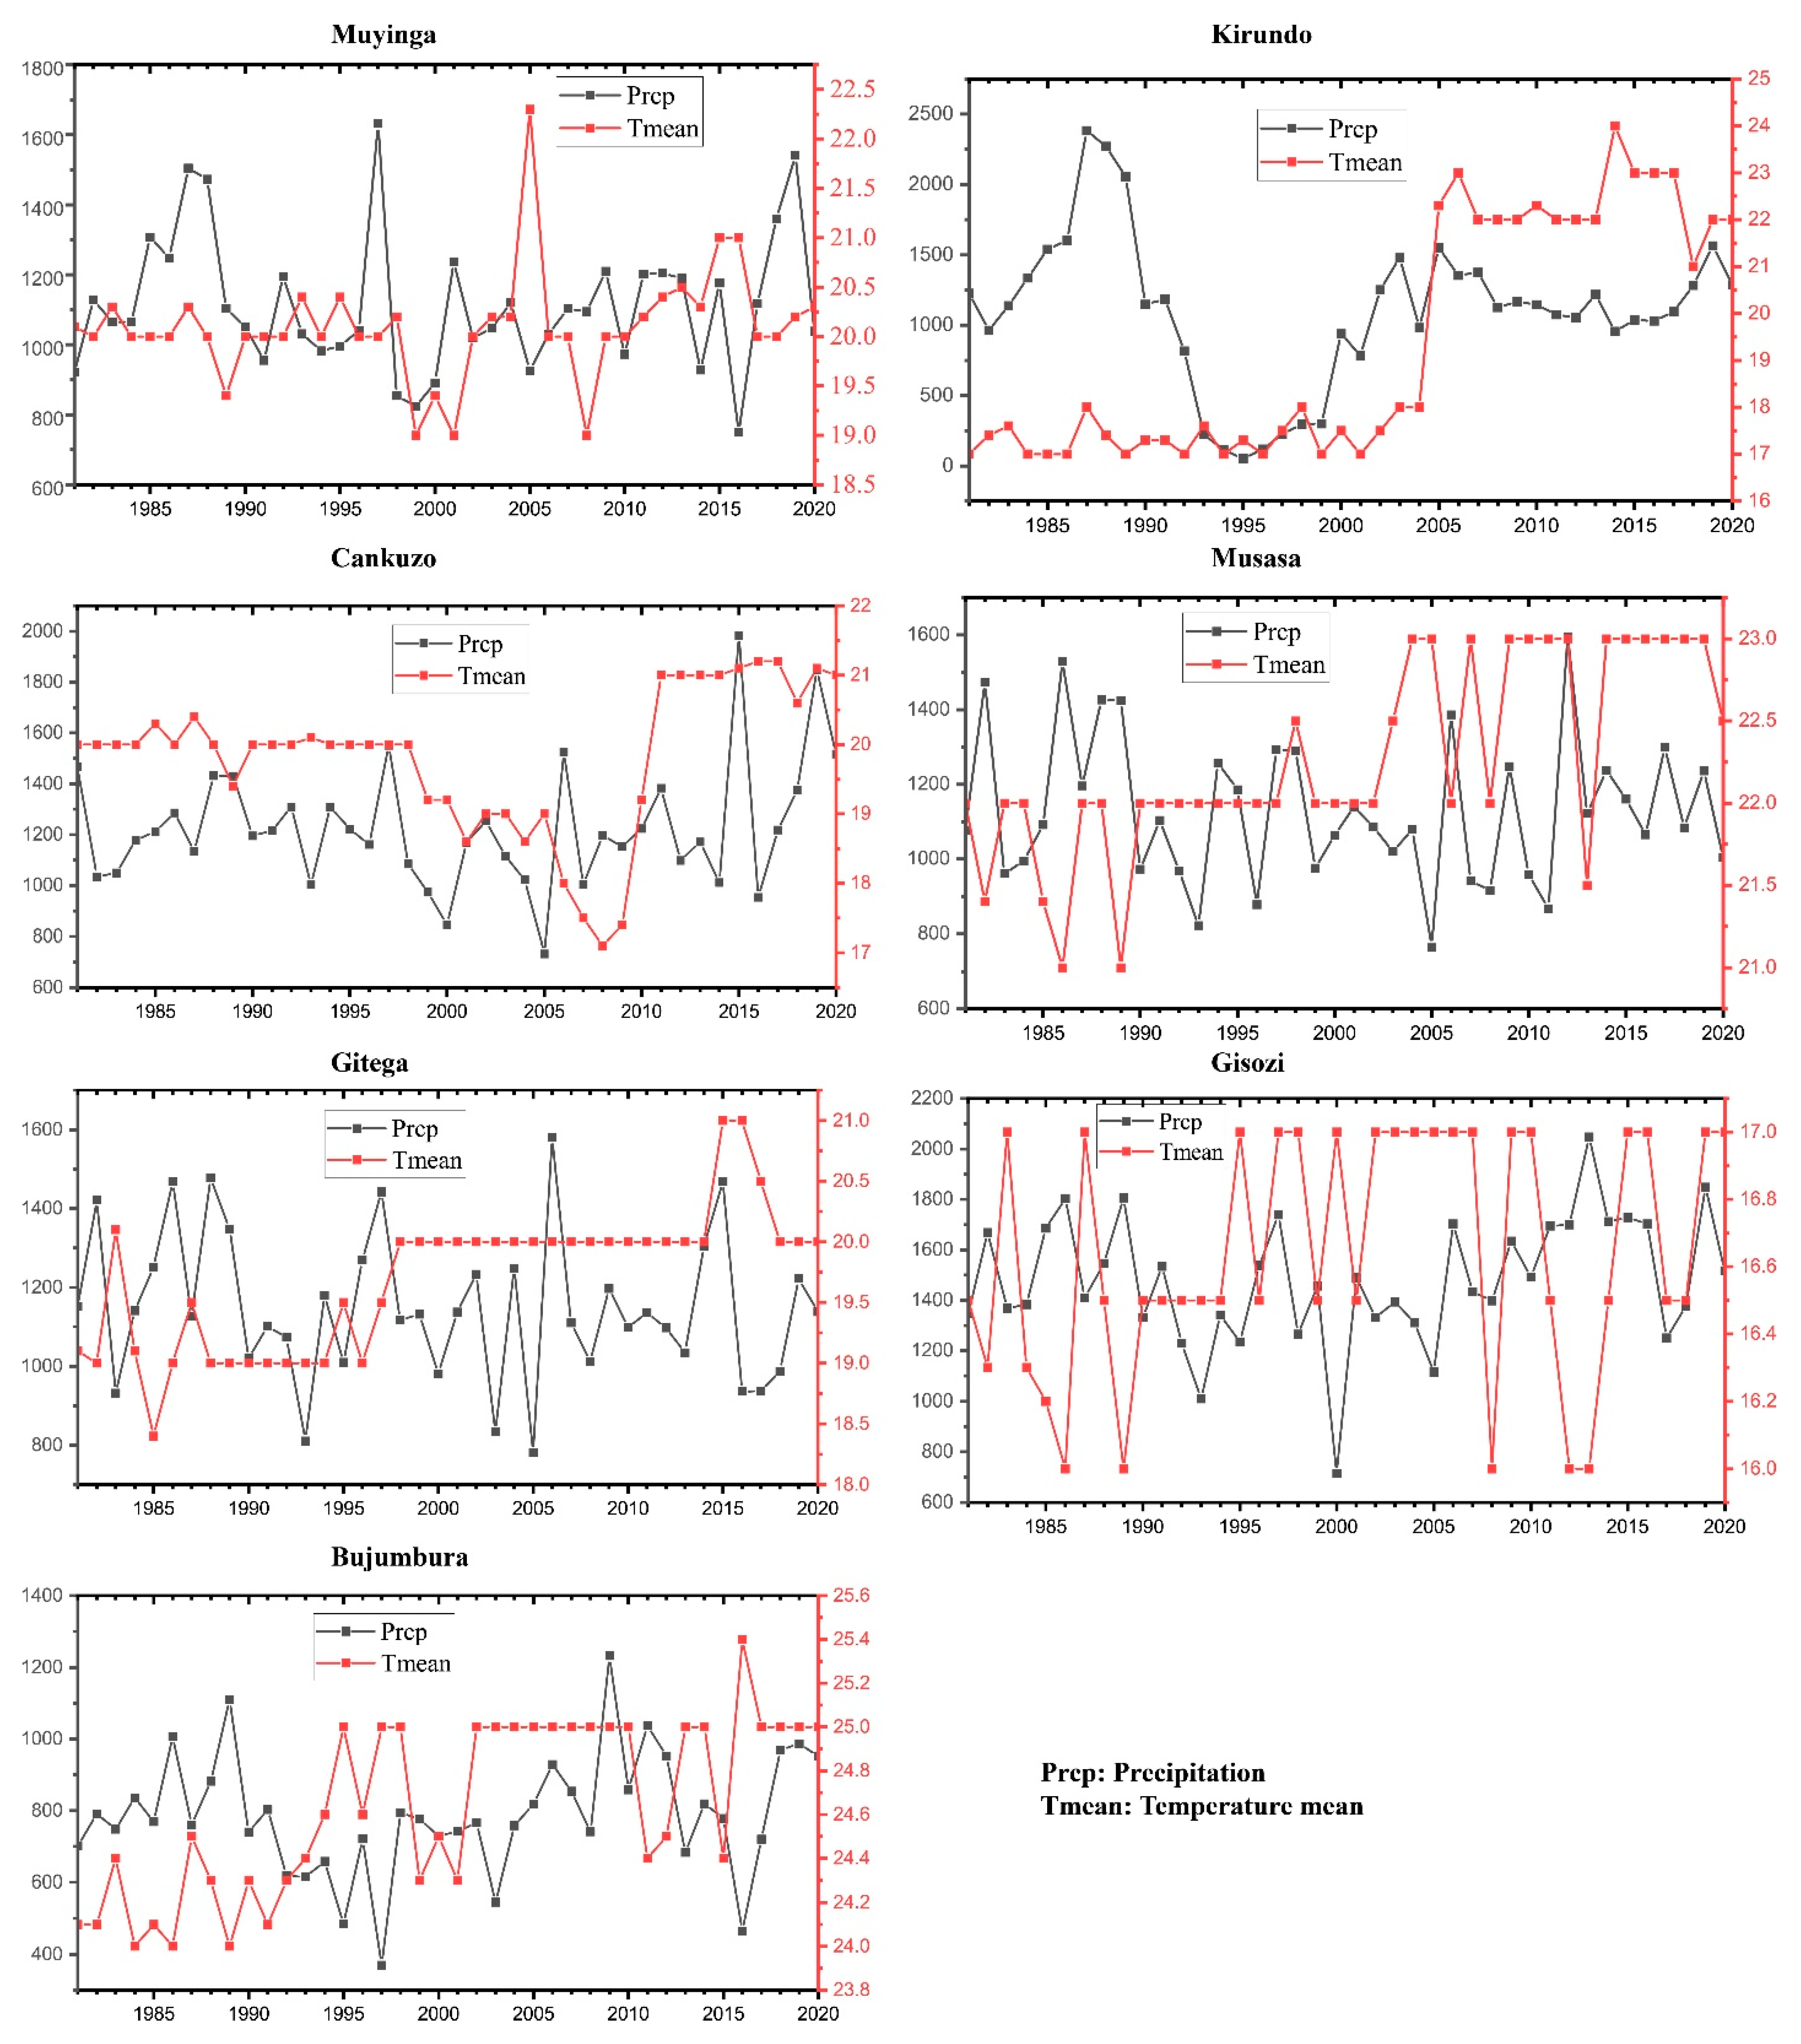
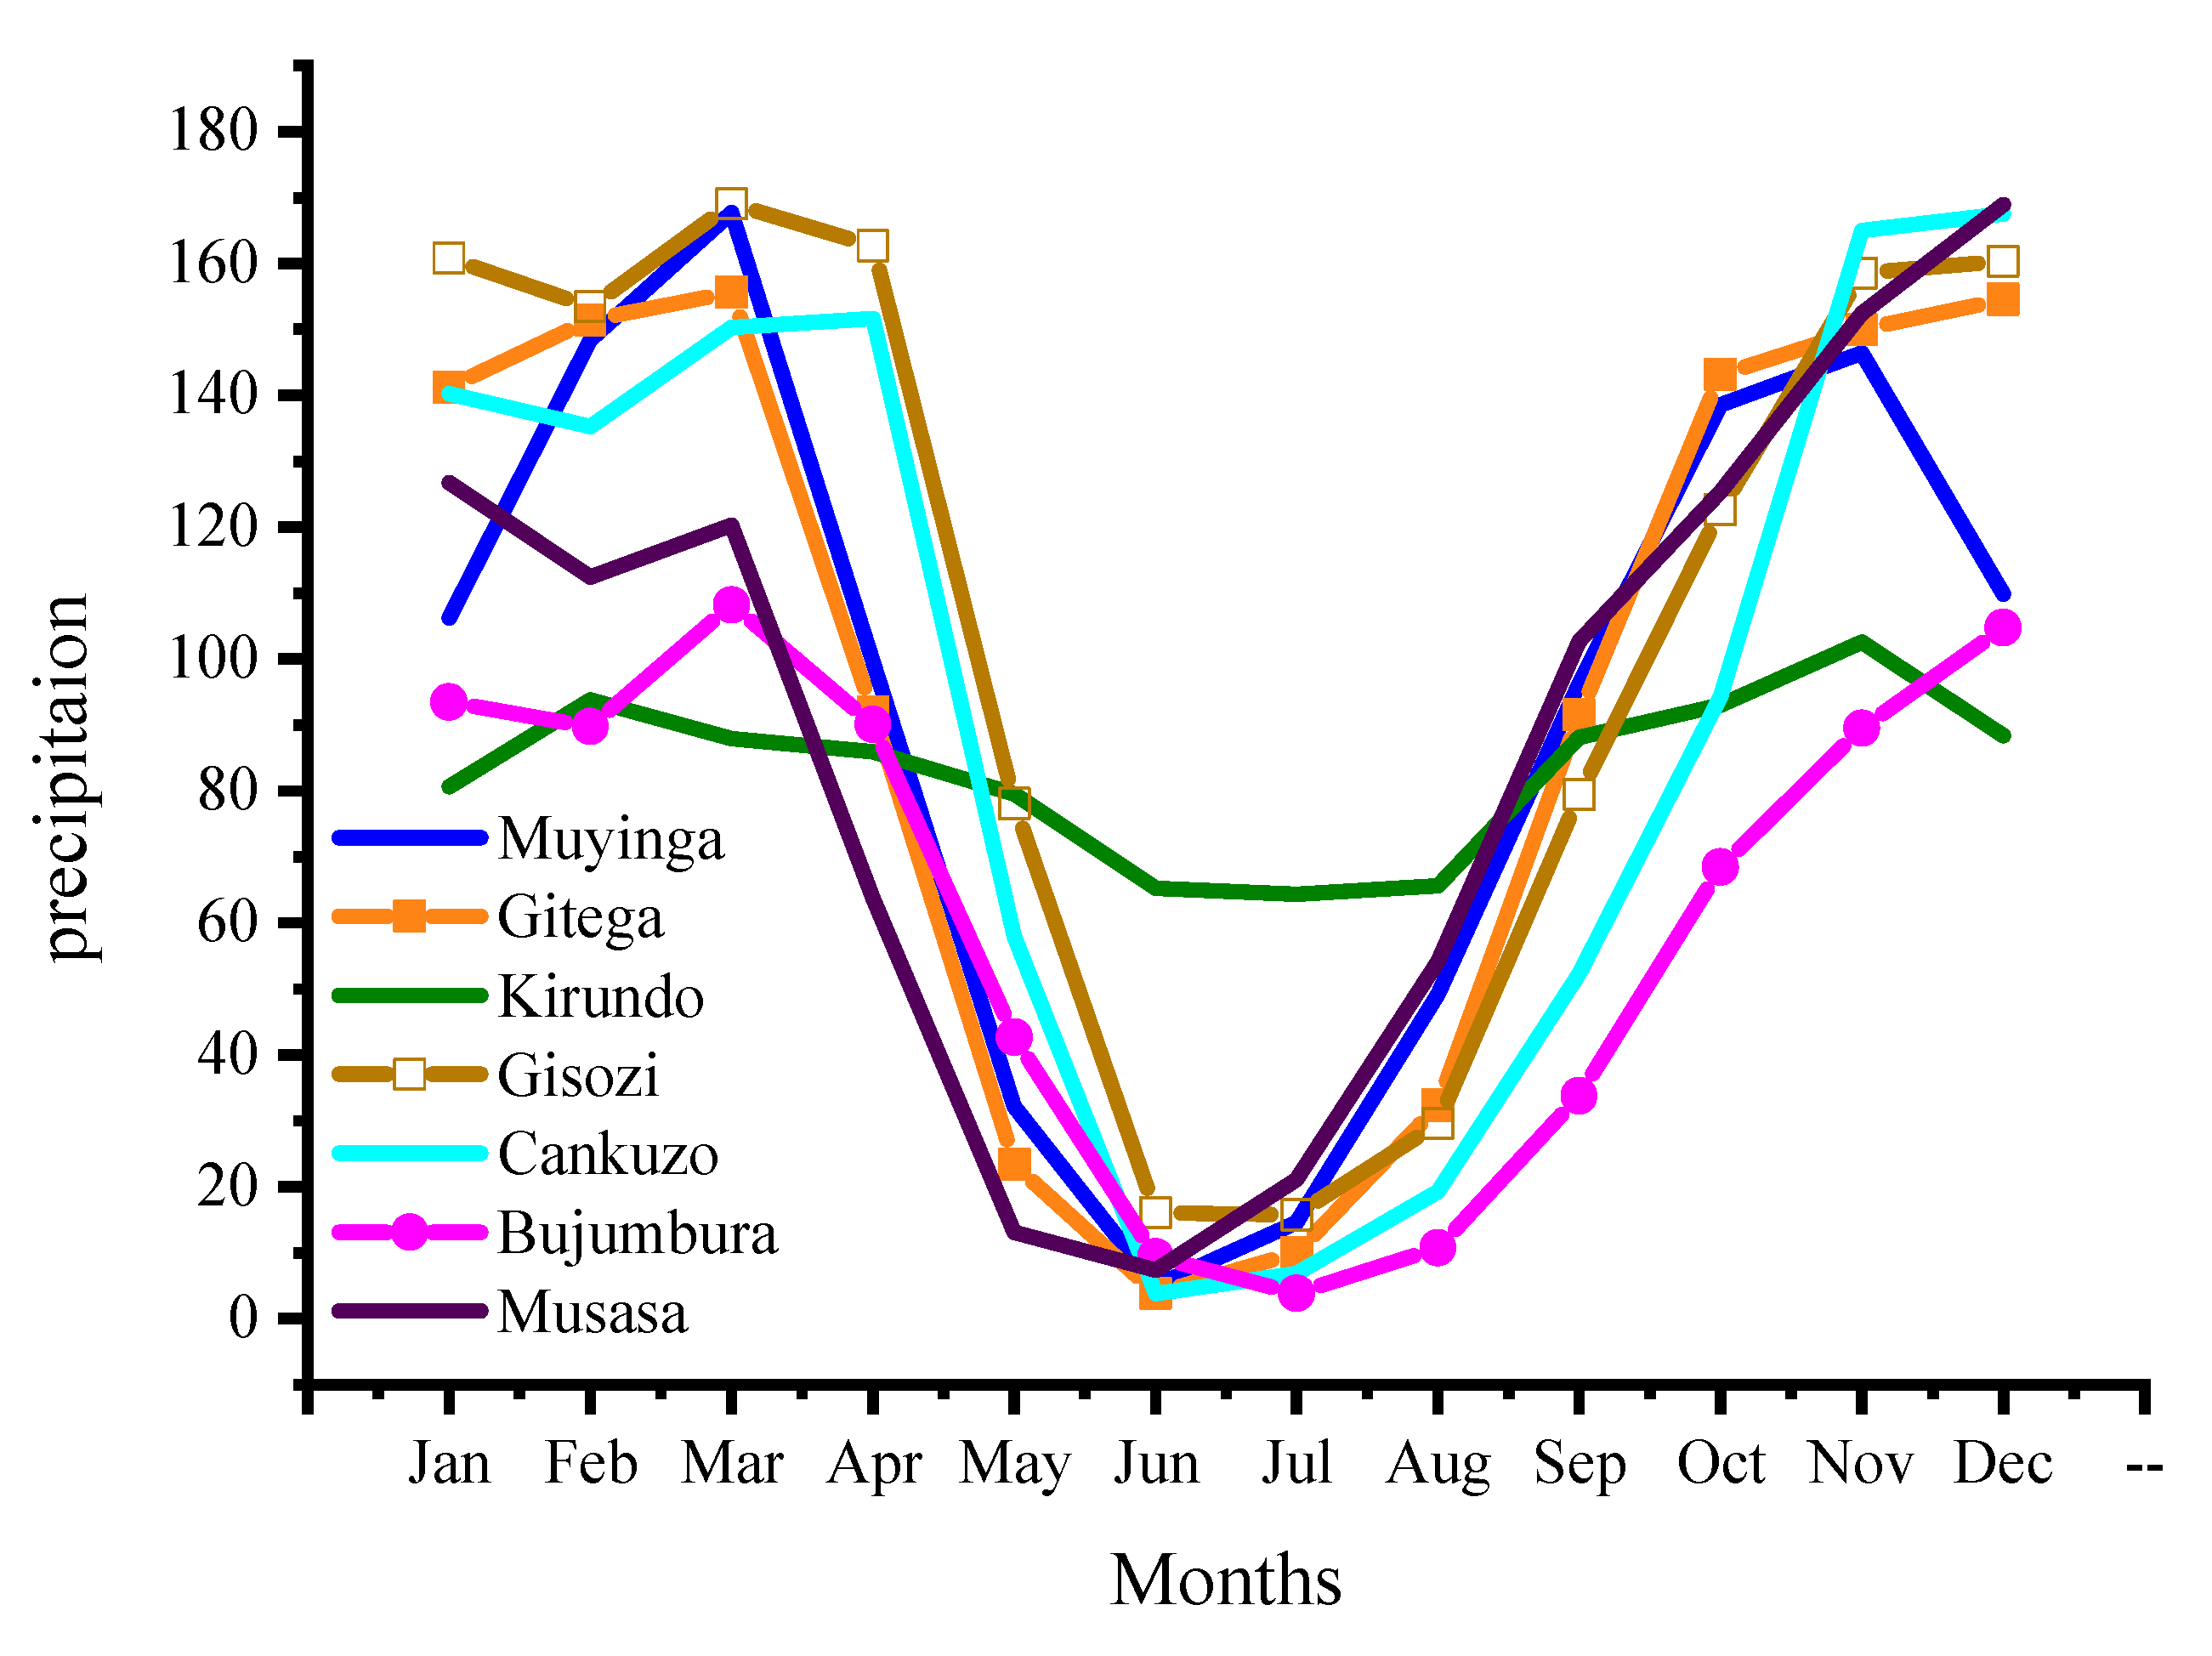
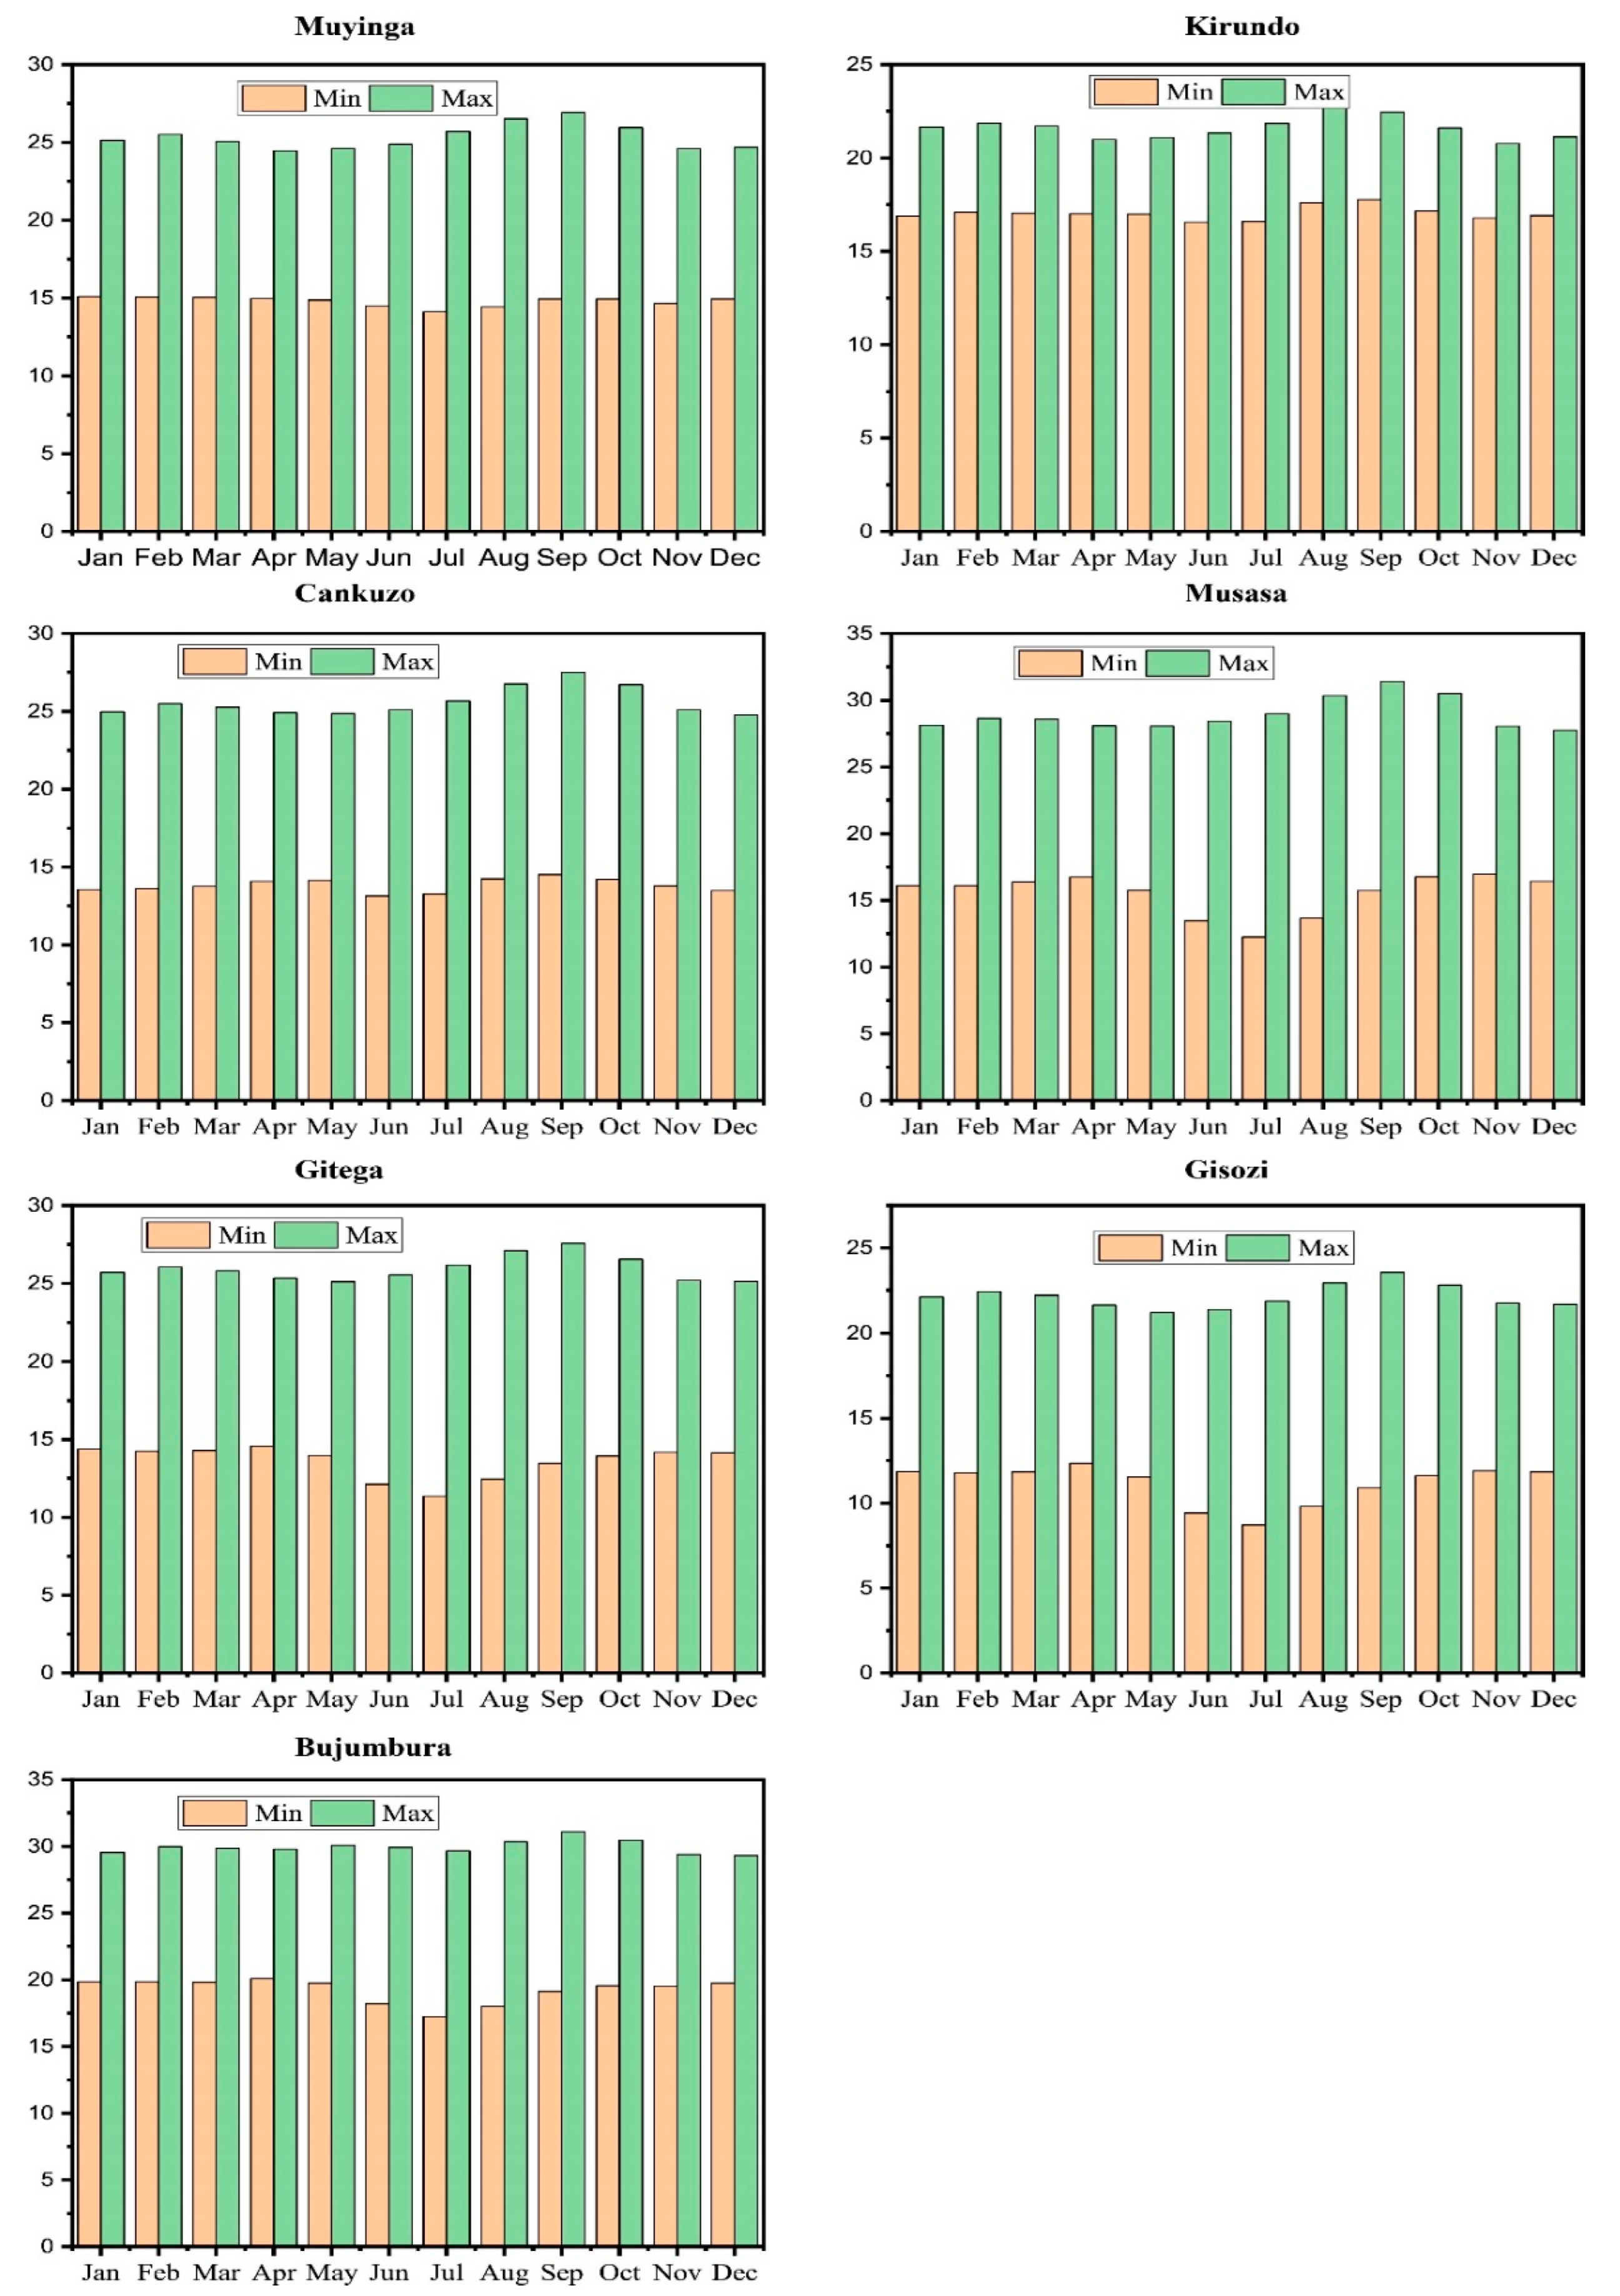
This work utilized meteorological data from Burundi Geographical Institute (IGEBU). Seven meteorology stations (Muyinga, Kirundo, Cankuzo, Musasa, Gitega, Gisozi, and Bujumbura) were purposely selected based on the availability of both temperature and rainfall data that enables the computation of the SPEI index to assess and analyze drought characteristics such as intensity, duration, and severity in this study. Within these seven meteorological stations, no significant missing data could disturb the analysis, and the missing data were filled under the linear mean. It is mentioned that the selected stations all have historical data records of 40 years (1981–2020). Table 1 shows the geographical coordinates of meteorological stations and the data length, and Figure 2 presents the annual mean precipitation (Prcp) in mm and mean temperature (Tmean) in o C. The monthly average precipitation and maximum and minimum mean monthly temperature of the stations utilized in this study are presented in Figure 3 and Figure 4, respectively.
3. Methodology
3.1. Standardized Precipitation Evapotranspiration Index
The SPEI is one of the multi-scalar tools developed by Vicente et al. [19], with the fundamental purpose of characterizing and quantifying drought. Due to its capability to incorporate rainfall and temperature data, it enables the monitoring and analysis of drought duration, severity, and intensity over a period in a particular region. At various timescales, such as 1 month, 3 months, 6 months, 12 months, 24 months, and above, the SPEI helps monitor drought and identify dryness and wetness conditions within historical data.
The Hargraves method, one of the most widely utilized methods in computing the potential evapotranspiration (PET), which requires the monthly average precipitation and both maximum and minimum monthly mean temperature (Tmax and Tmin) as the main factors, was applied in this study. The difference between precipitation and PET is computed as follows:
The application of Equation (1) provides information about water abundance or deficit within the analyzed month (month ).
The generation of the accumulated difference between precipitation P and PET at various time scales is the following:
where represents the cumulated difference between precipitation and PET at the m-month timescale in the q-month of the given n-year; and is the difference between precipitation and PET in the - month of the particular -year.
For the estimation of the SPEI value, the difference between climatic water balance is normalized as a log-logistic probability distribution. The equation expresses the probability density function (PDF) as follows:
where , , and represent scale, shape, and location parameters, respectively. Hence, the (PDF) can be demonstrated as:
The SPEI can be generated based on the equations introduced by Vicente et al.:
In case , and when , , , , , , , [19].
The generated SPEI values were categorized into classes as indicated in Table 2 and were utilized to analyze drought incidents and determine their characteristics in Burundi. The number of months in which SPEI values were consecutively at or below one (≤1) was recorded as drought incidents and determines the duration of the incident in this study. The severity is a cumulative summation of the index values across the length of the incident. The intensity of an incident is obtained by dividing its severity by the number of drought months of that incident.
The severity and intensity were generated based on the following equations:
3.2. Mann–Kendall (MK) and Sen’s Slope Estimator
3.2.1. Mann–Kendall Test
The MK test is a non-parametric statistical test widely used in hydrological and climatological studies to identify trends in time series. The trend analysis method that had been recommended by the World Meteorological Organization (WMO) has been applied in several studies that characterized drought and assessed climate variability all over the world [44,45]. In this research, the MK statistical test was employed to indicate an increasing or decreasing trend in the SPEI time series for the study period in all stations.
3.2.2. Sen’s Slope Estimator Test
Sen’s estimator [46] estimates the magnitude of the trend within SPEI values. In the case of a linear trend in a time series, the exact Sen’s slope is computed using the Theil–Sen slope, which is the alternative to linear regression and is used in conjunction with the MK test [46,47]. Sen’s slope of all data sample pairs is given as follows:
where , and and are data values at time and , respectively (). The values’ median of is represented as Sen’s slope estimator test, estimated at a confidence interval of 95%, which is demonstrated as follows:
The is calculated by a two-sided test at the confidence interval of 95% and the real slope can be obtained by no parametric test. A negative value of demonstrates a decreasing trend and a positive value of indicates an increasing trend in the time series.
4. Results and Discussion
4.1. Assessment of Drought Characteristics on Annual and Seasonal Scales with SPEI Time Series
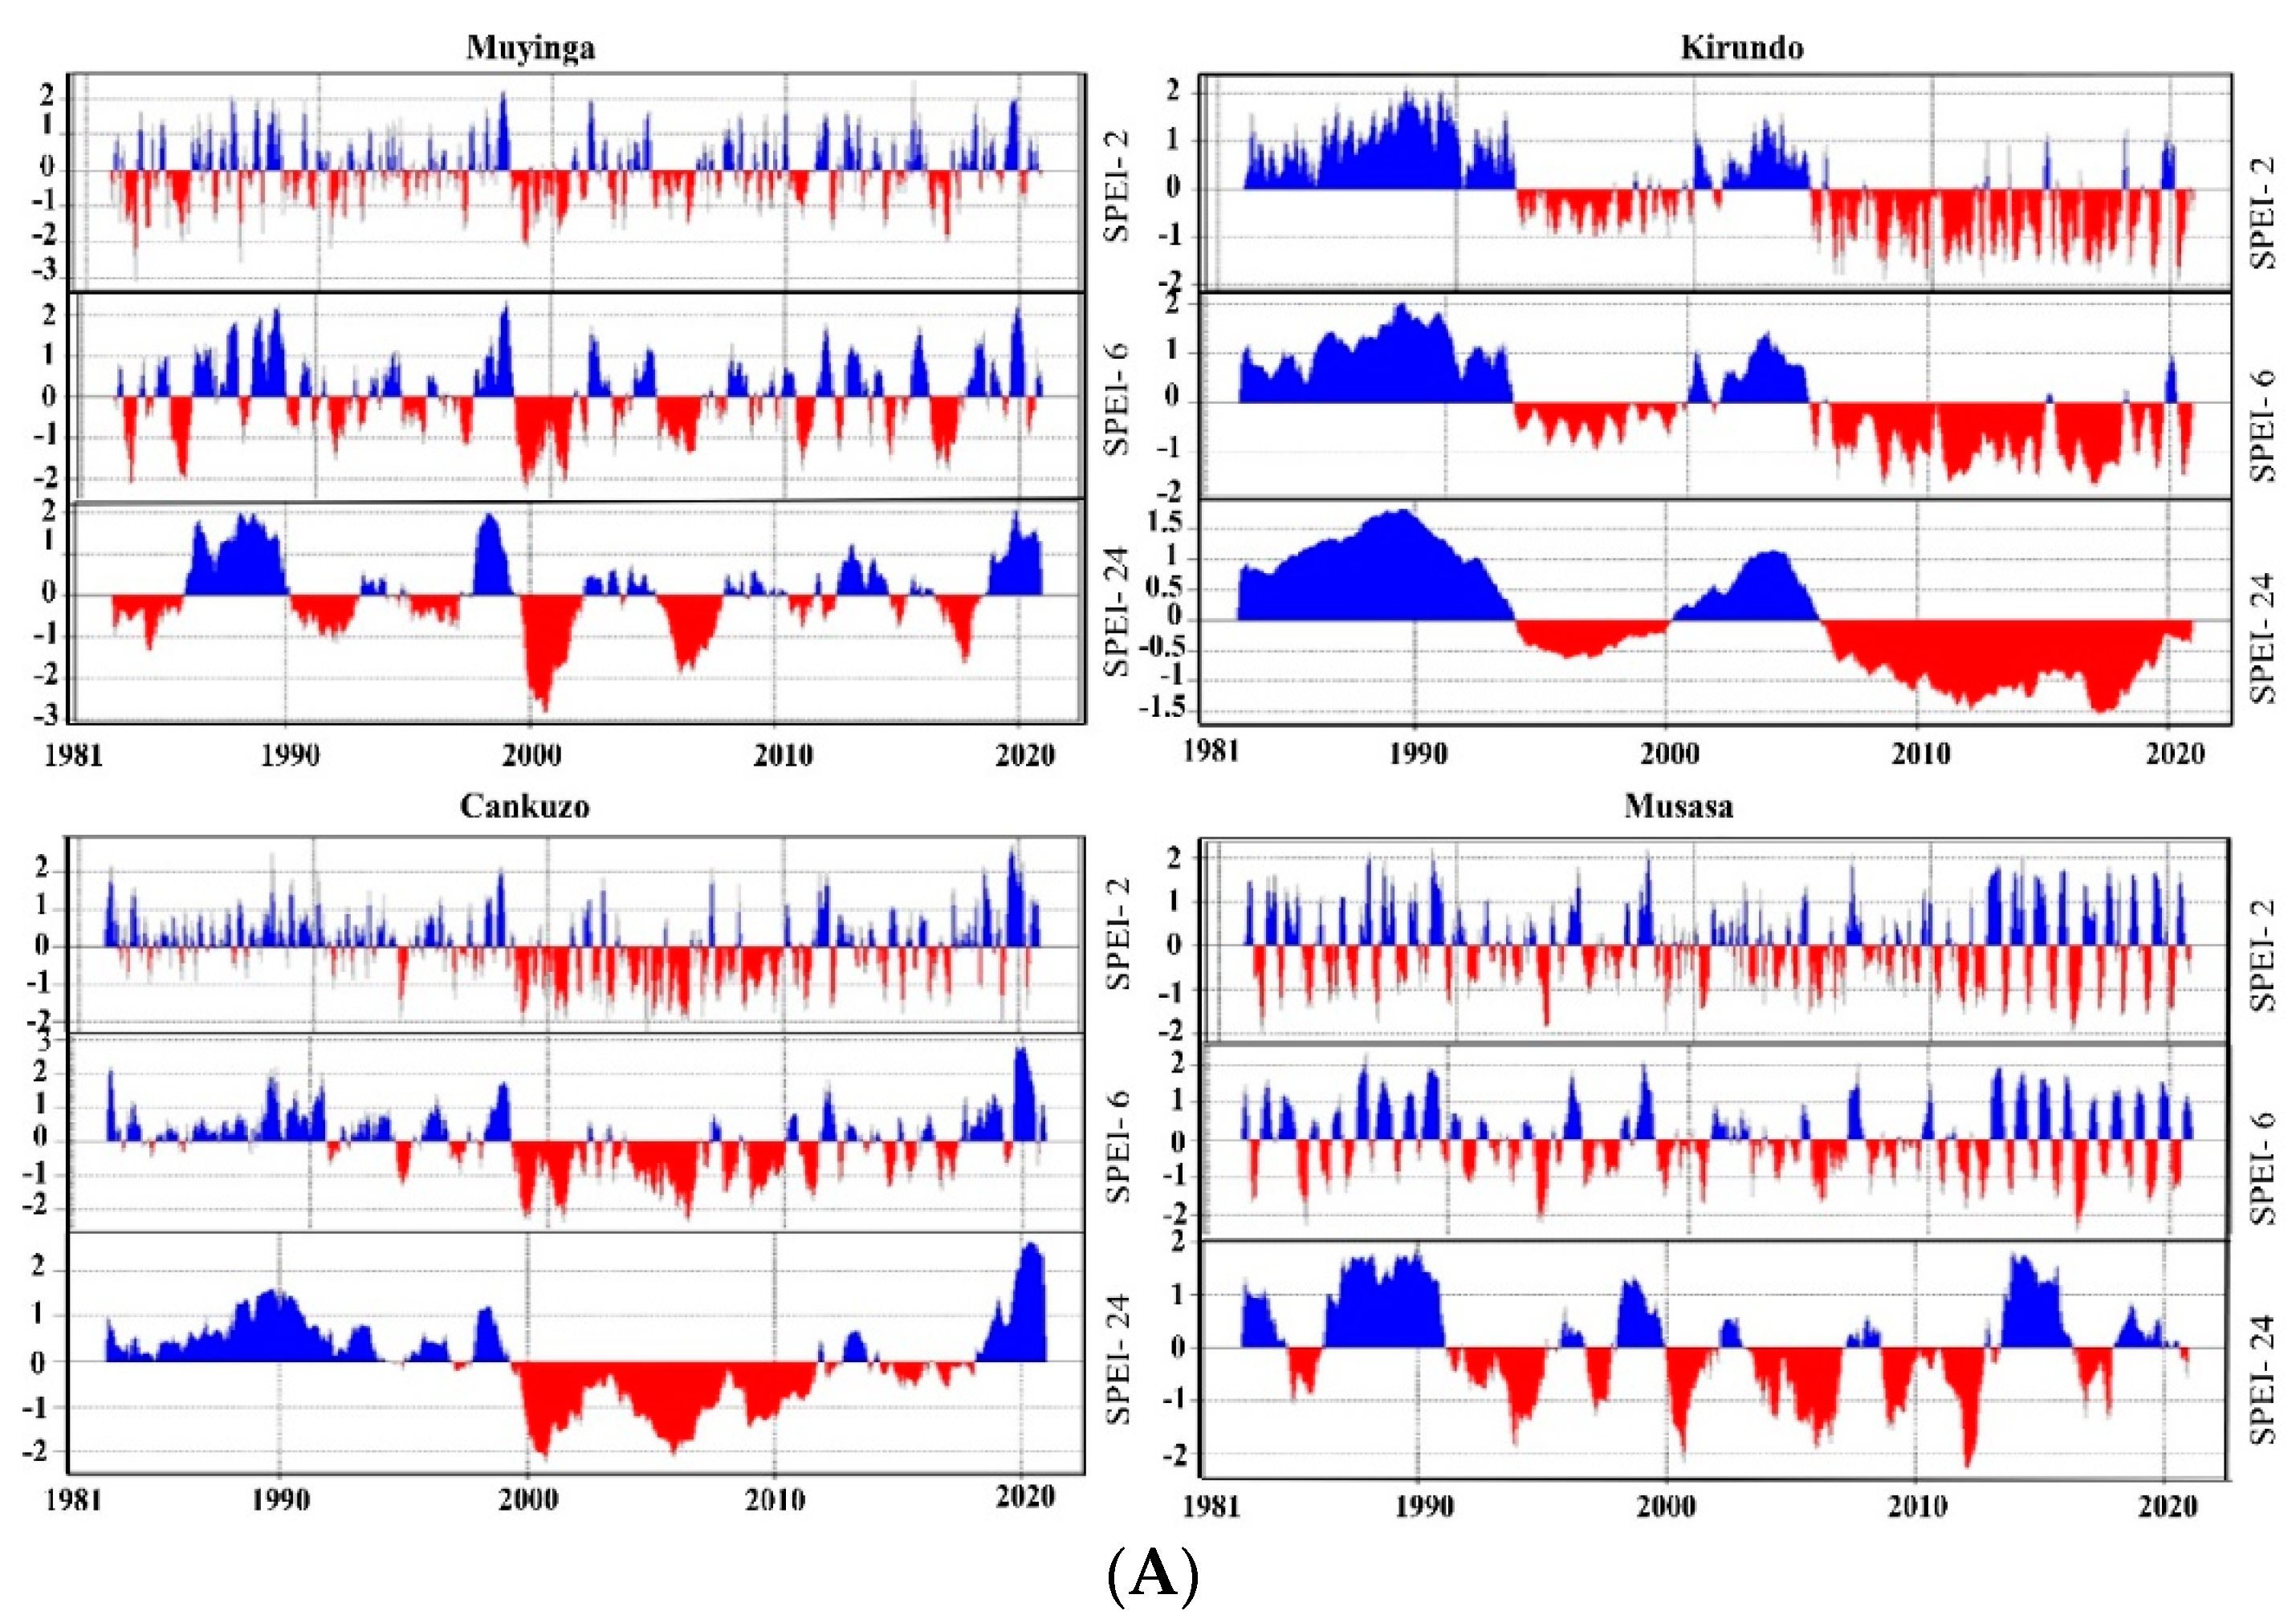
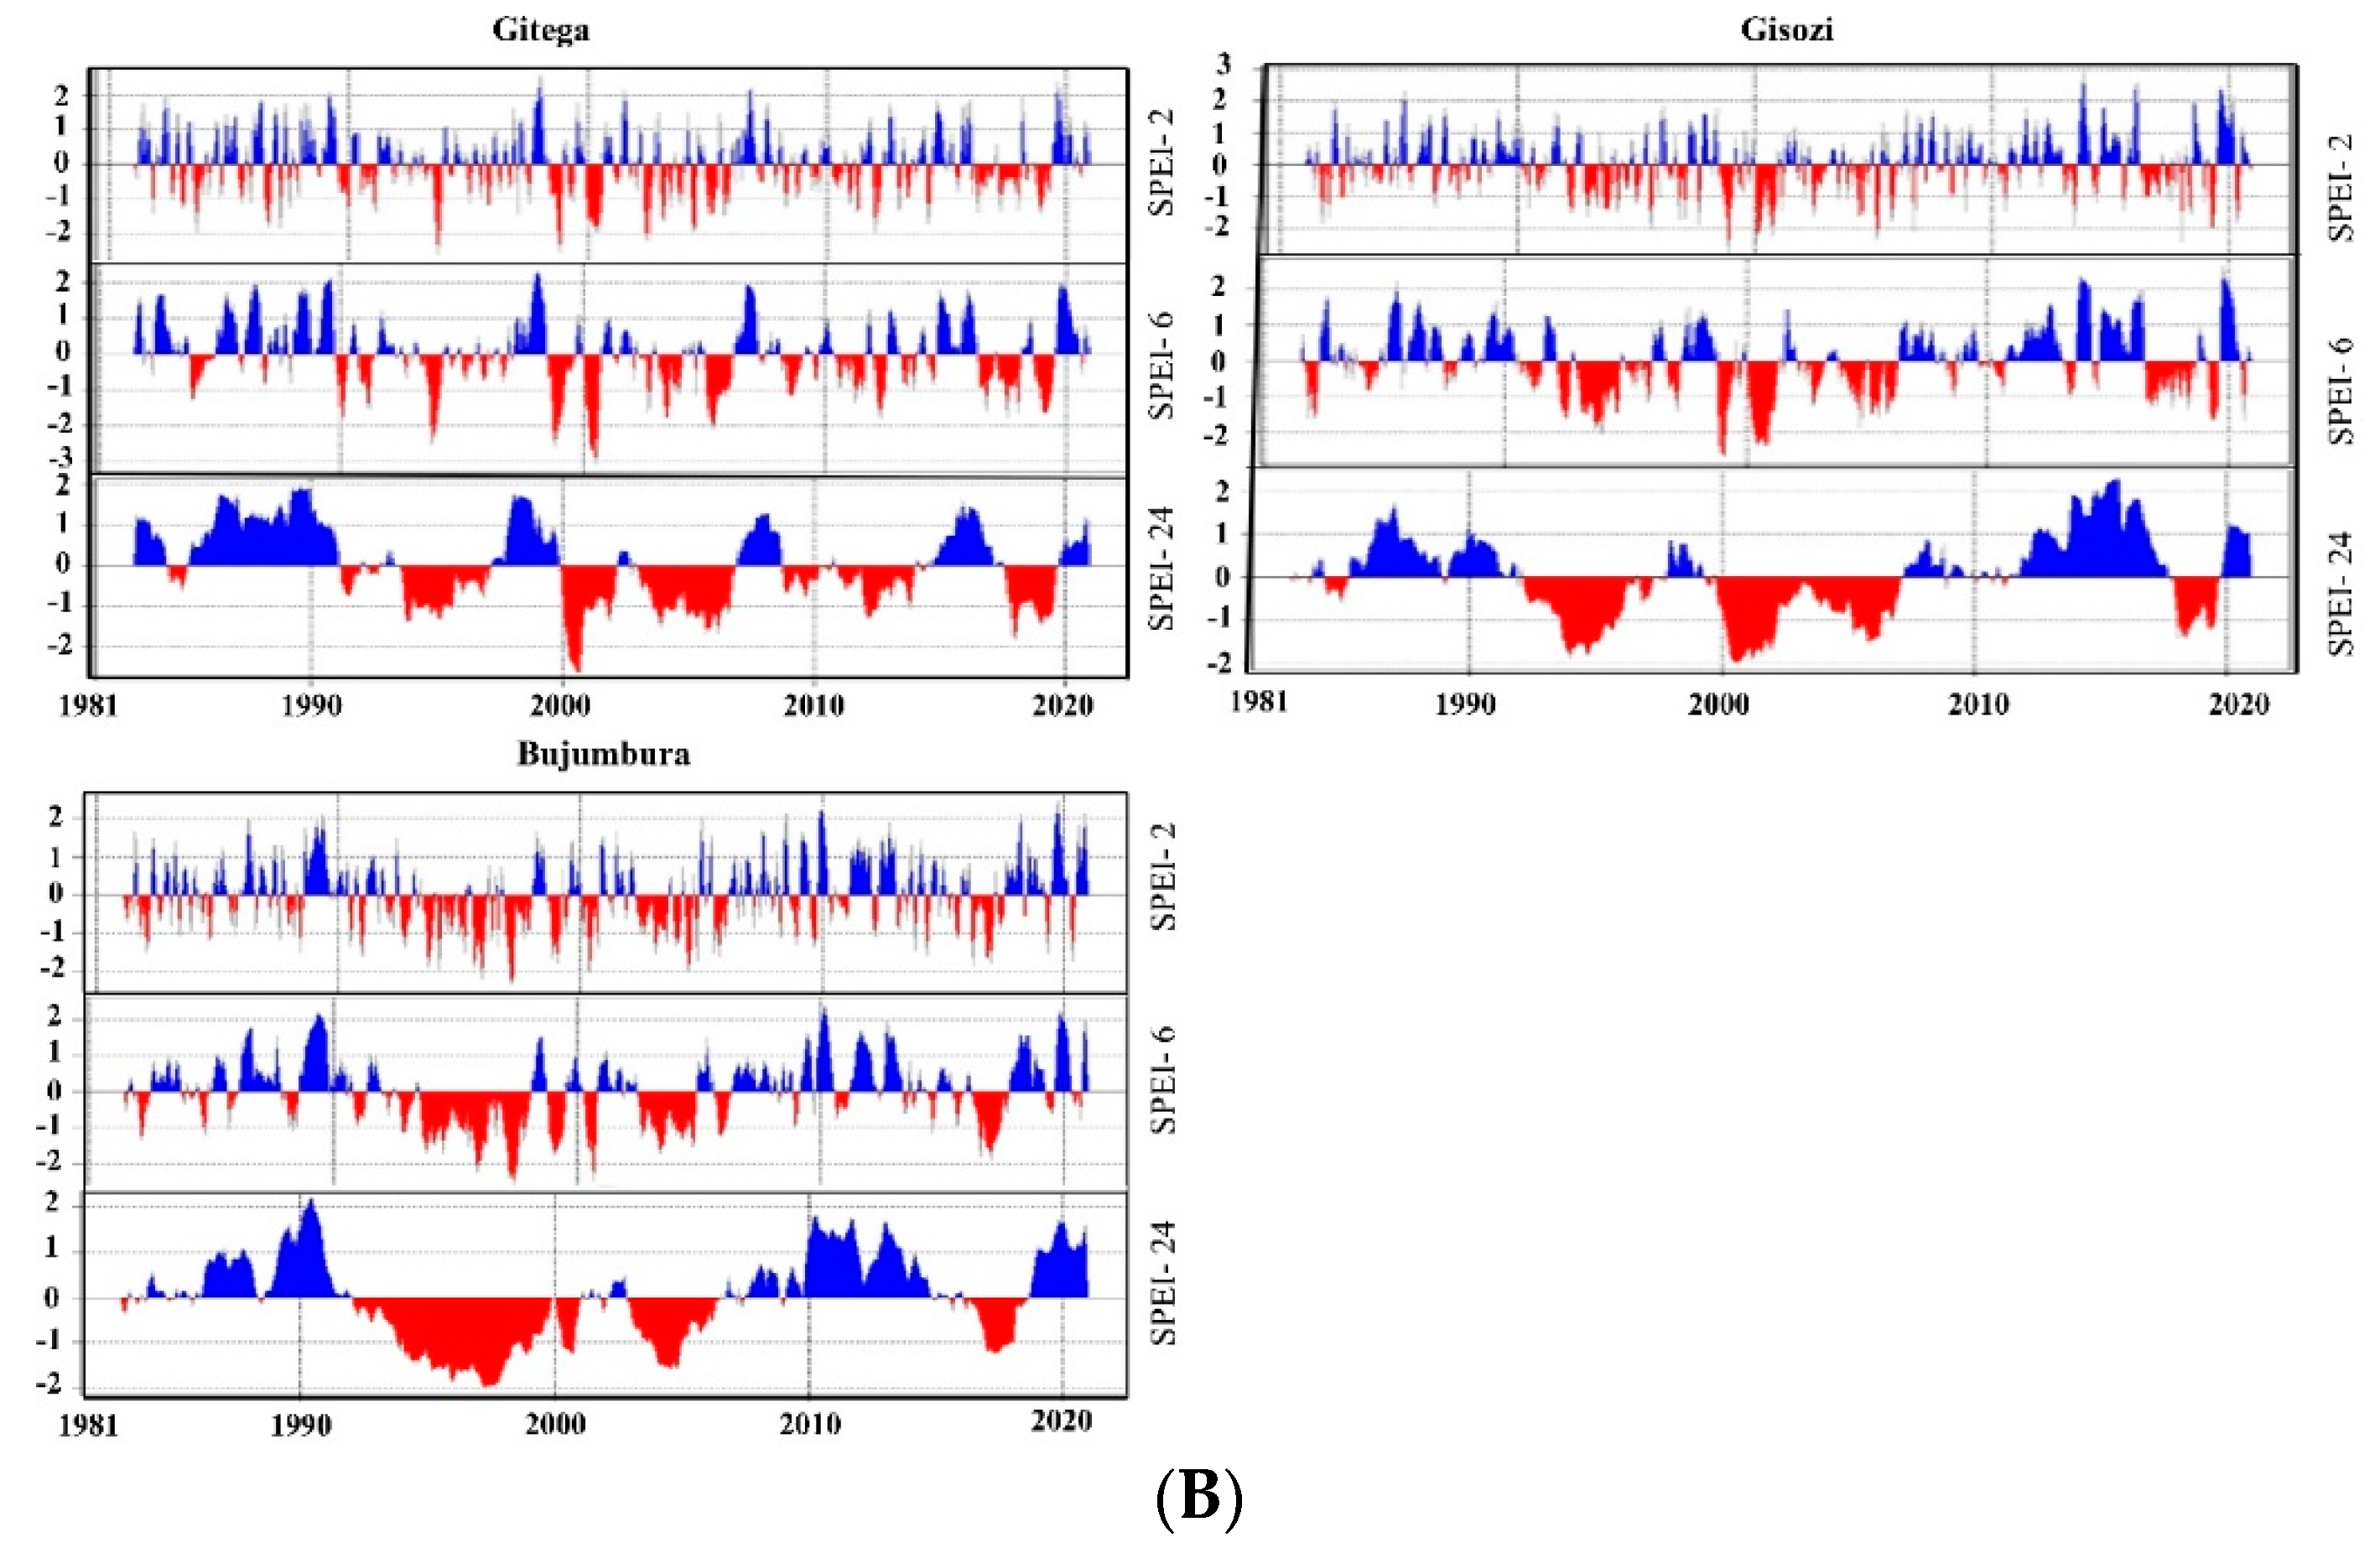
In this paper, the assessment of annual and seasonal analysis of drought characteristics was done by using the SPEI index at various timescales. The SPEI index delivered from seven meteorological stations revealed the occurrence of agricultural and hydrological drought incidents throughout the study period. The analysis of SPEI-2, -6 and -24 results across Burundi illustrated that severe dryness conditions began in the 1990 decade (Figure 5A,B). Since most of the cultivated crops in Burundi need two to six months to develop, the SPEI-2 and SPEI-6 results make it possible to clearly detect drought events that threatened Burundi and caused a reduction in agricultural production and the loss of livestock, especially in the northern and eastern parts of Burundi, where about 90% of the population lives in rural areas involved in agropastoral works to earn sustenance. With SPEI-24, it can be recognized that Burundi had been stricken by hydrological drought, and the years 1993, 1995, 1996, 1998–2001, 2004, 2005, 2006, 2009, and 2016 were recorded as dry periods. The drought events that occurred during the 2001–2010 decade resulted in groundwater reduction and depletion of lakes and rivers. This hydrological scarcity affected the hydropower stations across Burundi, especially the hydropower stations of Rwegura and Kavuruga located in the northern part of Burundi. As result, Burundi’s economy collapsed and joblessness spread because most activities requiring electricity were paralyzed.
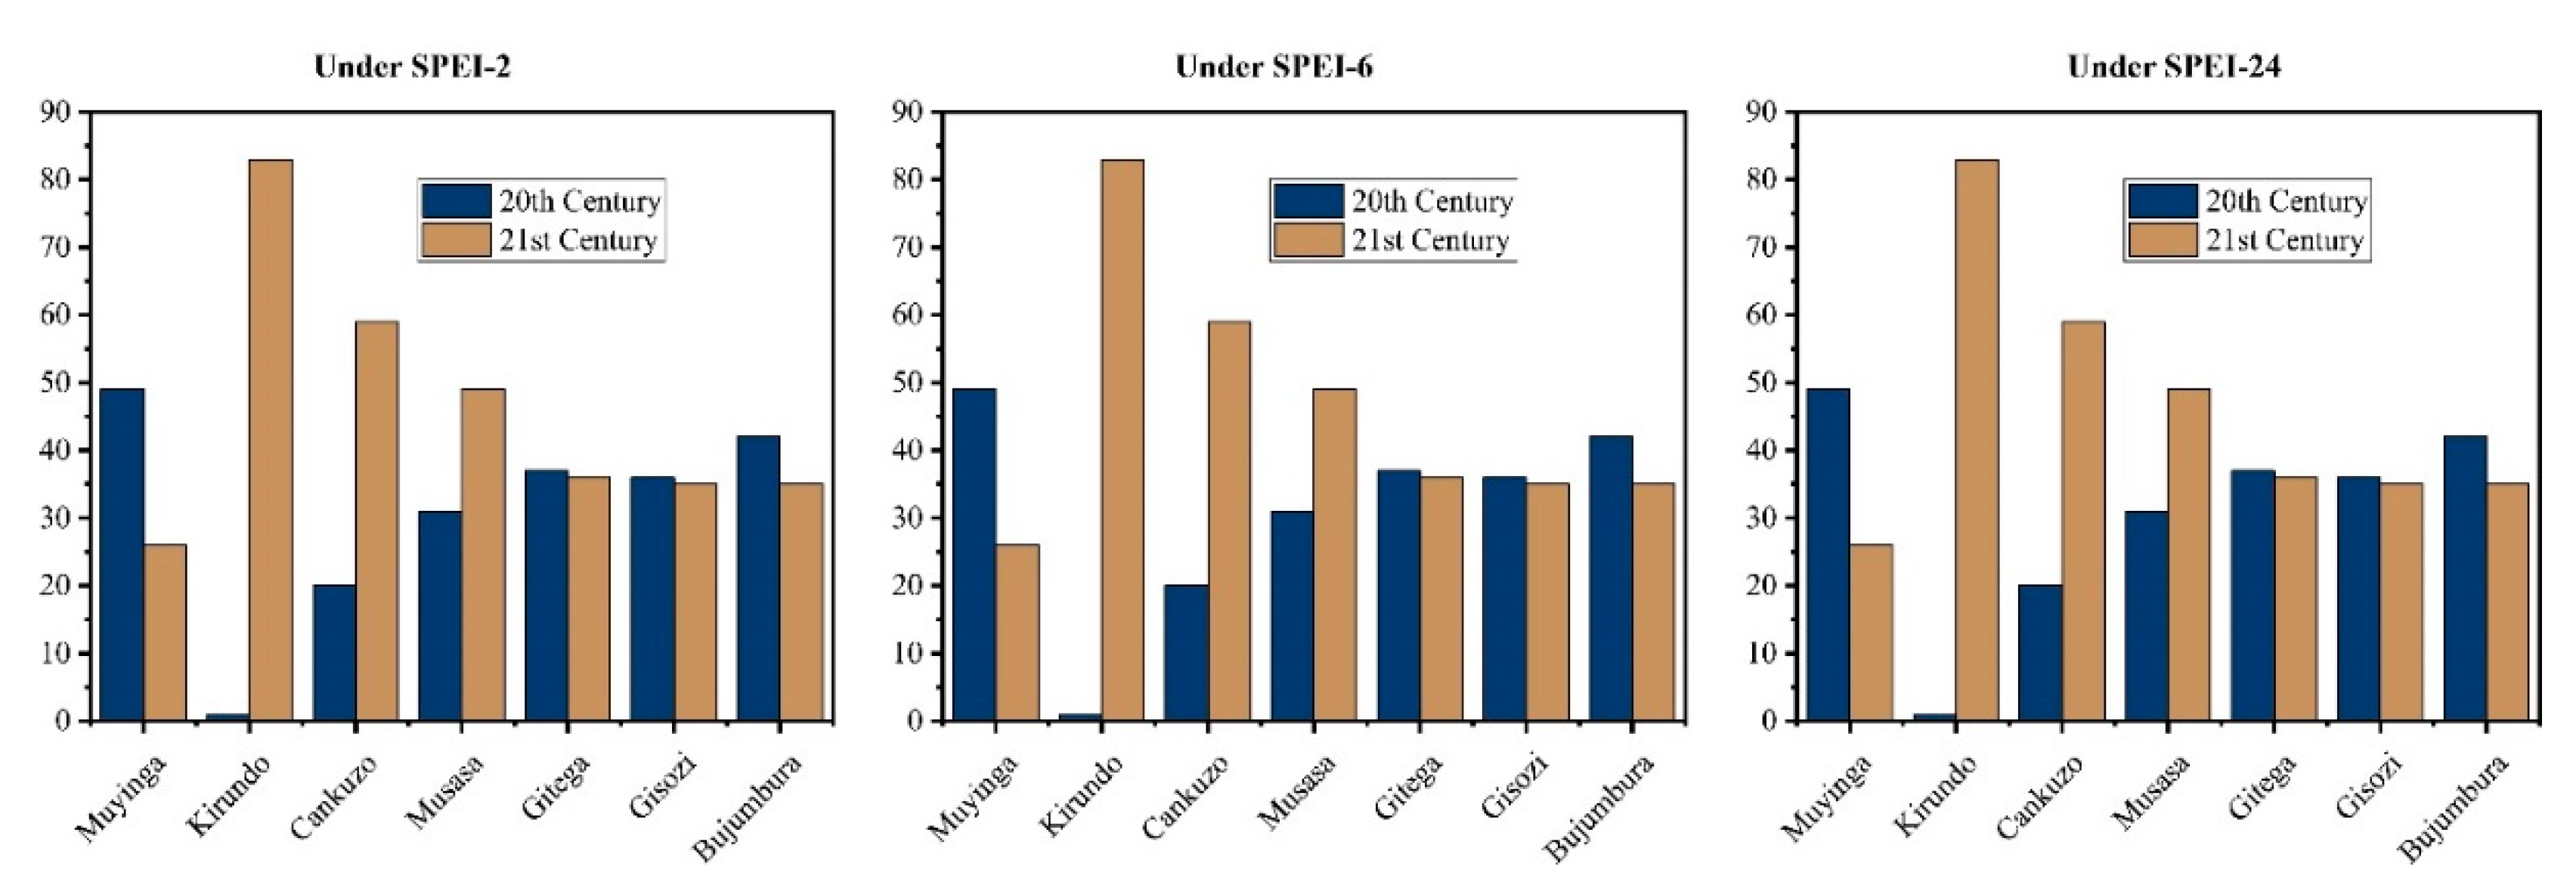
Figure 6 shows the frequency of drought during the last two decades of the 20th century and during the first two decades of the 21st century in Burundi, which is highly vulnerable to climate change-related events such as droughts, floods, landslides, and soil erosion [48]. It can be clearly seen from the stations of Kirundo, Cankuzo, Musasa, and Gitega that droughts have been intensifying since the beginning of the 21st century relative to before based on SPEI-2, -6, and -24 month timescale values and in the stations of Muyinga and Gisozi based on the SPEI-24 month timescale values. On the other hand, in the station of Bujumbura, SPEI-2, -6, and -24 month timescales values demonstrated that droughts have frequently occurred during the last two decades of the 20th century. Therefore, during the first two decades of the 21st century climate change resulted in more drought events in the northern, eastern, southeastern, and central parts of Burundi and in more flood intensity in the western part.
Drought Frequency of Seasonal SPEI Historical Values
In the region where rainfed agriculture is the main source of food, it is vital to assess seasonal drought frequencies. As Figure 5A,B shows, the SPEI values demonstrated that drought frequently occurred in Burundi during all seasons and more drought events were detected during the short rain season, which runs from September to December as shown in Figure 7. The drought incidents that occurred during the two rainy seasons had a greater impact on the agricultural production since these two are the main growing seasons in Burundi. As a result, there were food shortage and losses of life and socio-economic activities. For instance, according to the Food Security and Nutrition Working Group (FSNGW), in 2010, nearly 178,550 people required humanitarian emergency aid in the northern and eastern parts of Burundi and reported that in Burundi approximately 100,000 people are victims of drought catastrophes every year [49].
4.2. Drought Characteristics Analysis
This study characterized and analyzed drought duration, severity and intensity by utilizing SPEI values generated at 2-, 6- and 24-month timescales in seven meteorological stations across Burundi. The SPEI-2 and -6 month data were used to characterize and quantify drought incidents that impacted the rain feed agriculture due to the precipitation deficit during the two major rainy seasons over the study domain. The results indicate that all categories of drought had frequently occurred, and that the extremely dry month of July 2000 was detected under SPEI-6 with a negative peak of −3.05 in Gitega station. Additionally, February 1999 was an extremely dry month detected under SPEI-6 with a negative peak of −2.66 in Gisozi station, all in the center of Burundi. However, under SPEI-24 in Muyinga, the year 2000 was extreme dry year, with all months from January to December characterized by a negative peak of less than −2, and the longest drought incident was registered under SPEI-24 in Bujumbura station in the western part of Burundi, which stayed from February 1994 to February 1999. These findings highlight that hydrological drought resulted in rivers and dams depleting, especially in the northern and eastern parts of Burundi. Table 3 indicates that drought duration, severity, and intensity had augmented since 1993.
4.3. Trend Analysis of Annual Drought with SPEI Time Series
The Mann–Kendall test and Sen’s slope estimator were employed to detect trends of SPEI values at 2, 6, and 24 months in Burundi. The trend analysis was done on annual time scales to recognize the regions characterized by decreasing or increasing trends. The results of MK trend analysis given in Table 4 reveal that regions with a significant increasing trend were prone to drought and have been hit by recurrent drought incidents. In almost all regions considered in this study, SPEI values on a 24-month timescale indicate that hydrological drought had more severely occurred, especially in Kirundo and Cankuzo in the northern and eastern parts of Burundi, respectively. These findings have a correspondence with those of a previous study conducted by Nkunzimana et al. [50] to assess drought events and their trend across Burundi using the SPI index.
4.4. The Analysis of Drought Characteristics and Their Categories
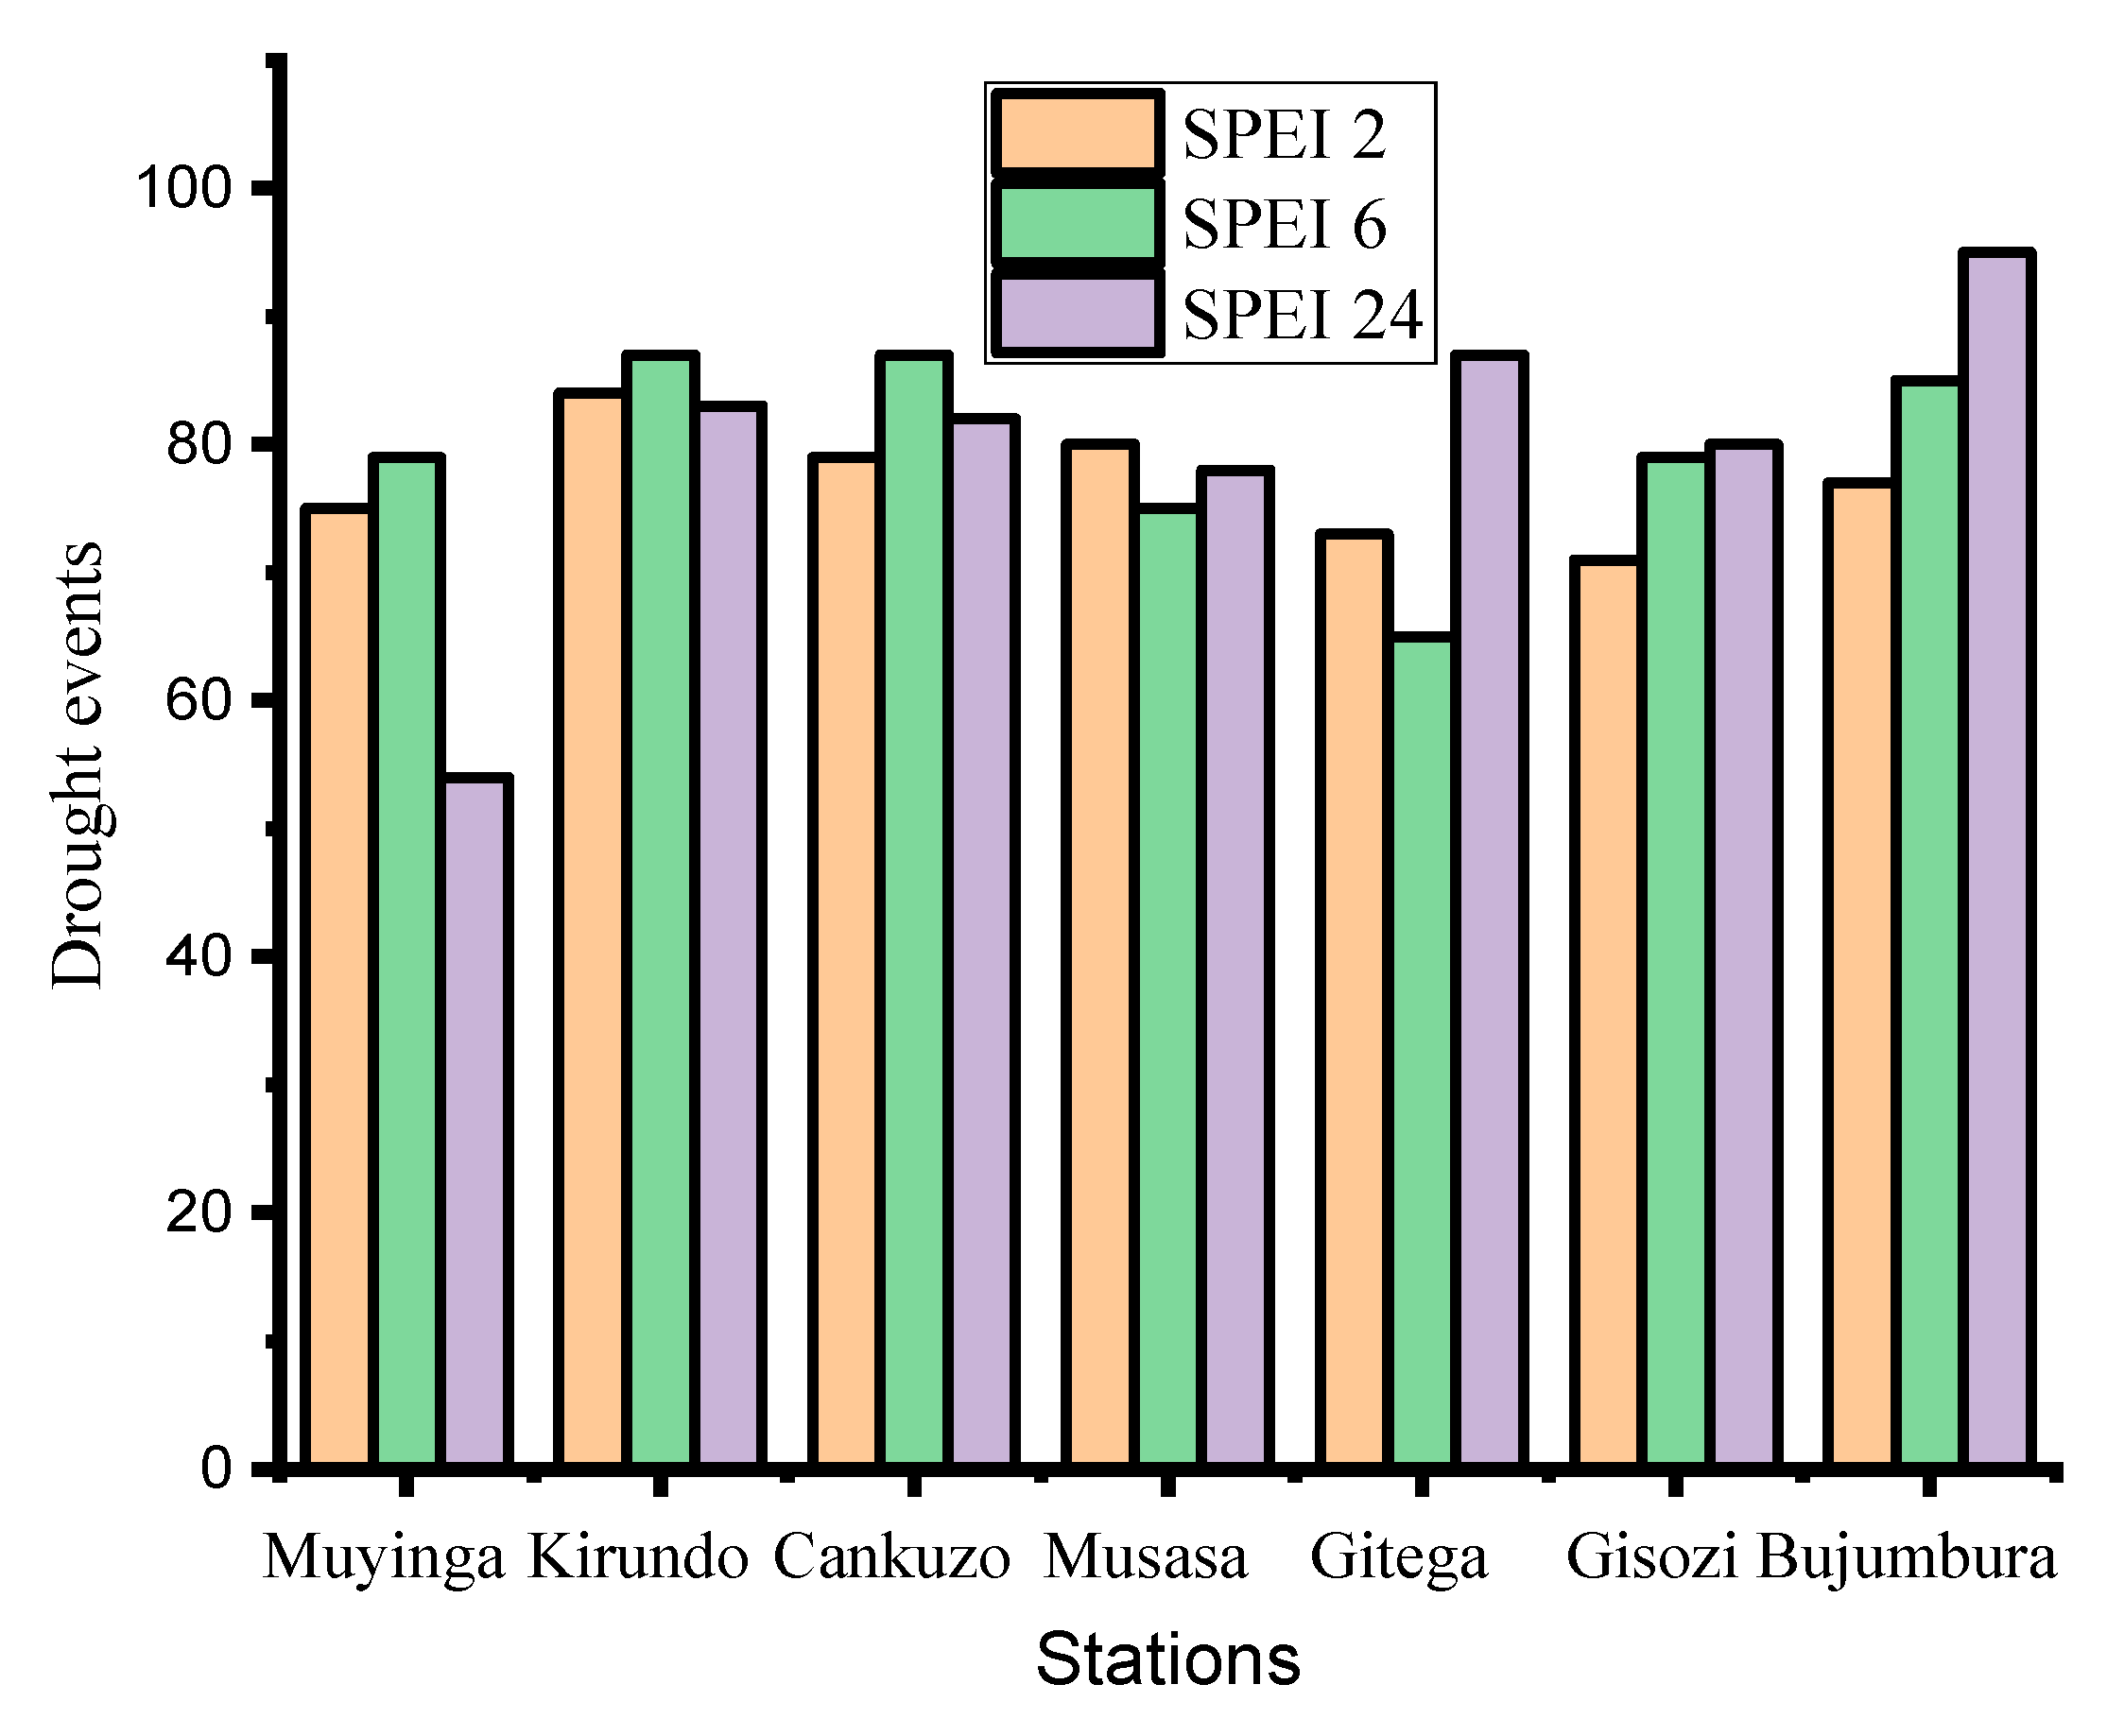
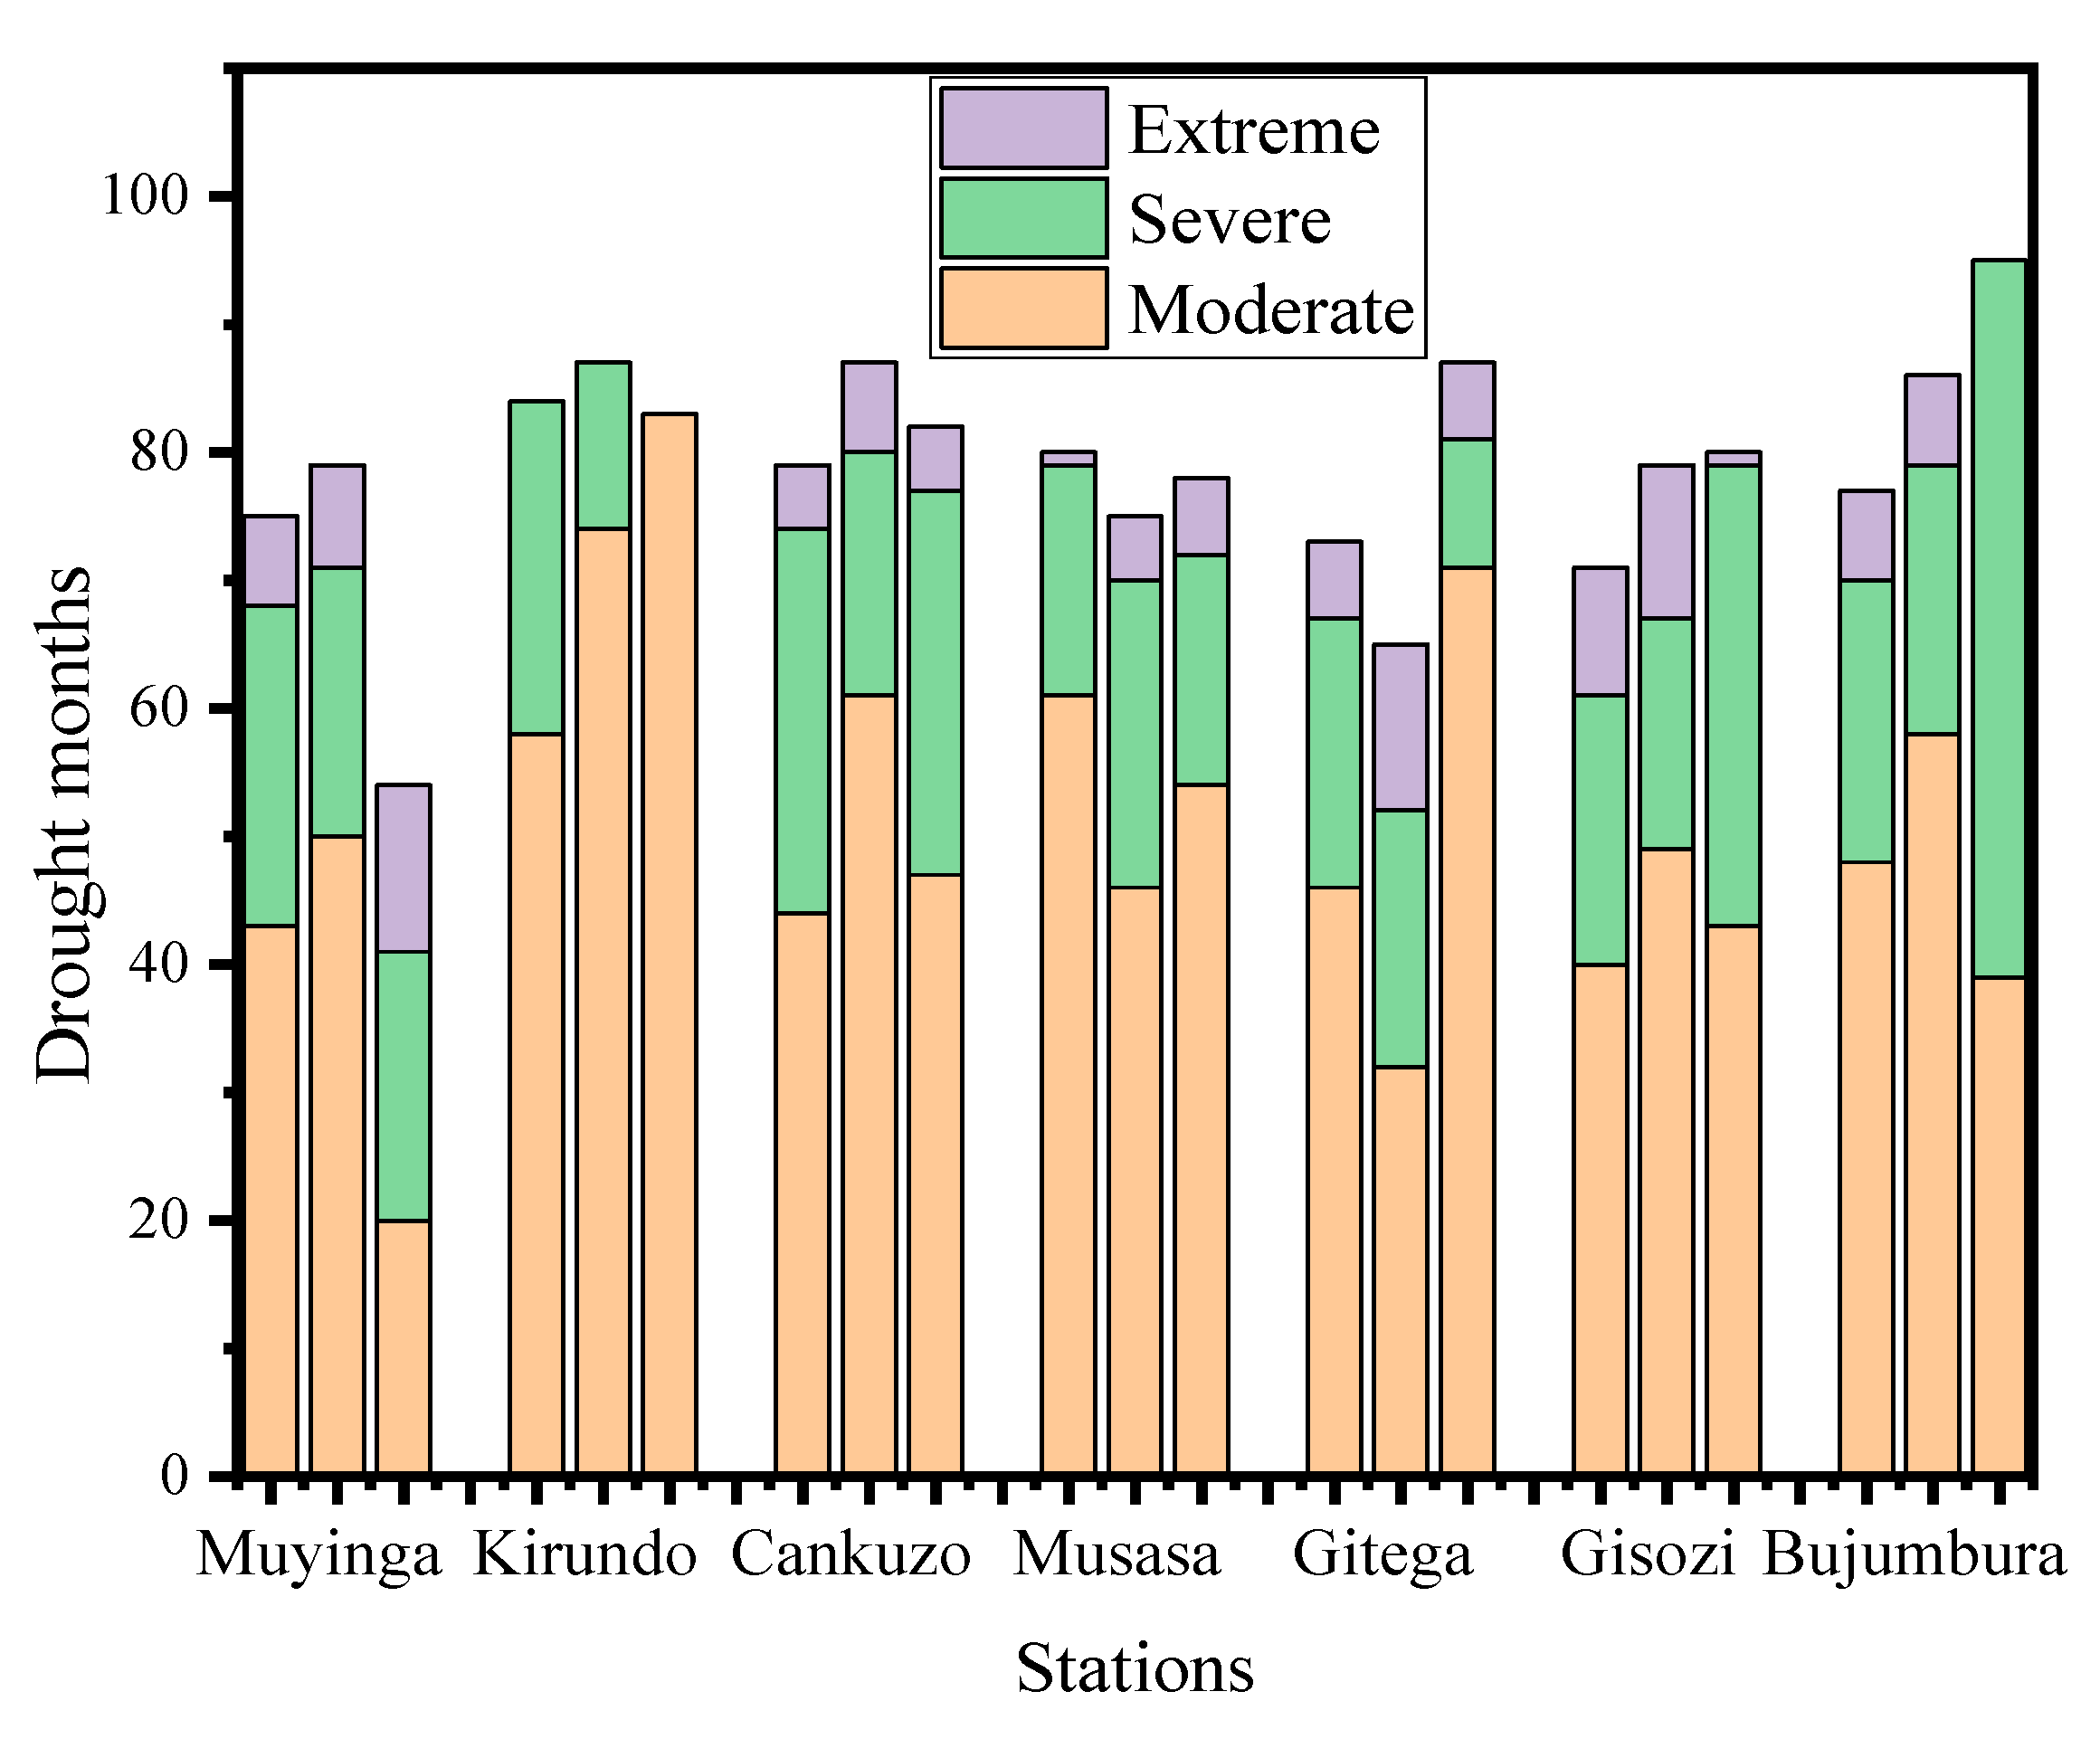
Drought properties such as duration, severity, and intensity were analyzed using the SPEI index at different timescales in this work. The SPEI values were generated for seven meteorological stations across Burundi from January 1981 to December 2020 for all stations considered in this study at 2-, 6- and 24-month timescales to monitor droughts and investigate their characteristics, whereby 2- and 6- represent agricultural drought based on the fact that most of the cultivated plants require 2 to 6 months to fully develop and 24- represents hydrological drought. The number of drought incidents in Burundi was quantified during the study period in this work. In Muyinga, Kirundo, and Cankuzo stations, SPEI-6 detected a greater number of drought events compared to SPEI-2 and SPEI-24. Besides this, the drought months identified in the station of Kirundo were all classified in moderate and severe categories for all timescales, where SPEI-2 and SPEI-6 captured 84 and 87 drought incidents, respectively, and SPEI-24 detected 83 drought incidents, all in the moderate category. On the other hand, in the stations of Gitega, Gisozi, and Bujumbura, the result revealed that SPEI-24 detected more drought incidents than SPEI-2 and SPEI-6.
Figure 8 shows the quantified drought months, and Figure 9 illustrates the categories of the detected drought incidents. The results demonstrate that in most stations, at SPEI-2, -6, and -24 month timescales, the detected drought incidents were more in moderate and severe conditions, while the extreme dry incidents detected were fewer during the study period. In the station of Bujumbura at the SPEI-24 month timescale and the station of Kirundo at the SPEI-2, SPEI-6, and SPEI-24 month timescales, no extremely dry incident had been registered.
5. Conclusions
The characteristics of drought are indispensable in determining the severeness of drought in a particular region. During the last four decades, Burundi has been facing the recurrence of drought incidents, especially from 1990 to 2010. The assessment and the analysis of drought characteristics such as duration, severity, and intensity was conducted with the use of the SPEI index at various timescales with an indication of 2- and 6-month timescales for agricultural drought and 24 months for hydrological drought, and seven meteorological stations distributed across Burundi were utilized in this study. Additionally, the Mann–Kendall (MK) trends test combined with Sen’s slope Estimator was employed to detect trends of SPEI values. The results of the MK test illustrated that the frequency of moderate, severe, and extreme drought incidents had increased during the study period, especially in Kirundo, Cankuzo, and Gitega stations in the northern, eastern, and central parts of Burundi, respectively. The SPEI index is a typical drought index that has the ability to incorporate both precipitation and evapotranspiration, which are indispensable factors for the estimation of crop development and evaluating water surplus or shortage. Despite the ability of the SPEI index in the assessment of drought incident, it has not been applied to study drought in Burundi. Therefore, SPEI was calculated at 2-, 6-, and 24-month timescales in order to detect historical drought incidents and indicate their characteristics. The results demonstrate that all classes of drought had threatened Burundi, and the years 1993, 1994, 1995, 1999, 2000, 2001, 2004, 2005, 2006, 2009, and 2016 were recorded as dry years in Burundi. Proactive drought mitigation activities, climate change mitigation, and water resources management policy are highly recommended to reduce drought risk and its effect on both the population and the natural environment.
Author Contributions
J.M.N.: Conceptualization, methodology, software, validation, formal analysis, investigation, resources, data curation, writing—original draft preparation, writing—review and editing, visualization; F.L.: supervision, project administration, funding acquisition. All authors have read and agreed to the published version of the manuscript.
Funding
This work was supported by the China Postdoctoral Science Foundation (No. 2019M651976).
Institutional Review Board Statement
Not applicable.
Informed Consent Statement
Not applicable.
Data Availability Statement
Data are available upon reasonable request from authors.
Acknowledgments
The authors would like to express their sincere thanks to the China Postdoctoral Science Foundation (No. 2019M651976) and Yangzhou University (YZU) for the provision of a good learning environment and making available all materials needed for this study. Special appreciation goes to IGEBU that provided the data used in this work.
Conflicts of Interest
The authors declare no conflict of interest.
References
- Crausbay, S.D.; Ramirez, A.R.; Carter, S.L.; Cross, M.S.; Hall, K.R.; Bathke, D.J.; Betancourt, J.L.; Colt, S.; Cravens, A.E.; Dalton, M.S.; et al. Defining Ecological Drought for the Twenty-First Century. Bull. Am. Meteorol. Soc. 2017, 98, 2543–2550. [Google Scholar] [CrossRef]
- Fagariba, C.J.; Song, S.; Soule, S.K.G. Livelihood Economic Activities Causing Deforestation in Northern Ghana: Evidence of Sissala West District. Open J. Ecol. 2018, 08, 57–74. [Google Scholar] [CrossRef]
- Guo, W.; Guo, M.; Tan, Y.; Bai, E.; Zhao, G. Sustainable Development of Resources and the Environment: Mining-Induced Eco-Geological Environmental Damage and Mitigation Measures-a Case Study in the Henan Coal Mining Area, China. Sustainability 2019, 11, 4366. [Google Scholar] [CrossRef]
- Shen, Z.; Zhang, Q.; Chen, D.; Singh, V.P. Varying Effects of Mining Development on Ecological Conditions and Groundwater Storage in Dry Region in Inner Mongolia of China. J. Hydrol. 2021, 597, 125759. [Google Scholar] [CrossRef]
- Zhang, T.; Su, X.; Zhang, G.; Wu, H.; Wang, G.; Chu, J. Evaluation of the Impacts of Human Activities on Propagation from Meteorological Drought to Hydrological Drought in the Weihe River Basin, China. Sci. Total Environ. 2022, 819, 153030. [Google Scholar] [CrossRef] [PubMed]
- CRED: 2021 Disasters in Numbers. Brussels: CRED; 2022. Available online: https://cred.be/sites/default/files/2021_EMDAT_report.pdf (accessed on 28 May 2022).
- Kamali, B.; Jahanbakhshi, F.; Dogaru, D.; Dietrich, J.; Nendel, C.; AghaKouchak, A. Probabilistic Modeling of Crop-Yield Loss Risk under Drought: A Spatial Showcase for Sub-Saharan Africa. Environ. Res. Lett. 2022, 17, 024028. [Google Scholar] [CrossRef]
- Masih, I.; Maskey, S.; Mussá, F.E.F.; Trambauer, P. A Review of Droughts on the African Continent: A Geospatial and Long-Term Perspective. Hydrol. Earth Syst. Sci. 2014, 18, 3635–3649. [Google Scholar] [CrossRef]
- Xu, C.; McDowell, N.G.; Fisher, R.A.; Wei, L.; Sevanto, S.; Christoffersen, B.O.; Weng, E.; Middleton, R.S. Increasing Impacts of Extreme Droughts on Vegetation Productivity under Climate Change. Nat. Clim. Chang. 2019, 9, 948–953. [Google Scholar] [CrossRef]
- Spinoni, J.; Barbosa, P.; Bucchignani, E.; Cassano, J.; Cavazos, T.; Christensen, J.H.; Christensen, O.B.; Coppola, E.; Evans, J.; Geyer, B.; et al. Future Global Meteorological Drought Hot Spots: A Study Based on CORDEX Data. J. Clim. 2020, 33, 3635–3661. [Google Scholar] [CrossRef]
- Sheffield, J.; Wood, E.F.; Chaney, N.; Guan, K.; Sadri, S.; Yuan, X.; Olang, L.; Amani, A.; Ali, A.; Demuth, S.; et al. A Drought Monitoring and Forecasting System for Sub-Sahara African Water Resources and Food Security. Bull. Am. Meteorol. Soc. 2014, 95, 861–882. [Google Scholar] [CrossRef]
- Mekonen, A.A.; Berlie, A.B.; Ferede, M.B. Spatial and Temporal Drought Incidence Analysis in the Northeastern Highlands of Ethiopia. Geoenviron. Disasters 2020, 7, 10. [Google Scholar] [CrossRef]
- Li, J.; Wang, Z.; Wu, X.; Xu, C.Y.; Guo, S.; Chen, X.; Zhang, Z. Robust Meteorological Drought Prediction Using Antecedent SST Fluctuations and Machine Learning. Water Resour. Res. 2021, 57, e2020WR029413. [Google Scholar] [CrossRef]
- Kalisa, W.; Zhang, J.; Igbawua, T.; Kayiranga, A.; Ujoh, F.; Aondoakaa, I.S.; Tuyishime, P.; Li, S.; Simbi, C.H.; Nibagwire, D. Spatial Multi-Criterion Decision Making (SMDM) Drought Assessment and Sustainability over East Africa from 1982 to 2015. Remote Sens. 2021, 13, 5067. [Google Scholar] [CrossRef]
- Mwangi, E.; Taylor, O.; Todd, M.C.; Visman, E.; Kniveton, D.; Kilavi, M.; Ndegwa, W.; Otieno, G.; Waruru, S.; Mwangi, J.; et al. Mainstreaming Forecast Based Action into National Disaster Risk Management Systems: Experience from Drought Risk Management in Kenya. Clim. Dev. 2021. [Google Scholar] [CrossRef]
- Ahmadalipour, A.; Moradkhani, H.; Demirel, M.C. A Comparative Assessment of Projected Meteorological and Hydrological Droughts: Elucidating the Role of Temperature. J. Hydrol. 2017, 553, 785–797. [Google Scholar] [CrossRef]
- Stagge, J.H.; Tallaksen, L.M.; Xu, C.-Y.; van Lanen, H.A.J. Standardized Precipitation-Evapotranspiration Index (SPEI): Sensitivity to Potential Evapotranspiration Model and Parameters; IAHS Publication: Montpellier, France, 2014; Volume 363. [Google Scholar]
- Mckee, T.B.; Doesken, N.J.; Kleist, J. The relation of drought frequency and duration to time scales. In Proceedings of the Eighth Conference on Applied Climatology, Anaheim, CA, USA, 17–22 January 1993; Department of Atmospheric Science Colorado State University: Fort Collins, CO, USA, 1993; Volume 17, pp. 179–184. [Google Scholar]
- Vicente-Serrano, S.M.; Beguería, S.; López-Moreno, J.I. A Multiscalar Drought Index Sensitive to Global Warming: The Standardized Precipitation Evapotranspiration Index. J. Clim. 2010, 23, 1696–1718. [Google Scholar] [CrossRef]
- Palmer, W.C. Keeping Track of Crop Moisture Conditions, Nationwide: The New Crop Moisture Index. Weatherwise 1968, 21, 156–161. [Google Scholar] [CrossRef]
- van Roy, M.P. A Rainfall Anomaly Index Independent of Time and Space. Notos 1965, 14, 43–48. [Google Scholar]
- Kalisa, W.; Zhang, J.; Igbawua, T.; Ujoh, F.; Ebohon, O.J.; Namugize, J.N.; Yao, F. Spatio-Temporal Analysis of Drought and Return Periods over the East African Region Using Standardized Precipitation Index from 1920 to 2016. Agricult. Water Manag. 2020, 237. [Google Scholar] [CrossRef]
- Rolbiecki, R.; Yücel, A.; Kocięcka, J.; Atilgan, A.; Marković, M.; Liberacki, D. Analysis of SPI as a Drought Indicator during the Maize Growing Period in the Çukurova Region (Turkey). Sustainability 2022, 14, 3697. [Google Scholar] [CrossRef]
- Zhao, Y.; Xu, X.; Liao, L.; Wang, Y.; Gu, X.; Qin, R.; Guo, Y.; Kang, Z.; Wang, F.; Wang, M. The Severity of Drought and Precipitation Prediction in the Eastern Fringe of the Tibetan Plateau. Theor. Appl. Climatol. 2019, 137, 141–152. [Google Scholar] [CrossRef]
- Pramudya, Y.; Onishi, T.; Senge, M.; Hiramatsu, K.; Nur, P.M.R. Evaluation of Recent Drought Conditions by Standardized Precipitation Index and Potential Evapotranspiration over Indonesia. Paddy Water Environ. 2019, 17, 331–338. [Google Scholar] [CrossRef]
- Musonda, B.; Jing, Y.; Iyakaremye, V.; Ojara, M. Analysis of Long-Term Variations of Drought Characteristics Using Standardized Precipitation Index over Zambia. Atmosphere 2020, 11, 1268. [Google Scholar] [CrossRef]
- Taji, S.G.; Keskar, A.P. Drought Identification and Analysis of Precipitation Trends in Beed District, Maharashtra. Mater. Today Proc. 2021. [Google Scholar] [CrossRef]
- Wang, Q.; Zhang, R.; Qi, J.; Zeng, J.; Wu, J.; Shui, W.; Wu, X.; Li, J. An Improved Daily Standardized Precipitation Index Dataset for Mainland China from 1961 to 2018. Sci. Data 2022, 9, 124. [Google Scholar] [CrossRef] [PubMed]
- Yang, M.; Yan, D.; Yu, Y.; Yang, Z. SPEI-Based Spatiotemporal Analysis of Drought in Haihe River Basin from 1961 to 2010. Adv. Meteorol. 2016, 2016, 1–10. [Google Scholar] [CrossRef]
- Hui-Mean, F.; Yusop, Z.; Yusof, F. Drought Analysis and Water Resource Availability Using Standardized Precipitation Evapotranspiration Index. Atmos. Res. 2018, 201, 102–115. [Google Scholar] [CrossRef]
- Feng, W.; Lu, H.; Yao, T.; Yu, Q. Drought Characteristics and Its Elevation Dependence in the Qinghai–Tibet Plateau during the Last Half-Century. Sci. Rep. 2020, 10, 14323. [Google Scholar] [CrossRef]
- Ogunrinde, A.T.; Olasehinde, D.A.; Olotu, Y. Assessing the Sensitivity of Standardized Precipitation Evapotranspiration Index to Three Potential Evapotranspiration Models in Nigeria. Sci. Afr. 2020, 8, e00431. [Google Scholar] [CrossRef]
- Wang, Q.; Zeng, J.; Qi, J.; Zhang, X.; Zeng, Y.; Shui, W.; Xu, Z.; Zhang, R.; Wu, X.; Cong, J. A Multi-Scale Daily SPEI Dataset for Drought Characterization at Observation Stations over Mainland China from 1961 to 2018. Earth Syst. Sci. Data 2021, 13, 331–341. [Google Scholar] [CrossRef]
- Jabbi, F.F.; Li, Y.; Zhang, T.; Bin, W.; Hassan, W.; Songcai, Y. Impacts of Temperature Trends and Spei on Yields of Major Cereal Crops in the Gambia. Sustainability 2021, 13, 12480. [Google Scholar] [CrossRef]
- Borona, P.; Busch, F.; Krueger, T.; Rufin, P. Uncertainty in Drought Identification Due to Data Choices, and the Value of Triangulation. Water 2021, 13, 3611. [Google Scholar] [CrossRef]
- Polong, F.; Chen, H.; Sun, S.; Ongoma, V. Temporal and Spatial Evolution of the Standard Precipitation Evapotranspiration Index (SPEI) in the Tana River Basin, Kenya. Theor. Appl. Climatol. 2019, 138, 777–792. [Google Scholar] [CrossRef]
- Ayugi, B.; Tan, G.; Rouyun, N.; Zeyao, D.; Ojara, M.; Mumo, L.; Babaousmail, H.; Ongoma, V. Evaluation of Meteorological Drought and Flood Scenarios over Kenya, East Africa. Atmosphere 2020, 11, 307. [Google Scholar] [CrossRef]
- Nguvava, M.; Abiodun, B.J.; Otieno, F. Projecting Drought Characteristics over East African Basins at Specific Global Warming Levels. Atmos. Res. 2019, 228, 41–54. [Google Scholar] [CrossRef]
- Tirivarombo, S.; Osupile, D.; Eliasson, P. Drought Monitoring and Analysis: Standardized Precipitation Evapotranspiration Index (SPEI) and Standardised Precipitation Index (SPI). Phys. Chem. Earth 2018, 106, 1–10. [Google Scholar] [CrossRef]
- Al-Najjar, H.; Ceribasi, G.; Dogan, E.; Abualtayef, M.; Qahman, K.; Shaqfa, A. Stochastic Time-Series Models for Drought Assessment in the Gaza Strip (Palestine). J. Water Clim. Chang. 2020, 11, 85–114. [Google Scholar] [CrossRef]
- Hao, Y.; Baik, J.; Fred, S.; Choi, M. Comparative Analysis of Two Drought Indices in the Calculation of Drought Recovery Time and Implications on Drought Assessment: East Africa’s Lake Victoria Basin. Stoch. Environ. Res. Risk Assess. 2021. [Google Scholar] [CrossRef]
- Salimi, H.; Asadi, E.; Darbandi, S. Meteorological and Hydrological Drought Monitoring Using Several Drought Indices. Appl. Water Sci. 2021, 11, 11. [Google Scholar] [CrossRef]
- Pei, Z.; Fang, S.; Wang, L.; Yang, W. Comparative Analysis of Drought Indicated by the SPI and SPEI at Various Timescales in Inner Mongolia, China. Water 2020, 12, 1925. [Google Scholar] [CrossRef]
- Wang, J.; Lin, H.; Huang, J.; Jiang, C.; Xie, Y.; Zhou, M. Variations of Drought Tendency, Frequency, and Characteristics and Their Responses to Climate Change under CMIP5 RCP Scenarios in Huai River Basin, China. Water 2019, 11, 2174. [Google Scholar] [CrossRef]
- Hu, Z.; Liu, S.; Zhong, G.; Lin, H.; Zhou, Z. Modified Mann-Kendall Trend Test for Hydrological Time Series under the Scaling Hypothesis and Its Application. Hydrologic. Sci. J. 2020, 65, 2419–2438. [Google Scholar] [CrossRef]
- Sen, P.K. Estimates of the Regression Coefficient Based on Kendall’s Tau. J. Am. Stat. Assoc. 1968, 63, 1379–1389. [Google Scholar] [CrossRef]
- Theil, H. A RankInvariant Method of Linear and Polynomial Regression Analysis, I, II, III. Proc. K. Ned. Akad. Wet. Ser. A Math. Sci. 1950, 53, 386–392, 521–525, 1397–1412. [Google Scholar]
- Schneiderbauer, S.; Baunach, D.; Pedoth, L.; Renner, K.; Fritzsche, K.; Bollin, C.; Pregnolato, M.; Zebisch, M.; Liersch, S.; López, M.d.R.R.; et al. Spatial-Explicit Climate Change Vulnerability Assessments Based on Impact Chains. Findings from a Case Study in Burundi. Sustainability 2020, 12, 6354. [Google Scholar] [CrossRef]
- FSNWG. FSNWG Update-Central & Eastern Africa, 11 March 2010. Humanitarian Emergency Declared in Northern Burundi. 2010. Available online: https://reliefweb.int/report/burundi/fsnwg-update-central-eastern-africa-11-march-2010 (accessed on 19 May 2022).
- Nkunzimana, A.; Shuoben, B.; Guojie, W.; Alriah, M.A.A.; Sarfo, I.; Zhihui, X.; Vuguziga, F.; Ayugi, B.O. Assessment of Drought Events, Their Trend and Teleconnection Factors over Burundi, East Africa. Theor. Appl. Climatol. 2021, 145, 1293–1316. [Google Scholar] [CrossRef]
Figure 1.
Map of Burundi and the distribution of meteorological stations used in the study.

Figure 2.
The correlation of annual mean precipitation and annual mean temperature.

Figure 3.
Monthly mean precipitations in mm for the seven meteorological stations in this study.

Figure 4.
Maximum and minimum monthly mean temperature in °C for meteorological stations of Miyinga, Kirundo, Cankuzo, Musasa, Gitega, Gisozi, and Bujumbura across Burundi.
Figure 4.
Maximum and minimum monthly mean temperature in °C for meteorological stations of Miyinga, Kirundo, Cankuzo, Musasa, Gitega, Gisozi, and Bujumbura across Burundi.

Figure 5.
SPEI values illustration of dry (in red) and wet (in blue) conditions in Burundi. (A) The northern, eastern, and southeastern parts; (B) the central western parts.
Figure 5.
SPEI values illustration of dry (in red) and wet (in blue) conditions in Burundi. (A) The northern, eastern, and southeastern parts; (B) the central western parts.


Figure 6.
The frequency of droughts at meteorological stations. The blue and grey bar charts respectively represent the frequency of droughts before the 21st century and during the 21st century.
Figure 6.
The frequency of droughts at meteorological stations. The blue and grey bar charts respectively represent the frequency of droughts before the 21st century and during the 21st century.

Figure 7.
The quantified historical drought events in the JF, MAM, JJA, and SOND seasons for Muyinga, Kirundo, Cankuzo, Musasa, Gitega, Gisozi, and Bujumbura stations.
Figure 7.
The quantified historical drought events in the JF, MAM, JJA, and SOND seasons for Muyinga, Kirundo, Cankuzo, Musasa, Gitega, Gisozi, and Bujumbura stations.

Figure 8.
The number of drought events detected during the study period for each meteorological station.
Figure 8.
The number of drought events detected during the study period for each meteorological station.

Figure 9.
The number of moderate, severe, and extreme months detected under SPEI timescales of 2, 6, and 24 months, respectively, for each station.
Figure 9.
The number of moderate, severe, and extreme months detected under SPEI timescales of 2, 6, and 24 months, respectively, for each station.


Table 1.
Meteorological stations’ information and the record length of data used in this study.
| Name of Stations | Stations ID | Latitude | longitude | Elevation | Location | Period |
|---|---|---|---|---|---|---|
| Muyinga | 1130 | −2.85 | 30.35 | 1756 | North | 1981~2020 |
| Kirundo | 10079 | −2.58 | 30.11 | 1449 | 1981~2020 | |
| Cankuzo | 10030 | −3.31 | 30.53 | 1652 | East | 1981~2020 |
| Musasa | 10116 | −4.00 | 30.10 | 1260 | Southeast | 1981~2020 |
| Gitega | 10046 | −3.42 | 29.92 | 1645 | Center | 1981~2020 |
| Gisozi | 10044 | −3.56 | 29.68 | 2097 | 1981~2020 | |
| Bujumbura | 10011 | −3.32 | 29.32 | 783 | West | 1981~2020 |
Table 2.
Classification of dryness and wetness according to the SPEI index.
| SPEI Values | Categories of Climatic Moisture |
|---|---|
| ≥2.00 | Extremely wet |
| 1.50 to 1.99 | Severely wet |
| 1.00 to 1.49 | Moderately wet |
| −1.00 to 1.00 | Near normal |
| −1.49 to −1.00 | Moderate dry |
| −1.99 to −1.50 | Severe dry |
| ≤−2 | Extremely dry |
Table 3.
The longest drought incidents recorded and their categories of dryness based on the intensity during the study period for each meteorological station.
Table 3.
The longest drought incidents recorded and their categories of dryness based on the intensity during the study period for each meteorological station.
| Station | Timescale | Year | Duration | Severity | Intensity | Months | Category |
|---|---|---|---|---|---|---|---|
| Muyinga | SPEI-2 | 1981 | 3 | −4.25 | −1.42 | October–December | Moderate dry |
| 1982 | 3 | −4.67 | −1.56 | August–October | Severely dry | ||
| 1984 | 3 | −4.67 | −1.56 | January–March | Severely dry | ||
| 1998–1999 | 4 | −8.11 | −2.03 | October–January | Extremely dry | ||
| 2000 | 5 | −7.30 | −1.46 | April–August | Moderate dry | ||
| 2005 | 3 | −4.20 | −1.40 | October–December | Moderate dry | ||
| SPEI-6 | 1982 | 3 | −5.40 | −1.80 | February–April | Severely dry | |
| 1983–1984 | 9 | −14.33 | −1.60 | November–July | Severely dry | ||
| 1996 | 4 | −4.57 | −1.14 | May–August | Moderate dry | ||
| 1998–1999 | 15 | −25.40 | −1.70 | August–October | Severely dry | ||
| 2000 | 7 | −11.70 | −1.67 | April–October | Severely dry | ||
| 2005–2006 | 6 | −8.00 | −1.33 | October–March | Moderate dry | ||
| 2010 | 5 | −6.71 | −1.34 | August–December | Moderate dry | ||
| 2014 | 4 | −5.20 | −1.30 | May–August | Moderate dry | ||
| 2016–2017 | 12 | −16.06 | −1.34 | May–April | Moderate dry | ||
| SPEI-24 | 1999–2001 | 23 | −48.21 | −2.10 | November–September | Extremely dry | |
| 2005–2007 | 18 | −27.33 | −1.52 | December–May | Severely dry | ||
| 2017 | 7 | −9.34 | −1.33 | June–December | Moderate dry | ||
| Kirundo | SPEI-2 | 2007–2008 | 6 | −8.51 | −1.42 | October–March | Moderate dry |
| 2010 | 6 | −8.13 | −1.35 | July–December | Moderate dry | ||
| 2011 | 4 | −5.00 | −1.25 | June–September | Moderate dry | ||
| 2013 | 4 | −5.61 | −1.40 | June–September | Moderate dry | ||
| 2014 | 4 | −5.47 | −1.37 | May–August | Moderate dry | ||
| 2015 | 4 | −5.43 | −1.36 | July–October | Moderate dry | ||
| 2016 | 5 | −7.67 | −1.53 | June–October | Severely dry | ||
| 2020 | 4 | −6.00 | −1.50 | April–July | Severely dry | ||
| SPEI-6 | 2008 | 5 | −7.27 | −1.45 | January–May | Moderate dry | |
| 2009 | 4 | −5.22 | −1.30 | February–May | Moderate dry | ||
| 2010–2011 | 16 | −22.10 | −1.38 | August–November | Moderate dry | ||
| 2012–2013 | 5 | −5.85 | −1.17 | October–February | Moderate dry | ||
| 2013 | 7 | −8.40 | −1.20 | June–December | Moderate dry | ||
| 2014 | 4 | −5.60 | −1.40 | June–September | Moderate dry | ||
| 2015–2016 | 9 | −11.01 | −1.22 | June–February | Moderate dry | ||
| 2016–2017 | 19 | −25.68 | −1.35 | June–December | Moderate dry | ||
| SPEI-24 | 2009–2010 | 9 | −9.72 | −1.08 | May–January | Moderate dry | |
| 2010–2014 | 52 | −62.72 | −1.21 | July–October | Moderate dry | ||
| 2016–2018 | 24 | −32.26 | −1.34 | September–August | Moderate dry | ||
| Cankuzo | SPEI-2 | 2000 | 7 | −11.00 | −1.57 | April–October | Severely dry |
| 2002 | 4 | −6.24 | −1.56 | July–October | Severely dry | ||
| 2003 | 4 | −4.46 | −1.12 | July–October | Moderate dry | ||
| 2005 | 6 | −10.40 | −1.73 | July–December | Severely dry | ||
| 2008 | 3 | −4.80 | −1.20 | Ape–June | Moderate dry | ||
| SPEI-6 | 1999 | 7 | −13.21 | −1.90 | January–July | Severely dry | |
| 2000 | 11 | −18.04 | −1.64 | February–December | Severely dry | ||
| 2004 | 4 | −5.60 | −1.40 | May–August | Moderate dry | ||
| 2005–2006 | 15 | −24.40 | −1.63 | February–April | Severe dry | ||
| 2009 | 4 | −5.33 | −1.33 | January–April | Moderate dry | ||
| 2011 | 5 | −7.10 | −1.42 | January–May | Moderate dry | ||
| SPEI-24 | 1999–2002 | 28 | −44.16 | −1.60 | December–March | Severely dry | |
| 2004–2007 | 33 | −52.00 | −1.60 | May–January | Severely dry | ||
| 2008–2010 | 17 | −21.30 | −1.26 | November–March | Moderate dry | ||
| Musasa | SPEI-2 | 1981 | 3 | −4.43 | −1.47 | October–December | Moderate dry |
| 1983 | 3 | −4.07 | −1.36 | October–December | Moderate dry | ||
| 1986 | 3 | −4.36 | −1.45 | August–October | Moderate dry | ||
| 1933 | 4 | −6.55 | −1.64 | September–December | Severely dry | ||
| 2000 | 4 | −5.45 | −1.11 | May–August | Moderate dry | ||
| 2011 | 3 | −4.00 | −1.33 | April–June | Moderate dry | ||
| 2013 | 3 | −4.32 | −1.44 | February–April | Moderate dry | ||
| 2014 | 3 | −4.21 | −1.40 | February–April | Moderate dry | ||
| 2015 | 4 | −5.35 | −1.34 | January–April | Moderate dry | ||
| 2015–2016 | 5 | −8.53 | −1.70 | December–April | Severely dry | ||
| 2019 | 3 | −4.48 | −1.50 | February–April | Severely dry | ||
| 2020 | 3 | −4.16 | −1.38 | February–April | Moderate dry | ||
| SPEI-6 | 1981–1982 | 3 | −4.67 | −1.56 | November–January | Severely dry | |
| 1983–1984 | 4 | −6.57 | −1.64 | November–February | Severely dry | ||
| 1990 | 3 | −3.31 | −1.10 | October–December | Moderate dry | ||
| 1993–1994 | 5 | −9.72 | −1.94 | October–February | Severely dry | ||
| 1995 | 3 | −3.70 | −1.23 | September–November | Moderate dry | ||
| 2005 | 6 | −8.56 | −1.43 | April–September | Moderate dry | ||
| 2012 | 3 | −4.47 | −1.50 | March–May | Severely dry | ||
| 2013 | 3 | −3.78 | −1.26 | May–July | Moderate dry | ||
| 2015 | 4 | −5.12 | −1.28 | March–June | Moderate dry | ||
| 2016 | 6 | −11.76 | −1.96 | February–July | Severely dry | ||
| 2019 | 5 | −6.87 | −1.37 | February–June | Moderate dry | ||
| 2020 | 4 | −5.05 | −1.26 | March–June | Moderate dry | ||
| SPEI-24 | 1993–1994 | 13 | −17.74 | −1,36 | October–October | Moderate dry | |
| 2000 | 10 | −15.06 | −1.51 | March–December | Severely dry | ||
| 2004 | 5 | −6.30 | −1.26 | March–July | Moderate dry | ||
| 2005–2006 | 21 | −30.34 | −1.44 | March–November | Moderate dry | ||
| 2009 | 8 | −9.78 | −1.22 | January–August | Moderate dry | ||
| 2011–2012 | 9 | −17.21 | −1.91 | November–July | Severely dry | ||
| Gitega | SPEI-2 | 1986 | 3 | −5.00 | −1.70 | August–October | Severely dry |
| 1993 | 3 | −6.35 | −2.12 | September–November | Extremely dry | ||
| 1998 | 3 | −6.36 | −2.12 | October–December | Extremely dry | ||
| 2000 | 8 | −13.47 | −1.68 | January–August | Severely dry | ||
| 2002 | 3 | −6.00 | −2.00 | June–August | Extremely dry | ||
| 2004 | 3 | −5.24 | −1.75 | May–July | Severely dry | ||
| 2005 | 4 | −5.23 | −1.30 | January–April | Moderate dry | ||
| 2012 | 3 | −4.72 | −1.57 | January–March | Severely dry | ||
| SPEI-6 | 1993–1994 | 6 | −10.78 | −1.80 | September–February | Severely dry | |
| 1998 -1999 | 7 | −13.25 | −1.90 | October–April | Severely dry | ||
| 2000 | 8 | −17.72 | −2.22 | February–September | Extremely dry | ||
| 2003 | 4 | −5.86 | −1.46 | May–August | Moderate dry | ||
| 2005 | 8 | −12.20 | −1.53 | March–October | Severely dry | ||
| 2012 | 4 | −5.72 | −1.43 | March–June | Moderate dry | ||
| 2019 | 5 | −7.61 | −1.52 | January–May | Severely dry | ||
| SPEI-24 | 1993 | 3 | −4.12 | −1.37 | October~ December | Moderate dry | |
| 1994 | 4 | −4.20 | −1.05 | March–June | Moderate dry | ||
| 1994–1995 | 7 | −8.30 | −1.18 | October–April | Moderate dry | ||
| 2000 | 11 | −23.28 | −2.12 | January–November | Extremely dry | ||
| 2003 | 5 | −6.22 | −1.24 | August–December | Moderate dry | ||
| 2004 | 5 | −5.50 | −1.10 | March–July | Moderate dry | ||
| 2004–2006 | 20 | −25.61 | −1.28 | November–June | Moderate dry | ||
| 2012 | 6 | −7.12 | −1.18 | February–July | Moderate dry | ||
| 2018–2019 | 10 | −12.54 | −1.25 | October–July | Moderate dry | ||
| Gisozi | SPEI-2 | 1992 | 3 | −4.18 | −1.40 | April–June | Moderate dry |
| 1993 | 4 | −5.41 | −1.35 | September–December | Moderate dry | ||
| 1998 ~1999 | 4 | −7.70 | −1.92 | October–January | Severely dry | ||
| 2000 | 9 | −16.00 | −1.77 | February–December | Severely dry | ||
| 2005 | 2 | −4.12 | −2.06 | March–April | Extremely dry | ||
| 2019 | 3 | −5.17 | −1.72 | April–June | Severely dry | ||
| SPEI-6 | 1982 | 3 | −5.67 | −1.42 | January–March | Moderate dry | |
| 1992 | 4 | −5.92 | −1.48 | May–August | Moderate dry | ||
| 1993–1994 | 13 | −17.84 | −1.37 | March–February | Moderate dry | ||
| 1998–1999 | 6 | −12.78 | −2.13 | November–April | Extremely dry | ||
| 2000–2001 | 13 | −25.26 | −1.94 | March–March | Severely dry | ||
| 2005 | 5 | −6.80 | −1.36 | March–July | Moderate dry | ||
| 2019 | 5 | −7.42 | −1.48 | April–August | Moderate dry | ||
| SPEI-24 | 1993–1995 | 26 | −39.27 | −1.51 | September–October | Severely dry | |
| 2000–2002 | 26 | −44. 05 | −1.69 | February–March | Severely dry | ||
| 2005–2006 | 14 | −18.60 | −1.33 | March–April | Moderate dry | ||
| 2018 | 8 | −10.07 | −1.25 | February–September | Moderate dry | ||
| 2019 | 4 | −4.76 | −1.19 | April–July | Moderate dry | ||
| Bujumbura | SPEI-2 | 1995–1996 | 6 | −10.00 | −1.66 | August–January | Moderate dry |
| 1997 | 4 | −8.00 | −2.00 | January–April | Extremely dry | ||
| 2000 | 2 | −4.04 | −2.04 | May–June | Extremely dry | ||
| 2004 | 3 | −5.28 | −1.76 | June–August | Moderate dry | ||
| 2016 | 3 | −4.50 | −1.50 | October–December | Moderate dry | ||
| SPEI-6 | 1993 | 4 | −5.89 | −1.47 | September–December | Moderate dry | |
| 1994 | 4 | −5.12 | −1.28 | February–May | Moderate dry | ||
| 1995–1996 | 8 | −12.06 | −1.51 | October–May | Severely dry | ||
| 1997 | 9 | −16.87 | −1.87 | January–September | Severely dry | ||
| 1999 | 6 | −9.00 | −1.50 | January–June | Severely dry | ||
| 2000 | 5 | −9.01 | −1.80 | June–October | Severely dry | ||
| 2003 | 5 | −5.62 | −1.12 | April–August | Moderate dry | ||
| 2004 | 9 | −11.73 | −1.30 | February–November | Moderate dry | ||
| 2016–2017 | 8 | −11.71 | −1.46 | October–May | Moderate dry | ||
| SPEI-24 | 1994–1999 | 60 | −90.34 | −1.50 | February–February | Severely dry | |
| 2003–2004 | 14 | −19.83 | −1.42 | November–December | Moderate dry | ||
| 2017 | 12 | −13.61 | −1.13 | January–December | Moderate dry |
Table 4.
The results of the Mann–Kendall (MK) trend test and Sen’s slope for SPEI index values at 2, 6, and 24 month timescales. * significant and ** highly significant.
Table 4.
The results of the Mann–Kendall (MK) trend test and Sen’s slope for SPEI index values at 2, 6, and 24 month timescales. * significant and ** highly significant.
| Regions | Stations | Z-Value | Sen’s Slope | ||||
|---|---|---|---|---|---|---|---|
| SPEI-2 | SPEI-6 | SPEI-24 | SPEI-2 | SPEI-6 | SPEI-24 | ||
| North | Muyinga | 1.86 * | 0.28 | 1.53 | 0.00 | 0.00 | 0.00 |
| Kirundo | −13.75 ** | −15.86 ** | −17.29 ** | 0.00 | 0.00 | 0.00 | |
| East | Cankuzo | −2.74 ** | −3.73 ** | −6.16 ** | 0.00 | 0.00 | 0.00 |
| South East | Musasa | −0.06 | −1.79 | −3.81 ** | 0.00 | 0.00 | 0.00 |
| Center | Gitega | −1.14 | −3.43 ** | −5.92 ** | 0.00 | 0.00 | 0.00 |
| Gisozi | 1.21 | 0.93 | 2.75 ** | 0.00 | 0.00 | 0.00 | |
| Ouest | Bujumbura | 1.77 | 1.80 | 3.42 ** | 0.00 | 0.00 | 0.00 |
Publisher’s Note: MDPI stays neutral with regard to jurisdictional claims in published maps and institutional affiliations. |
© 2022 by the authors. Licensee MDPI, Basel, Switzerland. This article is an open access article distributed under the terms and conditions of the Creative Commons Attribution (CC BY) license (https://creativecommons.org/licenses/by/4.0/).
Share and Cite
MDPI and ACS Style
Ndayiragije, J.M.; Li, F. Monitoring and Analysis of Drought Characteristics Based on Climate Change in Burundi Using Standardized Precipitation Evapotranspiration Index. Water 2022, 14, 2511. https://doi.org/10.3390/w14162511
AMA Style
Ndayiragije JM, Li F. Monitoring and Analysis of Drought Characteristics Based on Climate Change in Burundi Using Standardized Precipitation Evapotranspiration Index. Water. 2022; 14(16):2511. https://doi.org/10.3390/w14162511
Chicago/Turabian StyleNdayiragije, Jean Marie, and Fan Li. 2022. "Monitoring and Analysis of Drought Characteristics Based on Climate Change in Burundi Using Standardized Precipitation Evapotranspiration Index" Water 14, no. 16: 2511. https://doi.org/10.3390/w14162511
Note that from the first issue of 2016, this journal uses article numbers instead of page numbers. See further details here.