Review

A Comparative Analysis of Statistical Models and Mathematics in Reverse Osmosis Evaluation Processes as a Search Path to Achieve Better Efficiency

by
Esteban Manuel Villena-Martínez
1,2,*,
Paola Andrea Alvizuri-Tintaya
2,3,
Jaime Lora-Garcia
4,
Juan Ignacio Torregrosa-López
4 and
Vanesa Gladys Lo-Iacono-Ferreira
2
1
Departamento de Ingeniería y Ciencias Exáctas, Universidad Católica Boliviana “San Pablo”, Tarija, Bolivia
2
Project Management, Innovation and Sustainability Research Center (PRINS), Alcoy Campus, Universitat Politècnica de València, Plaza Ferrándiz y Carbonell, s/n, E-03690 Alcoy, Spain
3
Centro de Investigación en Agua, Energía y Sostenibilidad, Universidad Católica Boliviana “San Pablo”, La Paz, Bolivia
4
Research Institute for Industrial, Radiophysical and Environmental Safety (ISIRYM), Alcoy Campus, Universitat Politècnica de València, Plaza Ferrándiz y Carbonell, s/n, E-03690 Alcoy, Spain
*
Author to whom correspondence should be addressed.
Water 2022, 14(16), 2485; https://doi.org/10.3390/w14162485
Submission received: 23 June 2022 / Revised: 8 August 2022 / Accepted: 9 August 2022 / Published: 12 August 2022
(This article belongs to the Section Water Quality and Contamination)

Abstract

:
An effective alternative for water purification is reverse osmosis (RO). Laboratory-scale RO modeling is widely applied worldwide, and allows the evaluation of the behavior of the system to find the most convenient operating variables to be applied in future industrial scale-ups. Statistical models provide a wide range of information that allows a statistical prediction of the operation of the plant, and allows us to obtain efficiency indices in its development; these are useful in the planning, operation and monitoring process in RO plants. The mathematical models describe the physical behavior of the membrane and allow the identification of optimal operating conditions, taking into account economic aspects, guaranteeing a greater implementation of RO technology in developing countries which have problems with water contaminated with toxic heavy metals. The present work shows a review of different statistical and mathematical models, and the suitability of these in the analysis of RO in the separation of heavy metals in drinking water that can be applied in countries with serious environmental problems. Bolivia and several river basins, such as the Guadalquivir and Milluni, present this type of problem. A comparative method is proposed to establish the advantages and selection criteria to apply the different models in RO.

1. Introduction

Throughout the world, water scarcity is recognized as a present and future threat to humanity; as a consequence, the new trend is to recover water from wastewater or the sea through different technologies. Likewise, financial viability is often a concern in water reclamation projects [1]. Recent studies have shown membrane filtration technology to be a promising process for drinking water treatment and recovery [2,3,4,5]. One membrane filtration process that has drawn particular attention in the last few years is RO [6,7,8]. Feria-Díaz et al. [9] states that RO is the most advanced technology used for water desalination in the world, due to its high efficiency, flexibility, and ease of operation. In contrast, RO has become a tool with industrial applications, and its research is currently being deepened, with the aim of guiding this process towards sustainability [10]. In making reverse osmosis a more economically efficient technology, research has allowed advances in materials, better pumping efficiency, and the creation of energy recovery devices [11].
In order to understand the separation in a membrane process, it is necessary to build models. These models are especially useful when the transport coefficients are not functions of the driving forces, that is, pressure and concentration gradients [12]. The variables of the models are discussed by different authors seeking to reach an exact understanding of the process. For example, Sherwood et al. [13] define the coefficients in the solution—diffusion and solution-diffusion-imperfection models to be functions of both pressure and concentration, while the coefficients in the Kedem model [14] are relatively insensitive to pressure and concentration. On the other hand, Abbas [15] specifies two key variables that must be monitored and controlled for the correct performance of the RO system. One is product flow rate, and the second is conductivity (a measure of quality). However, there are many other variables that need to be monitored and/or controlled, including the feed rate, operating temperature, permeate pressure, and solute concentration.
Subramanni and Panda [16] state that steady-state statistical models in RO are built using flow, concentration, and pH data over a period of time. This research indicates that statistical models are useful for the formulation of operational control strategies in real-time in the plant. On the other hand, laboratory-scale pilot plants are useful in order to understand the solute separation mechanism in water in an RO process. Mathematical models of the integrated process can be useful in the design and operation of plants at various levels. It should also be noted that phenomenological models derived from real-time plant data are useful for the calculation of the permeate and rejection characteristics that also incorporate concentration polarization [16]. However, the behavior of a real plant must be ascertained by analyzing its input and output data through statistical tools. Regression models were used to predict the performance index, which takes into account the consumption of energy depending on different variables.
Bolivia has had significant population growth and poorly organized development, which has led to a growing and sustained process of water pollution in various areas of the country [17,18]. Such is the case of the Guadalquivir-Tarija and Milluni-La Paz basins. The water problem in Bolivia requires technologies that allow the production and provision of safe water through simulation models that allow the optimal use of energy. This paper shows a review of the statistical, optimization, and mathematical models used in RO, and their advantages in the design of water treatment plants at an industrial level. The study constitutes a novel methodology to identify the most efficient model in the evaluation of the operation of the RO, based on the advantages and characteristics of each model.
The most frequently used models and methodologies in reverse osmosis processes are described below.

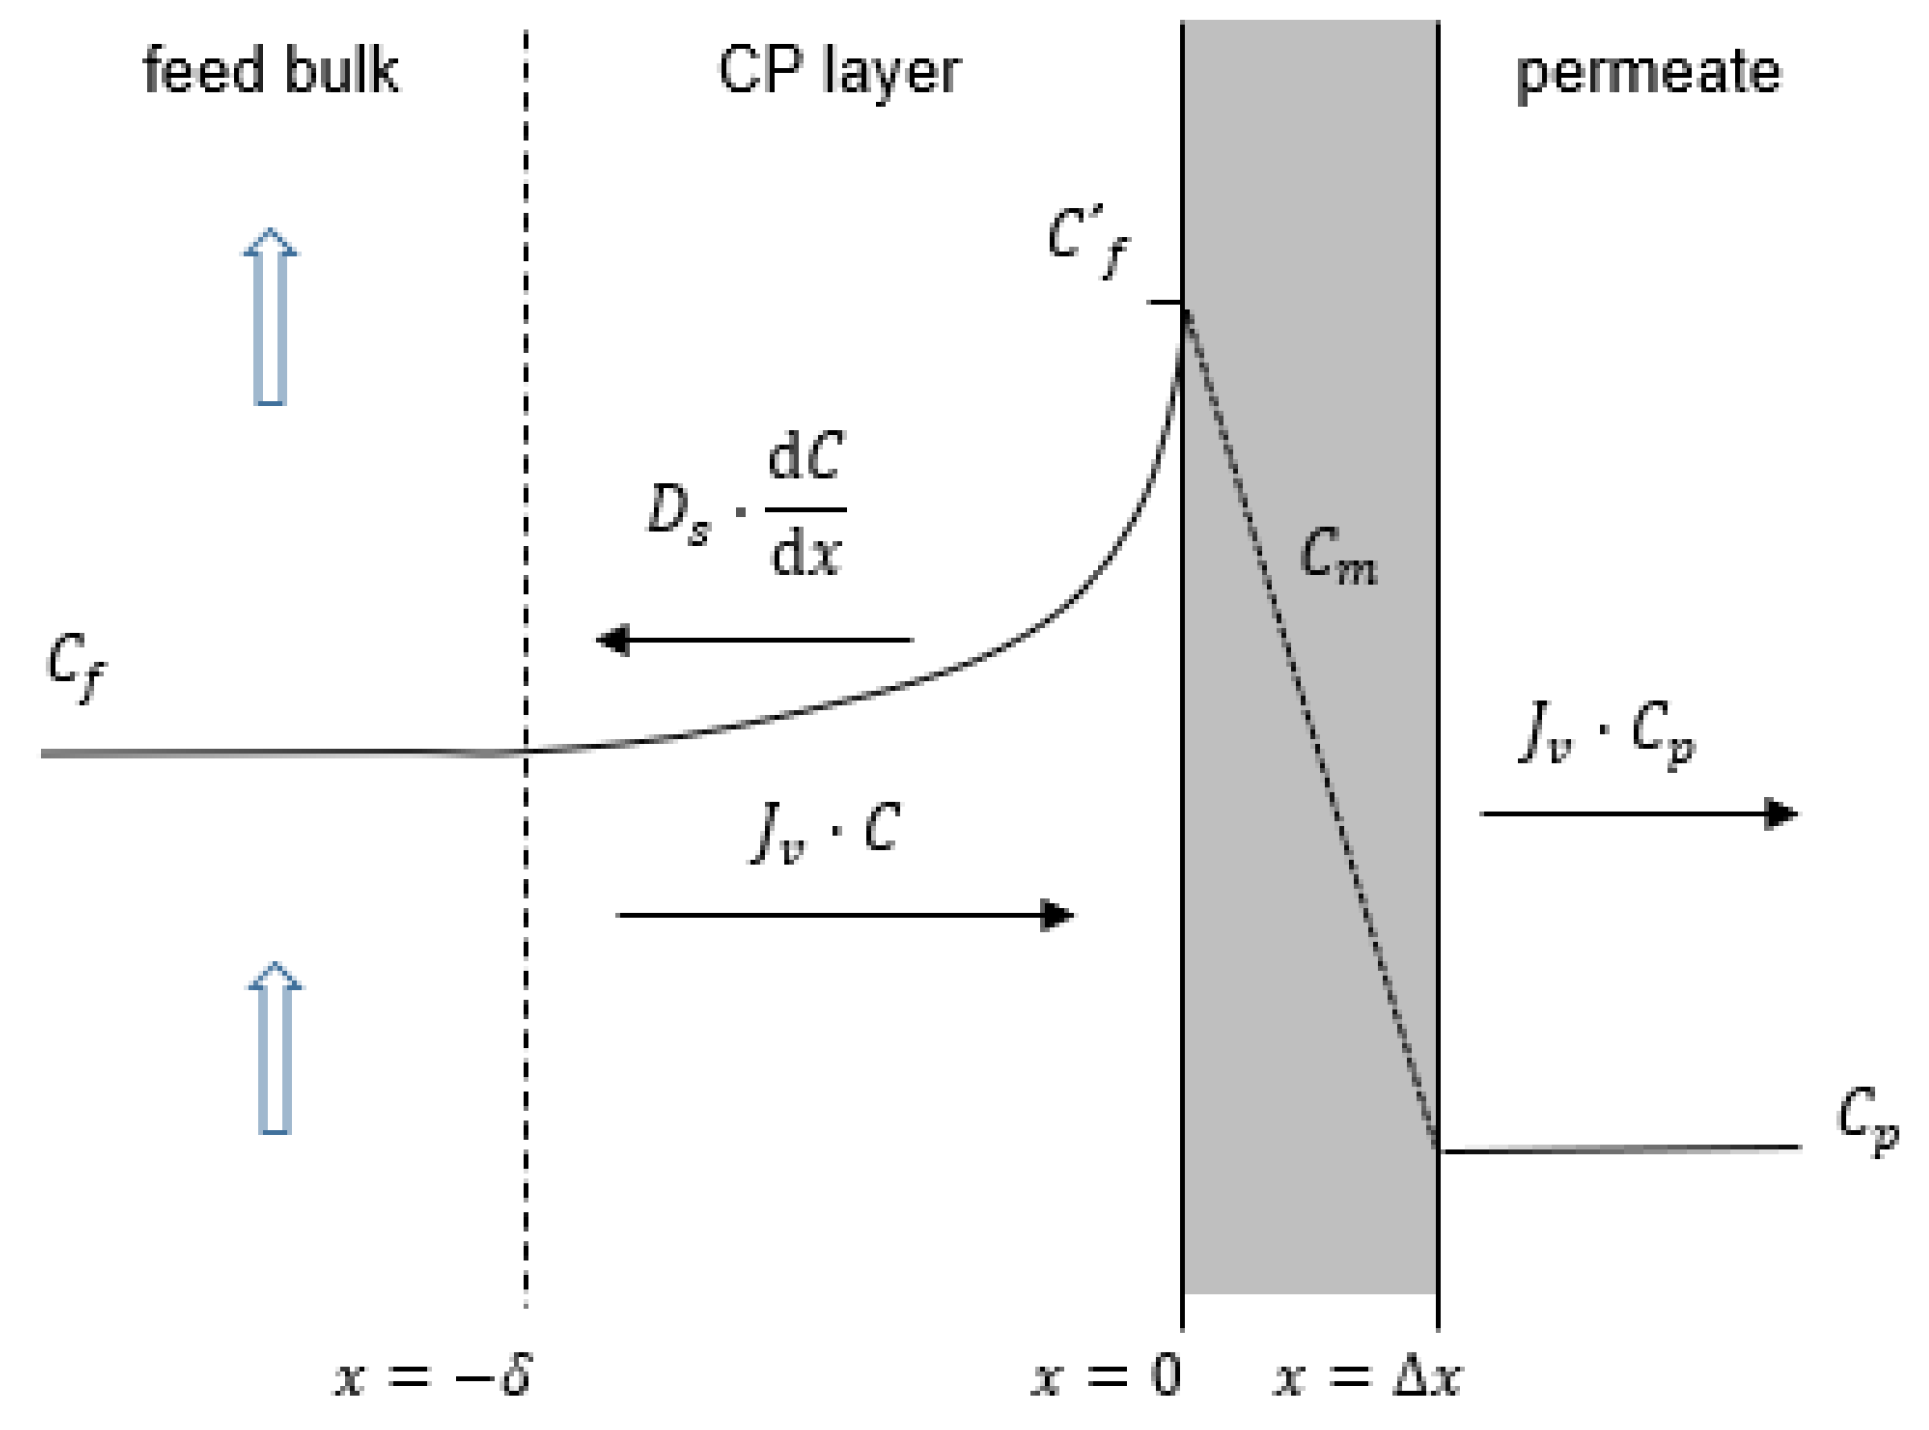
1.1. Model Concentration Polarization

In membrane-based water treatment processes, membrane fouling is an unavoidable fact that can significantly affect the performance, operation, sustainability, and economic viability of the processes, with concentration by polarization being one of these mechanisms. There are several correlations for a quantitative description of this phenomenon [19].
The main research topic in mass transfer is the transfer process near the membrane, where concentration-polarization (CP) significantly affects this process. Therefore, the study of mass transfer to the outer membrane focuses on CP modeling to predict the RO separation process [5].
The phenomenon of concentration-polarization (CP) remains a challenge that generates problems in the operational process, such as increases in feed pressure, decreases in permeate, increases in energy consumption, and membrane fouling [8,20,21].
When a membrane separation process is carried out, as time progresses, solutes remain near the membrane on the feed side; they belong to dissolved salts that did not pass through the permeate. These solutes must be dragged by the rejection current; however, as this speed is almost zero, they can only pass into the rejection current by diffusion that is generated in the opposite direction to the permeate flow, which is also called retro diffusion. This causes a zone in the membrane called the boundary layer, where the concentration of the salt is greater than that of the rest of the solution. The explained phenomenon is called membrane polarization, and when the concentration of this solution in contact with the membrane increases, a concentration by polarization is generated [22,23].
Concentration polarization and the corresponding theory allow the simultaneous evaluation of the three characteristic parameters of the Spigler-Kedem [24] model: reflection coefficient σ, solute permeability Lp, and mass transfer coefficient K. In addition, the variable rate method gives quite good results, similar to those of the Spiegler-Kedem polarization model. The latter also provides information on the reflection and permeability of solutes [25].
Al-Obaidi et al. [26] show that a mathematical model applied in the processes of the separation of diluted aqueous solutions by RO can be used to predict and analyze the flow, pressure, concentration, and temperature in the membrane, in addition to facilitating the estimation of the behavior of the flow of water and the concentration of the solute.
Temperature is a very difficult parameter to control in a natural environment. However, in a plant operation process it is important to evaluate its effect on the operation of the RO [27]. Transport through dense films can be viewed as an activated process that can generally be represented by an Arrhenius-type equation. Temperature has an important effect on membrane permeability and solute transport, and the Arrhenius equation shows the temperature dependence of the membrane permeability in RO processes [28].
Alanod et al. [29] point out that the increase in pressure and temperature in a brackish water desalination process by RO allows better recovery but decreases when the feed flow increases. They also point out that lower energy consumption can be achieved with lower values of flow and pressures.
Ahmed et al. [30] point out that more than 60% of desalination processes installed in the world are operated by RO. New membrane materials, improved pretreatment methods, and novel process design have enabled the technology to operate near the theoretical energy limit. In turn, Lim and Elimelec [31] indicate that innovations in the system configuration, such as the use of multiple stages and/or passes, have been incorporated in large-scale RO plants to overcome the drawbacks of the RO process of a single stage in which the large, applied pressure results in avoidable energy dissipation and a high initial permeate flux.
In membrane-based water treatment processes, membrane fouling is an unavoidable fact that can significantly affect the performance, operation, sustainability, and economic viability of the processes, with concentration by polarization being one of these mechanisms. Several correlations exist for a quantitative description of this phenomenon [10,32,33].

1.1.1. Mathematical Modeling

For Ersoy and Moscardini [34], a mathematical model is used to describe real problems as mathematical equations, and they are solved using different approaches. Sarker and Newton [35] indicate that the most frequently applied mathematical model is optimization or mathematical programming. This consists in maximizing or minimizing an objective function by systematically choosing input values within a set that stratifies some restrictions. They also point out that optimization is the way to find the best solution to a problem by analyzing several alternatives.
For Walker et al. [36], mathematical modeling and optimization in engineering allow the manipulation of design parameters to meet certain objectives and/or to help predict system performance. For their part, Yang and Koziel [37] state that the uncertainty of real systems and the costs involved in pilot experimental plants make mathematical models valuable, but more complex, such that they must be developed in a way that matches reality.
The development of a mathematical model that adequately expresses the performance of the RO process is essential in order for the final design of the system to be implemented to be optimal and efficient, whilst also allowing a reduction in costs during its implementation [38]. In this sense, several mathematical models have been proposed to describe mass transfer and hydrodynamic permeability in RO systems [5].

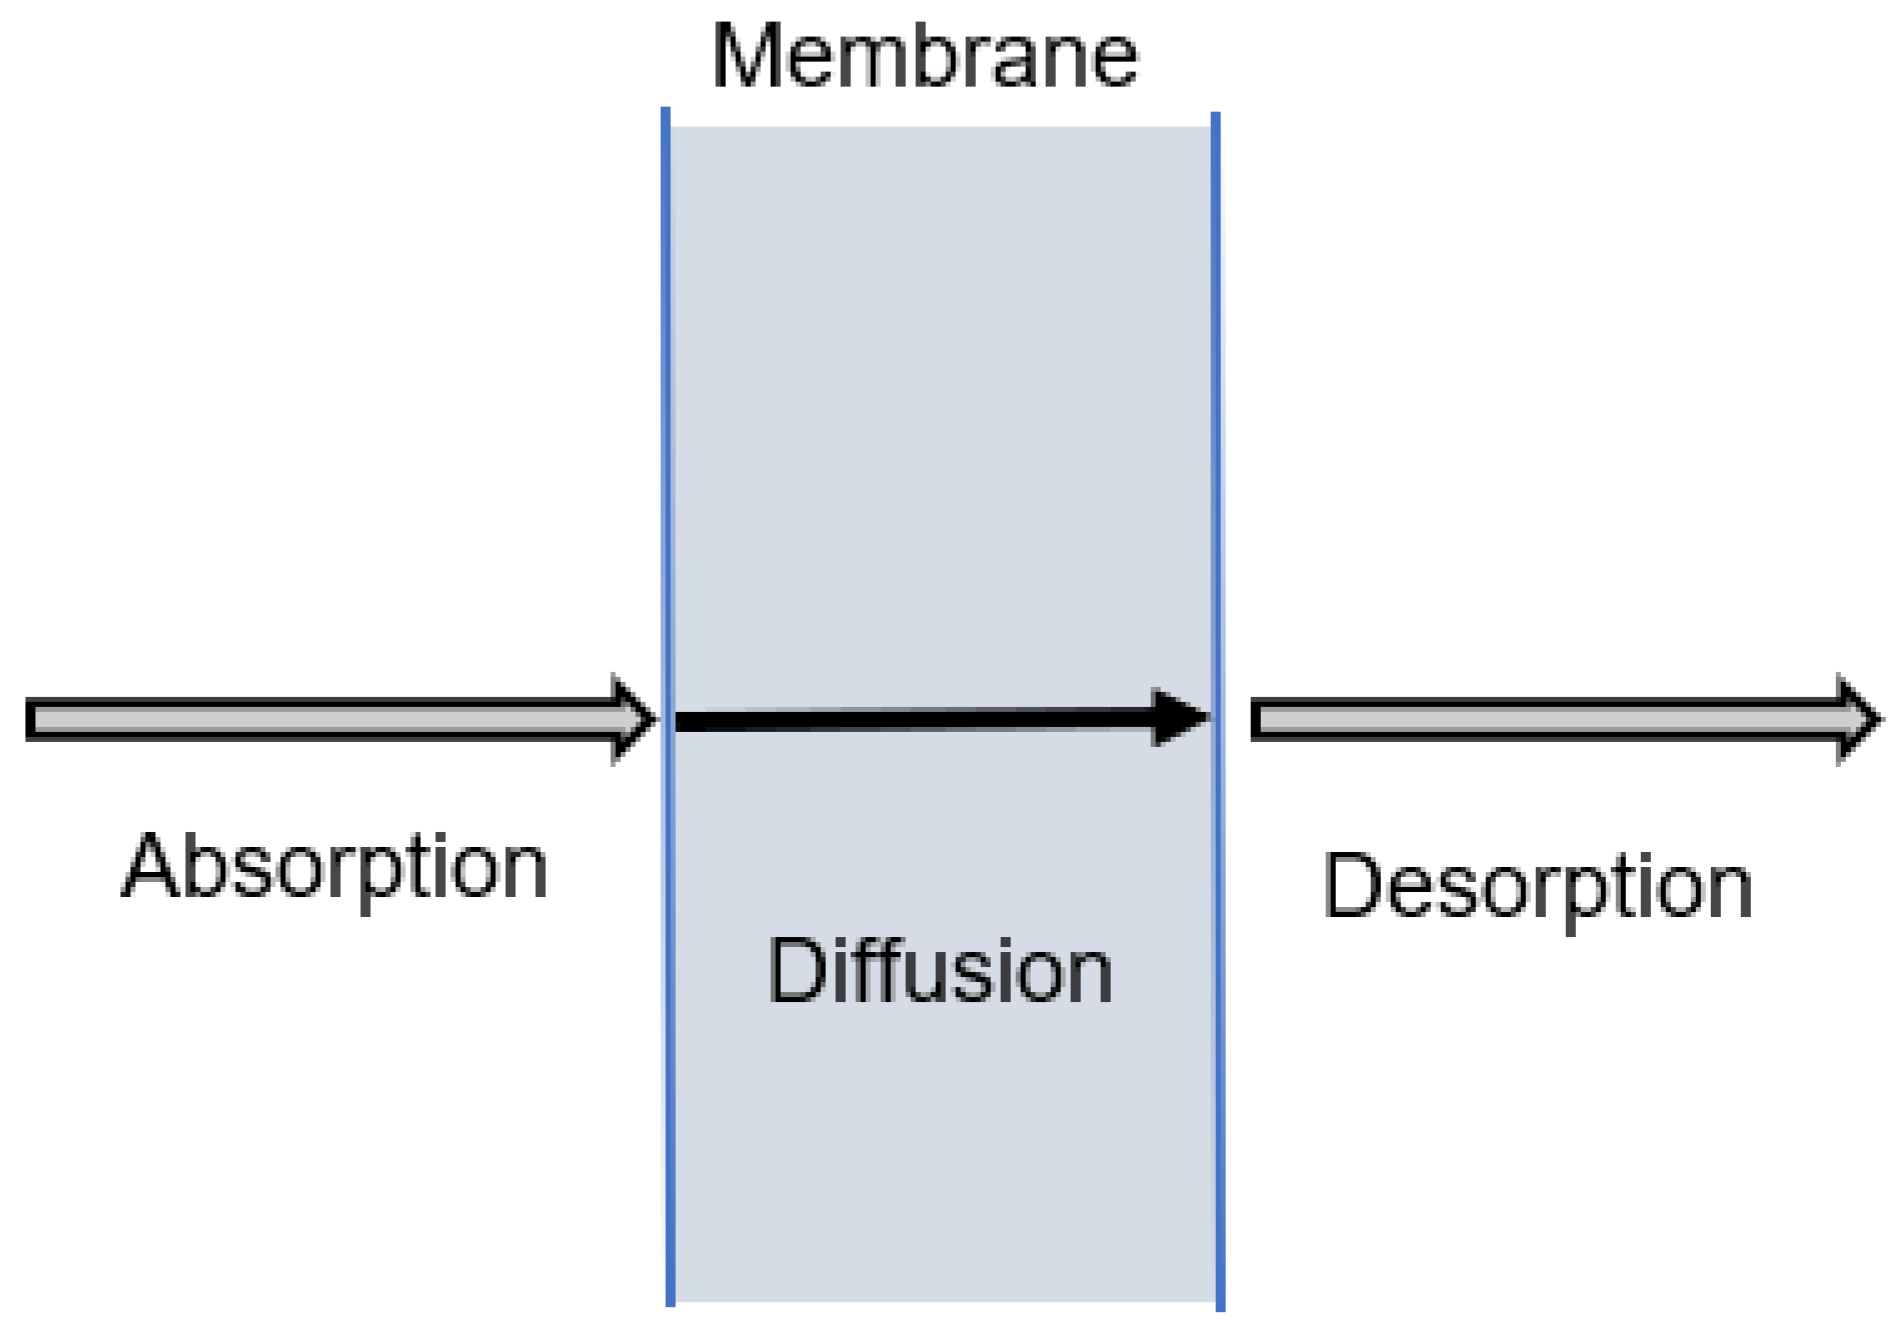
1.1.2. Membrane Modeling Approaches

Ahmed et al. [30] states that mathematical modeling techniques for membrane desalination processes have improved significantly in the last decade. Van der Bruggen [39] points out three benefits in modeling pressure-driven membrane separation processes. In the first instance, it helps to predict the behavior of the system and compare the different membranes. Secondly, the modeling allows a better understanding of the mechanisms that govern the permeate and rejection in the system. Thirdly, the models allow the generation of a monitoring process to find the factors that affect the performance of the process.
The modeling and optimization of solute separation processes by membranes has been critically reviewed in the last five years regarding the phenomena of transport and mass transfer, energy consumption, and fouling, etc. in technologies such as RO or multistage flash (MSF) [30].

1.1.3. Mathematical Modeling in Reverse Osmosis

In the 1960s, the solution diffusion model was developed, which—to date—continues to be the most widely used in RO separation processes. The model describes transport through a semi-permeable RO membrane [40]. In this model, the transfer of the solution (solute and solvent) through the membrane occurs in three steps: absorption to the membrane, diffusion through the membrane, and desorption from the membrane. Figure 1 illustrates the solution diffusion scheme.
The diffusion model of the solution is explained with Equations (1) and (2).
J v = L p ( Δ p σ Δ π )
J s = B s   ( C δ , 1 C p ) + ( 1 σ ) · J v · C s = J v · C p
where:
Jv and Js = the flux of the solvent and solute, respectively
Lp = the solvent permeability coefficient (the membrane permeability of water)
Δp = the transmembrane pressure or system operating pressure
Δπ = osmotic pressure
σ = reflection coefficient
Bs = solute transport coefficient
Cδ,1 = solute concentration at the membrane surface (feed side)
Cp = solute concentration in the permeate
Cs = solute concentration within the membrane
A mathematical model that makes it possible to analyze the physical behavior of the membrane in relation to operating variables such as pressure and solute concentration is the model proposed by Spiegler-Kedem [41], which considers the CP phenomenon in OI. Figure 2 outlines the mass transfer model due to the increase in concentration in the area near the membrane (inner layer) due to the accumulation of retained solute.
The scheme allows us to interpret the fact that an RO system assumes that the flow and solute concentration at distances greater than δ are constant due to turbulence. However, near the membrane is the boundary layer, where the concentration increases, and can reach a maximum on the surface of the Cδ1 membrane, generating the concentration by polarization [5,43].
The Spiegler-Kedem model [24,41] indicates that the transport of solutes through a membrane can be described with the principles of irreversible thermodynamics (IT), which relates the solvent and solute fluxes with transport coefficients that are, in turn, independent of solute concentration [44]. Equations (1) and (2), as previously detailed, pose the basic behavior of the model.
Equations (3)–(6) show the mathematical model of concentration polarization in RO.
The relationship between Qp and Jv is shown in Equation (3):
J v   =   Q p S
where:
S = the effective area of the membrane
Qp = the permeate flow
The recovery, y, is the water production capacity, and is defined as the fraction of the feed flow that passes through the membrane. The greater this flow, the greater the production capacity of the RO system; this value is determined with Equation (4):
y   =   Q p Q f   × 100
The rejection coefficient that is represented in Equation (5) compares the solute concentration in the inflow stream, Cf, with respect to the solute concentration in the permeate stream, Cp.
R o = C f C p   C f  
The temperature variation during the experimental process generates a variation of the Lp parameter, such that it must be adjusted with the Arrhenius equation [28]:
J v   =   L po · e x p Δ H R ( 1 T 1 T o ) ·   [ Δ p σ . R . T ( C f C p ) e x p J v k ]

1.2. RO Optimization Modeling

Ahmed et al. and Zarzo and Prats [30,45] state that energy consumption in an RO system is between 50 and 60% of the total cost of the process, with this being the key factor for the use of any technology.
Between 1970 and 2022, the energy consumption in an RO system was reduced by 80% due to lower energy consumption in each of the components of the RO plant. Such is the case for the pretreatment system, high-pressure pumps, the material and configuration of the membrane, energy recovery devices, and post-treatment [45]. Initially, the energy consumption exceeded 15 kWh/m3; today, and with the new advances in general, the consumption is in the order of 2.5 kWh/m3 [45].
Ahmed et al. [30] point out that an adequate optimization of the system and greater energy reductions can be achieved with an adequate plant configuration, which can be achieved first through simulations before pilot-scale experimental tests. Geise et al. [46] state that the configuration of the membrane is fundamental for the reduction of energy consumption, where part of the driving force is the balance between the selectivity and permeability of the membrane.
In terms of energy consumption, several alternatives for the operation of the system were compared. Lin and Elimelech [47] compared two-stage reverse RO (SSRO) systems against a single-stage closed-loop (CC-RO). In the first case, the reject stream from the first stage is converted into feed for the second stage, while for the single-stage system, the reject is mixed with the feed stream that passes back through the membrane. The results show that the single-stage system in a closed circuit is less efficient than a two-stage system because it needs more energy to reduce the entropy generated by the mixture of the rejection to the feed flow [31]. Figure 3 illustrates the operating scheme of the indicated RO systems and a comparison of their energy consumption.
In another investigation, Chong and Krantz [48] propose a low-consumption (EERO) system in which they seek to increase the overall water recovery by sending the retentate from one or more two-stage (SSRO) systems as feed to a countercurrent membrane cascade with recycling (CMCR). This consists in one or more low-salt-rejection RO stages (Stage 1) and high-salt-rejection stages (Stage 2). The results show a lower osmotic pressure differential and thus a lower net specific energy consumption [30]. Figure 4 shows the scheme proposed by Chong and Krantz [48].
King and Hong [49] propose a partial split single-pass system (SSO-RO) in which permeate from only the back RO elements in a pressure vessel is mixed with the RO feed to dilute the feed. This results in a high-quality permeate with lower energy demand. The modeling carried out shows that the energy efficiency is maximized for the process when the permeate of the last element is mixed with the feed. This modified process is up to 15% more efficient in permeate purity and energy efficiency than a normal two-step system [30].
An improvement to the RO system which is proposed to achieve a more uniform flow distribution throughout a pressure vessel is to use a hybrid membrane configuration known as internal staged design (ISD). This system involves the use of low-flux membranes in the front and high-flux membranes in the rear elements [50,51]. This system allows a significant reduction in permeate costs by requiring fewer pressure vessels and fewer membranes [52,53]. Figure 5 illustrates the proposed scheme.
Han et al. [51] improved the system using three different types of RO membranes: high rejection, standard, and high flux. In an experimental boron rejection process, they showed that using three standard membranes at the front and four high-flow membranes at the back, energy savings of 0.41 kW/m3 were achieved.
Jeong et al. [54] proposes a model based on a finite difference approximation that allows a better numerical optimization of the ISD system in the presence of colloidal fouling. Compared to conventional designs in which the same membrane is incorporated throughout the vessel, the ISD resulted in higher water flow and higher energy efficiency for long-term operation, without compromising the permeate quality (<400 mg/L). Figure 6 illustrates the proposal [54].
Kotb et al. [55] point out that optimization studies require complex or highly non-linear models with many restrictions. They implemented a simple transport model to determine the operating parameters corresponding to the optimal structure of the RO system, that is, one-, two-, and three-stage arrangements with respect to the minimum cost of permeate production for a given permeate flow rate with the maximum total dissolved solids [30].
They suggest that the optimal permeate flow rate increases with the number of stages; while a single-stage RO system is suitable for up to 6 m3/h, three-stage modules are suitable for production up to 20 m3/h [30].

1.3. Statistical Modeling

The use of statistical models to analyze the separation process in RO is essential to knowing the behavior of an RO plant and analyzing the input and output data [16].
Subramanni and Panda [16], in their research carried out on a desalination process by RO, use statistical regression for the analysis of the experimental modeling. Among the most important conclusions, they point out that the statistical model allows a better understanding of the behavior of the plant’s mechanism and the interaction between the input and output variables through the formulation of statistical models. The ANOVA analysis shows that the total dissolved solids of the permeate is affected by the change in the system recycle ratio. They also point out that the proposed statistical model is useful for the planning, monitoring, and analysis of the separation system.
Miyamoto et al. [56] statistically examined the performance of the sediment density index (SDI) and defined a new fouling index, defined as the “coefficient of permeation”. The research was carried out in a desalination process under normal environmental conditions, where they statistically analyzed the relationships between the amount of filtered water, the elapsed time, and the environmental factors in order to obtain new knowledge about the performance and deficiencies of the use of SDI from a statistical point of view.
Khajet and Cojocaru [57] performed the modeling and optimization of the air-gap membrane distillation process using the response surface methodology. The optimization of a solar-powered desalination plant was evaluated through the response surface methodology [58].
Khajet et al. [58] investigated the optimization of an RO plant using solar-powered energy through statistical response surface modeling. They applied the orthogonal type methodology [59] for the design of the experiments and a minimum number of experimental runs—as proposed by Taguchi et al. [60]—with simultaneous temperature variations, which allowed them to develop a predictive model of salt rejection, permeate flux, and the RO specific performance index. The results obtained from the analysis of variance (ANOVA) confirm that the response surface models developed are statistically validated in order to simulate the RO process. They establish, for example, that for a drinking water production of 0.2 m3/day they use an energy consumption of only 1.2 to 1.3 kWh/m3.
In another investigation, Mohsen and Salen [61] evaluated the performance of an RO plant in Wadi Ma’in, Zara, and Mujib to present the state of the art of its operation and maintenance. They collected detailed information on plant design and engineering, water quality, plant personnel, and the cost of operation and maintenance since the plant was commissioned. They analyzed for 150 days the performance of the RO desalination process in terms of recovery, permeate flux, normalized permeate flux during the erratic period, normalized differential pressure throughout the RO system, and salt rejection, and obtained the state of the system operation and maintenance.
Khajet and Cojocaru [57] used the response surface methodology for the statistical design of the experiment, which allowed them to evaluate an air gap membrane desalination process. They developed and statistically validated two regression models, one for the performance index and one for the specific performance index that considers energy consumption. The temperature is the one that has the greatest positive effect on the performance index and the feed flow rate for the specific performance index.
De-wei et al. [62], meanwhile, used quadratic dynamic matrix control (QMDC), which is a model-based predictive control (MPC) strategy to evaluate and control an RO desalination system. For the QMDC controller, they installed a field-programmable gate array (FPGA) chip and operator using software developed for this purpose. The results showed that the proposed system performs better than the traditional proportional, integral and derivative (PID) controller systems.
Feo et al. [63] analyzed the production capacities and costs in production lines in small RO plants in the Canary Islands. For this purpose, they developed a mathematical model based on expressions related to costs based on production capacity. They collected and processed statistical data. They plotted all of the cost data on bar charts and box-and-whisker plots. They performed the study of outliers, as well as Kolmogorov-Smirnov and Shapiro-Wilk tests based on the Hubera M-wave, Tukey biweight, Hampel M, and Andrew’s estimators. Subsequently, factorial analysis was performed using the Bartlett and Kaiser-Meyer-Olkin tests; they then analyzed the possible mathematical models.
The response surface model was proposed by Box and Wilson [64], and is very useful for the modeling and analysis of the results obtained in applications where the response of interest is influenced by different variables, and where the objective is to optimize said response. Its main advantage, compared to other models that relate a variable at three levels, is that it provides the minimum number of experimental runs. An economic design does so from the point of view of reagents, sample quantification, the payment of external checks, and energy, among others [65].
In order to form the MSR, it is necessary to consider several phases or steps, one of them being the exploration of the optimal response region, through 2k full factorial experiments or the option of 2k−p fractional factorial designs. This is necessary in order to determine a smaller number of experiments [66].
Taguchi contributed to the dissemination of the design of experiments because this, unlike what happens with classical design, does not require being an expert in the method in order to be able to apply it [60].
Taguchi’s method manages to solve design of experiments problems in a practical way. The use of the classic design generally implies the allocation of more resources to experimentation (a greater number of experimental units, more personnel involved, more time, a special place may even be required for experimentation because there are more replicas, and efforts to maintain a homogeneous the experimental conditions, among others). In some cases, the Taguchi method constitutes the only possible way for companies to carry out experimentation [67].
Likewise, it should be pointed out that Taguchi’s method would not be viable if its conclusions were not certain. The reliability of the results obtained through the design of experiments proposed by Taguchi [60] is given by the power of the AO, that is, the power of the ANOVA (ANalysis Of Variance).

2. Goals

The objective of this study is to review the main mathematical and statistical simulation models in RO, and to ascertain their limitations and advantages in order to optimize the design of RO plants at an industrial level. The analysis will focus on making a comparison of the mathematical models with respect to the statistical ones, and comparing the feasibility of their application on a future scale in water treatment plants. A methodology is proposed to identify and choose the most appropriate model.

3. Review and Analysis Process

After the detailed description of each model presented in the introduction, a comparative analysis was carried out. The study analyzes the following characteristics of each model based on a bibliographic analysis:
-
The type of model applied
-
Reverse osmosis system efficiency considerations
-
Ease of operation
-
Economic criteria
-
Energy efficiency
-
The efficiency and effectiveness in the results of contaminant rejection and flux production
A total of 67 publications were analyzed for this study. The criteria for the selection of these publications are:
-
Keywords: reverse osmosis, mathematical model, statistical model, heavy metals;
-
Databases: Scopus, Google Scholar;
-
Main conclusions: physical analysis of the membrane, energy efficiency in the process, main operating variables of the process.

4. Results

A total of 10 models were detected: the concentration polarization mathematical model, four optimization models, and four statistical models. Table 1 shows the characteristics of each model.
The Kedem model describes the physical behavior of the reverse osmosis membrane. In experiments on a laboratory scale [42], it was shown that at low pressures, 5 to 10 bar, an efficiency in the removal of heavy metals of up to 99% is achieved.
This model allows the observation of the physical/chemical phenomena that govern reverse osmosis, such as the temperature, the concentration of the solute in the solution, or the rate of entry of the feed flow to the membrane. It is shown, for example, that the flux decreases up to 40% with increases in the concentration of contaminants, as Chenghan and Han’s [5] research shows.
Chenghan also demonstrates, in his research, that when the inlet flow increases, the transmembrane pressure decreases; this confirms that a mathematical model shows that the system can be efficient at low pressures.
The use of a suitable reverse osmosis technology achieves significant energy savings. The optimization models allow an adequate choice of material and configuration of the membranes, allowing energy savings of up to 83% with new technologies, as Zarzo and Prats suggest [45].
The Lin and Elimelech configurations [31] of one-stage, two-stage and closed circuits quantitatively show how the average water flow rate increases with increasing applied pressure and the consequent increase in specific energy consumption (SEC). The model also shows that fouling, solute rejection, and industrial fouling are physical factors that determine proper system performance. It is also evident that the rate of recovery of the average flow of water is in the order of 50 for configurations of one stage, while for two or more it reaches up to 90% [31].
The Chong and Krantz [48] model, called energy-efficient reverse osmosis (EERO), also shows adequate water recovery rates reaching up to 75%, at a lower cost, compared to a normal one-stage system that only reaches up to 50%. They also point out that the model can reduce significant costs in pretreatment, reaching 3.7% in configurations 1-2 and up to 6.2% in configurations 2-2 of the EERO.
The King and Hon System [49], called divided partial single pass (SSP-RO), with a configuration of seven elements placed in series, has shown that the highest energy efficiency occurs when the permeate in the seventh element is recirculated and mixed with the startup feeding. This proposal generates a purer permeate of up to 15% higher than the conventional system. However, this method is not applied in practice.
The numerical modeling proposed by Jeong et al. [54], called internally staged design (ISD), improves recovery rates and long-term energy efficiency compared to conventional systems. However, as in other systems, the efficiency particularly depends on the fouling potential.
The results of the statistical modeling of Subramanni and Panda [16] indicate that regression models show the interaction between the input and output variables, e.g., how the permeate is affected by the feed rate. He also points out that this analysis allows the adequate planning of the system, and that it also allows the analysis of the sensitivity of the parameters towards production.
In the research by Miyamoto et al. [56], it is illustrated how the performance of the silt density index (SDI) can be statistically examined in order to find a new index or permeability coefficient; however, this proposal requires further field tests.
In the research carried out by Khajet et al. [57,58], they use the response surface model to analyze the behavior of a reverse osmosis system. They used two regression models, the first to evaluate the rejection rate and the other to evaluate energy consumption. Statistically they show, for example, that the inlet temperature has a positive effect. Flow rate has small positive effects; however, temperature cooling has small negative effects, reducing performance ratings.
With the response surface models, they determined two optimal operating conditions in order to ensure the optimization cases. For the first case, these were a cooling inlet temperature of 13.9 °C, a feed inlet temperature of 71 °C, and a feed flow rate of 183 L/h. Under these conditions, the experimental performance index, 47,189 kg/m2 h, turned out to be the highest value in this study. For the second case, the optimal solution was found to be a cooling inlet temperature of 13.9 °C, a feed inlet temperature of 59 °C and a feed flow rate of 205 L/h. Under these plant operating conditions, a maximum specific yield index of 188.703 kg/kWh and a specific energy consumption of 5.3 kWh/m3 were experimentally obtained [57].
The study developed by Feo et al. [63] provides an innovative aspect in cost analysis because the study focused exclusively on the search for more technologically efficient production lines with less impact on costs for the plant. The proposed equation corresponds to the mathematical model based on statistical data adjusted to 98% of the real cost for small desalination plants in ranges between 500 and 15,000 m3/d.

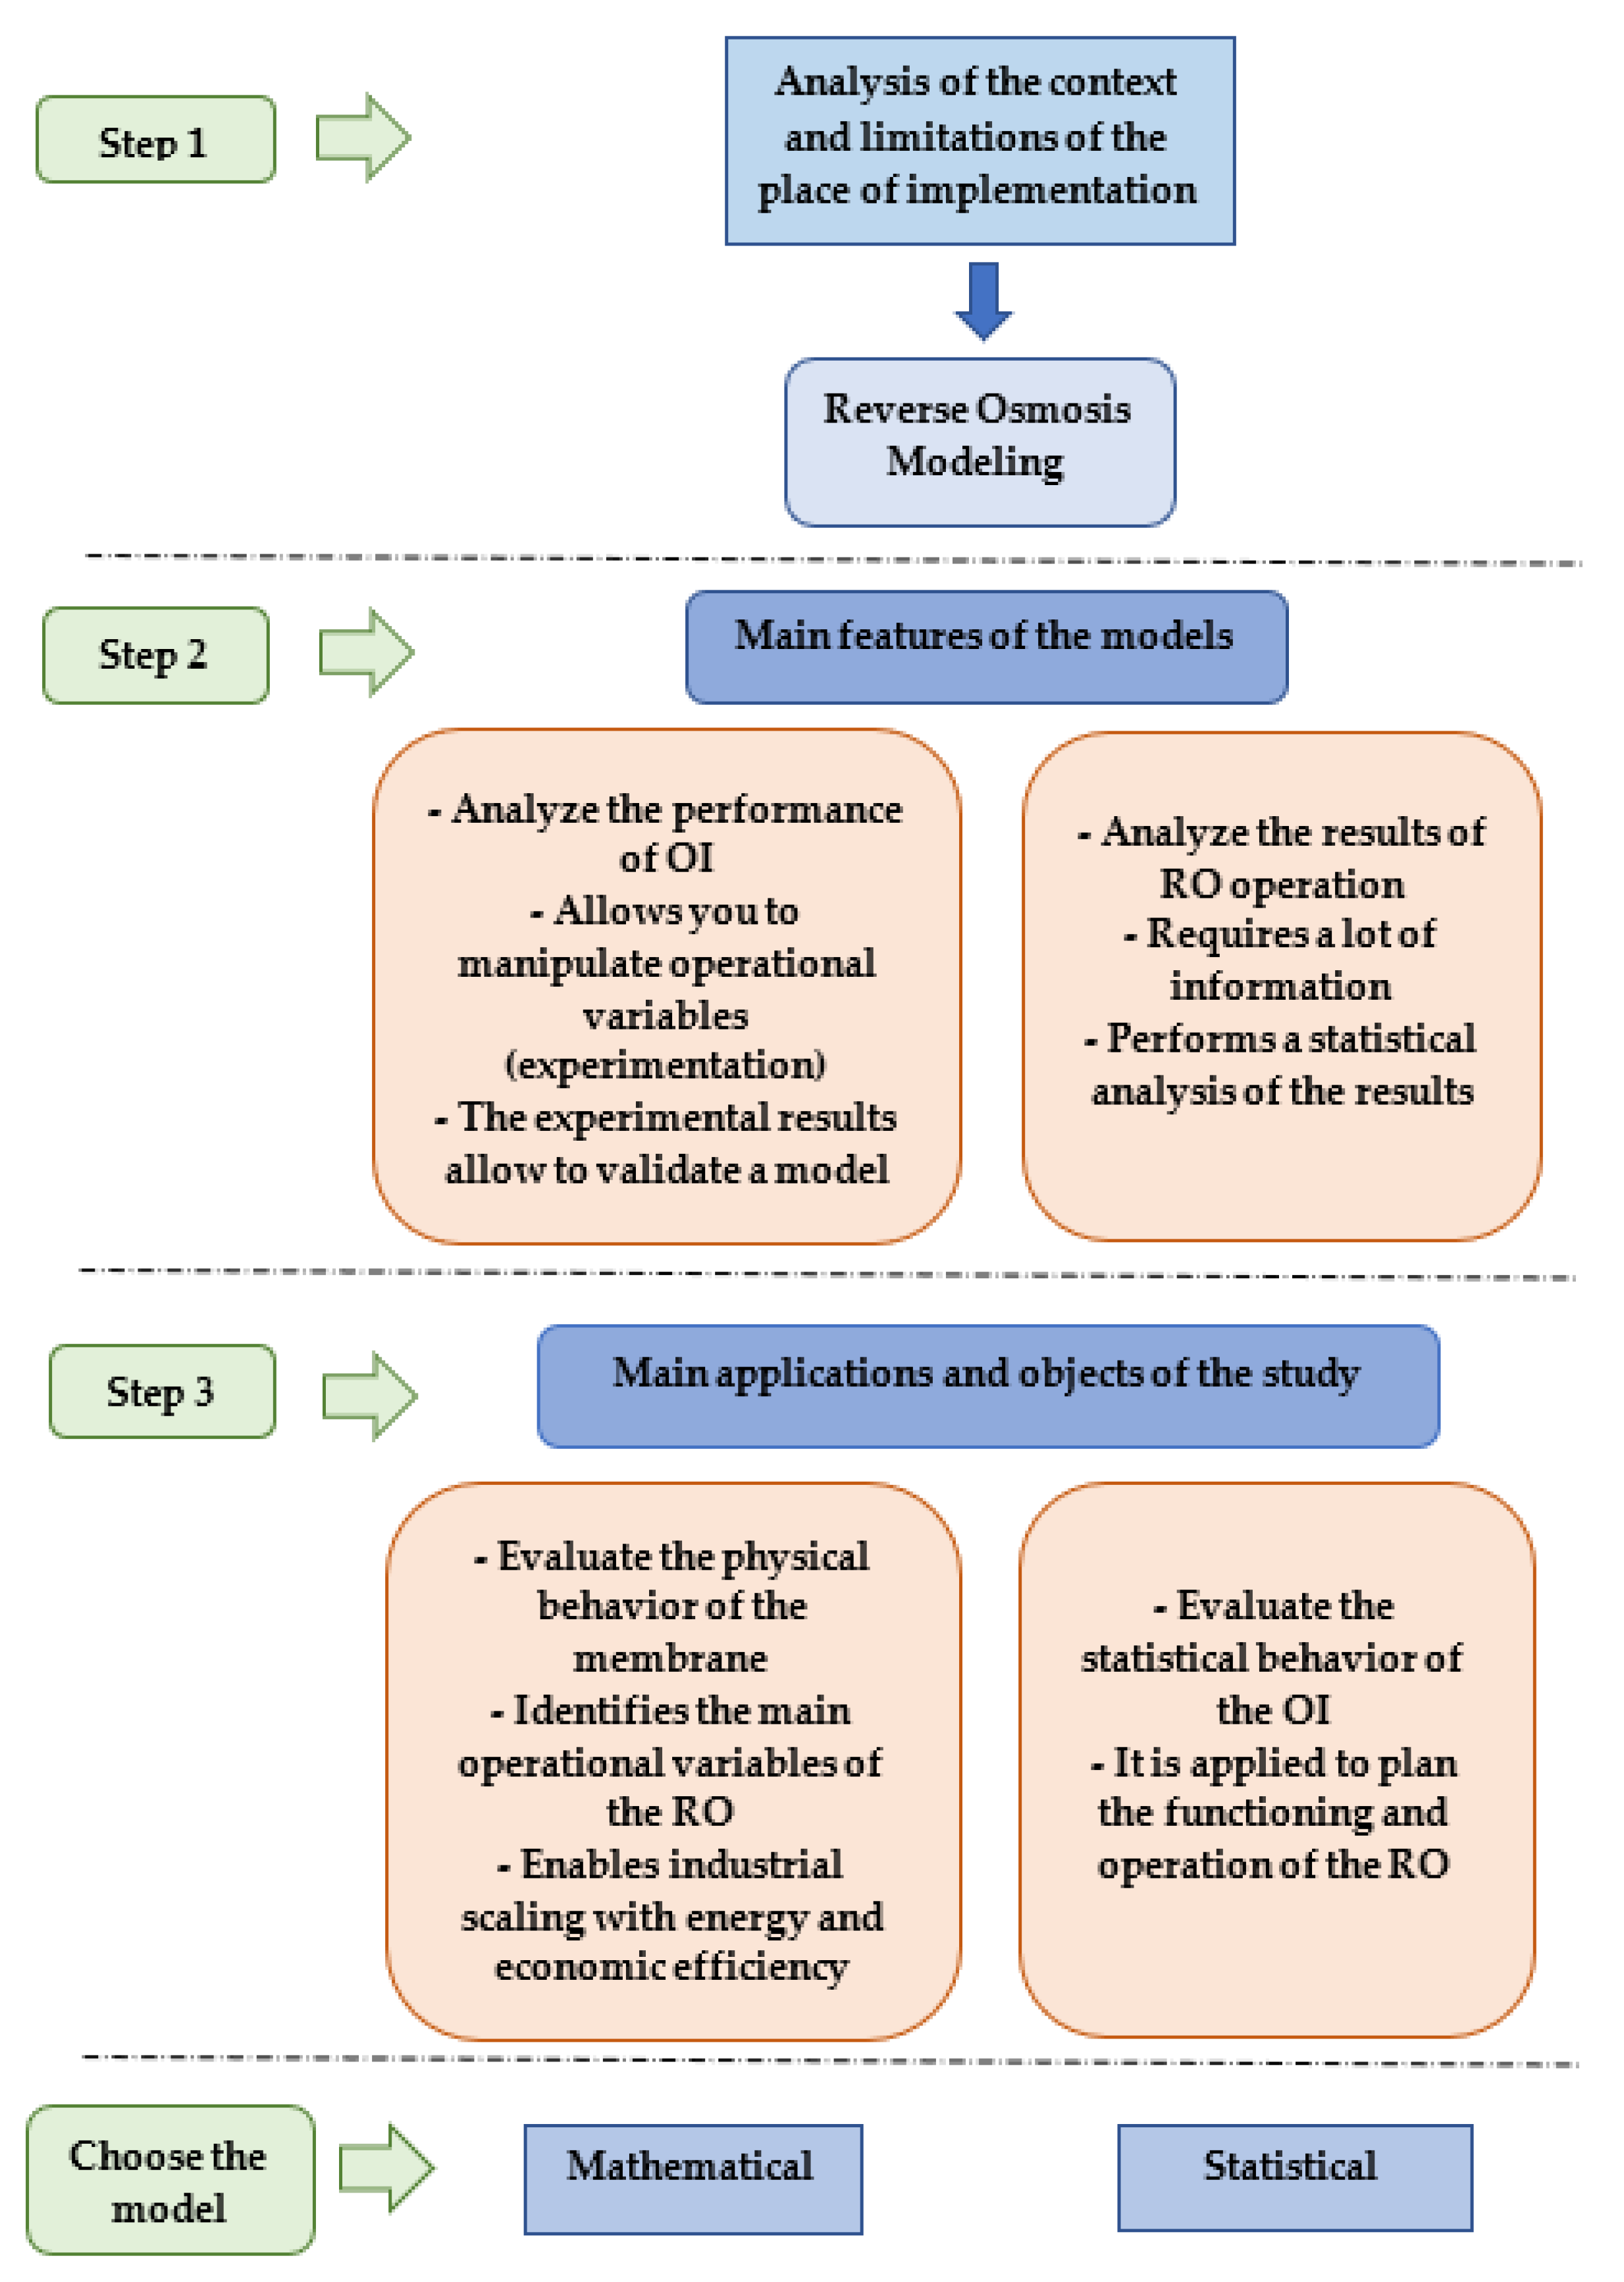
Mechanism for the Identification and Application of the Model

The diagram in Figure 7 summarizes the mechanism for the identification of the ideal model to be implemented, based on the main characteristics and applications of both models.
The scheme details a mechanism to choose a suitable model based on the main characteristics and uses of the RO system.
The first step is to define the context and the limitations of the place where you want to implement the RO. The second step is to ascertain the main characteristics of each model. The third step is to define the information available and the objective of the analysis. For plan operation and control from a set of RO system operational data, the approach suggests a statistical model; this is a suitable model at the scale at which one wants to improve one’s planning and operation. If we need greater energy efficiency in industrial scale-up based on the physical behavior of the membrane, this model is suitable for new scale-ups that require lower energy consumption.
A mathematical model may be more suitable for new scale-ups and for countries with economic limitations.

5. Conclusions

Mathematical models make it possible to evaluate the physical behavior of the membrane, identify the operating variables that govern its operation, and allow greater energy savings to be achieved. On the other hand, statistical models are efficient for administrative, economic and operational planning.
The mathematical model of Spiegler and Kedem allows the evaluation of the physical behavior of the membrane. It shows the behavior of the membrane before the variability of the operating conditions, such as the increase in solute concentrations, variations in the transmembrane pressures, or changes in temperature.
Mathematical models allow the definition of the best operating conditions, taking into account economic and energy saving aspects. This is very important in order to implement RO technology in developing countries with water pollution problems. This consideration coincides with that described by [29], which indicates that lower energy consumption can be achieved with low operating pressures.
The optimization model based on open flow with longitudinal and parallel scaling is the one that shows the best performance and energy efficiency. There are also systems that have a simpler operating process.
The statistical models provide a wide range of information that allows the prediction of the operation of the plant, and allows us to obtain efficiency indices in its development. Response surface models and the orthogonal method allow the low-cost design of experiments for a simulation process. They are useful in order to understand the effect of the interaction of the parameters on the result of the process. Statistical models are also useful in the process of planning, operating and monitoring an RO plant. However, these do not show the physical behavior of the membrane.
In order to implement RO in countries where this system is not conventional, it is necessary to apply a mathematical model. A statistical model can be efficient for the programming of its operation and maintenance.
A methodological mechanism is proposed to identify and choose a suitable model for the evaluation of RO systems based on the review of different mathematical and statistical models, and what their main characteristics and uses are.

Author Contributions

E.M.V.-M.: Investigation, Conceptualization, Methodology, Writing—Original Draft Preparation. P.A.A.-T.: Investigation, Conceptualization, Methodology, Writing—Original Draft Preparation, Writing—Review and Editing. J.L.-G.: Data curation, Investigation, Data curation, Formal analysis, Validation. J.I.T.-L.: Project administration, Funding acquisition. V.G.L.-I.-F.: Visualization, Supervision, Writing Review and Editing. All authors have read and agreed to the published version of the manuscript.

Funding

This work was supported by the Universidad Católica Boliviana “San Pablo”—Academic Units of La Paz and Tarija, and by the Universitat Politècnica de Valencia through the ADSIDEO-2018 project.

Institutional Review Board Statement

Not applicable.

Informed Consent Statement

Not applicable.

Data Availability Statement

Not applicable.

Acknowledgments

The authors appreciate the support of the national and regional authorities of the Universidad Católica Boliviana “San Pablo”. The research was carried out with the support of the Department of Engineering and Exact Sciences of the Universidad Católica Boliviana headquarters Tarija, and the Center for Research in Water, Energy and Sustainability (CINAES) of the Environmental Engineering career of the Bolivian Catholic University “San Pablo” headquarters, La Paz.

Conflicts of Interest

The authors declare that they have no known competing financial interests or personal relationships that could have appeared to influence the work reported in this paper.

References

  1. Intaraburt, W.; Sangsanont, J.; Limpiyakorn, T.; Ruangrassamee, P.; Suttinon, P.; Suwannasilp, B.B. Feasibility Study of Water Reclamation Projects in Industrial Parks Incorporating Environmental Benefits: A Case Study in Chonburi, Thailand. Water 2022, 14, 1172. [Google Scholar] [CrossRef]
  2. Atab, M.; Smallbone, A.; Roskilly, A. A hybrid reverse osmosis/adsorption desalination plant for irrigation and drinking water. Desalination 2018, 444, 44–52. [Google Scholar] [CrossRef]
  3. Shigidi, I.; Anqi, A.E.; Elkhaleefa, A.; Mohamed, A.; Ali, I.H.; Brima, E.I. Temperature Impact on Reverse Osmosis Permeate Flux in the Remediation of Hexavalent Chromium. Water 2022, 14, 44. [Google Scholar] [CrossRef]
  4. Ray, S.; Chen, S.; Sangeetha, D.; Chang, H.; Thanh, C.; Le, Q.; Ku, H. Developments in forward osmosis and membrane distillation for desalination of waters. Environ. Chem. Lett. 2018, 16, 1247–1265. [Google Scholar] [CrossRef]
  5. Chenghan, C.; Han, Q. A Mathematical Modeling of the Reverse Osmosis Concentration Process of a Glucose Solution. Processes 2019, 7, 271. [Google Scholar] [CrossRef]
  6. Chung, T.; Zhang, S.; Wang, K.; Su, J.; Ling, M. Forward osmosis processes: Yesterday, today and tomorrow. Desalination 2012, 287, 78–81. [Google Scholar] [CrossRef]
  7. Khulbe, K.C.; Matsuura, T. Removal of heavy metals and pollutants by membrane adsorption techniques. Appl. Water Sci. 2018, 8, e19. [Google Scholar] [CrossRef]
  8. Ray, S.; Chen, S.; Nguyen, N.; Nguyen, H.; Dan, N.; Thanh, B. Exploration of polyelectrolyte incorporated with Triton-X 114 surfactant based osmotic agent for forward osmosis desalination. J. Environ. Manag. 2018, 209, 346–353. [Google Scholar] [CrossRef]
  9. Feria-Díaz, J.J.; Correa-Mahecha, F.; López-Méndez, M.C.; Rodríguez-Miranda, J.P.; Barrera-Rojas, J. Recent Desalination Technologies by Hybridization and Integration with Reverse Osmosis: A Review. Water 2021, 13, 1369. [Google Scholar] [CrossRef]
  10. Saravanan, A.; Senthil Kumar, P.; Jeevanantham, S.; Karishma, S.; Tajsabreen, B.; Yaashikaa, P.R.; Reshma, B. Effective water/wastewater treatment methodologies for toxic pollutants removal: Processes and applications towards sustainable development. Chemosphere 2021, 280, e130595. [Google Scholar] [CrossRef]
  11. Sablani, S.S.; Goosen, M.F.A.; Al-Belushi, R.; Wilf, M. Concentration polarization in ultrafiltration and reverse osmosis: A critical review. Desalination 2001, 141, 269–289. [Google Scholar] [CrossRef]
  12. Soltanieh, M.; Gill, W. Review of reverse osmosis membranes and transport models. Chem. Eng. Commun. 1981, 12, 279–363. [Google Scholar] [CrossRef]
  13. Sherwood, T.K.; Brian, P.L.T.; Fisher, R.E. Desalination by reverse osmosis. Ind. Eng. Chem. Fundam. 1967, 6, 2–12. [Google Scholar]
  14. Kedem, O.; Katchalsky, A. Thermodynamic analysis of the permeability of biological membranes to non-electrolytes. Biochim. Biophys. Acta 1958, 27, 229–246. [Google Scholar]
  15. Abbas, A. Model predictive control of a reverse osmosis desalination unit. Desalination 2016, 194, 268–280. [Google Scholar] [CrossRef]
  16. Subramani, S.; Panda, R. Statistical regression and modeliing analysis for reverse osmosis desalination process. Desalination 2014, 351, 120–127. [Google Scholar] [CrossRef]
  17. Garrido, A.E.; Strosnider, W.H.; Wilson, R.T.; Condori, J.; Nairn, R.W. Metal-contaminated potato crops and potential human health risk in Bolivian mining highlands. Environ. Geochem. Health 2017, 39, 681–700. [Google Scholar] [CrossRef]
  18. Quaghebeur, W.; Mulhern, R.E.; Ronsse, S.; Heylen, S.; Blommaert, H.; Potemans, S.; Valdivia Mendizábal, C.; Terrazas García, J. Arsenic contamination in rainwater harvesting tanks around Lake Poopó in Oruro, Bolivia: An unrecognized health risk. Sci. Total Environ. 2019, 688, 224–230. [Google Scholar] [CrossRef]
  19. AlSawaftah, N.; Abuwatfa, W.; Darwish, N.; Husseini, G. A Comprehensive Review on Membrane Fouling: Mathematical Modelling, Prediction, Diagnosis, and Mitigation. Water 2021, 13, 1327. [Google Scholar] [CrossRef]
  20. Wei, W.; Zou, X.; Ji, X.; Zhou, R.; Zhao, K.; Wang, Y. Analysis of Concentration Polarisation in Full-Size Spiral Wound Reverse Osmosis Membranes Using Computational Fluid Dynamics. Membranes 2021, 11, 353. [Google Scholar] [CrossRef]
  21. Qasim, M.; Badrelzaman, M.; Darwish, N.N.; Darwish, N.A.; Hilal, N. Reverse osmosis desalination: A state-of-the-art review. Desalination 2019, 459, 59–104. [Google Scholar] [CrossRef]
  22. Fariñas, M. Osmosis Inversa. Fundamentos Tecnología y Aplicaciones; Mc GrawHill, Ente Vasco de la Ingeniería, EVE, e IBERDROLA, España: Madrid, Spain, 1999; pp. 163–168. [Google Scholar]
  23. García, C. Aplicación de Ósmosis Inversa y Nanofiltración en Acondicionamiento de Agua para Calderas. Ph.D. Thesis, Universidad de Oviedo, Asturias, Spain, 2002. Available online: https://www.tesisenred.net/handle/10803/11146 (accessed on 27 June 2021).
  24. Spiegler, K.; Kedem, O. Thermodynamics of hyperfiltration (reverse osmosis): Criteria for efficient membranes. Desalination 1966, 1, 311–326. [Google Scholar] [CrossRef]
  25. Otero-Fernández, A.; Otero, J.A.; Maroto, A.; Carmona, J.; Palacio, L.; Prádanos, P.; Hernández, A. Concentration-polarization in nanofiltration of low concentration Cr(VI) aqueous solutions. Effect of operative conditions on retention. J. Clean. Prod. 2017, 150, 243–252. [Google Scholar] [CrossRef]
  26. Al-Obaidi, M.A.; Kara-Zaïtri, C.; Mujtaba, I.M. Wastewater treatment by spiral wound reverse osmosis: Development and validation of a two dimensional process model. J. Clean. Prod. 2017, 140, 1429–1443. [Google Scholar] [CrossRef]
  27. Lora, J.; López, M.; Cardona, S.; Fombuena, V.; Carbonell, A. Análisis del consumo Energético como factor clave en proyectos de desalación de agua de mar. In Proceedings of the 24th International Congress on Project Management and Engineering, Alcoi, Spain, 7–9 July 2020; pp. 991–1003. Available online: http://dspace.aeipro.com/xmlui/handle/123456789/2486 (accessed on 22 June 2022).
  28. Mulder, M. Basic Principles of Membrane Technology; Springer Science & Business Media: Berlin/Heidelberg, Germany, 1996; pp. 246–248. Available online: https://ebookcentral.proquest.com/lib/bibliotecaupves-ebooks/reader.action?docID=3102158&ppg=1 (accessed on 22 June 2022).
  29. Alanood, A.; Al-Obajdib, M.A.; Al-Hroubc, A.M.; Patela, R.; Mujtaba, I.M. Evaluation and minimisation of energy consumption in a mediumscale reverse osmosis brackish water desalination plant. J. Clean. Prod. 2020, 248, 119220. [Google Scholar] [CrossRef]
  30. Ahmed, F.; Hashaikeh, R.; Diabat, A.; Hilal, N. Mathematical and optimization modelling in desalination: State-of-the-art and future direction. Desalination 2019, 469, 114092. [Google Scholar] [CrossRef]
  31. Lin, S.; Elimelec, M. Operación de ósmosis inversa por etapas: Configuraciones, eficiencia energética y potencial de aplicación. Desalination 2015, 366, 9–14. [Google Scholar]
  32. Gu, B.; Adjiman, C.S.; Xu, X.Y. Correlations for Concentration Polarization and Pressure Drop in Spacer-Filled RO Membrane Modules Based on CFD Simulations. Membranes 2021, 11, 338. [Google Scholar] [CrossRef]
  33. Salcedo, R.; García-Algado, P.; García-Rodríguez, M.; Fernández-Sempere, J.; Ruiz-Beviá, F. Visualization and modeling of the polarization layer in crossflow reverse osmosis in a slit-type channel. J. Membr. Sci. 2014, 456, 21–30. [Google Scholar] [CrossRef]
  34. Ersoy, Y.; Moscardini, A.O. Mathematical Modeling Courses for Engineering Education; Springer: Berlin/Heidelberg, Germany, 1993. [Google Scholar]
  35. Sarker, R.A.; Newton, C.S. Optimization Modeling: A Practical Approach; CRC Press: EEUU, Florida, 2007. [Google Scholar]
  36. Walker, D.; Leonard, M.; Metcalfe, A.; Lambert, M. Engineering Modelling and Analysis; Taylor & Francis: Abingdon, UK, 2009. [Google Scholar]
  37. Yang, X.-S.; Koziel, S. Computational Optimization and Applications in Engineering and Industry; Springer Science & Business Media: Berlin/Heidelberg, Germany, 2019; Volume 359. [Google Scholar]
  38. Sundaramoorthy, S.; Srinivasan, G.; Murthy, D. An analytical model for spiral wound reverse osmosis membrane modules: Part I—Model development and parameter estimation. Desalination 2011, 280, 403–411. [Google Scholar] [CrossRef]
  39. Van der Bruggen, B. Chapter 2—Microfiltration, ultrafiltration, nanofiltration, reverse osmosis and direct osmosis. In Fundamental Modeling of Membrane Systems, Membrane and Process Performance; Luis, P., Ed.; Elsevier: Amsterdam, The Netherlands, 2018; pp. 25–70. [Google Scholar]
  40. Ismail, A.F.; Khulbe, K.C.; Matsuura, T. Chapter 1—Introduction—Do RO membranes have pores? In Reverse Osmosis; Elsiever: Amsterdam, The Netherlands, 2018; pp. 1–24. [Google Scholar]
  41. Pontié, M.; Dach, H.; Leparc, J.; Hafsi, M.; Lhassani, A. Novel approach combining physico-chemical characterizations and mass transfer modelling of nanofiltration and low pressure reverse osmosis membranes for brackish water desalination intensification. Desalination 2008, 221, 174–191. [Google Scholar] [CrossRef]
  42. Villena, E.; Alvizuri, P.; Torregrza-López, J.-I.; Lora, J.; Lo-Iacono, V. Reverse Osmosis Pilot Plant to Removal Heavy Metals Pb, Fe, As, Zn and Mn in Consumption Waters in Bolivia. In Proceedings of the 24th International Congress on Project Management and Engineering, Alcoi, Spain, 7–9 July 2020; pp. 1252–1264. [Google Scholar]
  43. Salcedo, R. Aplicación de la interferometría holográfica al estudio de la capa de polarización en ósmosis inversa. Efecto de la convección natural. Ph.D. Thesis; Universidad de Alicante: Asturias, Spain, 2006. Available online: https://dialnet.unirioja.es/servlet/tesis?codigo=68704 (accessed on 27 June 2021).
  44. Hidalgo, A.M.; Gómez, M.; Murcia, M.D.; Serrano, J.; Otón, J. Caracterización de la membrana NF-97 mediante disoluciones salinas. Aplicación del modelo de Spiegler-Kedem-Kachalsky. Afinidad 2013, 70, 48–53. Available online: https://raco.cat/index.php/afinidad/article/view/268539 (accessed on 22 June 2022).
  45. Zarzo, D.; Prats, D. Desalination and energy consumption. What can we expect in the near future? Desalination 2018, 427, 1–9. [Google Scholar] [CrossRef]
  46. Geise, G.; Park, H.; Sagle, A.; Freeman, B.; McGrath, J. Water permeability and water/salt selectivity tradeoff in polymers for desalination. J. Membr. Sci. 2011, 369, 130–138. [Google Scholar] [CrossRef]
  47. Lin, S.; Elimelech, M. Kinetics and energetics trade-off in reverse osmosis desalination with different configurations. Desalination 2017, 401, 42–52. [Google Scholar] [CrossRef]
  48. Chong, T.H.; Krantz, W.B. Process economics and operating strategy for the energy-efficient reverse osmosis (EERO) process. Desalination 2018, 443, 70–84. [Google Scholar] [CrossRef]
  49. Kim, J.; Hong, S. A novel single-pass reverse osmosis configuration for high-purity water production and low energy consumption in seawater desalination. Desalination 2018, 429, 142–154. [Google Scholar]
  50. Voutchkov, N. Energy use for membrane seawater desalination—Current status and trends. Desalination 2018, 431, 2–14. [Google Scholar] [CrossRef]
  51. Han, D.; Hwang, M.; Kim, I.S. Effect of boron rejection and recovery rate on a single-pass design of SWRO using hybrid membrane inter-stage design (HID) concept. Desalination 2017, 404, 215–223. [Google Scholar]
  52. Peñate, B.; García-Rodríguez, L. Reverse osmosis hybrid membrane inter-stage design: A comparative performance assessment. Desalination 2011, 281, 354–363. [Google Scholar]
  53. Molina, V.G.; Busch, M.; Sehn, P. Cost savings by novel seawater reverse osmosis elements and design concepts. Desalination Water Treat. 2009, 7, 160–177. [Google Scholar]
  54. Jeong, K.; Park, M.; JinKi, S.; HaKim, J. A systematic optimization of Internally Staged Design (ISD) for a full-scale reverse osmosis process. J. Membr. Sci. 2017, 540, 285–296. [Google Scholar] [CrossRef]
  55. Kotb, H.; Ame, E.H.; Ibrahim, K.A. On the optimization of RO (Reverse Osmosis) system arrangements and their operating conditions. Energy 2016, 103, 127–150. [Google Scholar]
  56. Miyamoto, J.; Nakamura, K.; Nakamura, T. Searching for an Efficient Fouling Index for Reverse Osmosis Desalination: A Statistical Approach. In Proceedings of the 2010 International Conference on Industrial Engineering and Operations Management, Dhaka, Bangladesh, 9–10 January 2010; pp. 9–10. [Google Scholar]
  57. Khajet, M.; Cojocaru, C. Air gap membrane distillation desalination modelling and optimization. Desalination 2012, 287, 138–145. [Google Scholar] [CrossRef]
  58. Khajet, M.; Essalh, M.; Tmenta-Deu, A. Optimization of solar powered reverse osmosis desalination pilot plant using response surface methodology. Desalination 2010, 261, 284–292. [Google Scholar] [CrossRef]
  59. Tort-Martorell, J. Diseños Factoriales Fraccionales—Aplicación al Control de Calidad Mediante el Diseño de Productos y Procesos. Ph.D. Thesis, Universidad Politecnica de Catalunia, Barcelona, Spain, 1985. [Google Scholar]
  60. Taguchi, G.; Chowdhury, S.; Wu, Y. Taguchi’s Quality Engineering Handbook; John Wiley and Sons: Hoboken, NJ, USA, 2005; ISBN 047-141-334-8. [Google Scholar]
  61. Mohsen, M.; Salem, G. Performance evaluation of reverse osmosis desalination plant. A case study of Wadi Ma’in, Zara and Mujib plant. Desalin. Water Treat. 2010, 14, 265–272. [Google Scholar] [CrossRef]
  62. De-wei, L.; Yang, N.; Qui, H.; Xi, Y. FPGA based QDMC control for reverse-osmosis water desalination system. Desalination 2012, 285, 83–90. [Google Scholar]
  63. Feo, J.; Jaime, J.; Alvarez, L. Cost analysis in RO desalination plants production lines. Mathematical model and simulation. Desalin. Water Treat. 2013, 51, 4800–4805. [Google Scholar]
  64. Box, G.E.; Wilson, K.B. On the experimental attainment of optimum conditions. In Breakthroughs in Statistics; Springer: New York, NY, USA, 1992; pp. 270–310. [Google Scholar]
  65. Gil, E. Fotocatálisis: Una alternativa viable para la eliminación de compuestos orgánicos. Rev. Universidad EAFIT 2002, 127, 59–64. Available online: https://repository.eafit.edu.co/handle/10784/17256 (accessed on 27 June 2021).
  66. Guerra, C.; Ruíz, A.; Herrera, M.; Fernández, L. La Modelación Matemático-Estadística en la Metodología de Superficie de Respuesta. Apl. Agrícolas. Ing. Agrícola 2018, 8, 67–73. Available online: https://scholar.google.com.bo/scholar?hl=es&as_sdt=0%2C5&as_vis=1&q=Guerra+C.%2C+Ru%C3%Adz+A.%2C+Herrera+M.+y+Fern%C3%A1ndez+L.+2018.+La+Modelaci%C3%B3n+Matem%C3%A1tico-Estad%C3%Adstica+en+la+Metodolog%C3%Ada+de+Superficie+de+Respuesta.+Aplicaciones+agr%C3%Adcolas.+Ingenier%C3%Ada+Agr%C3%Adcola.+8%2C+67-73.&btnG= (accessed on 19 June 2022).
  67. Hernández, A.; Guillón, M.; García, L. La metodología de Taguchi en el control estadístico de la calidad. Investig. Operativa. 2015, 37, 65–83. Available online: https://revistas.unc.edu.ar/index.php/revahttp:/revistas.unc.edu.ar/index.php/epio/article/view/11986.ine (accessed on 19 June 2022).
Figure 1. Solution diffusion scheme, source [40].
Water 14 02485 g001
Figure 2. Schematic of the CP model, source [5,41,42,43].
Water 14 02485 g002
Figure 3. Energy consumption in one-stage, two-stage, and closed-loop RO systems, source [31].
Water 14 02485 g003
Figure 4. Low-consumption RO system proposed by, source [48].
Water 14 02485 g004
Figure 5. Internal staged RO system, source [50,51].
Water 14 02485 g005
Figure 6. ISD system optimization using finite difference approximation source [54].
Water 14 02485 g006
Figure 7. Schematic procedure to define the ideal model.
Water 14 02485 g007
Table 1. The main characteristics and comparison of the models.
ModelTypologyCharacteristicEfficiency and Effectiveness in the Results of Contaminant Rejection and Flux Production
Type of Model AppliedReverse Osmosis System Efficiency ConsiderationsEase of OperationEconomic CriteriaEnergy Efficiency
Concentration PolarizationMatemática—Kedem model [5,14,19,34,35,41]Physical behavior of the membraneEvidence physical/chemical phenomena that govern the processDetermine key operating variables—Shows the behavior of the system interrelating result—widely used in experimental processes [5].Energy consumption is the most important factor of the total cost—Electricity price variability generates changes in process conditions such as pressures, concentrations in permeate flows [8,9,20,21].The model allows the process to be analyzed at low pressures, identifying the most sensitive operating variables that allow industrial scaling with energy efficiency [10,38].Rejection of contaminants greater than 99%
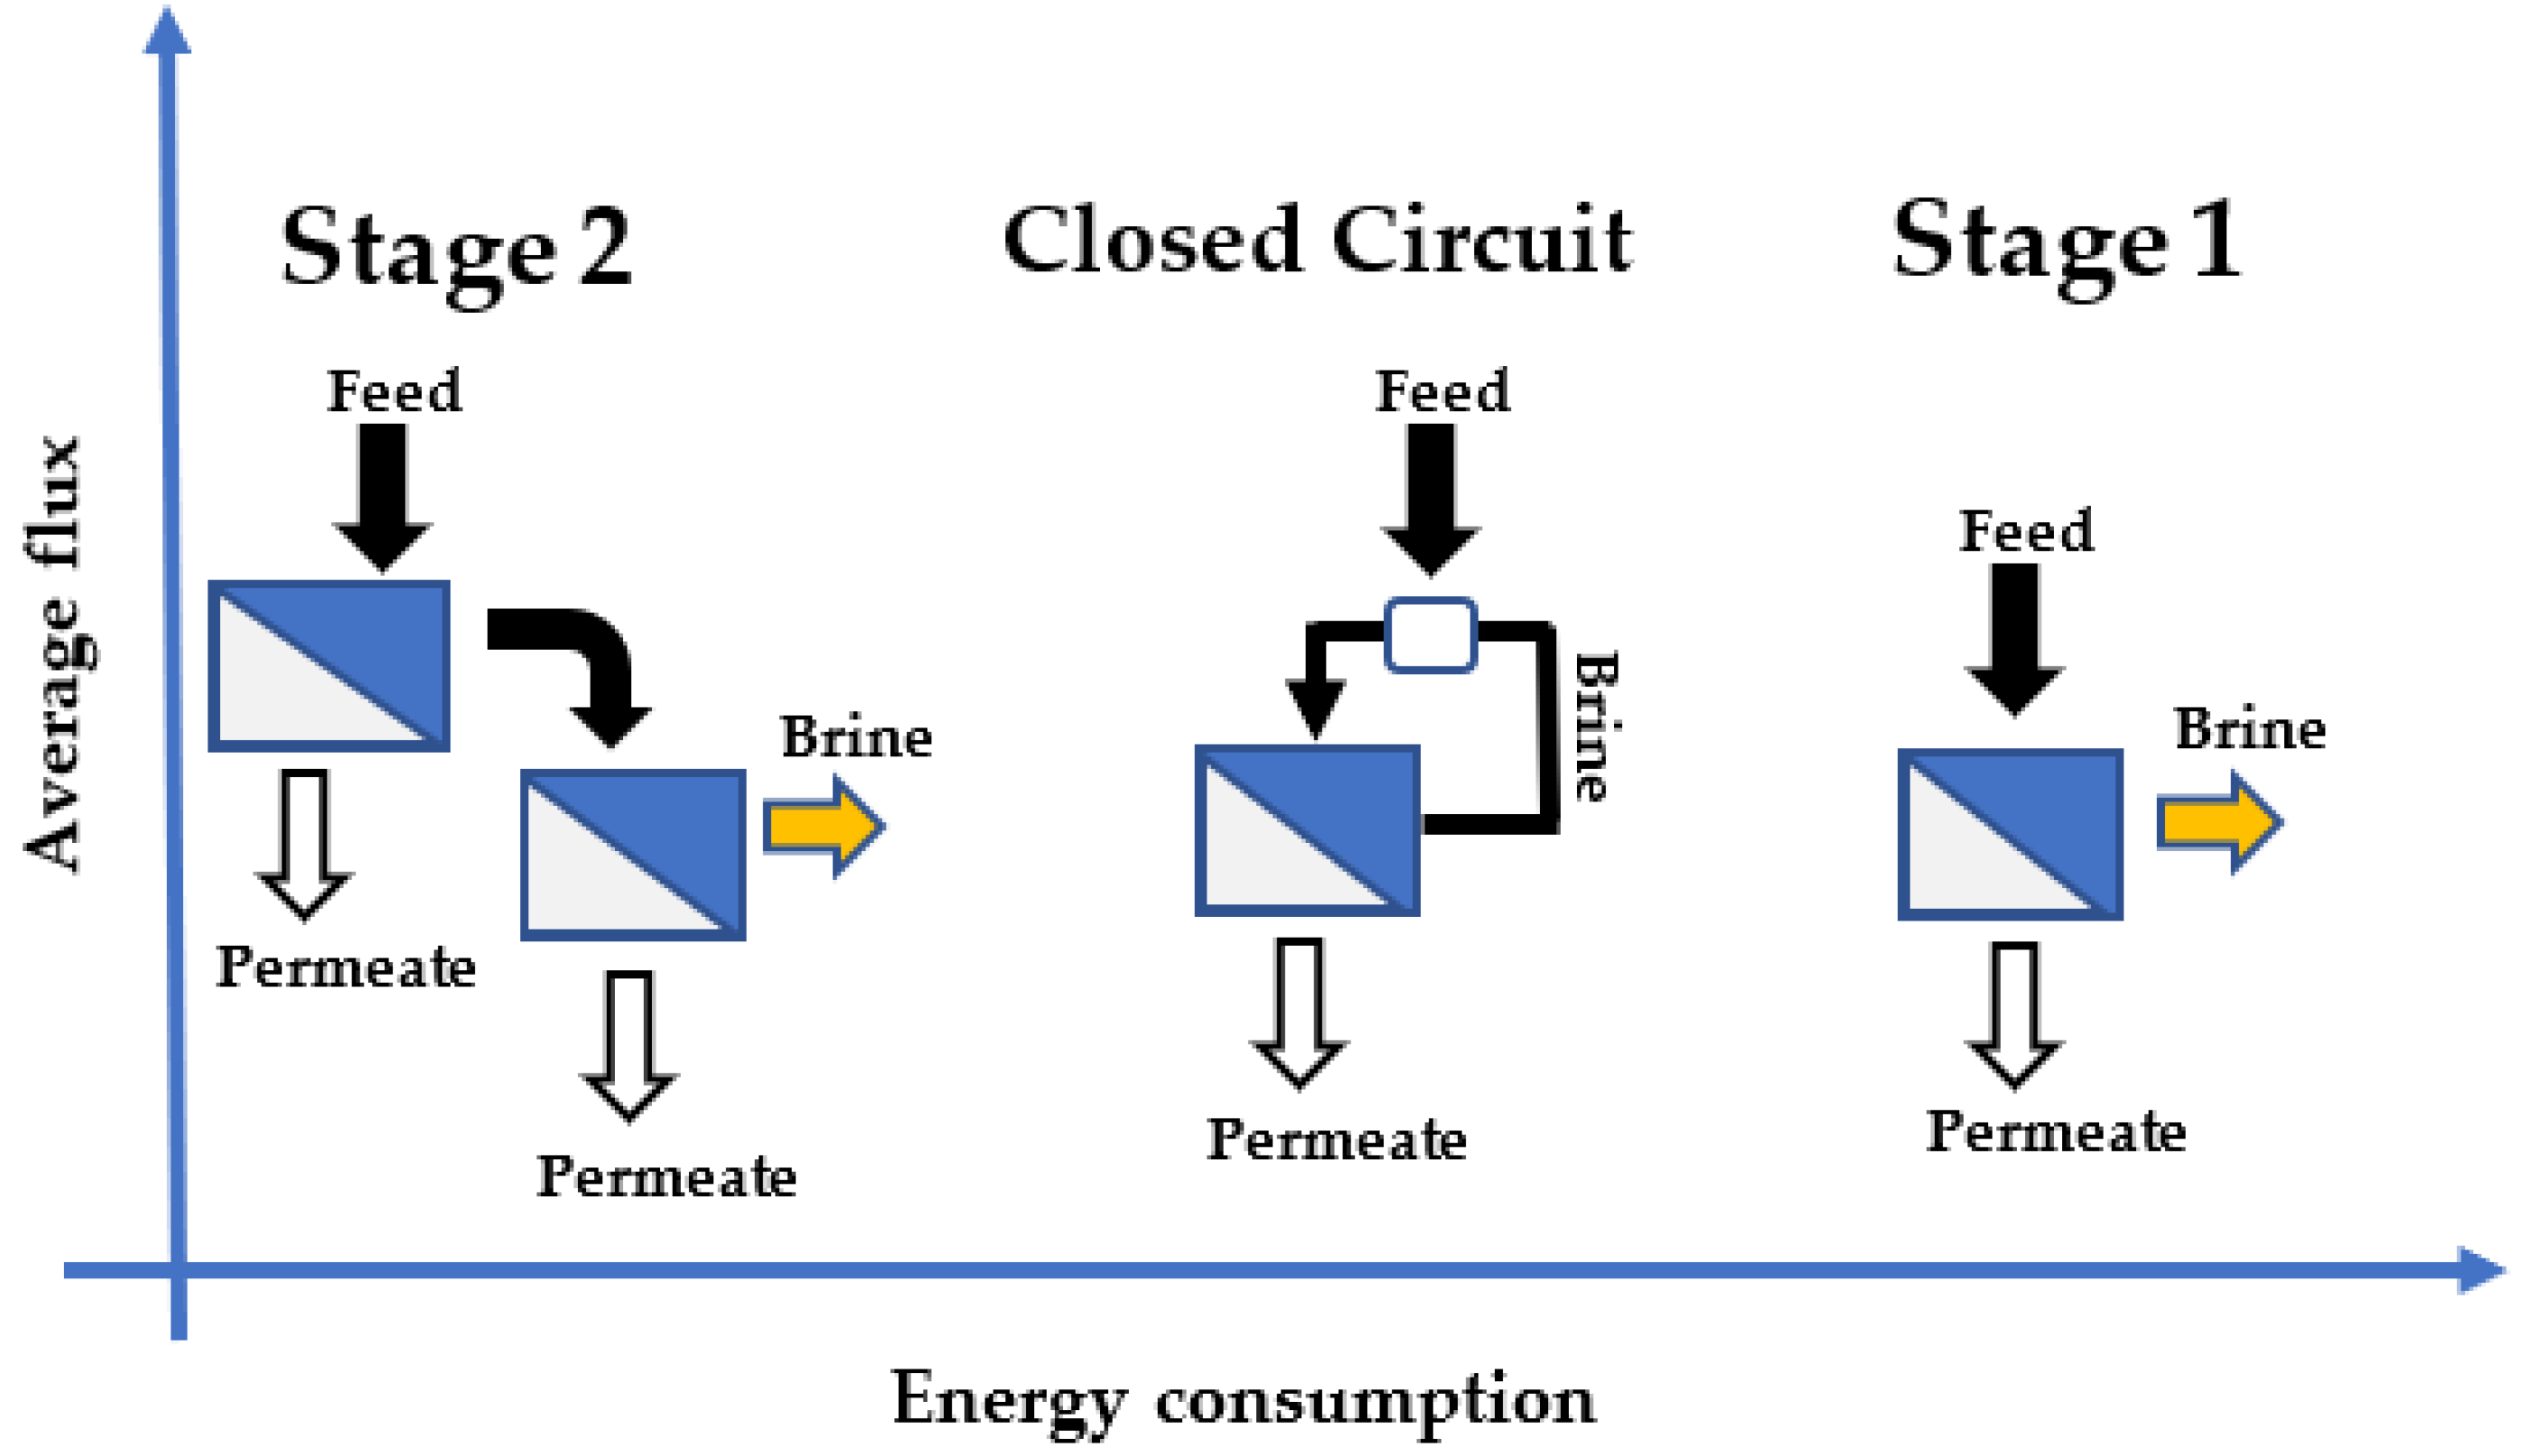
Physical configurationSpecific energy consumption (SEC)1 Stage, 2 Step and CCRO [31,47]The compensation quantifies the relationship between mean water flow and SEC at module scale with 1-stage, 2-stage, and closed-loop—Operation based on the kinetics [47]Quantify compensation using the relationship between average water flow and SEC in module-scale reverse osmosis processes with 1-stage, 2-stage, and closed-loop configurations [47]The reduction of the normalized SEC will have a significantly stronger impact
In absolute energy savings, system configuration and operating conditions also have significant impacts on energy or economic costs of pretreatment processes and energy recovery [45].
A 1-stage RO process usually yields the highest average water flux but also consumes the most energy a 2-stage RO process typically consumes the least energy and yields a moderate average water flux and a CC-RO process yields the lowest average water flux and consumes more energy than a 2-stage RO process but less energy than a 1-stage RO process [31,47]The optimization of RO operation based on the kinetics-energetics tradeoff should be conducted in the range of operation conditions that would not drastically undermine other aspects of RO performance
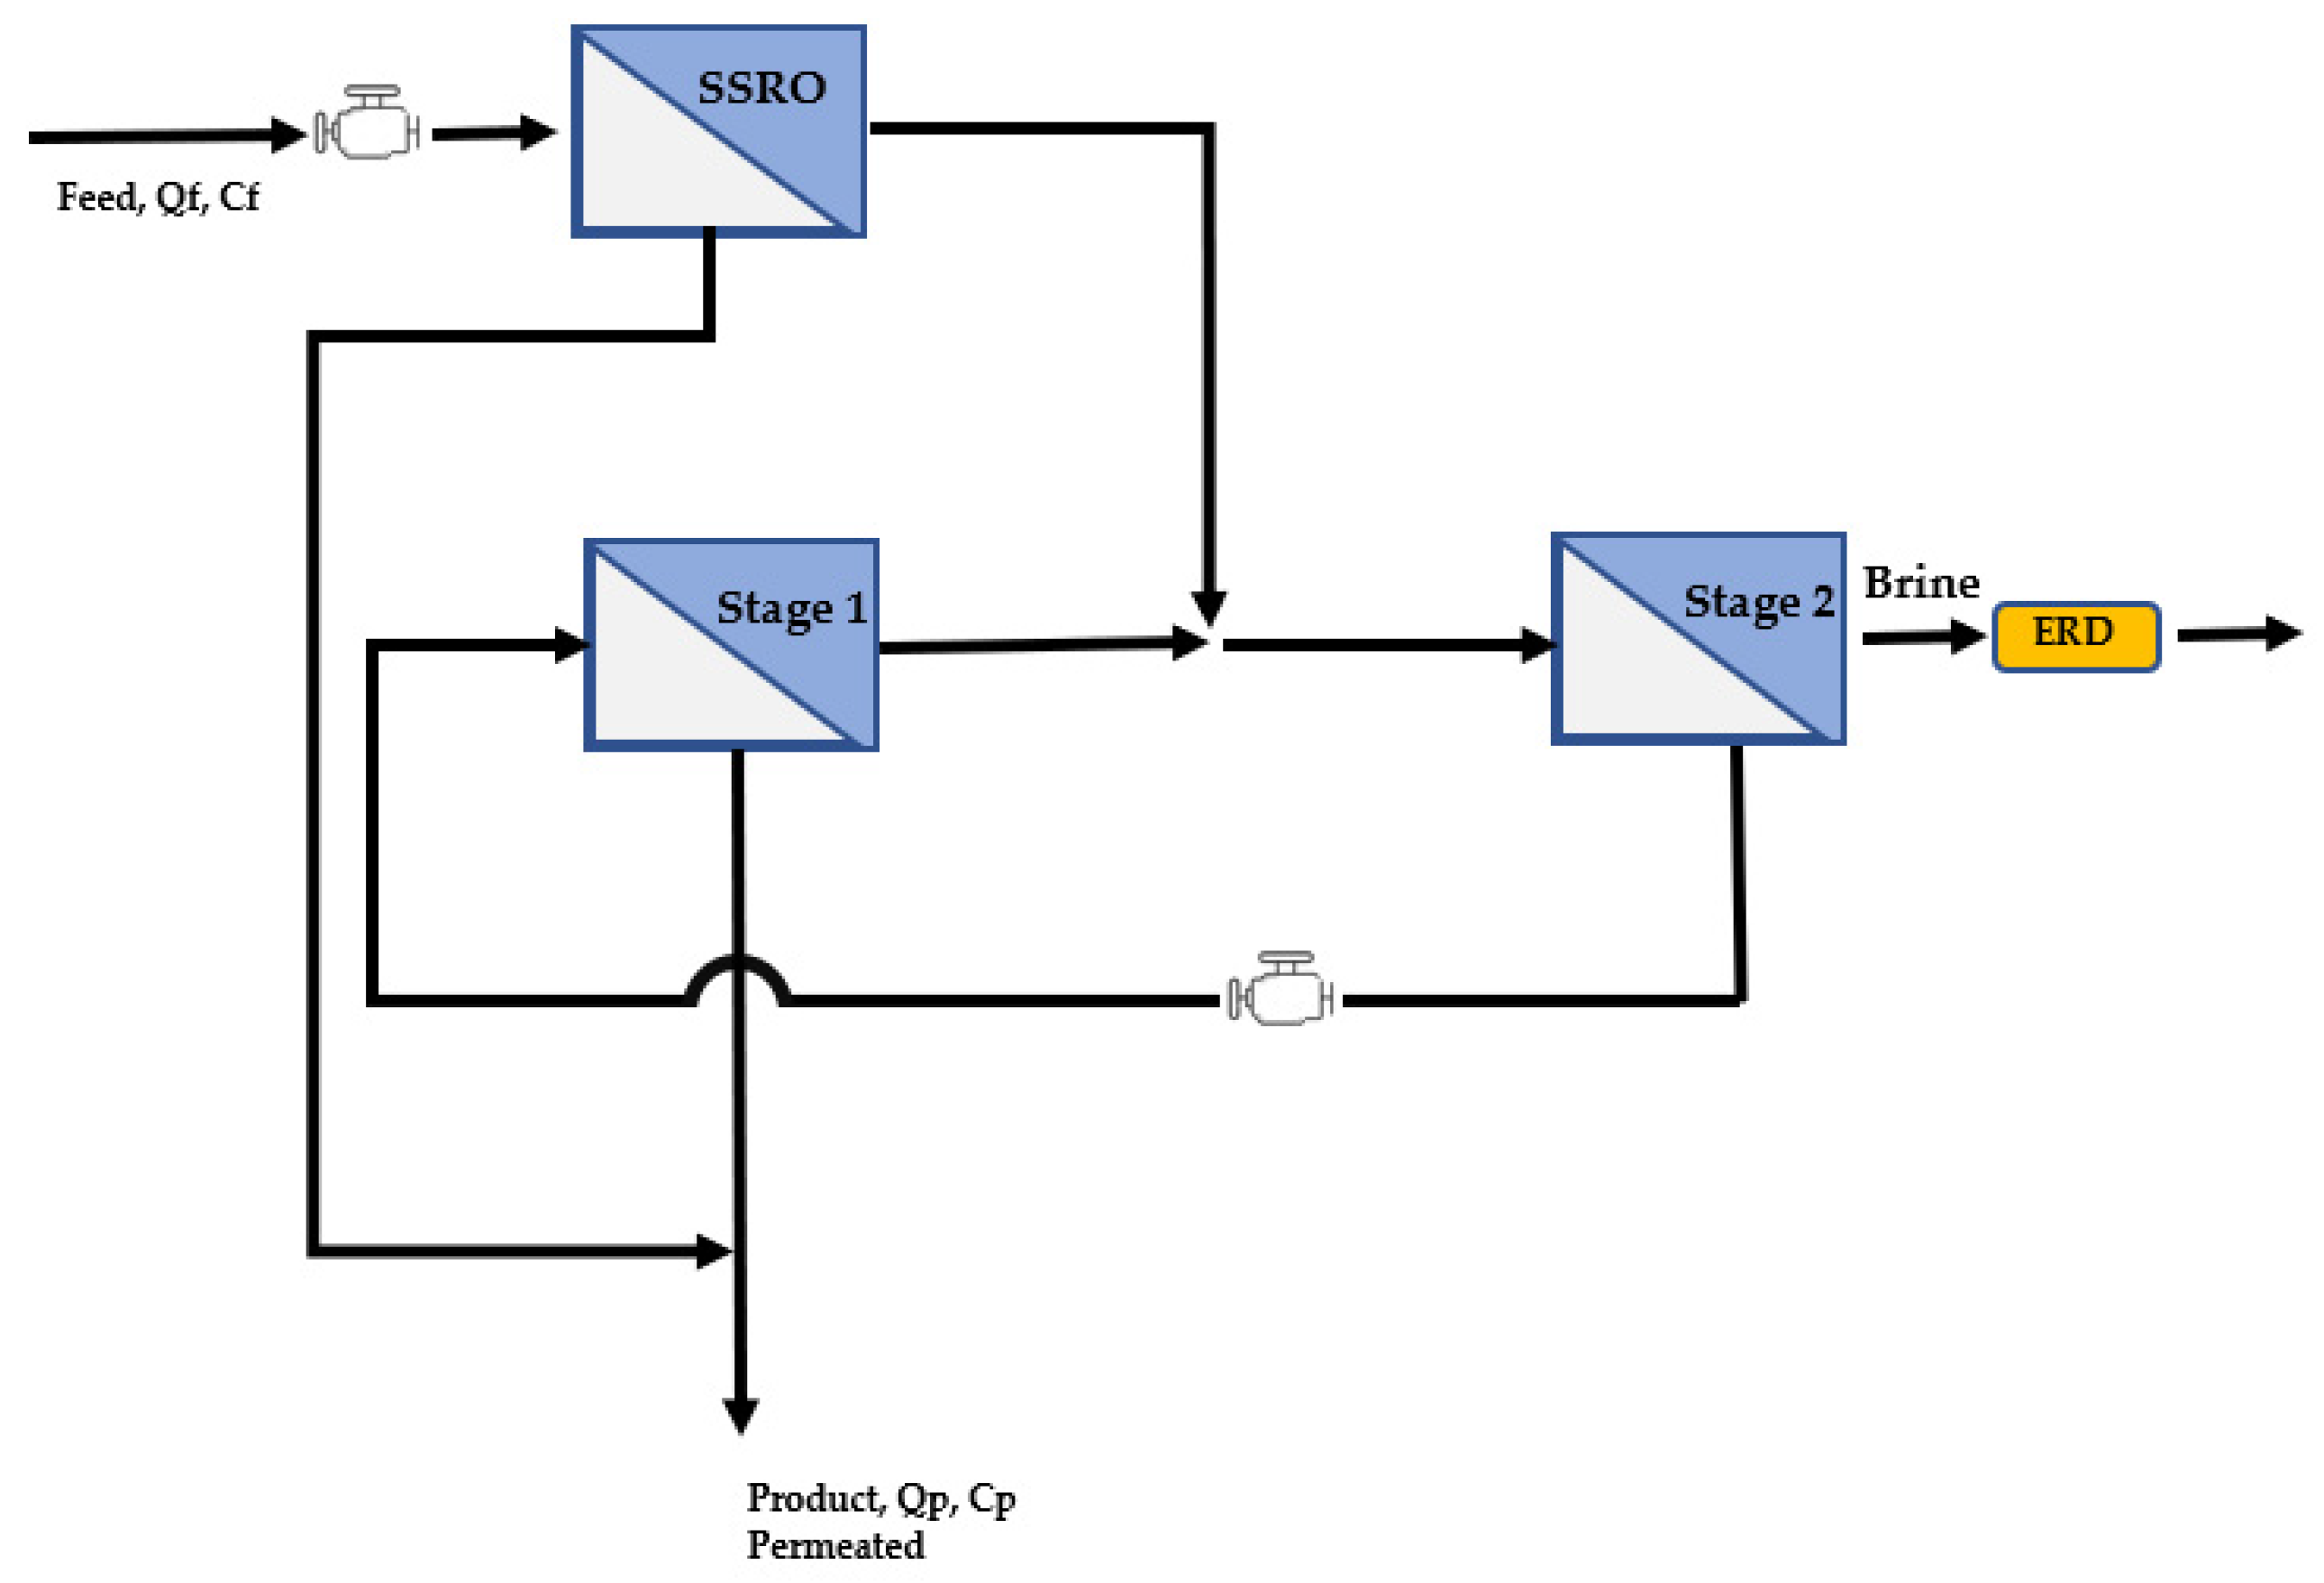
Energy-Efficient Reverse Osmosis (EERO)The energy-efficient reverse osmosis (EERO) desalination process was developed to achieve a highfull water recovery [48]Feeds retentate from one or more stages of Single Stage Reverse Osmosis (SSRO) in series to a countercurrent membrane cascade with recycle (CMCR) consisting of a reverse osmosis (RO) terminal stage
and one or more low salt rejection stages
The process, it develops with an operational strategy that involves increasing the pressure to the low salt rejection stage of the CMCR to compensate for the use of membranes with a higher salt rejection than requiredAn achieve 75% total water recovery at a lower total cost of water production than conventional SSRO operated with only 50% water recovery [48]The EERO process can reduce the osmotic pressure differential by 50% relative to conventional SSRO for the same total water recoveryThe EERO process significantly reduces the infrastructure costs—The 1-2 and 2-2 configurations of the EERO process can achieve reductions of 3.7% and 6.2%, respectively, in the total cost of water production for operation at 75% total water recovery relative to conventional SSRO operating at only 50% total water recover associated with pre-treatment [48]
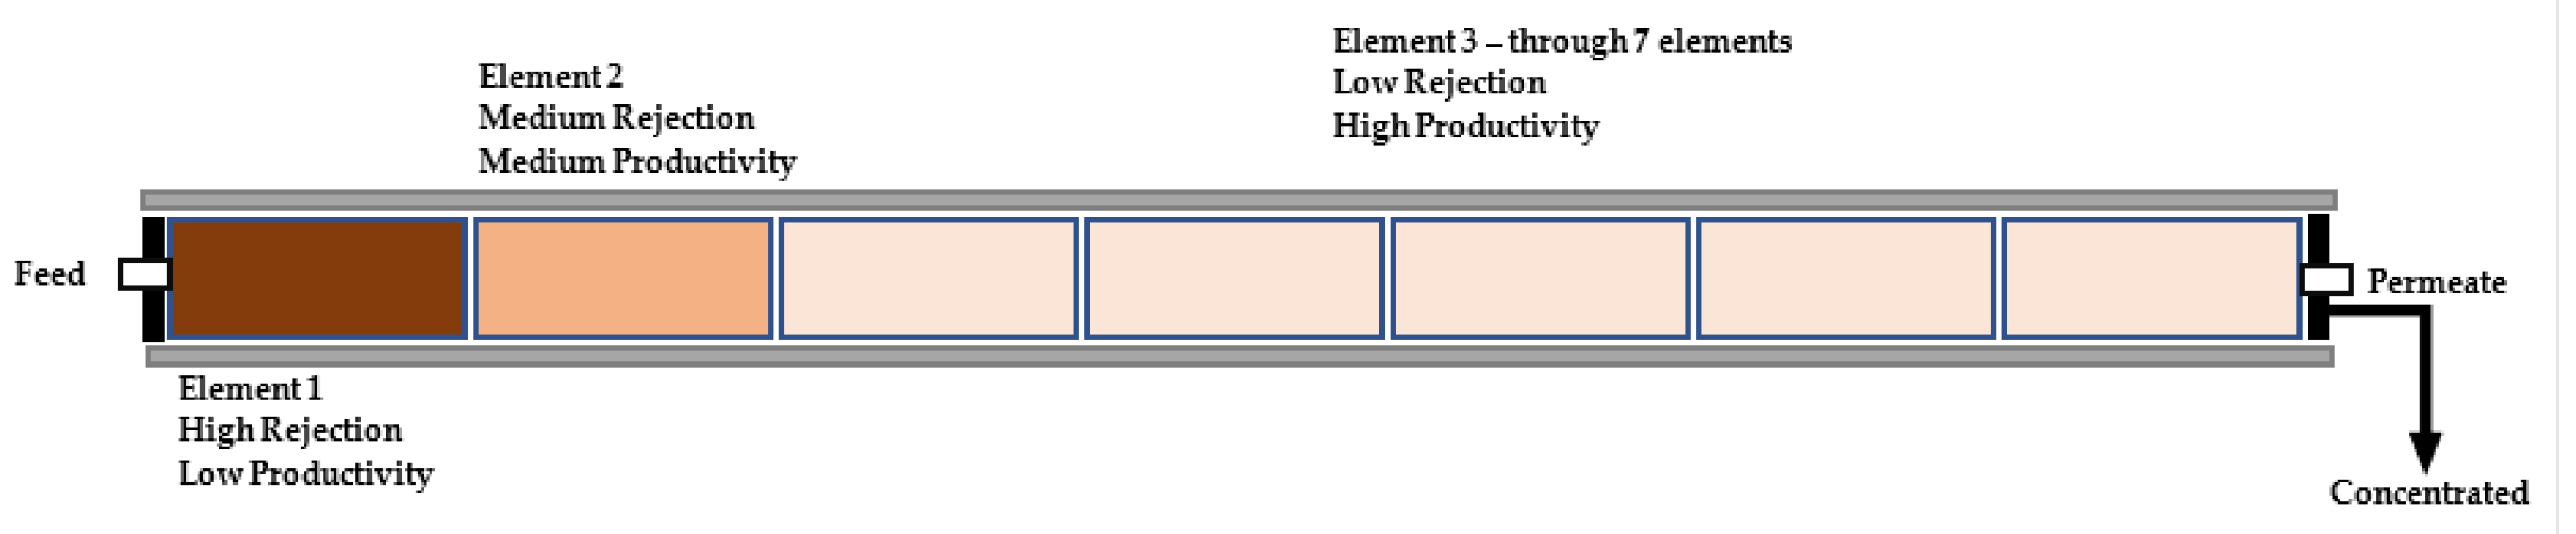
Hybrid membrane configuration combining SWROCombining SWRO elements of different productivity and rejection within the same vessel [50,51]The hybrid membrane interstage design (HID) is evaluated to improve the SEC efficiency of the reverse osmosis processThe system allows estimating the energy efficiency of the HID under three feeding conditions: high concentration and high temperature (Case 1); low concentration and high temperature (Case 2); and low concentration and low temperature (Case 3)HID application can save up to 0.41 kWh/m3 of SEC.Configuration of seven elements per vessel, each element of the membrane would produce one seventh (14.3%) of the total flow of permeate [50]Temperature is a more important design factor than recovery rate for HID application.
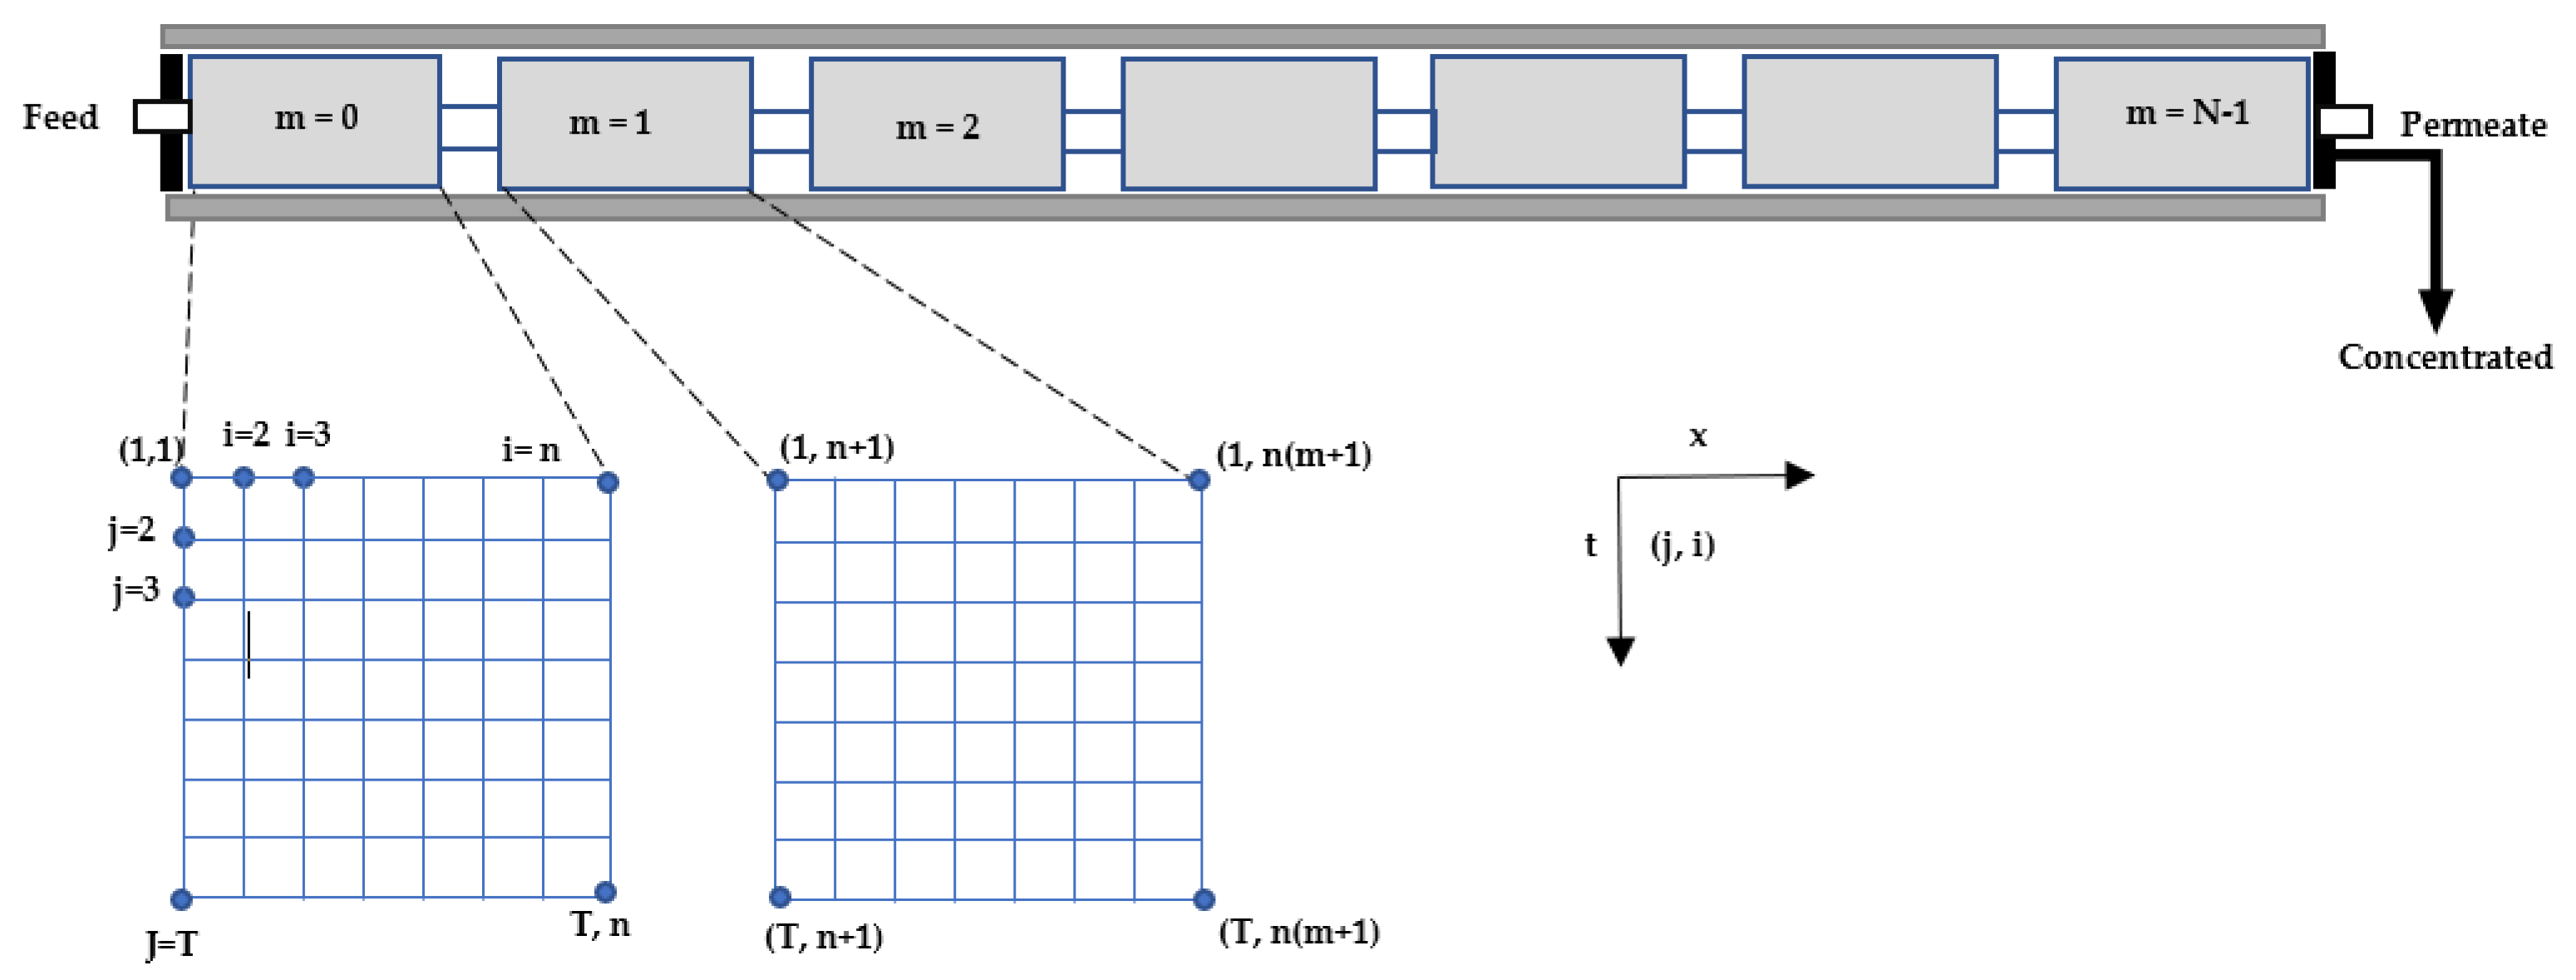
Internally Staged Design (ISD)Numerically optimized, based on a finite difference method [54]It is a method of systematic optimization to find better sequences of membrane elements in a pressure vessel.A large-scale RO process was numerically modeled to assess the impact of the membrane element configuration on the long-term operation in the presence of colloidal contaminants [54]The proposed method for optimizing ISD is useful for more economical and efficient design and is a good reference for manufacturers to further improve their RO membranes [54]The ISD system improves water recovery rate and energy efficiency of SWRO processes during a long-term operationThe optimization ISD shows higher water flow and higher energy efficiency in long-term operation (90 days) compared to conventional designs [30].
StatisticsReverse Osmosis (RO) Steady State Statistical ModelsConstructions of correlations between inputs/outputs [16]Understanding of the mechanism/behavior of the interaction between input and output variables of the desalination plant by formulating regression models.Show interaction between input and output variables—They are used to plan and shows the sensitivity of variables against the operation of the system—Characteristic data of the current are used (flow rate, concentration, and pH) over a periodThe model developed here is useful for planning, monitoring, and analysis of the current separation systemThe model is obtained after multivariate
resulting analysis that the P values are smaller than α < 0.052, indicating
independently distributed residuals with mean residual values for a confidence level of 95% and 99% that are insignificant
The proposal requires more field as well as experiments to confirm findings based on physical or chemical viewpoints [16]
New fouling index, β called the “permeation coefficient”Development of a new fouling index that is more reliable and feasible than the SDI [56]Definition of a new fouling index β called “permeation coefficient” under natural environmental conditions from a statistical point of viewRegression models allow predicting the rate of return and the specific performance index that takes into account energy consumption based on different variablesThe analysis of the performance of the membranes based on their fouling, allows better criteria of its preservation to improve its performance, allowing better energy and economic savings.It provides new insights into the performance and shortcomings of SDI from a statistical point of view.adoption of a new fouling index would require further field testing, as well as experiments or theory to confirm the findings based on physical or chemical points of view [56]
Response surface methodology (RS)Applied for modeling and optimization of the air gap membrane distillation process used in desalination [58,59,60,65]Regression models are used to predict the rate of return and the specific performance index that takes into account energy consumption based on different variablesThe developed models have been statistically validated by analysis of varianceTwo optimal operating conditions were found by solving two different problems.
optimization cases: (i) maximization of the performance index and (ii) maximization of the specific performance index. This allows design with greater energy and economic savings in the systems.
From the RS models, the optimal AGMD conditions were determined using the multi-stage Monte Carlo simulation technique.For the performance index, the optimal solution was a cooling inlet temperature of 13.9 °C, a feed inlet temperature of 71 °C and a feed flow rate of 183 L/h [58,59]
Model Predictive Control (MPC)It is an advanced control algorithm widely used in the process industries, as reverse osmosis plant [62]In this paper, the QDMC controller is used to control a simulated reverse-osmosis (RO) water desalination system with spiral wound element (SWM). A cascaded control system was designed with the QDMC controller and a PID controller for the desalination process, where the QDMC controller optimizes the set point of the PID controller and directly controls one output.Support software is available to help engineers adjust QDMC controller parameters. Since the QDMC controller is implemented in an embedded system, the system cost is reduced, which is helpful for RO desalination system applicationDado que todo el controlador QDMC está implementado
a través de un chip FPGA, el costo es muy bajo, lo que es útil para una amplia
aplicación en plantas prácticas
QDMC control system can also handle the system constraints and is very effective in controlling the complex coupled process of a RO plant.The model compared the results of the proposed QDMC cascade control system with the traditional two-PID control strategy used in the industry. The model considers three different scenarios, with set point control and disturbance rejections. Based on the simulation results [62]
Statistical data processing, applied to research studies related to costsReport of a mathematical model based on statistical processing related to production costs. The analysis of the cost of one m3 of desalinated water by reverse osmosis (RO) is carried out [63]A mathematical model is proposed based on expressions related to costs based on production capacity.All cost data are plotted on bar charts and box-and-whisker plots.
The study of atypical values was carried out as well as that of Kolmogorov–Smirnov and Shapiro–Wilk tests were performed based on Hubera’s M, Tukey’s biweight, Hampel’s M and Andrew’s wave estimators. Subsequently, factorial analysis was performed using the Bartlett and Kaiser-Meyer-Olkin tests; Possible mathematical models were analyzed
the model shows that desalination costs can be up to 1.5%, more efficient in the production line compared to the rest of the observed linesThe model provides an innovative aspect in cost analysis because the study focused exclusively in the search for technologically more efficient and lower cost production lines impact on the plant.The proposed equation corresponds to the mathematical model based on the statistical data adjusted to 98% of the real cost for small desalination plants [63]
Publisher’s Note: MDPI stays neutral with regard to jurisdictional claims in published maps and institutional affiliations.

