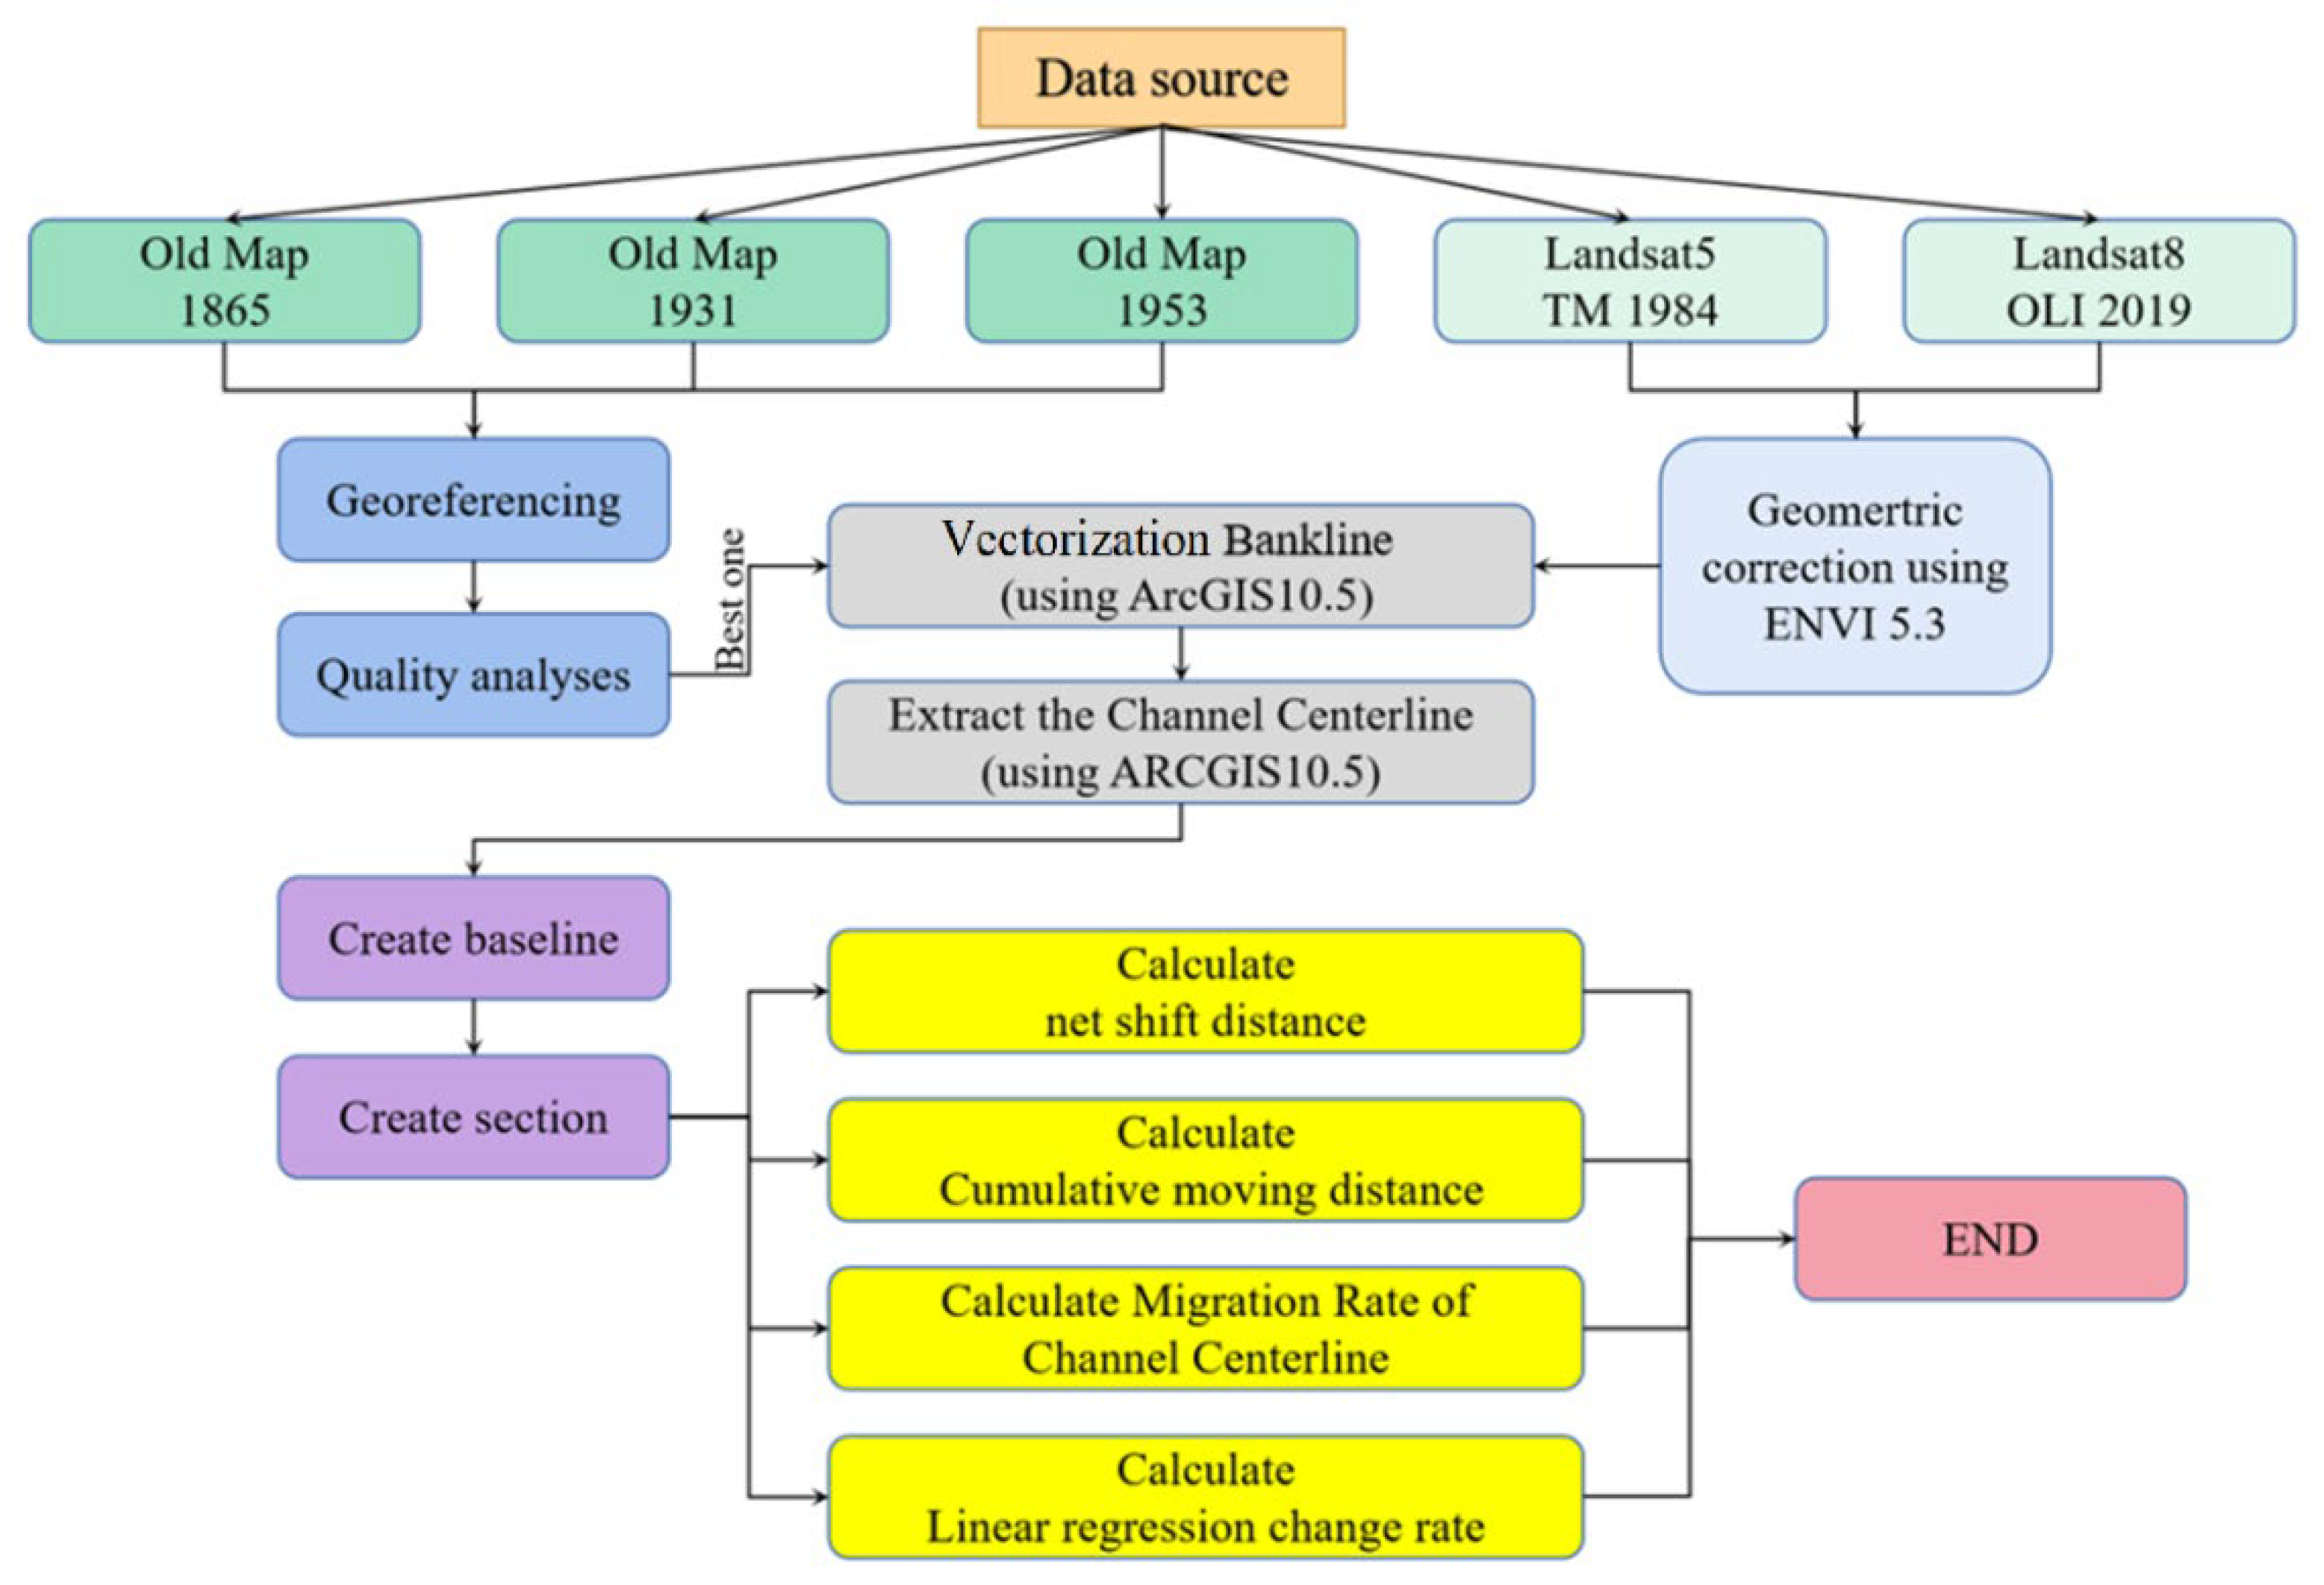
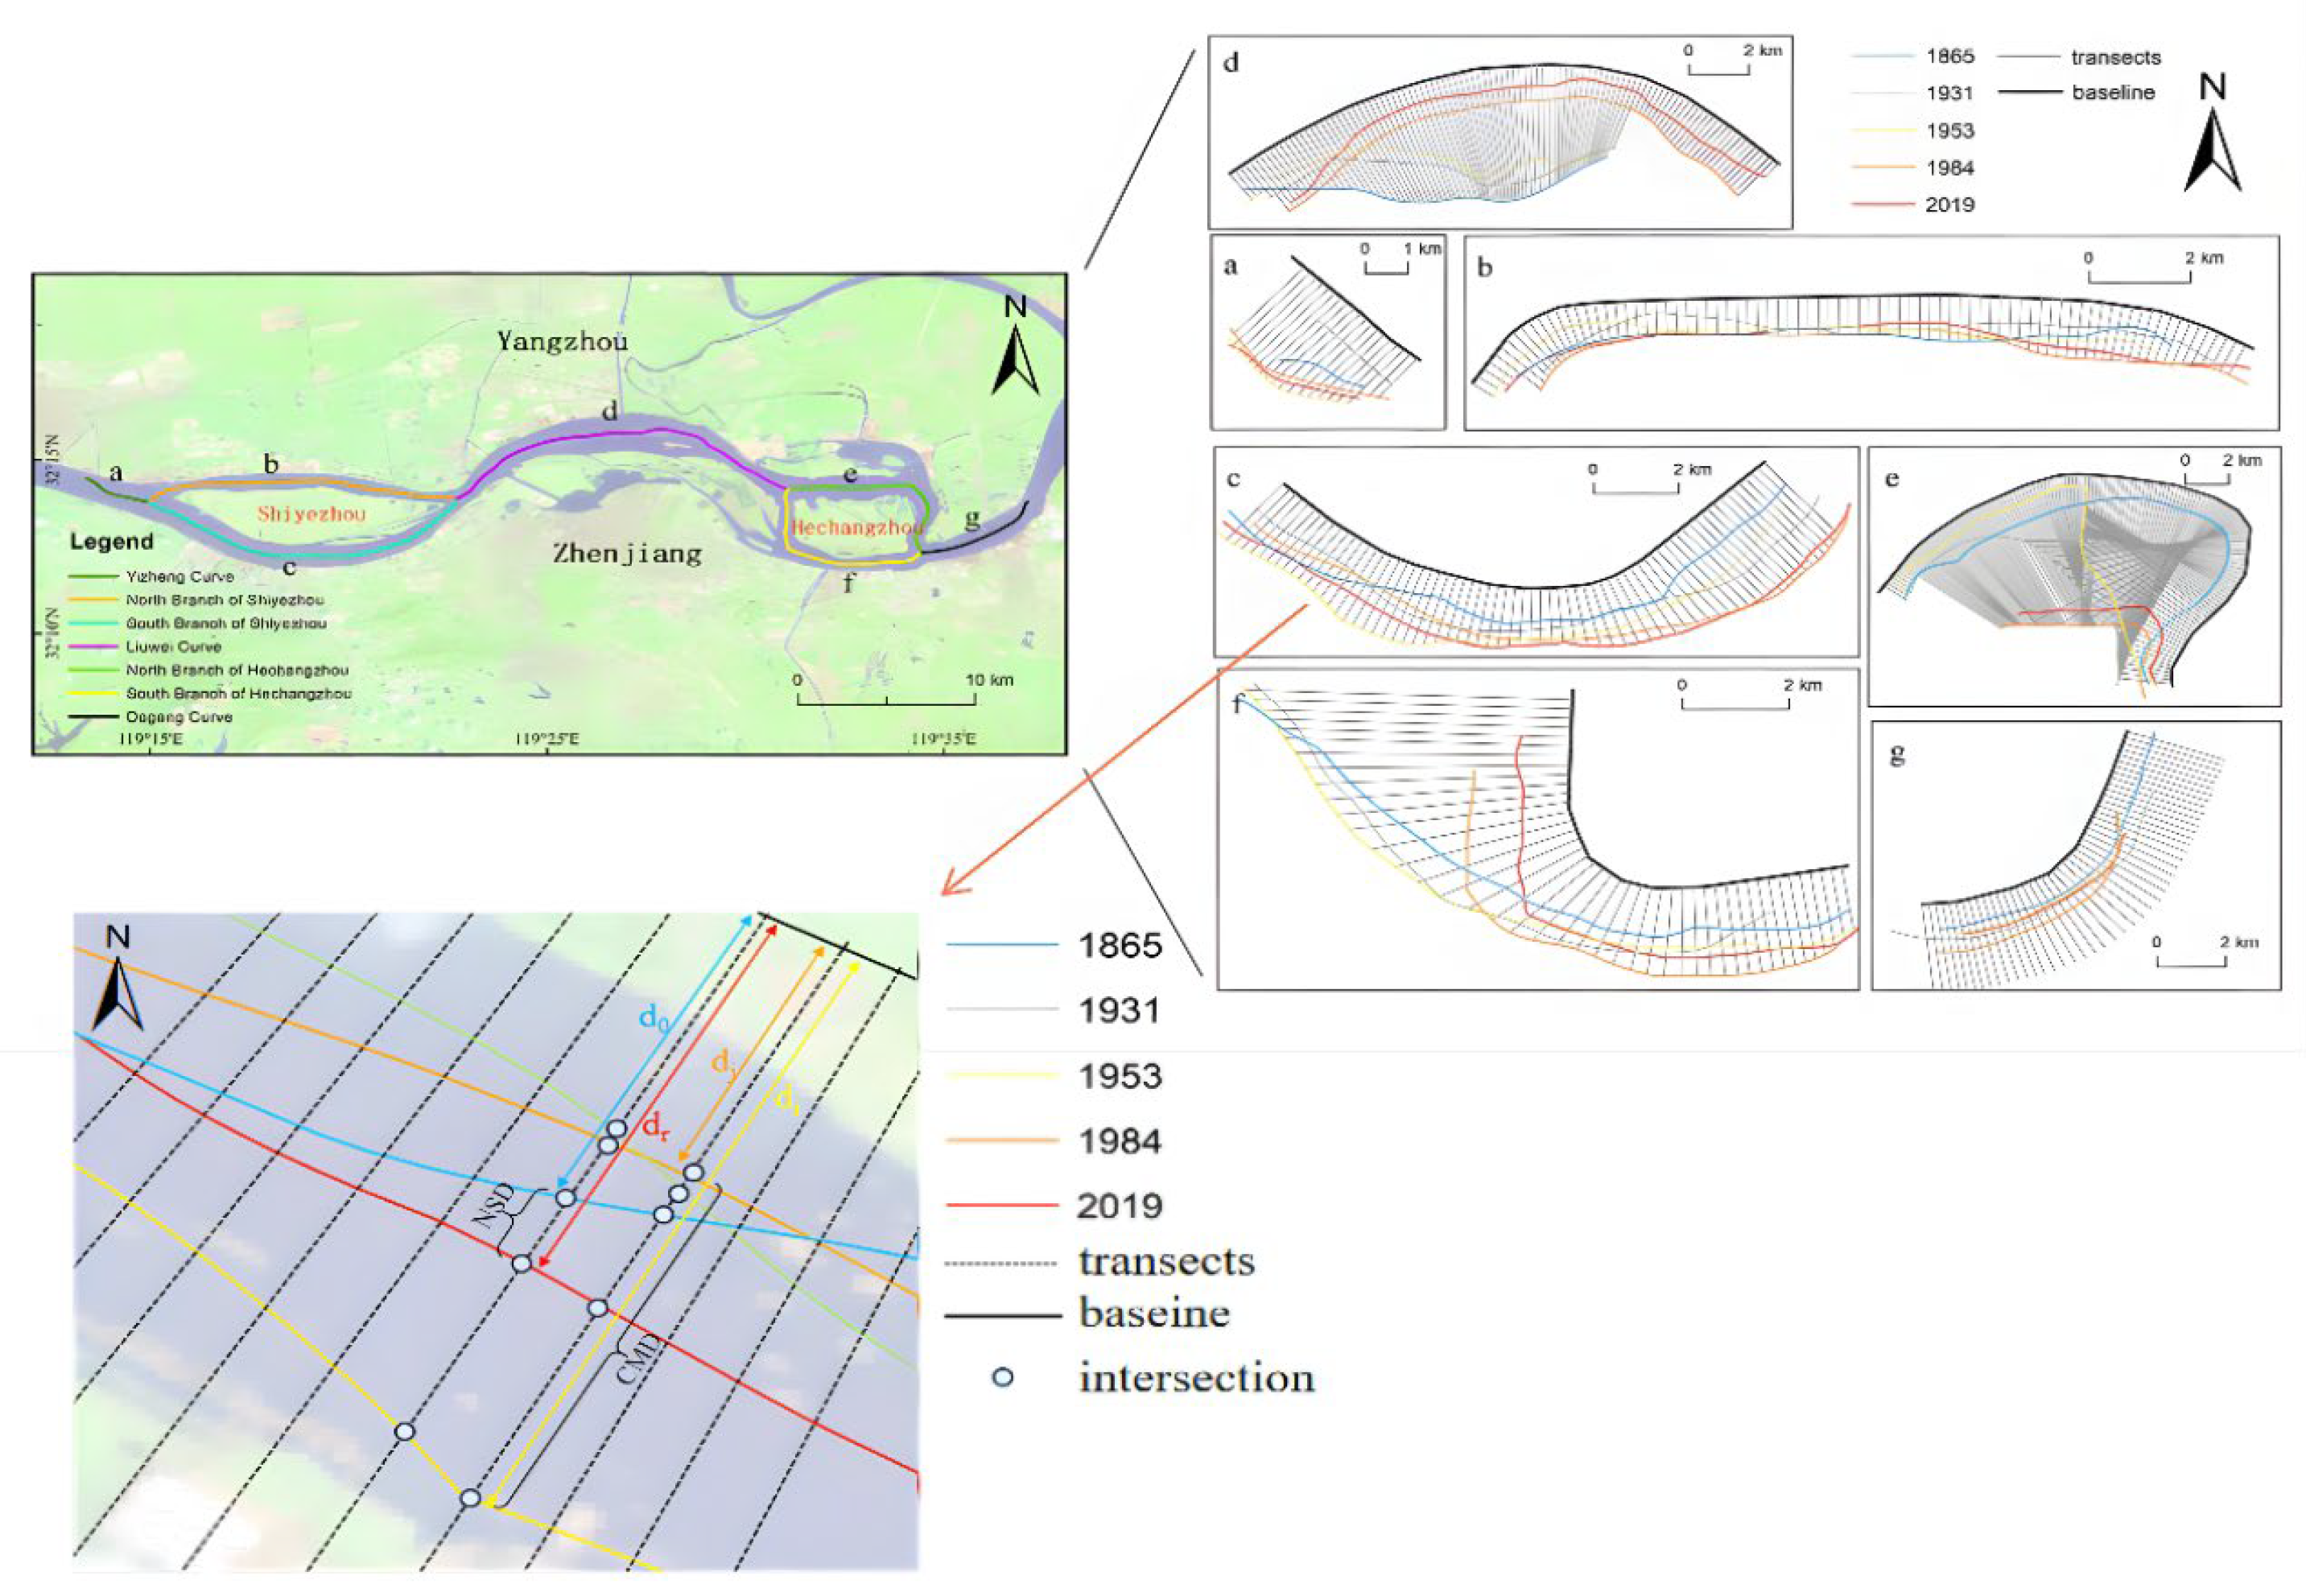
In this study, the above methods were employed to quantify the section- and reach-scale morphometric parameters, covering the Net Shift Distance, Cumulative Moving Distance, Migration Rate of Channel Centerline, and Linear Regression Change Rate in the channel centerline of the Zhenjiang-Yangzhou reach in 1865–2019.
3.1. The Net Shift Distance and Cumulative Moving Distance of the Channel Centerline on the Section Scale
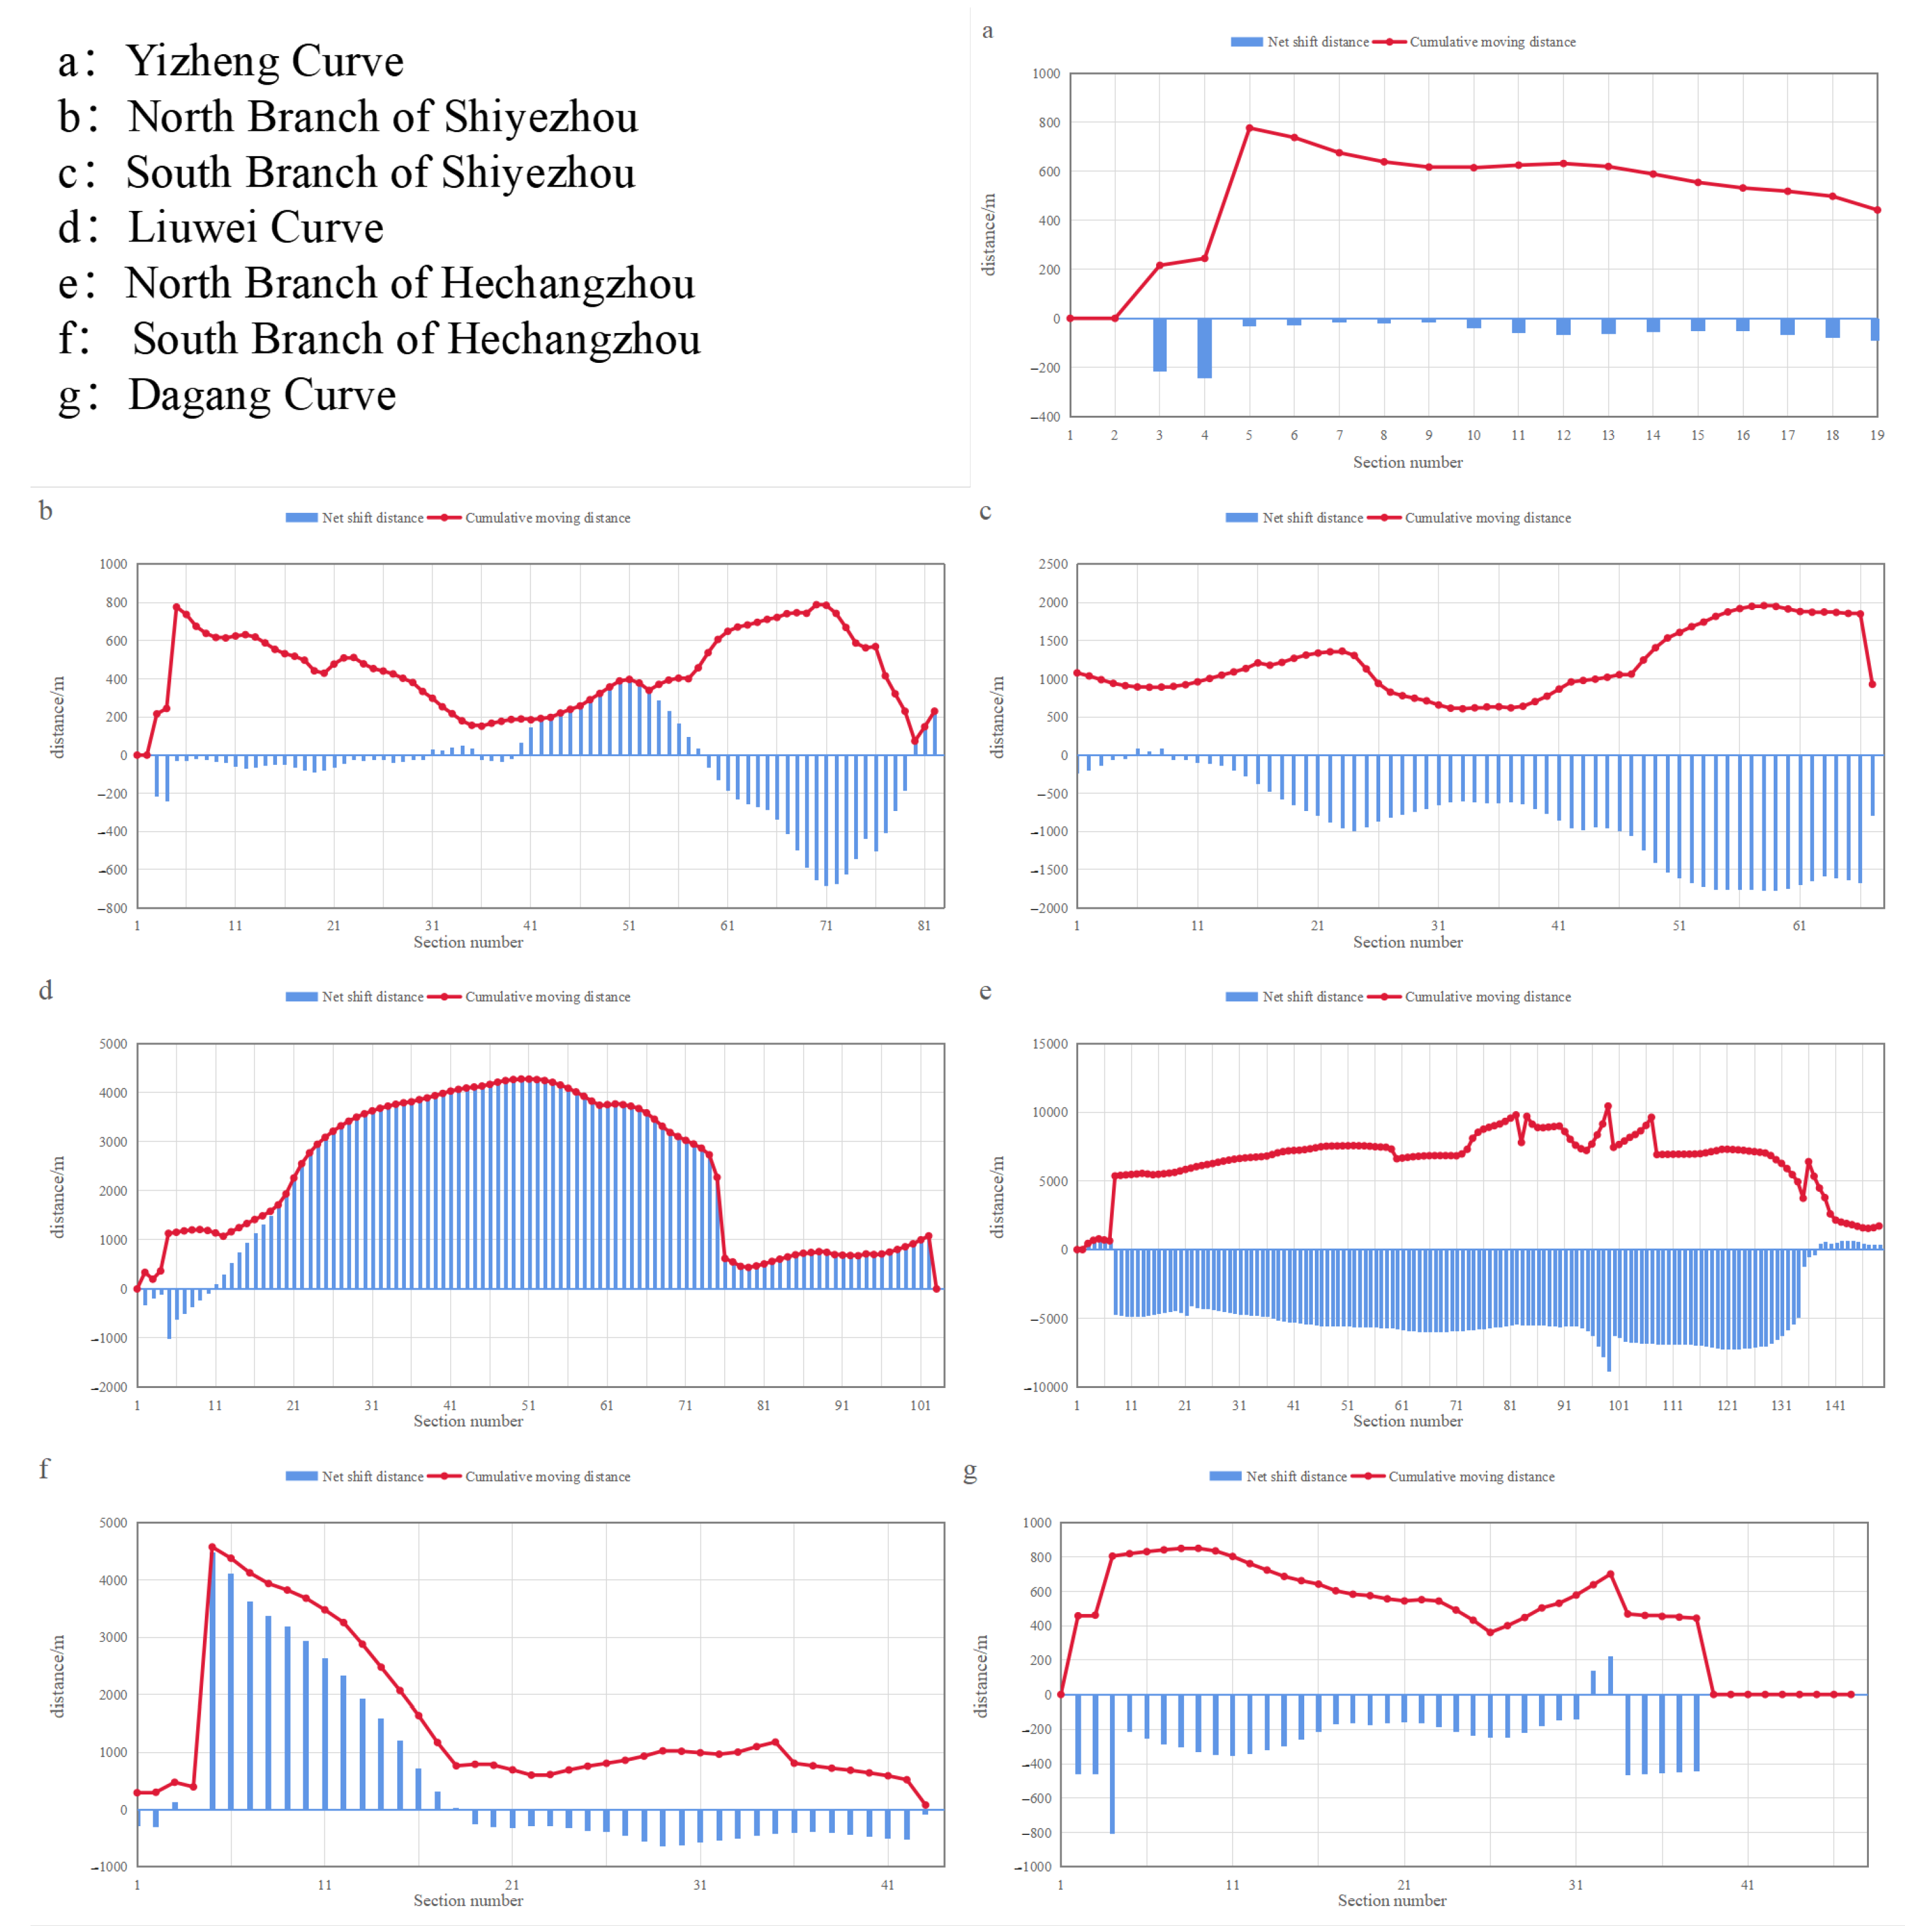
In the past 100 years, the channel centerline reached by Zhenjiang-Yangzhou has shown a trend of continuous swing on the whole (
Figure 4). The average Net Shift Distance of the section is 1103.47 m for the right bank migration, and the average cumulative displacement distance of the section is 2790.51 m. The channel centerline has the largest net displacement distance of the channel curve, followed by the South Branch of Hechangzhou, North Branch of Shiyezhou, Yizheng Curve, and Curve, and South Branch of Hechangzhou, and the smallest is North Branch of Hechangzhou. The maximum Cumulative Moving Distance of the channel centerline is North Branch of Hechangzhou, followed by Six Curve, South Branch of Shiyezhou, South Branch of Hechangzhou, and North Branch of Shiyezhou.
Among them, for the channel centerline of Yizheng Curve during 1868–2019, the value of Net Shift Distance from upstream to downstream trend is high → low → medium, the average section of Net Shift Distance is right bank migration 302.01 m, the highest value appears in section 4, the right bank migration 650.63 m, and the lowest value appears in sections 1 and 2. The variation trend of Cumulative Moving Distance from upstream to downstream is low to high, with an average of 938.65 m. The highest value appeared in section 5, which was 1972.7 m, and the lowest value appeared in sections 1 and 2. Cumulative Moving Distance is much larger than Net Shift Distance, which indicates that Yizheng Curve has periodic reverse swing. The connection between Yizheng Curve and South Branch of Shiyezhou becomes the main channel in the upper reaches of the river, which receives the influence of the geostrophic bias force. The river continuously scours the right bank, resulting in the gradual movement of the channel center line to the right bank.
For the channel centerline of North Branch of Shiyezhou during 1868–2019, the value of Net Shift Distance from upstream to downstream changed from low to high. The average Net Shift Distance of the cross-section was 57.23 m, and the highest value appeared in section 71, which was right bank migration 683.79 m; the lowest value appeared in section 31, which was left bank migration, at 10.84 m. The change trend of Cumulative Moving Distance from upstream to downstream is high → low → high, with an average of 435.93 m. The highest value appears in section 4, which is 244.36 m, and the lowest value appears in section 1. The Cumulative Moving Distance of sections 1–14 is far greater than the Net Shift Distance, indicating that there is periodic reverse swing in this part of the river. The absolute value of Cumulative Moving Distance after section 41 is basically the same as that of Net Shift Distance, indicating that the long-term movement direction of this part of the river is basically the same. The right bank of North Branch of Shiyezhou was scoured, while the small sandbars in the area of Shiyezhou Sandbank continued to merge, resulting in an expanding area of Shiyezhou Sandbank and a dynamic balance on the right bank.
For the channel centerline of South Branch of Shiyezhou during 1868–2019, the value of Net Shift Distance from upstream to downstream changed from low to high. The average section Net Shift Distance was 869.04 m on the right bank. The highest value appeared in section 59, which was right bank migration, at 1777.36 m. The lowest value appeared in section 5, which was right bank migration, at 0.55 m. The change trend of Cumulative Moving Distance from upstream to downstream is high → low → high, with an average of 1186.31 m. The highest value appeared in section 59, which is 1958.07 m, and the lowest value appeared in section 33, at 606.65 m. Cumulative Moving Distance of sections 1–23 is greater than Net Shift Distance, indicating that there is periodic reverse swing in this part of the river. The absolute value of Cumulative Moving Distance after section 24 is basically the same as that of Net Shift Distance, indicating that the long-term movement direction of this part of the river is basically the same. At first, a large number of small sandbars were scattered in this area, which compressed the width of South Branch of Shiyezhou. Later, after the small sandbars were merged into Shiyezhou Sandbank, the river surface became wider.
For the channel centerline of Liuwei Curve during 1868–2019, the change trend of Net Shift Distance from upstream to downstream is low → high → low, and the average cross-section Net Shift Distance is left bank migration 2191.63 m. The highest value appears in section 51, which is 4273.94 m for left bank migration, and the lowest value appears in section 103. The variation trend of Cumulative Moving Distance from upstream to downstream is high → low → high, which is consistent with the variation trend of Net Shift Distance, with an average value of 2340.15 m. The maximum appears in section 59, which is 4273.94 m, and the minimum appears at section 103. The absolute values of Cumulative Moving Distance of most cross-sections are basically the same as those of Net Shift Distance, indicating that the long-term movement direction of boundary curve in each cross-section is basically the same. The reason for the dramatic change of the Six Curve is that the hydrodynamic force has changed greatly, resulting in the change of the top impact point, and the river changed from the initial concave bank to the convex bank.
For the channel centerline of North Branch of Hechangzhou during 1868–2019, the value of Net Shift Distance from upstream to downstream trend is low → high → low, the average section of Net Shift Distance is right bank migration at 4908.03 m, the highest value appears in section 59, and the right bank migration is 7851.58 m. The lowest value appears in section 2. The variation trend of Cumulative Moving Distance from upstream to downstream is low → high → low, which is consistent with the variation trend of Net Shift Distance, with an average value of 6465.19 m. The maximum appears at section 99, which is 9139.1 m, and the minimum appears at section 2. The absolute values of Cumulative Moving Distance of most sections are basically consistent with those of Net Shift Distance, indicating that the long-term movement direction of North Branch of Hechangzhou in each section is basically the same. Today’s Hechangzhou Sandbank area is much smaller than in 1868. At first, there was a huge and scattered small sandbank, and the northern bank of the merged Hechangzhou Sandbank gradually shrank southward.
For the channel centerline of South Branch of Hechangzhou during 1868–2019, the value of Net Shift Distance from upstream to downstream trend is low → high → low, the average section of Net Shift Distance is left bank migration 498.38 m, the highest value appears in section 5, and left bank migration is 4480.37 m. The lowest value appears in section 4, with left bank migration of 20.15 m. The trend of Cumulative Moving Distance from upstream to downstream is low → high → low, which is basically consistent with the trend of Net Shift Distance, and the average value is 1474.11 m. The maximum value appears in section 5, which is 4575.81 m, and the minimum value appears in section 43, which is 80.86 m. The absolute values of Cumulative Moving Distance of most sections are basically consistent with those of Net Shift Distance, indicating that the long-term movement direction of South Branch of Hechangzhou in each section is basically the same. During the long-term evolution of Hechangzhou Sandbank, the North Bank and West Bank are shrinking, resulting in a part of the channel centerline of South Branch of Hechangzhou moving to the left bank.
For the channel centerline of Dagang Curve during 1868–2019, the change trend of Net Shift Distance from upstream to downstream is high → low → high → low, and the average cross-section Net Shift Distance is right bank migration 212.48 m. The highest value appears in section 4, which is 805.25 m of right bank migration, and the lowest value appears in section 1 and sections 39–46. The change trend of Cumulative Moving Distance from upstream to downstream is low → high → low, with an average of 475.66 m. The highest value appeared in section 4, which is 805.25 m, the lowest value appeared in sections 1 and 9–46. The Cumulative Moving Distance of sections 5–33 is greater than Net Shift Distance, indicating that this part of the river has periodic reverse swing. The Cumulative Moving Distance of sections 1–4 and sections 34–36 are basically the same as the absolute value of Net Shift Distance, indicating that the long-term movement direction of this part of the river is basically the same. Compared with other reaches, the hydrodynamic force of the Dagang Curve has little change, mainly because the left bank has built many ports and a large number of berths extend into the main channel.
3.2. Analysis and Risk Recognition Based on the Central Line of MRCC and LRCR
In this study, the Migration Rate of Channel Centerline (
MRCC) and Linear Regression Change Rate (
LRCR) were employed to quantify the section- and reach-scale morphometric parameters. It includes the moving distance and direction of channel centerline on all sections. Based on the above data, we identified the risk of riverbank erosion (
Figure 5,
Figure 6,
Figure 7,
Figure 8,
Figure 9,
Figure 10 and
Figure 11).
Studies have shown that the braided river channel has self-adjustment characteristics under basically unchanged climatic conditions and upstream water and sediment conditions. The probability of the channel centerline moving to the left bank should be roughly equal to that of moving to the right [
38]. In this study, the total number of the channel centerline moving left and right in the Zhenjiang-Yangzhou reach of the Yangtze River is 156 and 329, respectively, indicating that the probability of the channel centerline moving right is about twice that of moving left. It shows that the upstream water and sediment conditions of the Zhenjiang-Yangzhou reach of the Yangtze River are unstable and vary greatly.
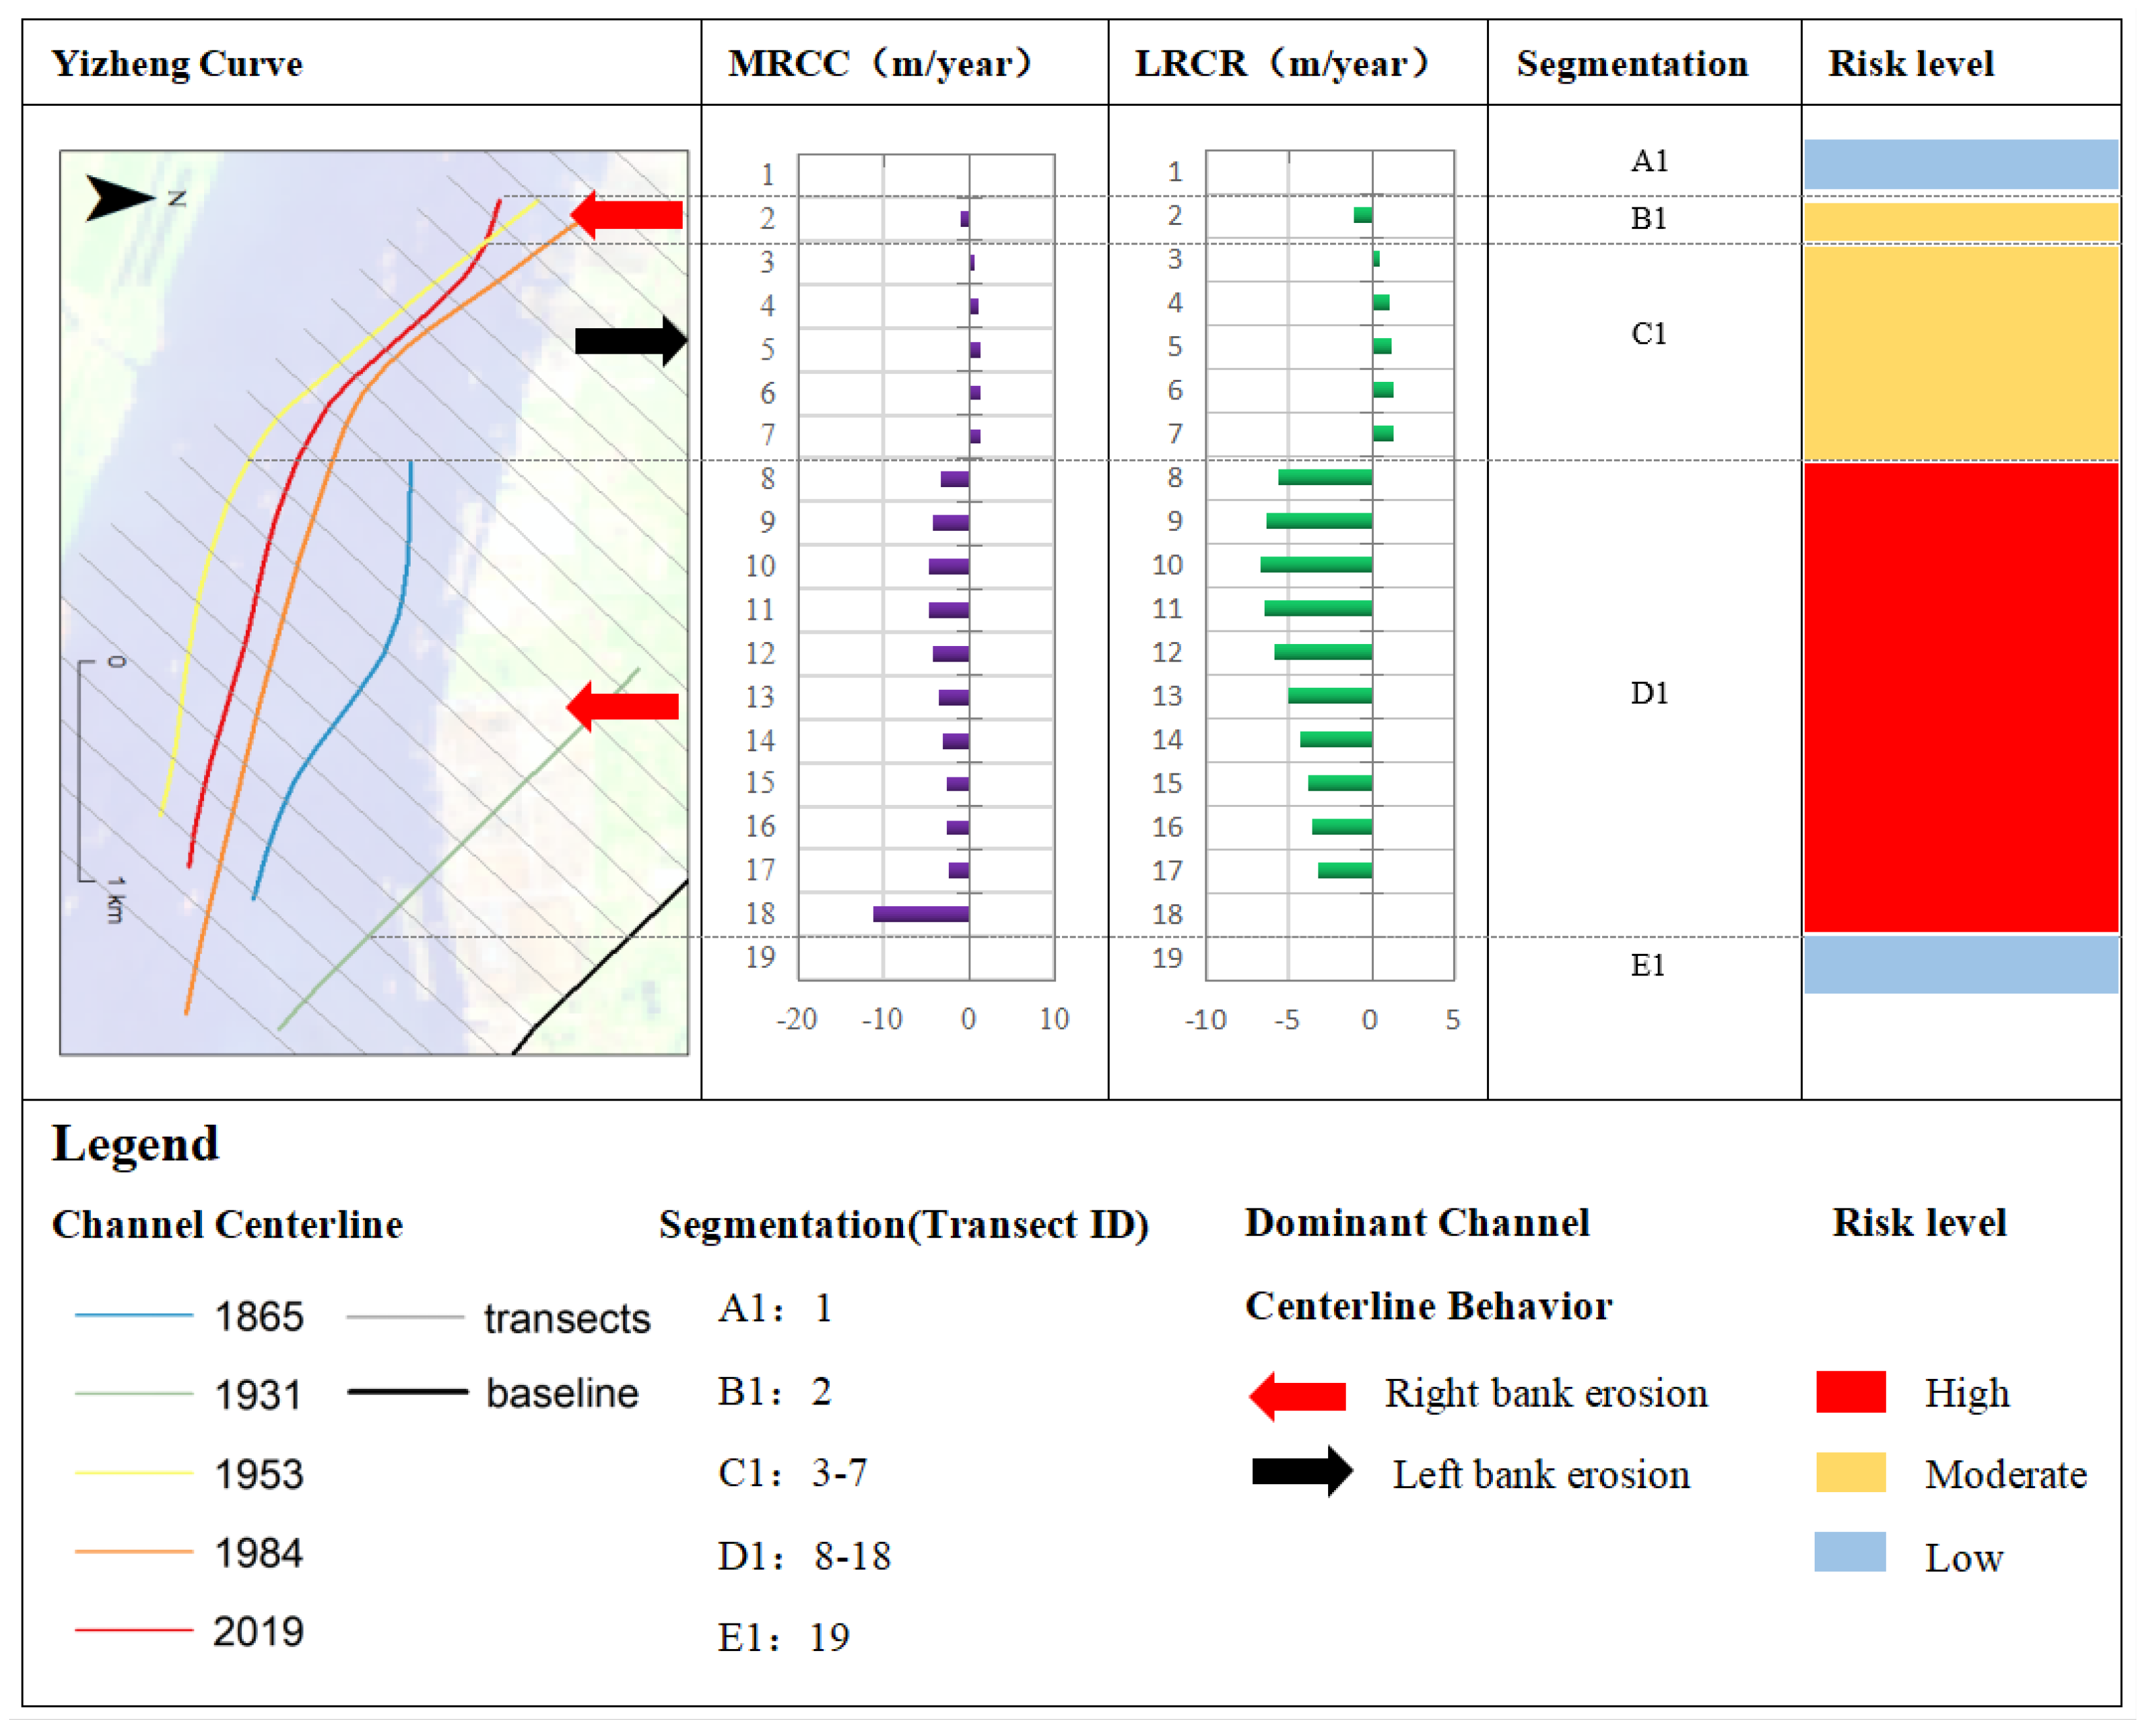
As shown in
Figure 5, the highest
MRCC value of Yizheng Curve during 1868–2019 was 11.13 m/y, with an average of 2.19 m/y, and the highest
LRCR value was 6.67 m/y, with an average of 2.45 m/y. The number of left shifts of the Yizheng Curve section is 5, and the number of right shifts is 12. Combining the direction and velocity of cross-section movement to identify the bank erosion risk, Yizheng Curve can be divided into five sections. Section A1 contains section 1, and the bank erosion risk level is low. Section B1 contains section 2, and the erosion risk level is moderate risk on the right bank. Section C1 contains sections 3–7, and the erosion risk level is moderate risk on the left bank. Section D1 contains sections 8–18, and the erosion risk level is high risk on the right bank. Section E1 contains section 19, and the risk level of riparian erosion is low.
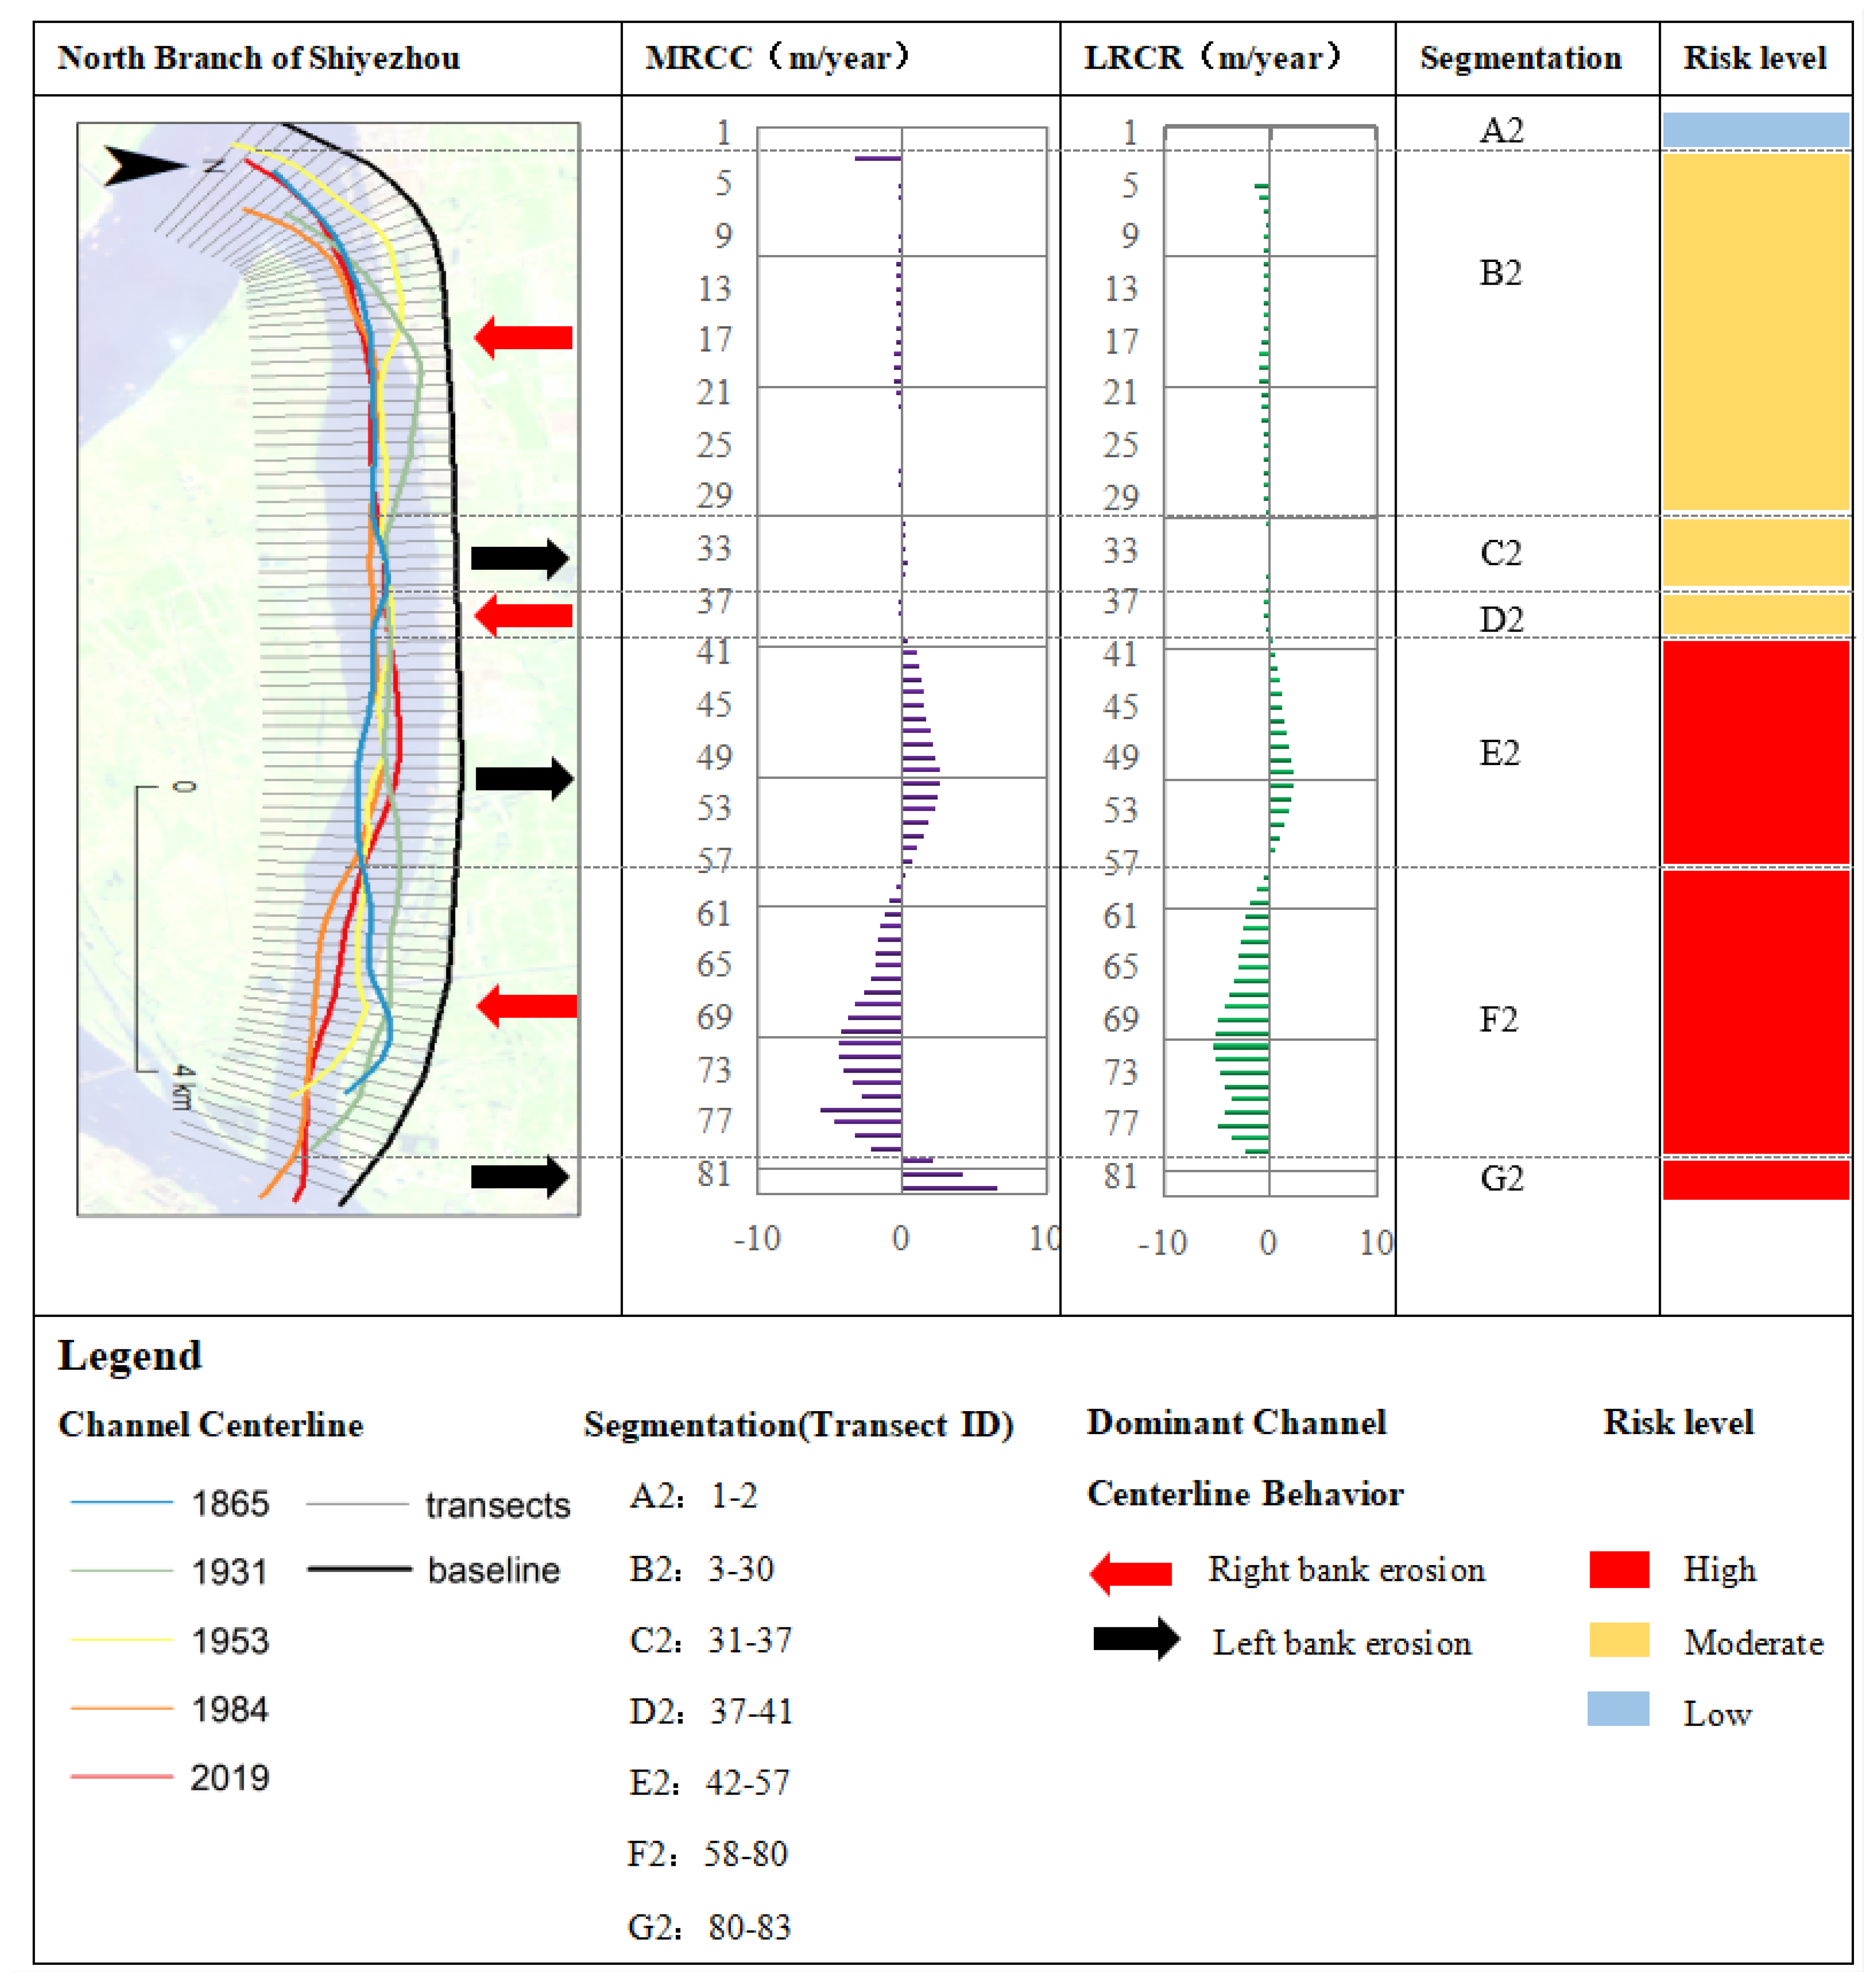
As shown in
Figure 6, the highest
MRCC value of North Branch of Shiyezhou during 1868–2019 was 6.58 m/y, with an average of 0.38 m/y, and the highest
LRCR value was 5.3 m/y, with an average of 0.94 m/y. The number of left shifts of North Branch of Shiyezhou section is 27, and the number of right shifts is 53. Combining the direction and velocity of cross-section movement to identify the bank erosion risk, Yizheng Curve can be divided into seven sections. Section A2 contains sections 1–2, and the bank erosion risk level is low. Section B2 contains section 3–30, and the erosion risk level is moderate on the right bank. Section C2 contains sections 31–37, and the erosion risk level is moderate on the left bank. Section D2 contains sections 37–41, and the erosion risk level is moderate on the right bank. Section E2 contains sections 42–57, and the erosion risk level is high on the left bank. Section F2 contains sections 58–80, and the erosion risk level is high on the right bank. Section G2 contains sections 80–83, with an erosion risk rating of high risk on the left bank.
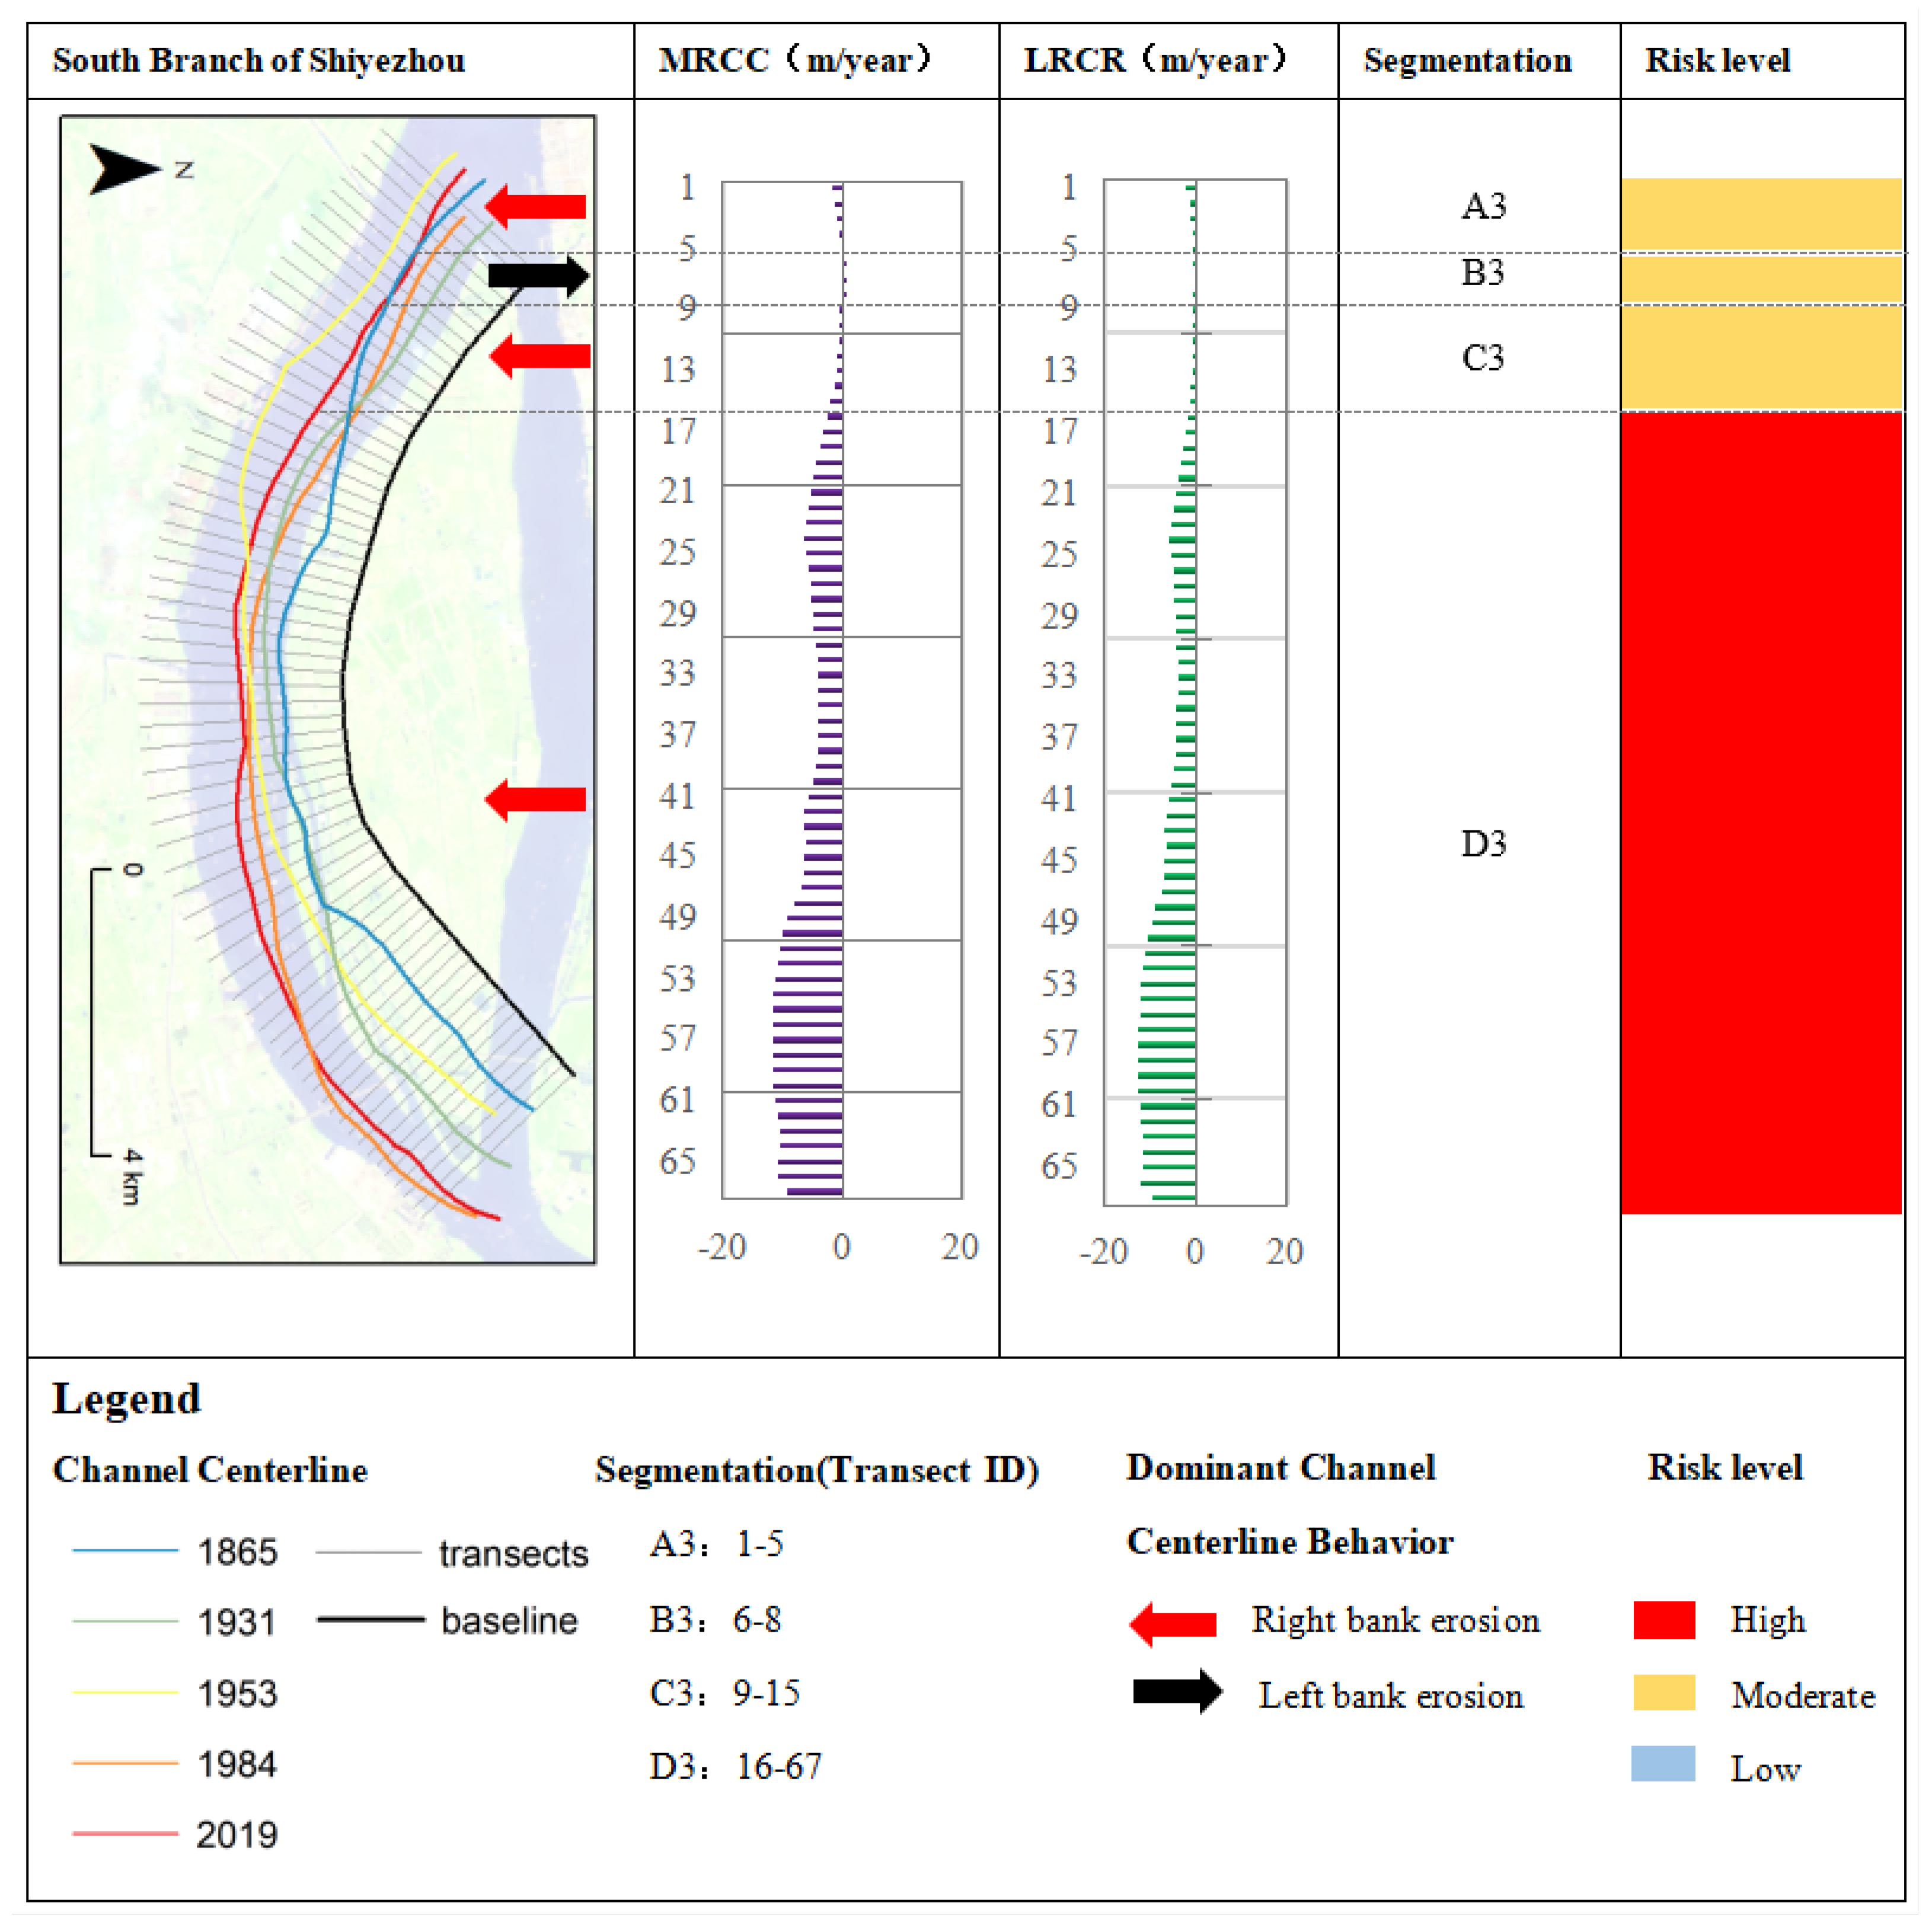
As shown in
Figure 7, the maximum
MRCC value of South Branch of Shiyezhou during 1868–2019 was 11.54 m/y, with an average of 5.7 m/y, and the maximum
LRCR value was 12.63 m/y, with an average of 5.93 m/y. The number of left shifts of South Branch of Shiyezhou section is 3, and the number of right shifts is 63. Combining the direction and velocity of cross-section movement to identify the bank erosion risk, Yizheng Curve can be divided into four sections. Section A3 contains sections 1–5, and the erosion risk level is moderate on the right bank. Section B3 contains sections 6–8, and the erosion risk level is moderate on the left bank. Section C3 contains sections 9–15, and the erosion risk level is moderate on the right bank. Section D3 contains sections 16–67, and the erosion risk level is high on the right bank.
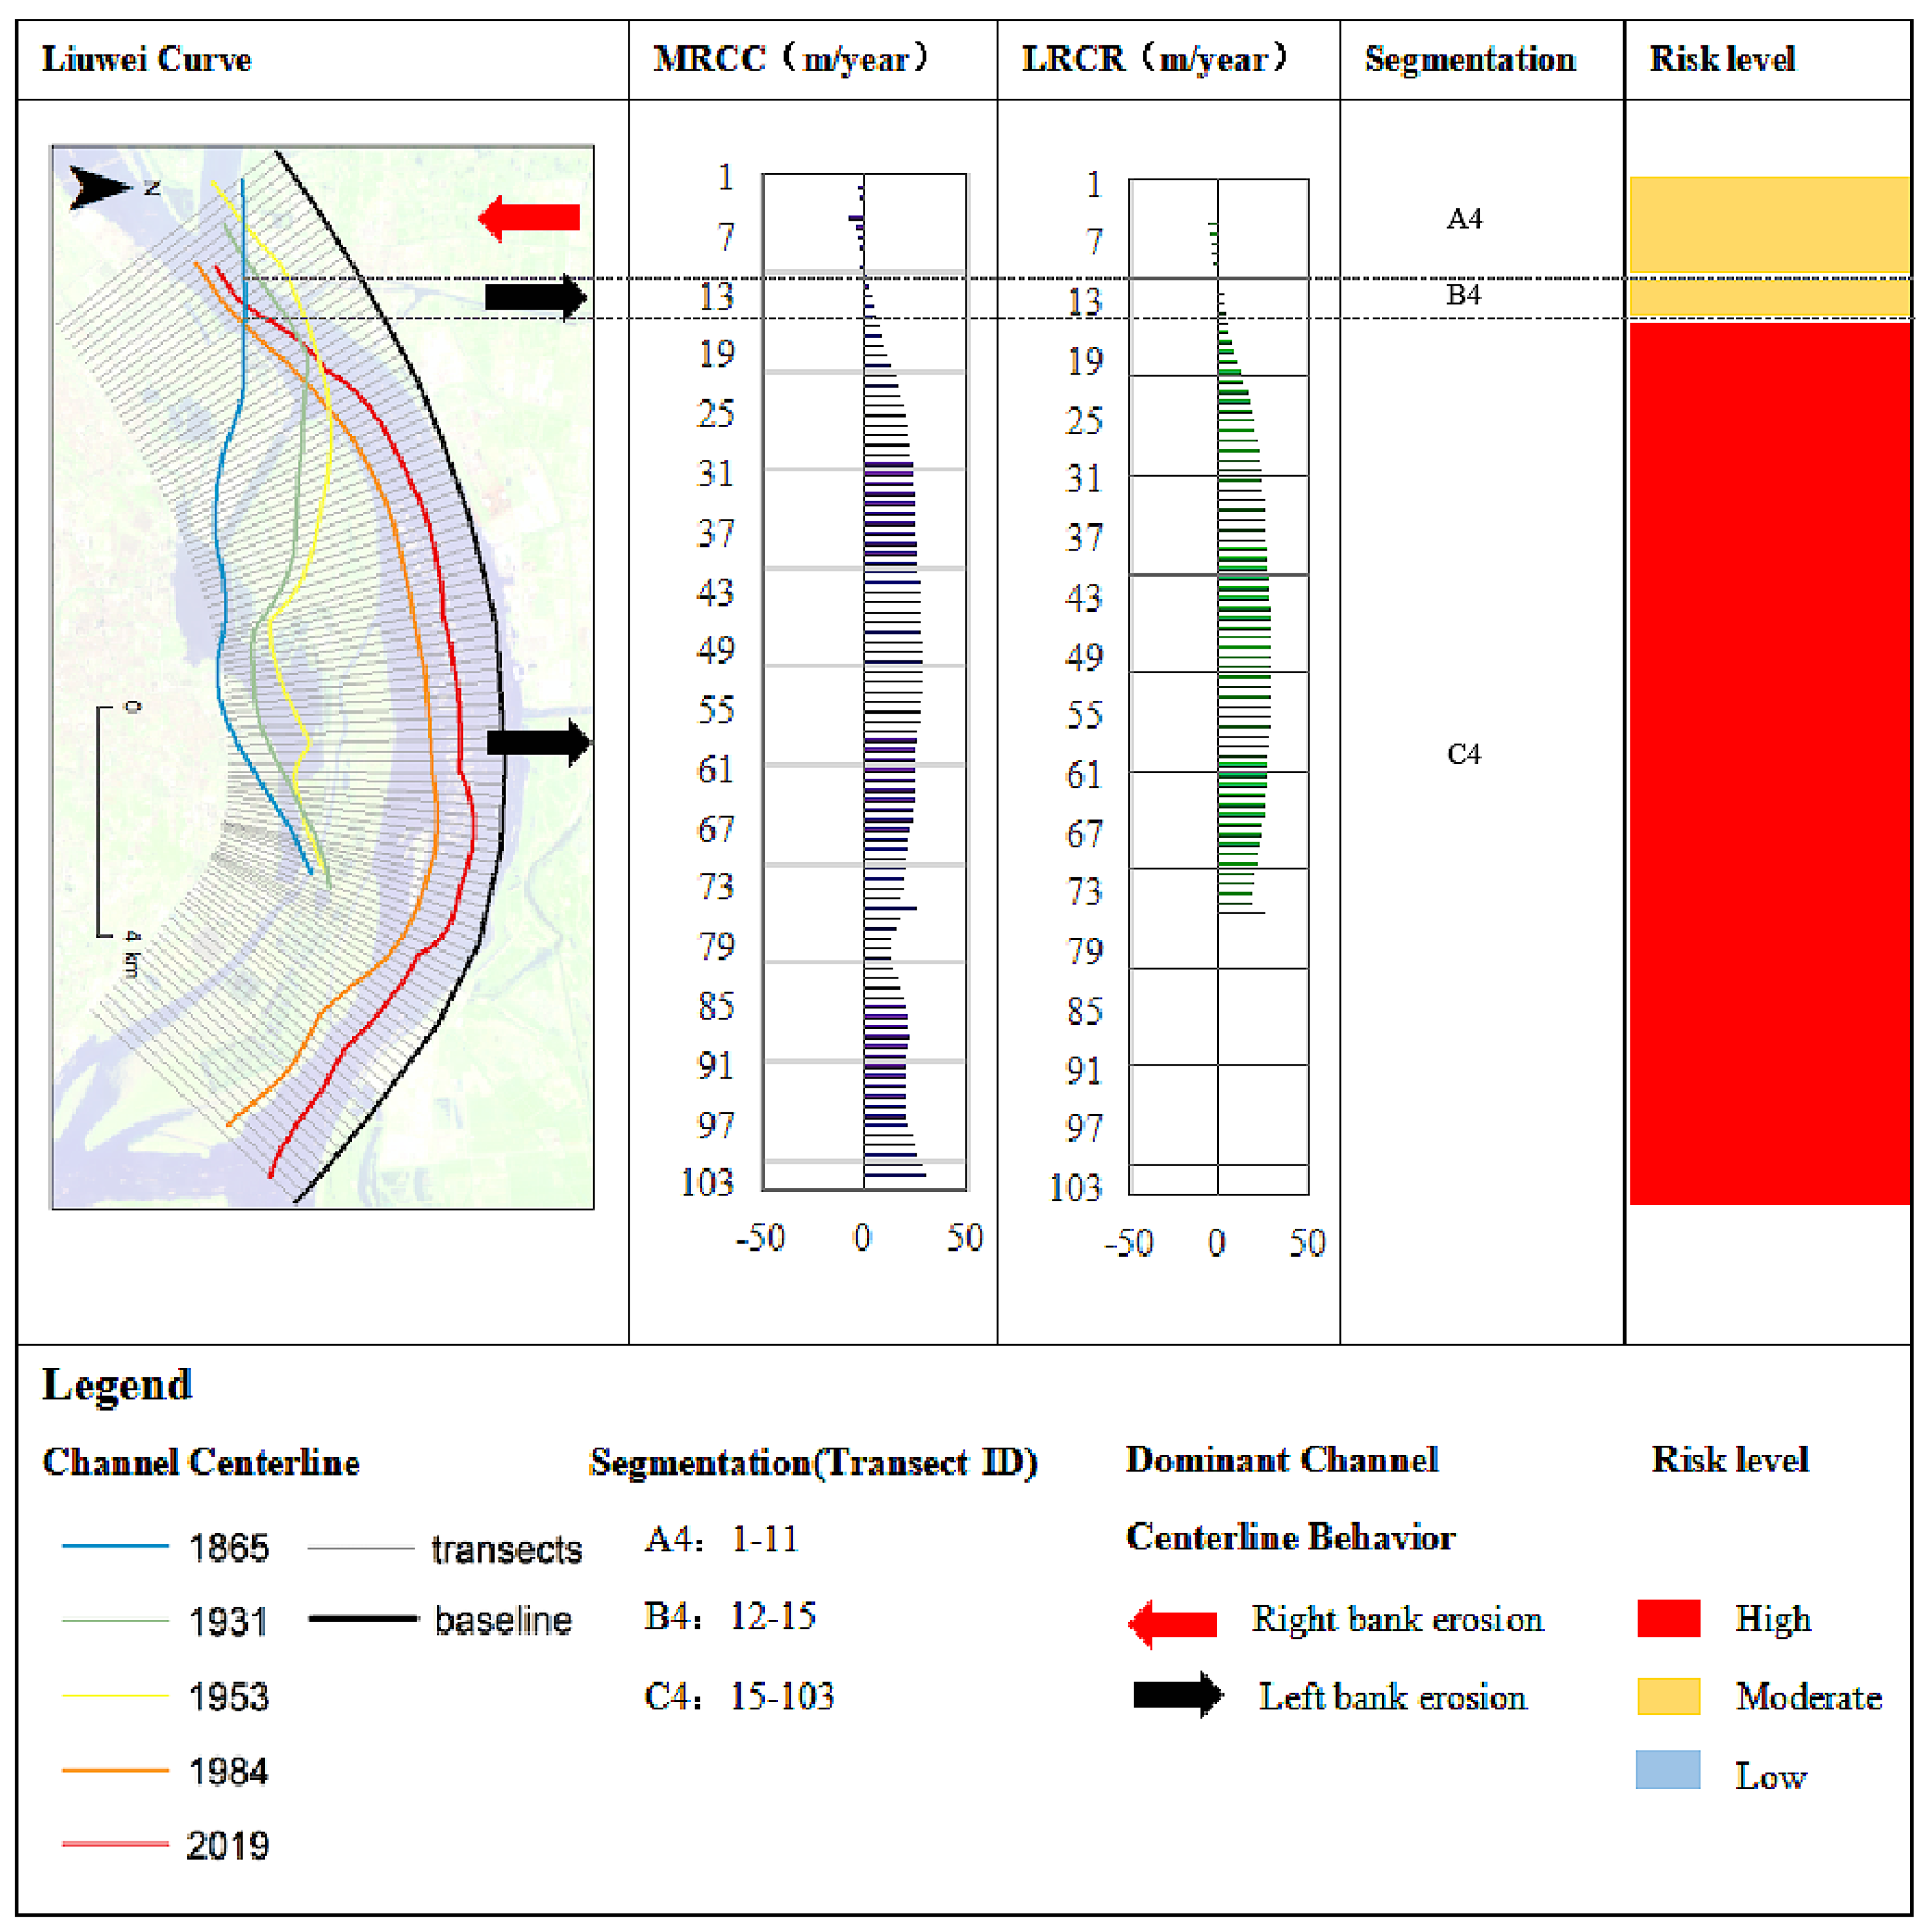
As shown in the
Figure 8, the maximum value of
MRCC of Liuwei Curve during 1868–2019 was 30.85 m/y, with an average of 18.32 m/y, and the maximum value of
LRCR was 30.29 m/y, with an average of 13.76 m/y. The number of left shifts of Liuwei Curve section is 91, and the number of right shifts is 9. Combining the direction and velocity of cross-section movement to identify the bank erosion risk, Yizheng Curve can be divided into three sections. Section A4 contains sections 1–11, and the erosion risk level is moderate on the right bank. Section B4 contains sections 12–15, and the erosion risk level is moderate on the left bank. Section C4 contains sections 15–103, and the erosion risk level is high on the left bank.
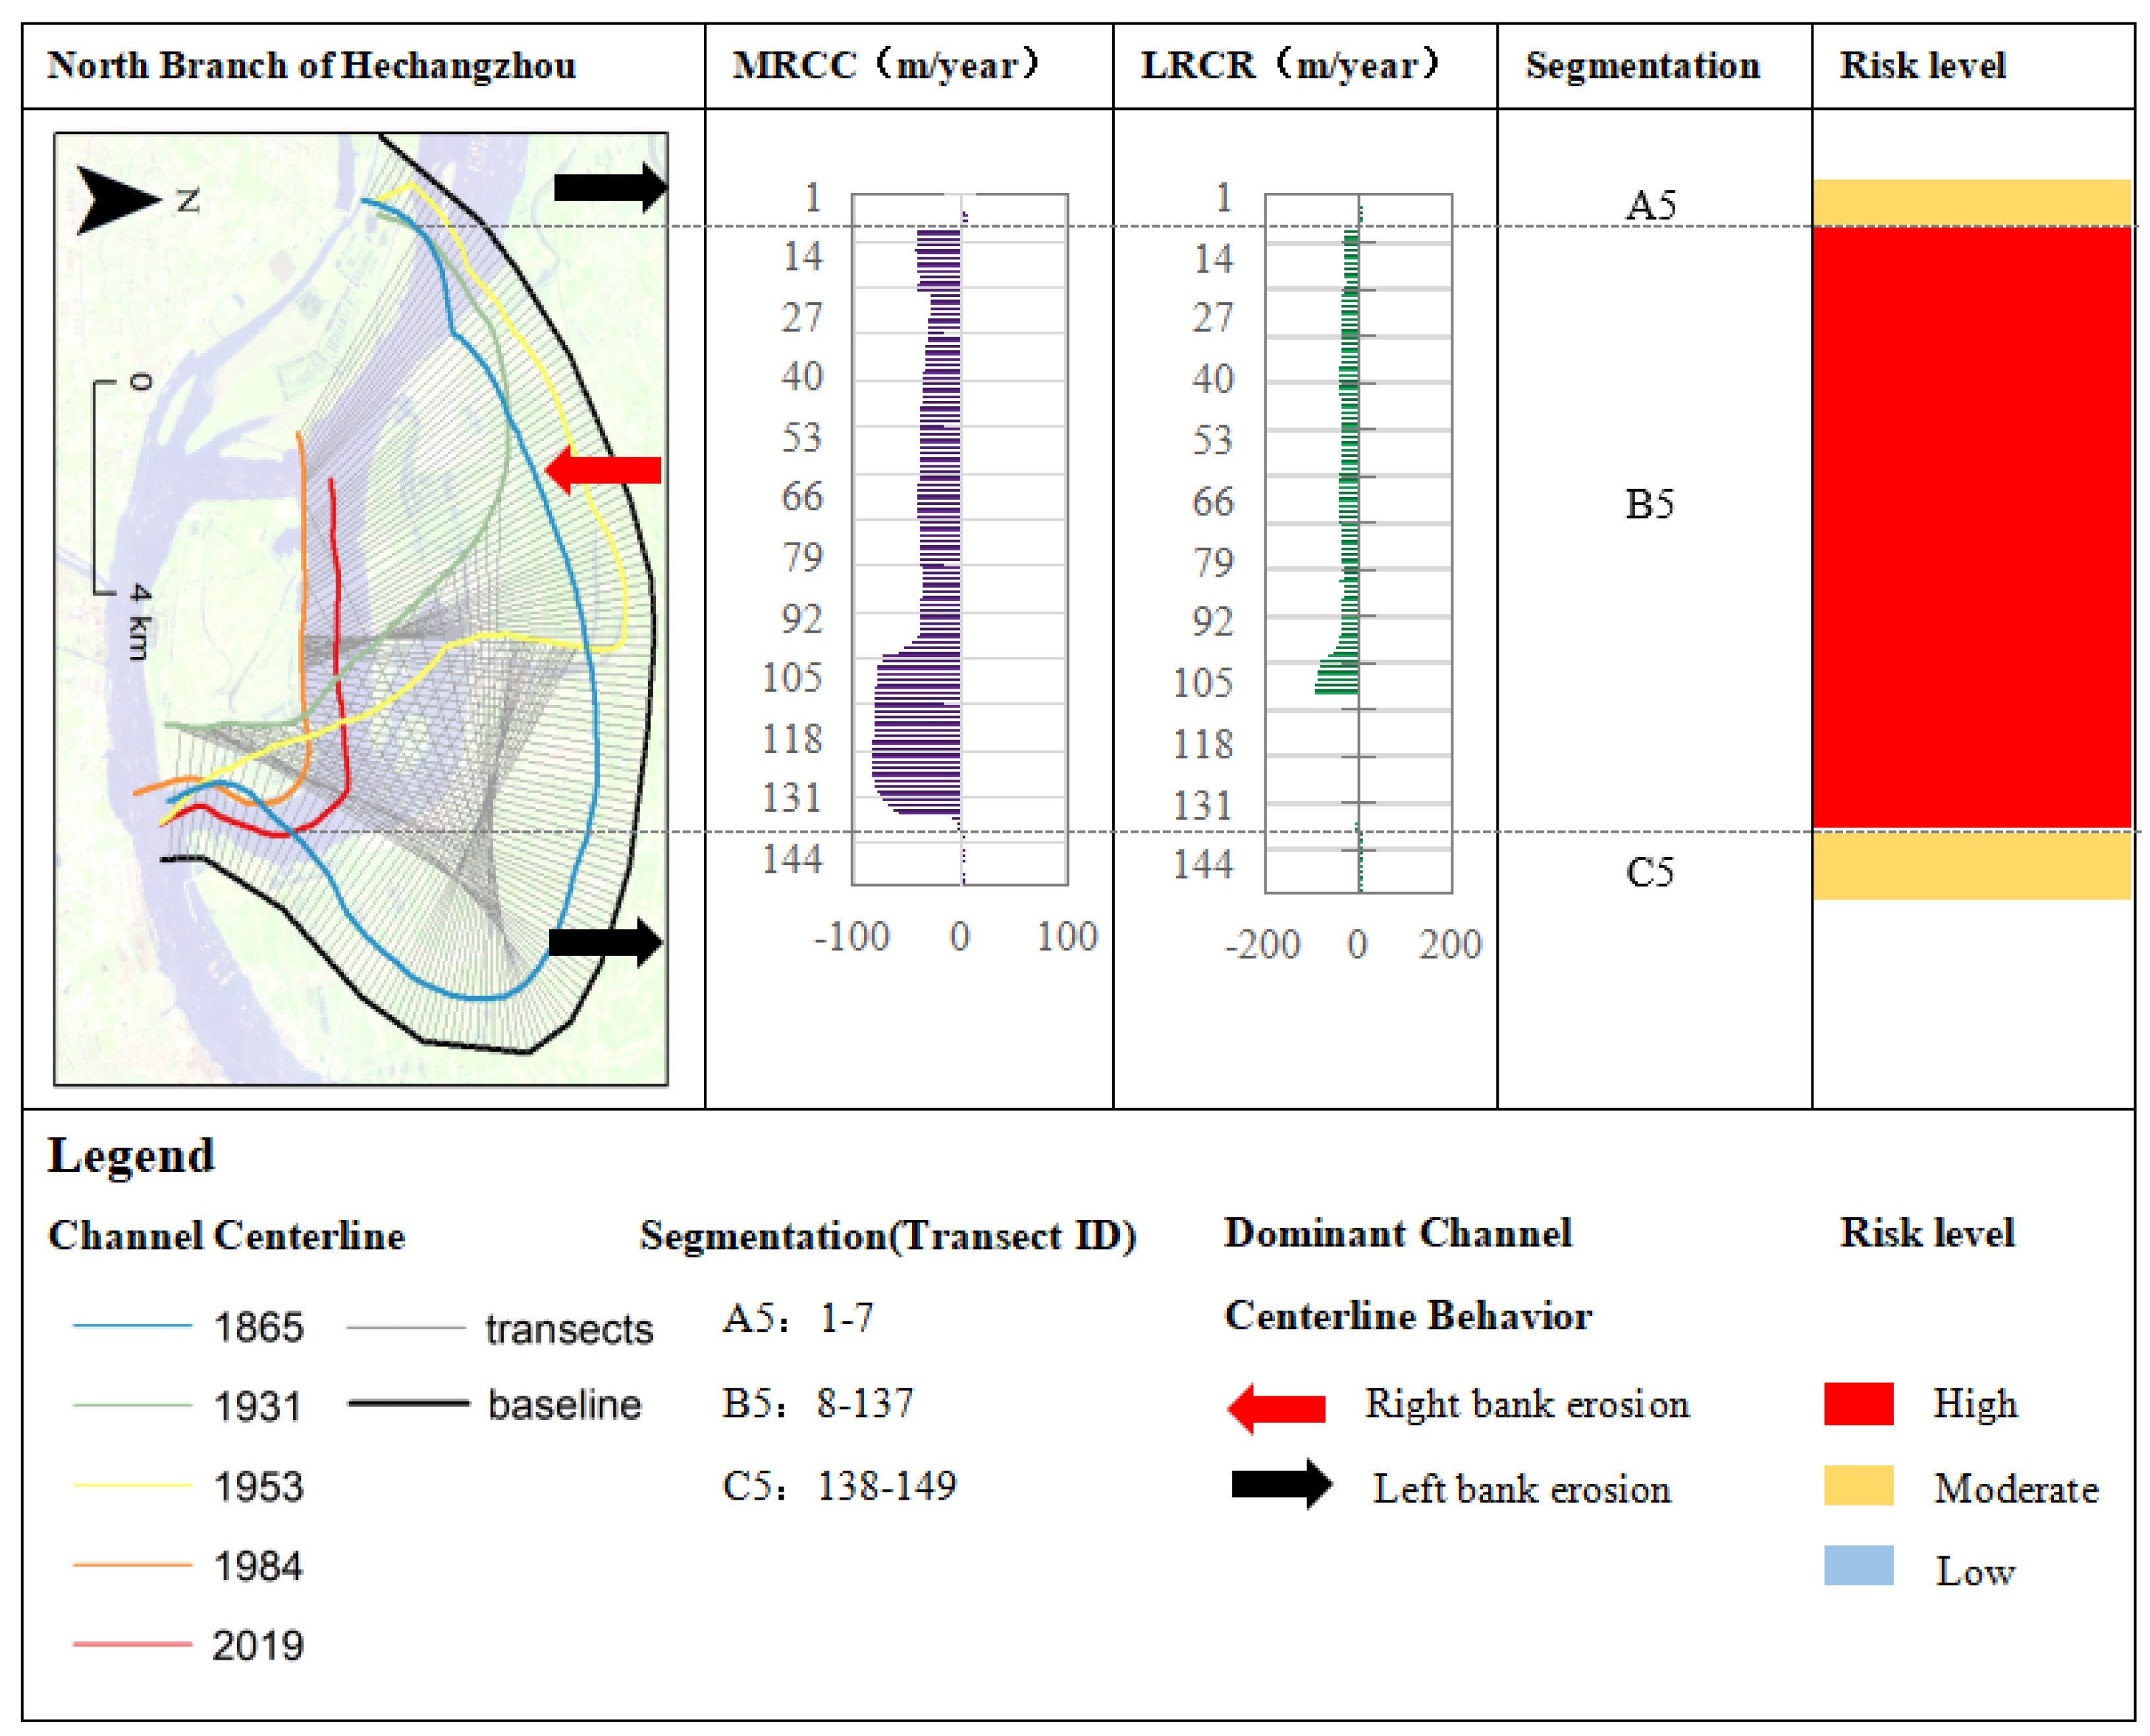
As shown in
Figure 9, the highest
MRCC value of North Branch of Hechangzhou during 1868–2019 was 82.96 m/y, with an average of 40.41 m/y, and the highest
LRCR value was 93.8 m/y, with an average of 26.83 m/y. The North Branch of Hechangzhou section moves left 12 times and right 130 times. Combining the direction and velocity of cross-section movement to identify the bank erosion risk, Yizheng Curve can be divided into three sections. Section A5 contains sections 1–7, and the erosion risk level is moderate on the left bank. Section B5 contains sections 8–137 with high risk of the right bank. Section C5 contains sections 138–149, and the erosion risk level is moderate on the left bank.
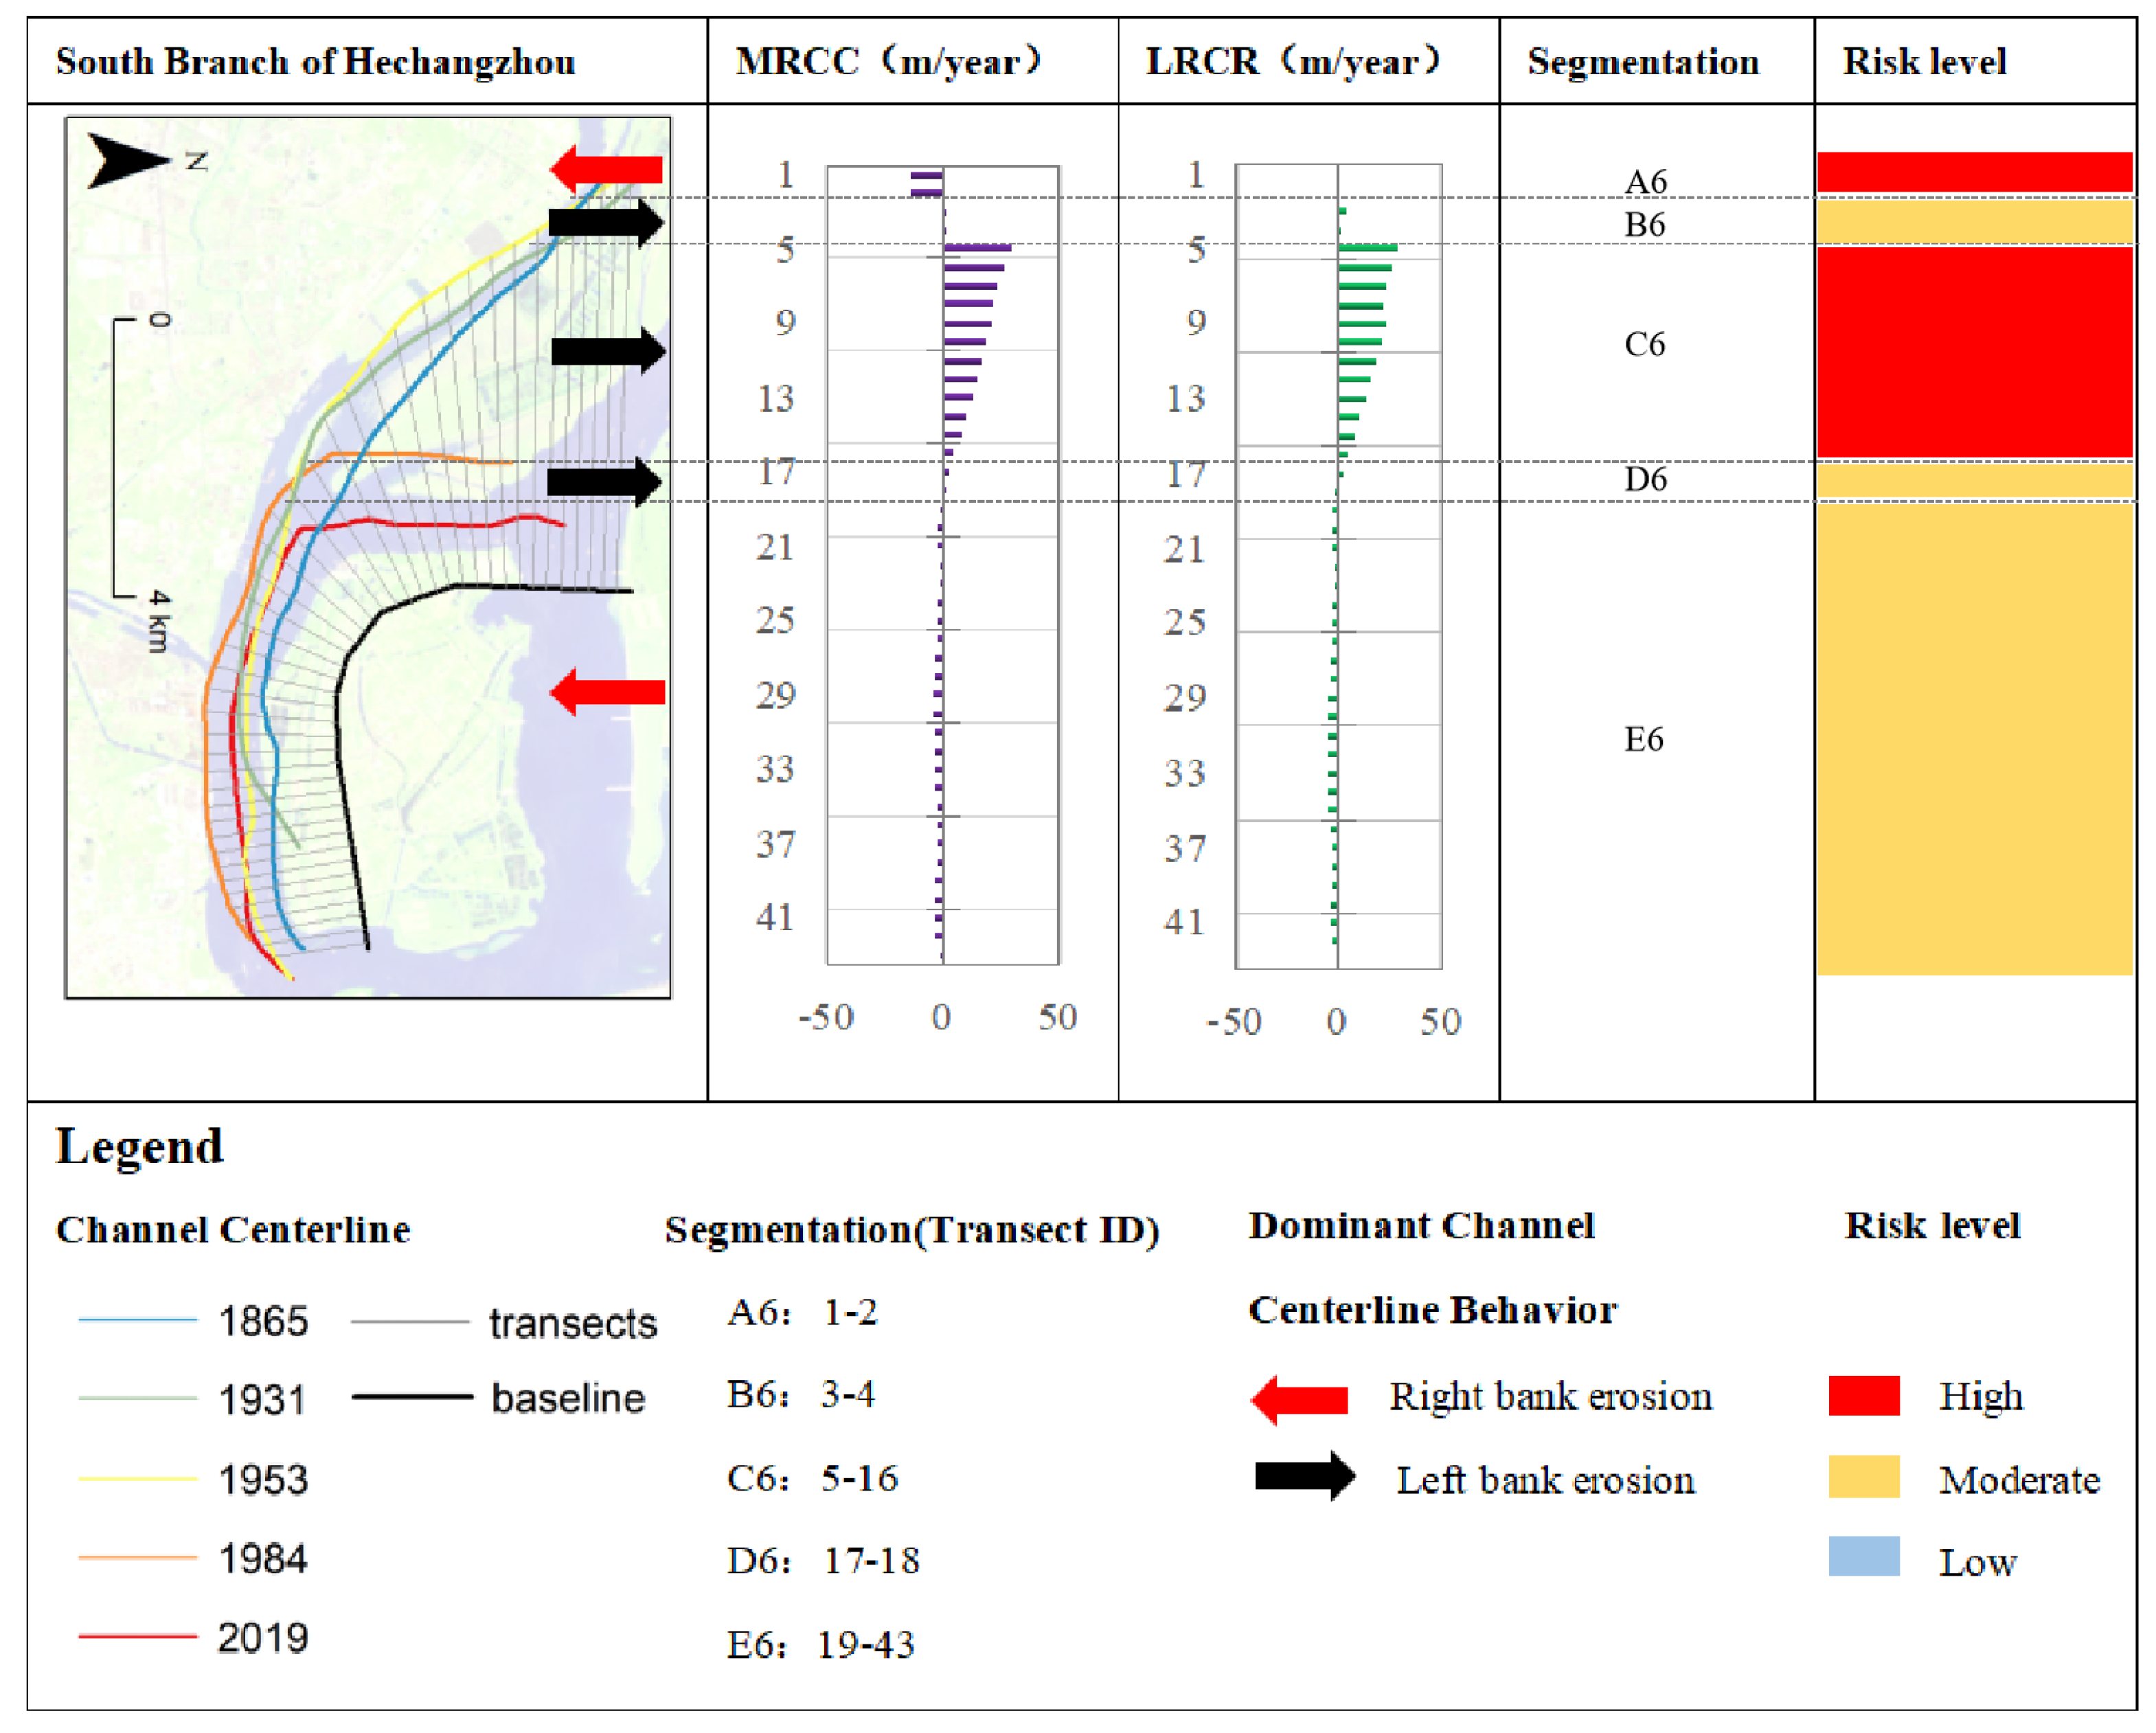
As shown in
Figure 10, the maximum
MRCC value of South Branch of Hechangzhou during 1868–2019 was 29.09 m/y, with an average of 2.69 m/y, and the maximum
LRCR value was 28.16 m/y, with an average of 2.81 m/y. The number of left shifts of South Branch of Hechangzhou section is 16, and the number of right shifts is 27. Combining the direction and velocity of cross-section movement to identify the bank erosion risk, Yizheng Curve can be divided into five sections. Section A6 contains sections 1–2, and the erosion risk level is high on the right bank. Section B6 contains sections 3–4, and the erosion risk level is moderate on the left bank. Section C6 contains sections 5–16, and the erosion risk level is high on the left bank. Section D6 contains sections 17–18, and the erosion risk level is moderate on the left bank. Section E6 contains sections 19–43, and the erosion risk level is moderate on the left bank.
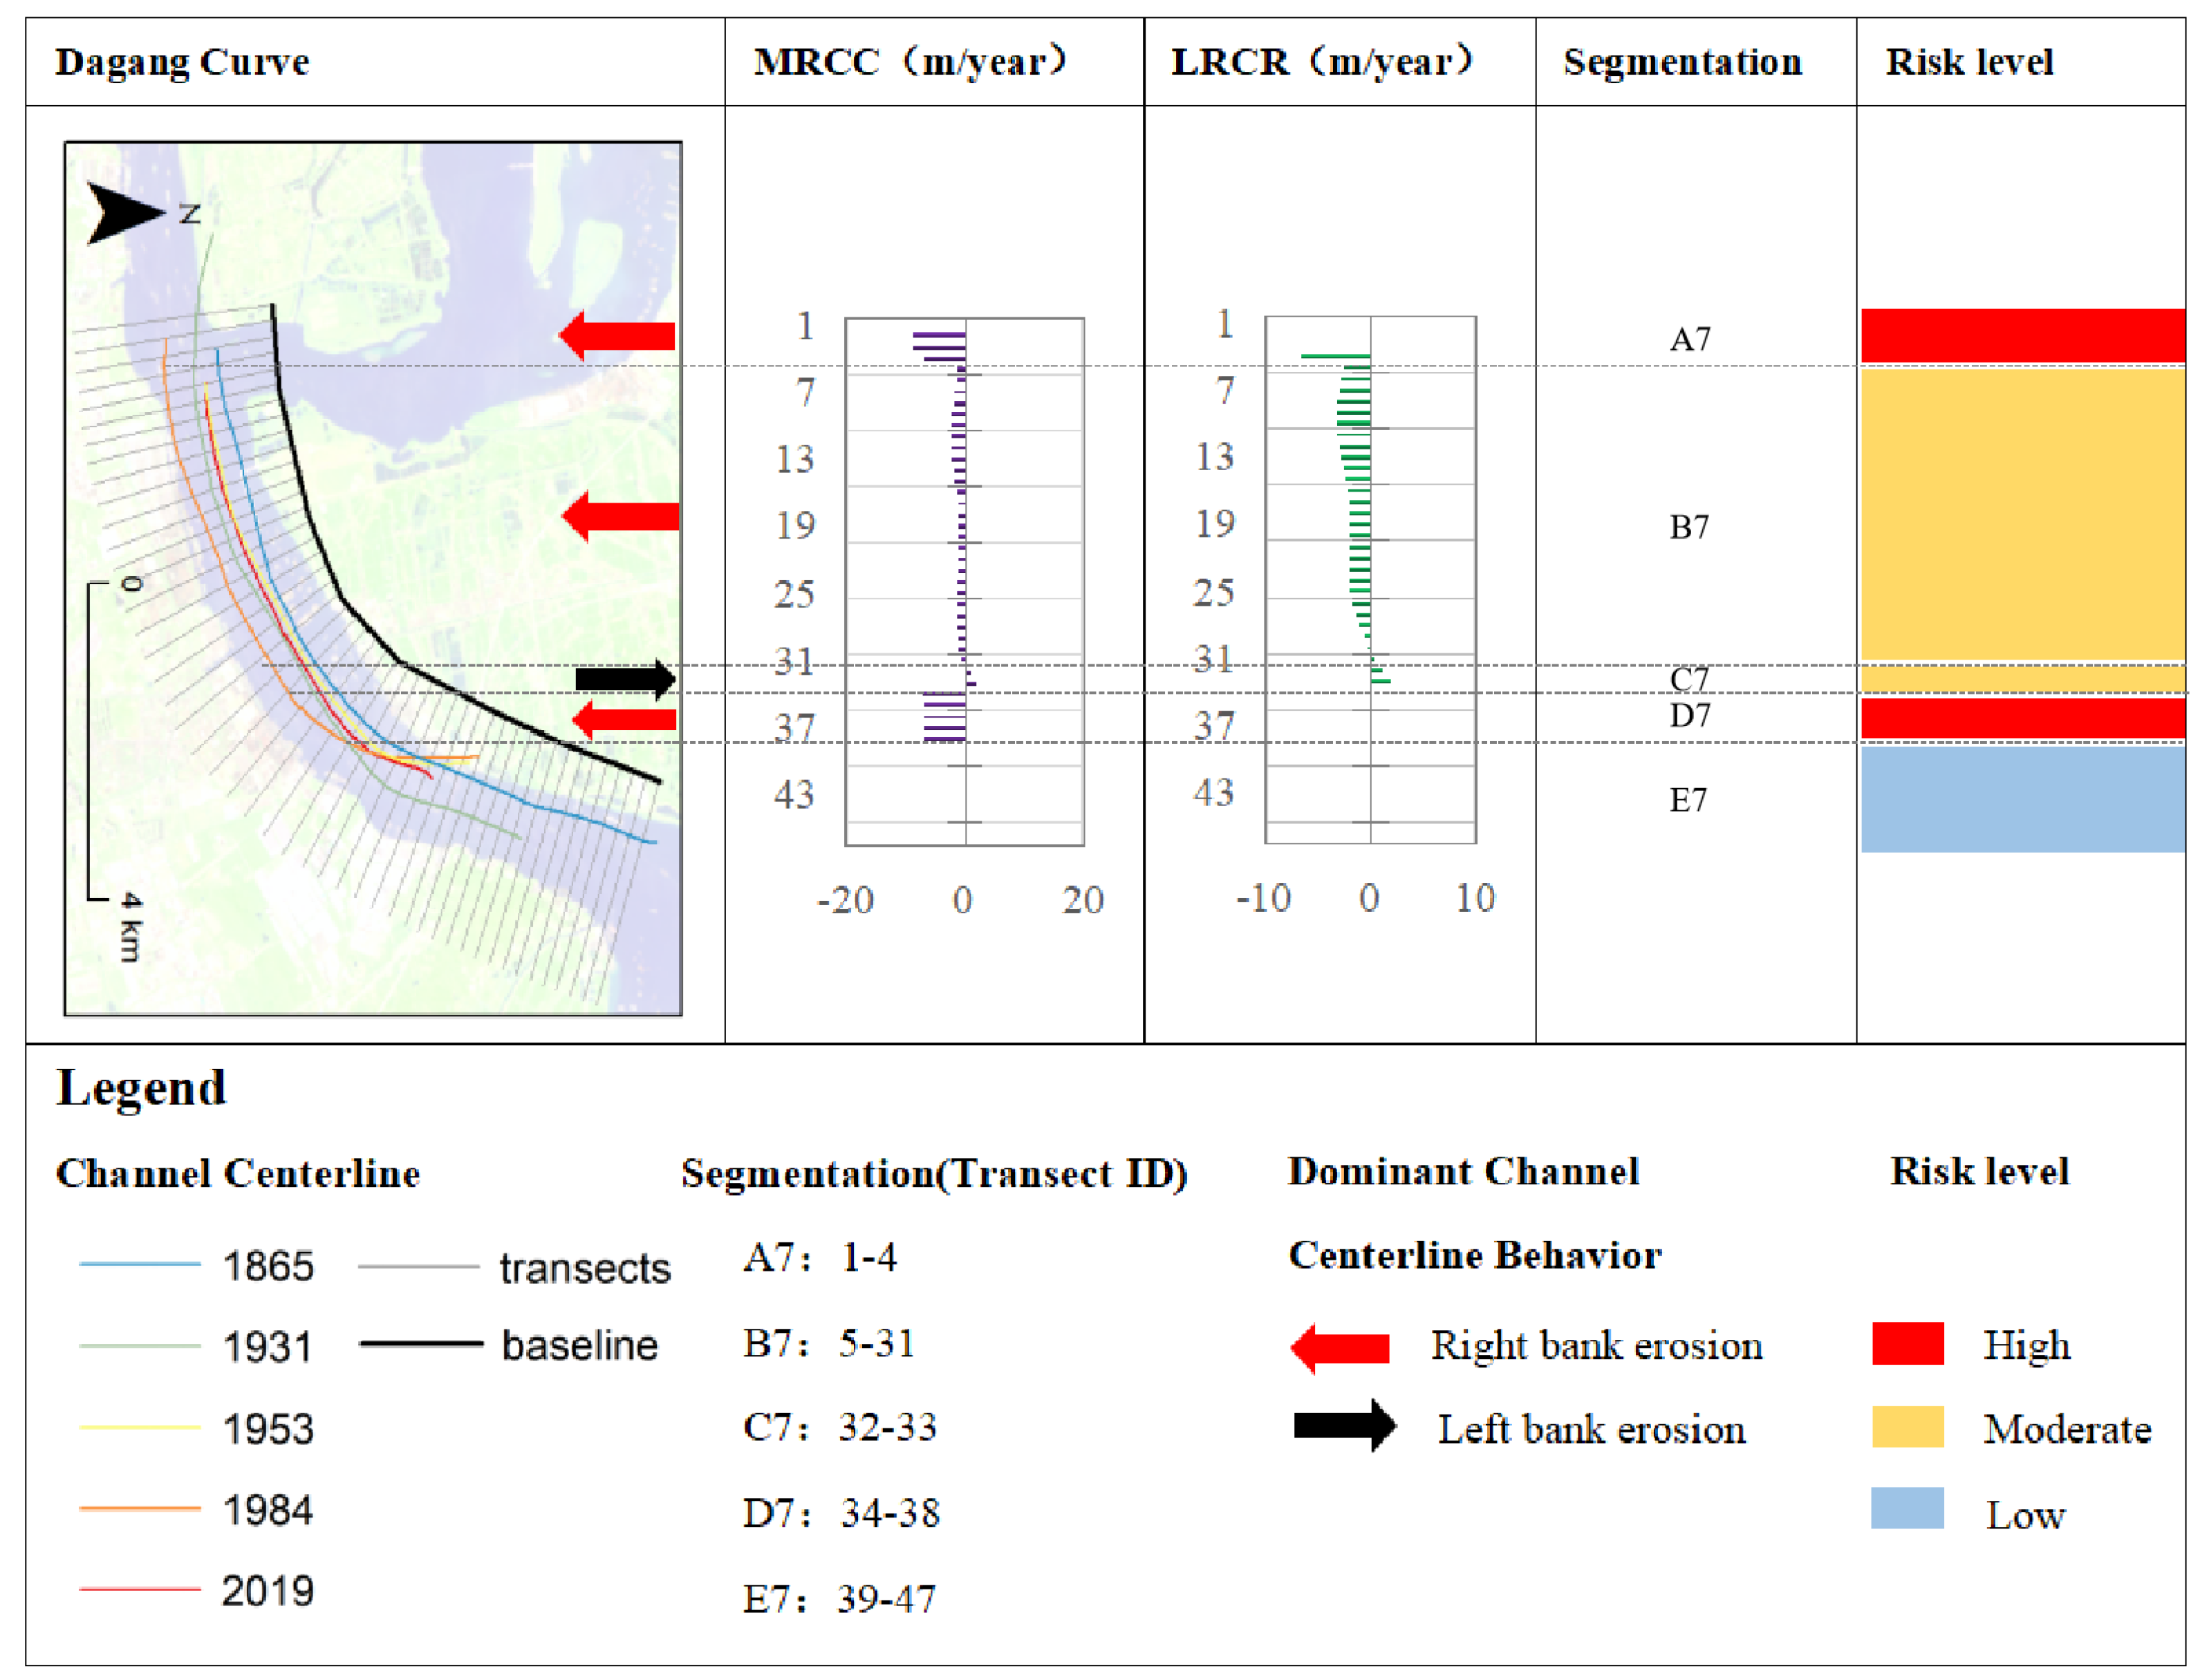
As shown in
Figure 11, the maximum value of
MRCC of Dagang Curve during 1868–2019 was 8.71 m/y, with an average of 2.05 m/y, and the maximum value of
LRCR was 6.71 m/y, with an average of 1.26 m/y. The number of left shifts of Dagang Curve section is 2, and the number of right shifts is 35. Combining the direction and velocity of cross-section movement to identify the bank erosion risk, Yizheng Curve can be divided into five sections. Section A7 contains sections 1–4, and the erosion risk level is high on the right bank. Section B7 contains sections 5–31, and the erosion risk level is moderate on the right bank. Section C7 contains sections 32–33, and the erosion risk level is moderate on the left bank. Section D7 contains sections 34–38, and the erosion risk level is high on the right bank. Section E7 comprises sections 39–47, with a low risk rating for riparian erosion.
3.3. Influence Factors of Channel Centerline Changes
Channel evolution covers various deformation components such as adjustments in planform and cross-sectional geometries, and channel migration is a critical component of channel planform adjustments in alluvial rivers. Factors influencing channel migration mainly include changes in river boundary conditions, hydrological and sediment changes, and sandbanks merging. These influencing factors are presented herein to investigate the variation characteristics in the variation characteristics of the migration intensity of the channel centerline of the Zhenjiang-Yangzhou reach of the Yangtze River.
3.3.1. Changes of River Boundary Conditions
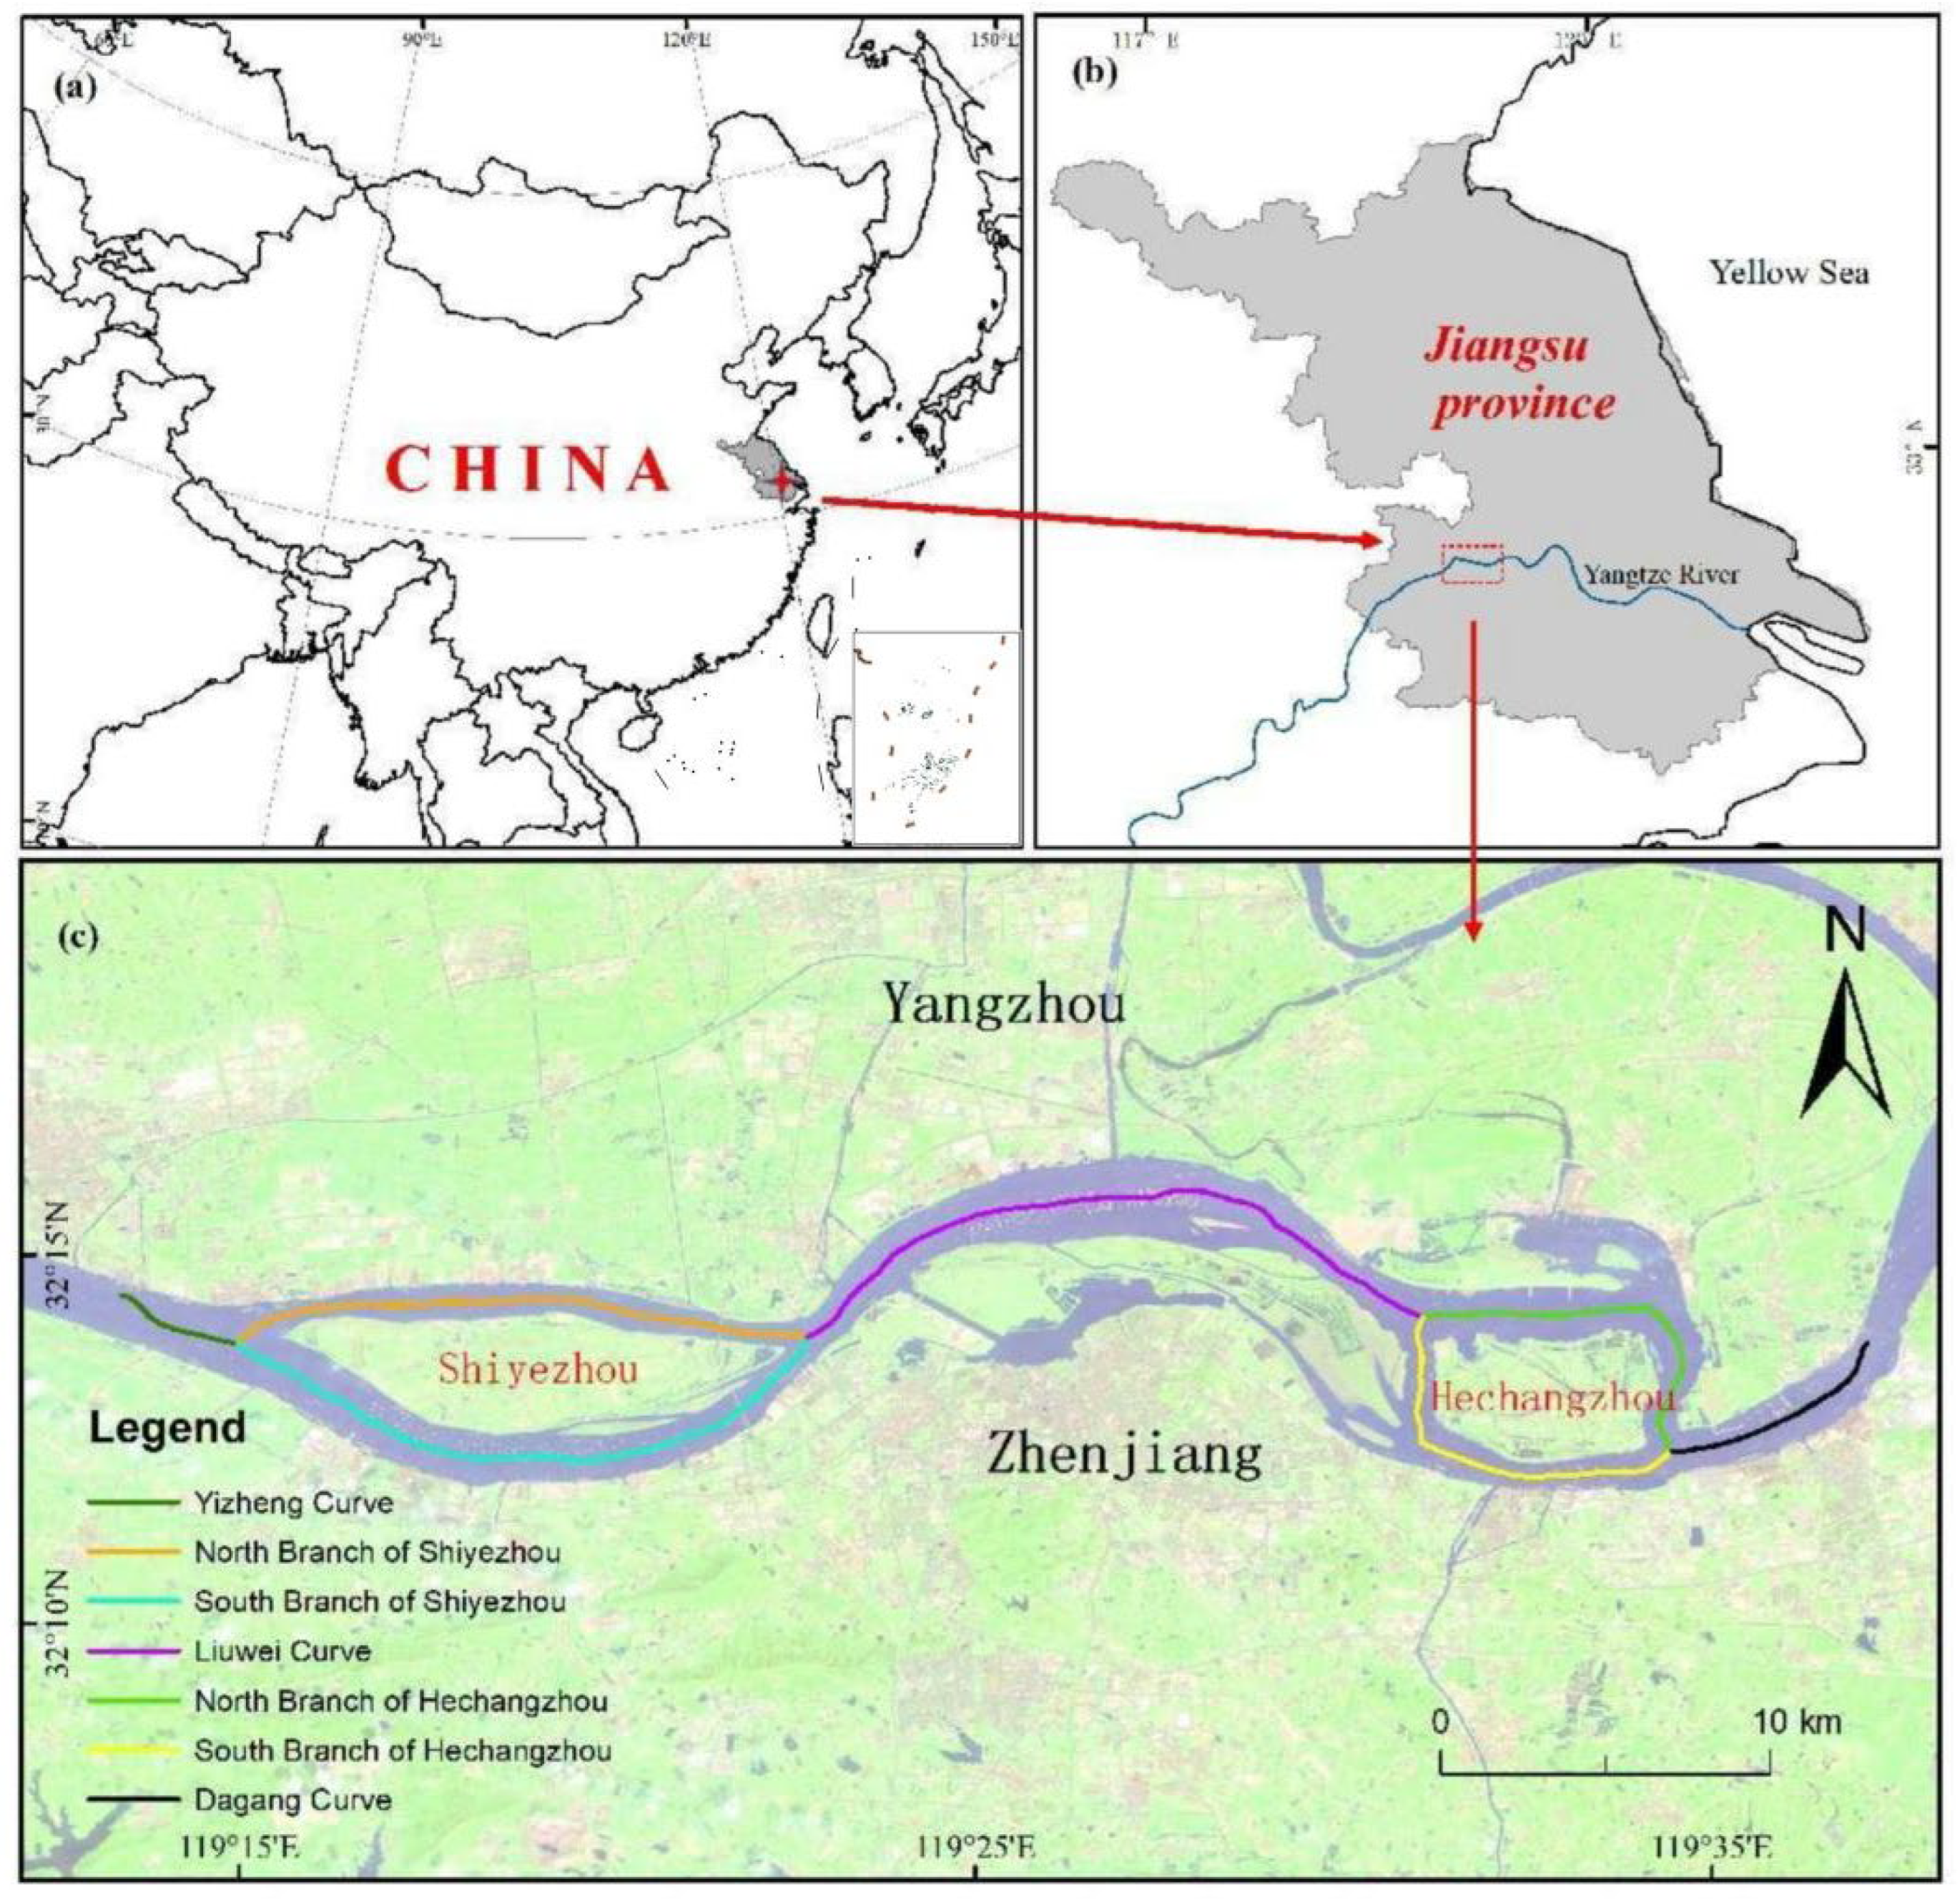
The Zhenjiang-Yangzhou reach is located at the top of the Yangtze River Delta, and the tidal current of the Yangtze River estuary can reach the reach to form a jacking effect. Therefore, the boundary conditions of the river will change with the dynamic changes of the material composition of the riverbed, topography, water level difference, and river slope.
The geological structure of the located Yangzhou reach belongs to the Yangzi quasi-platform, and the river trend is basically consistent with the geological structure trend, showing a west-east trend. The river valley reached by the Zhenjiang-Yangzhou reach is narrow in the upper part and wide in the lower, showing an asymmetric horn shape. Both sides are alluvial plains, and outward are loess terraces and low hills. The riverbed is mostly composed of fine sand or silt, and there are medium-coarse sand and gravel in the deep groove.
The southern bank of the reach is the Xiashu loess terrace and part of the impact plain at the northern foot of the Ningzhen Mountains. The Xiashu loess was formed about 100,000 years ago by river accumulation. All the riverbeds and bank walls made up of Xiashu soil are hard and have strong impact resistance. The riverbed on the south bank of the reach is mostly composed of Xiashu loess with good impact resistance except for Zhengzunzhou and a few bank walls. Therefore, all the rivers adjacent to the south bank (right bank) are not seriously eroded except the South Branch of Shiyezhou, where the south bank is continuously eroded.
The north bank of the reach can be divided into two parts from the terrain. Weiyang Loess Platform is located in the north of Yizheng to Yangzhou line. Loess is widely distributed and stretches for tens of kilometers. The southeast and east are the alluvial plains of the Yangtze River Delta. This area was once a shallow estuary area in history. The riverbed and bank wall there have poor erosion resistance and are easy to be washed by water. Therefore, after the crest point gradually moves to the northern bank of the adjacent curve opposite Jinshan Mountain, the central line of the channel moves northward rapidly.
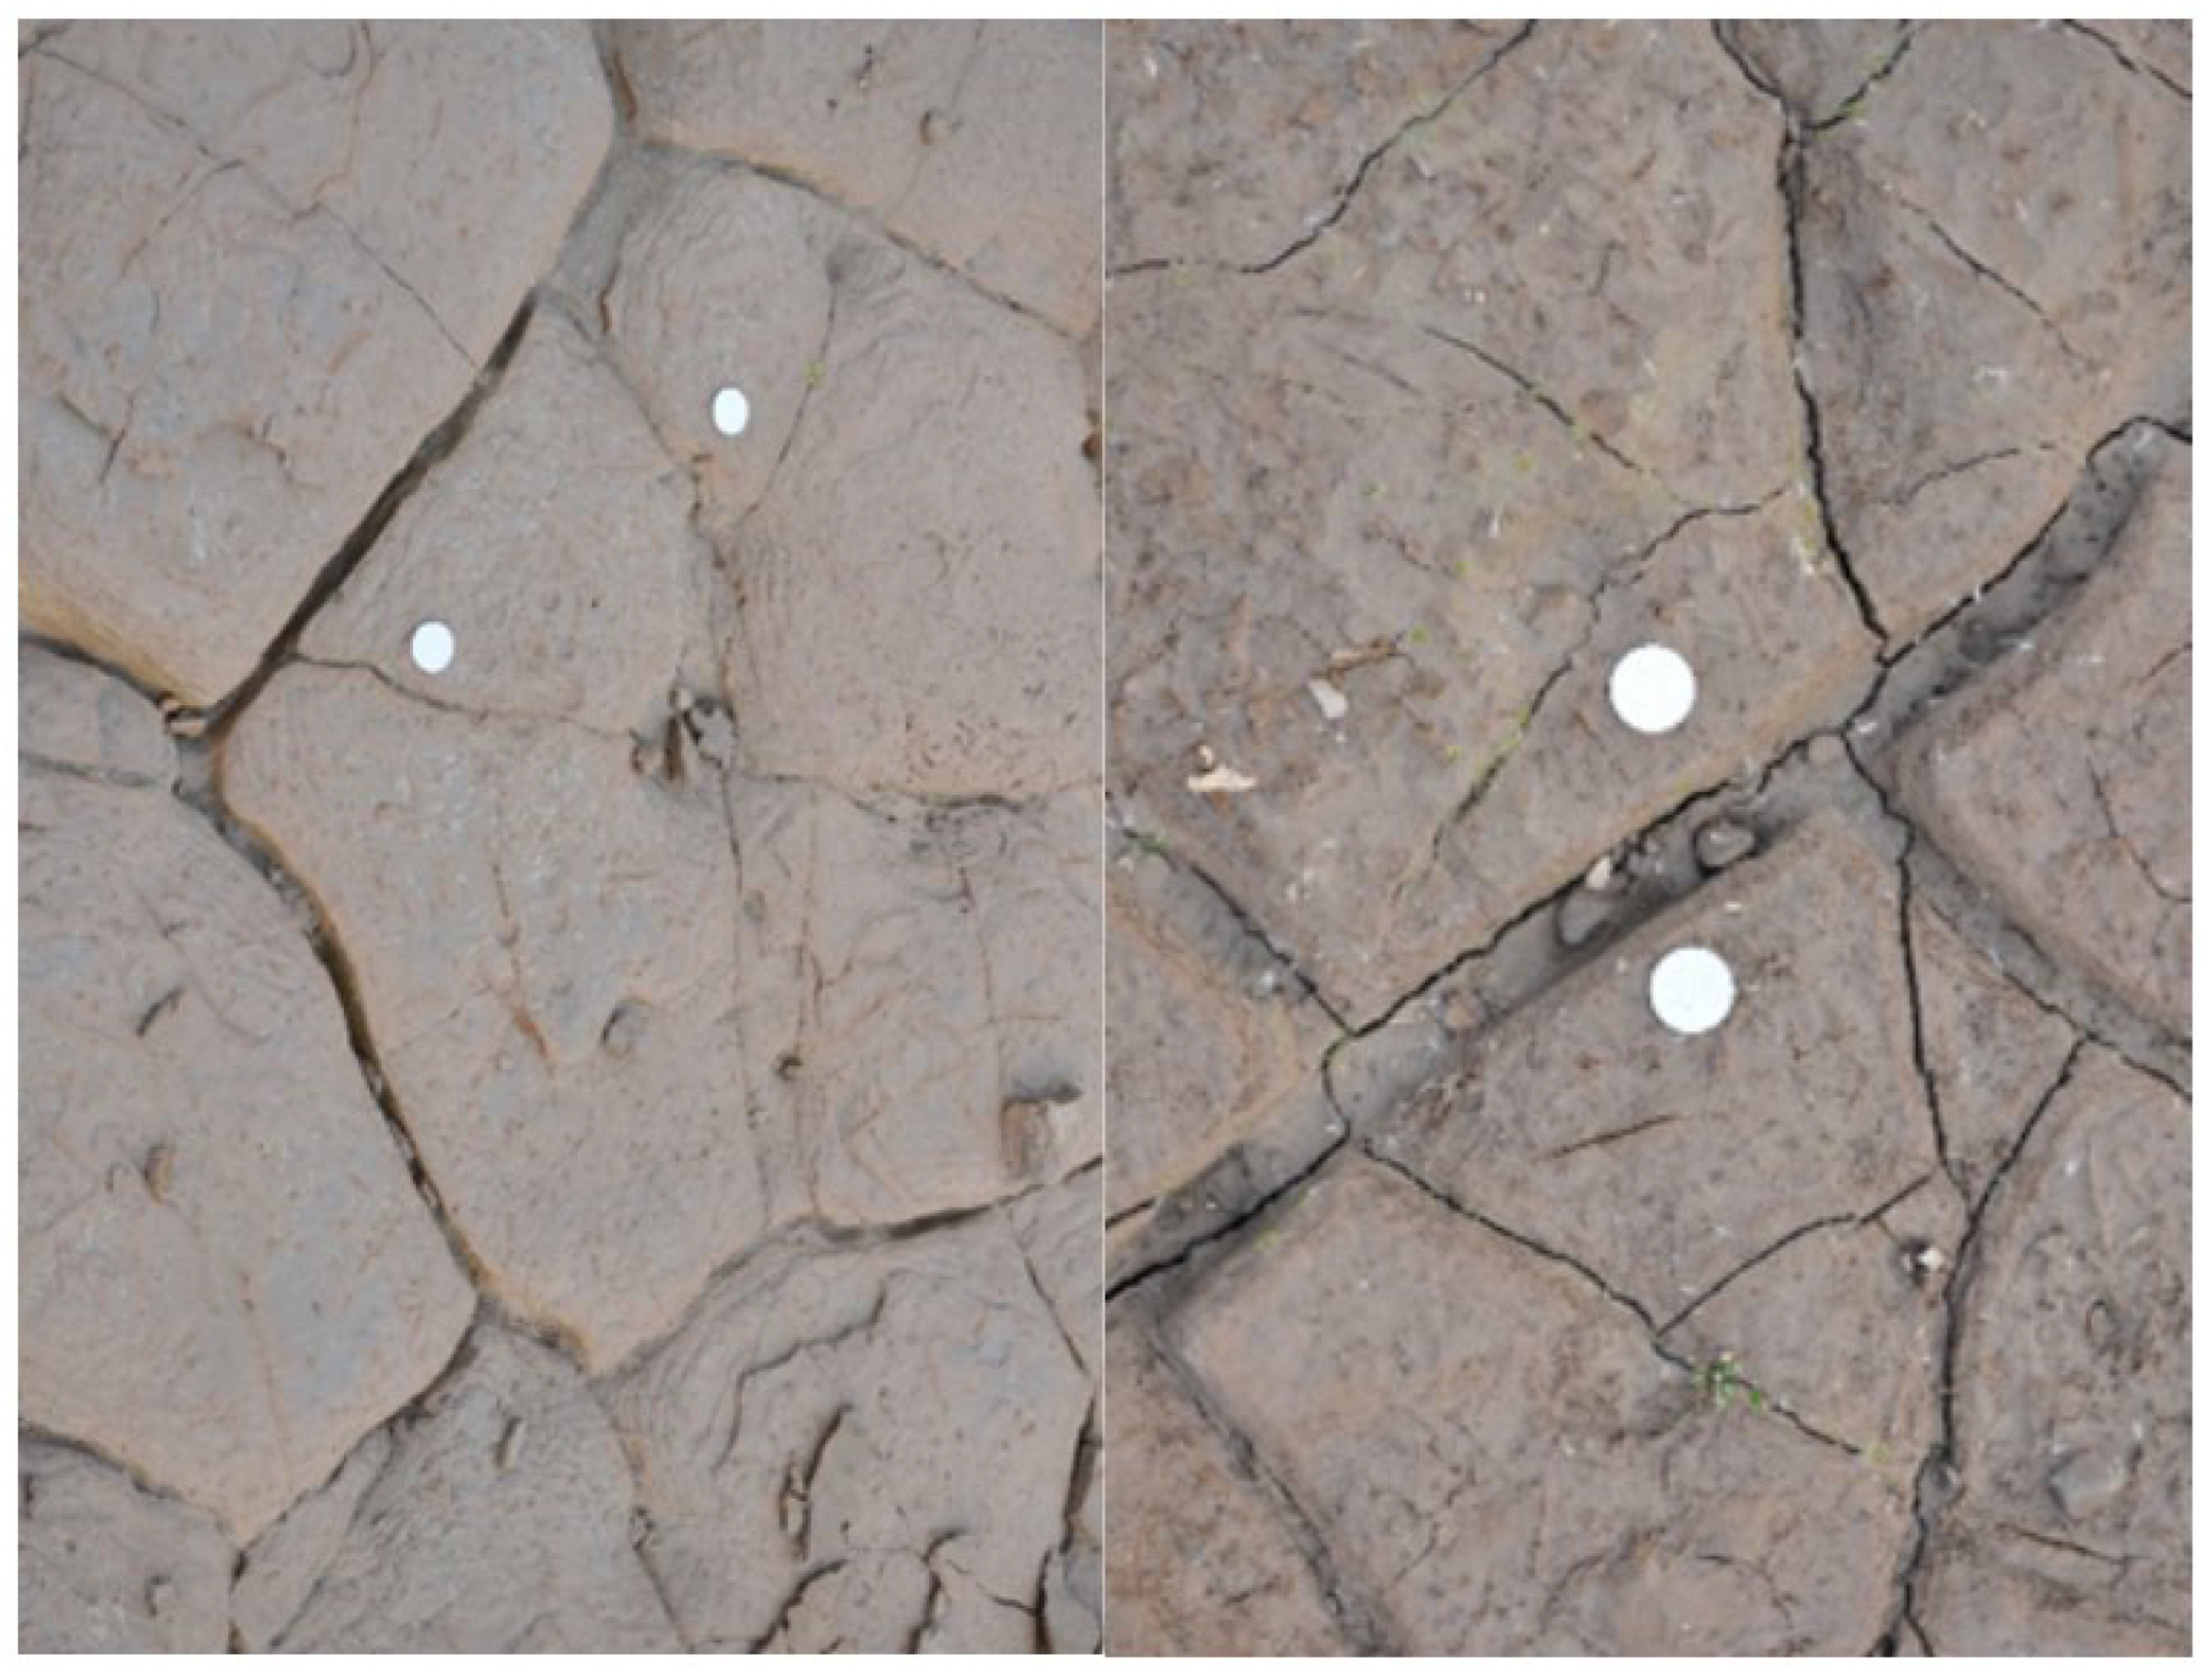
The hard soil or bedrock outcrops in the river reach are not easy to scour. The bank wall has become a good diversion barrier, and even if there are some concave alluvial soil banks, due to the inertia of the flow, in general, in flood years, a large scour will not occur. However, the soil conditions of river floodplains are different. According to the investigation and study of the modern river floodplain sedimentary columnar samples collected in our field and the outcrop profile in the field, it was found that the mud deposits deposited at a high water level in the flood period of the river reach are prone to mud cracks in the dry and rainy environment and have obvious characteristics of mud cracks.
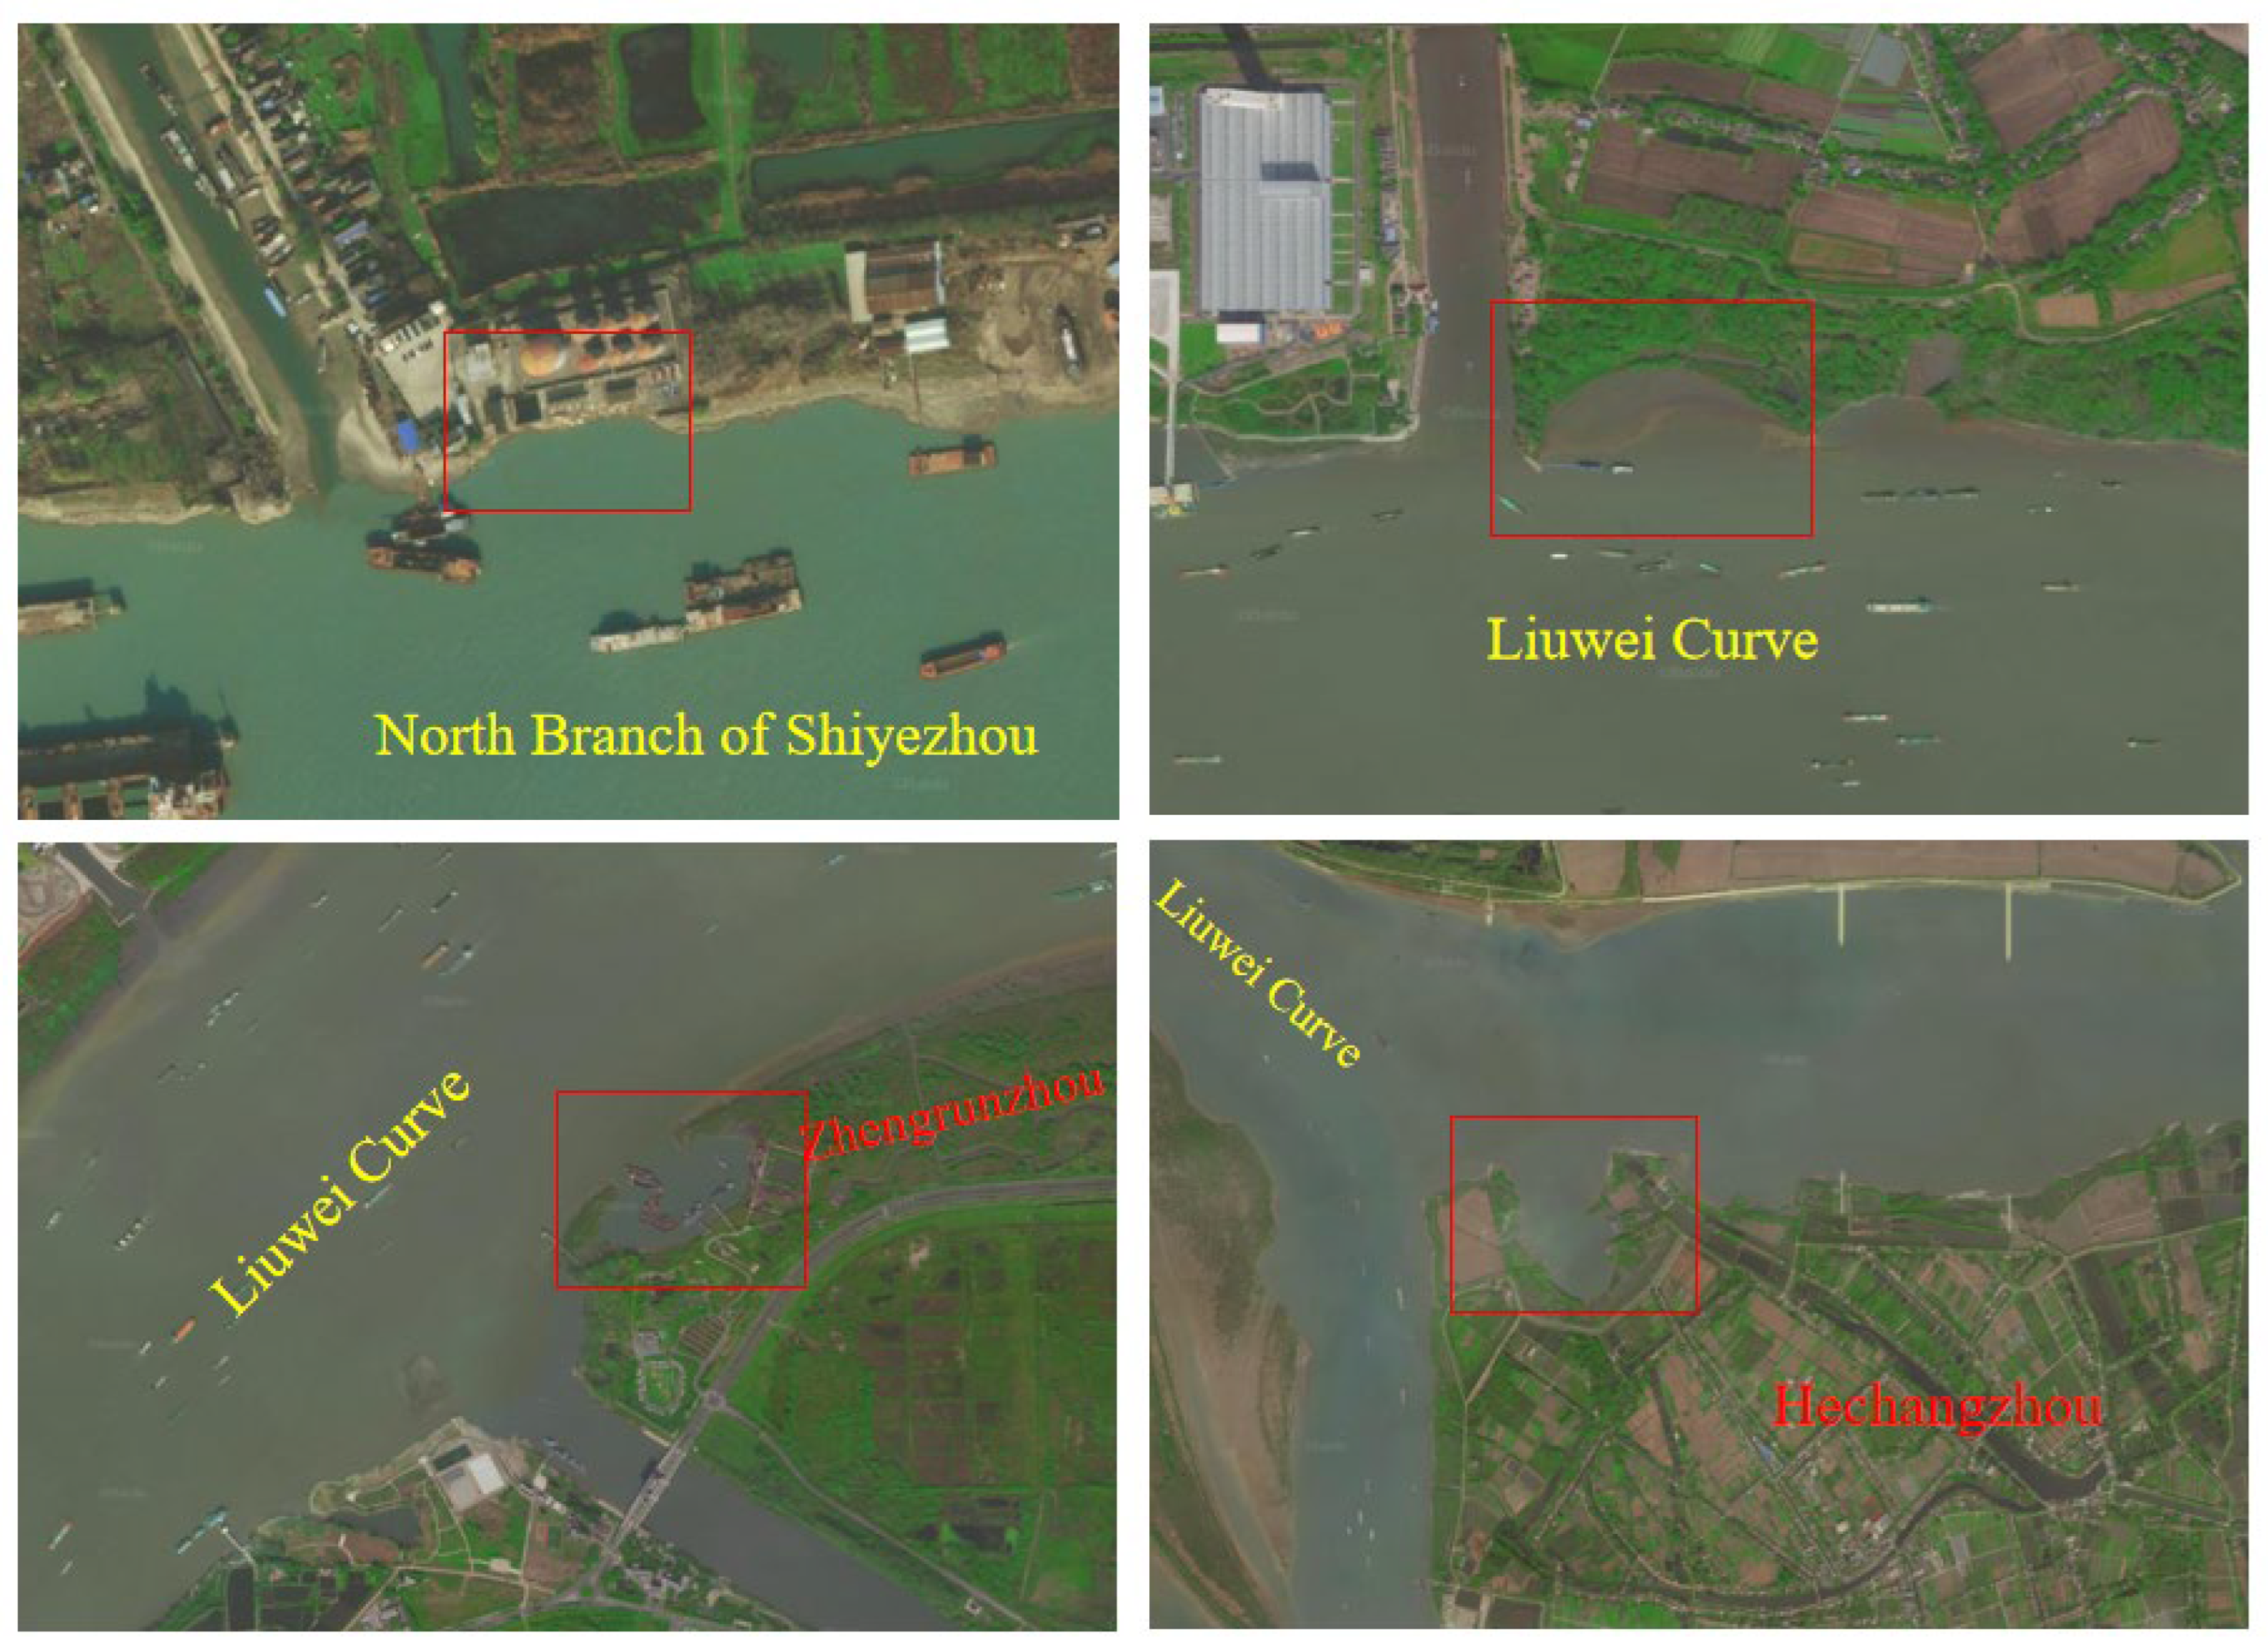
Figure 12 shows the scene images of dense mud cracks found near Zhengrunzhou.
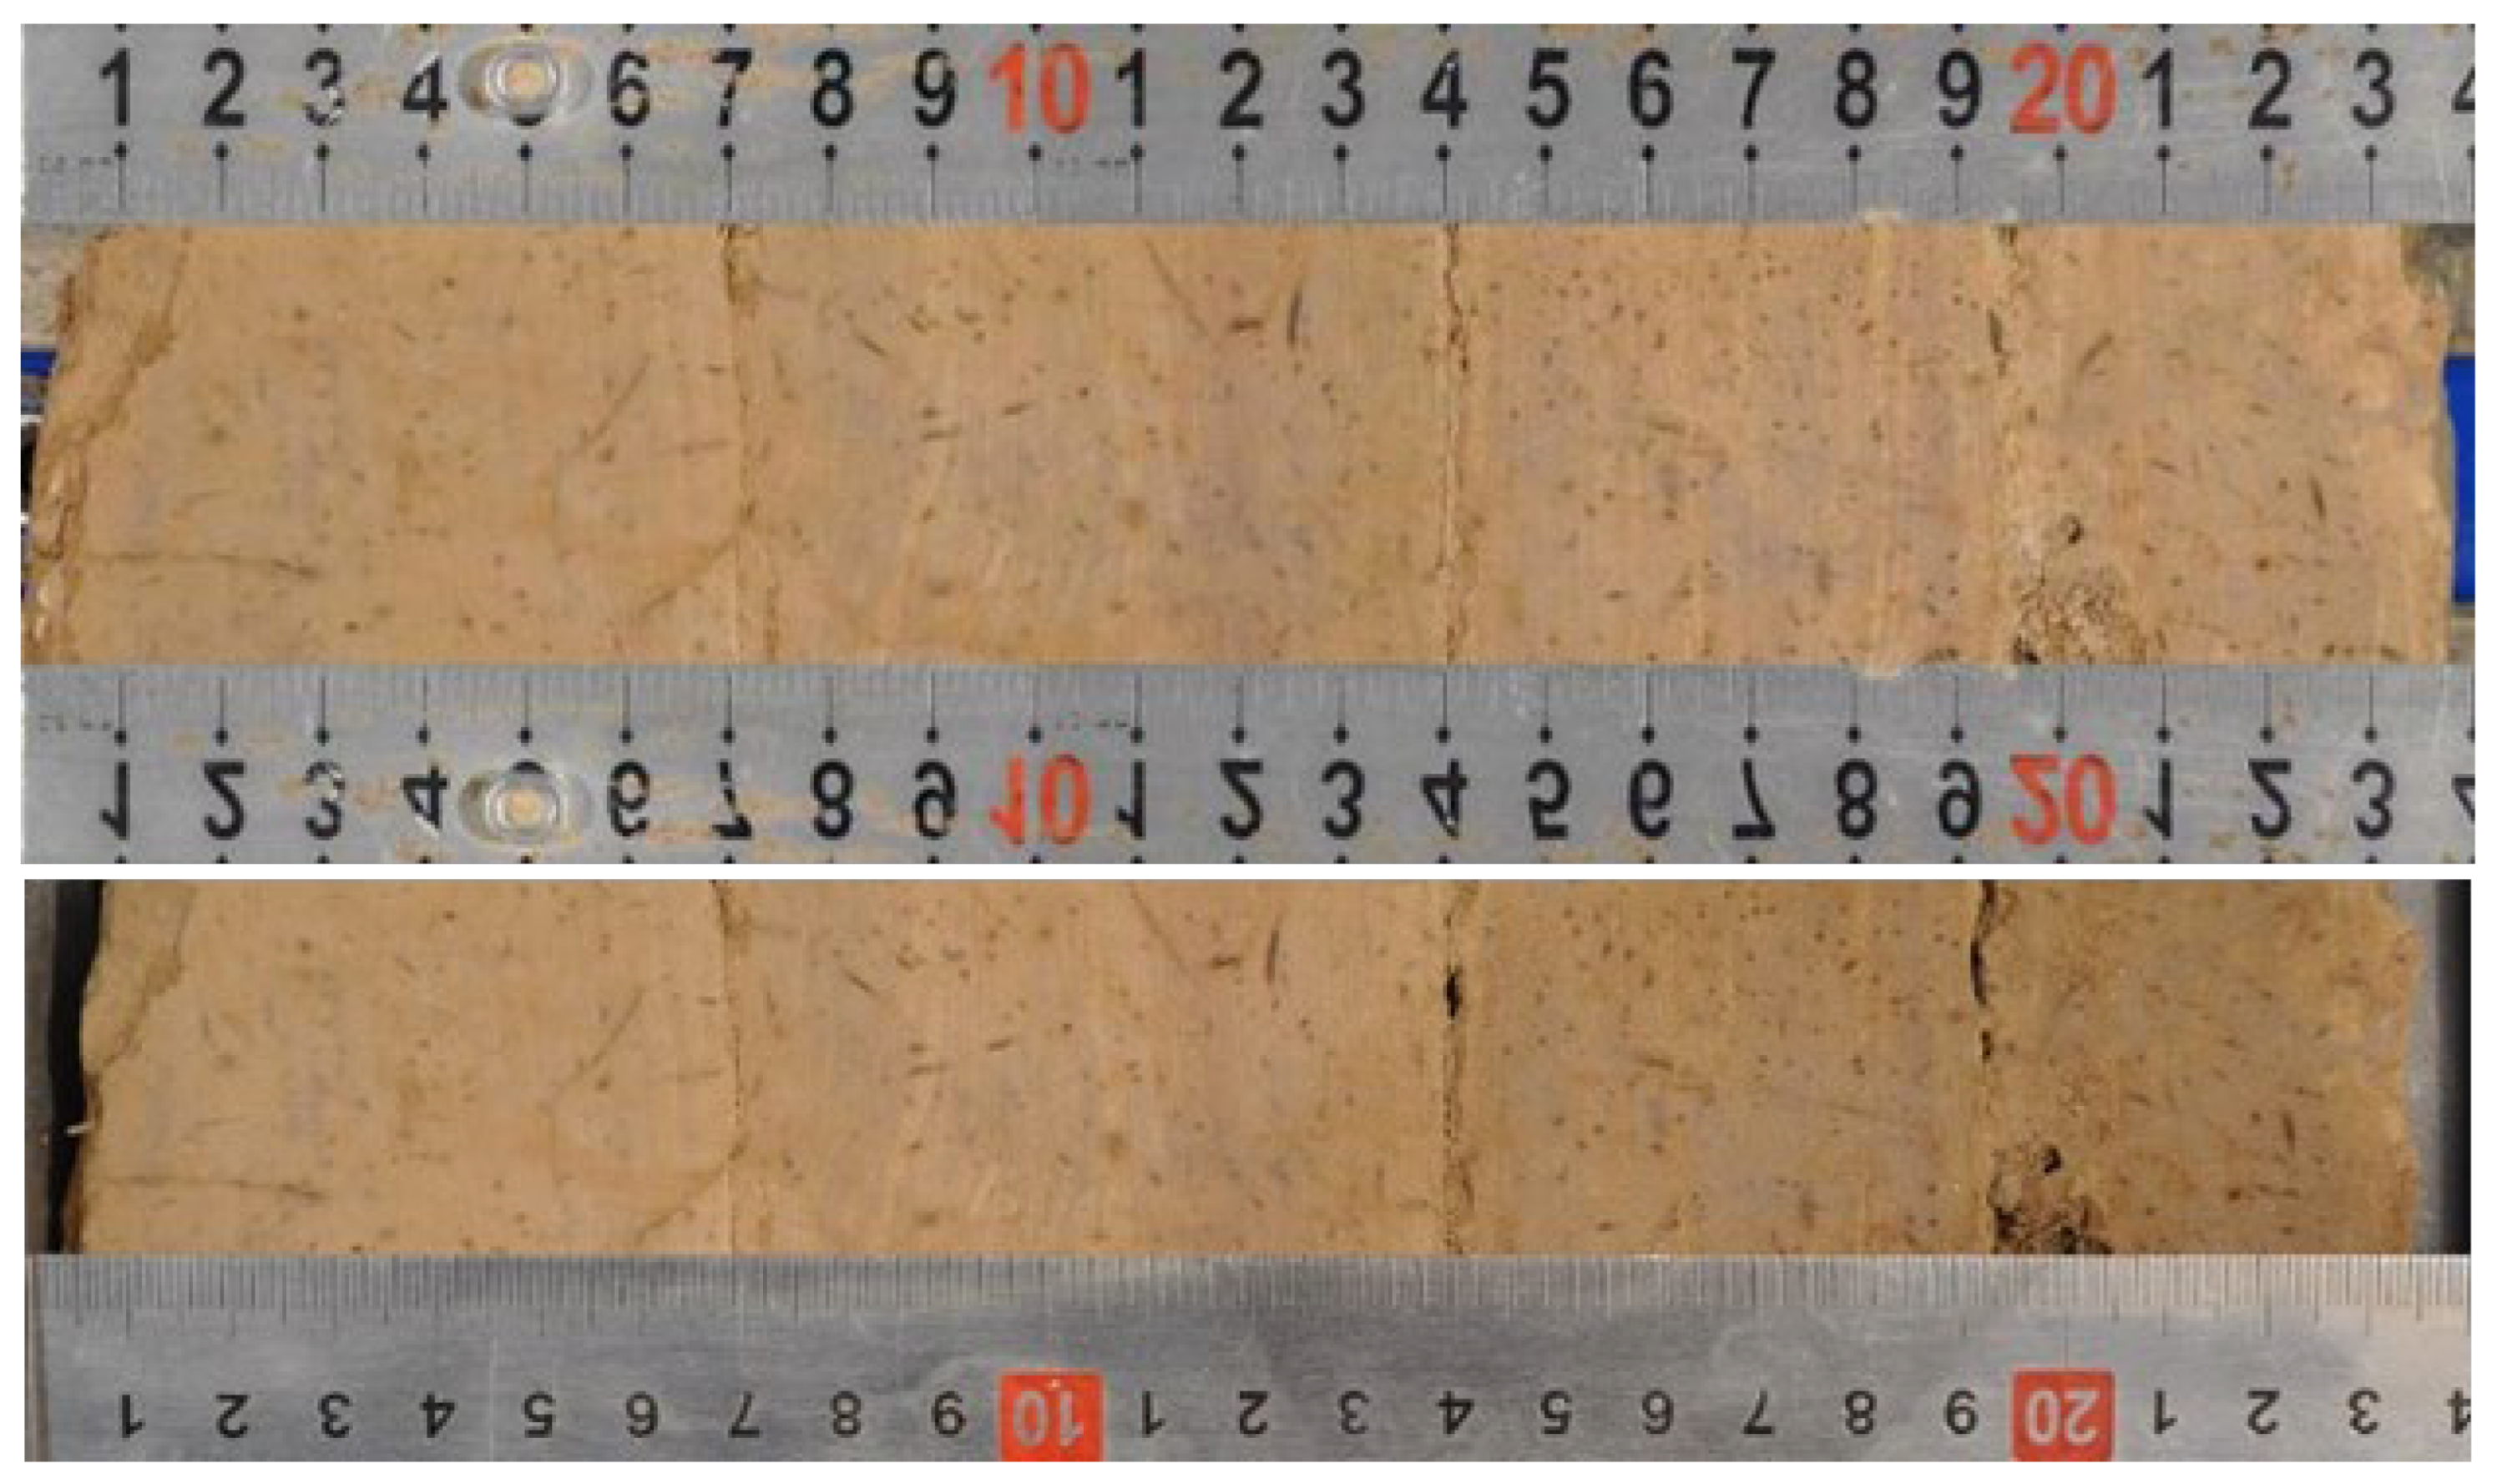
The located Yangzhou reach is mainly composed of barrier sand, sandbars, and beaches, which originally had multiple rivers. Later, some Jiajiang Rivers were silted by sediment and became dark rivers. The floodplain sediments in front of the embankment have obvious horizontal bedding structures, most of which are horizontal laminas of millimeter thickness, as shown in
Figure 13. Under the impact of river water and waves, the sand layer is very easy to be hollowed out, resulting in the loss of support and collapse of the upper floodplain sediments.
The swing of the river bank makes these dark rivers appear on the current river bank and even be pushed down by the river embankment. There will be a great deal of groundwater in and out of the dark river and will even take away silt, resulting in bank collapse and even embankment collapse into the river, forming an obvious gap on the bank. As shown in
Figure 14, several examples of bank collapse show that large-scale bank collapse will lead to increased river width at the bank collapse, resulting in the channel centerline moving to the bank collapse.
At the same time, the two sides of the river are densely populated, and regular floods pose a huge threat to the safety of people’s lives and property. The continuous deposition of Zhenjiang Port has seriously affected the local economic development. Therefore, various river regulation projects have been carried out in the river. These projects have gradually changed the boundary conditions of some river sections and have also had some impacts on the evolution of the river.
For example, the regulation of Zhenjiang port and the expansion of Jiaobei beach will lead to the evolution of the river regime in favor of the development of the South Branch of Hechangzhou. The problem of bank collapse on the north side of Hechangzhou is very active. Although Zhenjiang has carried out a dam project in the left bank of Hechangzhou to solve the problem of diversion ratio, which has a certain effect on improving the diversion ratio, the development of Jiaobei beach is continuing, and the change of river regime determines that it cannot fundamentally solve the problem of diversion ratio in Hechangzhou. Artificial river regulation leads to the development of Jiaobei beach and the narrow channel, which will aggravate the risk of bank collapse.
3.3.2. Changes in Hydrodynamic Conditions
The expansion of the Huaihe River channel and the increase of water quantity have a great influence on the change of the reach hydrodynamic conditions of the Zhenjiang-Yangzhou reach. The Zhenjiang-Yangzhou reach was narrow at both ends and broad in the middle hundreds of years ago. When the river channel changes from a narrow section to a wide section, the kinetic energy in the original mechanical energy of water and sediment flow will be significantly reduced, so the sediment will fall and silt accordingly. When the channel changes from a wide section to a narrow section, the backwater action of the narrow section causes the sediment to fall before the entrance to the narrow section. After the north branch of the Huaihe River enters the river, the water and sediment conditions change, and the main current line of the lower reach of the Zhenjiang-Yangzhou reach gradually moves to the southeast. The west entrance of the north branch and the Yangtze River are supported by each other, and the water flow becomes slow, and the sediment is deposited accordingly, resulting in the continuous shrinkage of the north branch, and the sandbar is parallel to the north, and finally, the north branch evolves into the Jiajiang River. The contraction of the north branch makes the east gate become the main channel of the Huaihe River and gradually evolved into the present channel of the Yangtze River, where the Yangtze River and the Huaihe River meet, making the sediment silt before entering the entrance of the narrow section, and the tail of the large sediment extends southward.
The expansion of the Huaihe River channel and the increase of water quantity have a great influence on the change of hydrodynamic conditions in the Zhenyang reach of the Yangtze River. In 1851, the Huaihe River flood destroyed the Xinli Dam, and now, the Huaihe River flows into the Yangtze River perennially. Zhengkezhou and Shiyezhou, two sandbars from Yizheng to Guazhou in the west reach of the Zhenjiang-Yangzhou reach, moved down rapidly. The upper end of Shiyezhou was concealed by Zhengkezhou and was not scoured. The sedimentation caused by backwater made the upper end rise. The lower end was controlled by Guazhou and Jinshan nodes and stopped the extension, which caused the upper and lower reaches to merge [
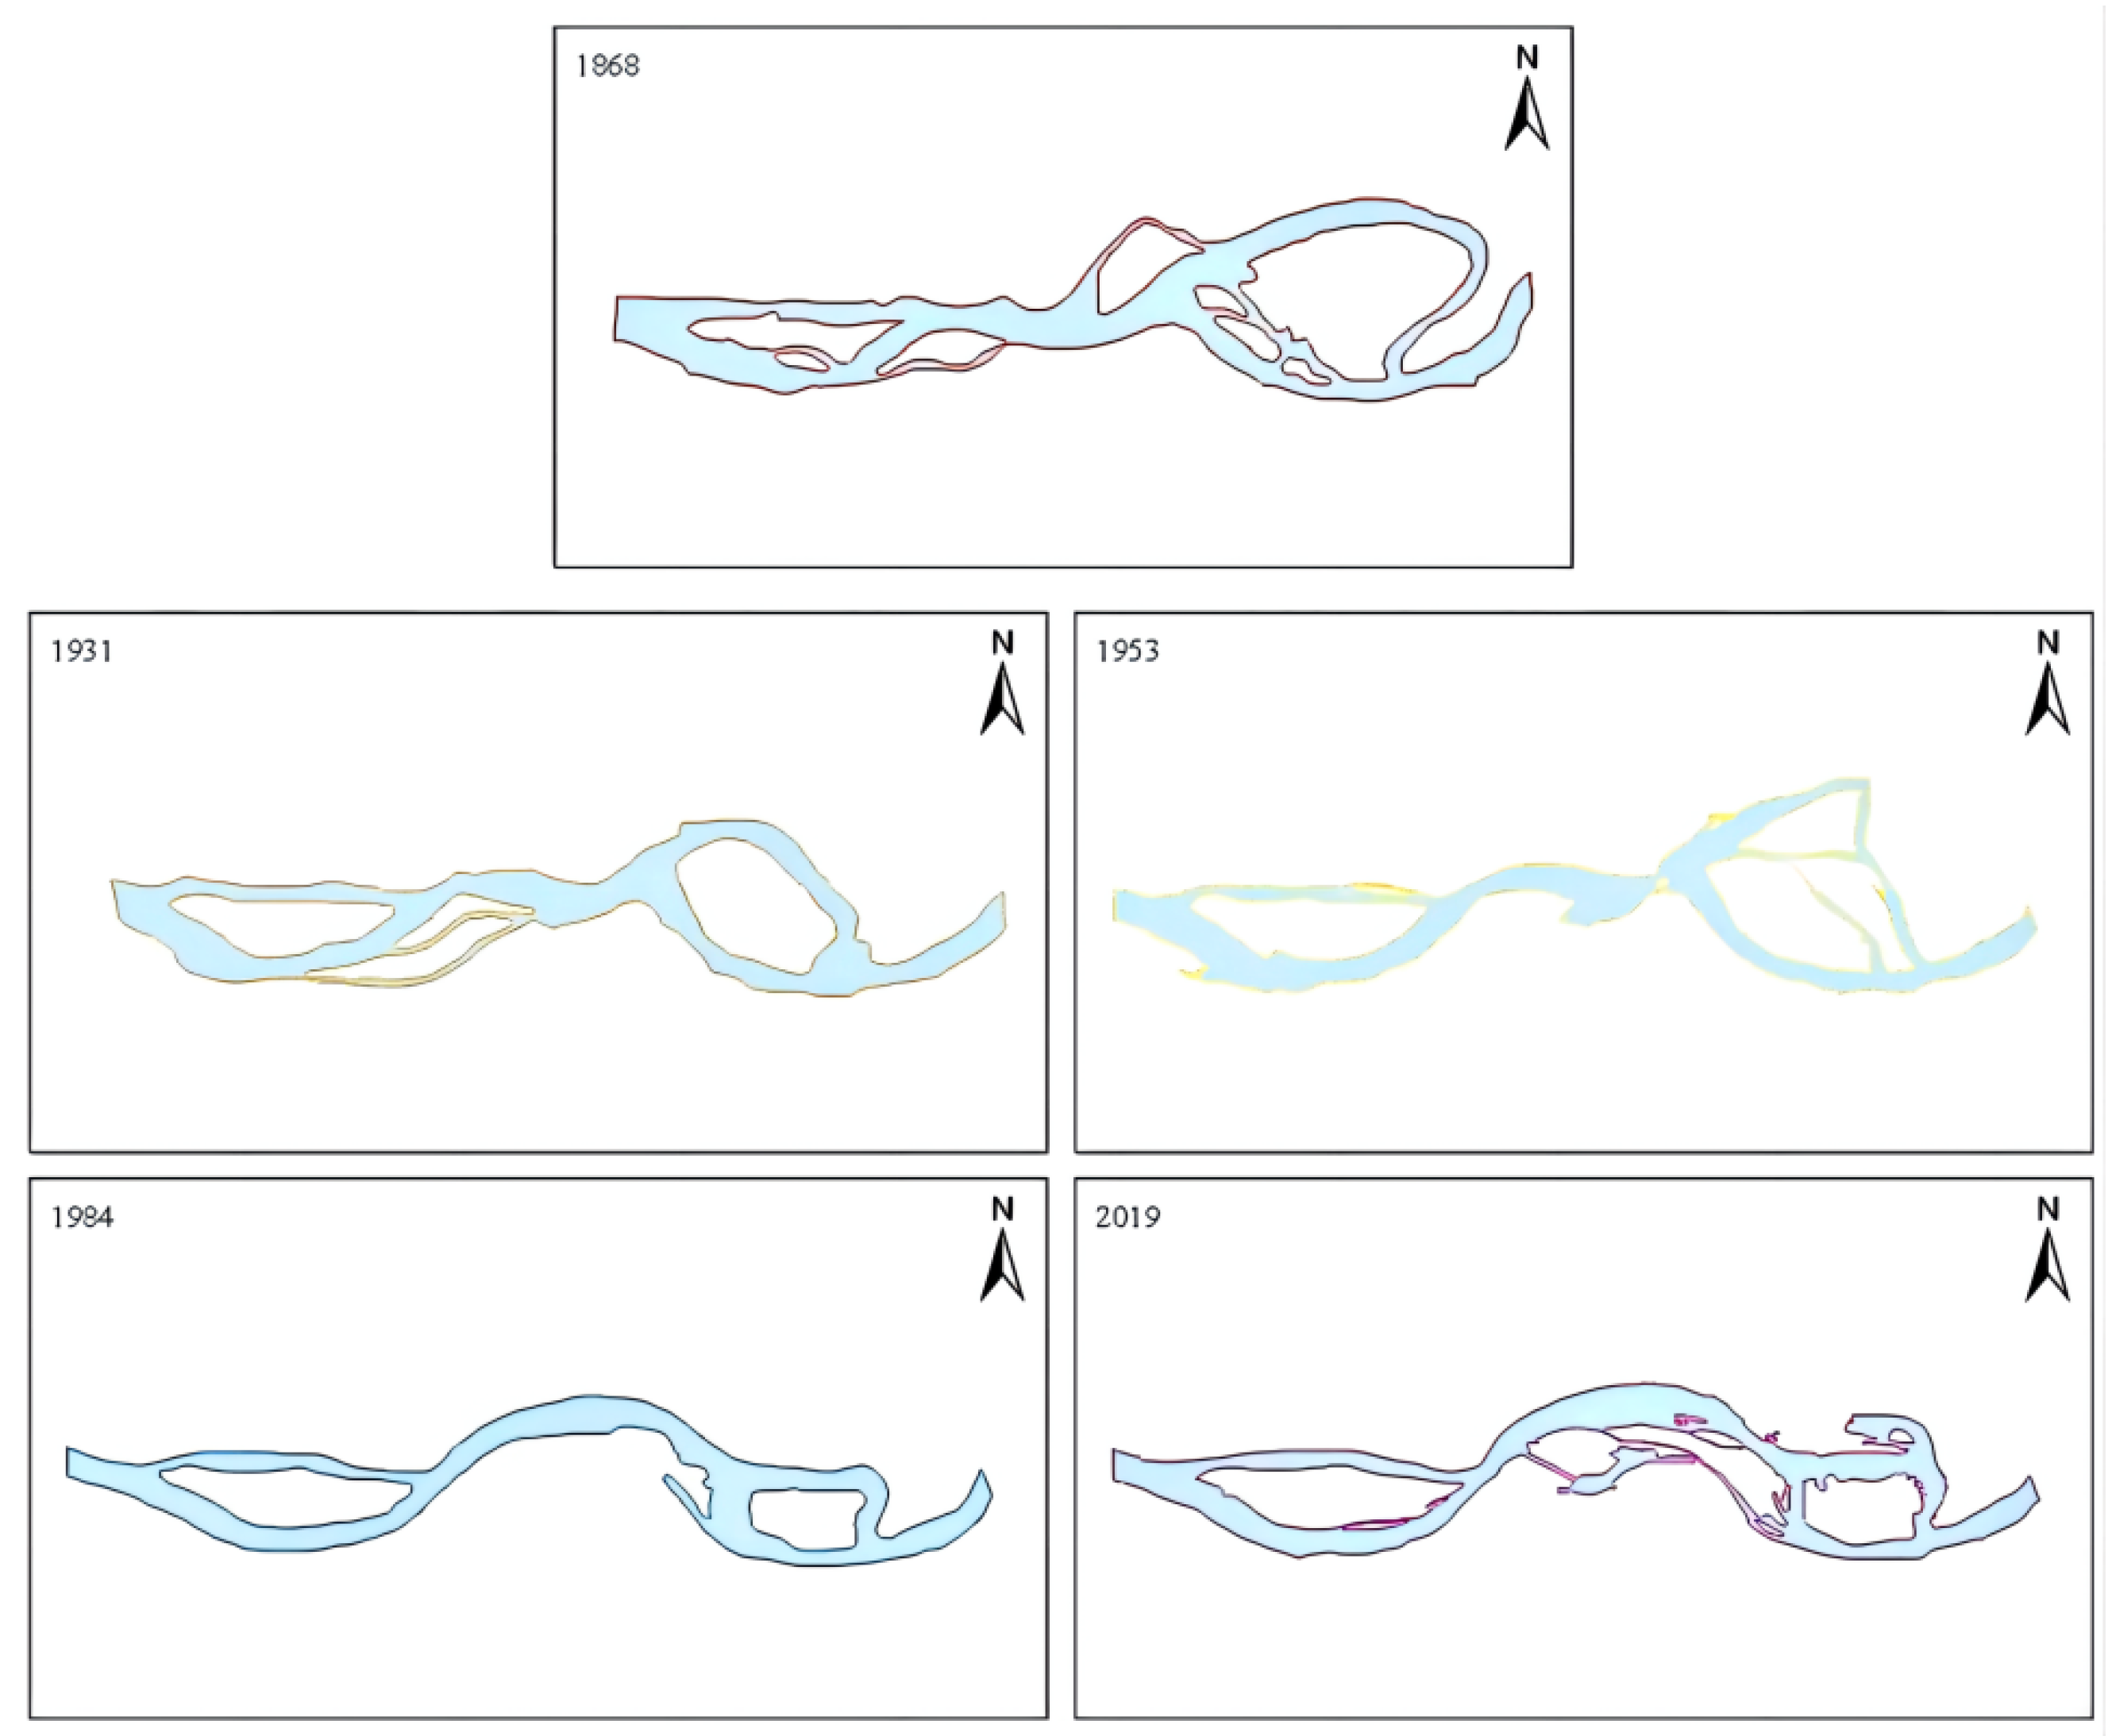
39]. After crossing Guazhou, the mainstream of the Yangtze River turned to the right bank and then turned to the left bank through the mainstream of Beigu Mountain and Jiao Mountain. On the river surface, Xinzhou, Enyuzhou, and other sandbars were formed, and the formed Jiajiang River continued to bank northward. The river and sandbar information of the Zhenjiang-Yangzhou reach from 1868 to 2019 are digitized (
Figure 15).
It can be seen from the figure that since the sandbank outside the estuary of Shiyezhou and Huaihe River merges with the left bank, the river channel changes from straight to curved. The Guazhou area becomes the concave bank, and the Zhenjiang area becomes the convex bank. Under the action of centrifugal force, the lateral circulation of the curved channel develops, and the lateral erosion occurs continuously, and at the same time, it moves downstream. Guazhou was originally the vertex of concave bank. With the downdraft of meandering stream, the east of Guazhou began to be eroded. Zhenrenzhou (the used name of Zhengrunzhou) was originally located in the west of Zhenjiang. Due to the influence of the downdraft of convex bank, Zhenjiang port is gradually covered. After 1868, the evolution of the Zhenjiang-Yangzhou reach was mainly characterized by a gradual change into an “S”-type shape.
3.3.3. Water and Sediment Changes after the Construction of the Three Gorges Dam
Water and sediment processes in the fluvial environment have a significant influence on the Zhenjiang-Yangzhou reach of the Yangtze River [
40,
41]. According to the results of the Changjiang Water Resources Commission and many other studies [
42,
43], water and sediment processes were drastically changed in the Zhenjiang-Yangzhou reach after the cutoff of Gezhouba Dam in 1981 and the impoundment of the Three Gorges Reservoir in 2003. A severe decrease in sediment load notably occurred in the Zhenjiang-Yangzhou reach. In general, the reduction of sediment would aggravate the lateral erosion and cause the channel centerline to move towards the eroded side.
Datong Hydrological Station in Chizhou City, Anhui Province, is the control station in the lower reaches of the Yangtze River. According to statistics, there are mainly small tributaries such as the Huaihe River, Chuhe River, Qingyi River, Shuiyang River, and Qinhuai River below Datong Station. The flow into the river in the mainstream section accounts for about 2–3% of the flow of Datong Station. Therefore, the flow and sediment characteristics of Datong Hydrological Station basically represent the characteristics of water and sediment in Zhenyang Reach. As shown in
Table 1, since the impoundment of the Three Gorges Reservoir, the distribution and composition of water and sediment in Datong Station have been adjusted and changed to some extent during the year. The average annual runoff in 2003~2020 (after impoundment) is 2.95% less than that in 1950~2002 (before impoundment), and the average annual sediment discharge is 68.6% less than that in 1950~2002 [
44]. As shown in
Table 1. From the perspective of annual distribution, the inflow and sediment of Datong Station are mainly concentrated in the flood season (May–October). Among them, the inflow and sediment of the Three Gorges Reservoir in the flood season after impoundment account for 67.4% and 78.8% of the whole year, respectively, which are slightly reduced compared with those before impoundment by 3.5% and 8.7%, respectively.
The change of incoming water and sediment caused by the construction of Three Gorges Dam has an important influence on the scouring and silting of the Zhenjiang-Yangzhou reach. Chen Jingru et al. collected underwater topographic maps of Zhenyang reach over the years and used SURFER8 software to calculate scouring and silting. The distribution of scouring and silting changes in this reach is shown in
Table 2 [
45].
In addition to the siltation of the river channel from 1991 to 1998, the river channel was scoured each year. Over the years, the cumulative scour was 183.57 million m3, with an average brush depth of 1.8 m. The scour area was mainly located in the nearshore area below Siyuangou. Before the completion of the Three Gorges Dam, some rivers in Zhenyang reach were silted. After the completion of the Three Gorges Dam, the erosion became more and more intense. By 2011–2016, all parts of the Zhenjiang-Yangzhou reach had become scoured. In order to avoid severe erosion of the concave bank, two river and shoreline remediation projects have been carried out in the past two decades in the Zhenjiang-yangzhou reach, focusing on the construction or reinforcement of the South Branch of Shiyezhou and Six Curve embankments, repairing the damaged bank sections affected by a large number of bank collapse events, which greatly improves the anti-erosion ability of the concave bank of the river section. The trend of the river in the erosion of the key bank sections in this century has been slowed to a certain extent, and the effect of the revetment project is remarkable.


