
Characteristics of the Rongcheng Bulge Geothermal Field and the Evolution of Geothermal Fluids, Xiong’an New Area, China

 ,
,
Abstract
:1. Introduction
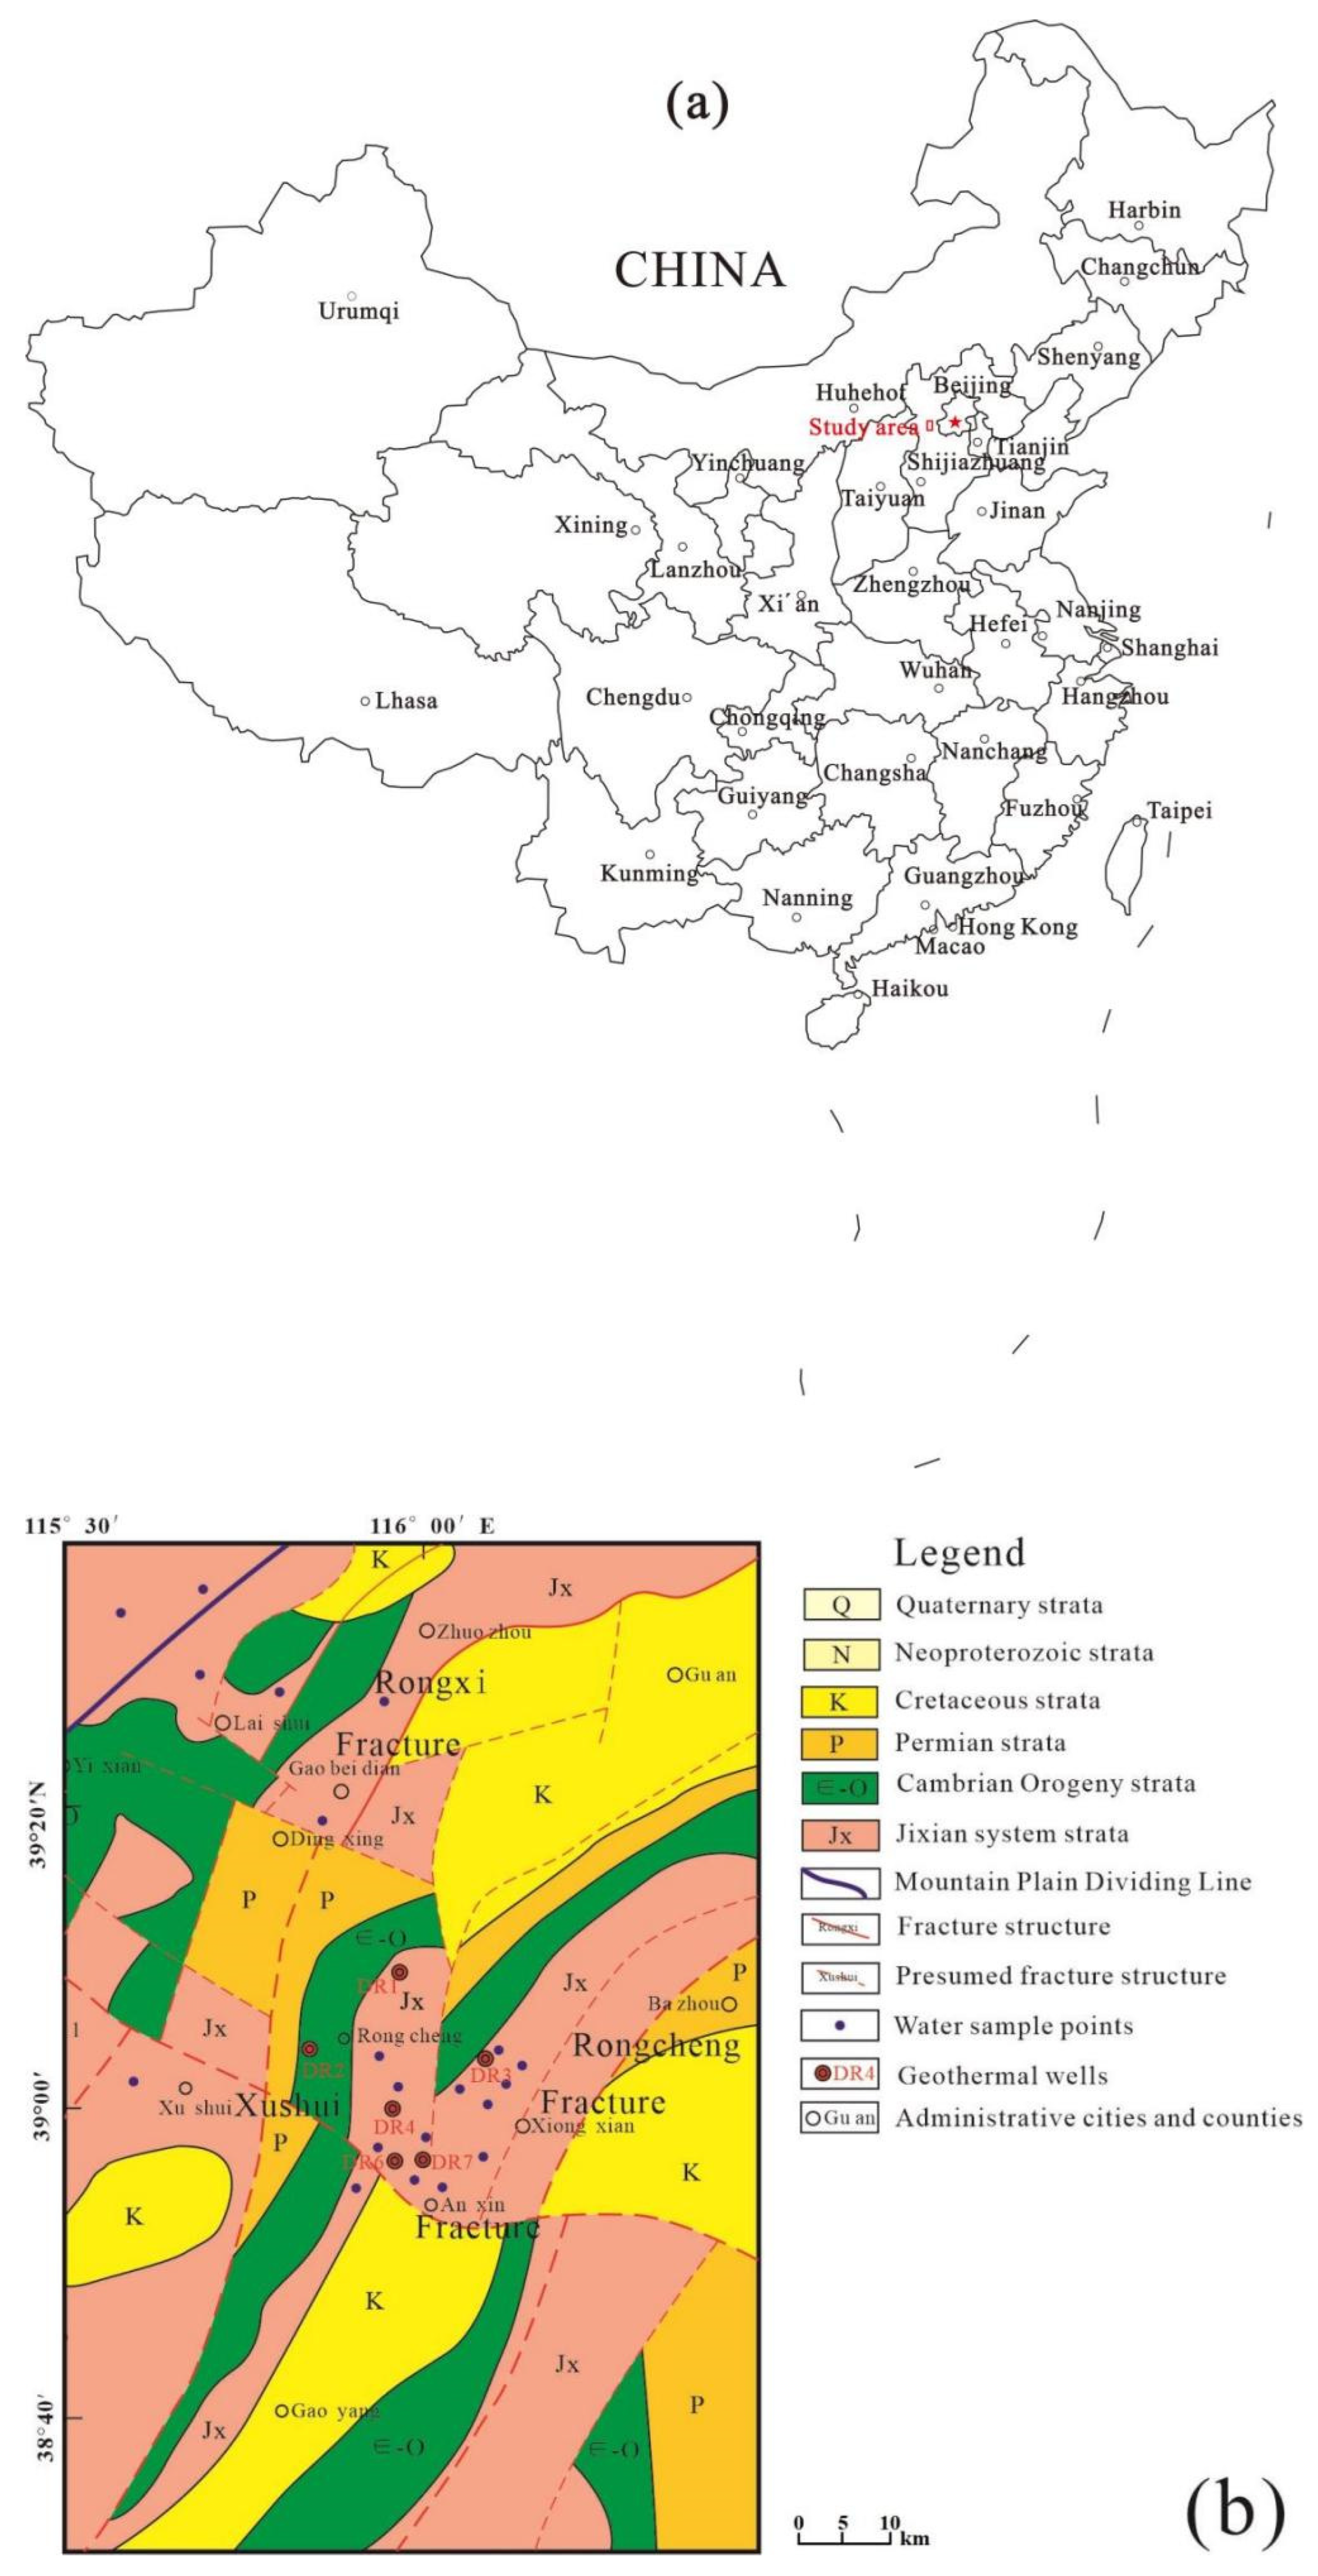
2. Study Area
3. Materials and Methods
3.1. Fluid Sample Collection and Test Methods
3.2. Rock Sample Collection and Test Methods
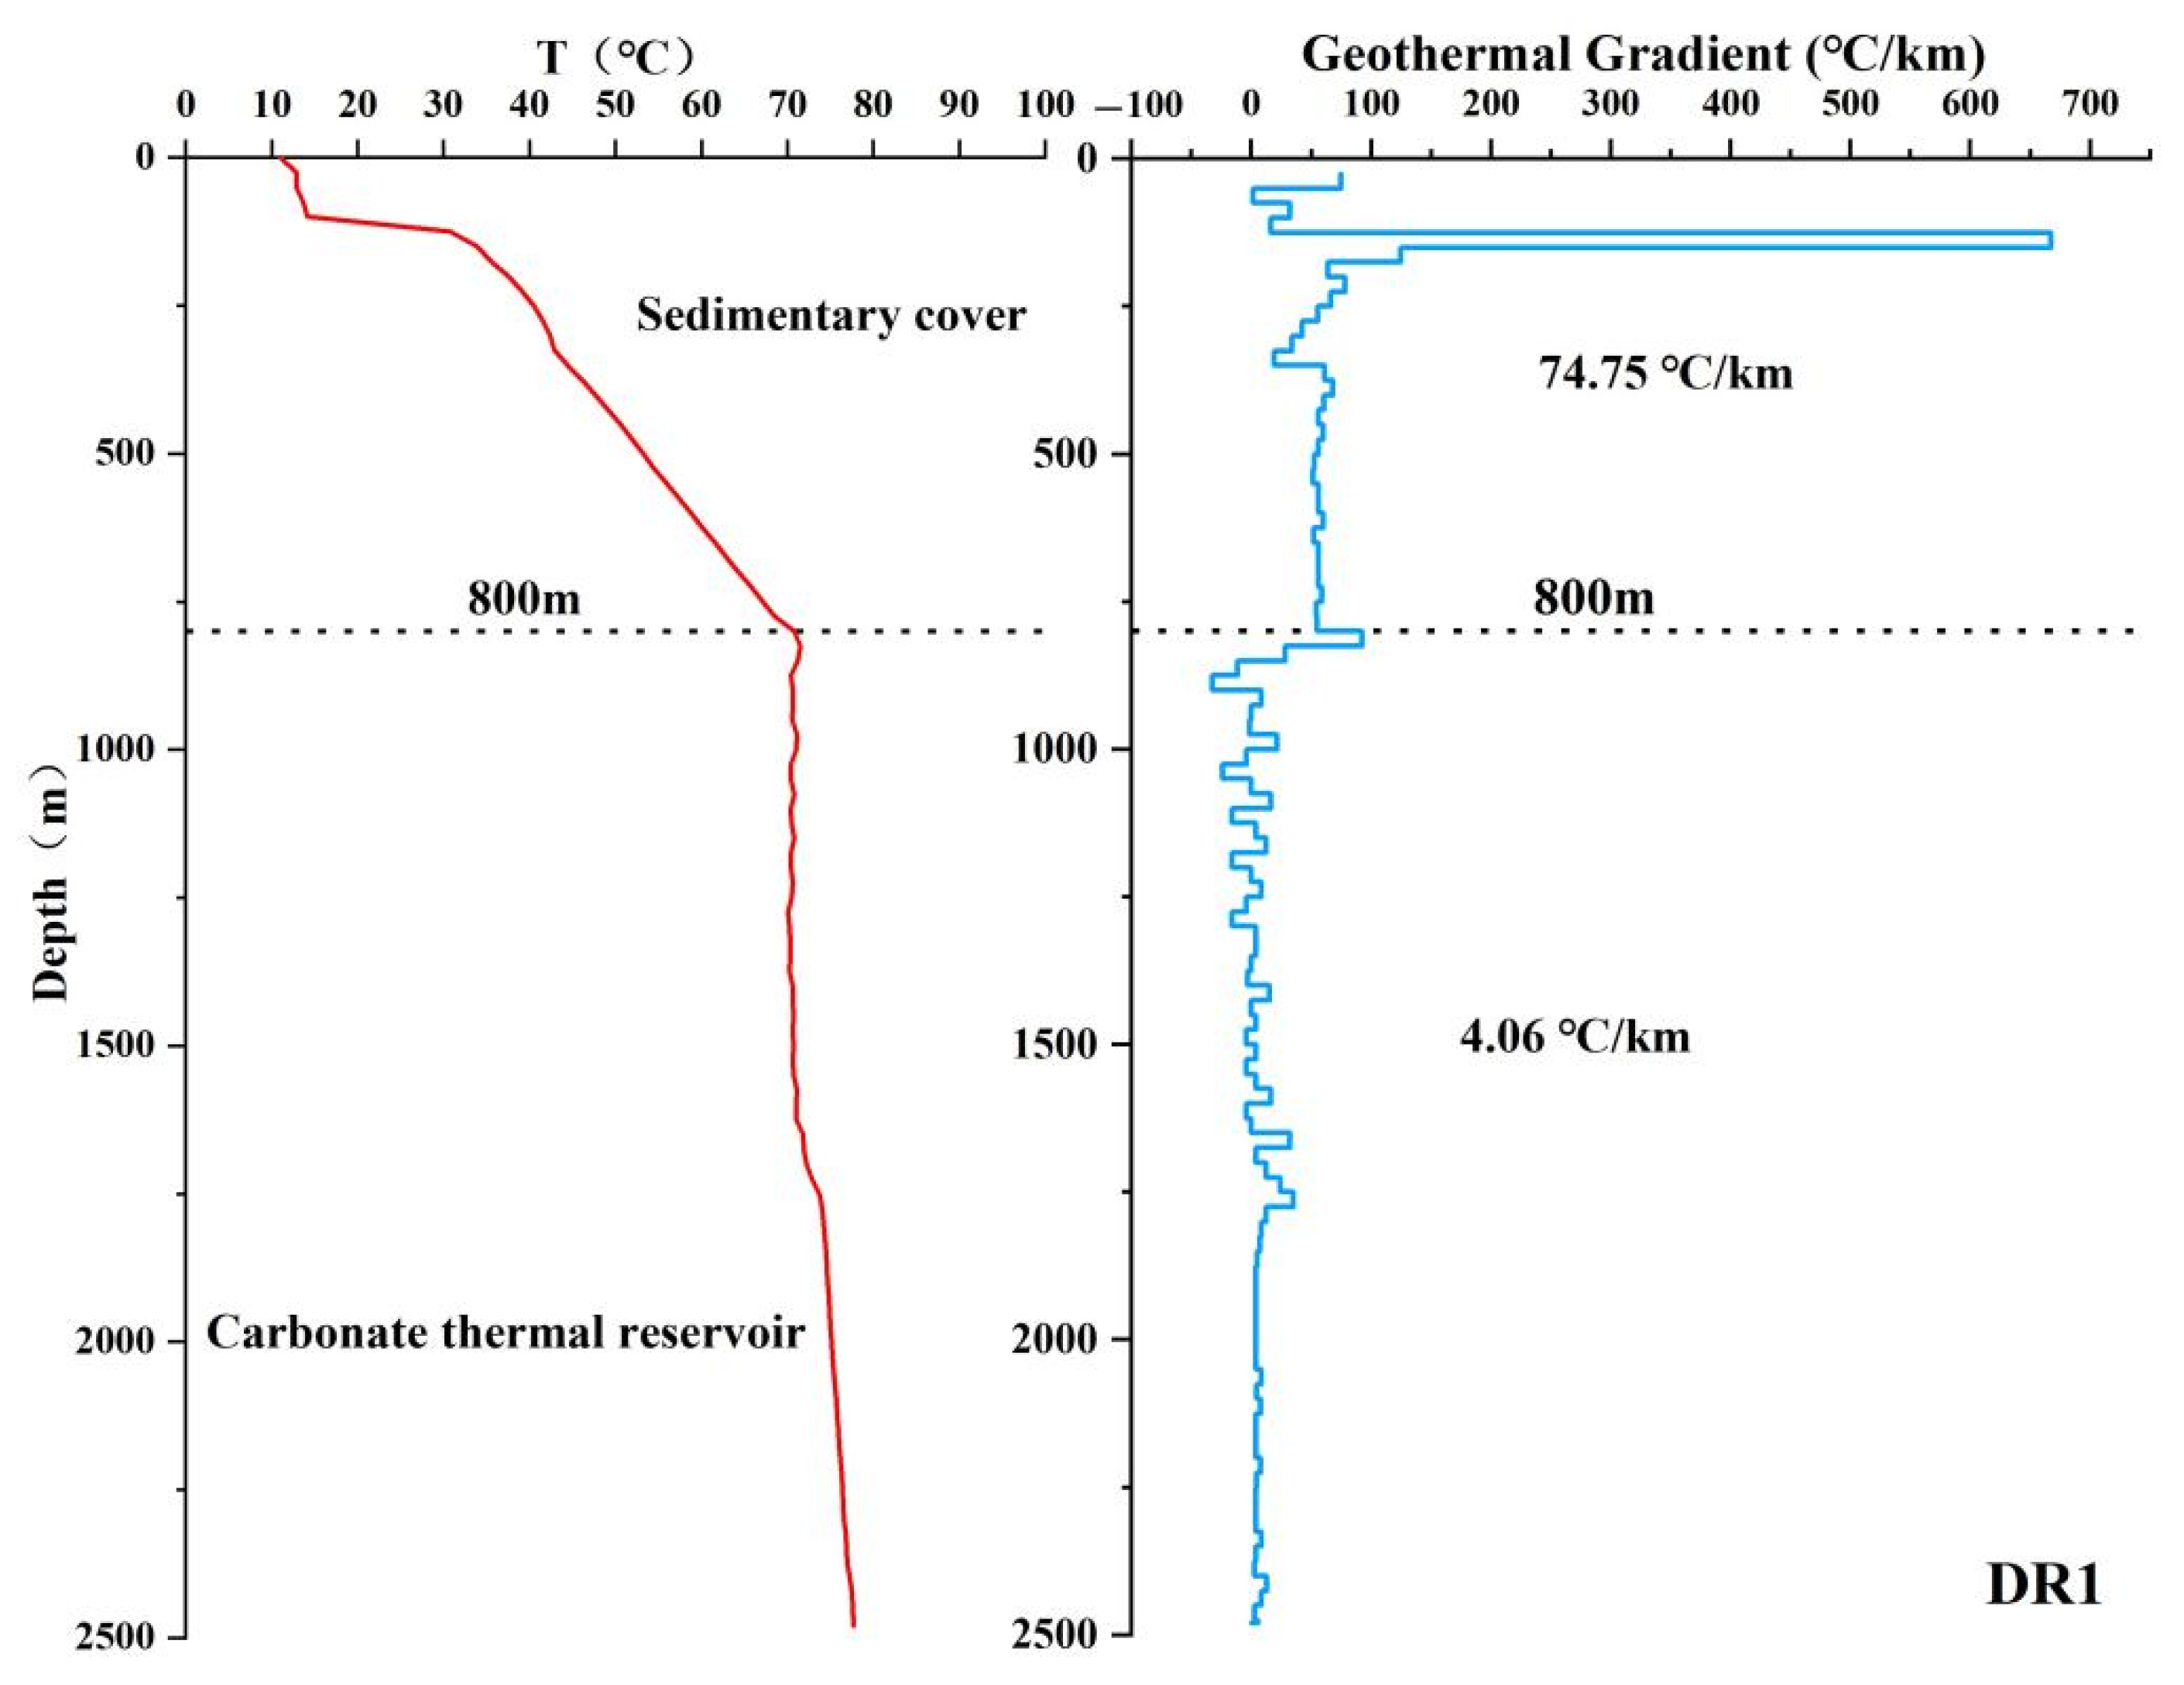
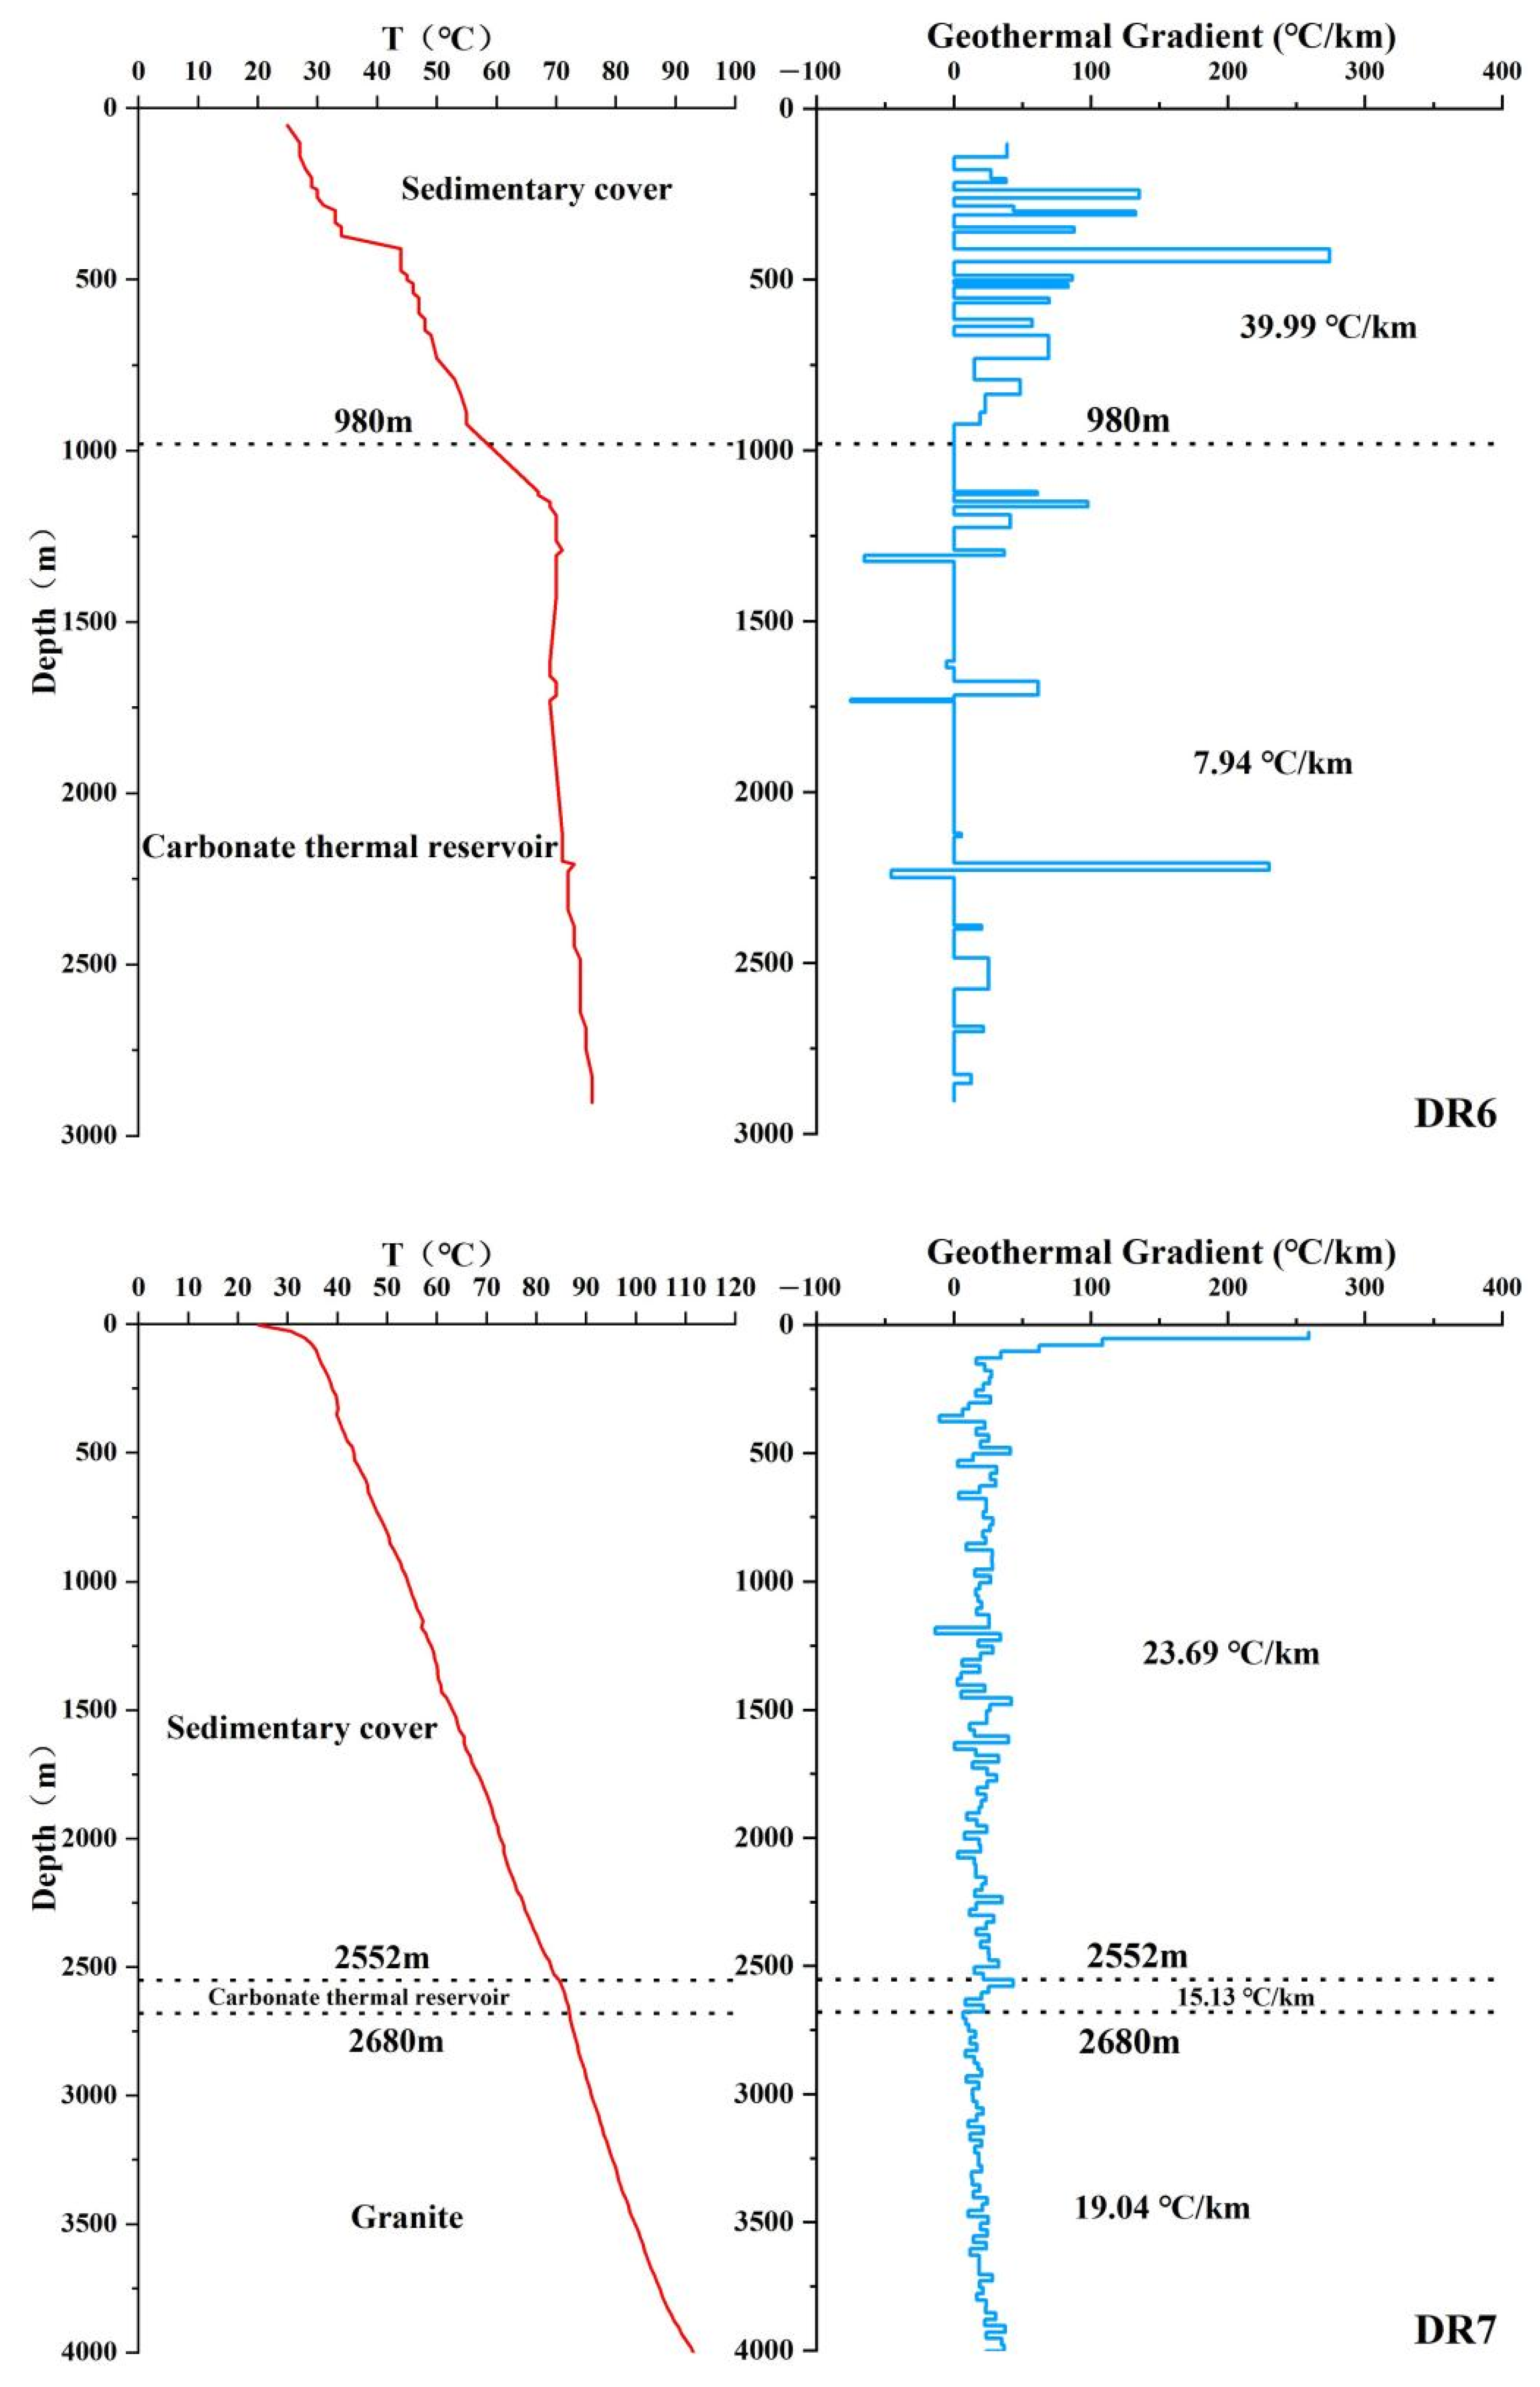
3.3. Geothermal Well Temperature Measurement and Geothermal Gradient Calculation Method
3.4. Geothermometry
4. Results
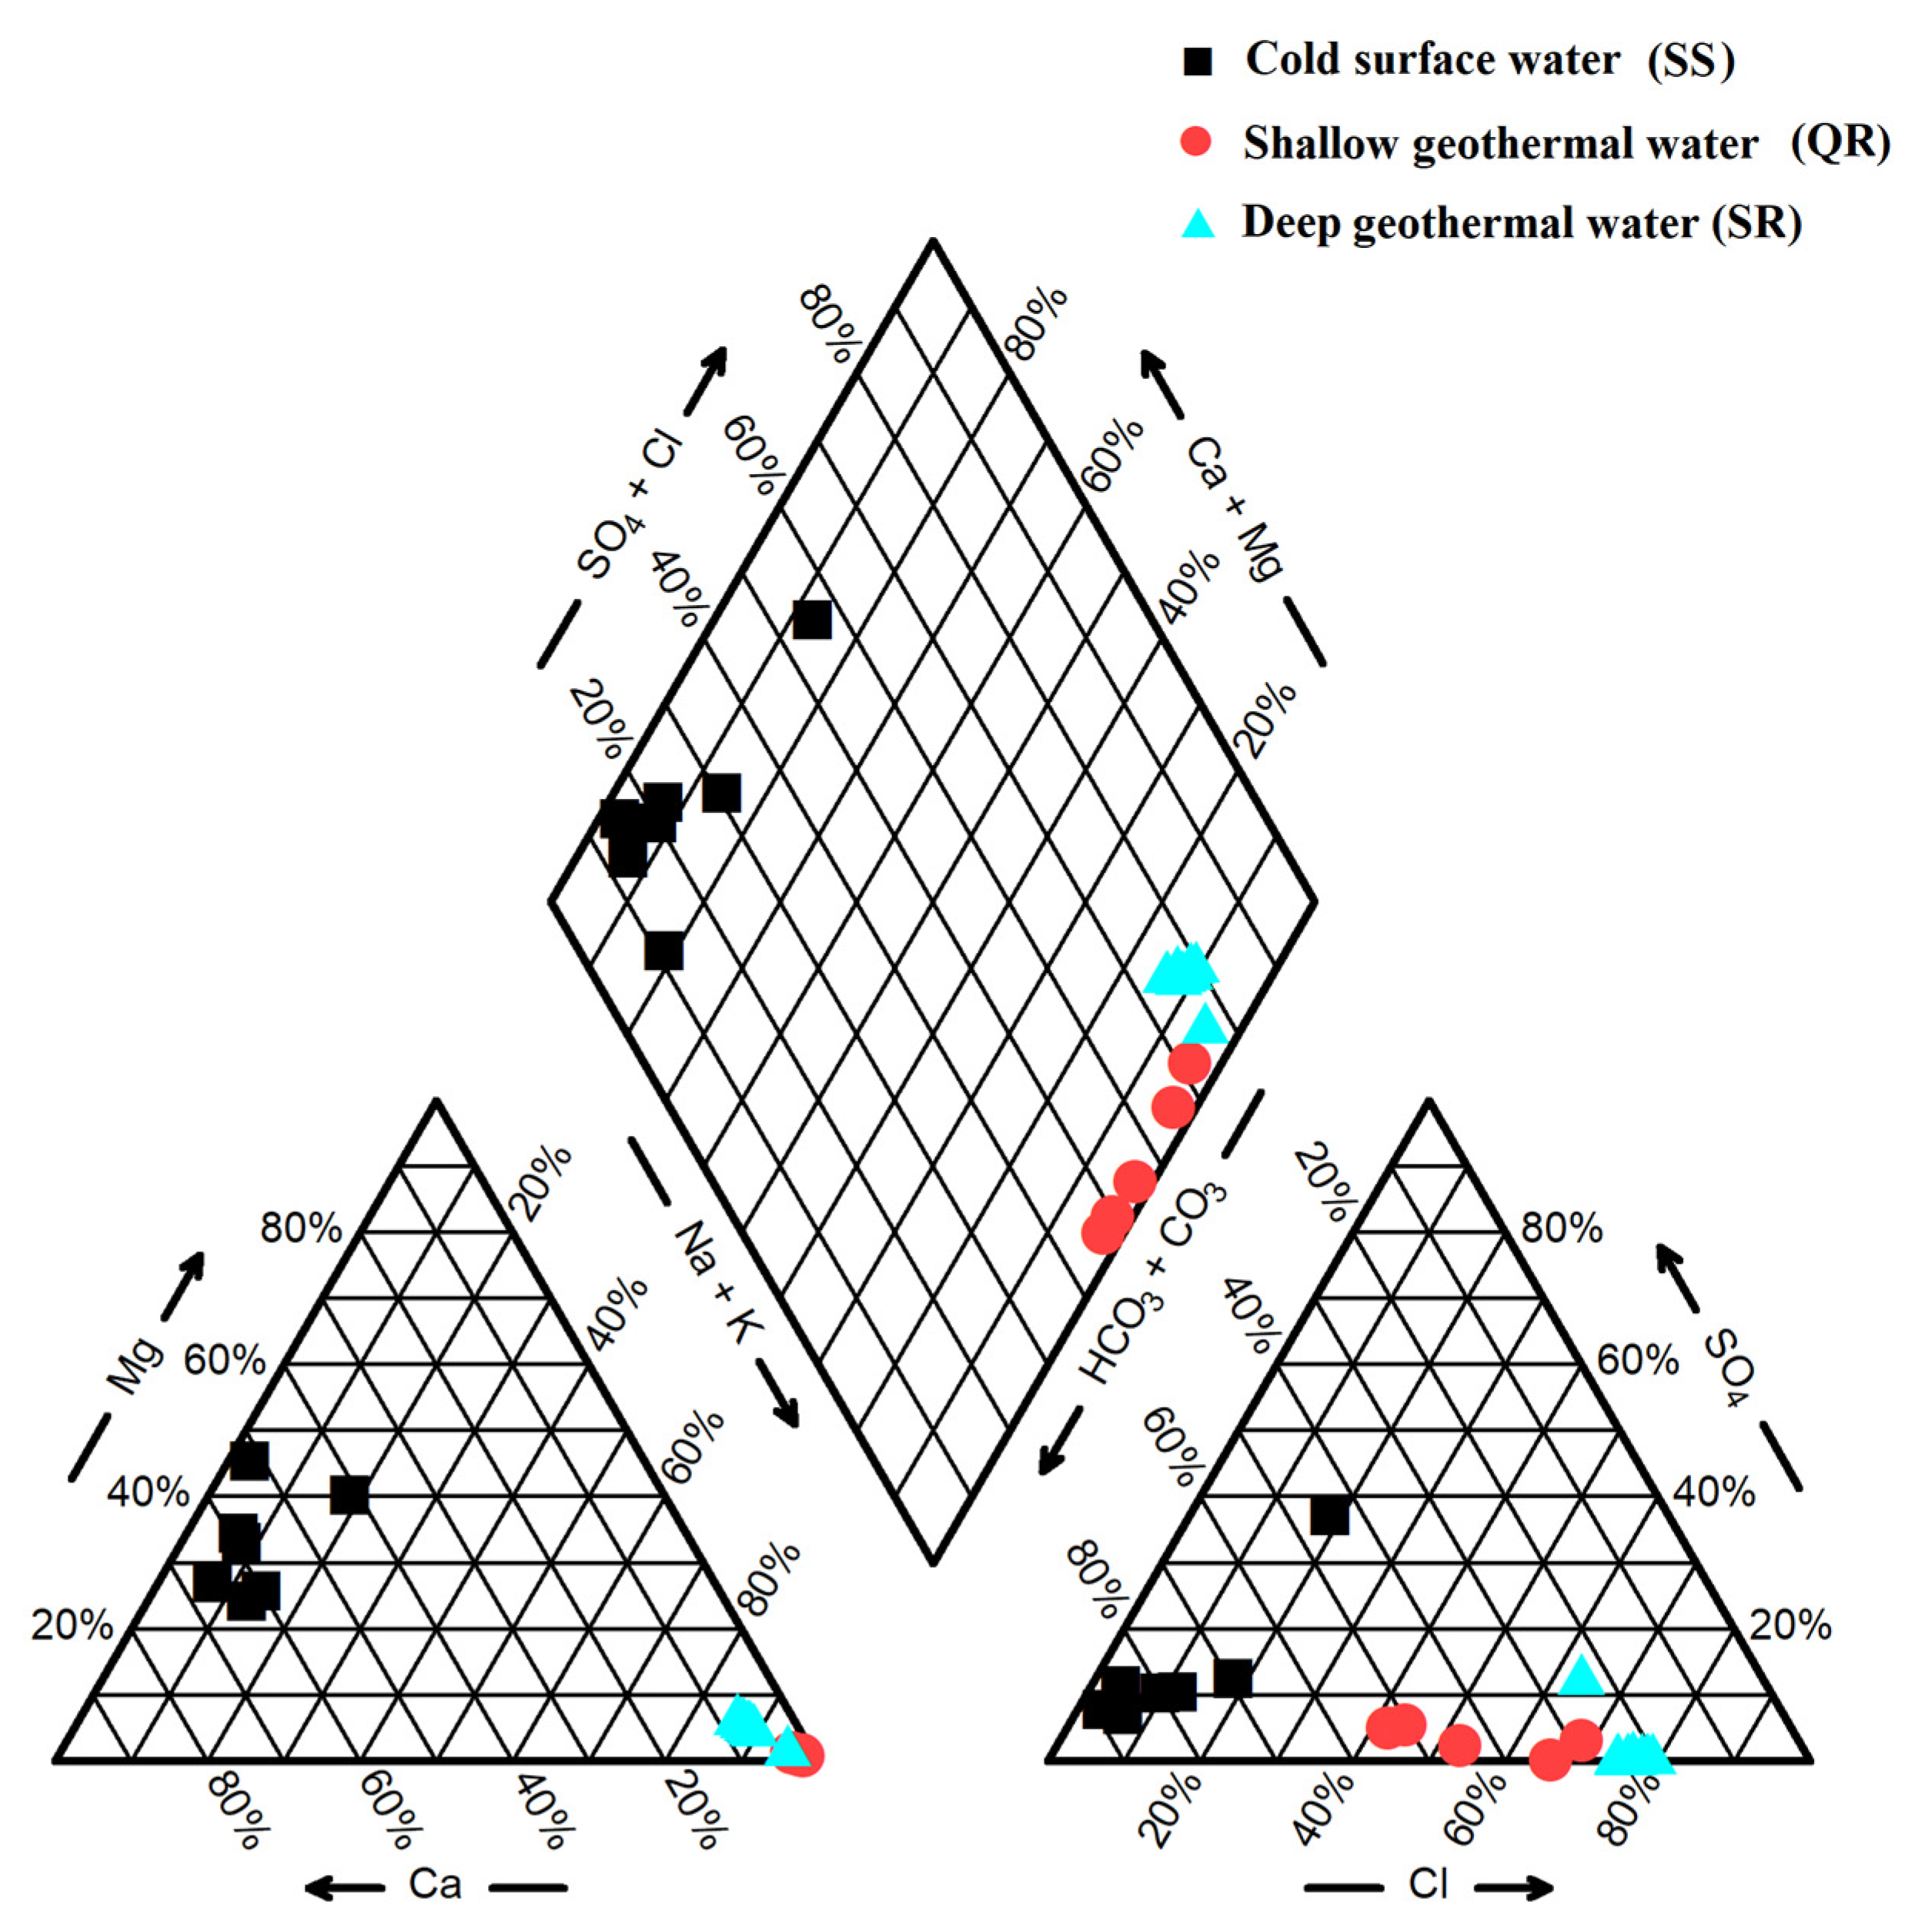
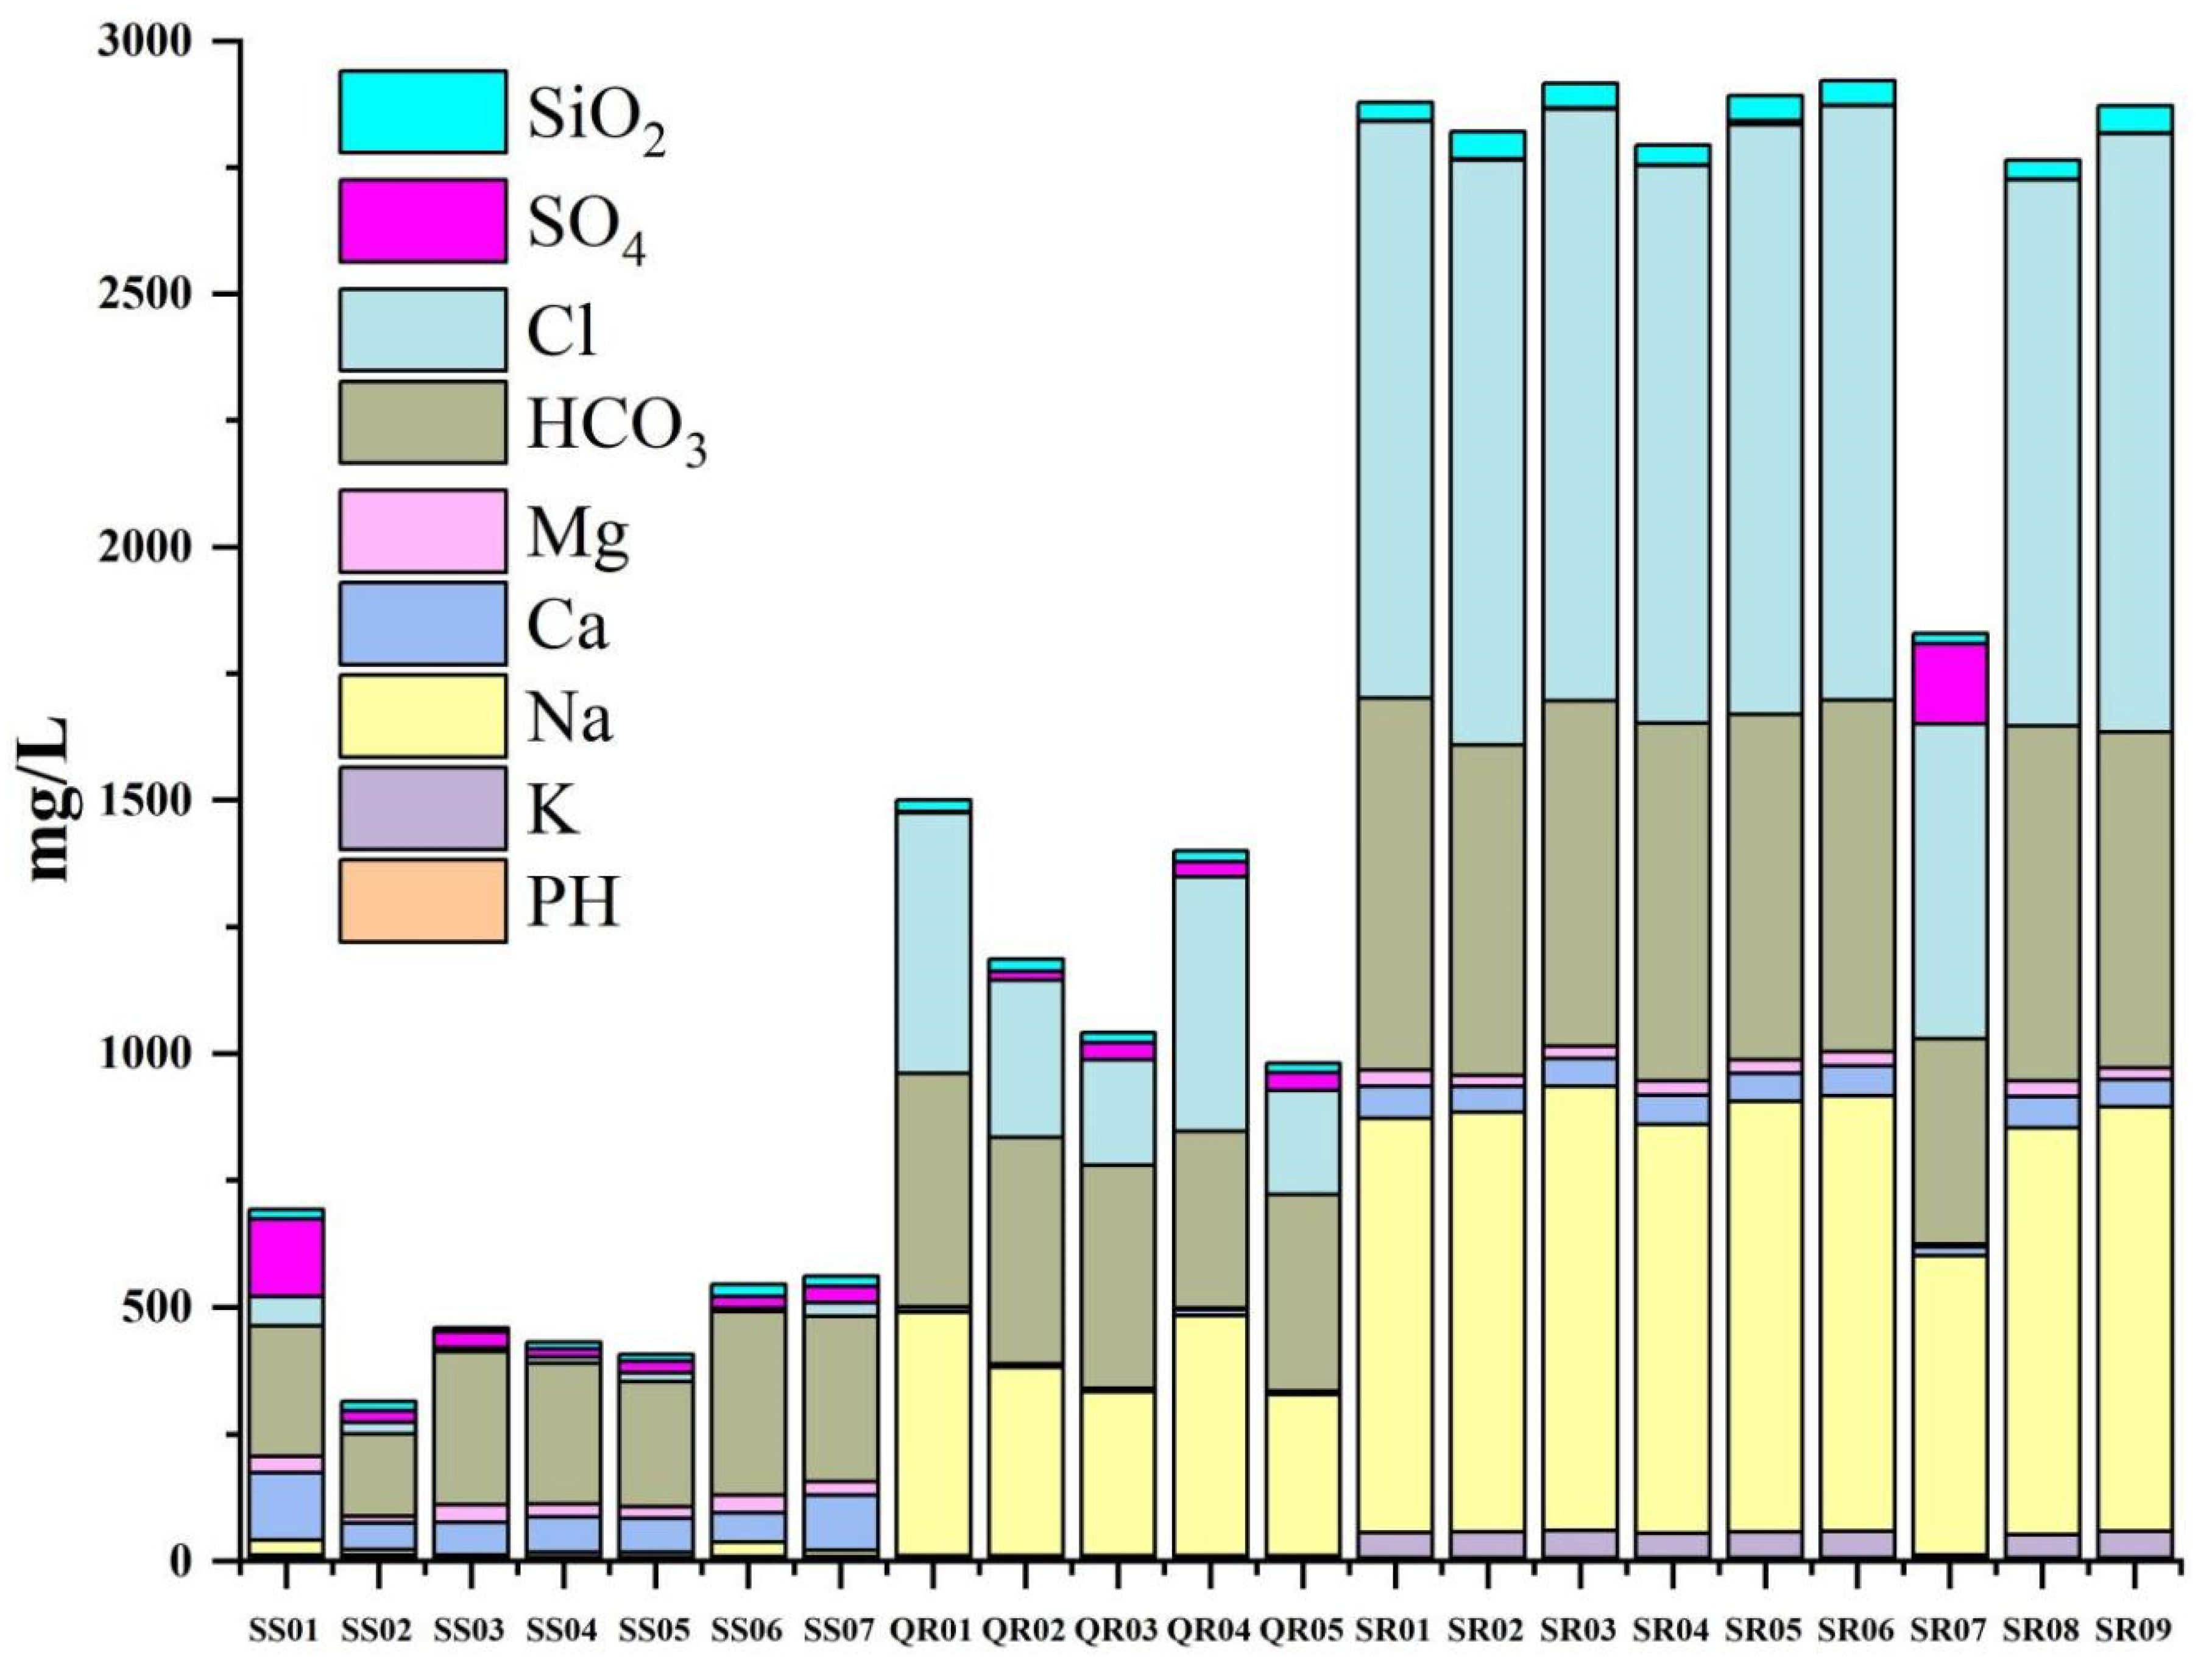
4.1. General Water Chemistry
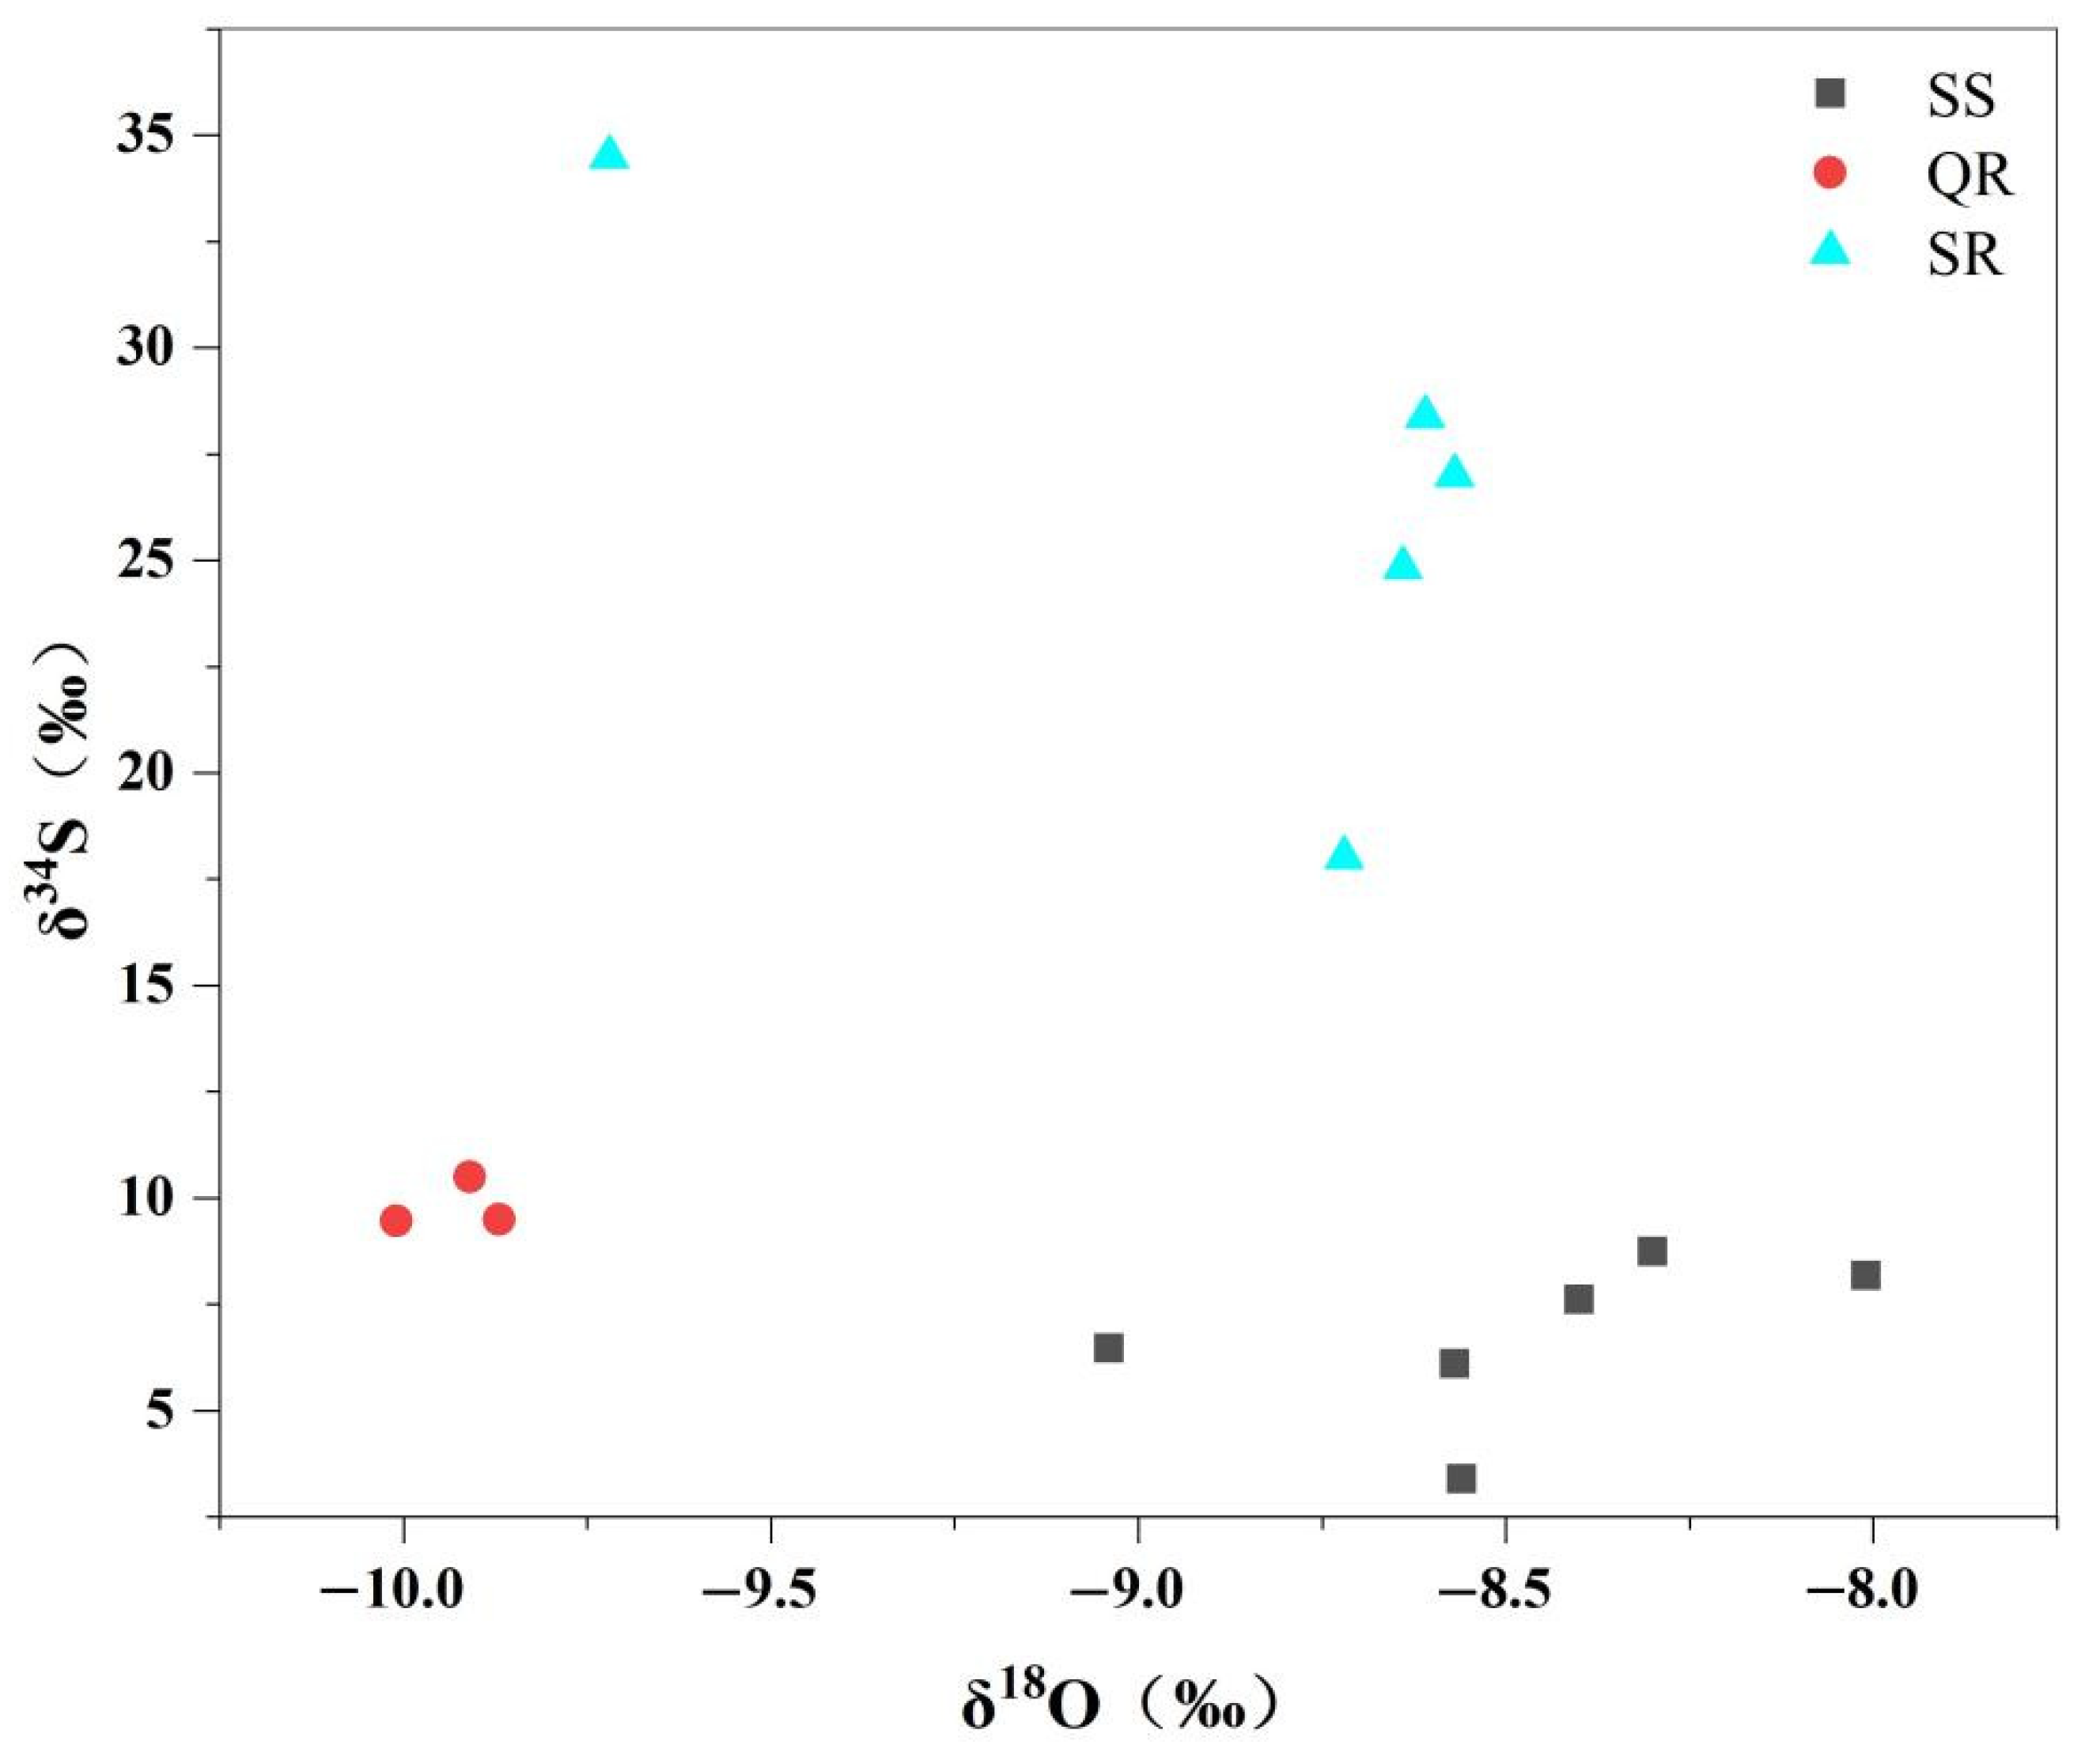
4.2. Isotopic Characteristics
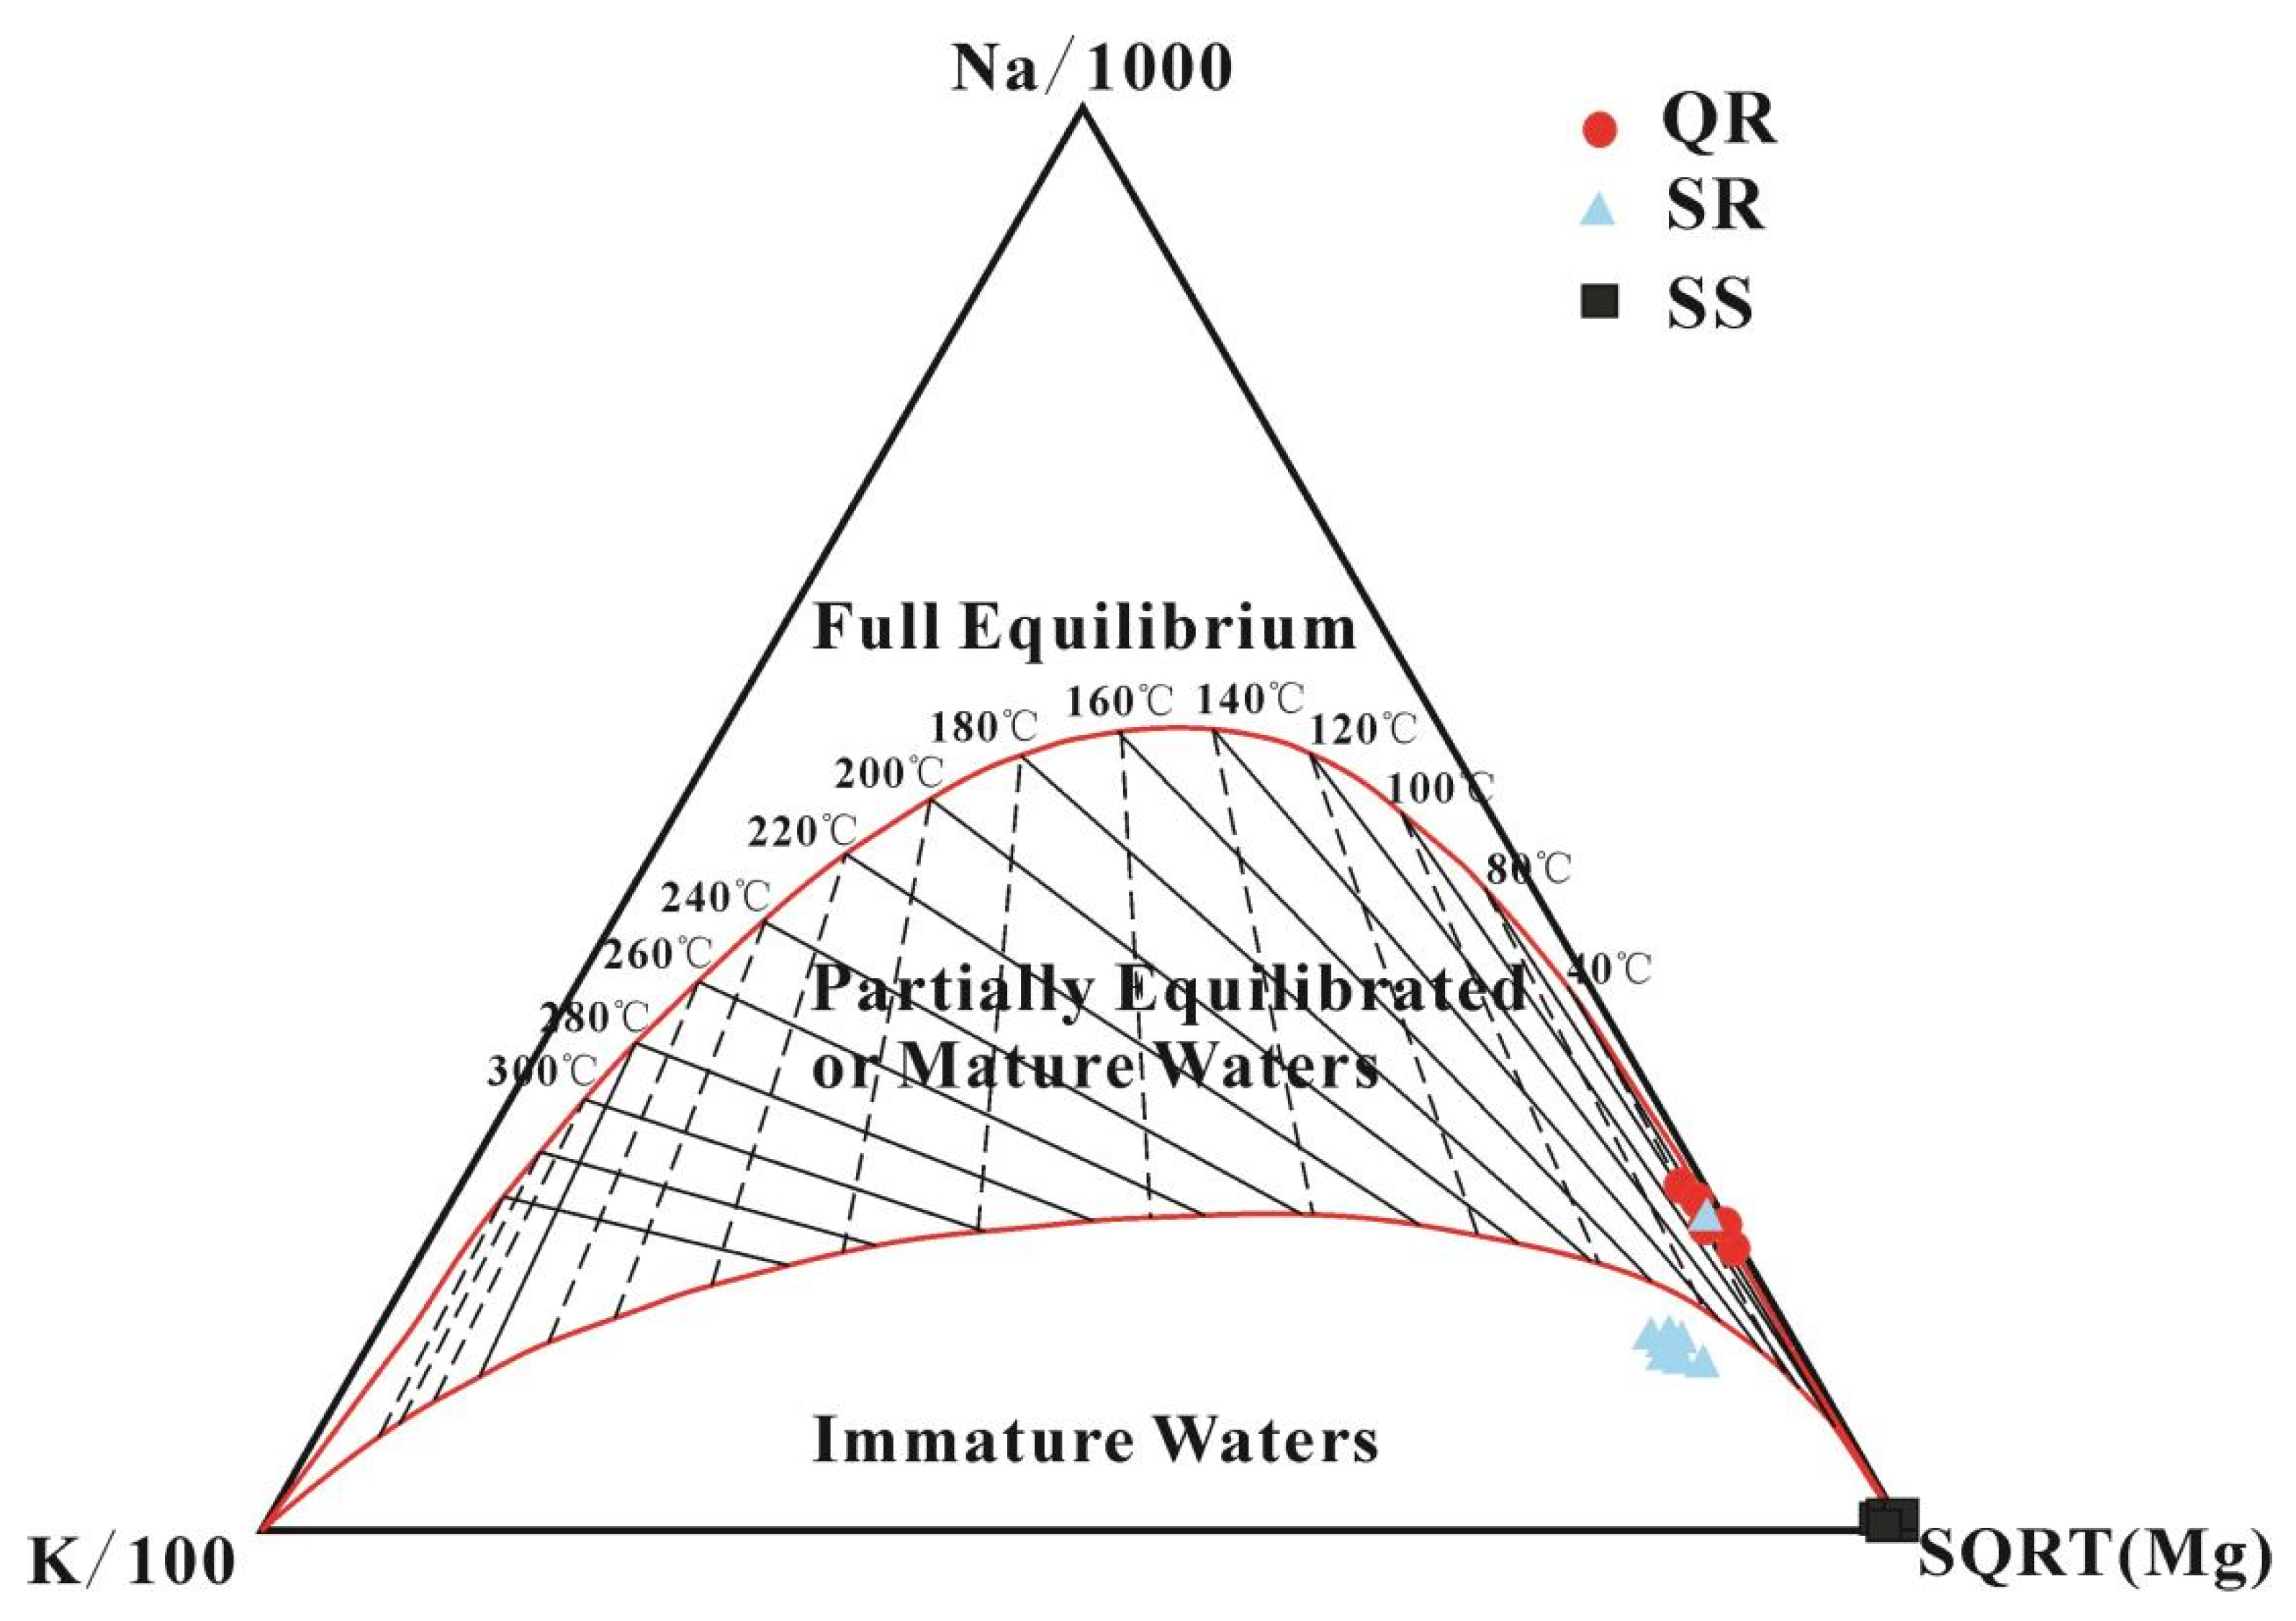
4.3. Mineral Saturation Index and Thermal Storage Temperature
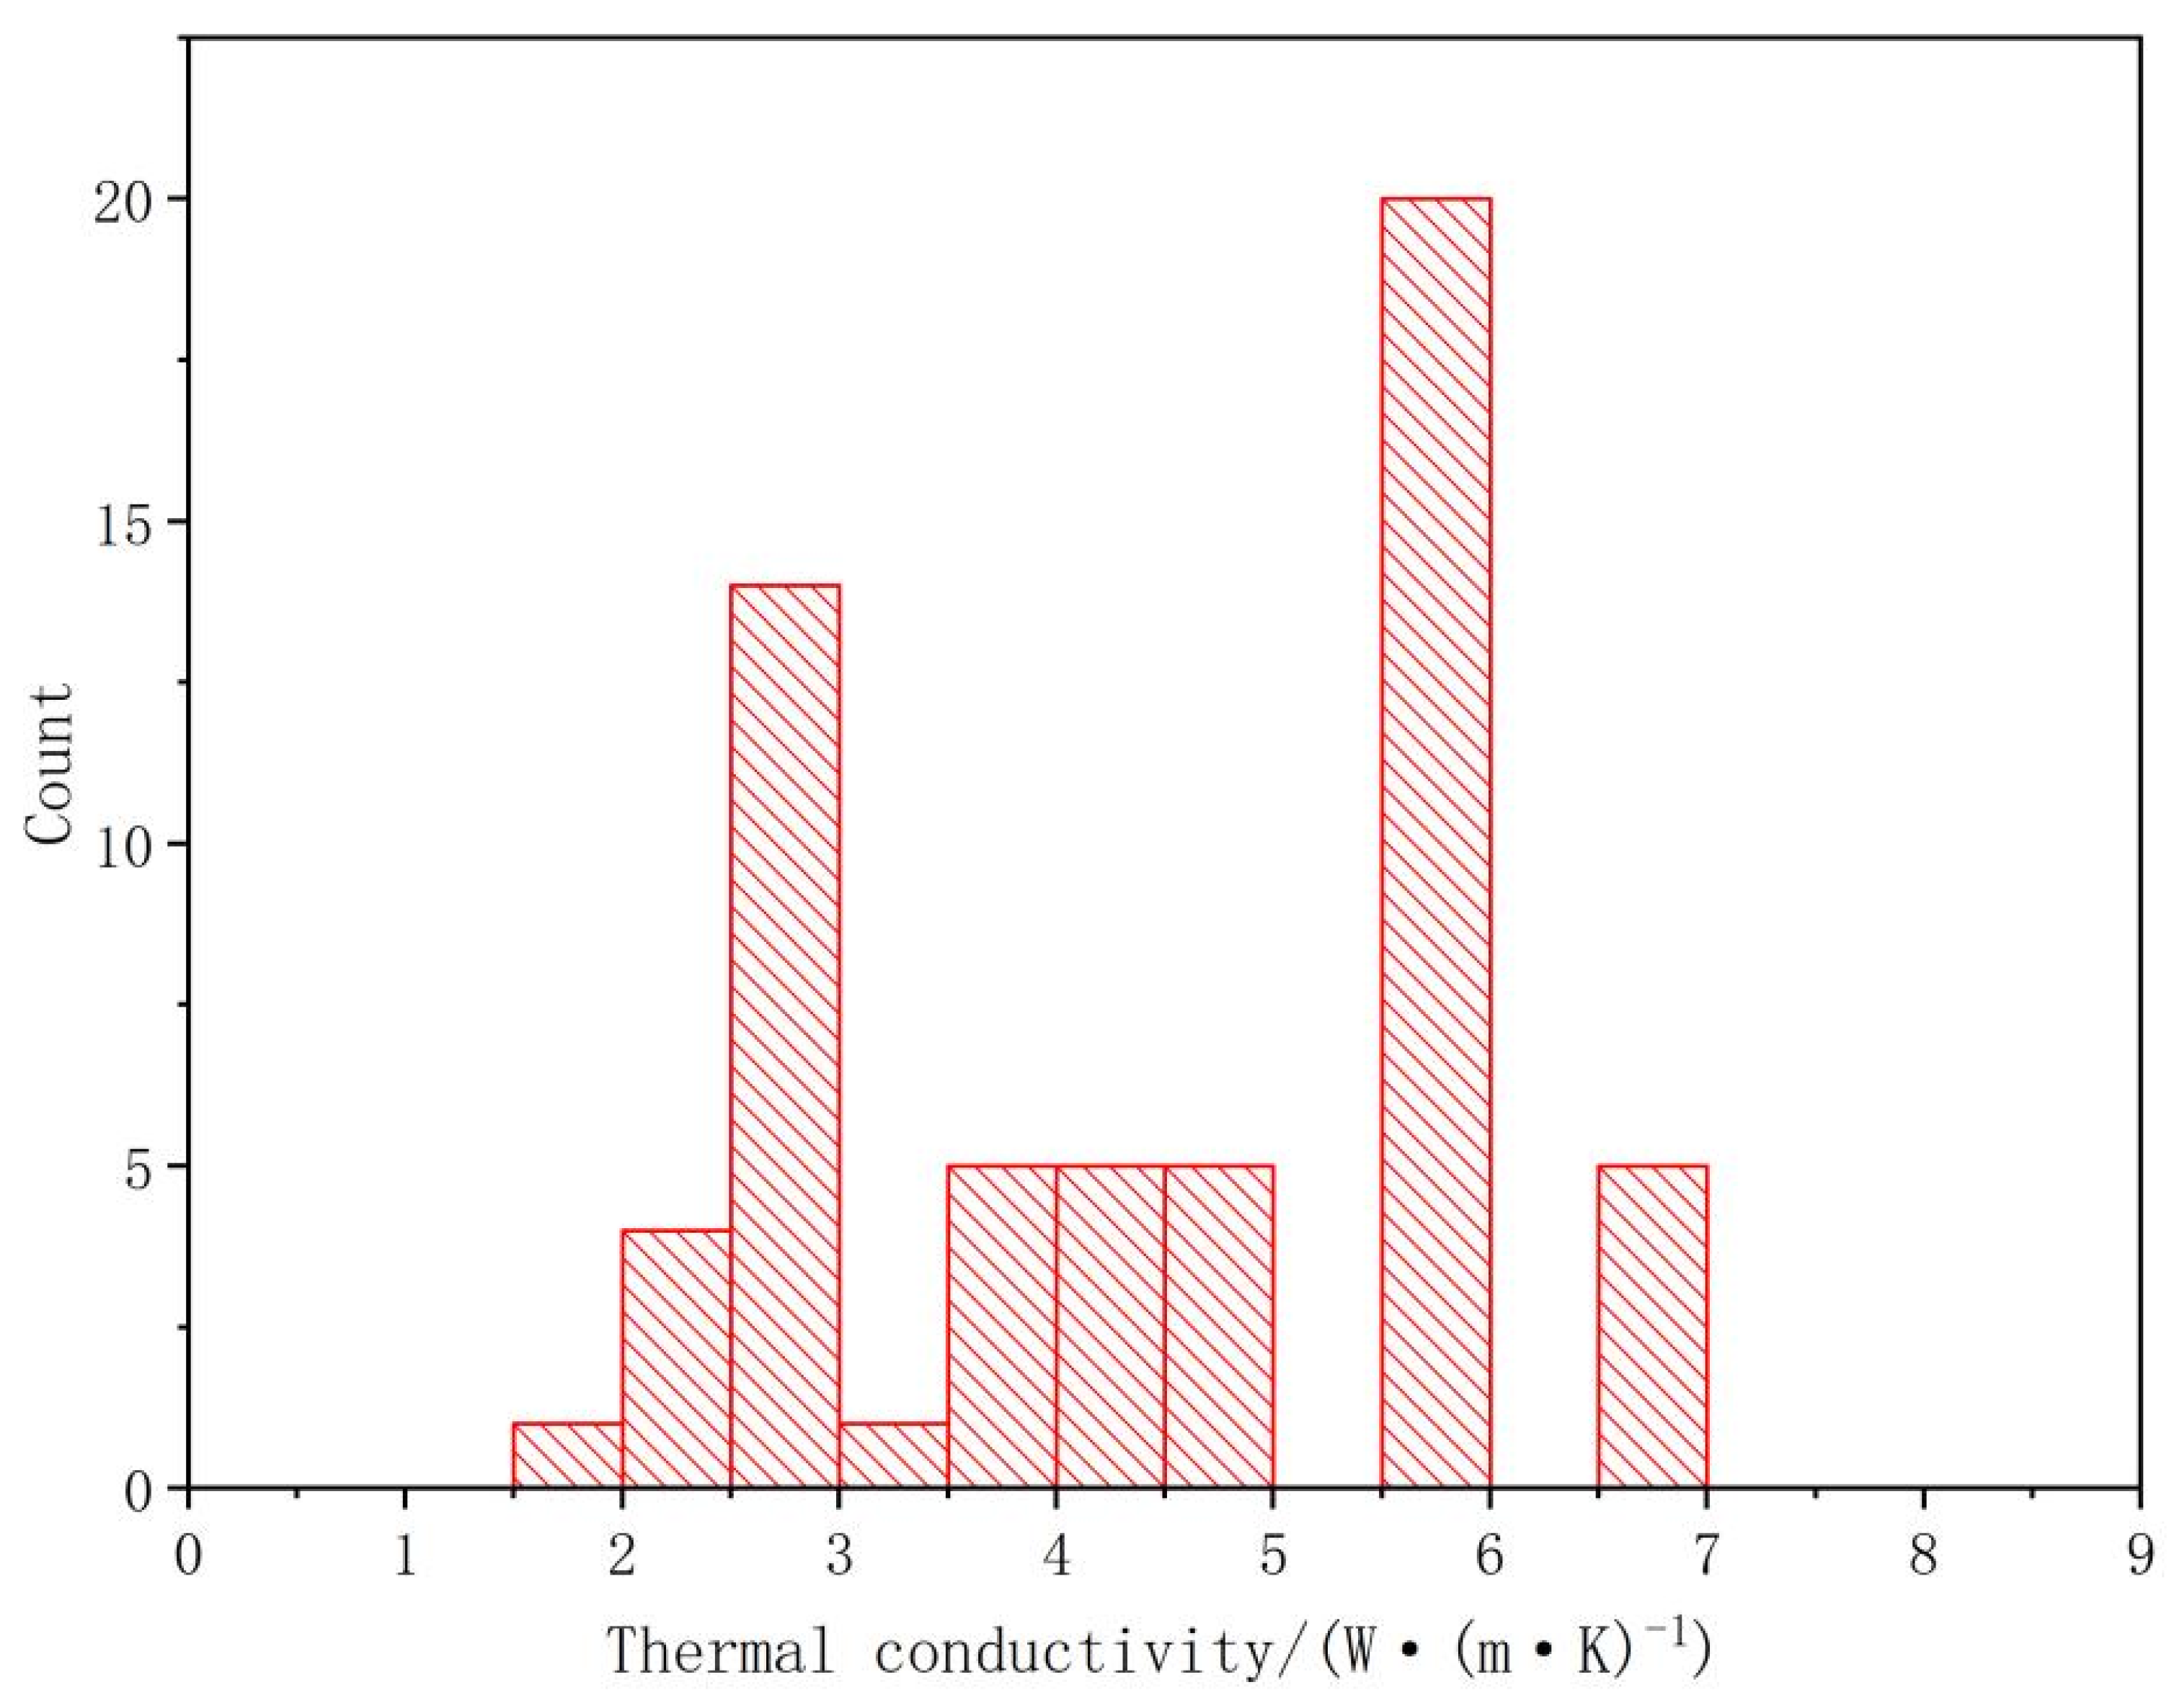
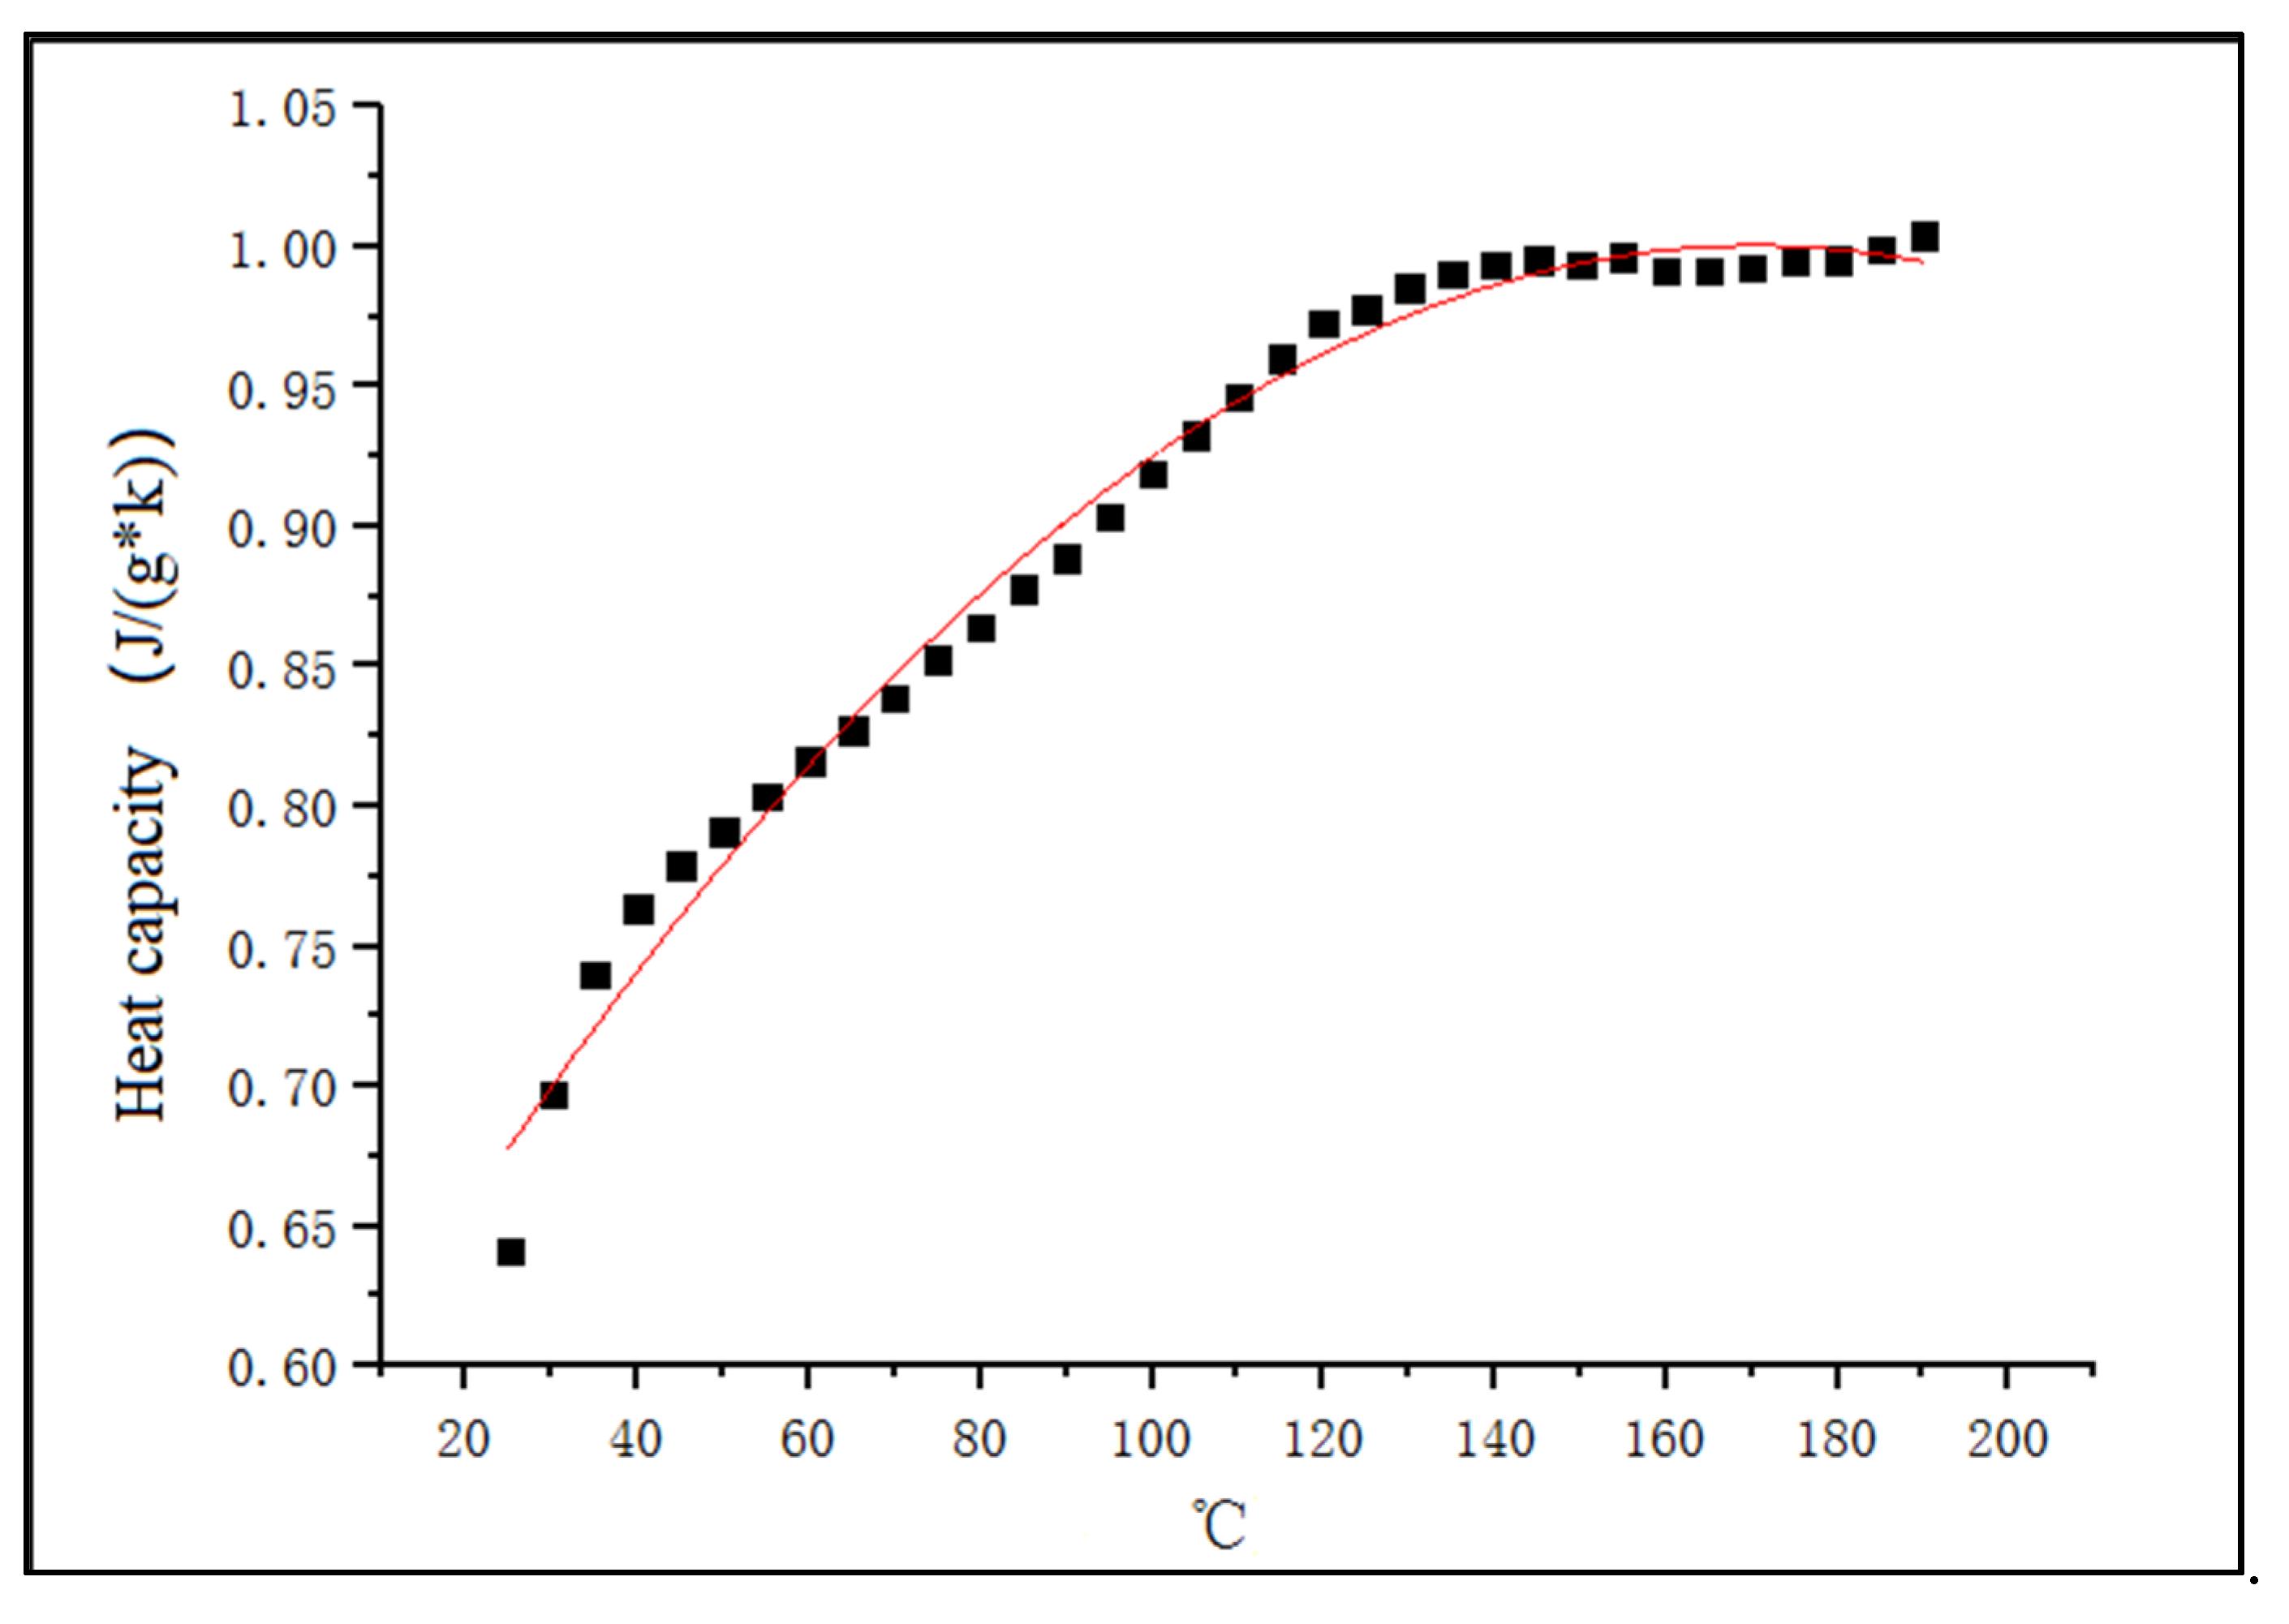
4.4. Rock Thermal Properties
5. Discussion
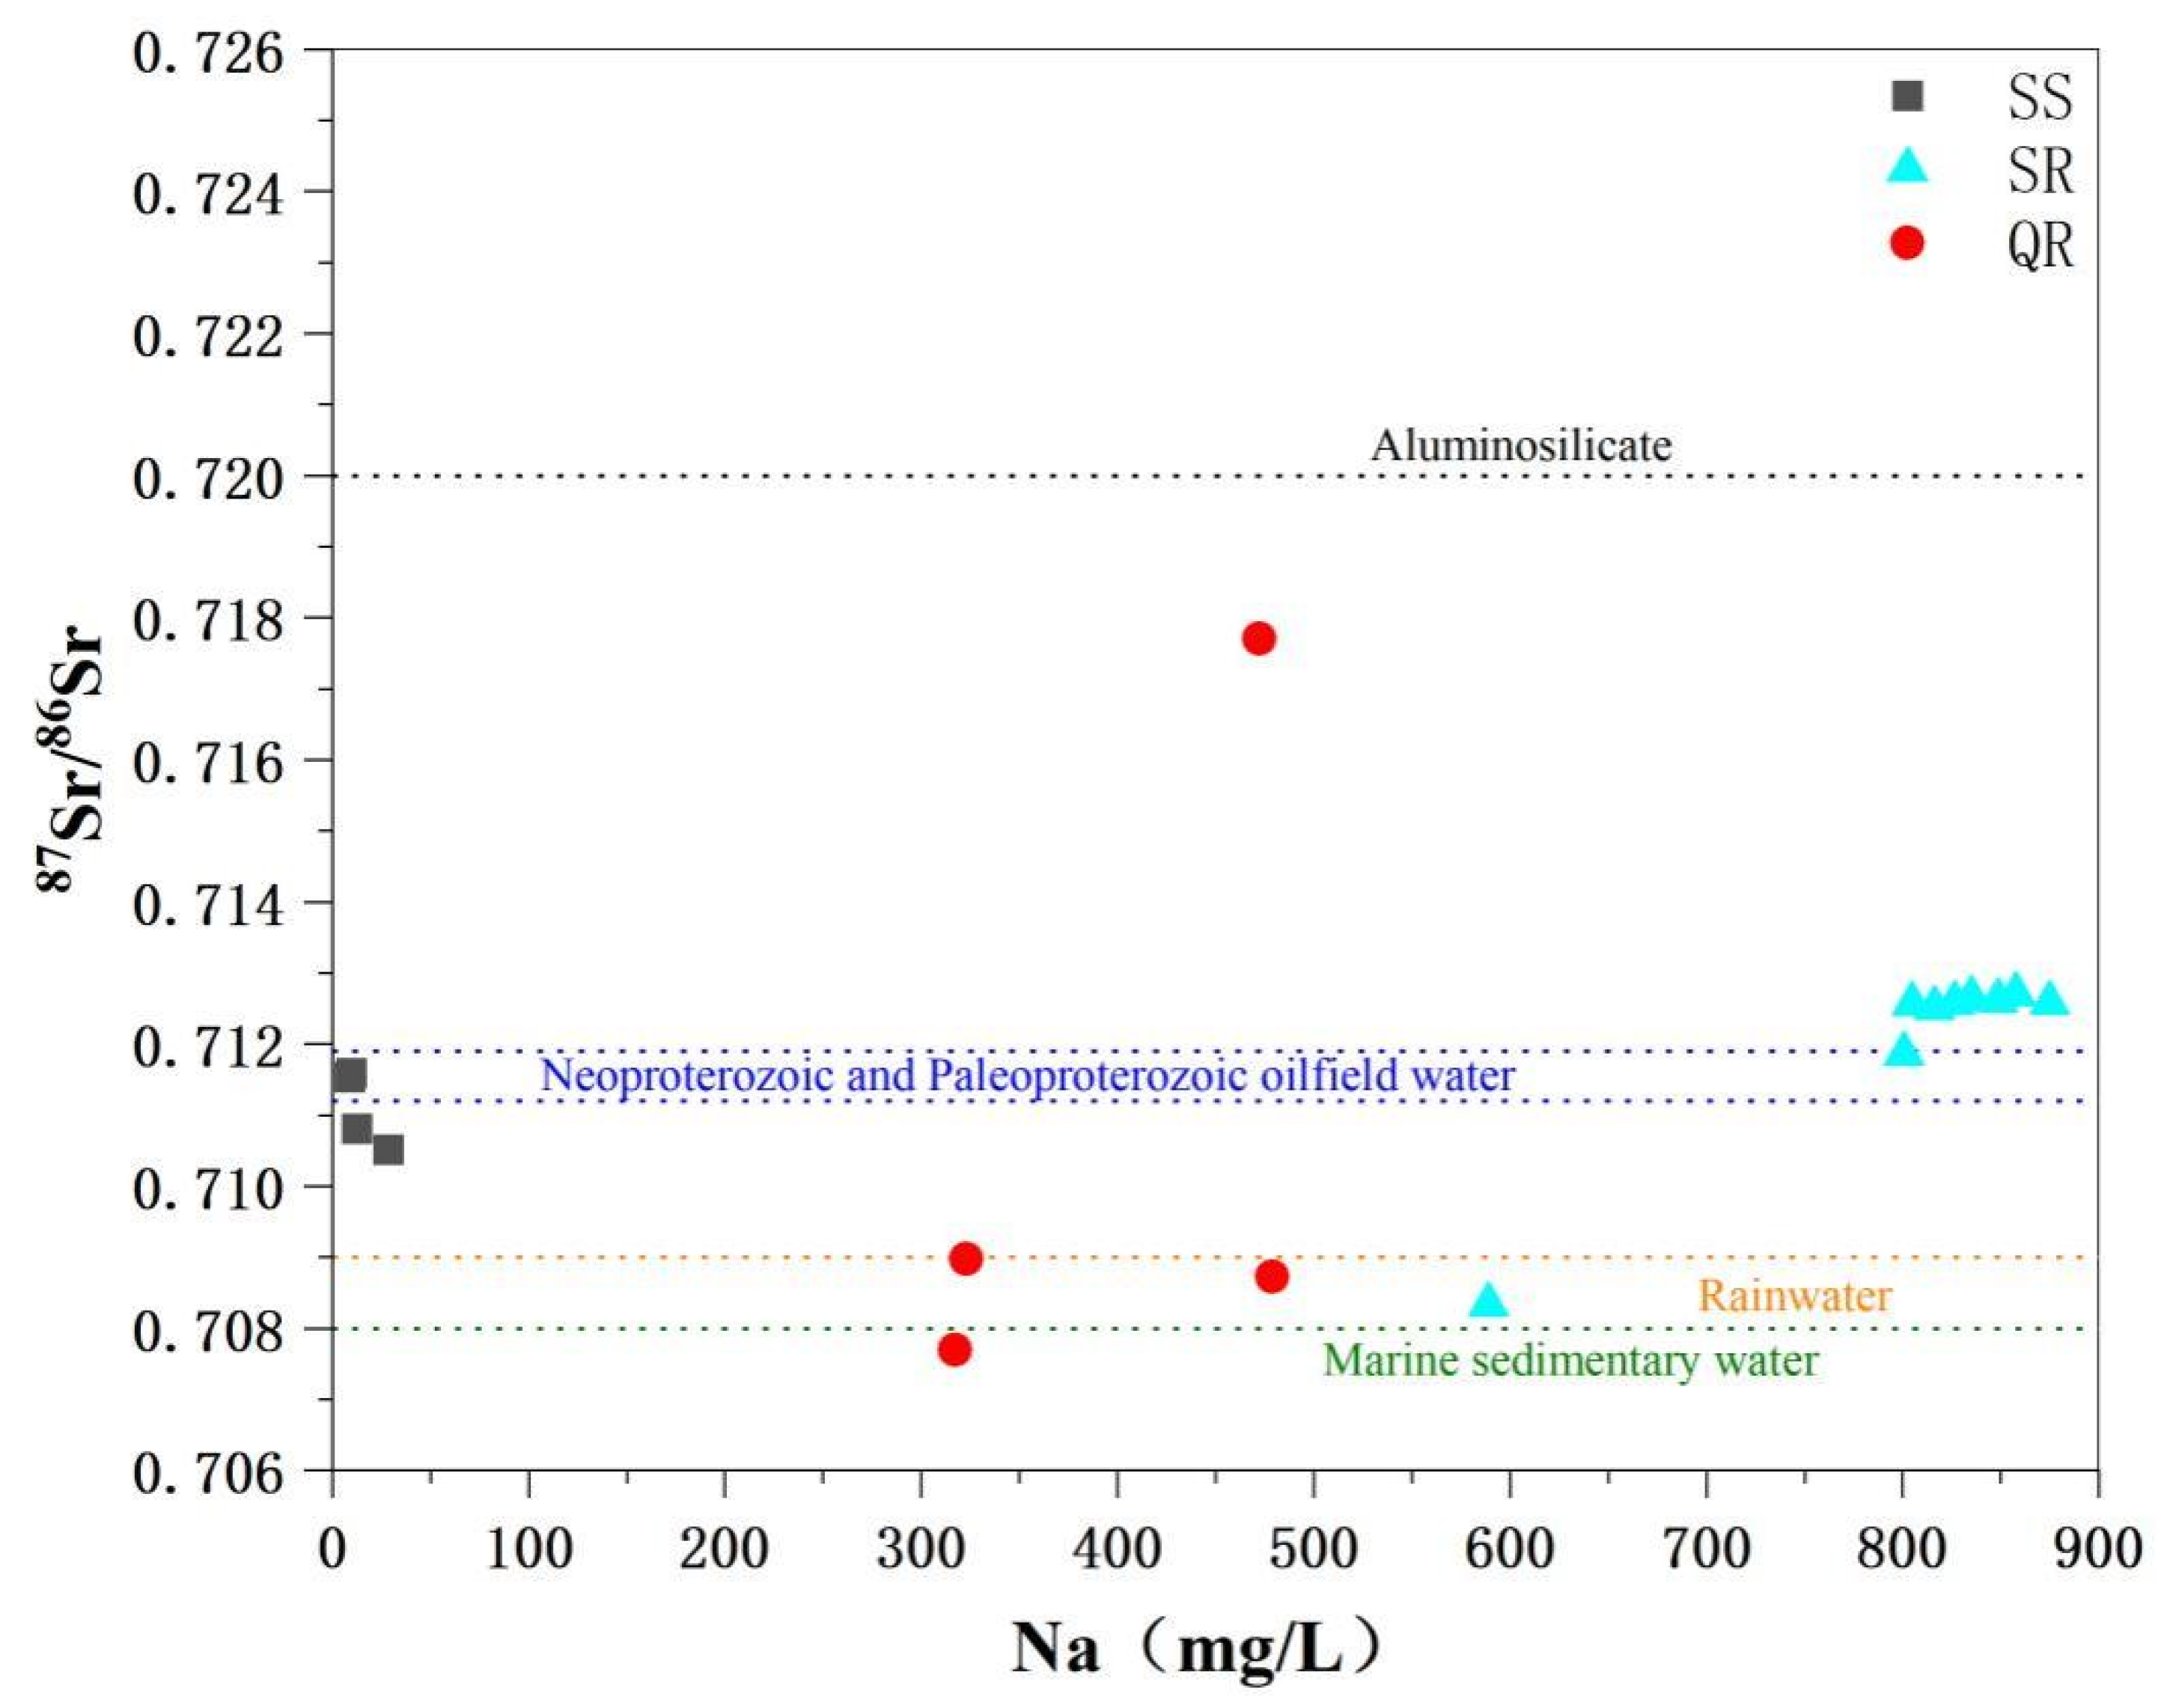
5.1. Hydrogeochemical Processes in Geothermal Fluids
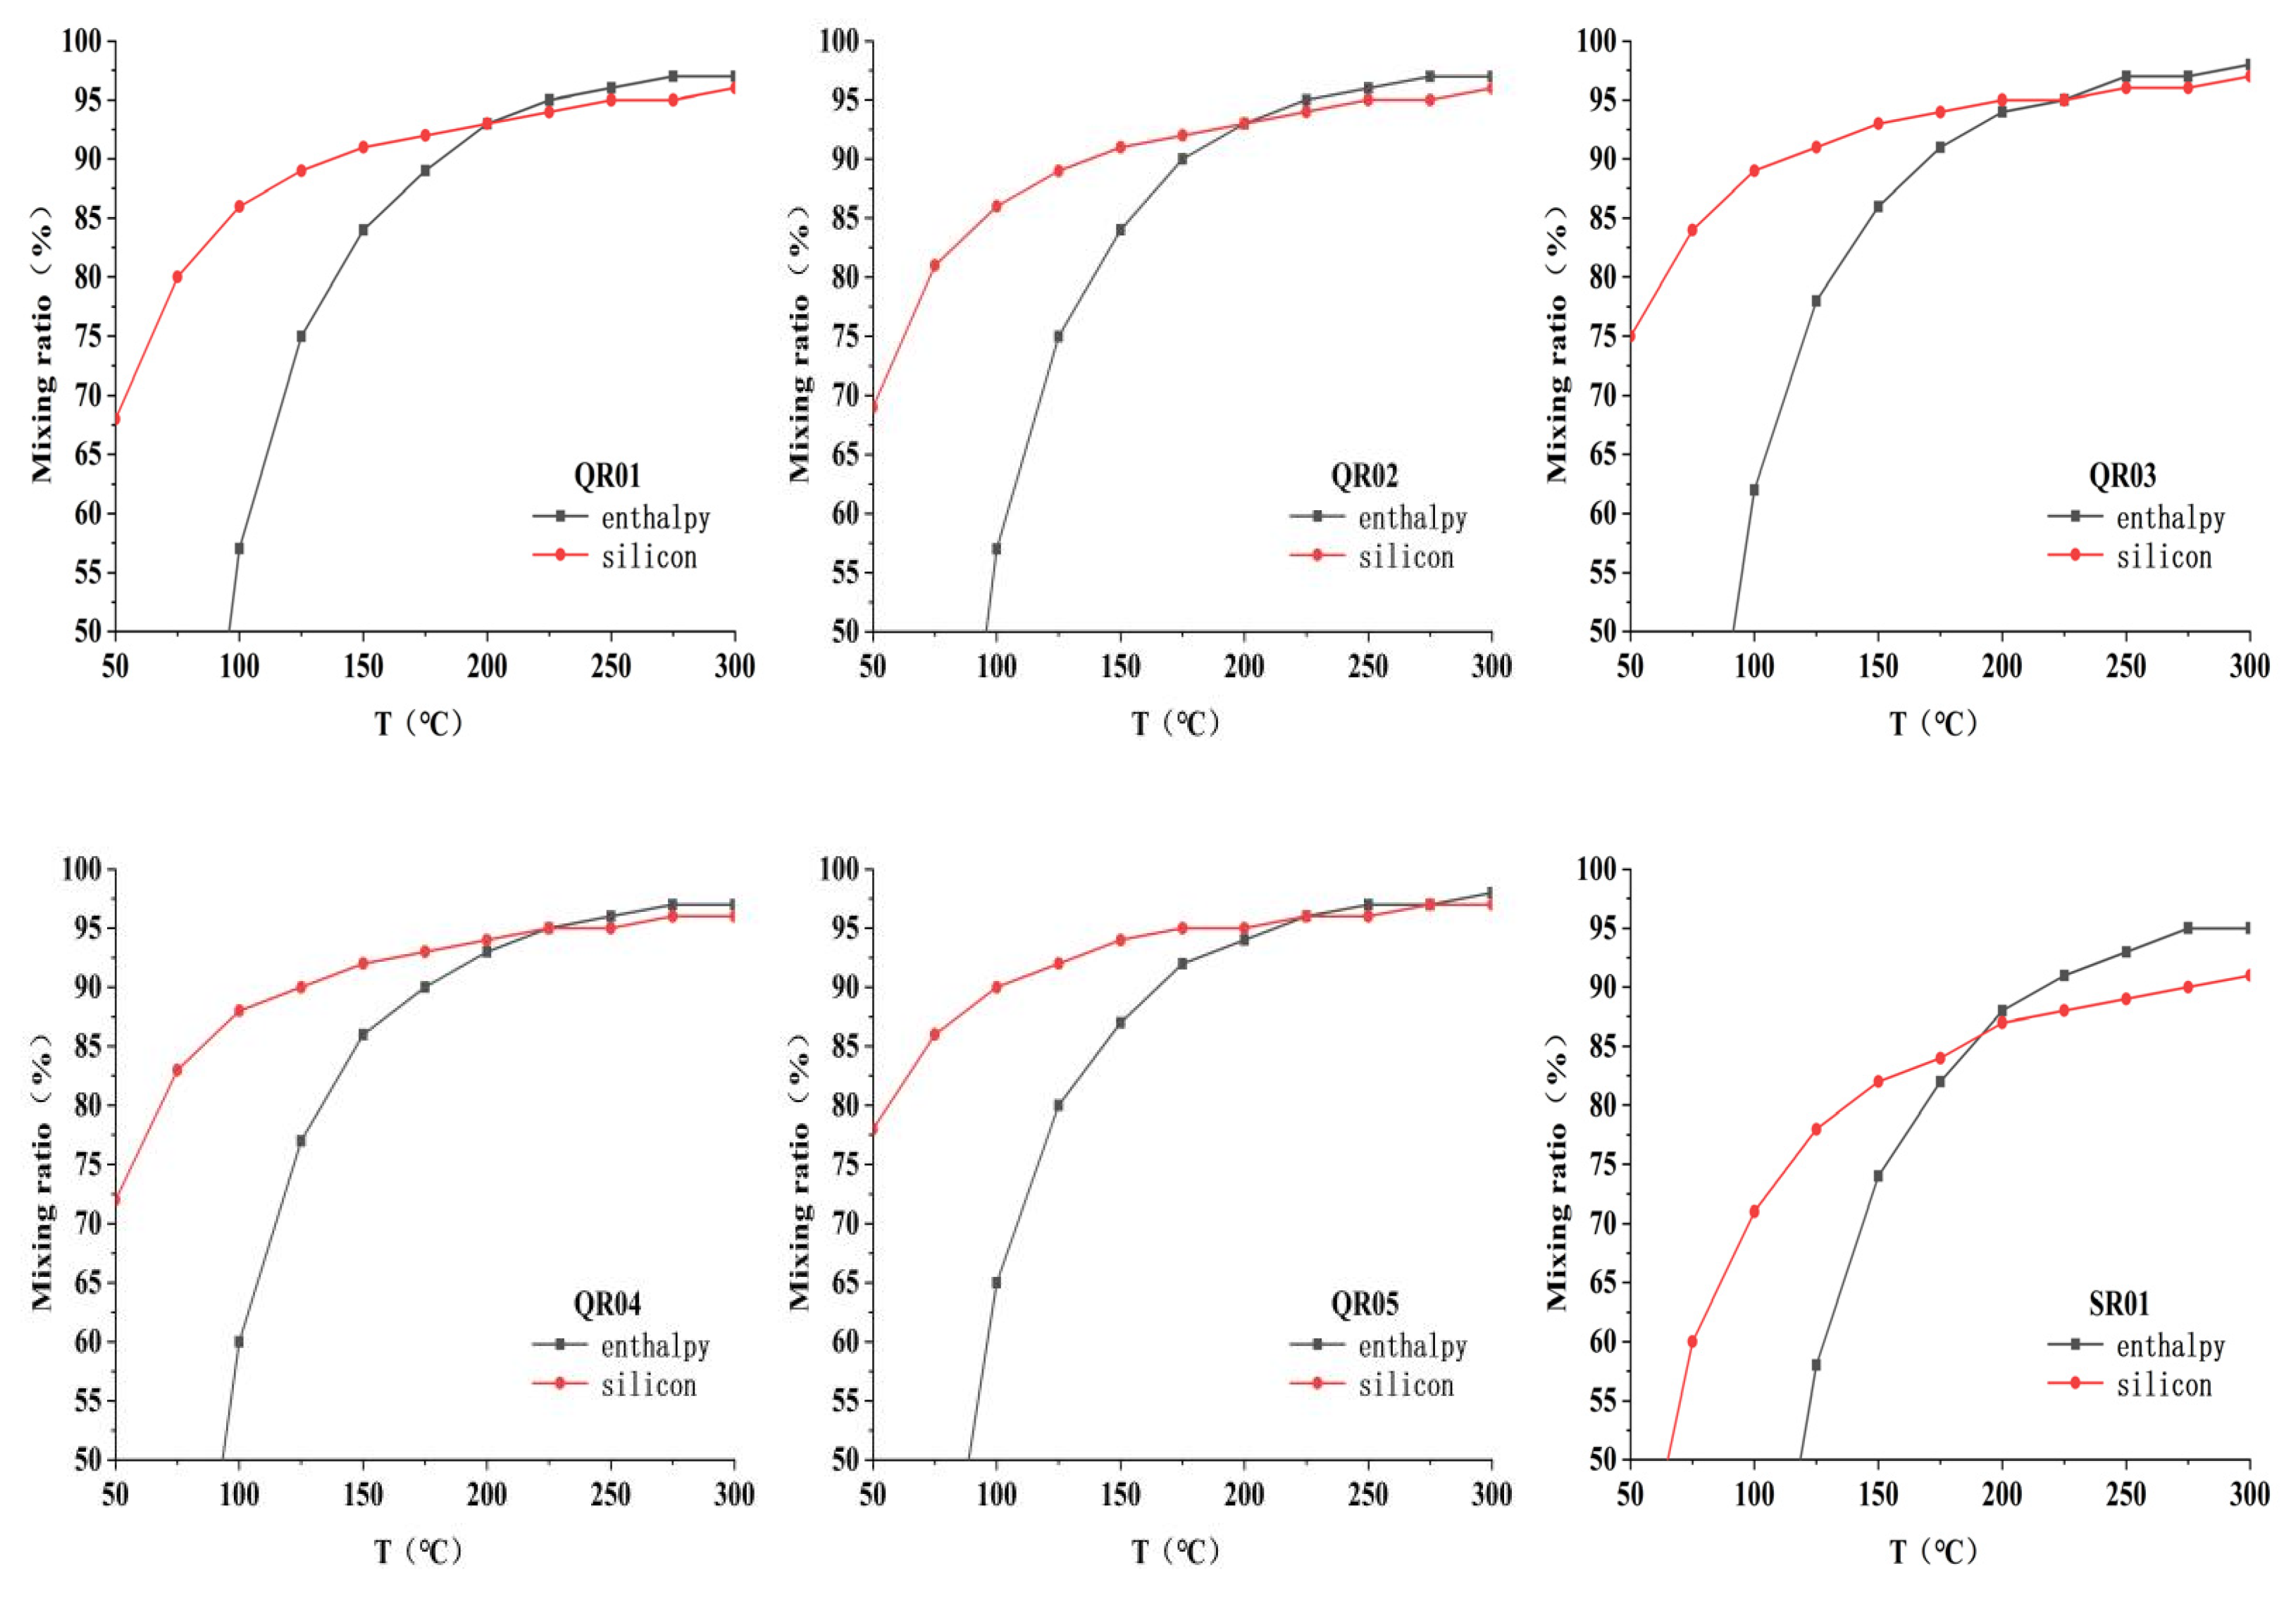
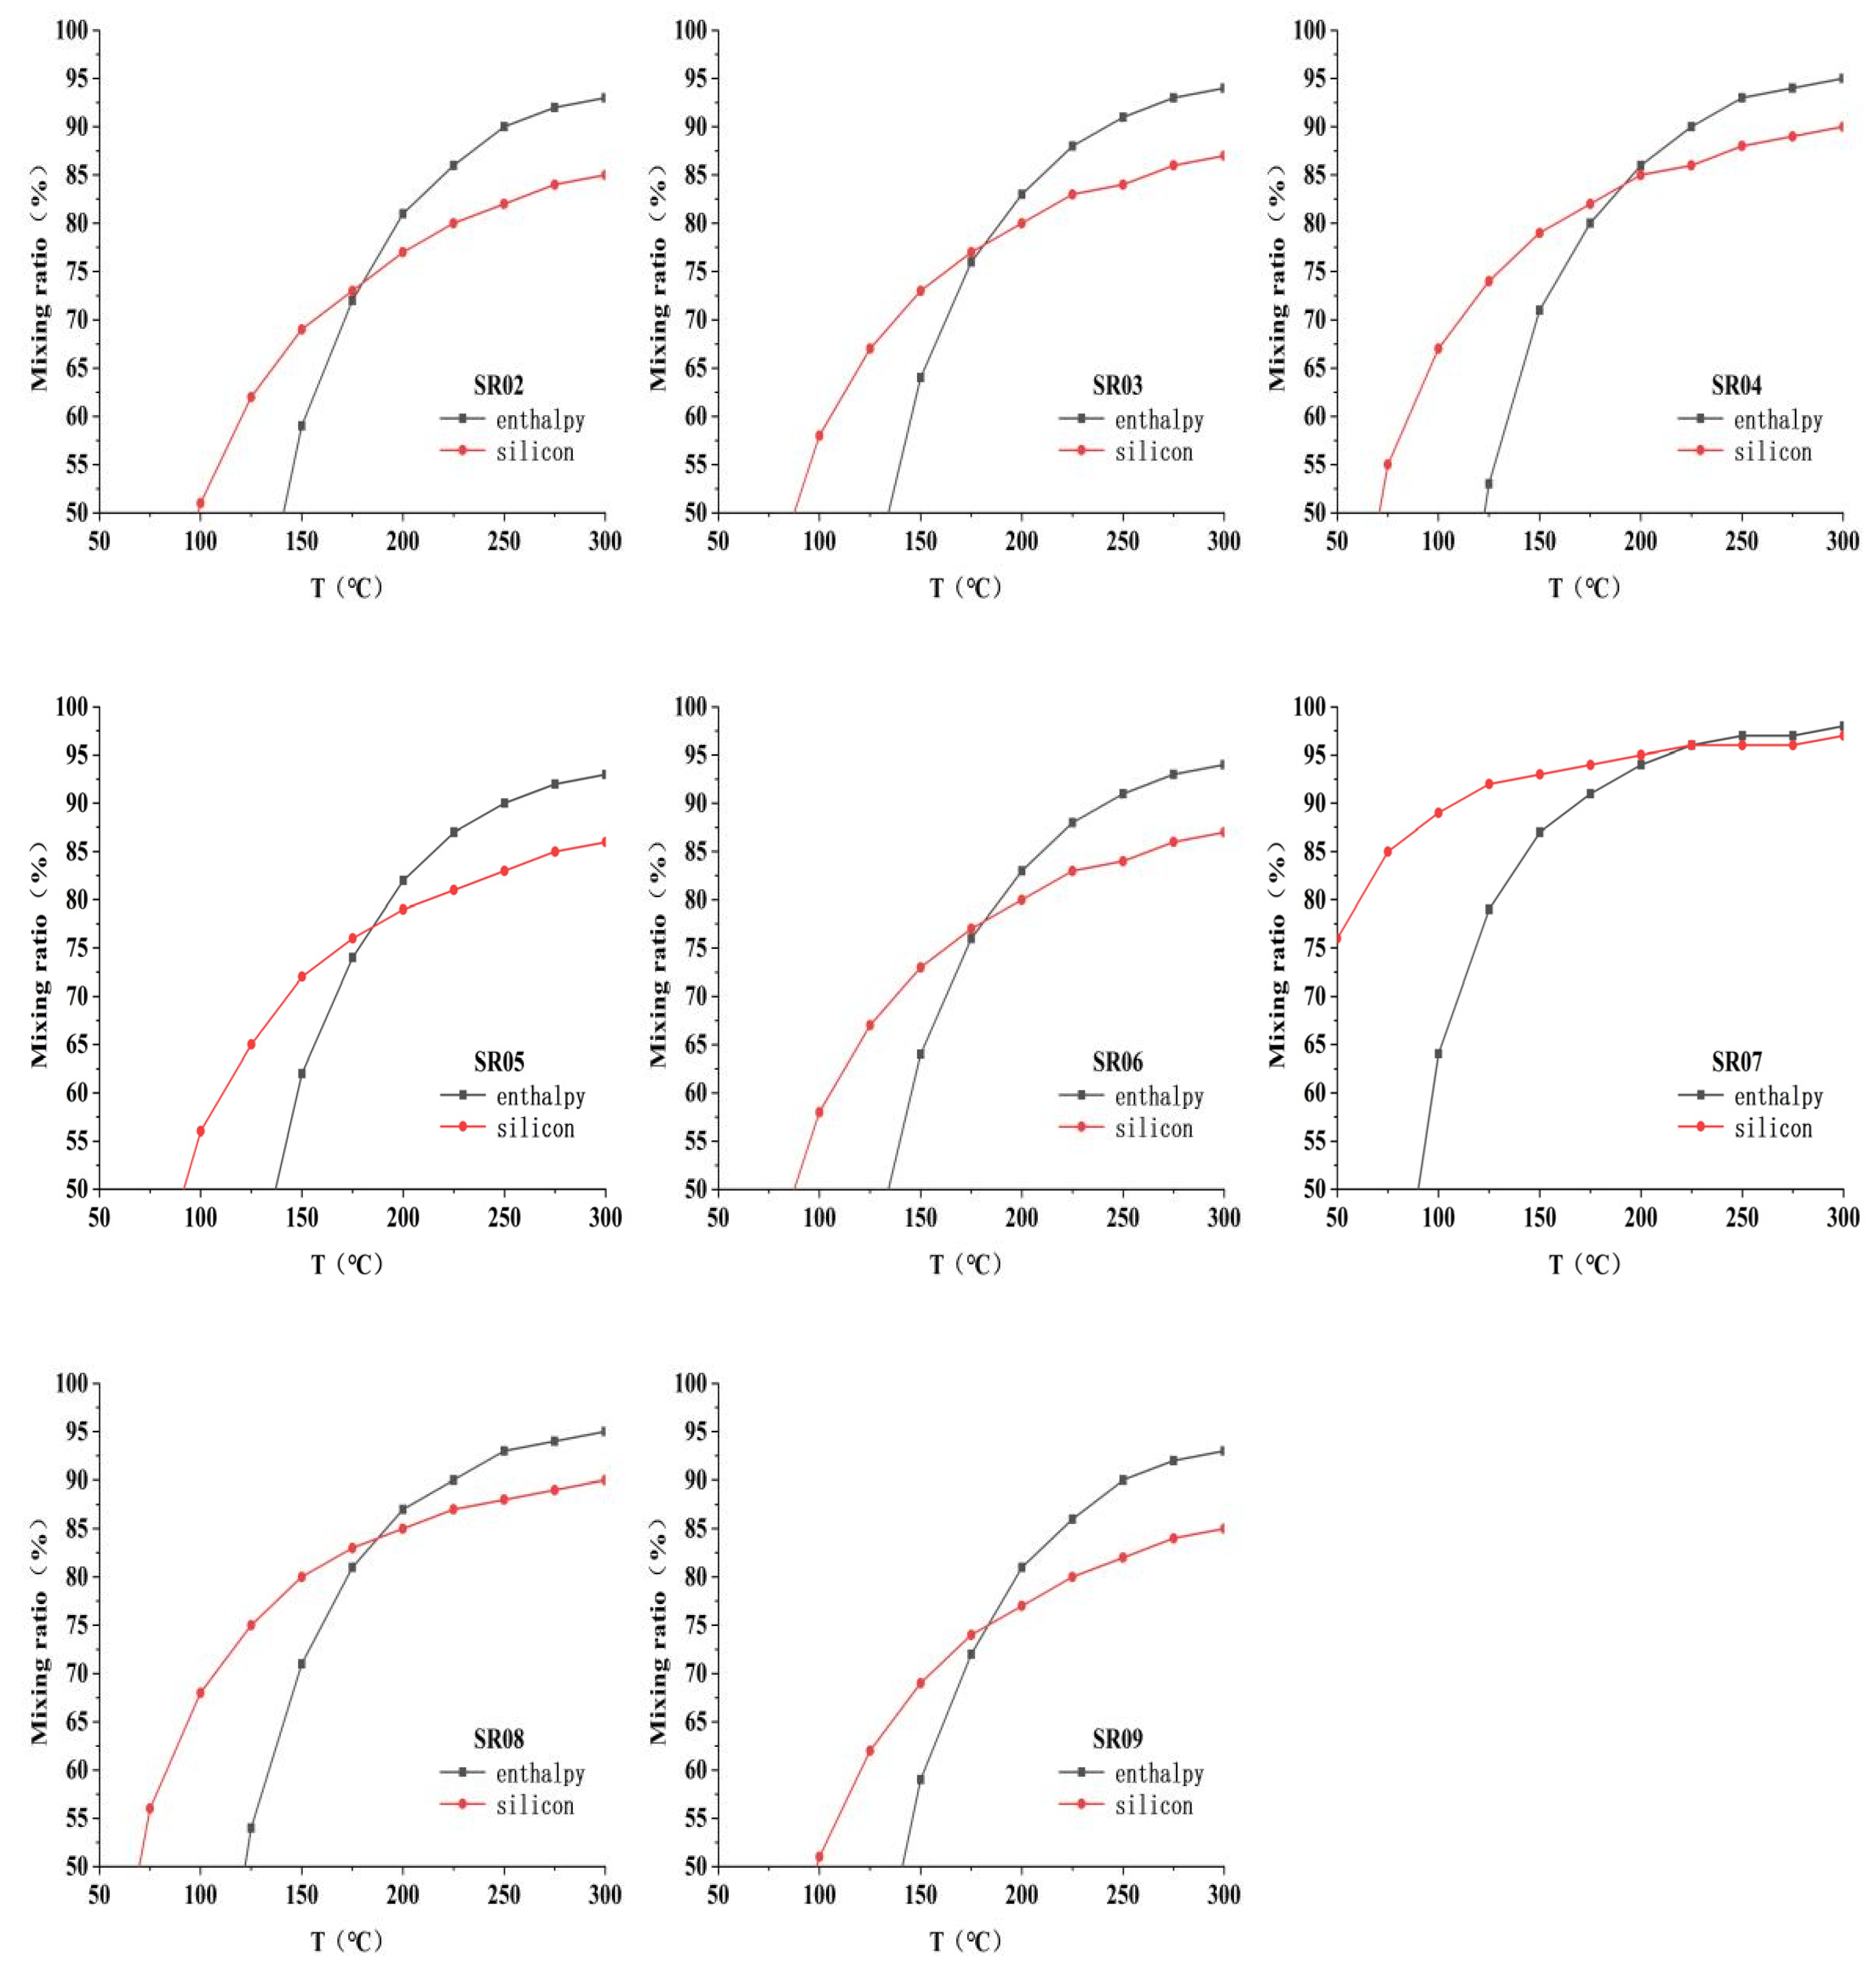
5.2. Geothermal Fluid Circulation Characteristics and Cold Water Mixing
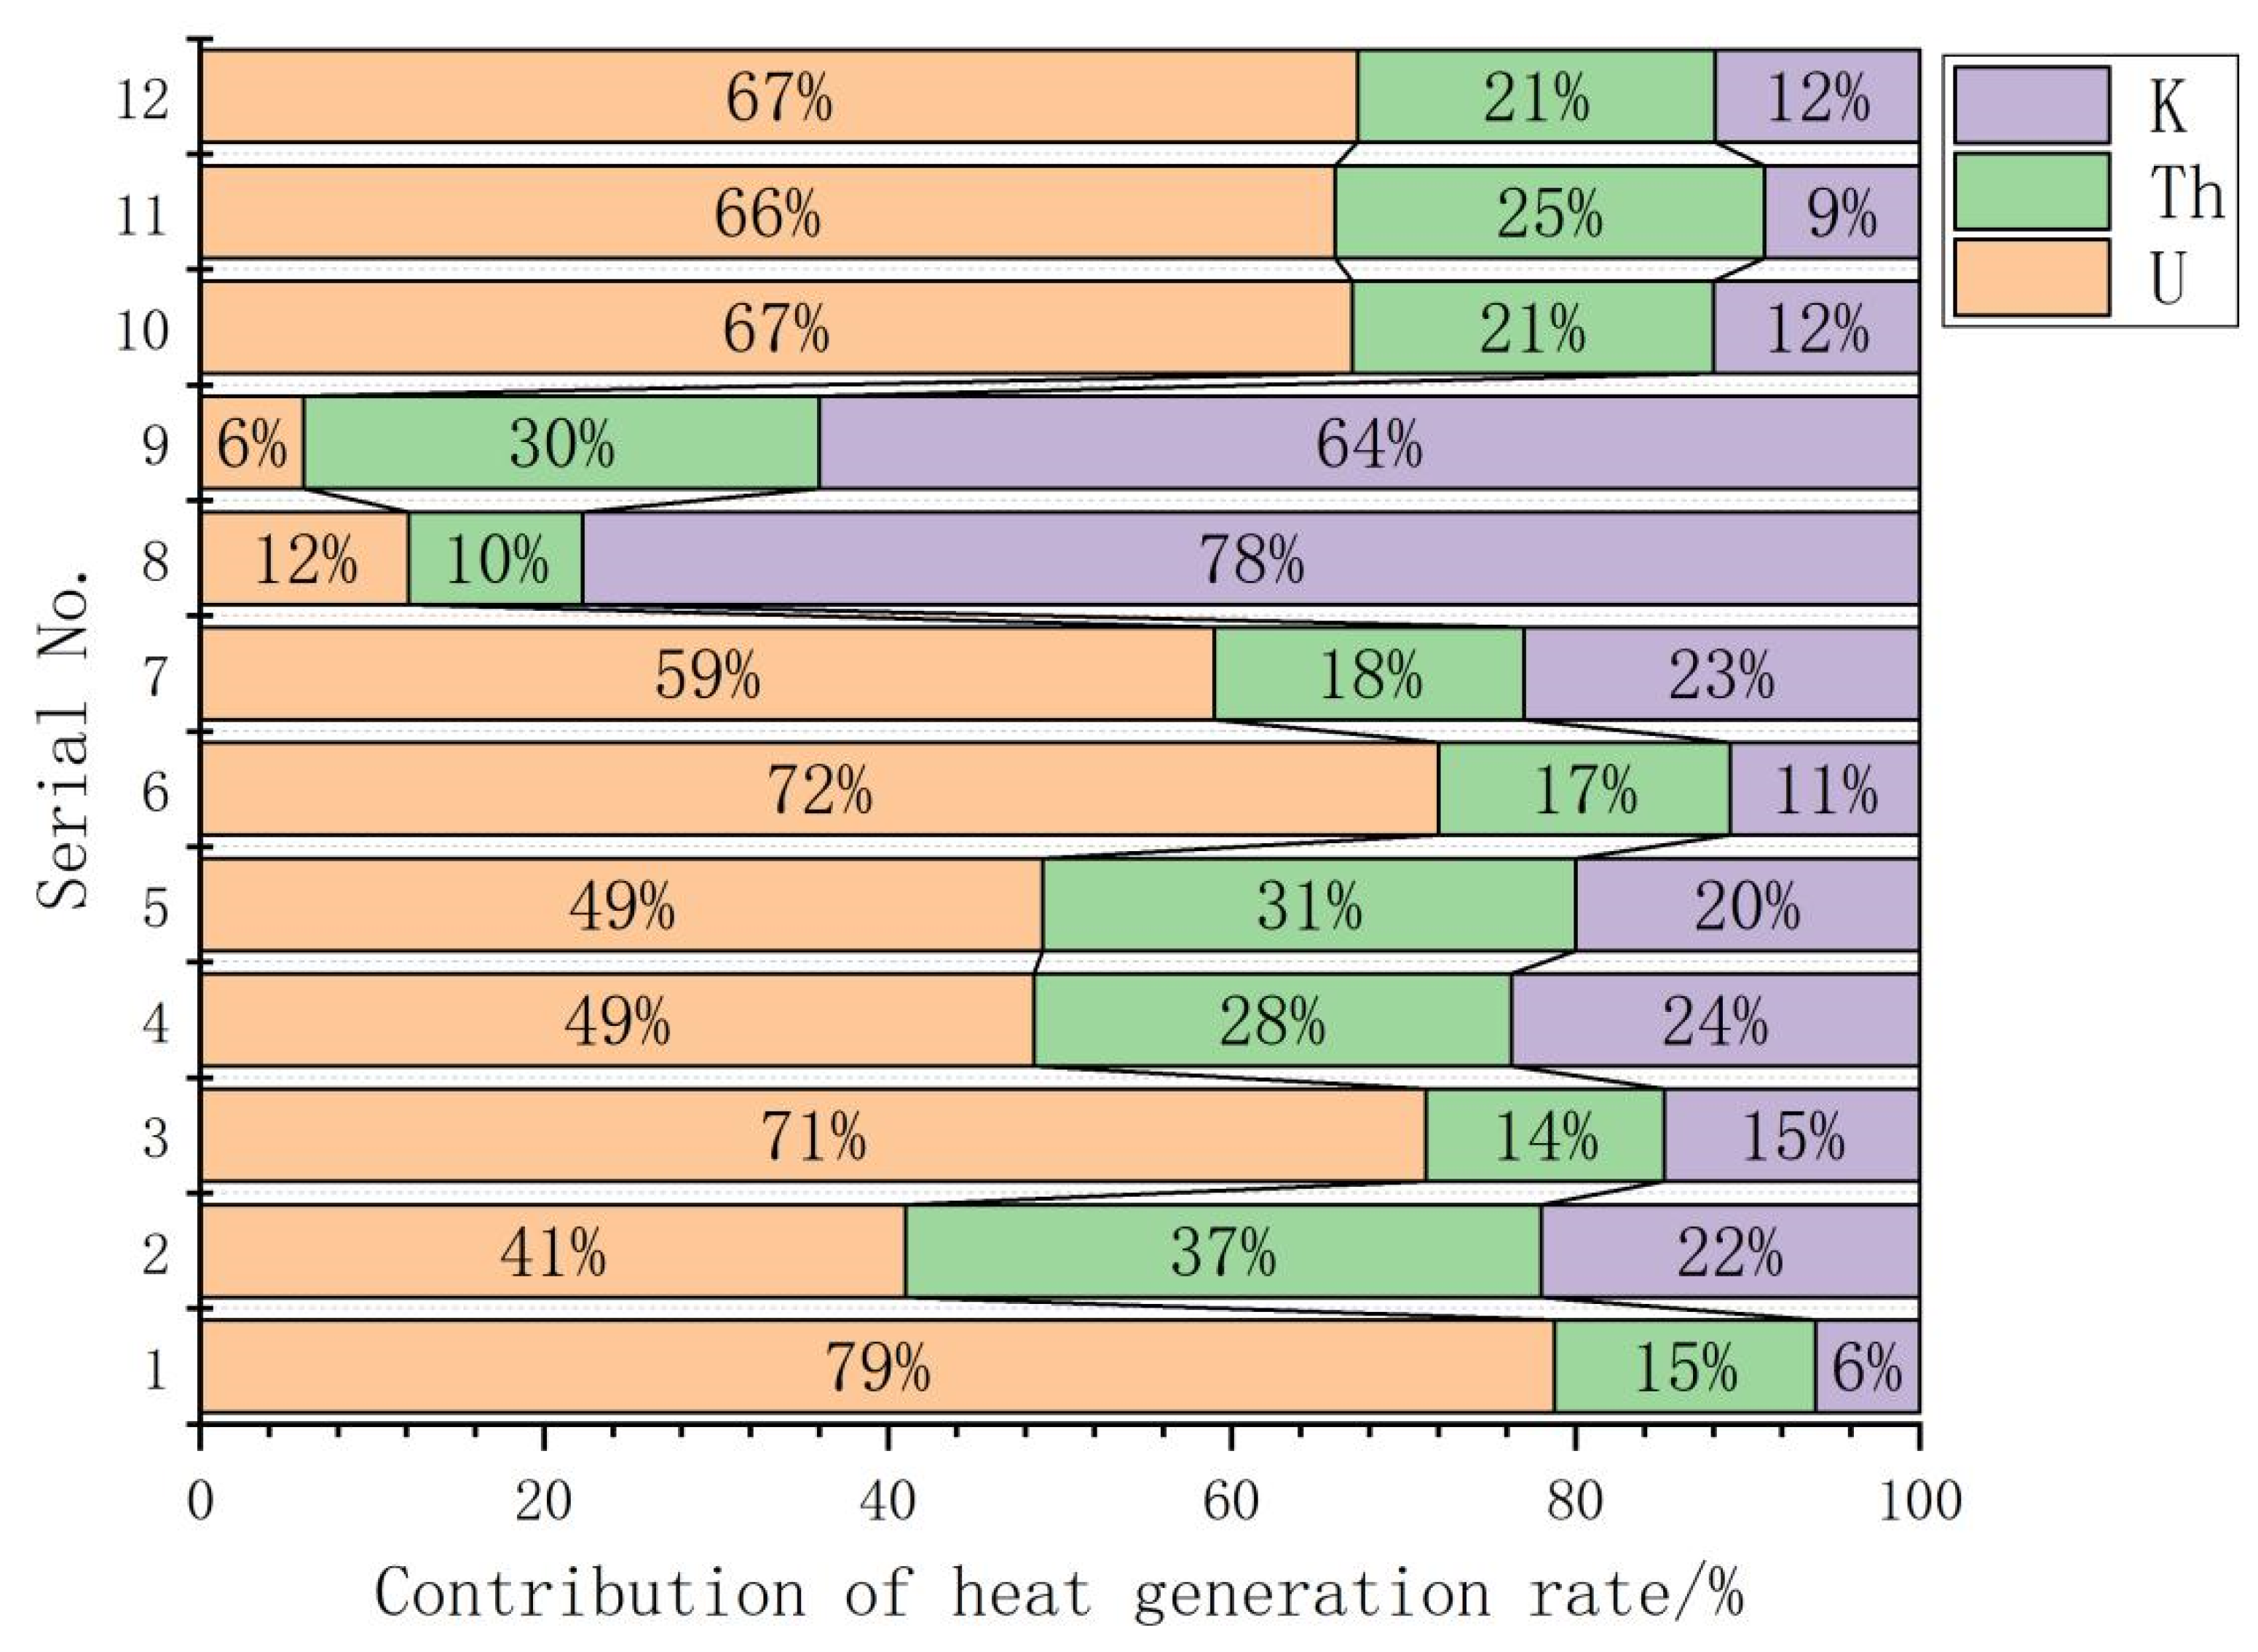
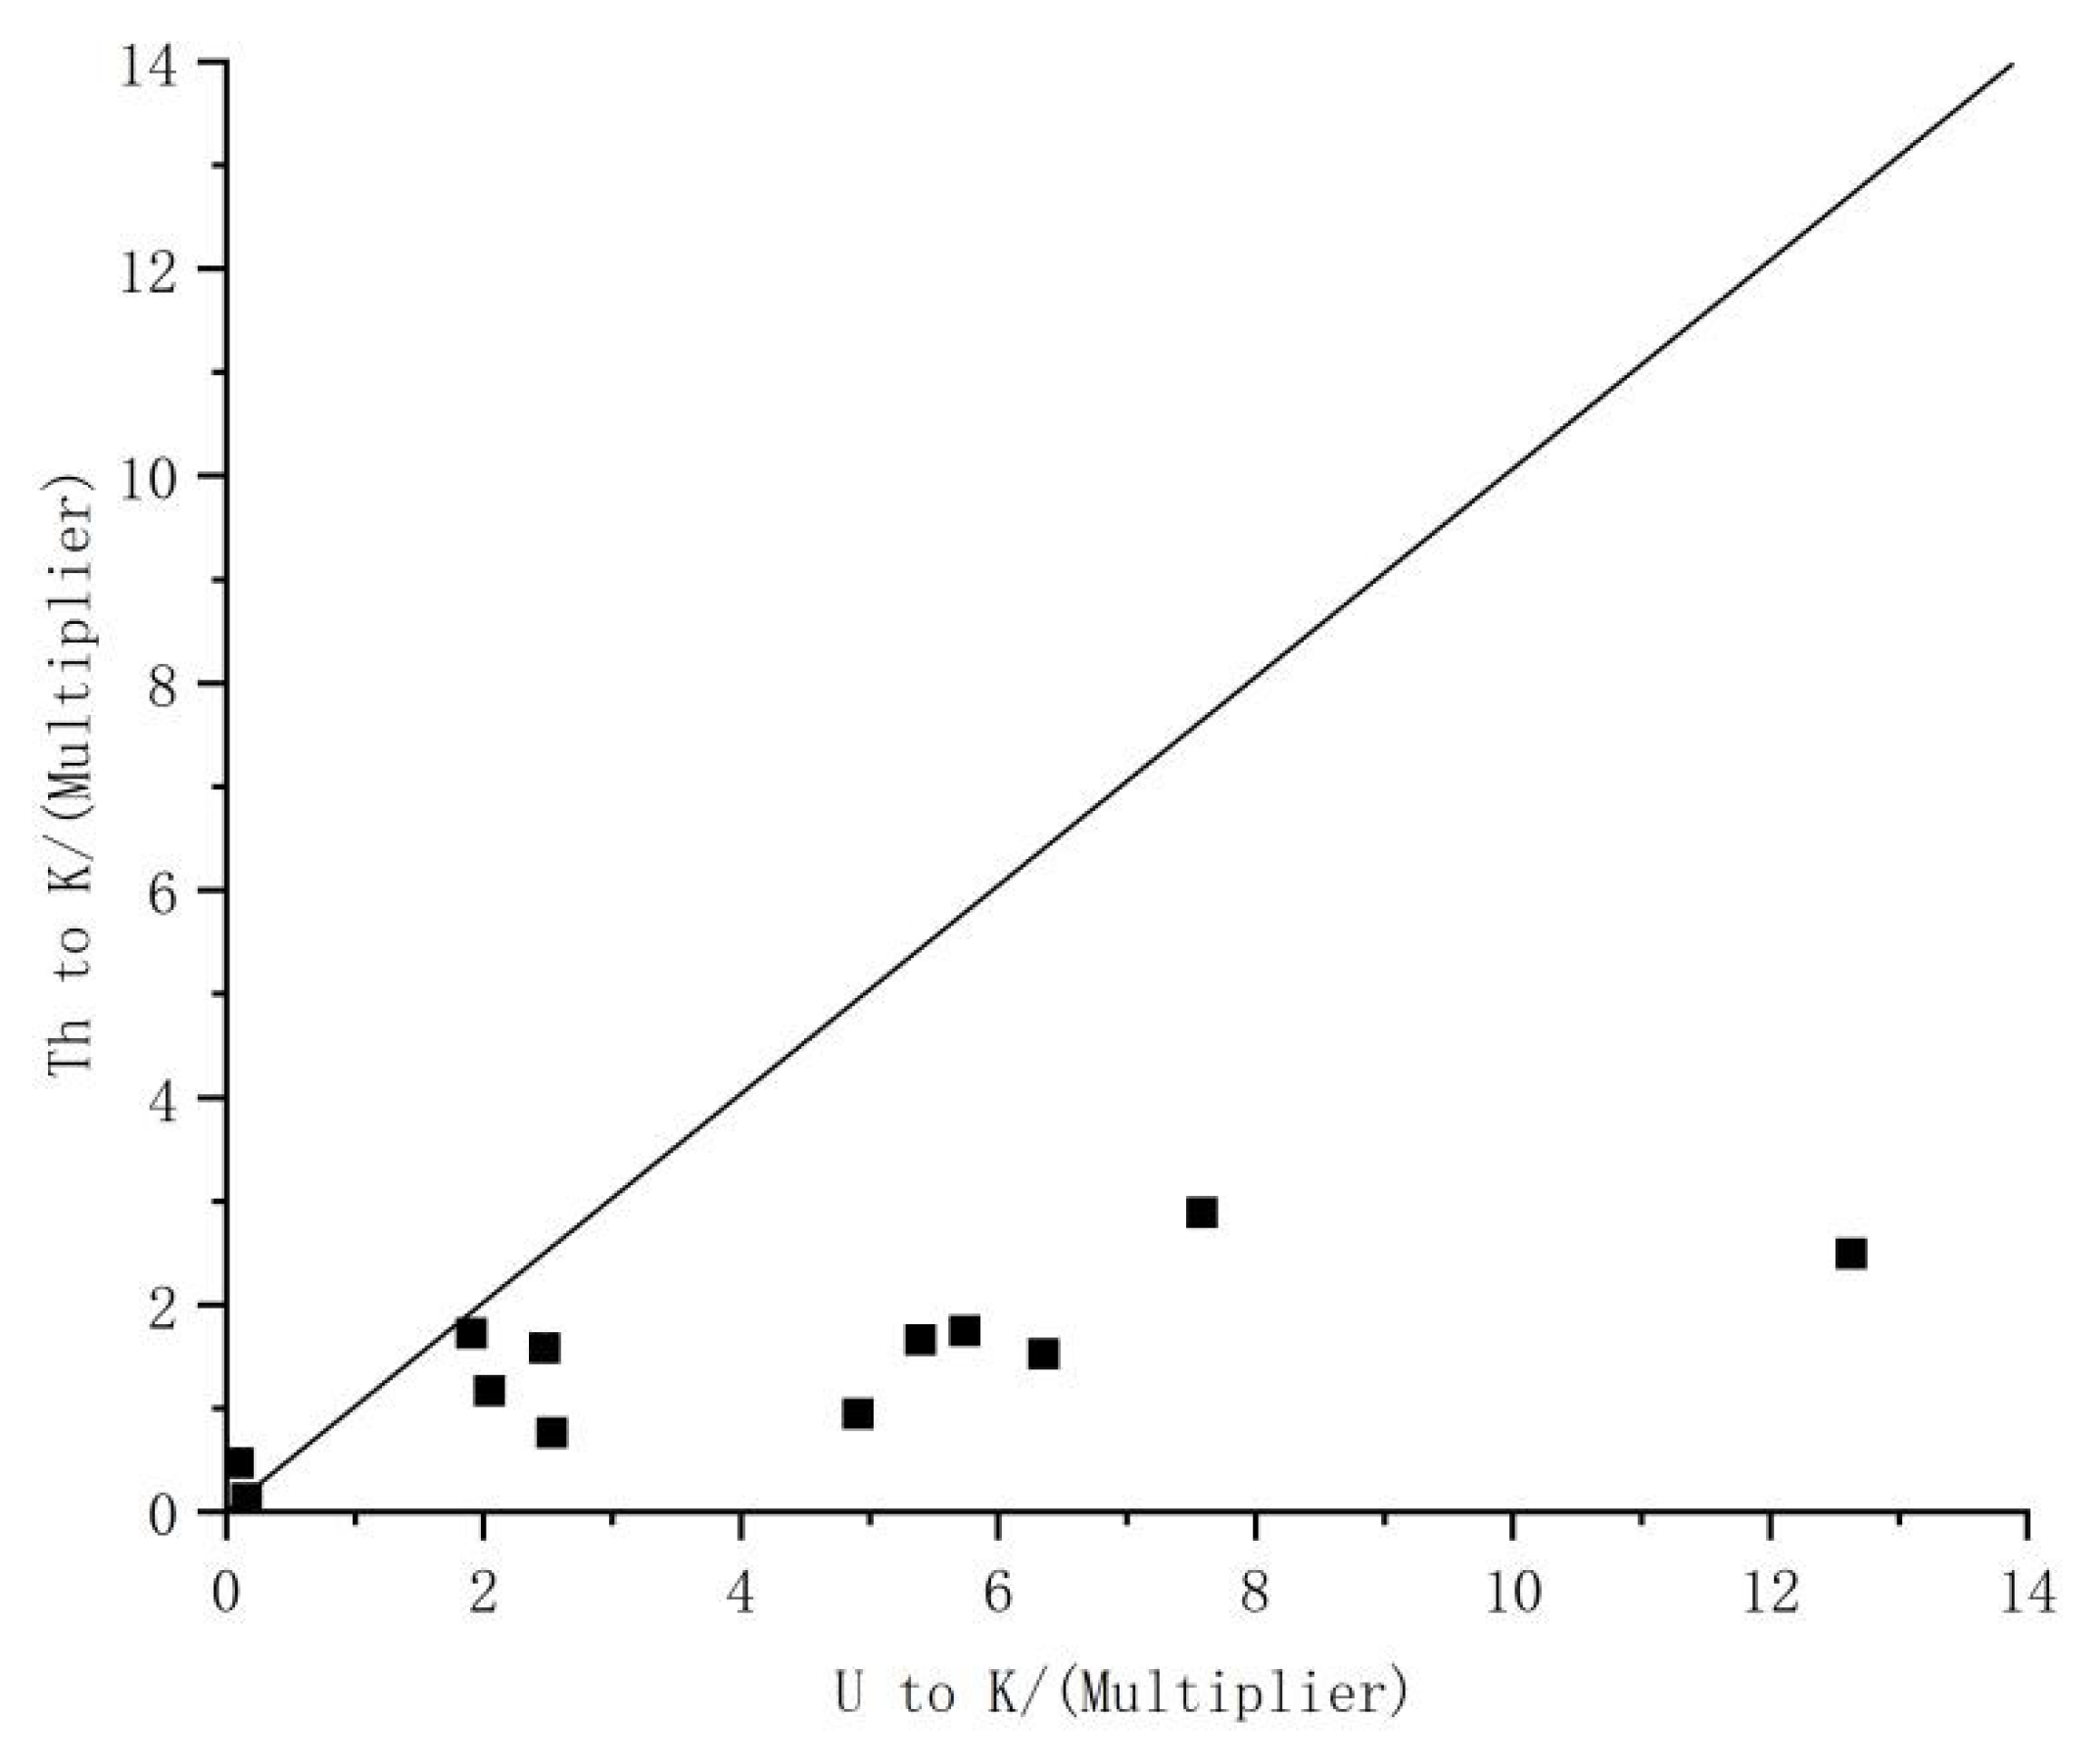
5.3. Radioactivity of Thermal Storage Rocks
5.4. Vertical Characteristics of the Geothermal Field
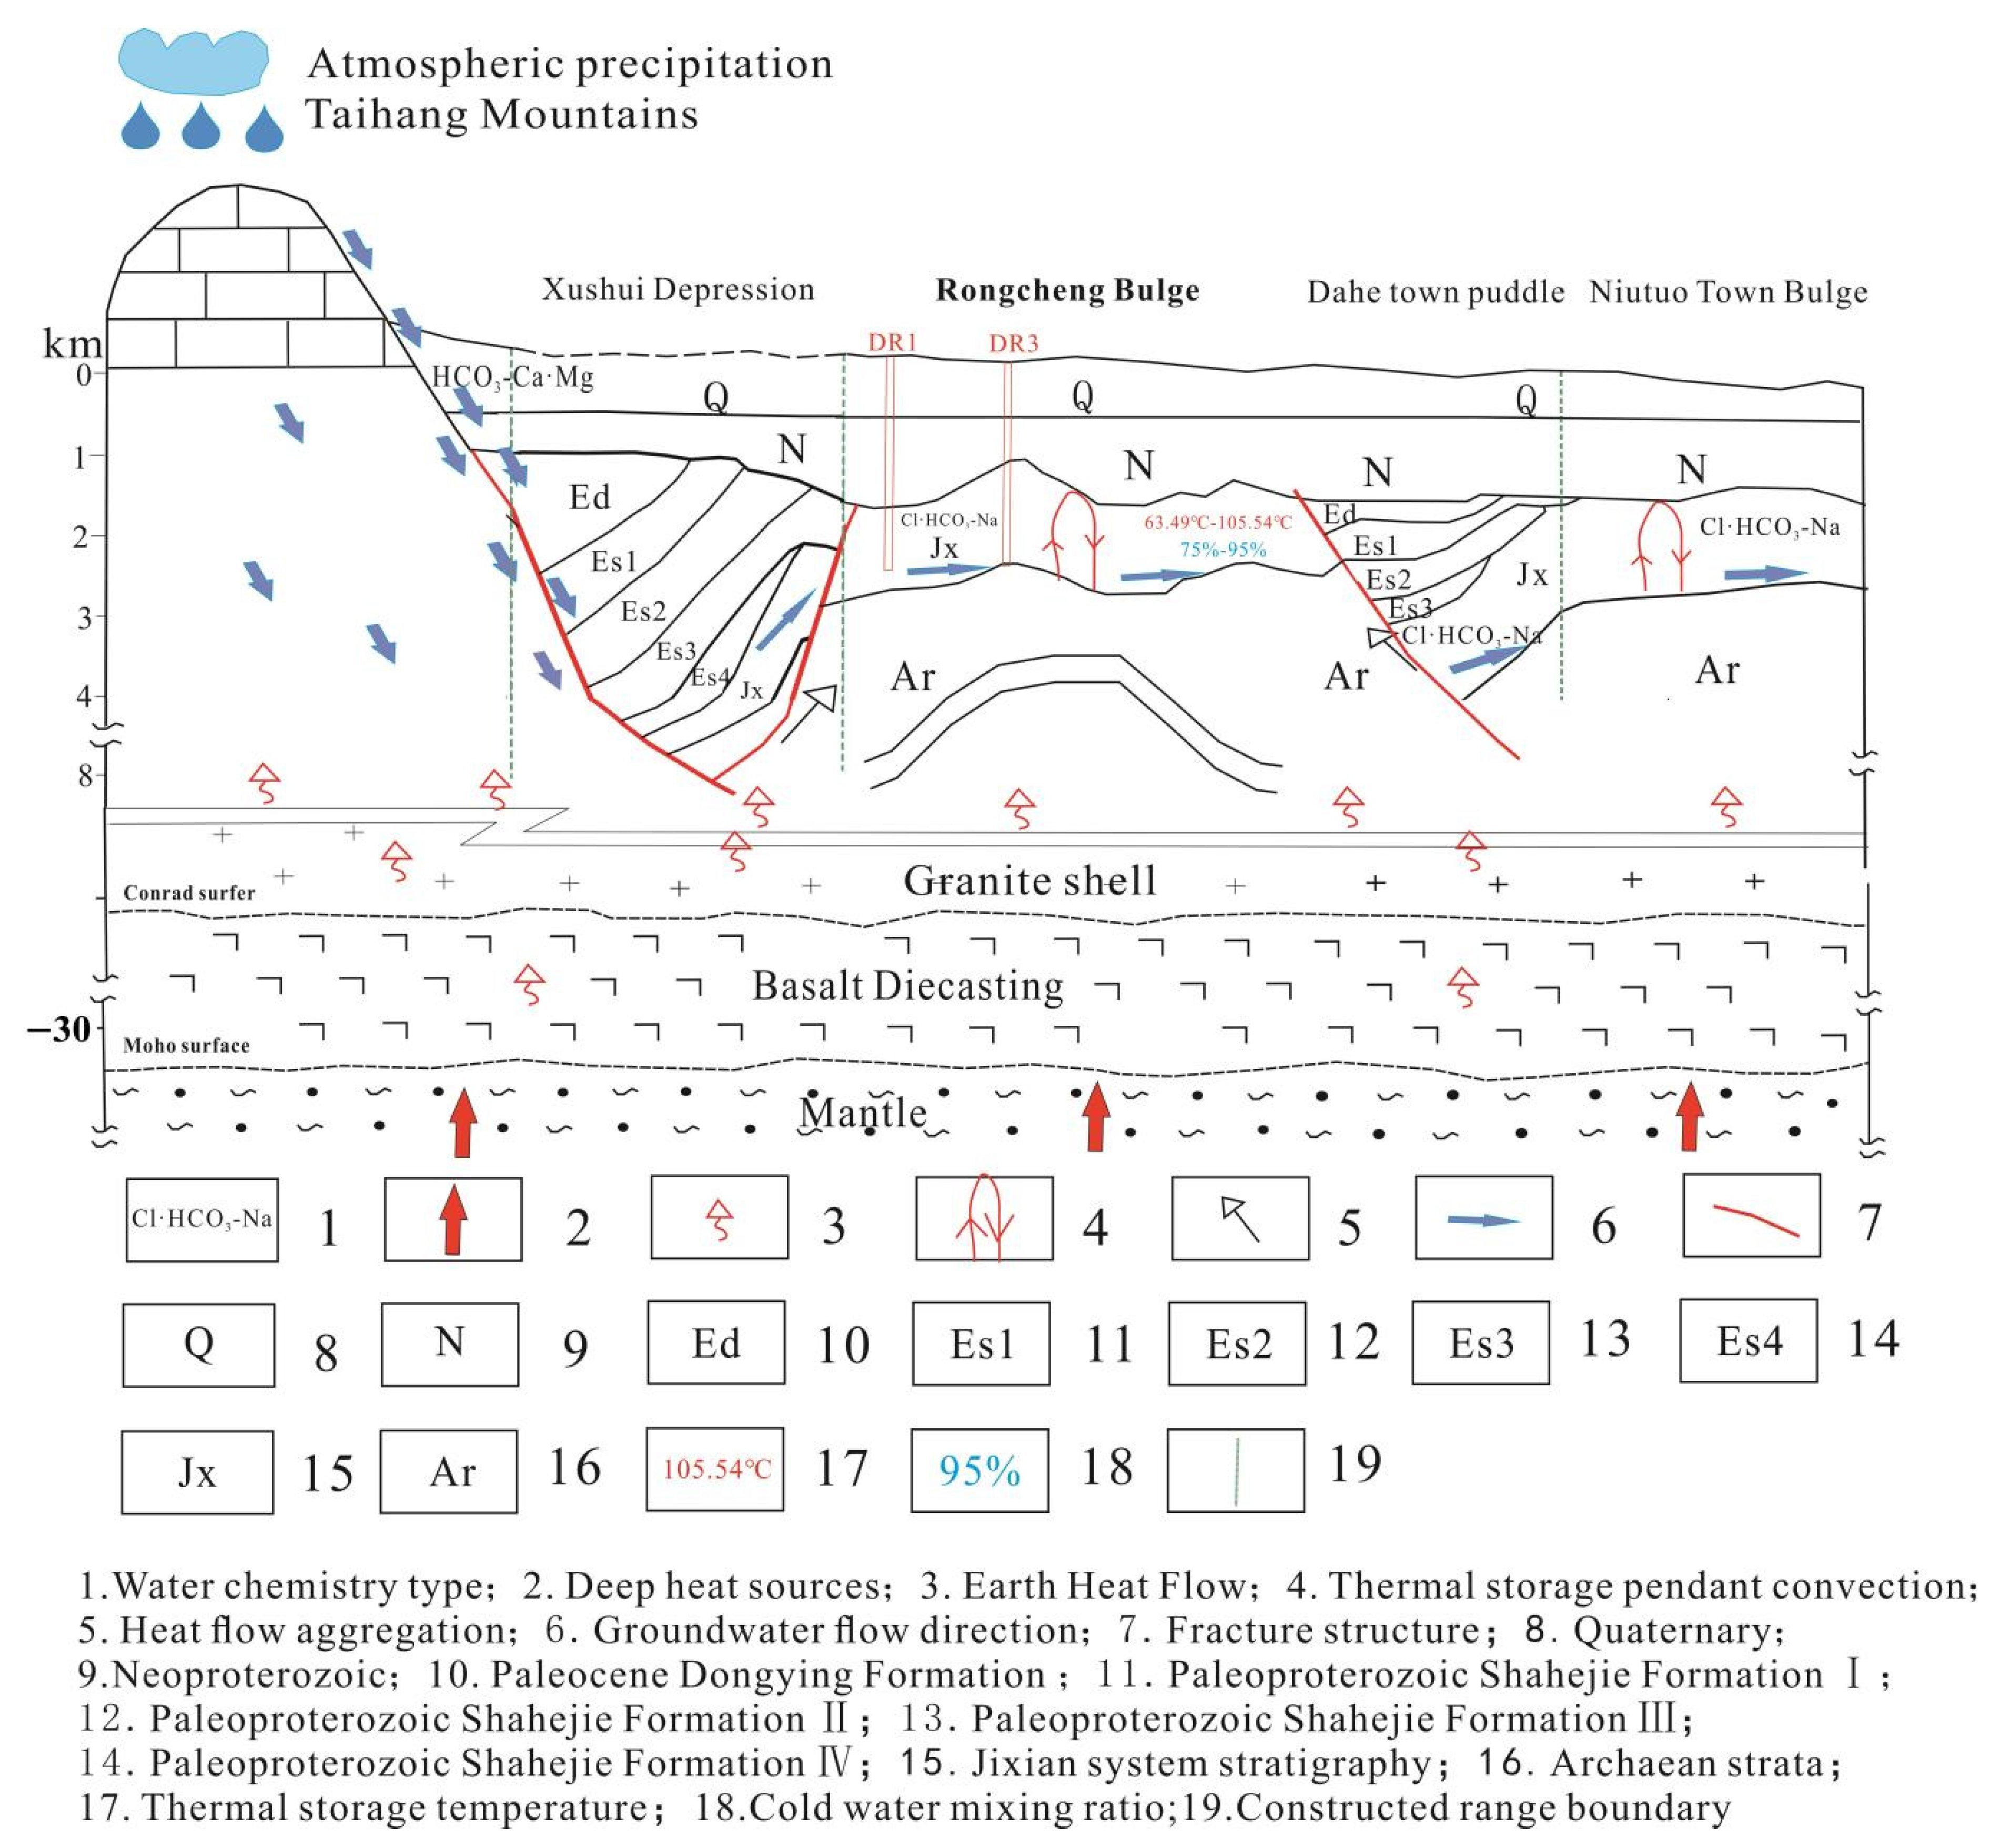
5.5. Genetic Model of Geothermal Water
6. Conclusions
Author Contributions
Funding
Institutional Review Board Statement
Informed Consent Statement
Data Availability Statement
Acknowledgments
Conflicts of Interest
References
- Fagundo-Castillo, J.R.; Carrillo-Rivera, J.J.; Antigüedad-Auzmendi, I.; González-Hernández, P.; Rodríguez-Pia, M. Chemical and geological control of spring water in Eastern Guaniguanico mountain range, Pinar del Rìo, Cuba. Environ. Geol. 2008, 55, 247–267. [Google Scholar] [CrossRef]
- Mongillo, M.A.; Axelsson, G. Preface to Geothermics Special Issue on sustainable geothermal utilization. Geothermics 2010, 39, 279–282. [Google Scholar] [CrossRef]
- Axelsson, G.; Gunnlaugsson, E.; Jonasson, T.; Olafsson, M. Low-temperature geothermal utilization in Iceland-Decades of experience. Geothermics 2010, 39, 329–338. [Google Scholar] [CrossRef]
- Zhang, H.; Meng, W.; Zhao, F. Study on the exploitation, utilization and cooperation of geothermal energy between Iceland and China. In IOP Conference Series: Earth and Environmental Science; IOP Publishing: Bristol, England, 2020; Volume 480, p. 9. [Google Scholar]
- Gude, V.G. Geothermal source potential for water desalination—Current status and future perspective. Renew. Sustain. Energy Rev. 2016, 57, 1038–1065. [Google Scholar] [CrossRef]
- Najafi, G.; Ghobadian, B. Geothermal resources in Iran: The sustainable future. Renew. Sustain. Energy Rev. 2011, 15, 3946–3951. [Google Scholar] [CrossRef]
- Zhu, J.L.; Hu, K.Y. A review of geothermal energy resources, development, and applications in China: Current Status and Prospects. Energy 2015, 93, 466–483. [Google Scholar] [CrossRef]
- Shang, X.G.; Yu, X.H.; Li, C.Y.; Chai, H.P.; Jiang, N.J. Geochemical characteristics of geothermal water in Weiyuan geothermal field, Huzhu County, Qinghai Province. J. Groundw. Sci. Eng. 2015, 3, 56–59. [Google Scholar]
- Feng, J.Y.; Zhang, Y.H.; He, Z.L.; Sun, Z.M.; Luo, J. Discussion on evaluation methodology of hydrothermal geothermal reservoir. J. Groundw. Sci. Eng. 2019, 7, 29–41. [Google Scholar]
- Wang, G.L.; Li, J.; Wu, A.M.; Zhang, W.; Hu, Q.Y. A study of the thermal storage characteristics of Gaoyuzhuang Formation, A new layer system of thermal reservoir in Rongcheng uplift area, Hebei Province. Acta Geosci. Sin. 2018, 39, 533–541. (In Chinese) [Google Scholar]
- Zhang, H.X.; Zhang, W.; Wang, G.L.; Zhao, J.Y.; Yue, G.F. Distribution and genetic mechanism of high arsenic geothermal water in the Batang area, Western Sichuan. Geothermics 2021, 97, 102232. [Google Scholar]
- Wang, G.L.; Zhang, W.; Liang, J.Y.; Lin, W.J.; Wang, W.L. Evaluation of Geothermal Resources Potential in China. Acta Geosci. Sin. 2017, 38, 449–459. (In Chinese) [Google Scholar]
- Chen, M. X Geothermics of North China; Science Press: Beijing, China, 1988. [Google Scholar]
- Chen, M.X.; Wang, J.Y. Geothermal Resources in China—Formation Characteristics and Potential Evaluation; Science Press: Beijing, China, 1994. [Google Scholar]
- Li, W.W.; Rao, S.; Tang, X.Y.; Jiang, G.Z.; Hu, S.B.; Kong, Y.L.; Pang, J.M.; Wang, J.C. The Drilling temperature measurement and geothermal field characteristics of geothermal field in Xiong County, Hebei Province. Chin. J. Geol. 2014, 49, 850–863. [Google Scholar]
- Wu, A.M.; Ma, F.; Wang, G.L.; Liu, J.X.; Hu, Q.Y.; Miao, Q.Z. A study of deep seated karst geothermal reservoir exploration and huge capacity geothermal well parameters in Xiongan New Area. Acta Geosci. Sin. 2018, 39, 523–532. (In Chinese) [Google Scholar]
- Yang, J.L.; Liu, F.T.; Jia, Z.; Yuan, H.F.; Xu, Q.M.; Hu, Y.Z. The hydrochemical and δ2H-δ18O characteristics of two geothermal fields in Niutuozhen of Hebei Province and Tianjin and their environmental significance. Acta Geosci. Sin. 2018, 39, 71–78. (In Chinese) [Google Scholar]
- Zhu, G.; Liu, S.W.; Li, L.X.; Wu, D. Characteristics of geothermal field in the lower Reaches of Yangtze River and its energy significance. Earth Sci. Front. 2020, 27, 25–34. (In Chinese) [Google Scholar]
- Zhang, H.X.; Wang, G.L.; Zhang, W.; Ma, F. Development and utilization of geothermal resources in Xiongan New Area. China High-Tech 2021, 3, 2. (In Chinese) [Google Scholar]
- Zhu, X.; Wang, G.L.; Ma, F.; Zhang, W.; Zhang, Q.L.; Zhang, H.X. Hydrogeochemical characteristics and significance of aquifer in Jixian system, Taihang Mountain-Xiong’an New Area. Earth Sci. 2020, 46, 2594–2608. (In Chinese) [Google Scholar]
- Zhao, J.Y.; Zhang, W.; Ma, F.; Zhu, X.; Zhang, H.X.; Wang, G.L. Thermal fluid chemical characteristics of Rongcheng Geothermal field in Xiongan New Area. Geotherm. Energy 2020, 94, 1991–2001. (In Chinese) [Google Scholar]
- Ellis, A.J. Quantitative interpretation of chemical characteristics of hydrothermal systems. Geothermics 1970, 2, 516–527. [Google Scholar] [CrossRef]
- Truesdell, A.H.; Nathenson, M.; Rye, R.O. The effects of subsurface boiling and dilution on the isotopic compositions of Yellowstone thermal waters. J. Geophys. Research. Part B Solid Earth 1977, 82, 3694–3704. [Google Scholar] [CrossRef]
- Guo, Q.H. Hydrogeochemistry of high-temperature geothermal systems in China: A review. Appl. Geochem. 2012, 27, 1887–1898. [Google Scholar] [CrossRef]
- Ármannsson, H. The fluid geochemistry of Icelandic high temperature geothermal areas. Appl. Geochem. 2016, 661, 4–64. [Google Scholar] [CrossRef]
- Li, C.S.; Wu, X.C.; Sun, B.; Sui, H.B.; Geng, F.Q.; Qi, H.; Ma, X.Y. Hydrochemical characteristics and formation mechanism of geothermal water in northern Ji’nan. Earth Sci. 2018, 43, 313–325. [Google Scholar]
- Ma, Z.Y.; Li, J.Q.; Zhai, M.; Wu, M.; Yong, X. Comparative study on isotopic hydrogeochemistry of sedimentary and volcanic geothermal fluids. Hydrogeol. Eng. Geol. 2019, 46, 9–18. (In Chinese) [Google Scholar]
- Wang, X.W.; Wang, T.H.; Zhang, X.; Mao, X.; Luo, L.; Wang, D.; Wu, M.H. Genetic mechanism of Xiwenzhuang Geothermal Field in Taiyuan Basin. Earth Sci. 2019, 44, 1042–1056. (In Chinese) [Google Scholar]
- Hu, S.B.; Long, Z.L.; Zhu, J.; Hu, D.; Huang, Y. Characteristics of geothermal field and tectono-thermal evolution in pearl River Mouth Basin. Acta Pet. Sin. 2019, 40, 178–187. (In Chinese) [Google Scholar]
- Su, Y.C.; Mao, X.P. Characteristics and main controlling factors of geothermal field in northern Cangxian Uplift. Geoscience 2021, 35, 403–411. (In Chinese) [Google Scholar]
- Yang, Y.D.; Liu, Y.B. Analysis of geothermal field characteristics and influencing factors in Zhoukou Sag. China Min. Mag. 2021, 30, 6. (In Chinese) [Google Scholar]
- Wang, J.Y. Low-medium temperature geothermal system of convective type. Earth Sci. Front. 1996, 3, 96–102. (In Chinese) [Google Scholar]
- Giggenbach, W.F. Geothermal solute equilibria. Derivation of Na-K-Mg-Ca. Geochim. Et Cosmochim. Acta 1988, 52, 2749–2765. [Google Scholar] [CrossRef]
- Parkhurst, D.L.; Appelo, C.A.J. A Computer Program for Speciation, Batchreaction, One-Dimensional Transport, and Inverse Geochemical Calculations; Water-Resources Investigations Report; U.S. Geological Survey: Reston, VA, USA, 1999; 312p. [Google Scholar]
- Craig, H. Isotopic variations in meteoric waters. Science 1961, 133, 170–1703. [Google Scholar] [CrossRef] [PubMed]
- Stefansson, A.; Arnorsson, S.; Sveinbjrnsdóttir, J.; Heinemaier, H. Isotope (δD, δ18O, 3H, δ13C, 14C) and chemical (b, cl) constrains on water origin, mixing, water-rock interaction and age of low-temperature geothermal wate. Appl. Geochem. 2019, 108, 104380. [Google Scholar] [CrossRef]
- Zhang, H.P.; Liu, E.K.; Wang, D.S. Stable Isotopic Composition of Atmospheric Precipitation in China and Its Influencing Factors. In Collection of Institute of Hydrogeology and Engineering Geology; Chinese Academy of Geological Sciences: Beijing, China, 1991. (In Chinese) [Google Scholar]
- Bullen, T.D.; Krabbenhoft, D.P.; Kendall, C. Kinetic and mineralogic controls on the evolution of groundwater chemistry and 87Sr/86Sr in a sandy silicate aquifer, northern Wisconsin, USA. Geochim. Et. Cosmochim. Acta 1996, 60, 1807–1821. [Google Scholar] [CrossRef]
- Wang, Y.; Zhou, X.; Yu, Y.; Liu, C.H.; Zhou, H.Y. Geothermal temperature scale is used to estimate underground heat storage temperature. Geoscience 2007, 2, 605–612. (In Chinese) [Google Scholar]
- Wu, H.M.; Sun, Z.X. Calculation of mineral fluid chemical equilibrium in geothermal system. J. East China Inst. Technol. Nat. Sci. Ed. 2000, 23, 39–42. (In Chinese) [Google Scholar]
- Zhang, B.J. Hydrogeochemical Characteristics and Formation Conditions of Underground Hot Water in Northwest Shandong Province; China University of Geosciences: Beijing, China, 2011. [Google Scholar]
- Wang, Z.T.; Zhang, C. Characteristics and formation mechanism of present geothermal field in Xiongan New Area. Chin. J. Geophys. 2019, 62, 4313–4322. (In Chinese) [Google Scholar]
- Rybach, L. Radioactive heat production in rocks and its relation to other petrophysical parameters. Pure Appl. Geophys. 1976, 114, 309–317. [Google Scholar] [CrossRef]
- Dai, M.G. Evaluation of recoverable geothermal resources and development parameters of middle Proterozoic thermal reservoirs with the top buried depth of 3500 m in Xiong’an New Area. Acta Geol. Sin. 2019, 93, 2874–2888. (In Chinese) [Google Scholar]
- Guo, S.S.; Zhu, X.Q.; Qiu, N.S.; Tang, K.N.; Cui, Y. Formation conditions and favorable area prediction of deep geothermal resources in Xiong’an New Area. Acta Geol. Sin. 2020, 94, 2026–2035. (In Chinese) [Google Scholar]
- Ma, F.; Wang, G.L.; Zhang, W.; Zhu, X.; Zhang, H.X.; Yue, G.F. Heat storage space structure and resource potential of Rongcheng Geothermal field in Xiongan New Area. Acta Geol. Sin. 2020, 94, 1981–1990. (In Chinese) [Google Scholar]
- Luo, N.; Zhang, J.; Li, J.M.; Xin, S.L. Development and utilization prospects of geothermal resources in Xiongan New Area and its surrounding buried hills. Nat. Gas Ind. 2021, 41, 12. (In Chinese) [Google Scholar]
- Wang, S.Q.; Zhang, B.J.; Li, Y.Y.; Xing, Y.F.; Yuan, W.Z.; Li, J.; Gao, J.; Zhao, T. Heat accumulation mechanism of deep buried hill in northeast Gaoyang Geothermal Field, Xiong’an New Area. Bull. Geol. Sci. Technol. 2021, 40, 10. (In Chinese) [Google Scholar]


| No. | Layer | PH | TDS | K | Na | Ca | Mg | HCO3 | Cl | SO4 | SiO2 | δ18O | δD(‰) | δ34S(‰) | 87Sr/86Sr(2s) |
|---|---|---|---|---|---|---|---|---|---|---|---|---|---|---|---|
| SS01 | Surface Water | 7.3 | 785.3 | 5.2 | 28.7 | 134.0 | 31.2 | 257.3 | 56.6 | 153.3 | 18.7 | −8.6 | −61.9 | 6.1 | - |
| SS02 | 7.7 | 331.6 | 5.0 | 11.0 | 51.5 | 13.3 | 162.3 | 23.7 | 22.1 | 17.9 | −8.6 | −61.7 | 3.4 | - | |
| SS03 | 7.8 | 467.5 | 0.9 | 3.5 | 65.2 | 34.6 | 300.6 | 8.0 | 30.8 | 7.2 | −9.0 | −66.5 | 6.5 | - | |
| SS04 | 7.7 | 458.0 | 0.7 | 9.0 | 70.6 | 25.2 | 276.5 | 11.3 | 17.0 | 12.5 | −8.4 | −61.6 | 7.6 | 0.71153 | |
| SS05 | 7.7 | 433.5 | 0.4 | 10.1 | 66.6 | 22.6 | 246.5 | 16.4 | 23.6 | 12.6 | −8.3 | −51.2 | 8.8 | 0.71158 | |
| SS06 | 7.5 | 544.1 | 1.9 | 28.8 | 57.9 | 34.3 | 360.7 | 7.3 | 23.1 | 24.3 | −10.3 | −74.1 | - | 0.71051 | |
| SS07 | 7.6 | 629.1 | 1.5 | 12.7 | 108.2 | 27.0 | 324.6 | 27.4 | 32.7 | 19.1 | −8.0 | −60.0 | 8.2 | 0.7108 | |
| QR01 | Neoproterozoic | 8.2 | 1497.0 | 3.2 | 478.9 | 8.8 | 2.3 | 459.1 | 514.7 | 2.0 | 23.2 | −9.9 | −75.7 | - | - |
| QR02 | 8.3 | 1193.0 | 2.1 | 370.9 | 5.3 | 1.5 | 447.3 | 308.7 | 18.7 | 22.9 | −9.9 | −73.9 | - | 0.70873 | |
| QR03 | 8.6 | 1061.0 | 1.9 | 323.2 | 4.8 | 1.6 | 439.3 | 208.1 | 33.7 | 20.6 | −10.0 | −75.6 | 10.5 | 0.70897 | |
| QR04 | 8.7 | 1424.0 | 1.8 | 472.5 | 12.2 | 3.1 | 349.0 | 500.9 | 30.2 | 21.5 | −9.9 | −76.3 | 9.5 | 0.7177 | |
| QR05 | 8.8 | 1014.0 | 2.0 | 317.4 | 4.8 | 1.5 | 388.3 | 205.0 | 34.5 | 19.4 | −8.7 | −74.8 | 9.5 | 0.7077 | |
| SR01 | Jixian system | 7.2 | 2918.0 | 49.0 | 816.1 | 63.8 | 31.5 | 734.5 | 1138.0 | 2.4 | 36.0 | - | - | - | 0.71251 |
| SR02 | 6.9 | 2862.0 | 50.8 | 826.3 | 51.1 | 22.2 | 651.6 | 1155.0 | 3.1 | 54.1 | - | - | - | 0.71258 | |
| SR03 | 7.0 | 2958.0 | 53.3 | 875.0 | 54.8 | 24.8 | 681.2 | 1169.0 | 3.0 | 47.9 | - | - | - | 0.71258 | |
| SR04 | 6.9 | 2832.0 | 48.2 | 804.8 | 57.5 | 28.2 | 706.6 | 1101.0 | 1.2 | 39.7 | - | - | - | 0.71257 | |
| SR05 | 7.2 | 2926.0 | 50.4 | 848.6 | 54.9 | 27.0 | 682.0 | 1164.0 | 8.7 | 50.3 | −8.6 | −74.2 | 27.0 | 0.71261 | |
| SR06 | 7.3 | 2960.0 | 52.1 | 857.7 | 58.8 | 27.4 | 694.3 | 1175.0 | 1.6 | 47.8 | −8.6 | −74.2 | 24.8 | 0.71270 | |
| SR07 | 8.0 | 1830.0 | 4.6 | 589.1 | 17.5 | 4.7 | 405.5 | 620.9 | 159.0 | 20.0 | −9.7 | −74.8 | 34.5 | 0.70833 | |
| SR08 | 7.2 | 2799.0 | 45.0 | 800.8 | 62.9 | 30.6 | 700.5 | 1079.0 | 0.0 | 38.9 | −8.7 | −74.2 | 18.0 | 0.71187 | |
| SR09 | 7.0 | 2908.0 | 52.6 | 835.0 | 53.8 | 23.9 | 662.4 | 1182.0 | 1.3 | 54.0 | −8.6 | −75.1 | 28.4 | 0.71265 |
| Quartz | Chalcedony | Calcite | Gypsum | Halite | Illite | Dolomite | |
|---|---|---|---|---|---|---|---|
| QR01 | 0.56 | 0.13 | 0.2 | −4.33 | −5.22 | 1.38 | 0.17 |
| QR02 | 0.55 | 0.12 | 0.11 | −3.52 | −5.54 | 1.34 | 0.03 |
| QR03 | 0.49 | 0.06 | 0.35 | −3.31 | −5.76 | 1.22 | 0.6 |
| QR04 | 0.5 | 0.07 | 0.7 | −3.02 | −5.23 | 0.88 | 1.17 |
| QR05 | 0.45 | 0.02 | 0.43 | −3.30 | −5.77 | 1.15 | 0.72 |
| SR01 | 0.76 | 0.33 | 0.23 | −3.58 | −4.68 | 2.31 | 0.51 |
| SR02 | 0.94 | 0.51 | −0.26 | −3.54 | −4.67 | 2.11 | −0.54 |
| SR03 | 0.89 | 0.46 | −0.11 | −3.54 | −4.64 | 2.12 | −0.22 |
| SR04 | 0.81 | 0.38 | −0.12 | −3.92 | −4.7 | 2.52 | −0.2 |
| SR05 | 0.91 | 0.48 | 0.07 | −3.07 | −4.65 | 1.87 | 0.18 |
| SR06 | 0.89 | 0.46 | 0.24 | −3.79 | −4.65 | 1.79 | 0.51 |
| SR07 | 0.5 | 0.07 | 0.2 | −2.2 | −5.06 | 1.68 | 0.17 |
| SR08 | 0.8 | 0.37 | 0.17 | −5.56 | −4.71 | 2.24 | 0.39 |
| SR09 | 0.94 | 0.51 | −0.13 | −3.89 | −4.65 | 1.99 | −0.26 |
| No | SiO2 (mg/L) | T (°C) |
|---|---|---|
| QR01 | 23.2 | 69.1 |
| QR02 | 22.9 | 68.6 |
| QR03 | 20.6 | 64.5 |
| QR04 | 21.5 | 66.2 |
| QR05 | 19.4 | 62.3 |
| SR01 | 36.0 | 87.1 |
| SR02 | 54.1 | 105.5 |
| SR03 | 47.9 | 99.8 |
| SR04 | 39.7 | 91.4 |
| SR05 | 50.3 | 102.1 |
| SR06 | 47.8 | 99.7 |
| SR07 | 20.0 | 63.5 |
| SR08 | 38.9 | 90.4 |
| SR09 | 54.0 | 105.4 |
| No. | Well | Depth | Stratigraphic | Thermal Conductivity | Average Value | Relative | Th | U | K | ρ | Radioactive Heat Generation Rate | ||||
|---|---|---|---|---|---|---|---|---|---|---|---|---|---|---|---|
| (W/mK) | Error (%) | (μg/g) | (μg/g) | (%) | (g/cm3) | (μW/m3) | |||||||||
| 1 | DR1 | 1299–1301 | Jixian System | 5.73 | 5.77 | 5.78 | 5.75 | 5.76 | 5.76 | 0.40 | 0.12 | 0.16 | 0.03 | 2.80 | 0.05 |
| 2 | DR1 | 1661–1663 | Jixian System | 4.06 | 4.08 | 4.09 | 4.09 | 4.09 | 4.08 | 0.30 | 2.55 | 0.76 | 1.09 | 2.90 | 0.51 |
| 3 | DR1 | 2403–2404 | Jixian System | 5.87 | 5.82 | 5.88 | 5.88 | 5.88 | 5.87 | 0.40 | 0.15 | 0.20 | 0.11 | 2.56 | 0.07 |
| 4 | DR2 | 1603–1608 | Cambrian System | 2.97 | 2.98 | 2.97 | 3.00 | 2.98 | 2.98 | 0.40 | 1.65 | 0.78 | 1.04 | 2.72 | 0.42 |
| 5 | DR2 | 2496–2501 | Cambrian System | 2.95 | 2.96 | 2.95 | 2.95 | 2.96 | 2.95 | 0.20 | 6.62 | 2.79 | 3.08 | 2.68 | 1.45 |
| 6 | DR2 | 2604–2608 | Jixian System | 4.82 | 4.85 | 4.88 | 4.85 | 4.91 | 4.86 | 0.70 | 0.28 | 0.32 | 0.14 | 2.81 | 0.12 |
| 7 | DR3 | 900–1400 | Jixian System | 5.74 | 5.68 | 5.72 | 5.70 | 5.71 | 5.71 | 0.40 | 0.13 | 0.12 | 0.12 | 2.73 | 0.05 |
| 8 | DR3 | 1501–1507 | Great Wall System | 2.00 | 2.02 | 2.02 | 2.01 | 2.01 | 2.01 | 0.50 | 1.53 | 0.49 | 8.49 | 2.56 | 0.98 |
| 9 | DR3 | 2168–2172 | Archaic | 2.76 | 2.78 | 2.77 | 2.77 | 2.76 | 2.77 | 0.30 | 4.85 | 0.26 | 7.58 | 2.36 | 0.98 |
| 10 | DR4 | 882–888 | Jixian System | 3.84 | 3.84 | 3.85 | 3.88 | 3.86 | 3.85 | 0.40 | 3.27 | 2.86 | 1.45 | 2.77 | 1.13 |
| 11 | DR4 | 785.7–790 | Jixian System | 6.61 | 6.67 | 6.64 | 6.63 | 6.59 | 6.63 | 0.40 | 0.37 | 0.26 | 0.09 | 2.75 | 0.10 |
| 12 | DR4 | 1212–1218 | Jixian System | 5.53 | 5.54 | 5.51 | 5.51 | 5.51 | 5.52 | 0.30 | 1.98 | 1.75 | 0.83 | 2.22 | 0.55 |
| Well | DR1 | DR1 | DR1 | DR2 | DR3 | DR4 | DR4 | DR4 |
|---|---|---|---|---|---|---|---|---|
| T/°C | Specific Heat Capacity (J/(g·K)) | |||||||
| 25 | 0.66 | 0.7 | 0.66 | 0.57 | 0.54 | 0.51 | 0.91 | 0.58 |
| 30 | 0.74 | 0.77 | 0.65 | 0.6 | 0.65 | 0.45 | 1.04 | 0.68 |
| 35 | 0.79 | 0.82 | 0.66 | 0.62 | 0.71 | 0.45 | 1.13 | 0.74 |
| 40 | 0.81 | 0.84 | 0.67 | 0.64 | 0.74 | 0.47 | 1.17 | 0.77 |
| 45 | 0.82 | 0.86 | 0.68 | 0.65 | 0.75 | 0.48 | 1.2 | 0.79 |
| 50 | 0.82 | 0.87 | 0.69 | 0.65 | 0.76 | 0.5 | 1.23 | 0.81 |
| 55 | 0.83 | 0.88 | 0.7 | 0.66 | 0.77 | 0.52 | 1.25 | 0.82 |
| 60 | 0.83 | 0.9 | 0.71 | 0.67 | 0.77 | 0.54 | 1.28 | 0.83 |
| 65 | 0.83 | 0.91 | 0.72 | 0.68 | 0.78 | 0.55 | 1.31 | 0.84 |
| 70 | 0.84 | 0.91 | 0.73 | 0.68 | 0.78 | 0.57 | 1.35 | 0.85 |
| 75 | 0.84 | 0.92 | 0.74 | 0.69 | 0.79 | 0.59 | 1.39 | 0.86 |
| 80 | 0.84 | 0.93 | 0.75 | 0.69 | 0.79 | 0.6 | 1.44 | 0.87 |
| 85 | 0.85 | 0.93 | 0.76 | 0.7 | 0.8 | 0.62 | 1.49 | 0.87 |
| 90 | 0.85 | 0.93 | 0.77 | 0.7 | 0.8 | 0.64 | 1.54 | 0.88 |
| 95 | 0.85 | 0.94 | 0.79 | 0.71 | 0.81 | 0.65 | 1.6 | 0.88 |
| 100 | 0.86 | 0.94 | 0.8 | 0.72 | 0.81 | 0.67 | 1.66 | 0.89 |
| 105 | 0.86 | 0.94 | 0.81 | 0.72 | 0.82 | 0.69 | 1.72 | 0.9 |
| 110 | 0.86 | 0.95 | 0.82 | 0.73 | 0.82 | 0.71 | 1.78 | 0.9 |
| 115 | 0.87 | 0.95 | 0.83 | 0.73 | 0.83 | 0.73 | 1.83 | 0.91 |
| 120 | 0.87 | 0.96 | 0.84 | 0.74 | 0.83 | 0.75 | 1.87 | 0.92 |
| 125 | 0.87 | 0.96 | 0.85 | 0.74 | 0.83 | 0.76 | 1.89 | 0.92 |
| 130 | 0.87 | 0.96 | 0.86 | 0.75 | 0.84 | 0.78 | 1.89 | 0.93 |
| 135 | 0.87 | 0.97 | 0.87 | 0.75 | 0.84 | 0.8 | 1.88 | 0.94 |
| 140 | 0.88 | 0.97 | 0.88 | 0.76 | 0.85 | 0.82 | 1.85 | 0.94 |
| 145 | 0.88 | 0.98 | 0.89 | 0.77 | 0.85 | 0.83 | 1.81 | 0.95 |
| 150 | 0.88 | 0.98 | 0.9 | 0.77 | 0.85 | 0.85 | 1.77 | 0.95 |
| 155 | 0.88 | 0.99 | 0.91 | 0.78 | 0.86 | 0.87 | 1.72 | 0.96 |
| 160 | 0.88 | 0.99 | 0.91 | 0.78 | 0.86 | 0.89 | 1.66 | 0.96 |
| 165 | 0.88 | 1 | 0.92 | 0.79 | 0.86 | 0.91 | 1.6 | 0.97 |
| 170 | 0.89 | 1 | 0.93 | 0.79 | 0.87 | 0.93 | 1.55 | 0.98 |
| 175 | 0.89 | 1.01 | 0.94 | 0.8 | 0.87 | 0.95 | 1.52 | 0.98 |
| 180 | 0.89 | 1.01 | 0.95 | 0.8 | 0.87 | 0.96 | 1.49 | 0.99 |
| 185 | 0.89 | 1.01 | 0.96 | 0.81 | 0.88 | 0.98 | 1.47 | 0.99 |
| 190 | 0.89 | 1.02 | 0.97 | 0.81 | 0.88 | 1 | 1.46 | 1 |
| No | T (°C) | H (m) |
|---|---|---|
| QR01 | 69.1 | 1658.9 |
| QR02 | 68.6 | 1646.7 |
| QR03 | 64.5 | 1528.9 |
| QR04 | 66.2 | 1576.6 |
| QR05 | 62.3 | 1465.2 |
| SR01 | 87.1 | 2175.1 |
| SR02 | 105.5 | 2701.5 |
| SR03 | 99.8 | 2537.4 |
| SR04 | 91.4 | 2296.5 |
| SR05 | 102.1 | 2601.6 |
| SR06 | 99.7 | 2534.2 |
| SR07 | 63.5 | 1499.9 |
| SR08 | 90.4 | 2270.0 |
| SR09 | 105.4 | 2698.6 |
| T (°C) | Enthalpy (J/g) | SiO2 (mg/L) |
|---|---|---|
| 50 | 50 | 14 |
| 75 | 75 | 27 |
| 100 | 100 | 48 |
| 125 | 125 | 80 |
| 150 | 151 | 125 |
| 175 | 177 | 185 |
| 200 | 204 | 265 |
| 225 | 231 | 365 |
| 250 | 259 | 486 |
| 275 | 289 | 614 |
| 300 | 321 | 692 |
Publisher’s Note: MDPI stays neutral with regard to jurisdictional claims in published maps and institutional affiliations. |
© 2022 by the authors. Licensee MDPI, Basel, Switzerland. This article is an open access article distributed under the terms and conditions of the Creative Commons Attribution (CC BY) license (https://creativecommons.org/licenses/by/4.0/).
Share and Cite
Zhang, H.; Wang, G.; Zhang, W.; Ma, F.; Zhu, X.; Yue, G.; Yu, M. Characteristics of the Rongcheng Bulge Geothermal Field and the Evolution of Geothermal Fluids, Xiong’an New Area, China. Water 2022, 14, 2468. https://doi.org/10.3390/w14162468
Zhang H, Wang G, Zhang W, Ma F, Zhu X, Yue G, Yu M. Characteristics of the Rongcheng Bulge Geothermal Field and the Evolution of Geothermal Fluids, Xiong’an New Area, China. Water. 2022; 14(16):2468. https://doi.org/10.3390/w14162468
Chicago/Turabian StyleZhang, Hanxiong, Guiling Wang, Wei Zhang, Feng Ma, Xi Zhu, Gaofan Yue, and Mingxiao Yu. 2022. "Characteristics of the Rongcheng Bulge Geothermal Field and the Evolution of Geothermal Fluids, Xiong’an New Area, China" Water 14, no. 16: 2468. https://doi.org/10.3390/w14162468