
Potential Effects of Urbanization on Precipitation Extremes in the Pearl River Delta Region, China


1
State Key Laboratory of Hydrology-Water Resources and Hydraulic Engineering, Nanjing Hydraulic Research Institute, Nanjing 210029, China
2
School of Resources and Geosciences, China University of Mining and Technology, Xuzhou 221116, China
3
Xiamen Water Group Co., Ltd., Xiamen 361008, China
*
Author to whom correspondence should be addressed.
Water 2022, 14(16), 2466; https://doi.org/10.3390/w14162466
Submission received: 9 July 2022
/
Revised: 5 August 2022
/
Accepted: 6 August 2022
/
Published: 9 August 2022
(This article belongs to the Special Issue Characterizing, Monitoring and Prediction of Hydrometeorological Extremes under Climate Change)
Abstract
:Rapid urbanization plays an indelible role in modifying local climate, with more extreme precipitation in urban areas. Understanding the mechanism of urban-induced precipitation changes and quantifying the potential effects of urbanization on the changes in precipitation extremes have become hotspot issues in hydrometeorology. We examine the spatiotemporal changes of precipitation extremes over the Pearl River Delta region in China using the homogenized daily precipitation dataset from the period 1961–2017, and quantify the urbanization effects on these changes. Most of the extreme precipitation indices show increasing trends, but only the mean precipitation intensity has a significant increase. Urbanization could induce the intensification of extreme precipitation, with a higher amount, intensity, and frequency of precipitation extremes and a larger magnitude of their trends in urban areas by comparison with those rural areas. Moreover, high-level urbanization tends to make a greater contribution to the temporal changes in precipitation extremes, indicating that urbanization effects on precipitation extremes may be related to urbanization levels. However, urbanization level shows little effect on the changes in the spatial patterns of precipitation extremes, with similar spatial distribution in different urbanization stages. Our findings highlight the important role of urbanization in precipitation extremes and offer insights into the feedback of anthropogenic changes into variations in precipitation extremes.
1. Introduction
Today, humanity is experiencing a dramatic shift toward urban living [1], with more than half of the worldwide population residing in urban areas [2]. About 55% of the population were living in metropolitan areas by 2018, and this figure is projected to rise to 56.2% in developing countries and 81.5% in developed countries by 2030 [3]. China has experienced a rapid and profound urbanization process since the 1980s. Now, approximately 63.8% of the population in China lives in urban areas, and the proportion will exceed 70% by 2030. As a result of urban expansion, many metropolitan regions in China have developed in recent decades, e.g., Beijing–Tianjin–Hebei (BTH), Yangtze River Delta (YRD), and the Pearl River Delta (PRD), with an extraordinary increase in population, built-up areas and gross domestic product (GDP). Unfortunately, however, because of these changes, urban areas are facing increasing threats of various disasters (e.g., floods, heat waves) under global warming and local anthropogenic influences, which have been causing growing concern in recent decades.
Urbanization usually causes changes in surface topography, thermal conductivity, hydraulic permeability, and other properties in urban areas [4]. These changes inevitably lead to profound influences on the environment, biodiversity, biogeochemical cycles, and energy flow [5,6,7]. Therefore, land surface modification should be considered in the assessment of regional climate change due to urban expansion, particularly in regions experiencing rapid urbanization [8,9]. Previous studies have reported that urbanization can alter the local/regional climate and even large-scale atmospheric circulation [10,11,12,13]. Generally, urbanization-induced land-use change influences local hydrometeorology by modifying the surface and boundary layer atmospheric properties [14,15,16,17] and then changing the urban micro-climate [18]. Moreover, urbanization also increases pollutant emissions and aerosol loading in the atmosphere, significantly affecting the climate and water cycle [19]. A well-known consequence of urbanization is the urban heat-island (UHI) effect, rendering the urban area consistently warmer than its surroundings [6,20]. However, aside from temperature changes, there has been a long debate about whether urbanization can affect precipitation, because no consistent conclusions have been drawn from different regions [21] with spatiotemporal variations in climatology, topography, urbanization levels, and aerosol emissions. Thus, knowledge about the urban rainfall effect is still evolving due to the involvement of many dynamic, thermodynamic and microphysical processes and the spatiotemporal discontinuity of precipitation. Therefore, there is a need for better understanding of the precipitation modifications caused by urbanization [22] that may provide reliable and authoritative information for designing future climate-resilient cities.
Rapid urbanization may lead to an increased frequency of disasters, such as extreme precipitation events in urbanized areas. Many studies have paid greater attention to urban-induced extreme climate events or urbanization–climate-extreme relationships [23,24,25,26,27,28,29,30]. For example, Mishra et al. [24] indicated that global urban areas experienced significant increases in heatwaves and extremely hot days. Zhang et al. [27] highlighted statistically significant urbanization effects on most worldwide land annual extreme temperature indices. Singh et al. [30] found pronounced urbanization-induced changes in precipitation extremes over the contiguous United States. Compared with whether urbanization influences local climate, another question related to urbanization’s contribution to those changes is much more complicated. Although previous studies have focused on the contributions of urbanization to temperature and its extreme changes [26,27,31,32,33,34], relatively limited attention has been paid to the contributions of urbanization to precipitation totals and extremes [22,28,29,30]. Hence, there is a need to further understand whether and how urbanization can alter and contribute to precipitation changes on various scales or from different perspectives, especially for precipitation extremes.
The PRD, one of the most densely urbanized areas, is severely threatened by the pressure of climate change and human activities. It is the low-lying area surrounding the Pearl River estuary and one of the disaster-prone regions in China, where about 12 million residents are likely to be influenced by frequent rainstorms, typhoons, and floods [29]. Based on observed reanalysis data and model experiments, many previous studies found stronger and more frequent extreme precipitation caused by rapid urbanization over the PRD in recent years. For instance, Chen et al. [35] and Wang et al. [36] highlighted that stronger afternoon precipitation can be observed in urban areas compared to that in the surrounding rural areas. The metropolitan areas in the PRD also tend to see faster-increasing trends of extreme precipitation frequency and intensity [37], which are highly sensitive to the urban surface heat flux or anthropogenic heat [38,39,40]. However, a deeper understanding of urban-induced precipitation extremes is required, and the relative contribution of urbanization to the changes in precipitation extremes needs to be ascertained.
Here, we present an actual case study to investigate the urbanization-induced changes in precipitation extremes in the PRD metropolitan area using high-density meteorological observations, focusing on its large-scale urbanization during the past four decades. The aims of the study are to (1) investigate the long-term changes in precipitation extremes, (2) identify the possible effects of urbanization on the changes in precipitation extremes, and (3) examine the contribution of urbanization to these changes. The remainder of the paper is structured as follows. Section 2 describes meteorological observations and methods used in this study. Section 3 details the long-term changes in selected indices of extreme precipitation. It also explores the role of urbanization in these changes and the extent to which urbanization affects these changes in extreme precipitation. A few concluding remarks are made in Section 4.
2. Materials and Methods
2.1. Study Area
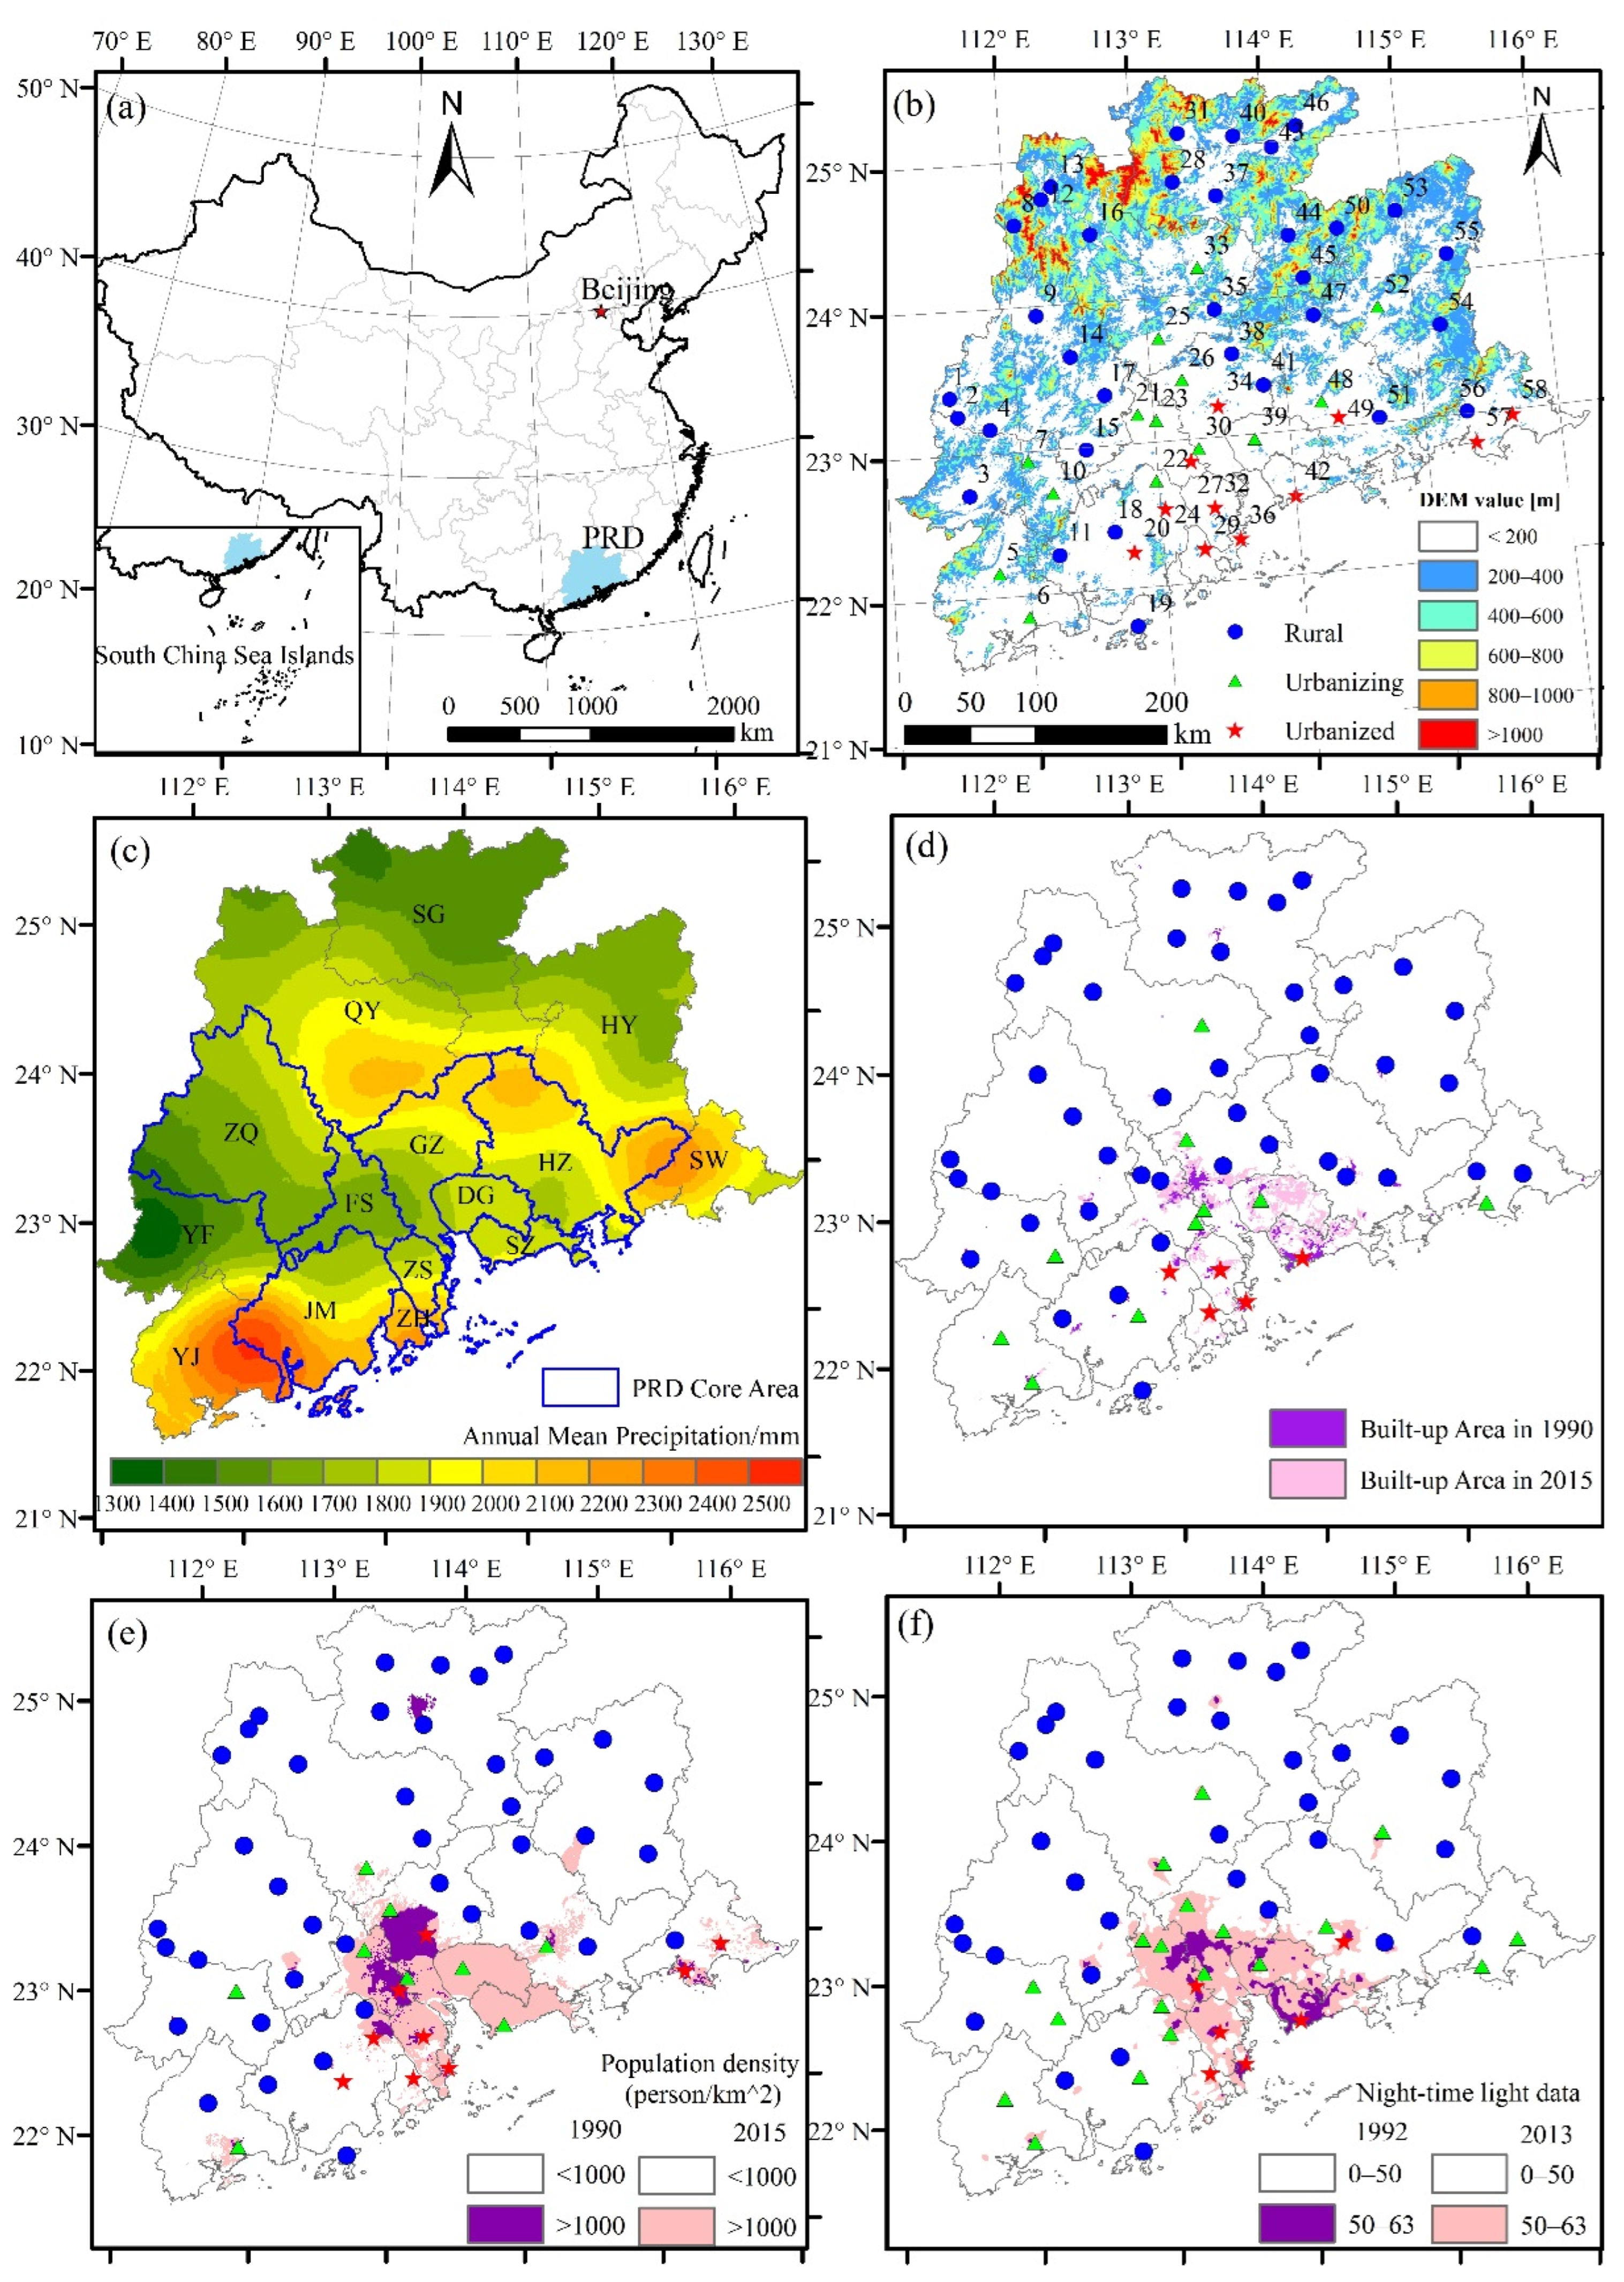
The PRD metropolitan region (21°28′ N–25°31′ N, 111°03′ E–116°13′ E), as shown in Figure 1, is located in tropical and subtropical climate zones and belongs to the monsoonal climate, with annual mean precipitation of about 1600 mm (ranging from 1350 to 2515 mm) and annual mean temperature ranging from 21.4 °C to 22.4 °C. The wet season lasts from April to September, accounting for 73% of the annual total precipitation [41]. It covers nine core cities (Guangzhou [GZ], Shenzhen [SZ], Foshan [FS], Dongguan [DG], Zhuhai [ZH], Zhongshan [ZS], Huizhou [HZ], Jiangmen [JM] and Zhaoqing [ZQ]) and surrounding six cities (Shaoguan [SG], Yangjiang [YJ], Shanwei [SW], Heyuan [HY], Qingyuan [QY], and Yunfu [YF]), with a total area of about 1.3 × 10⁵ km2 [42]. The PRD has undergone rapid urban expansion in the past four decades, and now the urban area accounts for approximately 72.7% of the total area, which has become one of the largest metropolitan regions in China, in both size and population [4,43].
2.2. Data Pre-Processing and Extreme Precipitation Indices
We collected the daily precipitation records of 58 gauges (Figure 1) across the PRD from the China Meteorological Administration (CMA). The dataset was subjected to strict quality control procedures. Preliminary quality assurance of these data, including examination and correction of the erroneous values, was regularly performed in real time and post-processing. These data have been widely used for climate studies in China [23,32,34,44,45,46]. These stations were established in the 1950s (45 stations) and 1960s (13 stations). After evaluating discontinuities and gaps, we only analyzed the dataset from 1961 to 2017 in this study, due to significant missing records from before the 1960s.
Here, we examine a set of 12 extreme precipitation indices adopted from the Expert Team on Climate Change Detection and Indices (ETCCDI) (see Table 1). These indices can reflect the changes in intensity, frequency, and duration of precipitation events, and are widely used in analyzing extreme precipitation on regional and global scales [3,8,23,28,30,47,48]. All indices are computed with the R package “RClimDex” (http://etccdi.pacificclimate.org/software.shtml, accessed on 1 March 2022) based on the reference period 1961–1990.
2.3. Classification of Urban and Rural Stations
Following previous work [22], a similar method was used to define urban and rural stations using different datasets. As urbanization is a complex dynamic process based on the growth of the urban population and expansion of the built-up area, the urban and rural stations are classified by the time-varying land use, population and night-time light data. Thus, in this work, the population and land use data for 1990 and 2015 with a spatial resolution of 1 × 1 km from the Resource and Environment Science and Data Center, Chinese Academy of Sciences, and the night-time light data for 1992 and 2013 from the Defense Meteorological Satellite Program’s Operational LineScan System (DMSP/OLS), were used to identify the urban and rural stations. The land use data were classified into seven types: croplands, forest, grasslands, water bodies, countryside, built-up lands, and others. If the proportion of the built-up area (extracted from land use data) was greater than 33% within the 2 km buffer zone surrounding the station [49], it was set as an urban station. Moreover, we identified an urban station based on a fixed threshold from the population and night-time light data, with a population density larger than 1000 person/km2 [21] or with a night-time light value higher than 50 [50]. Overall, if one or more of the above criteria were met, a station was identified as an urban station. We classified these stations into three categories: (a) an urbanized station with its location in the urban areas for both stages (i.e., 1990 (or 1992) and 2015 (or 2013)); (b) an urbanizing station with its location in the urban areas in the second stage only (i.e., 2013 or 2015); and (c) a rural station with its location in the rural areas for both stages. Finally, Figure 1b shows the comprehensive classification of urban and rural stations used in this study (11 for urbanized, 14 for urbanizing, and 33 for rural), and Figure 1d–f shows the classified results based on the above three datasets. Additionally, we classified the low-level and high-level urbanization stages from the spatiotemporal scales to better understand the possible effects of urbanization levels on precipitation extremes. From the spatial view, we assumed that the urbanized areas were classified as higher urbanization level, while the urbanizing areas were classified as a low-level urbanization stage. Similarly, the second-half period (1991–2017) was defined as a high-level urbanization stage, and the first half (1961–1990) was a low-level urbanization period from the temporal perspective.
2.4. Quantitation Analysis of Urbanization Effects and Contributions
Nowadays, statistical methods based on control experiments are widely used to examine the urbanization effects. Among these methods, a reference station needs to be set up for the area without an urban landscape in the same location. However, it is impossible to set twin stations with identical settings for the observational network. In practice, a neighboring non-urban station is set as a reference station. Here, we assume that: (1) extreme precipitation indices at rural stations are only influenced by climate variations and changes; (2) but these indices in urban areas are affected by both urbanization and climate conditions. Thus, the urban–rural differences (DPE) in precipitation extremes can be used to indicate the potential urbanization effects, derived as follows:
where PEurban and PErural denote the time series of extreme precipitation indices in urban and rural stations, respectively. In this work, we were able to obtain three groups of urban–rural differences, i.e., urbanized vs. rural, urbanizing vs. rural, and urbanized vs. urbanizing, to exhaustively examine the possible role of urbanization in the changes in precipitation extremes.
As the actual condition, the time series could be classified as two sub-periods, pre-1990 (1961–1990), and post-1990 (1991–2017), which represented the different urbanization stages or levels. The DPE indicator also showed the discrepancies in urban–rural differences in different sub-periods. The urbanization effect (UE) and the urbanization contribution (UC) can be calculated by
where and are the mean values of urban–rural difference series in the pre-1990 and post-1990 periods, respectively, while denotes the mean of urban–rural difference series during the full period (i.e., 1961–2017). If UE < 0, the urbanization effect is negative, or vice versa. If UC > 100%, the urban–rural differences may also be affected by other factors [22], which were not considered and detected in this study.
To better understand the role of urbanization in the changes in precipitation extremes, we also defined another indicator (ΔR) to quantify the urbanization effects, which is defined as
where Rurban and Rrural mean the change rates of precipitation extreme between pre-1990 and post-1990 for urban and rural areas, respectively, derived as follows:
where and denote the mean values of precipitation extremes during the pre-1990 and post-1990 periods, respectively.
Then the urbanization contribution can be derived by:
2.5. Trend Detection of Precipitation Extremes
In this work, three common methods, involving the linear regression method, the nonparametric Mann–Kendall test, and the Theil–Sen slope method, were projected to analyze the trends of extreme precipitation indices over the PRD. These methods are widely used to examine monotonic trends in hydrometeorological time series, and their details can be found in previous studies [2,8,14,22,42,51,52,53]. Statistically, the significance level of trend detection for precipitation extremes was set as 0.05 for all the methods.
3. Results and Discussion
3.1. Long-Term Changes in Extreme Precipitation
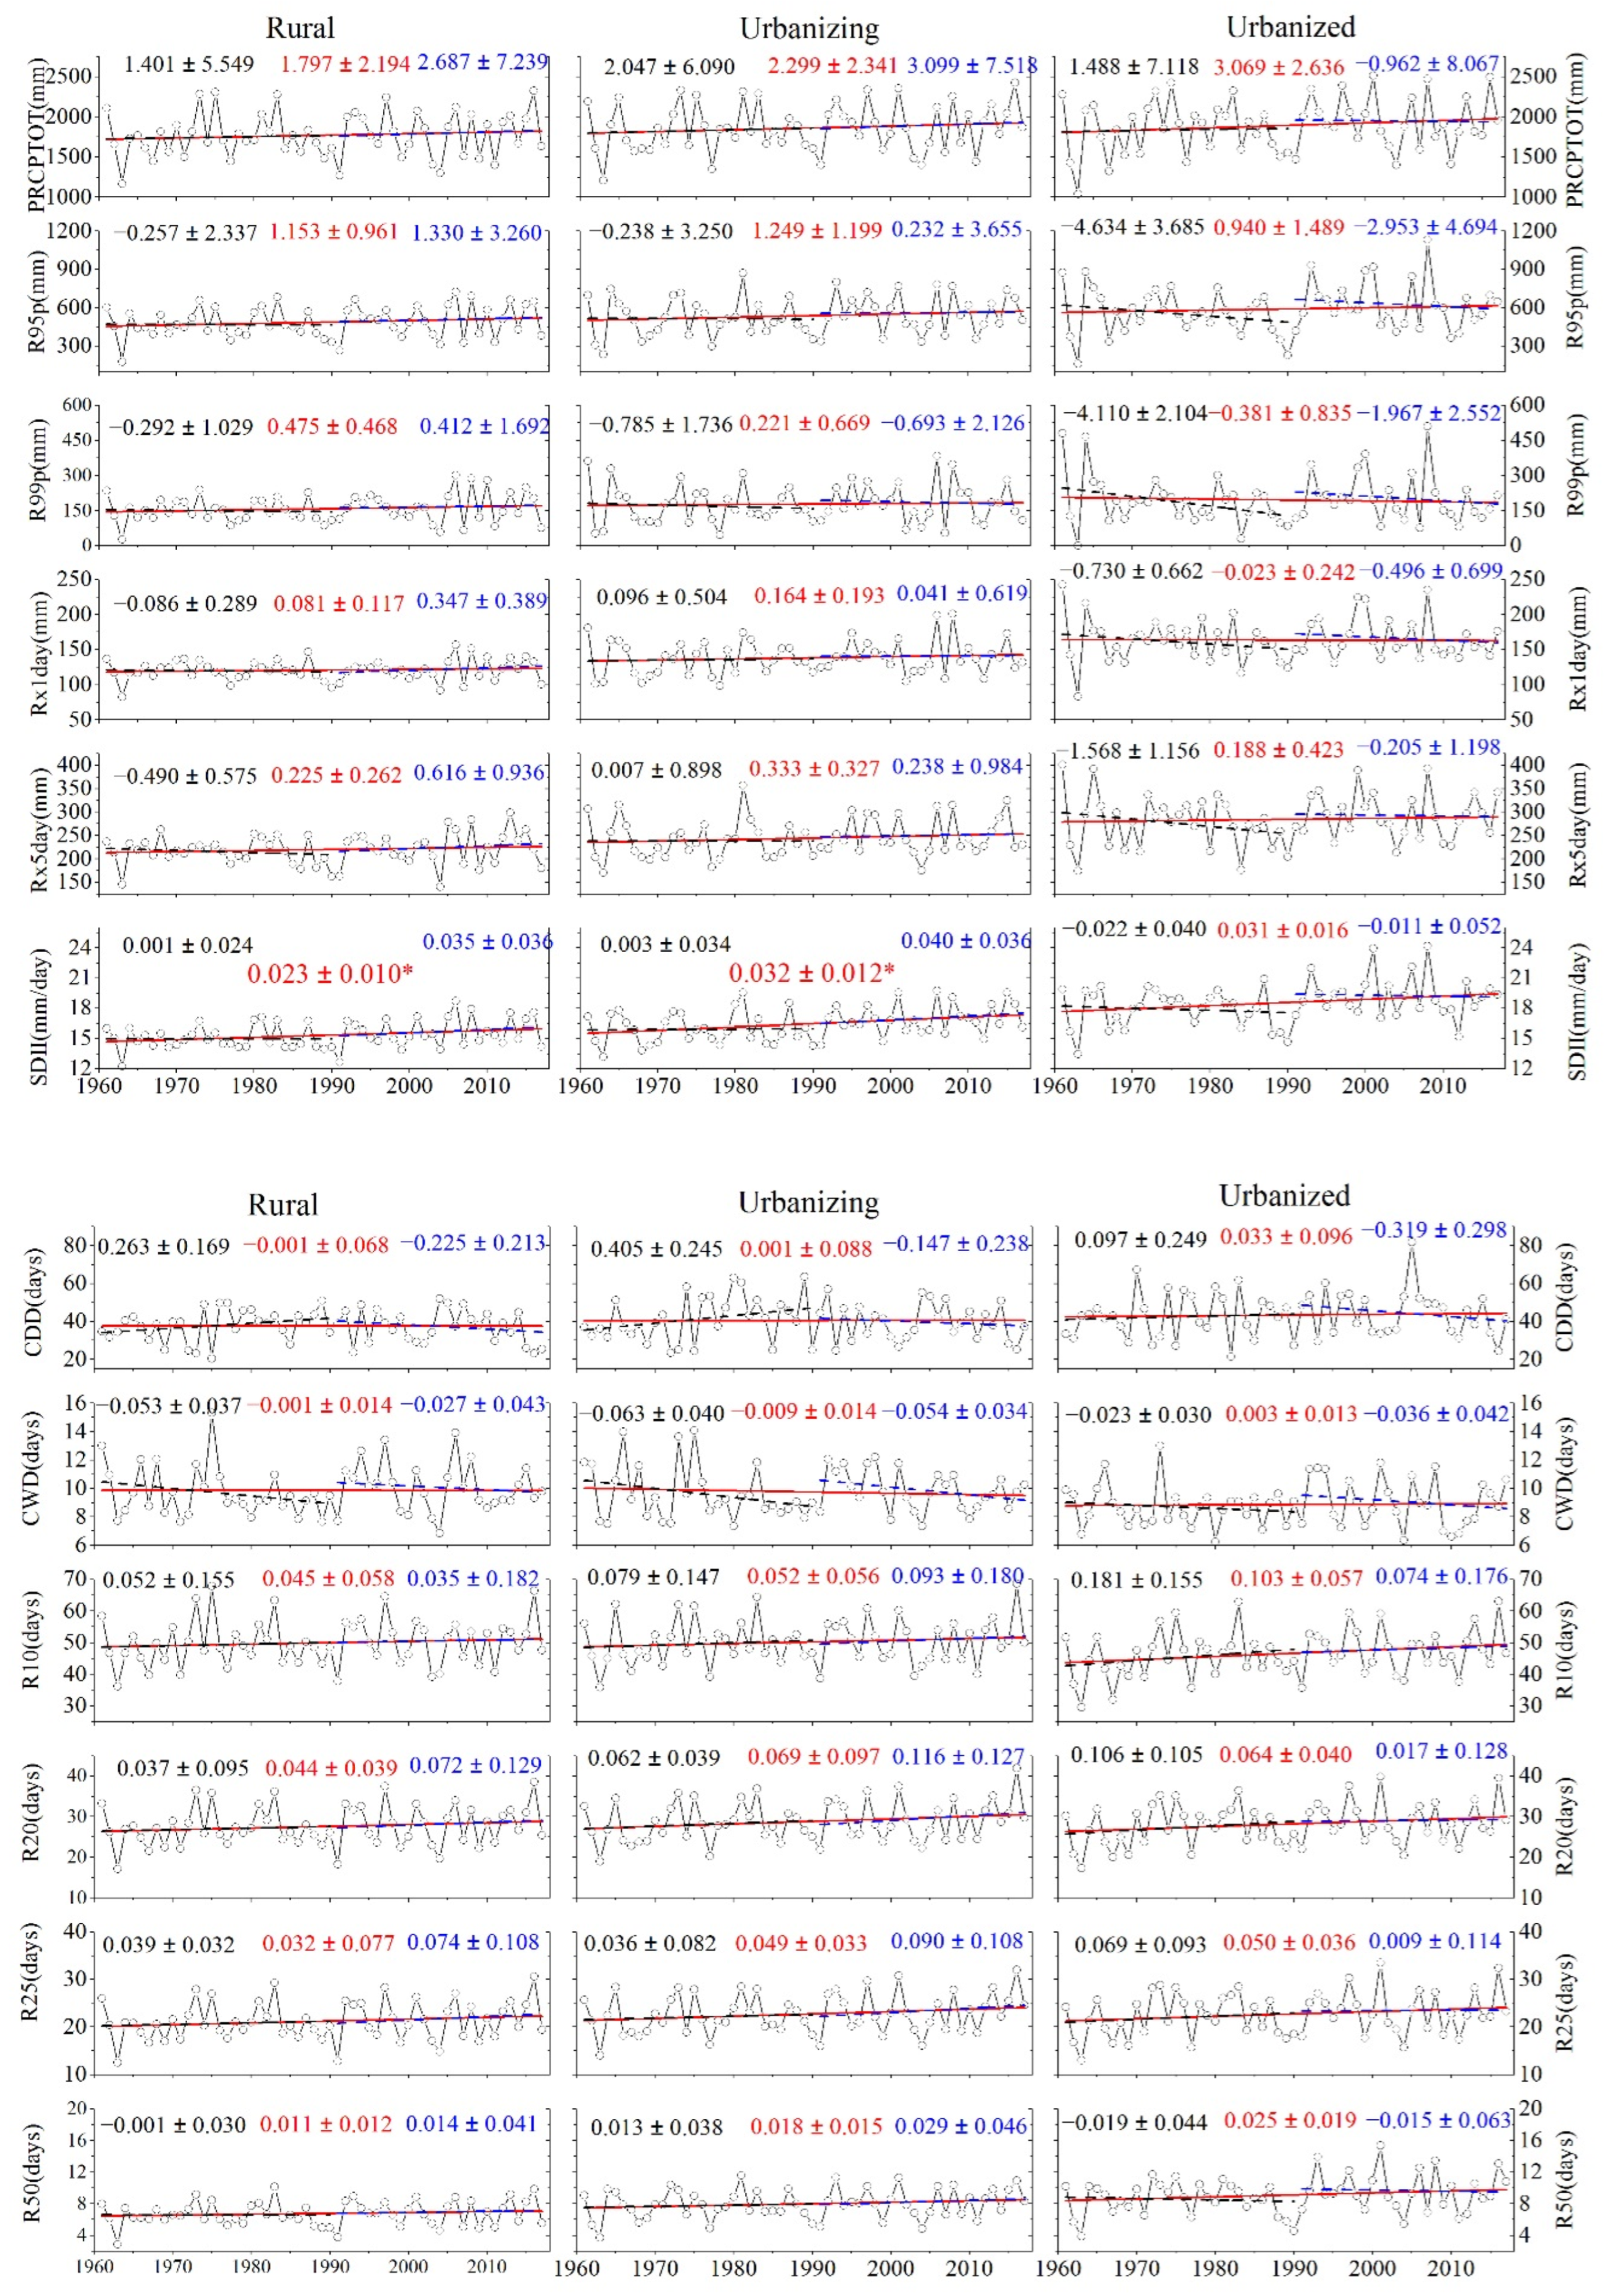
Firstly, we estimated the regional averages (e.g., rural, urbanizing, and urbanized areas) of precipitation extremes using the arithmetic mean method from all selected stations in this study. Figure 2 shows the long-term trends of the annual regional series of extreme precipitation indices during 1961–2017, detected using the linear regression method. A predominantly increasing trend can be found for all the indices over the PRD metropolitan areas. Only trifling decreases were found for the CDD (−0.01 days per decade) in rural areas, the CWD (−0.14 days per decade) in urbanizing areas, and the R99p (−3.8 mm per decade) and Rx1day (−0.2 mm per decade) in urbanized areas. However, all the changes, excluding the SDII, were insignificant at the 0.05 level, agreeing with previous studies for this region [34,36,38]. Overall, the linear trends of extreme precipitation were similar for rural and urban areas, with differences in their magnitudes and more considerable values in urban areas. For example, the annual total rainfall (i.e., PRCPTOT) experienced a slight increase, with 18.0, 23.0, and 30.7 mm per decade for rural, urbanizing, and urbanized areas, respectively; the SDII ranged from 12.2 (13.2 and 13.4) to 18.7 (19.7 and 24.2) mm/d with an increasing rate of 0.02 (0.03 and 0.03) mm/d per decade for rural (urbanizing and urbanized) areas. This indicates that urban areas showed a more rapid increase in most of the indices of precipitation extremes than rural ones during the last half-century. However, the R99p was a typical exception, with the highest increase in rural areas by comparison with urbanizing and urbanized areas.
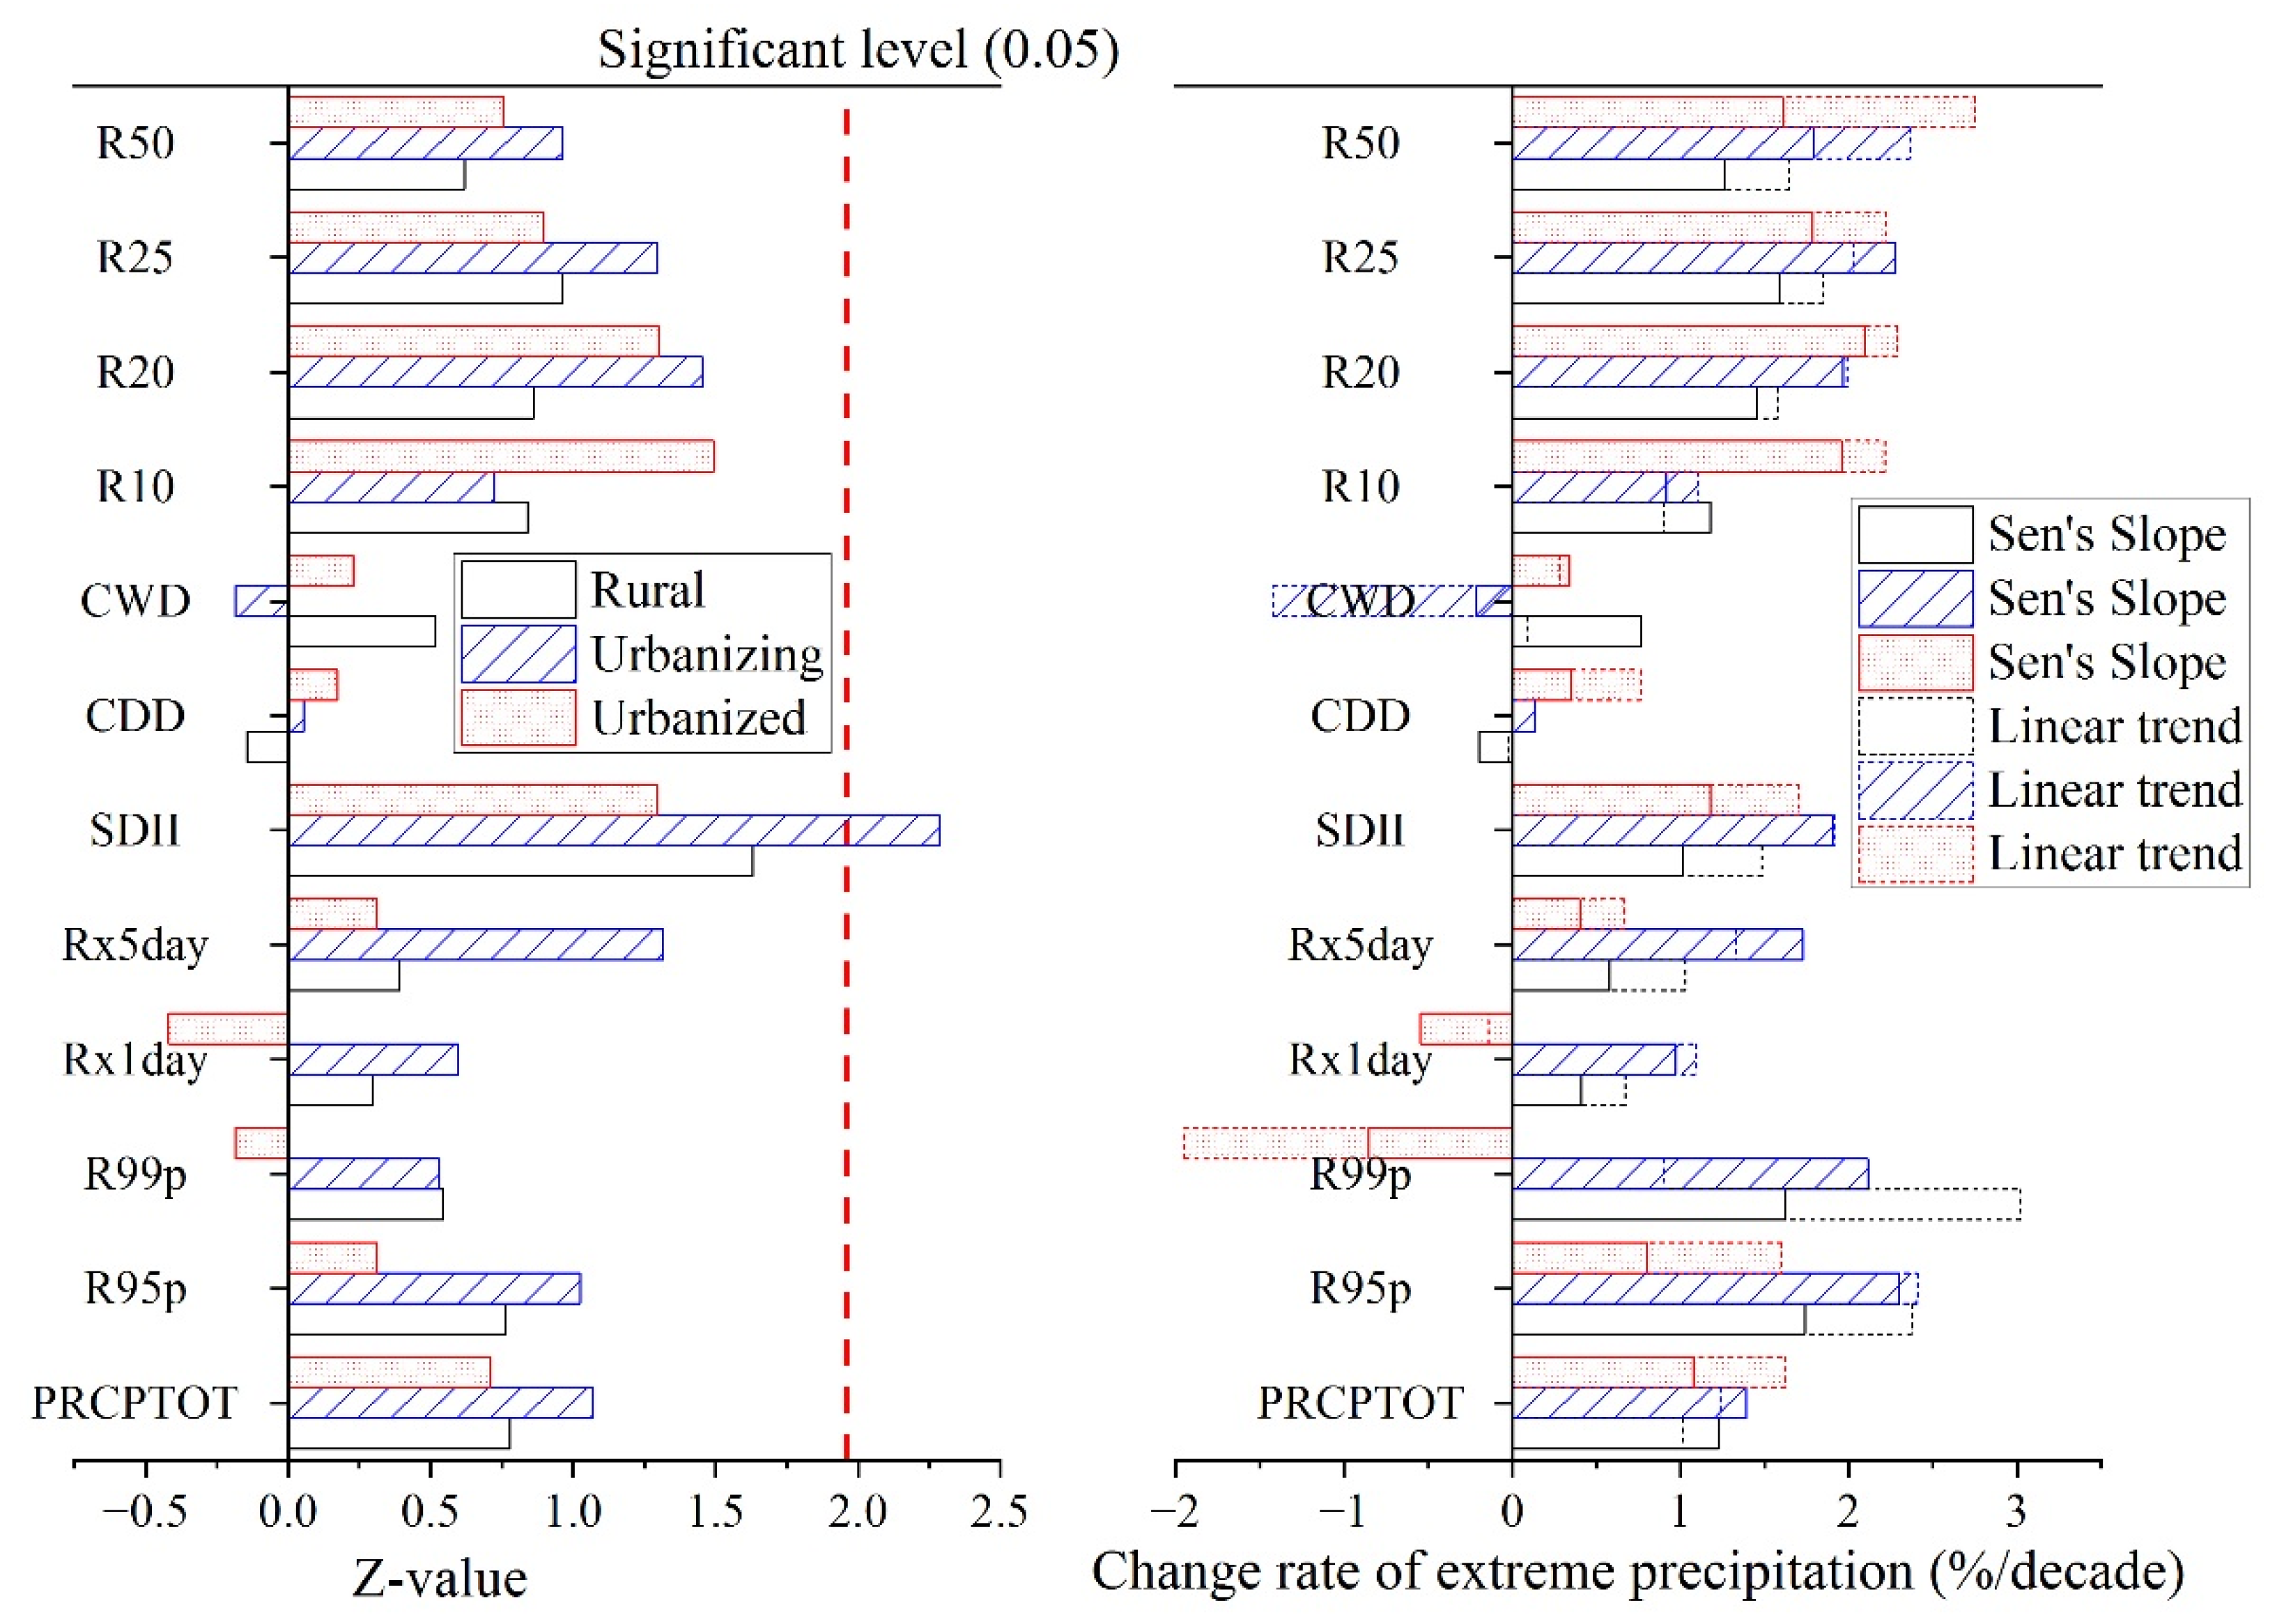
Meanwhile, we used the Mann–Kendall test and the Theil–Sen slope method to detect the trends of extreme precipitation series for all the areas. Similar results are shown in Figure 3, confirming the robustness of the observed trends of precipitation extremes. As a result, the amount of extreme precipitation (e.g., R95p and Rx5day), intensity (SDII), and frequency (e.g., R10, R20, R25, R50) exhibited increasing trends in all areas, implying that the PRD is facing increasingly extreme precipitation events, which is in accord with existing studies that analyzed the regional changes in precipitation extremes in the PRD [36,54,55], Guangdong Province [37], and Guangdong–Hong Kong–Macao Greater Bay Area (GBA) [56].
Here, we also investigated the segment trends of precipitation extremes during two sub-periods (i.e., 1961–1990 and 1991–2017), as also shown in Figure 2. Overall, increasing trends dominated in rural and urbanizing areas for the two sub-periods, whereas decreasing trends were prominent in the urbanized areas, with the number of precipitation extremes being about seven (58.33%) and nine (75%) in 1961–1990 and 1991–2017, respectively. On average, about 83.33% of trends in precipitation extremes in the rural (urbanizing) areas continued to increase in the magnitude of trends (i.e., a higher increasing magnitude or a lower decreasing magnitude) from the first to the second part. For example, the PRCPTOT increased by 14.01 mm (20.47 mm) per decade in the first part (i.e., 1961–1990), and it accelerated to 26.87 mm (30.99 mm) per decade in 1991–2017; the R95 p showed a decreasing trend with a value of 2.57 mm (2.38 mm) per decade during 1961–1990, but it increased by 13.30 mm (2.32 mm) per decade in the second sub-period. Moreover, only 58.33% of trends in the urbanized areas showed fewer decreases in 1991–2017 by comparison with the trends in 1961–1990. For instance, the decreasing magnitudes of trends in R95p (R99p) reduced from 46.34 mm (41.10 mm) to 29.53 mm (19.67 mm) per decade. In summary, the segment trends were different from the trends of the entire period because of the variations in precipitation extremes.
3.2. Spatial Patterns of Extreme Precipitation
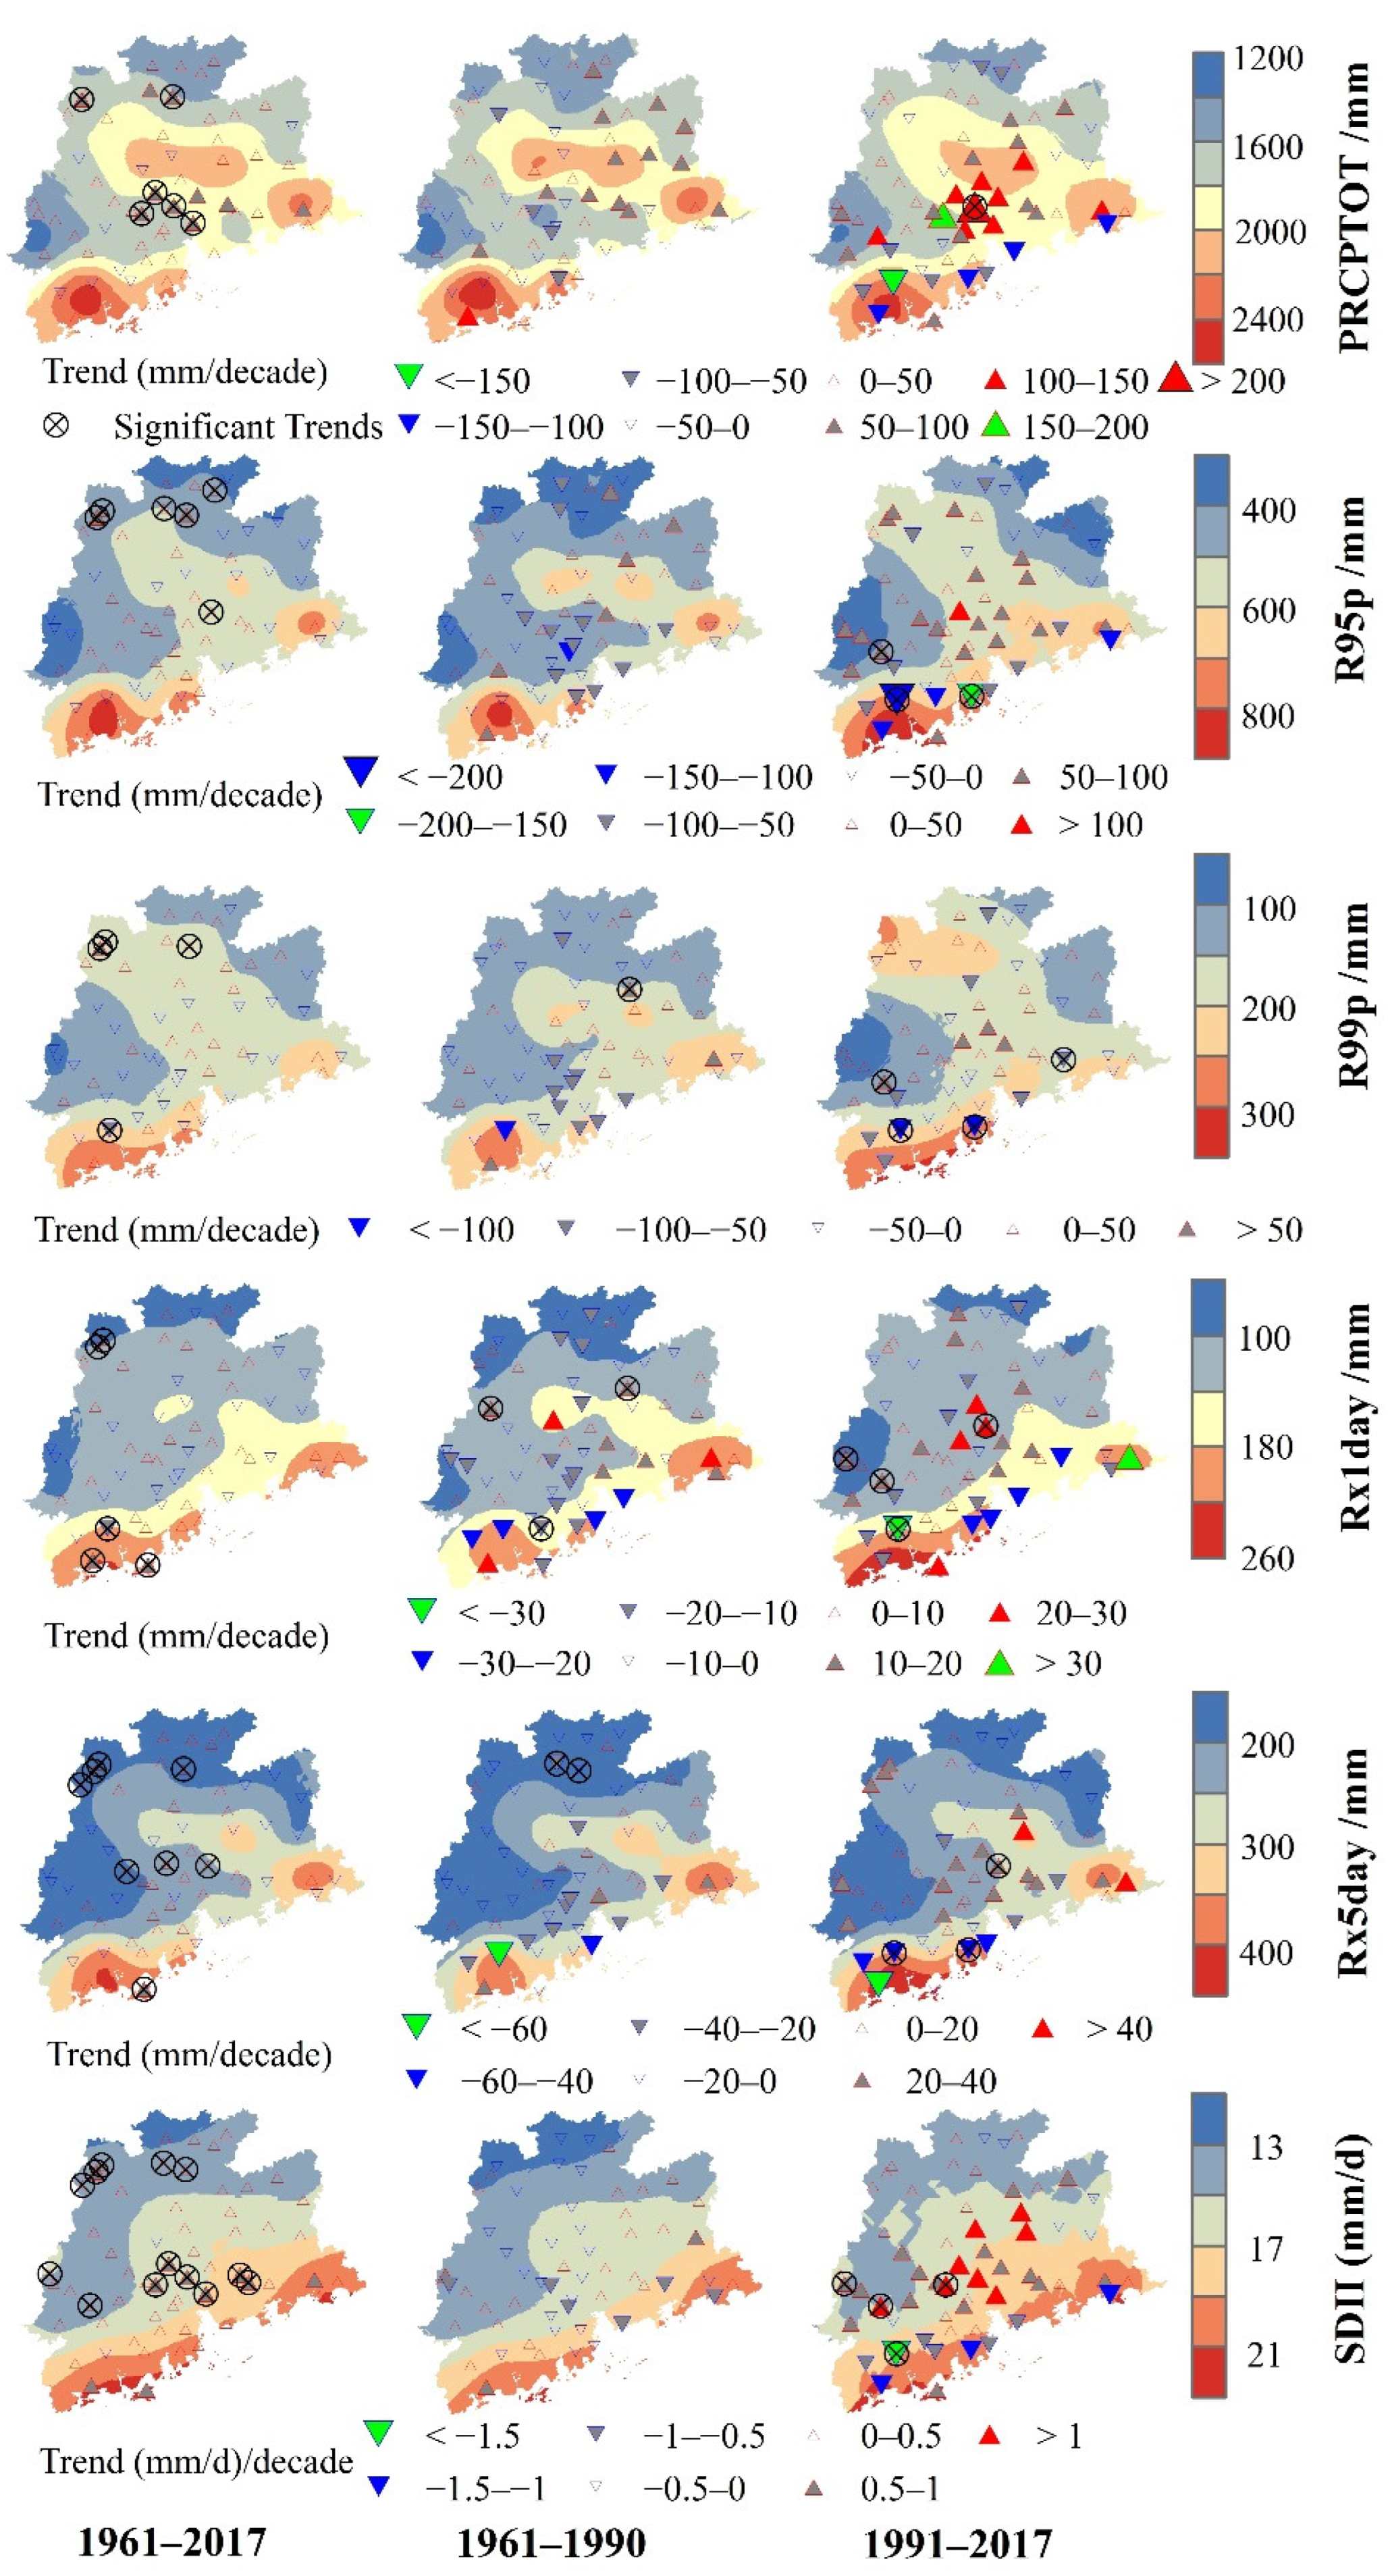
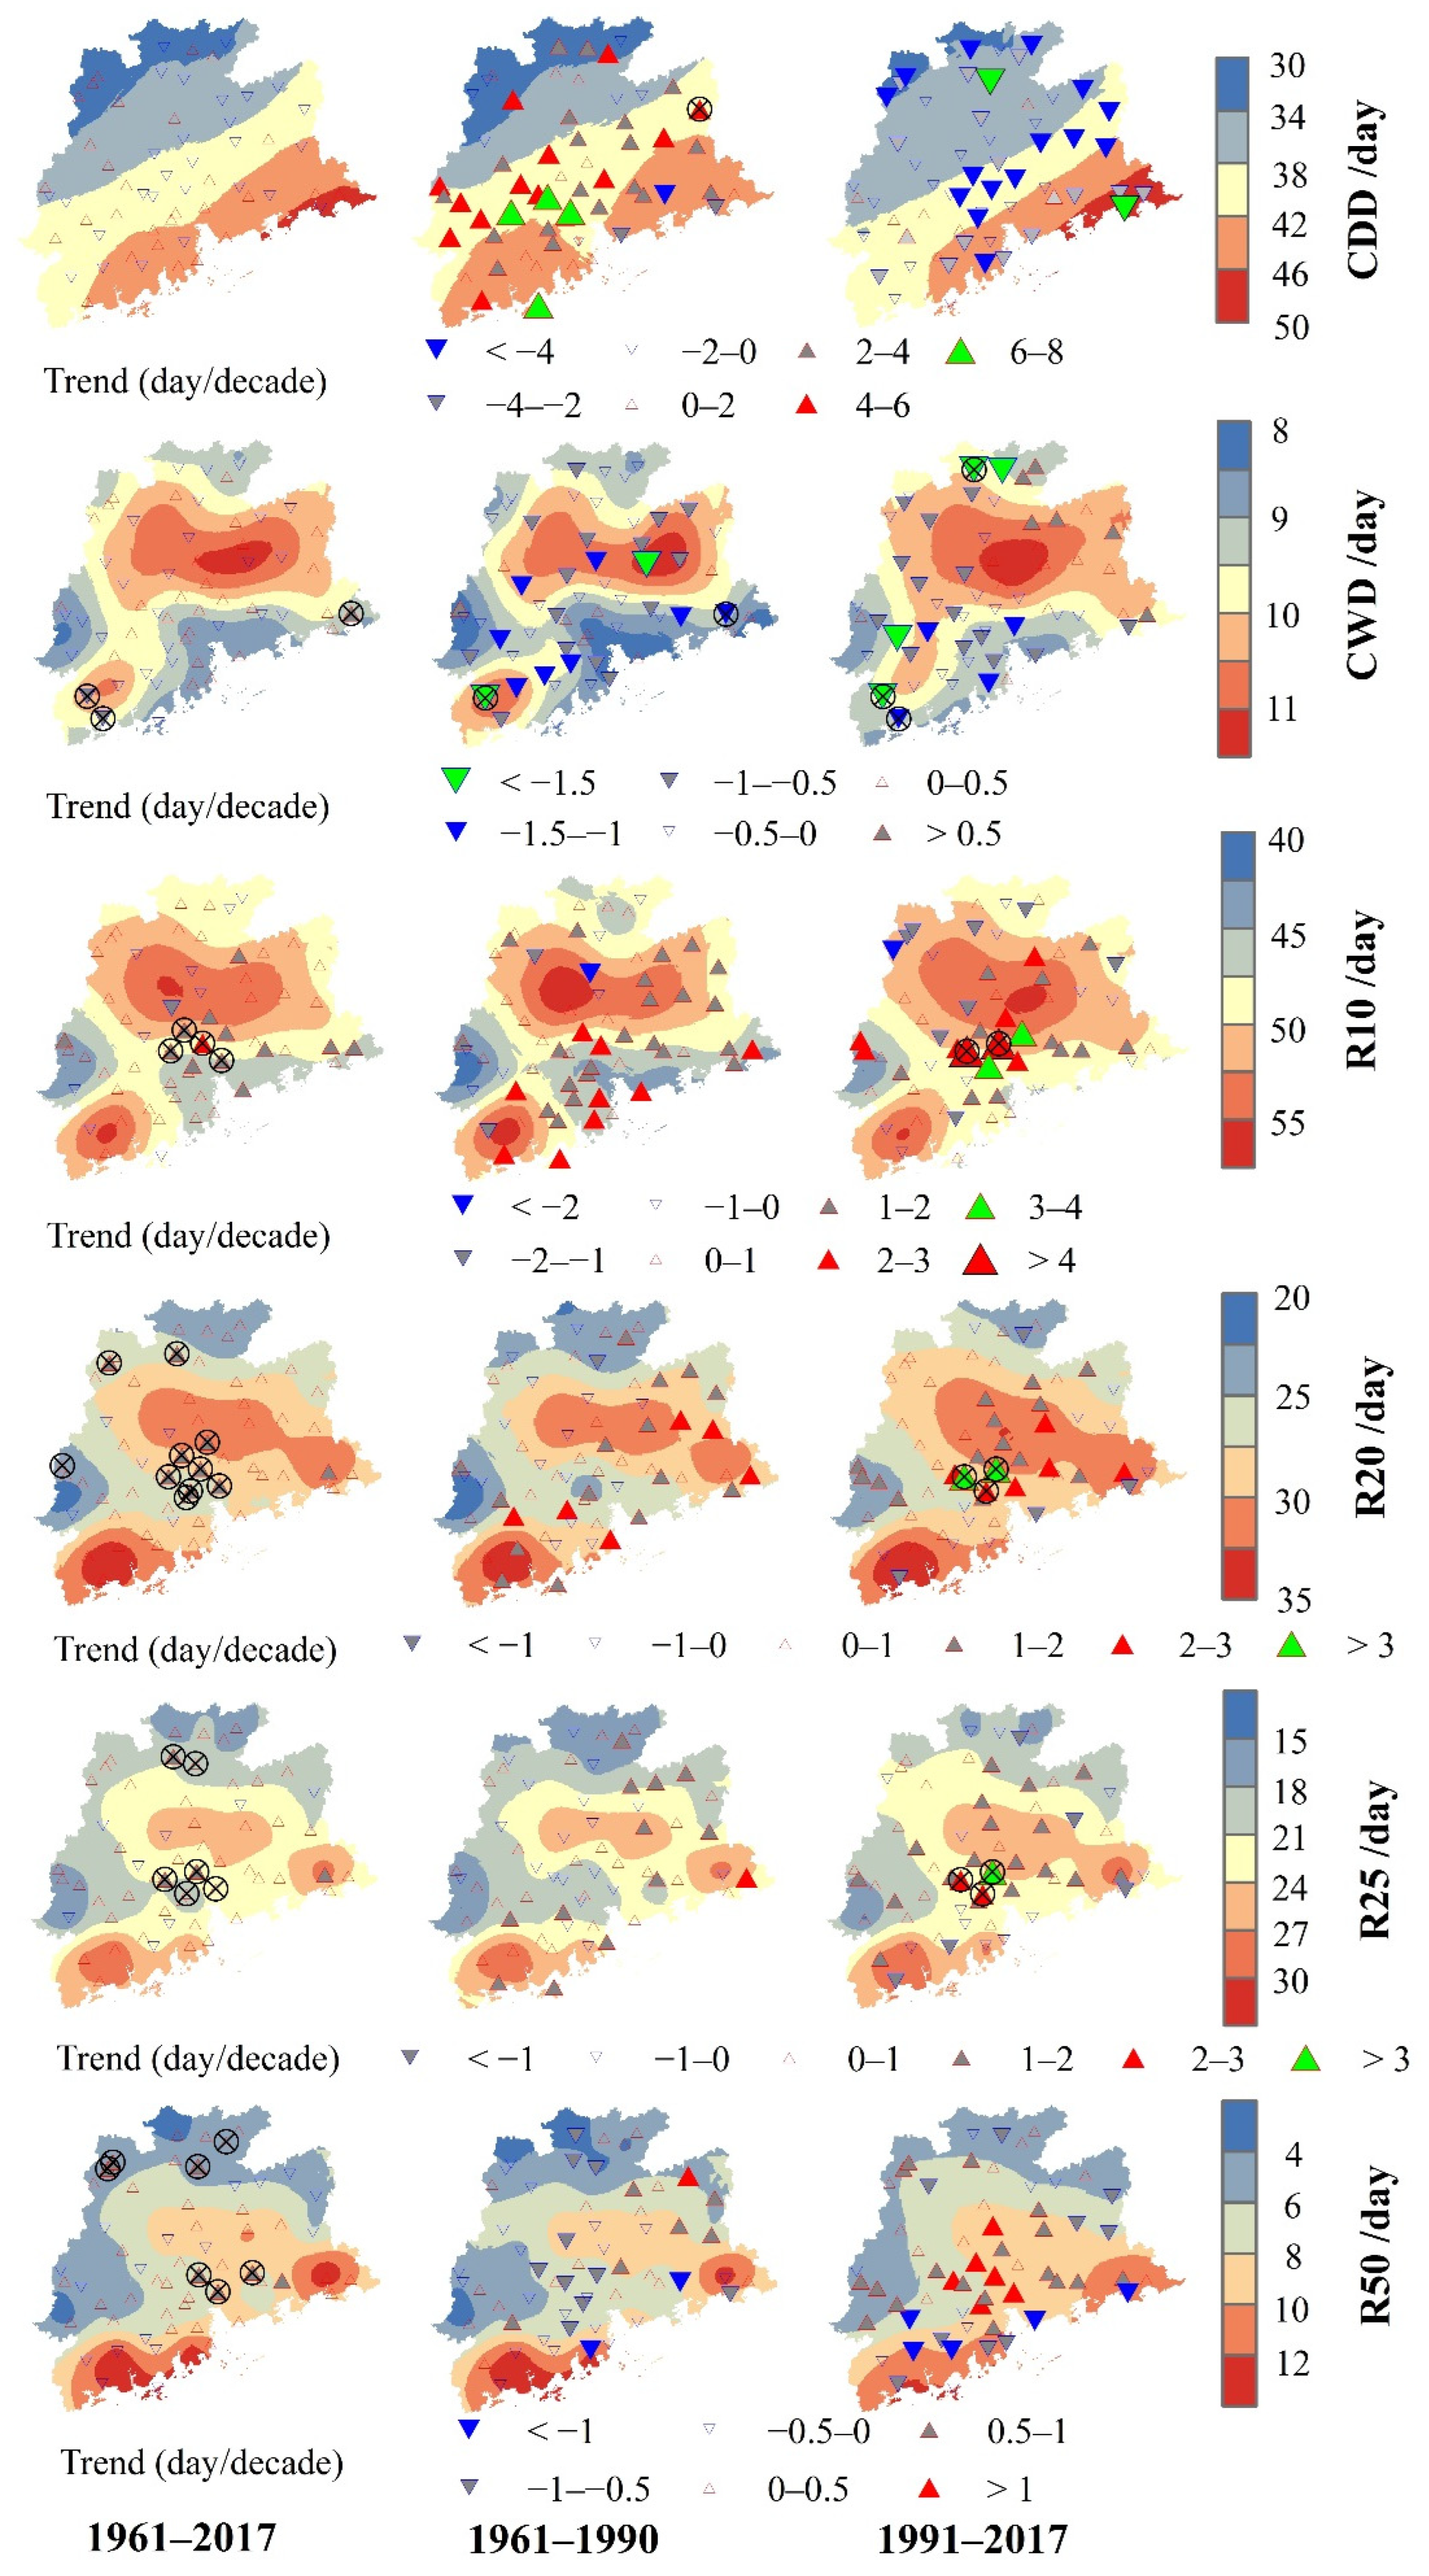
Figure 4 illustrates the spatial patterns of the annual mean extreme precipitation indices and their magnitudes of trends in different periods. We found that the precipitation extremes showed gradual changes from the southeast to the northwest, with a high value located in the southeast for the extreme precipitation indices, except for CWD and R10. Overall, the similar distribution for all the indices in different periods meant that urbanization may play a slight role in the spatial patterns of precipitation extremes, even though the PRD region experienced high-speed urbanization during 1991–2017, with the urbanization rate (based on the urbanization population) increasing from 40% to 85%.
Moreover, the results obtained from the linear regression indicate that only a few stations exhibited significant trends in precipitation extremes for the entire period at the 5% significance level, of which 9.77% and 0.57% showed positive and negative changes, respectively, as shown in Table 2. Notably, 13 stations (about 22.41% of them) showed a significant increasing trend for SDII, while there were no significant changes for CDD. Moreover, there were fewer stations (averaging about 1.29% and 4.31% of the total) showing significant changes in the periods of 1961–1990 and 1991–2017, although their magnitudes in trends were larger than those of 1961–2017.
3.3. Urban–Rural Differences in Extreme Precipitation
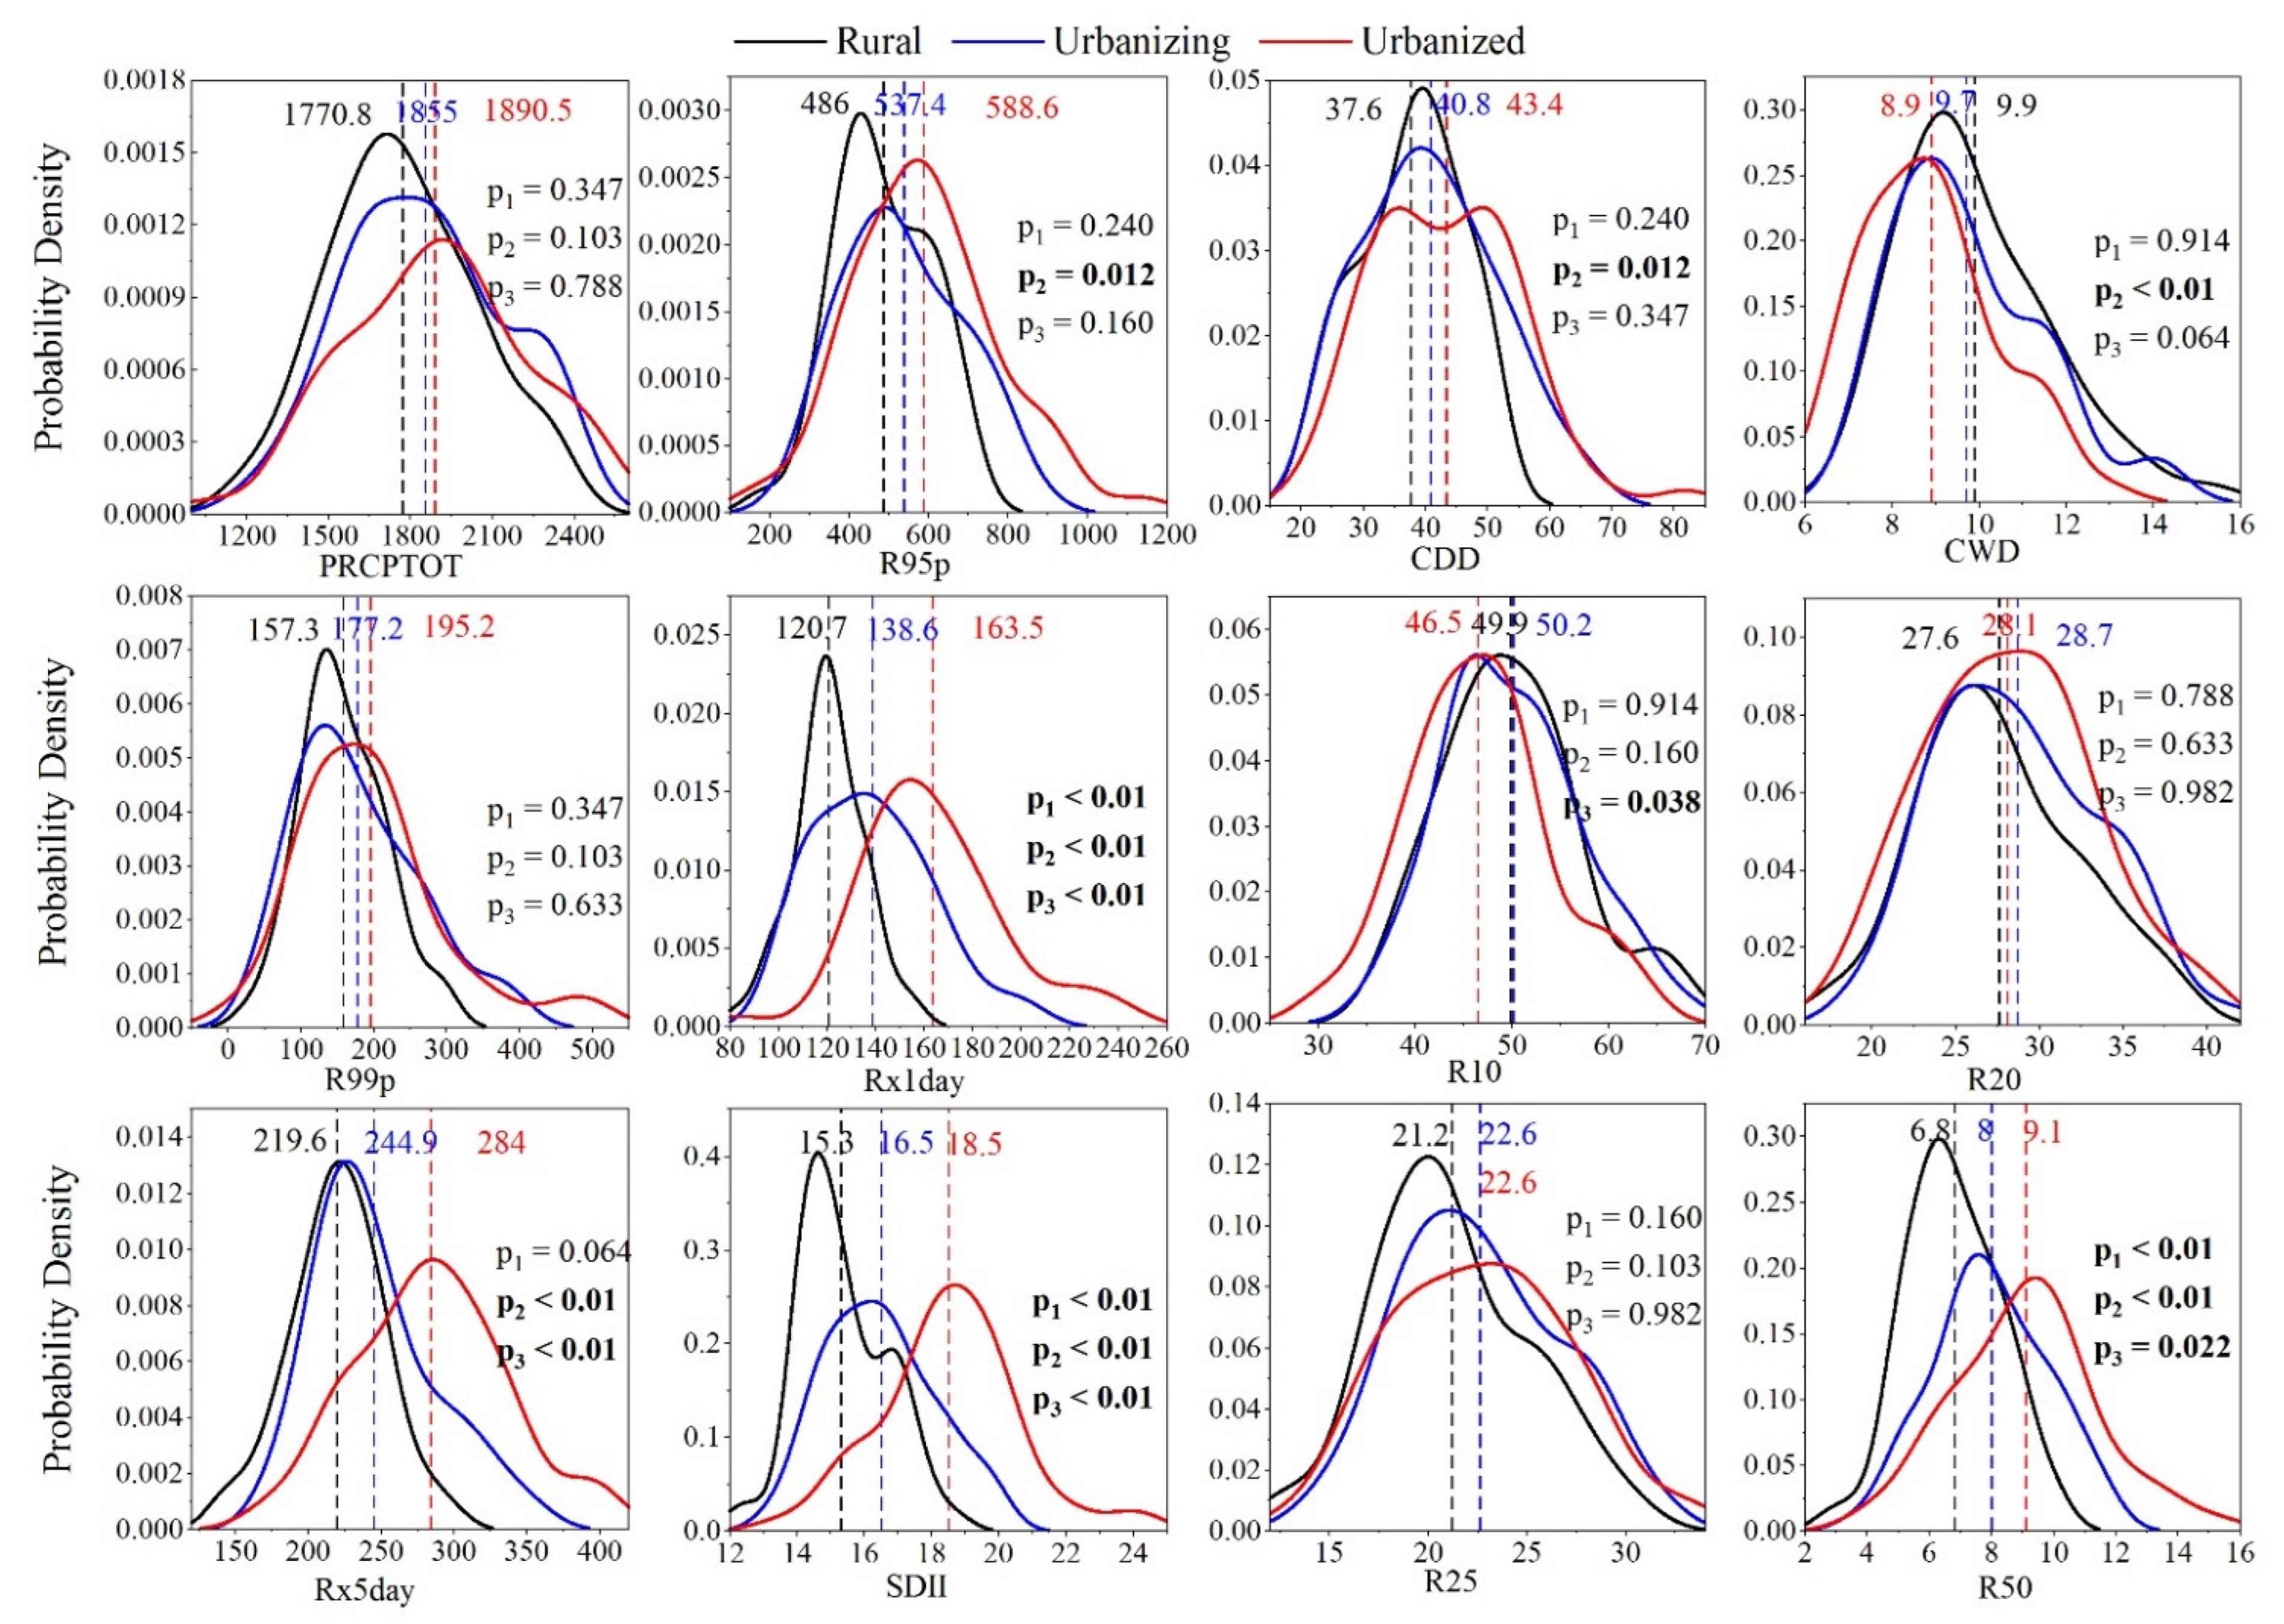
Firstly, we analyzed the urban–rural differences from the magnitude of extreme precipitation indices. To better understand urban–rural differences for all the indices of precipitation extremes, we examined their probability density function (PDF) curves and statistical features, as shown in Figure 5. We used the two-sample Kolmogorov–Smirnov (K–S) test to detect the urban–rural differences in the PDFs of precipitation extremes at a 5% significance level. All the mean values of extreme precipitation indices, except for CWD and R10, in the urban areas (i.e., the urbanizing and urbanized areas), were larger than those of the rural areas. On average, the mean values in urbanizing and urbanized areas were 9.89% (ranging from 3.99% to 17.65%) and 19.53% (from 1.81% to 35.46%) more than those of the rural areas. Moreover, the PDF also indicated that a higher precipitation amount, frequency, and intensity occurred in the urban stations when compared to rural stations, with a positive bias or right bias for most indices. That is, urbanization may lead to the flattening of the PDF representing the spatial variability of precipitation extremes in urban areas with a heavy tail. However, the K–S test results showed that seven (five) indices were significantly different in the PDF between rural (urbanizing) and urbanized areas at the significant level of 0.05, while only the PDFs of Rx1day, SDII, and R50 show significant differences between the rural and urbanizing areas. These results indicate that urbanization may induce more extreme precipitation events with a higher intensity (e.g., SDII, Rx1day and Rx5day) and a larger daily precipitation amount (e.g., R50).
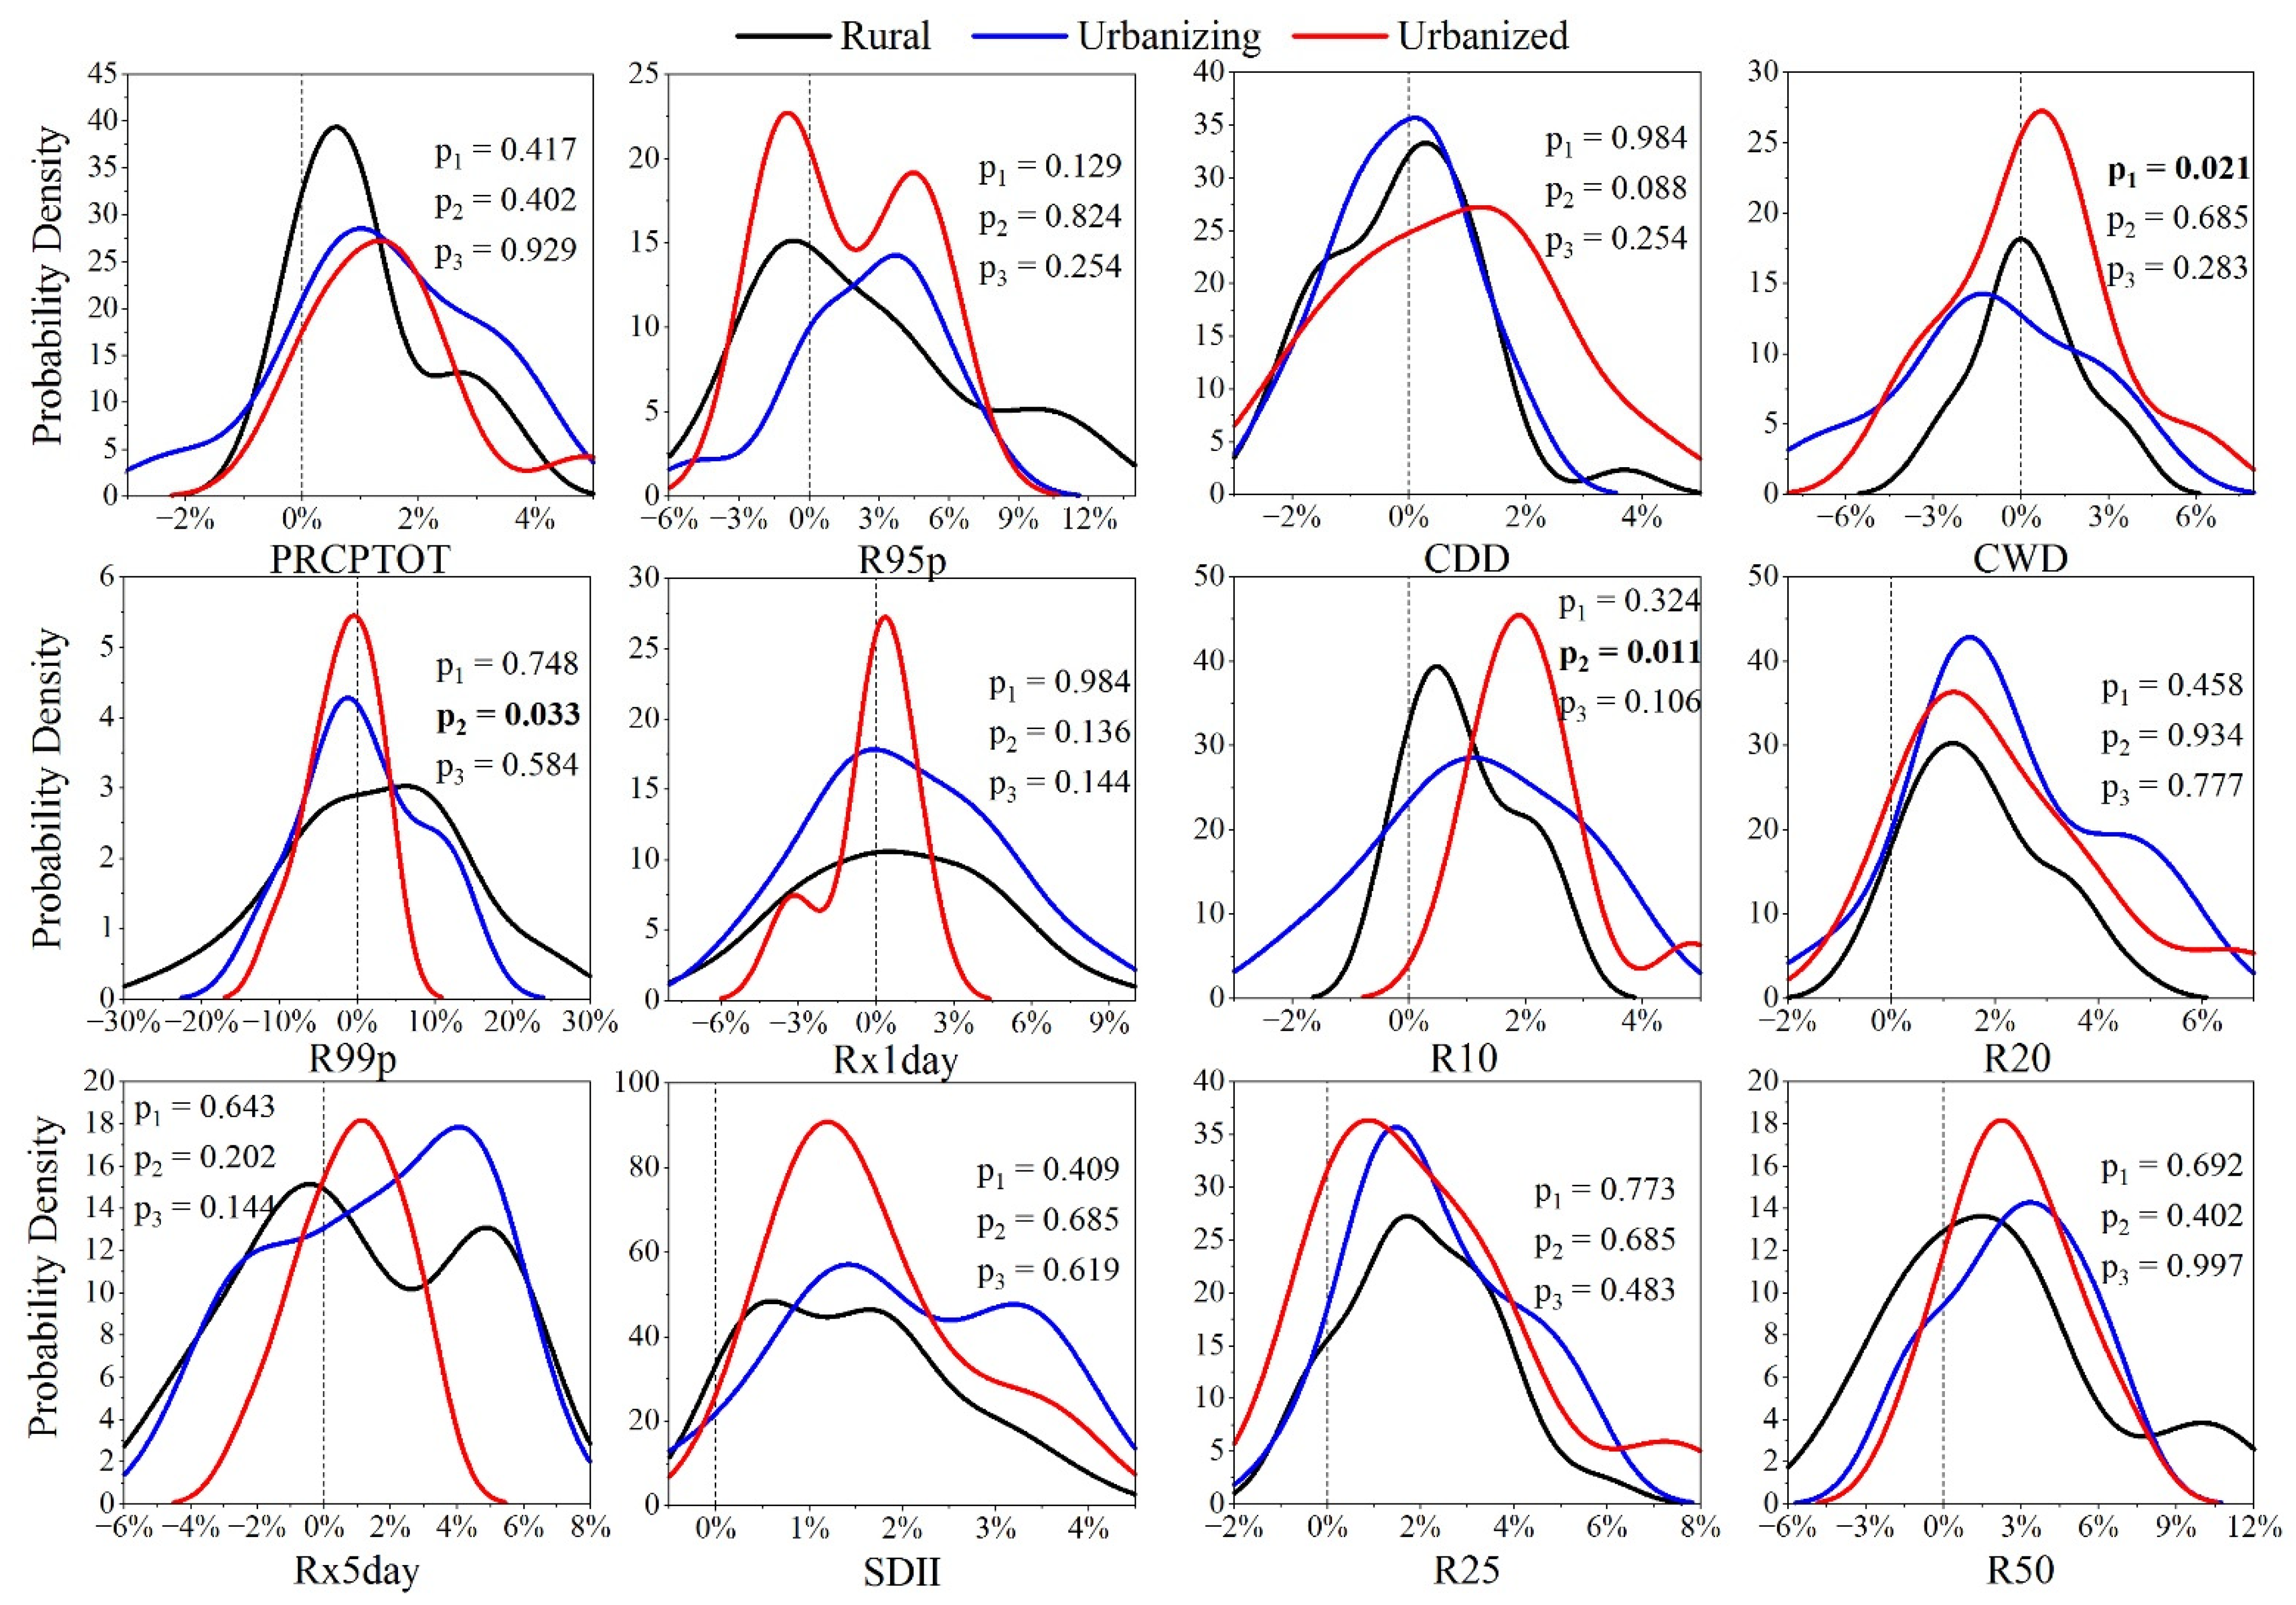
Moreover, we investigated the urban–rural differences from the perspective of trend detection. To identify the modification of precipitation extremes over the PRD and make their trends more comparable among the various variables of precipitation extremes, a normalized trend (i.e., change rate of trends per decade) was defined as the trend of the extreme precipitation index divided by its mean value during the same periods. Figure 6 shows the normalized trends in precipitation extremes for urban and rural areas, with the mean values in different areas being much the same. Overall, most of the indices showed an increasing trend for different areas, with an increasing rate of 1.31 ± 0.76%, 1.37 ± 1.07%, 1.13 ± 1.20% for rural, urbanizing, and urbanized areas, respectively. Similar results can be drawn from the PDF of normalized trends for rural and urban areas, as shown in Figure 7. Only three cases (i.e., the CDD between rural and urbanizing areas, the R99p and R10 between rural and urbanized areas) showed significant urban–rural differences. Therefore, in the broader context, these results indicate that urbanization may have a limited effect on the trends of precipitation extremes.
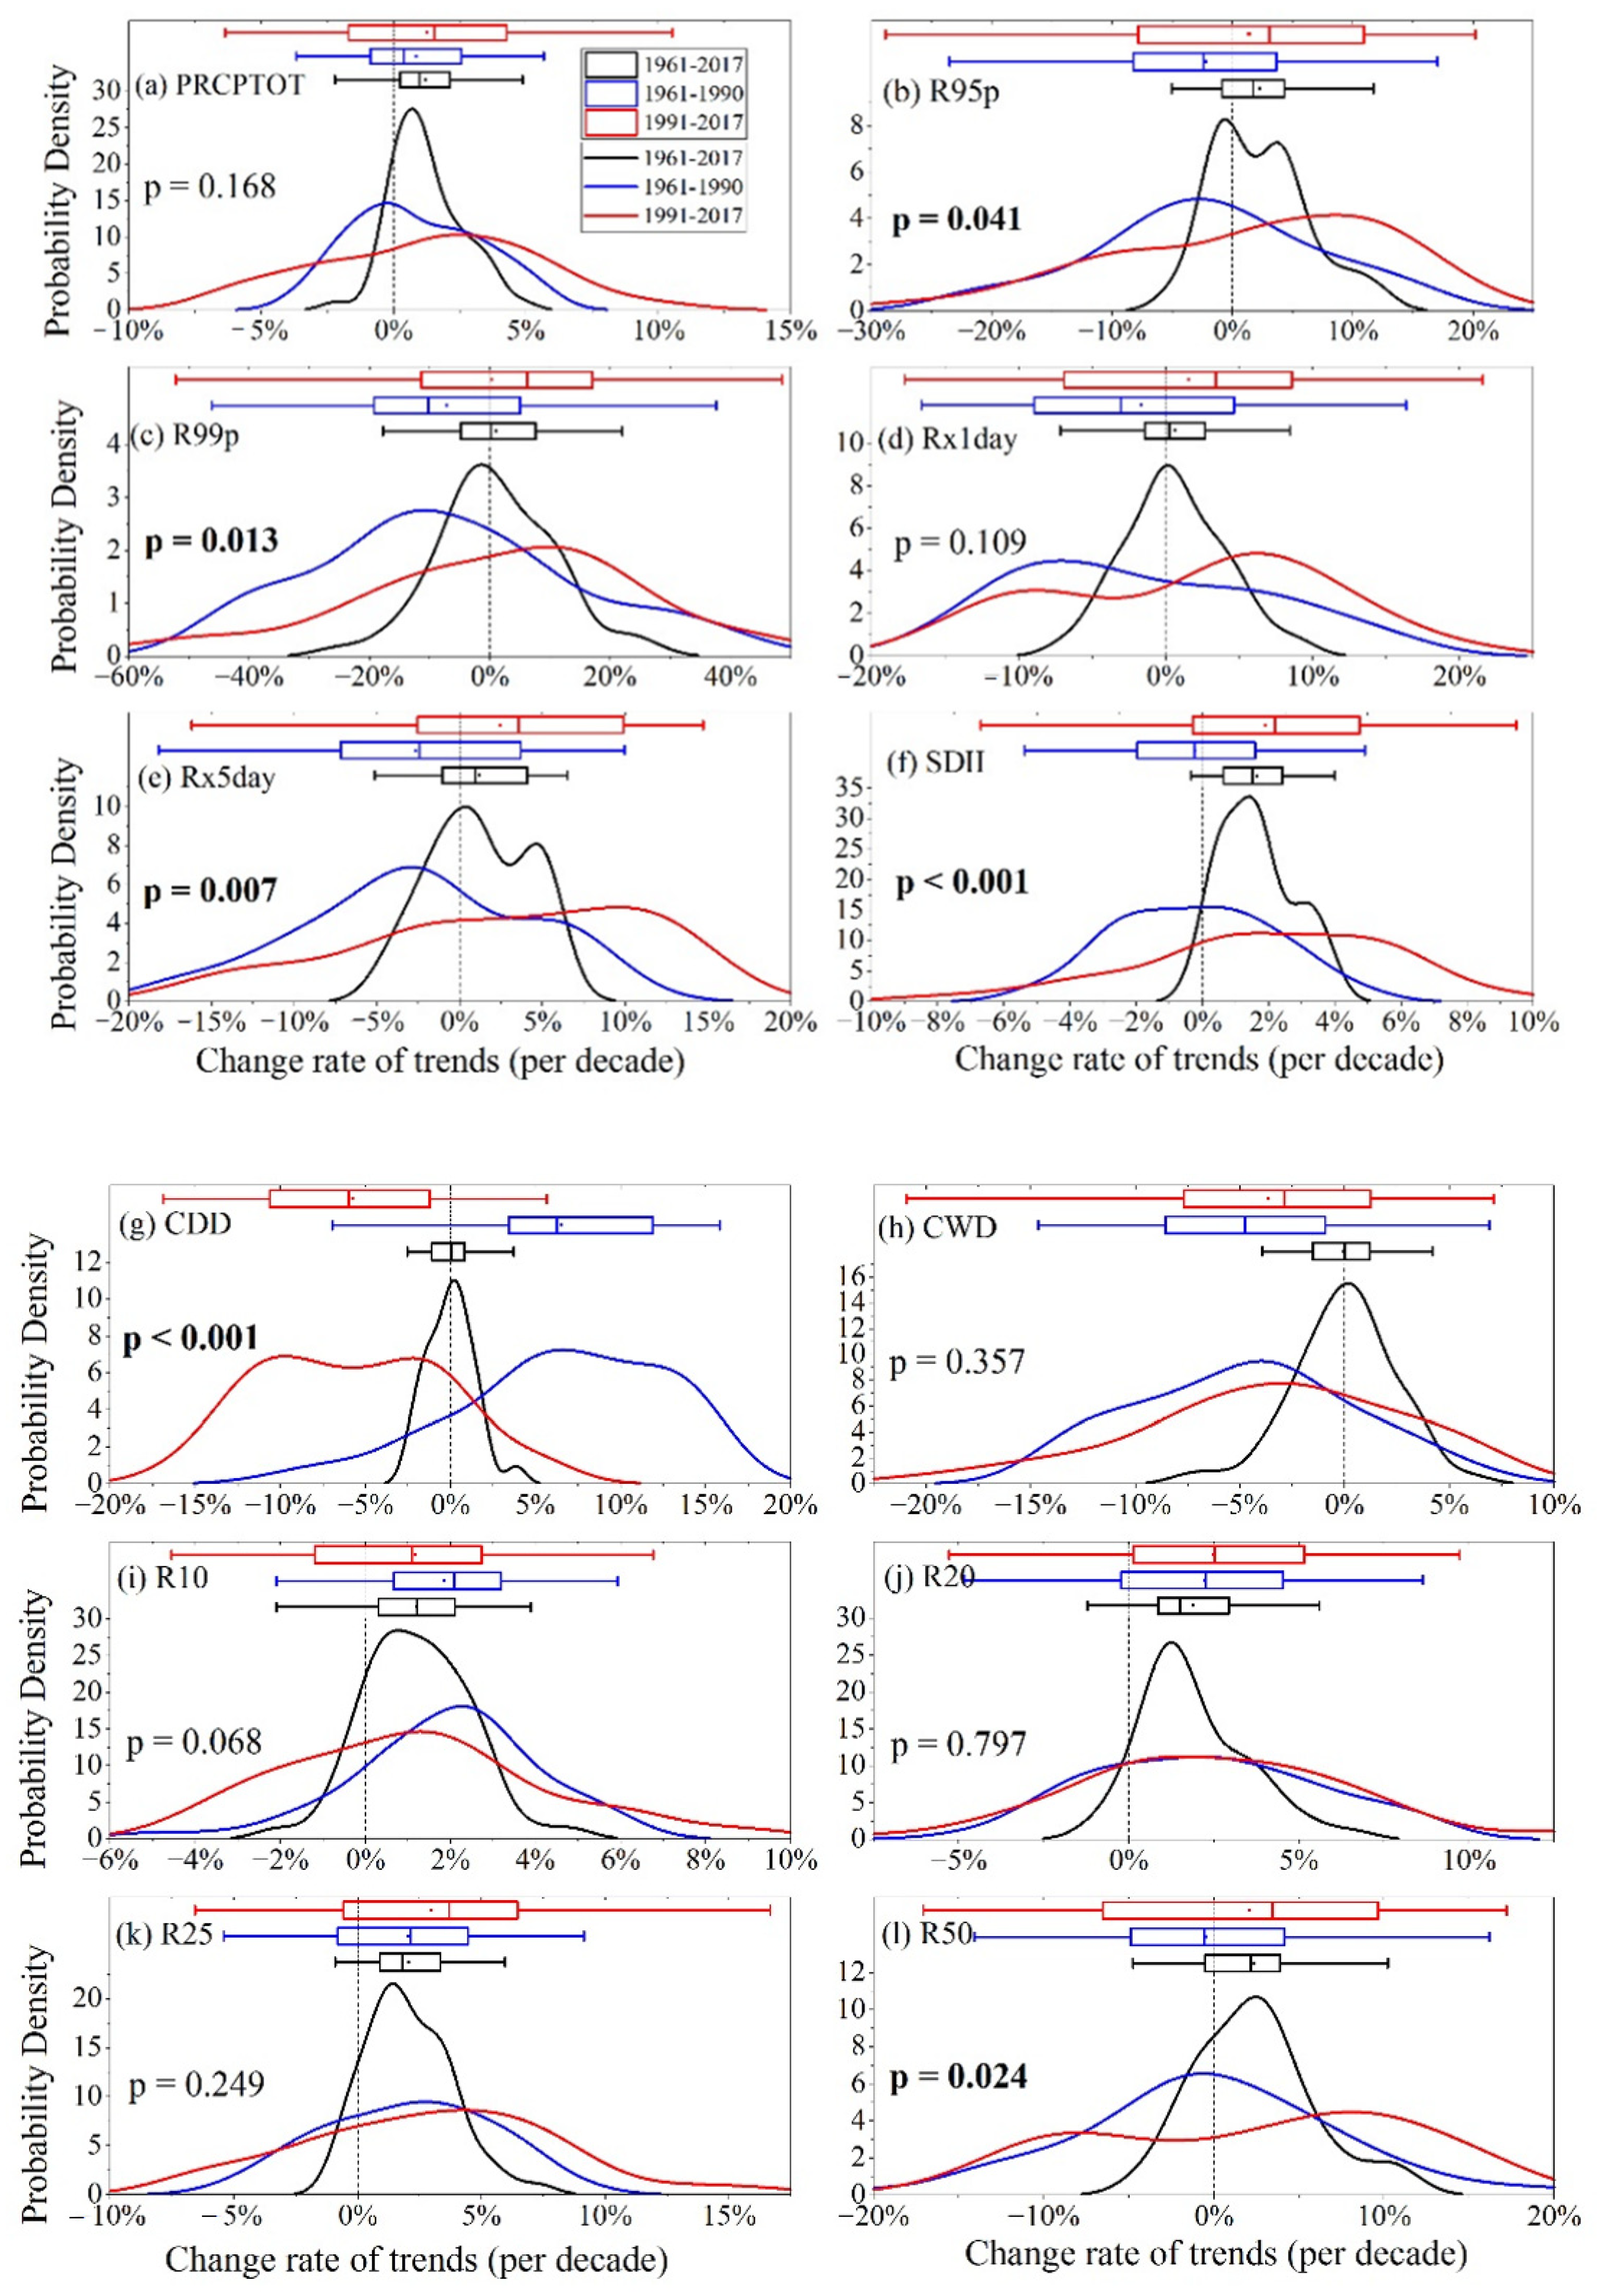
To better understand the possible impact of urbanization on the changes in precipitation extremes, we further analyzed the differences in the trends of precipitation extremes caused by the urbanization levels or stages. As previously mentioned, the first part (i.e., 1961–1990) was set as low-level urbanization, and the second part (i.e., 1991–2017) belonged to high-level urbanization. As shown in Figure 8, the magnitude (box plot) of normalized trends in precipitation extremes in the second-half period was the highest, followed by the first-half period, and the lowest magnitude was the full period. On average, the change rate in the first-half (second-half) period was 1.62 (1.91) and 4.33 (5.91) times as long as that of the full period for the increasing or decreasing trends, with the values ranging from 1.16–3.95 (1.19–2.37) and 1.66–15.16 (2.18–24.37) for all the extreme precipitation indices, respectively. For example, the magnitude of PRCPTOT ranged from −2.23% to 4.86% per decade in 1961–2017, while the value ranged from −3.68% (−6.38%) to 5.66% (10.52%) per decade in 1961–1990 (1991–2017). Certainly, the differences in the changes in precipitation extremes between the pre-1990 and post-1990 periods may be attributed to the joint effects of urbanization and climate change, which has been widely confirmed by previous studies [26,28,39]. Similar results can be also obtained from the PDF of normalized trends in precipitation extremes. We found that six indices (e.g., R95p, R99p, Rx5day, SDII, CDD, and R50) showed significant differences in the normalized trends between the pre-1990 and post-1990 periods. Overall, except for CDD, the normalized trends in 1991–2017 had a positive bias when compared to those in 1961–2017, implying that more extreme precipitation events may have occurred in the post-1990 period. In a way, these results also indicate that the extreme precipitation events may increase during the transition from low-level urbanization to high-level urbanization. That is, the increases in precipitation extremes have a possible link to the rapid urbanization across the PRD since the 1990s, similar to the previous work of Wu et al. [50].
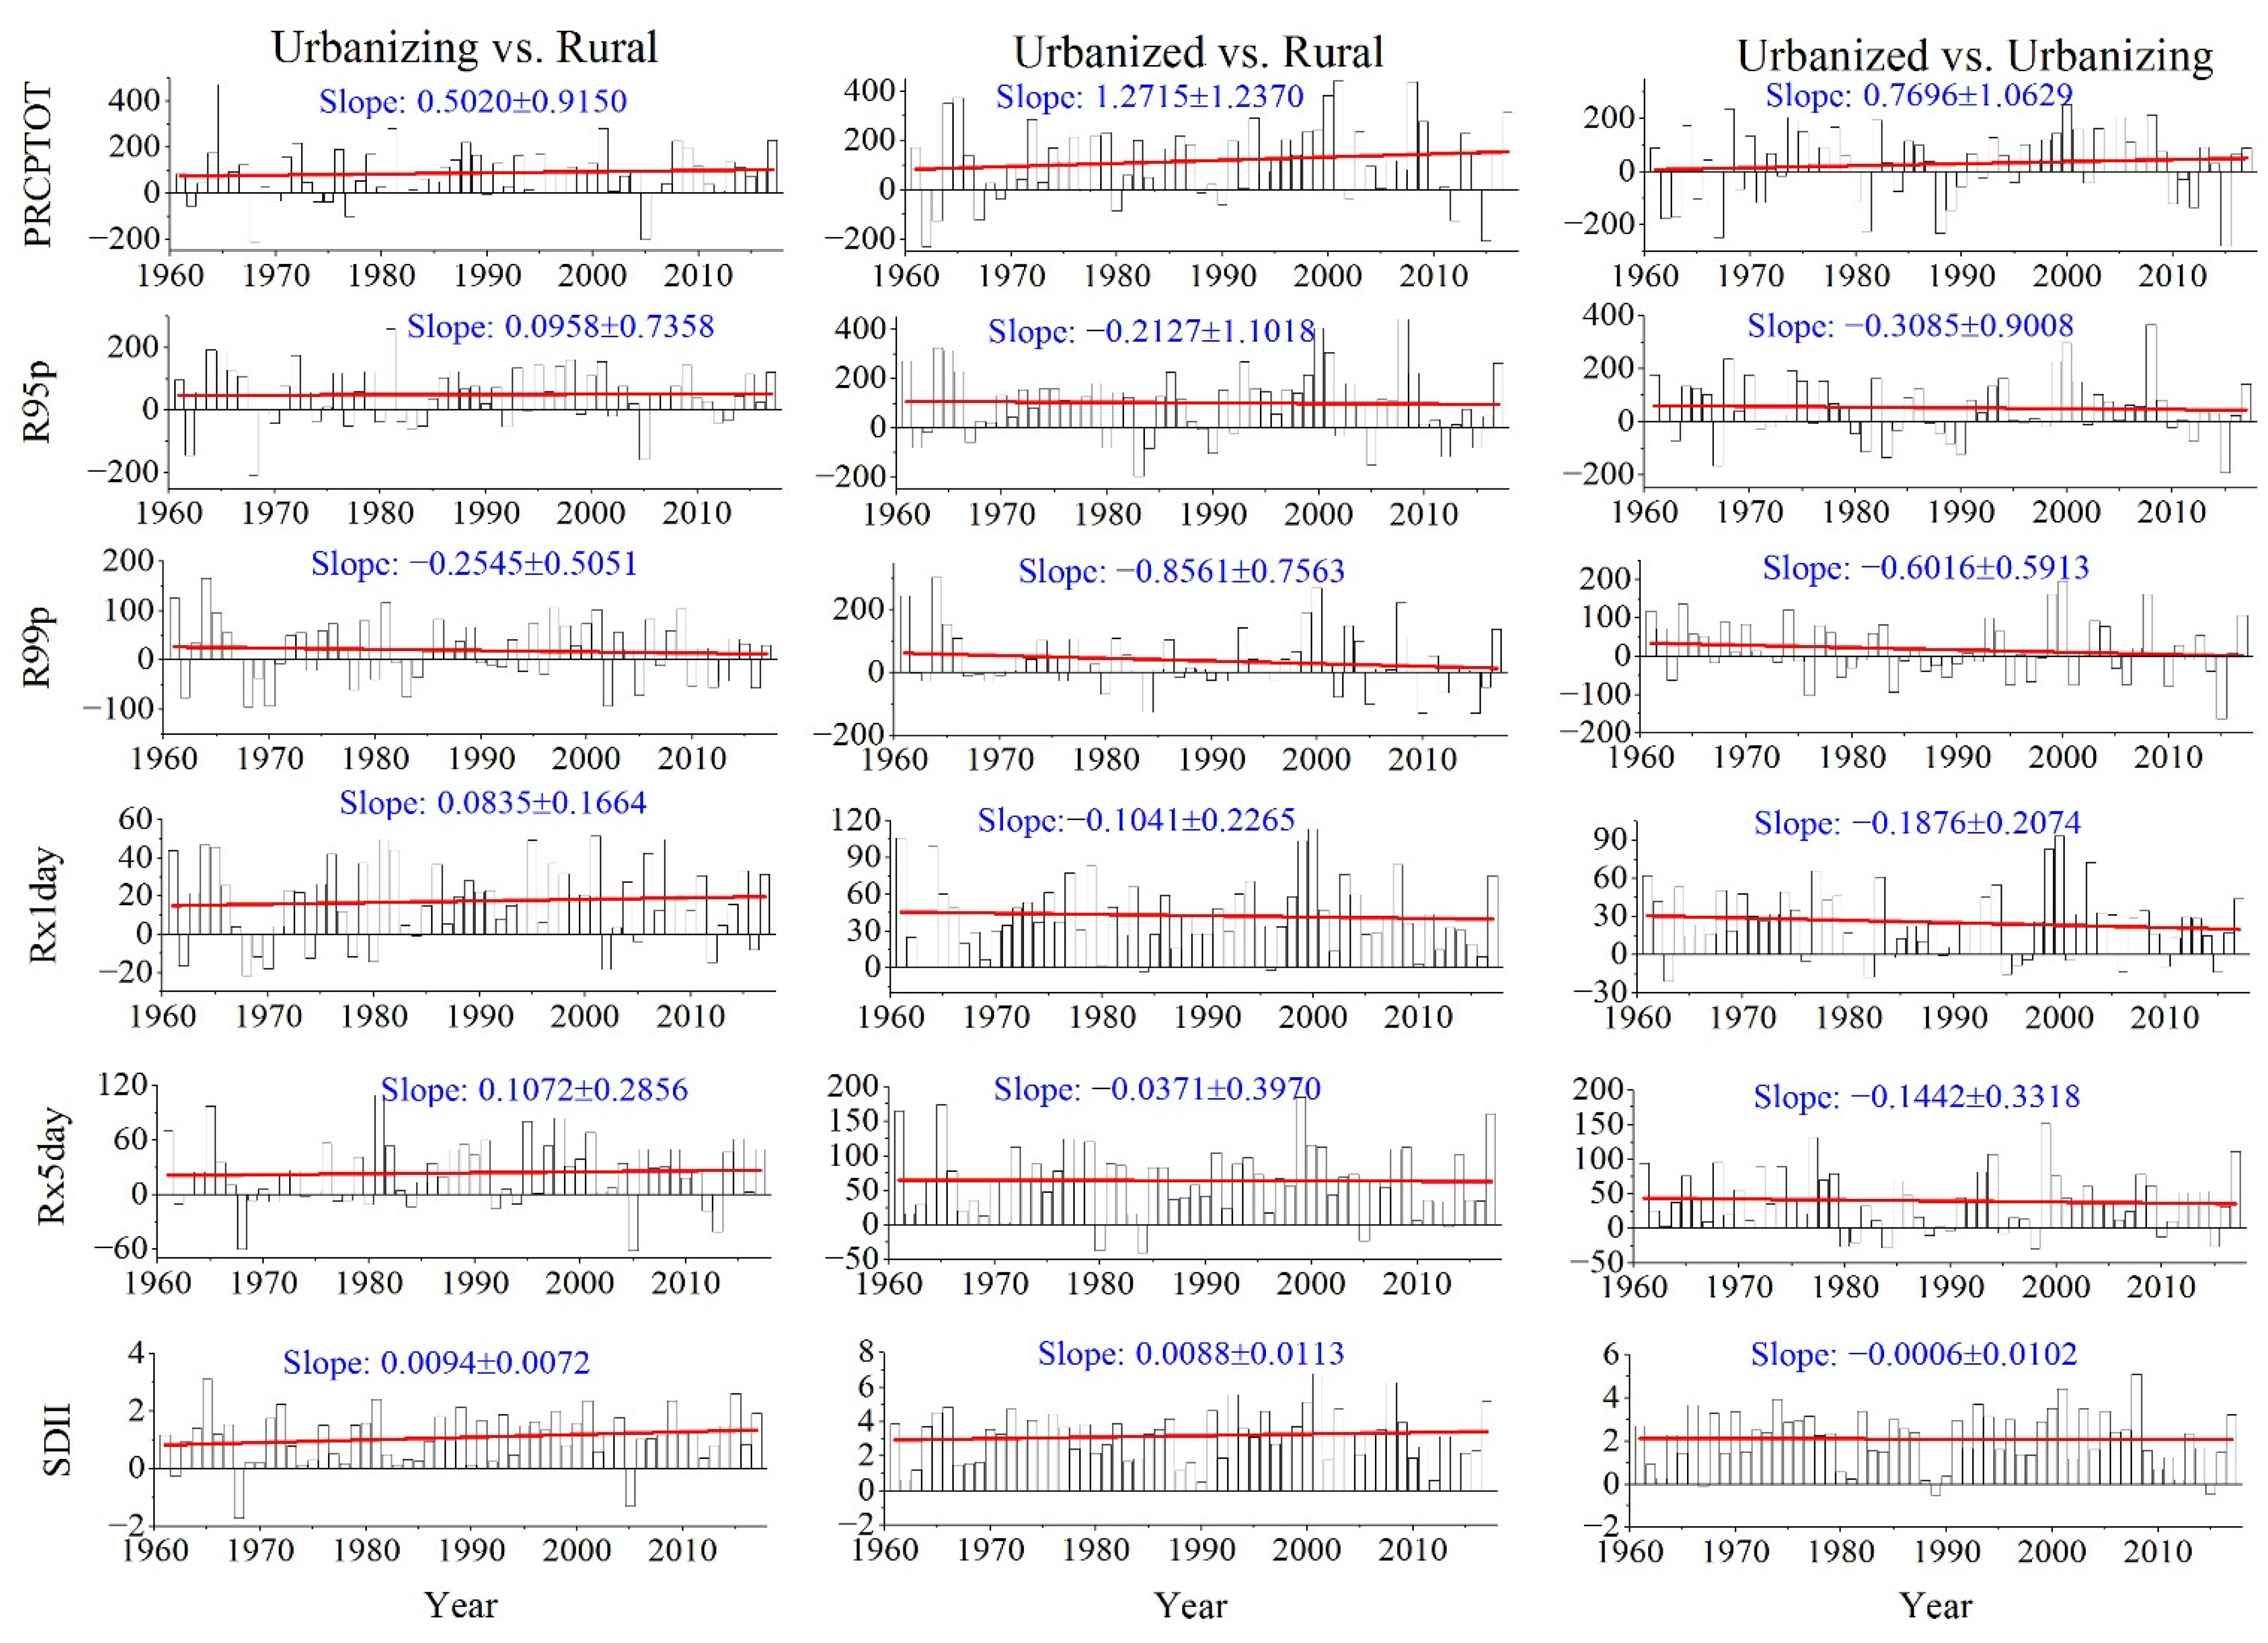
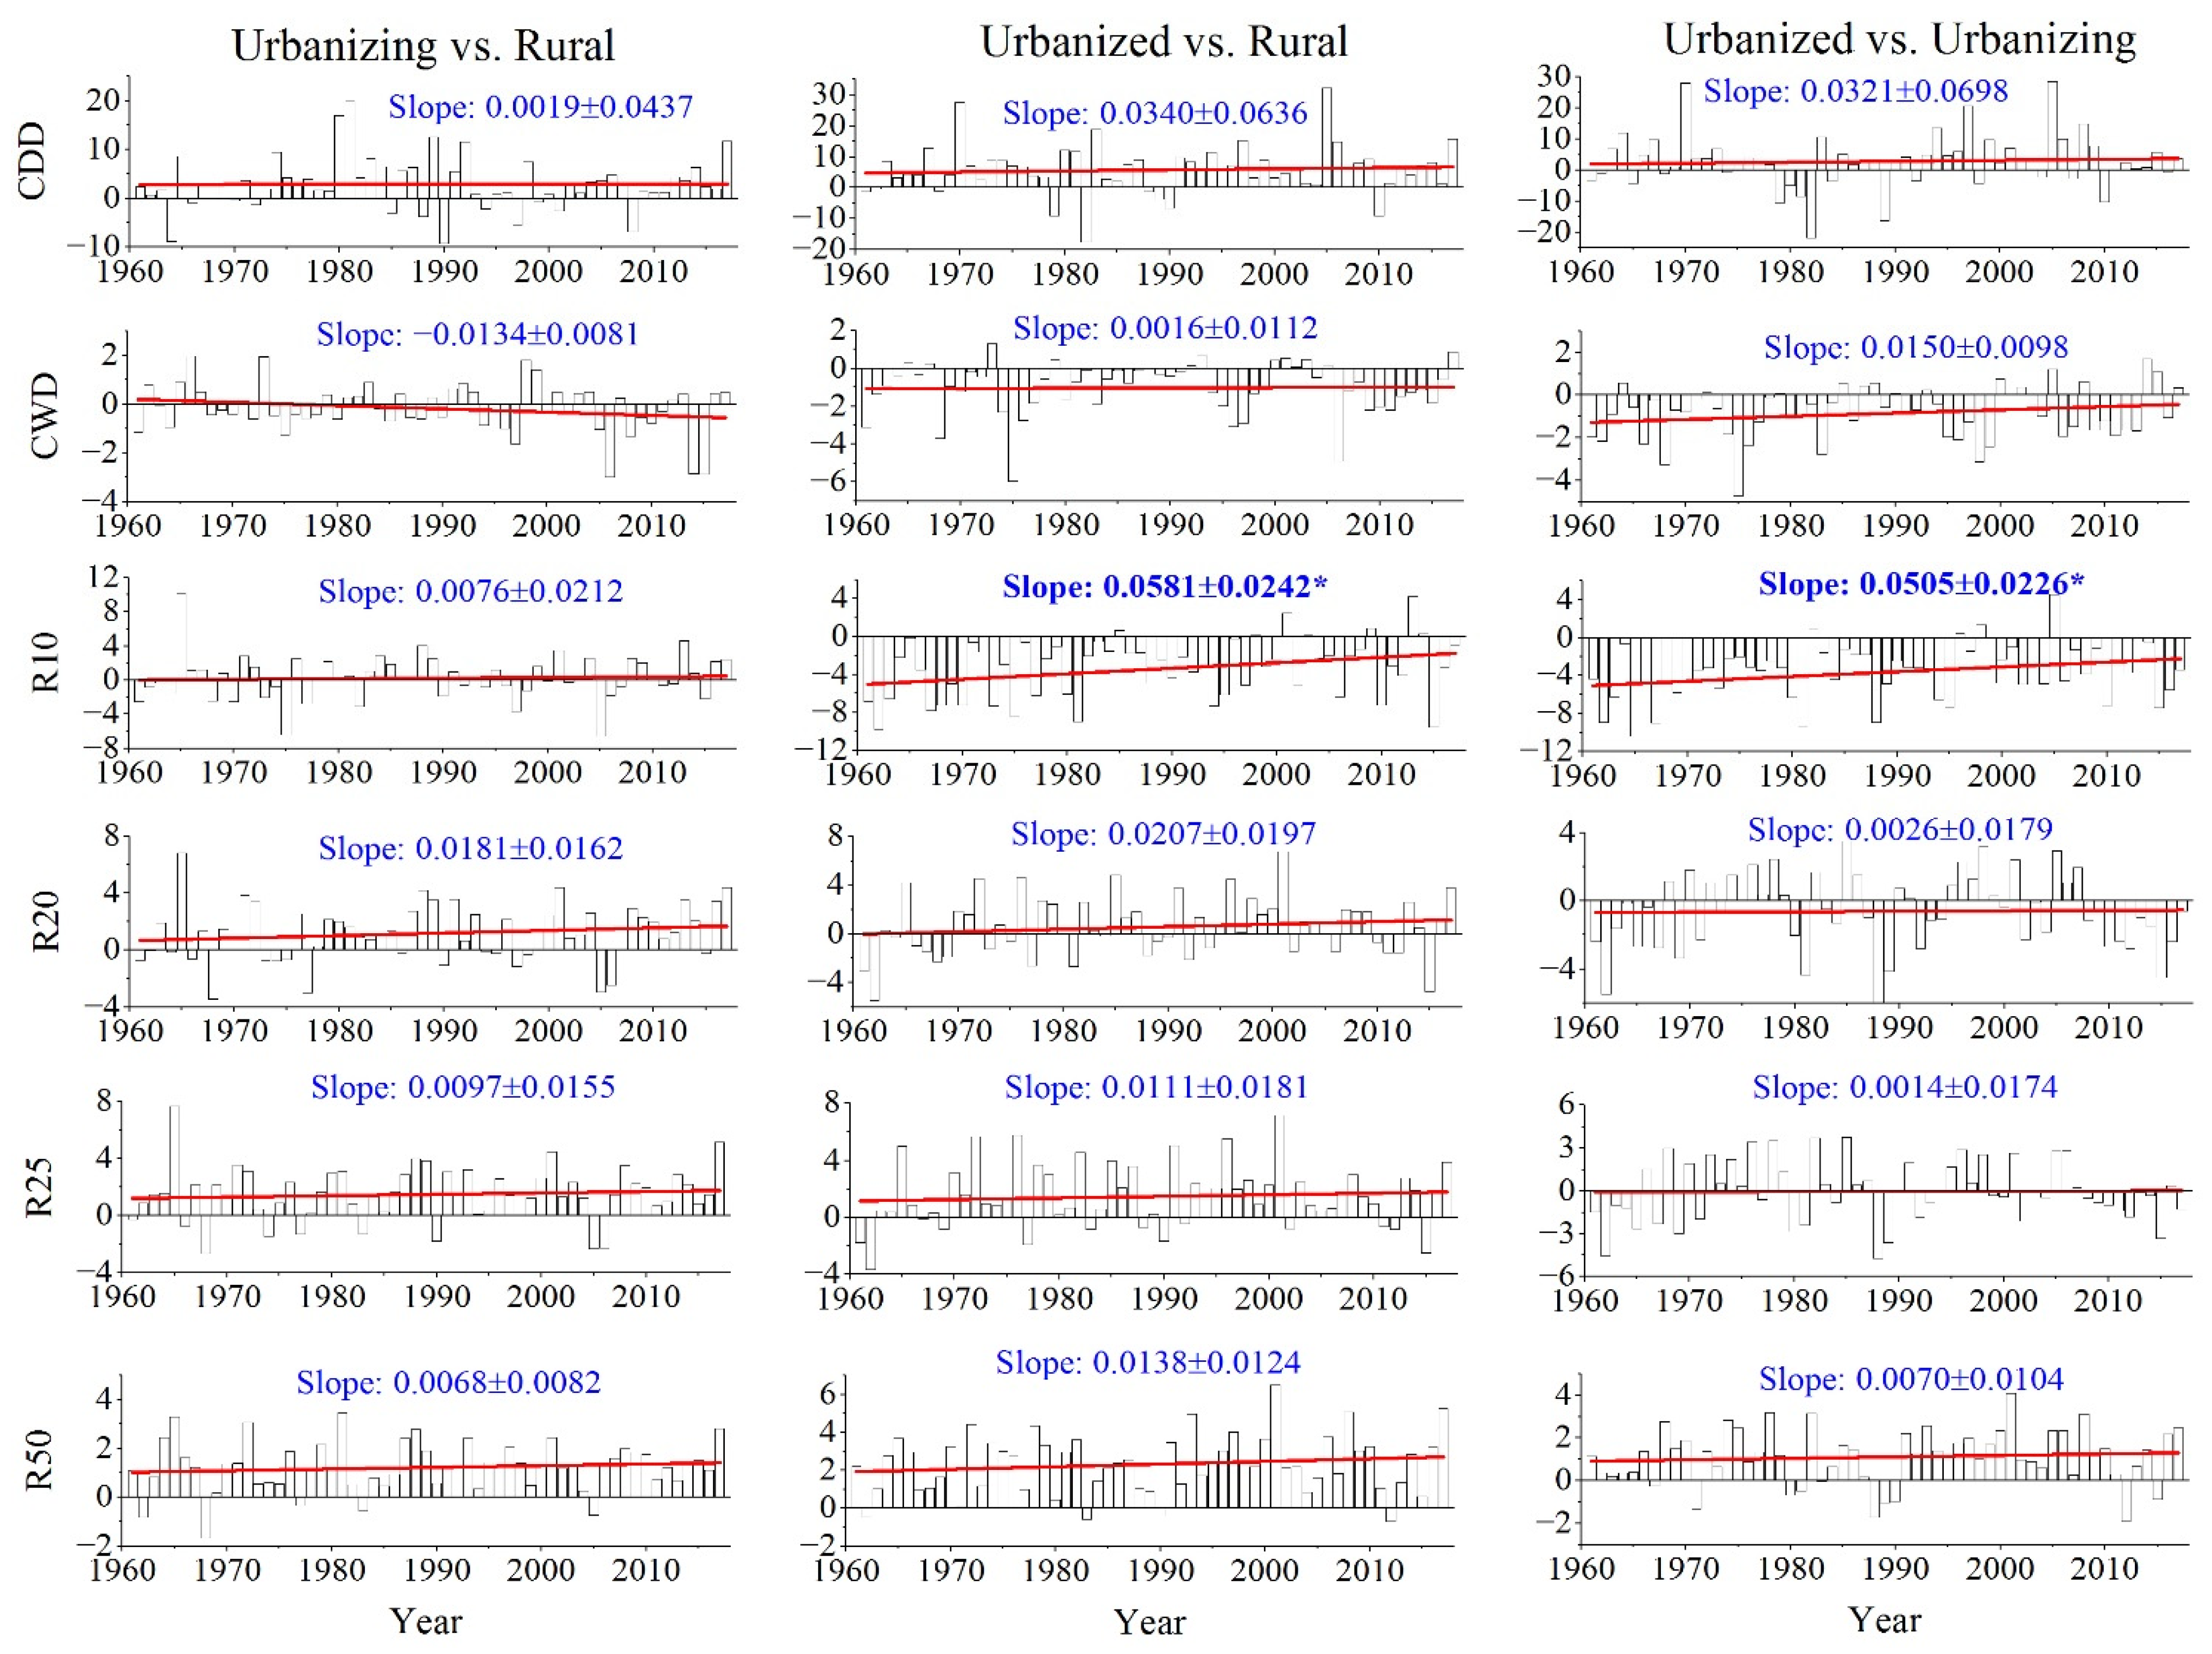
Furthermore, we examined the trends of urban–rural difference series in precipitation extremes, as shown in Figure 9. Most of the indices, especially for these frequency indices (e.g., R10, R20, R25, and R50), showed increasing trends from 1961 to 2017, with the numbers being 10, 8, and 7 for the urbanizing–rural, urbanized–rural and urbanized–urbanizing series, respectively. Nevertheless, only the R10 passed the significance test at a level of α = 0.05 for the urbanized–rural and urbanized–urbanizing series, with increasing trends of 0.58 and 0.50 days per decade. To some extent, enhanced urban–rural differences in precipitation extremes indicated the amplified effect of urbanization on the changes in precipitation extremes. However, these insignificant increases indicated that urbanization may cause increases in precipitation extremes, but its contribution may be limited.
3.4. Urbanization Effects and Contributions
Three urban–rural comparison groups (i.e., urbanizing vs rural, urbanized vs rural, and urbanized vs urbanizing) were classified to estimate the urbanization effects on precipitation extremes over the PRD. The UE was calculated by the two indicators, i.e., UED (based on the urban–rural difference series) in Equation (2) and UEΔR (based on the change rate of precipitation extremes) in Equation (4), which are illustrated in Table 3 and Table 4, respectively. This provided evidence of urbanization-induced increases in seven extreme precipitation indices (PRCPTOT, R95p, Rx5day, SDII, R20, R25, and R50) for both methods and three groups. Certainly, negative urbanization effects were also observed for a few indices, e.g., R99p, CDD, CWD, and R10 for the urbanizing–rural group, R99p for the urbanized–rural group, and Rx1day for the urbanized–urbanizing group. Hence, the magnitude and direction of the urbanization effects depended on the target index. Moreover, there were almost consistent positive or negative urbanization effects shown by the two methods, indicating that both are suitable and available in this work.
Moreover, Table 3 and Table 4 also summarize the urbanization contributions to the changes in precipitation extremes over the PRD, with wide ranges of 9.67–100% (8.34–100%), 3.56–100% (1.57–60.66%), and 1.53–100% (5.65–100%) for different urban–rural groups, as measured by urban–rural difference series (change rate of precipitation extremes). Overall, a higher contribution of urbanization to the changes in precipitation extremes was found in the urbanized areas, indicating that the urbanization effects may be related to the levels of urbanization. Although the UC values were larger than 100% for a few indices (e.g., CDD and CWD), most of them were less than 50%. These results, in a sense, confirm that rapid urbanization could cause changes in precipitation extremes at a regional or local scale, which has been reported previously [57,58]. However, it should be noted that urbanization may show only a limited role in the changes in precipitation extremes, which are also influenced by climate factors, geographical factors, anthropogenic factors, and so on. Moreover, there is uncertainty regarding the contributions of urbanization to precipitation extremes for different indices and control groups, indicating that urbanization-induced changes in precipitation extremes are complicated and need further investigation in the future.
3.5. Discussion
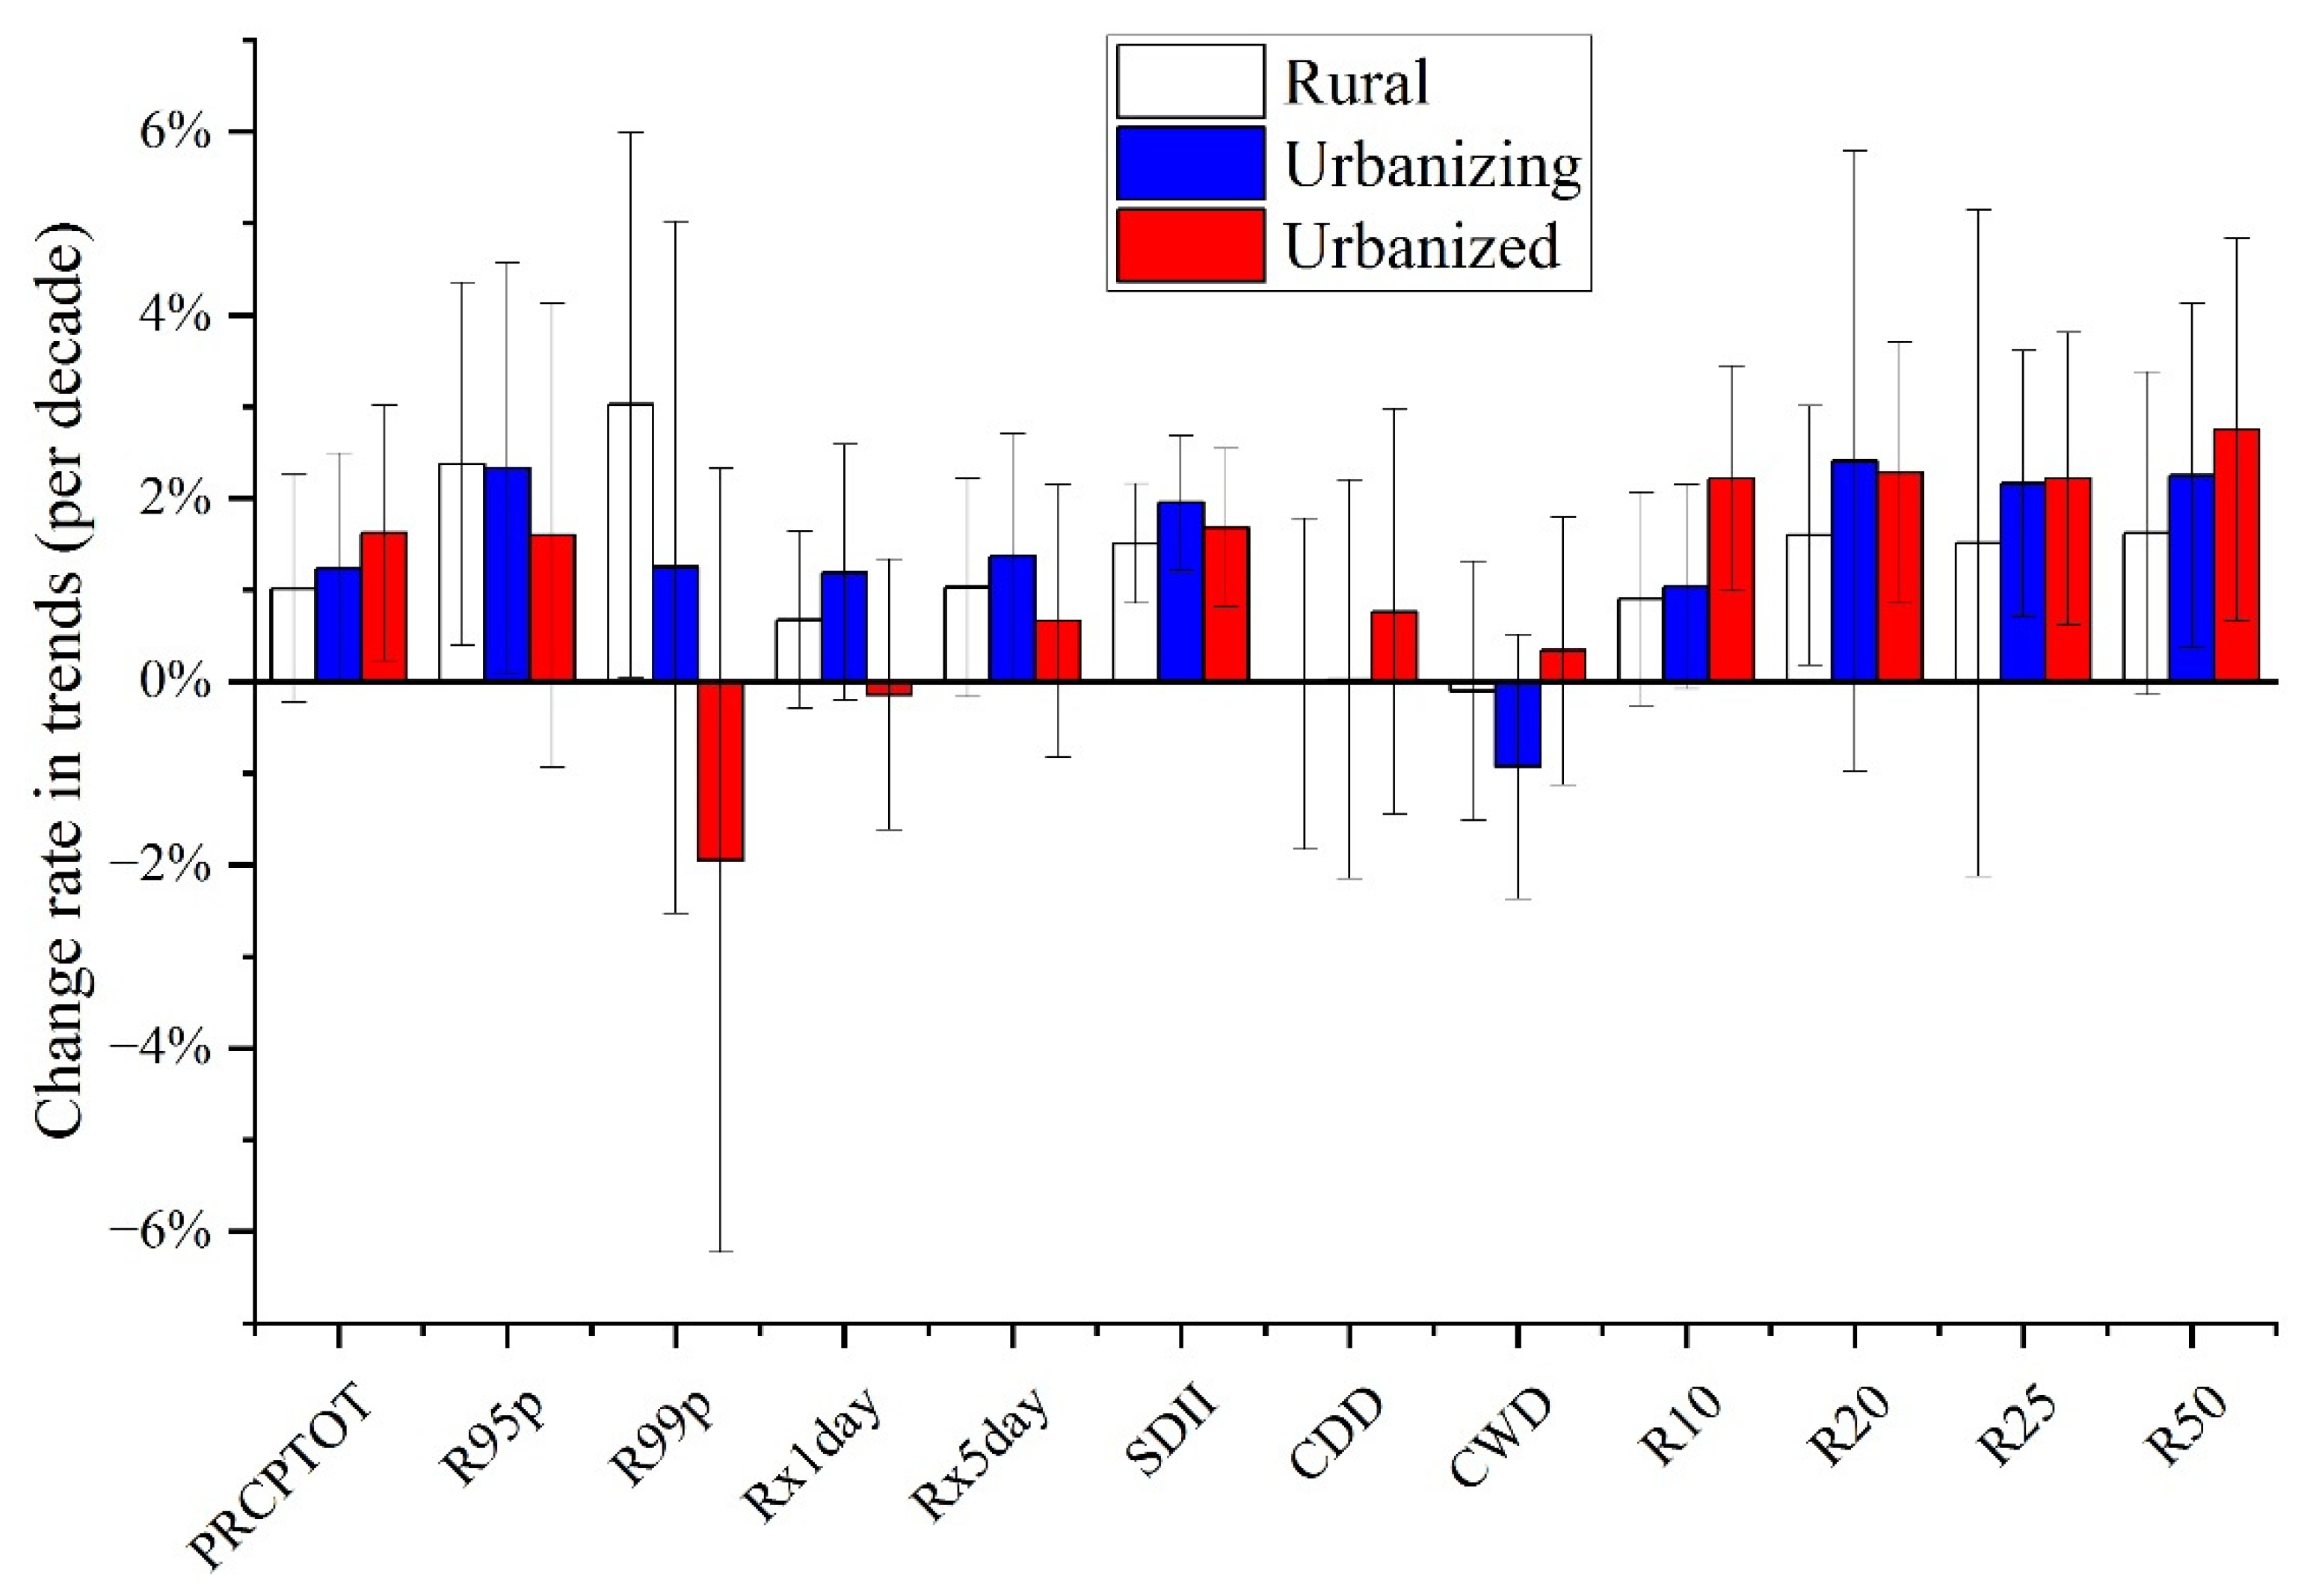
Precipitation extremes have increased globally in frequency, intensity, and extent over the past decades [59,60,61]. However, there were no consistent conclusions for regional and/or local scales, with results varying according to region due to heterogeneous terrain and climate conditions. Here, we examined the spatiotemporal changes in precipitation extremes using homogenized daily precipitation records from 58 meteorological stations over the PRD. In this work, twelve indices defined by the ETCCDI, including the features of amount, frequency, and intensity, were selected to represent precipitation extremes, and have been widely used to continuously improve perspectives on changes in climate extremes [61]. Our work provides additional evidence to supplement previous studies on the variations of precipitation extremes over the PRD [54,62], GBA [29,56,63] and Guangdong province [64], with insignificant increases for most extreme precipitation indices. The primary difference is that our findings mainly focus on the changes in precipitation extremes for various stations (e.g., rural, urbanizing, and urbanized stations), to exhaustively examine the spatial variations of precipitation extremes due to anthropogenic forcing. Our results highlight that the increases in precipitation extremes (except for R95p, R99p, Rx1day and Rx5day) in urban areas are higher than those in rural areas, as shown in Figure 10, suggesting that rapid urbanization may intensify the variability of precipitation extremes. The results also affirm current understanding that urbanization exerts an indelible influence on the changes in precipitation extremes over the PRD.
Substantial evidence shows that global urbanization leads to an increase in urban precipitation amount and heavy precipitation events in wet and dry regions, especially for extreme precipitation [59,60]. The PRD, one of China’s main economic centers and situated in one of the world’s most disaster-prone regions, has experienced rapid urbanization over the past few decades [4,65]. Previous studies have found that there is stronger and more frequent extreme precipitation induced by urban expansion over the PRD [35]. That is, PRD urban locations tend to see faster-increasing trends of extreme precipitation frequency and higher extreme precipitation intensity. As Li et al. [66] mentioned, human influence, e.g., rapid urbanization, is likely to cause the intensification of precipitation extremes over China. Our findings provide additional evidence to improve understanding of urbanization’s role in the changes in precipitation extremes. Moreover, we also found that the effect of urbanization on extreme precipitation is tied to different urbanization processes. Urbanization has a limited effect on extreme precipitation during low-level urbanization, and vice versa, which is consistent with the previous findings of Jiang et al. [67] and Kang et al. [68]. Certainly, the effects of urbanization on precipitation extremes are complicated, due to the involvement of various dynamical and thermodynamic processes [54]. Generally, four major mechanisms [58], namely, UHI, urban surface roughness, urban aerosol effect, and urban landscape, occur simultaneously and interact with many other environmental factors, impeding a comprehensive assessment of the urban rainfall effect, and urging further studies to improve our understanding of urbanization’s role in precipitation extremes.
Overall, our findings based on the urban–rural comparative analyses in observation data are a relatively convenient and easy-to-interpret assessment of the contribution of urbanization to the changes in precipitation extremes. Generally, this method is feasible for the regions with high-density observation gauges because these dense stations can better capture the variations of precipitation extremes. Of course, there are several shortcomings to the proposed method. Firstly, the weighted-average method was used to identify the urban–rural differences, which may have weakened interpretation of the contribution of urbanization to precipitation extremes because the urbanization effects showed obvious local-scale features. Secondly, as we all know, the role of urbanization in precipitation extremes is associated with many factors, such as geographical and climate context, spatial and temporal scale, precipitation type, and so on. Thus, it should be noted that statistical analyses are unable to clarify the complex physical mechanism of urban-induced changes in precipitation extremes, although the quantitative results may help us to understand the possible role of urbanization in precipitation changes. Therefore, to obtain more insight into the underlying physical processes of urbanization’s effects on extreme precipitation, climate-model-based dynamic experiments together with a refined analysis of high-resolution observation data are needed for future research.
4. Conclusions
This study examined the spatiotemporal variations of precipitation extremes over the PRD from 1961 to 2017 using a homogenized daily precipitation dataset, and investigated the effects of urbanization on these changes. Here, we presented a statistical method to examine the possible contribution of urbanization to these changes in precipitation extremes through urban–rural comparative analysis. Our results show that most of the extreme precipitation indices in the PRD experience gradual increasing trends, with a larger magnitude in the urban areas, indicating that urbanization serves as a regulator to accelerate the increases or decelerate the decreases caused by the other factors (e.g., climate change). That is, urbanization could induce the intensification of extreme precipitation, with a higher amount, intensity, and frequency of precipitation extremes and a larger magnitude of their trends occurring in urban areas by comparison with those rural areas. Spatially, urbanization plays a small role in altering the spatial patterns in precipitation extremes, mainly influenced by the terrain and other geographical environment drivers. However, urbanization may induce greater variations in the distribution of precipitation extremes, with the high values tending to occur in urban areas. Moreover, our findings also indicate that high-level urbanization tends to have a higher contribution to the temporal changes in precipitation extremes, suggesting that urbanization’s effects on precipitation extremes may be related to urbanization levels. In summary, our findings provide additional information and evidence on the important role of urbanization in precipitation extremes over the PRD, and offer insights into the feedback of anthropogenic changes into variations in precipitation extremes. Furthermore, the relationships between urbanization and precipitation extremes are extremely complicated, and also need further investigation in the future.
Supplementary Materials
The following are available online at https://www.mdpi.com/article/10.3390/w14162466/s1: Table S1: Information for meteorological stations.
Author Contributions
Conceptualization, X.S. and J.Z.; methodology, X.S.; formal analysis, X.S. and J.Q.; investigation, X.Z. and J.Q.; resources, X.S. and C.L.; writing—original draft preparation, X.S.; writing—review and editing, X.S., J.Q., X.Z., J.Z. and C.L.; funding acquisition, X.S. All authors have read and agreed to the published version of the manuscript.
Funding
This research was funded by the National Natural Science Foundation of China (No. 51979271), the Natural Science Foundation of Jiangsu Province of China (No. BK20211247), the China Postdoctoral Science Foundation (No. 2018M632333), and the Open Foundation of State Key Laboratory of Hydrology-Water Resources and Hydraulic Engineering (No. 2015490411).
Institutional Review Board Statement
Not applicable.
Informed Consent Statement
Not applicable.
Data Availability Statement
The population and land use data from 1990 and 2015 with a spatial resolution of 1 × 1 km are from the Resource and Environment Science and Data Center, Chinese Academy of Sciences (https://www.resdc.cn/DOI/DOI.aspx?DOIid=32 for population data and http://www.resdc.cn/data.aspx?DATAID=98 for land use data, accessed on 1 March 2022), and the night-time light data in 1992 and 2013 are from the Defense Meteorological Satellite Program’s Operational LineScan System (https://ngdc.noaa.gov/eog/dmsp/downloadV4composites.html, accessed on 1 March 2022). The raw daily precipitation records were obtained from the China Meteorological Administration (CMA), but these data are no longer publicly available (http://data.cma.cn/, accessed on 1 December 2021) as they are part of a proprietary dataset. The processed dataset of precipitation extremes in this study is available from the corresponding author upon reasonable request.
Acknowledgments
We greatly appreciate the editor and reviewers for their insightful comments.
Conflicts of Interest
The authors declare no conflict of interest.
References
- Grimm, N.B.; Faeth, S.H.; Golubiewski, N.E.; Redman, C.L.; Wu, J.G.; Bai, X.M.; Briggs, J.M. Global change and the ecology of cities. Science 2008, 319, 756–760. [Google Scholar] [CrossRef] [PubMed] [Green Version]
- Song, X.M.; Zhang, J.Y.; AghaKouchak, A.; Sen Roy, S.; Xuan, Y.Q.; Wang, G.Q.; He, R.M.; Wang, X.J.; Liu, C.S. Rapid urbanization and changes in spatiotemporal characteristics of precipitation in Beijing metropolitan area. J. Geophys. Res. Atmos. 2014, 119, 11250–11271. [Google Scholar] [CrossRef] [Green Version]
- Zhang, Y.Y.; Pang, X.; Xia, J.; Shao, Q.X.; Yu, E.; Zhao, T.; She, D.; Sun, J.; Yu, J.; Pan, X.; et al. Regional patterns of extreme precipitation and urban signatures in metropolitan areas. J. Geophys. Res. Atmos. 2019, 124, 641–663. [Google Scholar] [CrossRef]
- Zhang, H.; Wu, C.H.; Chen, W.J.; Huang, G.R. Effect of urban expansion on summer rainfall in the Pearl River Delta, South China. J. Hydrol. 2019, 568, 747–757. [Google Scholar] [CrossRef]
- Kalnay, E.; Cai, M. Impact of urbanization and land-use change on climate. Nature 2003, 423, 528–531. [Google Scholar] [CrossRef]
- Manoli, G.; Fatichi, S.; Schlapfer, M.; Yu, K.; Crowther, T.W.; Meili, N.; Burlando, P.; Katul, G.G.; Bou-Zeid, E. Magnitude of urban heat islands largely explained by climate and population. Nature 2019, 573, 55–60. [Google Scholar] [CrossRef]
- Luo, M.; Lau, N.C. Increasing Heat Stress in Urban Areas of Eastern China: Acceleration by Urbanization. Geophys. Res. Lett. 2018, 45, 13060–13069. [Google Scholar] [CrossRef]
- Zhao, N.; Jiao, Y.M.; Ma, T.; Zhao, M.M.; Fan, Z.M.; Yin, X.Z.; Liu, Y.; Yue, T.X. Estimating the effect of urbanization on extreme climate events in the Beijing-Tianjin-Hebei region, China. Sci. Total Environ. 2019, 688, 1005–1015. [Google Scholar] [CrossRef]
- Cao, Q.; Yu, D.; Georgescu, M.; Wu, J. Impacts of urbanization on summer climate in China: An assessment with coupled land-atmospehric modeling. J. Geophys. Res. Atmos. 2016, 121, 10505–10521. [Google Scholar] [CrossRef]
- Bounoua, L.; Zhang, P.; Mostovoy, G.; Thome, K.; Masek, J.; Imhoff, M.; Shepherd, M.; Quattrochi, D.; Santanello, J.; Silva, J.; et al. Impact of urbanization on US surface climate. Environ. Res. Lett. 2015, 10, 084010. [Google Scholar] [CrossRef] [Green Version]
- Chen, H.S.; Zhang, Y.; Yu, M.; Hua, W.J.; Sun, S.L.; Li, X.; Gao, C.J. Large-scale urbanization effects on eastern Asian summer monsoon circulation and climate. Clim. Dyn. 2016, 47, 117–136. [Google Scholar] [CrossRef]
- Chrysanthou, A.; van der Schrier, G.; van den Besselaar, E.J.M.; Tank, A.M.G.K.; Brandsma, T. The effects of urbanization on the rise of the European temperature since 1960. Geophys. Res. Lett. 2014, 41, 7716–7722. [Google Scholar] [CrossRef]
- Hao, L.; Sun, G.; Liu, Y.; Wan, J.; Qin, M.; Qian, H.; Liu, C.; Zheng, J.; John, R.; Fan, P.; et al. Urbanization dramatically altered the water balances of a paddy field-dominated basin in southern China. Hydrol. Earth Syst. Sci. 2015, 19, 3319–3331. [Google Scholar] [CrossRef] [Green Version]
- Ren, G.Y.; Zhou, Y.Q.; Chu, Z.Y.; Zhou, J.X.; Zhang, A.Y.; Guo, J.; Liu, X.F. Urbanization effects on observed surface air temperature trends in north China. J. Clim. 2008, 21, 1333–1348. [Google Scholar] [CrossRef] [Green Version]
- Zhou, X.F.; Chen, H. Impact of urbanization-related land use land cover changes and urban morphology changes on the urban heat island phenomenon. Sci. Total Environ. 2018, 635, 1467–1476. [Google Scholar] [CrossRef]
- Zhong, S.; Qian, Y.; Zhao, C.; Leung, R.; Yang, X.Q. A case study of urbanization impact on summer precipitation in the Greater Beijing Metropolitan Area: Urban heat island versus aerosol effects. J. Geophys. Res. Atmos. 2015, 120, 10903–10914. [Google Scholar] [CrossRef]
- Zhao, L.; Lee, X.; Smith, R.B.; Oleson, K. Strong contributions of local background climate to urban heat islands. Nature 2014, 511, 216–219. [Google Scholar] [CrossRef] [PubMed]
- Zhu, X.D.; Zhang, Q.; Sun, P.; Singh, V.P.; Shi, P.J.; Song, C.Q. Impact of urbanization on hourly precipitation in Beijing, China: Spatiotemporal patterns and causes. Glob. Planet. Chang. 2019, 172, 307–324. [Google Scholar] [CrossRef]
- Baklanov, A.; Molina, L.T.; Gauss, M. Megacities, air quality and climate. Atmos. Environ. 2016, 126, 235–249. [Google Scholar] [CrossRef]
- Yang, P.; Ren, G.Y.; Yan, P.C. Evidence for a Strong Association of Short-Duration Intense Rainfall with Urbanization in the Beijing Urban Area. J. Clim. 2017, 30, 5851–5870. [Google Scholar] [CrossRef]
- Fu, X.S.; Yang, X.Q.; Sun, X.G. Spatial and Diurnal Variations of Summer Hourly Rainfall Over Three Super City Clusters in Eastern China and Their Possible Link to the Urbanization. J. Geophys. Res.-Atmos. 2019, 124, 5445–5462. [Google Scholar] [CrossRef]
- Song, X.M.; Mo, Y.C.; Xuan, Y.Q.; Wang, Q.J.; Wu, W.Y.; Zhang, J.; Zou, X. Impacts of urbanization on precipitation patterns in the greater Beijing-Tianjin-Hebei metropolitan region in northern China. Environ. Res. Lett. 2021, 16, 014042. [Google Scholar] [CrossRef]
- Ren, G.Y.; Zhou, Y.Q. Urbanization Effect on Trends of Extreme Temperature Indices of National Stations over Mainland China, 1961–2008. J. Clim. 2014, 27, 2340–2360. [Google Scholar] [CrossRef]
- Mishra, V.; Ganguly, A.R.; Nijssen, B.; Lettenmaier, D.P. Changes in observed climate extremes in global urban areas. Environ. Res. Lett. 2015, 10, 024005. [Google Scholar] [CrossRef]
- Zhang, D.L. Rapid urbanization and more extreme rainfall events. Sci. Bull. 2020, 65, 516–518. [Google Scholar] [CrossRef] [Green Version]
- Sun, Y.; Hu, T.; Zhang, X.B.; Li, C.; Lu, C.H.; Ren, G.Y.; Jiang, Z.H. Contribution of Global warming and Urbanization to Changes in Temperature Extremes in Eastern China. Geophys. Res. Lett. 2019, 46, 11426–11434. [Google Scholar] [CrossRef] [Green Version]
- Zhang, P.F.; Ren, G.Y.; Qin, Y.; Zhai, Y.Q.; Zhai, T.L.; Tysa, S.K.; Xue, X.Y.; Yang, G.W.; Sun, X.B. Urbanization effects on estimates of global trends in mean and extreme air temperature. J. Clim. 2021, 34, 1923–1945. [Google Scholar] [CrossRef]
- Marelle, L.; Myhre, G.; Steensen, B.M.; Hodnebrog, Ø.; Alterskjær, K.; Sillmann, J. Urbanization in megacities increases the frequency of extreme precipitation events far more than their intensity. Environ. Res. Lett. 2020, 15, 124072. [Google Scholar] [CrossRef]
- Li, Y.; Wang, W.; Chang, M.; Wang, X. Impacts of urbanization on extreme precipitation in the Guangdong-Hong Kong-Macau greater bay area. Urban Clim. 2021, 38, 100904. [Google Scholar] [CrossRef]
- Singh, J.; Karmakar, S.; PaiMazumder, D.; Ghosh, S.; Niyogi, D. Urbanization alters rainfall extremes over the contiguous United States. Environ. Res. Lett. 2020, 15, 074033. [Google Scholar] [CrossRef] [Green Version]
- Sun, Y.; Zhang, X.B.; Ren, G.Y.; Zwiers, F.W.; Hu, T. Contribution of urbanization to warming in China. Nat. Clim. Chang. 2016, 6, 706–709. [Google Scholar] [CrossRef]
- Wang, F.; Ge, Q.S.; Wang, S.W.; Li, Q.X.; Jones, P.D. A New Estimation of Urbanization’s Contribution to the Warming Trend in China. J. Clim. 2015, 28, 8923–8938. [Google Scholar] [CrossRef]
- Zhao, D.; Wu, J. Comparisons of urban-related warming in Beijing using different methods to calculate the daily mean temperature. Sci. China Earth Sci. 2019, 62, 693–702. [Google Scholar] [CrossRef]
- Lin, L.; Gao, T.; Luo, M.; Ge, E.; Yang, Y.; Liu, Z.; Zhao, Y.; Ning, G. Contribution of urbanization to the changes in extreme climate events in urban agglomerations across China. Sci. Total Environ. 2020, 744, 140264. [Google Scholar] [CrossRef]
- Chen, S.; Li, W.; Du, Y.; Mao, C.; Zhang, L. Urbanization effect on precipitation over the Pearl River Delta based on CMORPH data. Adv. Clim. Chang. Res. 2015, 6, 16–22. [Google Scholar] [CrossRef]
- Wang, D.; Jiang, P.; Wang, G.; Wang, D. Urban extent enhances extreme precipitation over the Pearl River Delta, China. Atmos. Sci. Lett. 2015, 16, 310–317. [Google Scholar] [CrossRef]
- Yan, M.; Chan, J.; Zhao, K. Impacts of urbanization on the precipitation characteristics in Guangdong Province, China. Adv. Atmos. Sci. 2020, 37, 696–706. [Google Scholar] [CrossRef]
- Hu, C.; Fung, K.Y.; Tam, C.Y.; Wang, Z. Urbanization impacts on Pearl River Delta extreme rainfall sensitivity to land cover change versus anthropogenic heat. Earth Space Sci. 2021, 8, e2020EA001536. [Google Scholar] [CrossRef]
- Fung, K.Y.; Tam, C.Y.; Lee, T.C.; Wang, Z.Q. Comparing the influence of global warming and urban anthropogenic heat on extreme precipitation in urbanized Pearl River Delta area based on dynamical downscaling. J. Geophys. Res. Atmos. 2021, 126, e2021JD035047. [Google Scholar] [CrossRef]
- Holst, C.; Tam, C.; Chan, J. Sensitivity of urban rainfall to anthropogenic heat flux: A numerical experiment. Geophys. Res. Lett. 2016, 43, 2240–2248. [Google Scholar] [CrossRef] [Green Version]
- Su, C.; Chen, X. Covariates for nonstationary modeling of extreme precipitation in the Pearl River Basin, China. Atmos. Res. 2019, 229, 224–239. [Google Scholar] [CrossRef]
- Zou, X.; Song, X.; Liu, C.; Zhang, C. Spatiotemporal changes of precipitation characteristics in the Pearl River Delta region during flood season. Water Resour. Hydropower Eng. 2021, 52, 21–32. [Google Scholar] [CrossRef]
- Chen, X.; Zhang, H.; Chen, W.; Huang, G. Urbanization and climate change impacts on future flood risk in the Pearl River Delta under shared socioeconomic pathways. Sci. Total Environ. 2021, 762, 143144. [Google Scholar] [CrossRef] [PubMed]
- Song, X.; Zou, X.; Zhang, C.; Zhang, J.; Kong, F. Multiscale spatiotemporal changes of precipitation extremes in Beijing-Tianjin-Hebei region, China during 1958–2017. Atmosphere 2019, 10, 462. [Google Scholar] [CrossRef] [Green Version]
- Song, X.; Zou, X.; Mo, Y.; Zhang, J.; Zhang, C.; Tian, Y. Nonstationary Bayesian modeling of precipitation extremes in the Beijing-Tianjin-Hebei region, China. Atmos. Res. 2020, 242, 105006. [Google Scholar] [CrossRef]
- Yang, X.; Leung, L.R.; Zhao, N.; Zhao, C.; Qian, Y.; Hu, K.; Liu, X.; Chen, B. Contribution of urbanization to the increase of extreme heat events in an urban agglomeration in east China. Geophys. Res. Lett. 2017, 44, 6940–6950. [Google Scholar] [CrossRef]
- Khoi, D.N.; Quan, N.T.; Nhi, P.T.T.; Nguyen, V.T. Impact of climate change on precipitation extremes over Ho Chi Minh City, Vietnam. Water 2021, 13, 120. [Google Scholar] [CrossRef]
- Abbas, F.; Farooque, A.; Afzaal, H. Homogeneity in patterns of climate extremes between two cities—A potential for flood planning in relation to climate change. Water 2020, 12, 782. [Google Scholar] [CrossRef] [Green Version]
- Liao, W.; Liu, X.; Li, D.; Luo, M.; Wang, D.; Wang, S.; Baldwin, J.; Lin, L.; Li, X.; Feng, K.; et al. Stronger contributions of urbanization to heat wave trends in wet climates. Geophys. Res. Lett. 2018, 45, 11310–11317. [Google Scholar] [CrossRef] [Green Version]
- Wu, M.; Luo, Y.; Chen, F.; Wong, W. Observed link of extreme hourly precipitation changes to urbanization over coastal South China. J. Appl. Meteorol. Climatol. 2019, 58, 1799–1819. [Google Scholar] [CrossRef]
- Felix, M.L.; Kim, Y.; Choi, M.; Kim, J.; Do, X.K.; Nguyen, T.H.; Jung, K. Detailed trend analysis of extreme climate indices in the Upper Geum River Basin. Water 2021, 13, 3171. [Google Scholar] [CrossRef]
- Gulakhmadov, A.; Chen, X.; Gulahmadov, N.; Liu, T.; Davlyatov, R.; Sharofiddinov, S.; Gulahmadov, M. Long-term hydroclimatic trends in the mountainous Kofarnihon River basin in Central Asia. Water 2020, 12, 2140. [Google Scholar] [CrossRef]
- Zeng, Z.; Wu, W.; Li, Y.; Zhou, Y.; Zhang, Z.; Zhang, S.; Guo, Y.; Huang, H.; Li, Z. Spatiotemporal variations in drought and wetness from 1965 to 2017 in China. Water 2020, 12, 2097. [Google Scholar] [CrossRef]
- Zou, X.; Song, X.; Liu, C. Spatiotemporal changes of extreme precipitation in the Pearl River Delta region. Hydro-Sci. Eng. 2022; in press. [Google Scholar] [CrossRef]
- Wang, X.; Liao, J.; Zhang, J.; Shen, C.; Chen, W.; Xia, B.; Wang, T. A numeric study of regional climate change induced by urban expansion in the Pearl River Delta, China. J. Appl. Meteorol. Climatol. 2014, 53, 346–362. [Google Scholar] [CrossRef]
- Li, X.; Wei, Z.; Wang, H.; Ma, L.; Guo, S. Variations in precipitation extremes over the Guangdong-Hong Kong-Macao Greater Bay Area in China. Theor. Appl. Climatol. 2022, 147, 381–394. [Google Scholar] [CrossRef]
- Gu, X.; Zhang, Q.; Singh, V.P.; Song, C.; Sun, P.; Li, J. Potential contributions of climate change and urbanization to precipitation trends across China at national, regional and local scales. Int. J. Climatol. 2019, 39, 2998–3012. [Google Scholar] [CrossRef]
- Qian, Y.; Chakraborty, T.C.; Li, J.; Li, D.; He, C.; Sarangi, C.; Chen, F.; Yang, X.; Leung, L.R. Urbanization impact on regional climate and extreme weather: Current understanding, uncertainties, and future research directions. Adv. Atmos. Sci. 2022, 39, 819–860. [Google Scholar] [CrossRef]
- Donat, M.; Lowry, A.; Alexander, L.; O’Gorman, P.; Maher, N. More extreme precipitation in the world’s dry and wet regions. Nat. Clim. Chang. 2016, 6, 508–513. [Google Scholar] [CrossRef]
- Min, S.; Zhang, X.; Zwiers, F.; Hegerl, G. Human contribution to more-intense precipitation extremes. Nature 2011, 470, 378–381. [Google Scholar] [CrossRef]
- Dunn, R.; Alexander, L.; Donat, M.; Zhang, X.; Bador, M.; Herold, N.; Lippmann, T.; Allan, R.; Aguilar, E.; Barry, A.A.; et al. Development of an updated global land in situ-based data set of temperature and precipitation extremes: HadEX3. J. Geophy. Res.-Atmos. 2020, 1225, e2019JD032263. [Google Scholar] [CrossRef]
- Huang, G.; Chen, Y.; Yao, Z. Spatial and temporal evolution characteristics of extreme rainfall in the Pearl River Delta under high urbanization. Adv. Water Sci. 2021, 32, 161–170. [Google Scholar] [CrossRef]
- Wang, Y.; Han, Z.; Gao, Y. Changes of extreme high temperature and heavy precipitation in the Guangdong-Hong Kong-Macao Greater Bay Area. Geomat. Nat. Hazards Risks 2021, 12, 1101–1126. [Google Scholar] [CrossRef]
- Jia, J.; Long, X. Study on spatio-temporal distribution characteristics of extreme precipitation in Guangdong province. Water Resour. Hydropower Eng. 2018, 49, 43–51. [Google Scholar] [CrossRef]
- Xu, S.; Sun, Y.; Zhao, S. Contemporary urban expansion in the first fastest growing metropolitan region of China: A multicity study in the Pearl River Delta urban agglomeration from 1980 to 2015. Urban Sci. 2021, 5, 11. [Google Scholar] [CrossRef]
- Li, H.; Chen, H.; Wang, H. Effects of anthropogenic activity emerging as intensified extreme precipitation over China. J. Geophys. Res.-Atmos. 2017, 122, 6899–6914. [Google Scholar] [CrossRef]
- Jiang, P.; Wang, D.; Cao, Y. Spatiotemporal characteristics of precipitation concentration and their possible links to urban extent in China. Theor. Appl. Climatol. 2016, 123, 757–768. [Google Scholar] [CrossRef]
- Kang, C.; Luo, Z.; Zong, W.; Hua, J. Impacts of urbanization on variations of extreme precipitation over the Yangtze River Delta. Water 2021, 13, 150. [Google Scholar] [CrossRef]
Figure 1.
(a) Location of the PRD metropolitan area in China; (b) the spatial distribution of meteorological stations used in this study (the number listed in Table S1); (c) the spatial distribution of annual mean precipitation in the PRD during 1961–2017; (d–f) the results of rural, urbanizing and urbanized stations from the land-use, population, and night-time light data, respectively.

Figure 2.
Trends of annual averaged extreme precipitation indices for rural, urbanizing, and urbanized areas over the PRD during 1961–2017. Red solid lines mean linear trends for all the indices during 1961–2017, and black and blue dashed lines are linear trends during 1961–1990 and 1991–2017, respectively, with the number being the slope of trends. The asterisk symbol means a significant increase or decrease at the 0.05 level.

Figure 3.
Trends of extreme precipitation series for rural, urbanizing, and urbanized areas with different methods.
Figure 3.
Trends of extreme precipitation series for rural, urbanizing, and urbanized areas with different methods.

Figure 4.
Spatial patterns of extreme precipitation indices and their linear trends over the PRD during 1961–2017, 1961–1990 and 1991–2017, respectively. Black crossings with circles denote a significant trend at the 95% confidence level.
Figure 4.
Spatial patterns of extreme precipitation indices and their linear trends over the PRD during 1961–2017, 1961–1990 and 1991–2017, respectively. Black crossings with circles denote a significant trend at the 95% confidence level.


Figure 5.
Probability density functions of extreme precipitation indices for the rural (black line), urbanizing (blue line), and urbanized (red line) areas over the PRD metropolitan region during 1961–2017. The dashed lines represent the mean values of extreme precipitation indices for different parts during 1961–2017. The p values indicate whether the differences in the two distributions for precipitation extremes are significant, based on the two-sample Kolmogorov–Smirnov test. The p1 value is estimated based on the rural and urbanizing series, p2 on the rural and urbanized series, and p3 on the urbanizing and urbanized series.

Figure 6.
Boxplots of normalized trends (% per decade) in precipitation extremes for rural, urbanizing, and urbanized areas from 1961 to 2017. The solid squares represent the mean values in trends, and the lines in the box mean the 25%, 50%, and 75% values of normalized trends.
Figure 6.
Boxplots of normalized trends (% per decade) in precipitation extremes for rural, urbanizing, and urbanized areas from 1961 to 2017. The solid squares represent the mean values in trends, and the lines in the box mean the 25%, 50%, and 75% values of normalized trends.

Figure 7.
Probability density functions of normalized trends in precipitation extremes for rural, urbanizing, and urbanized areas during 1961–2017. The p values indicate whether the differences in the two distributions for precipitation extremes are significant or not based on the two-sample Kolmogorov–Smirnov test. The p1 value is estimated based on the rural and urbanizing series, p2 on the rural and urbanized series, and p3 on the urbanizing and urbanized series.

Figure 8.
Magnitude (box plots) and probability density functions of normalized trends in precipitation extremes during 1961–2017, 1961–1990, and 1991–2017. The p values indicate whether the differences in the two distributions (1961–1990 and 1991–2017) for change rates of trends in precipitation extremes are significant, based on the two-sample Kolmogorov–Smirnov test.

Figure 9.
Trends of urban–rural differences in precipitation extremes over the PRD during 1961–2017. The sign * denotes a significant trend at the 0.05 level.
Figure 9.
Trends of urban–rural differences in precipitation extremes over the PRD during 1961–2017. The sign * denotes a significant trend at the 0.05 level.


Figure 10.
Error bars for the scaling trends of precipitation extremes over the PRD during 1961–2017 (unit: % per decade).
Figure 10.
Error bars for the scaling trends of precipitation extremes over the PRD during 1961–2017 (unit: % per decade).


Table 1.
Definitions of extreme precipitation indices used in this study.
| Index | Definition | Unit |
|---|---|---|
| PRCPTOT | Annual total precipitation with precipitation ≥1 mm | mm |
| R95p | Annual total precipitation when precipitation >95% percentile | mm |
| R99p | Annual total precipitation when precipitation >99% percentile | mm |
| Rx1day | Maximum 1-day precipitation value | mm |
| Rx5day | Maximum 5-day precipitation value | mm |
| SDII | Mean precipitation intensity of days with precipitation ≥1 mm | mm/day |
| CDD | Maximum number of consecutive days with precipitation <1 mm | day |
| CWD | Maximum number of consecutive days with precipitation ≥1 mm | day |
| R10 | Number of days with precipitation ≥10 mm | day |
| R20 | Number of days with precipitation ≥20 mm | day |
| R25 | Number of days with precipitation ≥25 mm | day |
| R50 | Number of days with precipitation ≥50 mm | day |
Table 2.
Statistical results of trends in precipitation extremes over the PRD.
| Index | Magnitude of Trends * | Increasing Trends # | Decreasing Trend | No Changes | ||||
|---|---|---|---|---|---|---|---|---|
| 1961–2017 | 1961–1990 | 1991–2017 | Significant | Not Significant | Significant | Not Significant | ||
| PRCPTOT | 21.56 ± 24.68 | 15.83 ± 43.22 | 20.86 ± 78.69 | 6 (0, 1) | 43 (35, 37) | 0 (0, 0) | 9 (23, 20) | 0 (0, 0) |
| R95p | 11.84 ± 20.27 | −9.91 ± 43.28 | 3.36 ± 69.90 | 6 (0, 1) | 29 (24, 35) | 0 (0, 2) | 23 (34, 20) | 0 (0, 0) |
| R99p | 3.41 ± 17.92 | −10.49 ± 37.97 | −1.95 ± 43.73 | 3 (1, 1) | 26 (20, 30) | 1 (0, 3) | 28 (37, 24) | 0 (0, 0) |
| Rx1day | 1.66 ± 5.14 | −1.06 ± 12.70 | 2.03 ± 13.98 | 4 (2, 3) | 29 (21, 33) | 1 (1, 1) | 24 (34, 21) | 0 (0, 0) |
| Rx5day | 3.27 ± 7.49 | −5.05 ± 17.90 | 4.46 ± 24.10 | 8 (0, 1) | 28 (18, 33) | 0 (2, 2) | 22 (38, 22) | 0 (0, 0) |
| SDII | 1.20 ± 0.18 | 0.92 ± 0.38 | 1.21 ± 0.68 | 13 (0, 3) | 43 (28, 40) | 0 (0, 1) | 2 (30, 14) | 0 (0, 0) |
| CDD | 0.96 ± 0.57 | 3.24 ± 2.50 | −1.18 ± 2.13 | 0 (1, 0) | 30 (47, 8) | 0 (0, 0) | 26 (10, 50) | 2 (0, 0) |
| CWD | 0.94 ± 0.24 | 0.49 ± 0.52 | 0.63 ± 0.62 | 1 (0, 0) | 28 (10, 17) | 2 (2, 3) | 27 (46, 38) | 0 (0, 0) |
| R10 | 1.50 ± 0.61 | 1.79 ± 1.07 | 1.49 ± 1.54 | 4 (0, 2) | 44 (49, 36) | 0 (0, 0) | 10 (9, 20) | 0 (0, 0) |
| R20 | 1.45 ± 0.44 | 1.54 ± 0.89 | 1.63 ± 1.20 | 10 (0, 3) | 43 (42, 41) | 0 (0, 0) | 5 (16, 14) | 0 (0, 0) |
| R25 | 1.37 ± 0.37 | 1.36 ± 0.71 | 1.57 ± 1.16 | 6 (0, 3) | 44 (39, 38) | 0 (0, 0) | 7 (19, 17) | 1 (0, 0) |
| R50 | 1.10 ± 0.23 | 0.92 ± 0.49 | 1.06 ± 0.71 | 7 (0, 0) | 34 (25, 36) | 0 (0, 0) | 16 (33, 22) | 1 (0, 0) |
* Note: The values represent mean ± standard deviation of trends in precipitation extremes per decade. # Note: The values mean the number of stations with increasing or decreasing trends in precipitation extremes during 1961–2017 (1961–1990 and 1991–2017).
Table 3.
Results of urbanization effect and contribution based on the urban–rural difference series.
Table 3.
Results of urbanization effect and contribution based on the urban–rural difference series.
| Index | Urbanizing vs. Rural | Urbanized vs. Rural | Urbanized vs. Urbanizing | Mean UC/% | |||
|---|---|---|---|---|---|---|---|
| UED | UCD /% | UED | UCD/% | UED | UCD/% | ||
| PRCPTOT | 13.86 mm | 15.55 | 62.71 mm | 52.36 | 48.85 mm | 100 * | 55.97 |
| R95p | 7.99 mm | 15.87 | 33.51 mm | 32.65 | 25.52 mm | 48.82 | 32.45 |
| R99p | −2.49 mm | 12.47 | −1.80 mm | 4.76 | 0.69mm | 3.85 | 3.85 |
| Rx1day | 3.41 mm | 19.62 | 3.02 mm | 7.06 | −0.39 mm | 1.53 | 13.34 |
| Rx5day | 2.85 mm | 11.71 | 7.89 mm | 12.25 | 5.04 mm | 12.58 | 12.18 |
| SDII | 0.33 mm/day | 29.87 | 0.65 mm/day | 20.30 | 0.32 mm/day | 15.33 | 21.83 |
| CDD | −1.03 day | 35.50 | 2.59 day | 45.11 | 3.62 day | 100 * | 72.56 |
| CWD | −0.26 day | 100 * | −0.04 day | 3.56 | 0.23 day | 26.27 | 63.14 |
| R10 | −0.09 day | 37.29 | 1.34 day | 39.75 | 1.43 day | 39.59 | 39.67 |
| R20 | 0.33 day | 27.99 | 0.62 day | 100 * | 0.29 day | 47.47 | 58.49 |
| R25 | 0.28 day | 18.97 | 0.48 day | 32.39 | 0.19 day | 100 * | 50.45 |
| R50 | 0.12 day | 9.67 | 0.74 day | 31.75 | 0.62 day | 56.10 | 32.51 |
| Mean | -- | 27.69 | -- | 37.36 | -- | 50.00 | |
* Note: If UC > 100%, it means that the extra influence factors are not identified, and we set it to 100% in this study.
Table 4.
Results of urbanization effect and contribution based on the change rate of trends in precipitation extremes.
Table 4.
Results of urbanization effect and contribution based on the change rate of trends in precipitation extremes.
| Index | Urbanizing vs. Rural | Urbanized vs. Rural | Urbanized vs. Urbanizing | Mean UC/% | |||
|---|---|---|---|---|---|---|---|
| UEΔR | UCΔR/% | UEΔR | UCΔR/% | UEΔR | UCΔR/% | ||
| PRCPTOT | 0.006 | 18.07 | 0.033 | 53.44 | 0.026 | 43.17 | 38.23 |
| R95p | 0.008 | 8.35 | 0.047 | 35.50 | 0.039 | 29.63 | 24.49 |
| R99p | −0.030 | 32.47 | −0.035 | 39.96 | −0.005 | 5.65 | 26.03 |
| Rx1day | 0.023 | 56.17 | 0.014 | 43.99 | −0.009 | 27.81 | 42.66 |
| Rx5day | 0.008 | 16.37 | 0.020 | 32.37 | 0.012 | 19.13 | 22.62 |
| SDII | 0.018 | 26.87 | 0.028 | 37.25 | 0.011 | 14.20 | 26.11 |
| CDD | −0.024 | 100 * | 0.063 | 60.66 | 0.086 | 100 * | 86.89 |
| CWD | −0.027 | 100 * | 0.001 | 1.57 | 0.028 | 64.76 | 55.44 |
| R10 | −0.002 | 8.34 | 0.032 | 55.32 | 0.034 | 58.76 | 40.81 |
| R20 | 0.010 | 19.26 | 0.022 | 34.24 | 0.012 | 18.56 | 24.02 |
| R25 | 0.010 | 16.71 | 0.019 | 27.93 | 0.009 | 13.47 | 19.37 |
| R50 | 0.007 | 10.27 | 0.073 | 55.96 | 0.067 | 50.92 | 39.05 |
| Mean | -- | 34.41 | -- | 39.85 | -- | 37.17 | |
* Note: If UC > 100%, it means that the extra influence factors were not identified, and we set it to 100% in this study.
Publisher’s Note: MDPI stays neutral with regard to jurisdictional claims in published maps and institutional affiliations. |
© 2022 by the authors. Licensee MDPI, Basel, Switzerland. This article is an open access article distributed under the terms and conditions of the Creative Commons Attribution (CC BY) license (https://creativecommons.org/licenses/by/4.0/).
Share and Cite
MDPI and ACS Style
Song, X.; Qi, J.; Zou, X.; Zhang, J.; Liu, C. Potential Effects of Urbanization on Precipitation Extremes in the Pearl River Delta Region, China. Water 2022, 14, 2466. https://doi.org/10.3390/w14162466
AMA Style
Song X, Qi J, Zou X, Zhang J, Liu C. Potential Effects of Urbanization on Precipitation Extremes in the Pearl River Delta Region, China. Water. 2022; 14(16):2466. https://doi.org/10.3390/w14162466
Chicago/Turabian StyleSong, Xiaomeng, Jiachen Qi, Xianju Zou, Jianyun Zhang, and Cuishan Liu. 2022. "Potential Effects of Urbanization on Precipitation Extremes in the Pearl River Delta Region, China" Water 14, no. 16: 2466. https://doi.org/10.3390/w14162466
Note that from the first issue of 2016, this journal uses article numbers instead of page numbers. See further details here.