1. Introduction
Many islands in the subtropical south Pacific are at increasing risk of drought, and the consensus among global climate models is that the future climate will be drier [
1]. Humans’ dependence on potable water and the remoteness and isolation of many of these islands makes it important to have strategies in place to support communities to effectively prevent, prepare for, respond to and recover from ‘water emergencies’.
Norfolk Island, a 35.7 km
2 subtropical island in the Pacific Ocean approximately 1500 km southeast of Brisbane, Australia, is one such island. Like many small islands, Norfolk Island has no reticulated water supply, and it is the responsibility of residents and business owners to capture and store their own water. Approximately 95% of households on Norfolk Island rely primarily on rainwater tanks for their potable water [
2], and when their rainwater reserves are depleted, most replenish reserves using groundwater sourced from a well or bore or from commercial water carters who operate on the island. However, the potential for some residents of the island being unable to replenish their rainwater tanks using groundwater was recently highlighted in a companion paper [
3], which calculated that groundwater levels had fallen between 5 and 20 m across different parts of the island and that 37% of the 565 registered wells and bores across the island were now dry. Importantly, the authors showed how long-term reductions in mean annual rainfall and to a lesser extent change in land use had resulted in proportionally much larger reductions in observed streamflow and modelled potential groundwater recharge. While such a phenomenon has been observed in southern Australia [
4,
5,
6], Hughes et. al [
3] was the first study to document its occurrence on a subtropical island.
In 2019, the Emergency Management Norfolk Island identified that as a result of a reduction in long-term mean annual rainfall, a significant proportion of the Norfolk Island community could potentially run out of potable water and be unable to replenish their supplies. This concern was realised only one year later when following an extended ‘drought’ in the summer of 2019/2020, the Australian Government Department of Infrastructure requested the Australian Defence Force (ADF) to mobilise a temporary reverse osmosis (RO) desalination plant to Norfolk Island. Between 7 February and 11 March 2020, the plant produced about 2 million litres of potable water for residents and businesses and Norfolk Island Council operations.
The serious consequences of drought or extended dry periods occurring on remote small islands have resulted in a number of investigations of aspects of the water resources of small islands [
7,
8]. With many island communities lacking reticulated water supply, studies have commonly examined rainwater and the depletion of fresh groundwater resources beneath small coral islands and atolls [
7,
8]. The geomorphic setting of these islands is such that they are typically underlain by freshwater lenses, which are particularly susceptible to seawater intrusion, arising from groundwater extraction, reductions in rainfall and shoreline recession due to long-term sea level rise [
7]. Surprisingly, no studies were identified that reported on quantitative investigations comparing multiple engineered interventions to mitigate the consequences of extended dry spells on potable water supplies. Rather, the response of Pacific Island authorities and funding partners to ‘drought proof’ their communities has been to commission desalination plants, with little evidence of quantitative evaluation of how desalination may compare to other intervention options. The nearest such study was by the authors of [
7], who, based on surveys and observations, qualitatively discussed the potential benefits and impacts of rainwater, RO, groundwater and austere water usage behaviour on the island atolls of the Republic of the Marshall Islands. Interest in the potential of intervention options other than desalination arises from the mixed success of desalination on the Pacific Islands and the high cost of energy to power the plants.
With concern that similar and possibly even drier situations may reoccur on Norfolk Island in the near future, this study seeks to test the hypothesis that desalination is financially the most viable option to meet the water security needs of the community.
In doing so, the results of this study will (1) guide other island communities on the likely financial viability and social considerations of a wide variety of intervention options on their island, (2) document a method that other remote and island communities can use to consistently evaluate potential intervention options and (3) calculate and report on the sensitivity of changes to yield from changes in rainfall for a wide variety of infrastructure options.
Nine options for potentially improving the resilience of Norfolk Island to extended droughts were evaluated. Seven of these options are categorised as ‘centralised’ infrastructure, designed to supply a specified quantity of potable water during a water emergency at a specific location, and for which the infrastructure can be managed and operated by a single authority or organisation. Diffuse intervention options are defined as options that may result in an increase in potential groundwater recharge over large areas with the objective of mitigating further reductions in groundwater levels, not necessarily providing a supply of potable water during an extended drought. Diffuse intervention options would require the ongoing cooperation of many private residents and local councils. Results from the two categories of intervention options cannot be directly compared.
Specifically, this manuscript aims to calculate the performance and cost of each intervention option under current and projected future climates and the sensitivity of their yield to long-term reductions in rainfall, where yield is the quantity of water that can be supplied at a specified reliability.
Section 2 describes features of the study area that are relevant to the design and construction of management invention options listed in
Table 1.
Section 3 provides an overview of each intervention option and discusses the methods and considerations relevant to the calculation of cost and yield. A tabular summary of yield and costs is provided in
Section 4 and
Section 5 discusses other important considerations that are difficult to quantify, such as water quality and community acceptance. Conclusions are presented in
Section 6.
2. Study Area
Norfolk Island, a remnant volcano, largely comprises weathered and fractured basaltic rocks and tuffs and agglomerate. Within the weathered volcanics and the agglomerate and the underlying fractured unweathered basalt bedrock sequences are multiple aquifer systems, within which 565 registered wells and bores are sited.
The collection of daily rainfall data commenced at Norfolk Island airport in 1915 and is among one of the longest high-quality datasets across Australia. The mean annual rainfall on Norfolk Island was 11% lower between 1970 and 2019 (1184 mm/year) relative to the period between 1915 and 1969 (1334 mm/year), with rainfall declines occurring in all seasons except summer [
3]. Another characteristic of rainfall over Norfolk Island is that the annual variation has increased over the last 50 years. Between 1970 and 2019, the coefficient of annual variation in rainfall was 0.27, while between 1915 and 1969, it was only 0.19.
The soils on Norfolk Island are rich and highly permeable. As part of this study, time-lapse photography of a small, grassed swale in the northwest of the island (capacity of 35.5 m3 and surface area of 171 m2 estimated using high-resolution LiDAR data) suggested an infiltration rate of 250 to 400 mm/day.
At the last census, Norfolk Island had a resident population of about 1700 [
2], and tourism is the island’s largest industry, with about 30,000 tourist visitors per year. The majority of the island is privately owned, although there are numerous public reserves, the largest being the Norfolk Island National Park which occupies 6.5 km
2. The waters surrounding Norfolk Island were declared a Marine Park in 2018 and are managed by Parks Australia.
Norfolk Island has a commercial centre at Burnt Pine, but the majority of the residents reside in low-density rural residencies dispersed evenly across the island. The history of settlement of Norfolk Island is well documented [
10]. Of relevance here historical subdivision practices that sought to ensure land portions have both road and creek access have resulted in a pattern of long narrow portions of residential land. Not until the 1960s, and the arrival of drilling rigs on the island, did this practice become less common. In 1996, concerns over the sustainability of the groundwater resource led to a moratorium being placed on new bore construction. Today, annual groundwater use is estimated to be about 120 ML [
3].
Norfolk Island has no reticulated water supply due to the prohibitive costs of connecting dispersed households across steeply undulating terrain, although approximately 20% of private dwellings and the island’s commercial district are connected to a sewerage treatment plant referred to as the ‘water assurance scheme’. The scheme, completed in 1991, discharges an estimated 150 kL/day of wastewater into the ocean at Headstone Reserve and is intended to minimise contamination of the island’s aquifer systems from leaking septic tanks.
Although households and businesses are responsible for their own water capture and storage, three communal watering points were established by the Norfolk Island Regional Council during the 1990s to alleviate water shortages during dry spells. These are located at two of the most notable dams on the island, Headstone Dam (<250 ML) and Watermill Dam, with the third location being a small roadside earthen dam that collects water from a hillside seep in Watermill Creek catchment adjacent to the earthen dam.
Norfolk Island has a heavily modified ‘natural’ environment, with many parts of the island experiencing numerous cycles of clearing, regrowth and re-clearing. On Norfolk Island, it is the responsibility of landowners to exclude cattle from their property. As a consequence of fencing and reduced grazing of properties during the 1950s, woody weeds such as African olive (Olea europeaea) that had once been grazed by cattle started to proliferate across the island (M Buffett 2020 pers. comm.). Aerial photographs and satellite imagery indicates that in 1944 about 35% of the island was covered in deep-rooted vegetation, and that proportion has steadily increased to approximately 65% of the island today [
3]. A feature of the 2019 imagery is the large areas of woody weeds, particularly along drainage lines, which were largely absent in the 1944 photographs.
The remoteness of Norfolk Island and the lack of a suitable port as well as the cost of shipping and energy generation have posed challenges to infrastructure developments that all require: (i) materials to be imported; (ii) machinery for large-scale construction activities; and (iii) energy sources for their operation.
Supplies and equipment delivered to Norfolk Island by cargo ships have to be offloaded onto flat-bodied vessels, referred to as lighters, and lifted ashore, which limits the size of cargo (i.e., lighters have a capacity of 6 t). Significantly, standard 20-foot shipping containers are generally too large and bulky to be offloaded on Norfolk Island. Inclement sea weather conditions also mean that offloading and backloading operations are frequently delayed, sometimes by many weeks. It is possible for two types of cargo aircraft to land at Norfolk Island airport, the C-130 Hercules and C-17 Globemaster. While these planes have maximum payloads of 20 t and 77 t, respectively, the maximum forklift capacity on the island is currently 7 t, which limits the weight of individual items that can be unloaded from these aircraft, unless part of the aircraft payload was used to transport over a larger forklift.
Energy on Norfolk Island is generated by six 1 MW diesel-powered generator sets with 6.6 kV distribution main lines servicing the island. At any one time, only two of the generators are required to produce the 1.4 to 1.6 MW peak loads [
11].
3. Materials and Methods
Spatial datasets on roads, boundaries and registered bores were sourced from the Norfolk Island Regional Council. Elevation data and terrain-based datasets and vegetation mapping were derived from high-resolution LiDAR data and aerial imagery acquired as part of the study [
12]. The LiDAR dataset was used to produce a digital elevation model (DEM) at 0.5 m resolution and a digital surface model (DSM) at 1 m resolution. Uses of the LiDAR data included the accurate delineation of catchments, dam axis profiles, reservoir dimensions, calculating roof areas and elevations, mapping vegetation, assigning ground levels elevations to bores and wells and calculating rainwater tank volumes.
3.1. Climate Baselines and Scenario Definitions
3.1.1. Climate Baseline
To ensure comparability of the management intervention options, their performance was evaluated over a common 50-year ‘recent’ climate baseline (1 April 1970 to 31 March 2020), referred to here as Scenario A. A climate baseline commencing in 1970 was adopted due to an apparent step change reduction in annual rainfall over Norfolk Island, which is similar to the change in annual rainfall observed in southwestern Australia [
4], 6000 km to the west but of similar latitude to Norfolk Island. A climate baseline commencing in 1970 has a length of 50 years which encapsulates a large range of climate variability, which is an important consideration in the estimation of the potential yield of different water infrastructures. For example, the authors of [
13] argue that 30-year-long series should be used to provide statistically reliable results for roof-harvested rainwater systems (RHRWSs).
3.1.2. Water Emergency Scenarios
In this manuscript, a ‘water emergency’ is defined as an event that causes widespread disruption of the supply of potable water and would require coordinated action/intervention by authorities to ensure all residents have access to potable water. While the focus in this manuscript is on water emergencies caused by extended dry periods, or ‘droughts’, it is possible that water emergencies could also result from natural disasters such as earthquakes.
Rather than evaluate the performance of an option to meet a constant daily water demand, analogous to a reticulated water supply system, centralised intervention options were evaluated to meet an irregular demand for water, more analogous to the irregularity at which drought-related water emergencies may occur. To ensure each intervention option could be readily compared, it was necessary to evaluate the performance of each option to supply water over an identical sequencing of water emergencies. For the purposes of this analysis, the performance of each option was evaluated by calculating the cost per ML of water that could be supplied by each centralised intervention option over a 90-day period at 100% reliability. Water emergencies were assumed to occur over the 90-day summer period between 1 January and 31 March because groundwater levels are typically lowest during the summer months and hence groundwater pumping during this period is less likely to be able to replenish depleted residential roof harvest rainwater systems.
Two water emergency scenarios were evaluated: the first, referred to as Scenario B50, assumes a water emergency occurs with a 50% annual exceedance probability; the second, Scenario B20, assumes a water emergency occurs with a 20% annual exceedance probability. Rather than assuming water emergencies occur at regular 2-year and 5-year intervals, respectively, Scenario B50 assumes water emergencies occur in the ’driest’ 50% of years of the recent climate baseline, and Scenario B20 assumes water emergencies occur in the ‘driest’ 20% of years of the recent climate baseline. The ‘driest years’ were determined as being those years with the highest maximum modelled aggregated daily water stress of household rainwater systems on Norfolk Island between 1 January and 31 March as calculated each year using the Norfolk Island roof harvest rainwater system community tank model [
14]. The years were ranked from the highest to lowest maximum modelled aggregated daily water stress, and the first 25 and 10 years were selected as water emergencies for Scenarios B50 and B20, respectively.
For each centralised intervention option, the infrastructure was sized to achieve a target yield of about 45,000 L/day under Scenario B50. This equates to 20 L/day for each resident and tourist (assuming the average length of stay of a tourist is 7 days), the minimum essential level as specified by the United Nations [
15] that can be sustained over short periods of time, or is sufficient for about 20% of the island’s population to receive 100 L/day over each 90-day water emergency period. Although this quantity of water over 90 days is twice as high as that produced by the temporary ADF desalination plant in 2020, it is the daily quantity that can be produced by a skid-mounted 2.3 m
3/h fast RO desalinisation unit and hence provides a useful point of comparison. Furthermore, it is considered prudent to adopt a degree of conservativism, not only given that the majority of GCMs project a decrease in mean annual rainfall in the future but also to mitigate the consequences of compounding water emergency events, such as an earthquake occurring during an extended drought.
3.1.3. Future Climate Projection
A subset of 21 global climate models (GCMs) identified by [
16] as having higher skill over the Australia region were used to select a representative future climate, referred to as Scenario C, that could be used to examine the sensitivity of the yield of each of the management interventions to reductions in rainfall. The seasonal pattern scaling method [
17] was applied to the output from the 21 GCMs to scale the 50-year sequence of future daily rainfall, temperature, radiation and humidity. The two time slices adopted for this study centred around 1990 (1975 to 2005, which is broadly representative of the climate baseline) and 2060 (2046 to 2075) and are representative of a 2.2 °C temperature rise under an RCP8.5 emissions scenario. Projected change in mean annual rainfall across the 21 GCMs varied between −20% and +10%; however, consistent with previous studies [
1], 17 of the 21 GCMs projected a future reduction in mean annual rainfall over Norfolk Island. For the purposes of this analysis, and in keeping with conservative design philosophies, Scenario C was selected as the GCM with the second largest reduction in mean annual rainfall relative to the baseline climate (i.e., ~16%). The adopted GCM was GISS-E2-R-CC. In effect, Scenario C represents the same sequencing of wet and dry years as Scenario A; however, as per the pattern scaling method, the daily rainfall values have been scaled based on projected seasonal rainfall differences (and then the entire series has been rescaled to match the annual scaling factor).
Water emergencies under Scenario C were assumed to occur with the same sequencing as Scenario A and are referred to as Scenario D50 and Scenario D20 for water emergencies that occur with a 50% and 20% annual exceedance probability, respectively, under a drier future climate.
3.2. Centralised Management Intervention Options
Six centralised intervention options were identified as being potentially suitable for minimising the consequences of a water emergency on Norfolk Island. A seventh option, based on a recent study on upgrading the island’s wastewater treatment plant, is included; however, it is not directly comparable to the other options because the water is non-potable. An overview of each option and the method by which yield was calculated is provided below. Detailed costings are provided in the
Supplementary material. The ‘do nothing’ scenario was not considered. The costs of having to evacuate residents and tourists from the island (e.g., flights, accommodation, loss of revenue) as a result of an extended drought are difficult to quantify but would be high. Such an evacuation would cause considerable social upheaval with potentially long-term ramifications for the island (e.g., reputational damage to the tourism industry, loss of investor confidence).
3.2.1. Desalinisation
Containerised and skid-mounted reverse osmosis (RO) desalination plants have become increasingly commercially competitive because they are portable and can be quickly deployed for disaster relief where there is access to seawater or brackish water. For the purpose of this options analysis, a skid-mounted 2.3 m3/h fast RO desalinisation unit was considered. Although larger units may be more cost-effective per unit of potable water produced, the volume of water is likely to be surplus to requirements. Larger units would also need to be flown in by C-17 aircraft at a cost of more than AUD 160,000 (Department of Infrastructure pers. Comm. 2019). It is potentially feasible that the 2.3 m3/h skid-mounted unit could be offloaded onto a lighter and lifted ashore, and it is likely the volume of potable water produced would be sufficient to meet the emergency supply requirements of the island.
The levelled parking area at the western end of Cascade Pier was identified as a potentially suitable location for a skid-mounted RO desalinisation system contained within corrosion-resistant housing (
Figure 1). The site offers a level surface for the plant, three-phase power electrical connection and existing infrastructure upon which a submersible seawater pump could be mounted. A preliminary visual and spot water sample analysis indicated that the seawater is likely to be of suitable quality for the feedwater intake system of the unit being considered.
Freshwater would be pumped up to storage tanks situated on land owned by the Commonwealth Government of Australia on the adjacent headland (a total head requirement of about 110 m and distance of 280 m). An advantage of this pumped pipeline arrangement is that water carters would not need to drive their vehicles down to and up from Cascade Pier. For the purpose of this analysis, two 92,500 L storage tanks were adopted on the basis that this storage capacity could buffer fluctuations in demand and provide several days of storage if the desalination plant had mechanical failure. It was estimated that approximately 160 m of 90 mm diameter Class PN4 HDPE pipe would be required to convey water from the seawater pump to the desalination plant and that a corrosion-resistant submersible pump would be mounted on the Cascade Pier within a stainless-steel cage for security and protection from watercraft and activities on the jetty. Depending upon what was deemed acceptable to Parks Australia, which is responsible for managing the marine park around Norfolk Island, a 150 m pipeline weighted to the seabed could be used to dispose of the waste brine (approximately 1.3 L/s while in operation). The yield was calculated assuming the unit operates 20 h in 24 and at a 34% recovery rate as specified by the manufacturer. Given the intermittent nature of the operation of the desalination plant, the capital expense of a solar energy and battery system to power the plant and pumps was found to result in a considerably higher annualised cost than connecting to the established diesel-powered network.
Desalination plants should run continuously for the best efficiency and longevity. However, manufacturers report that the plants can be operated for a reduced period of time each day and that it is possible to only operate a plant for several months per year. However, if the plant ceases operation for an extended period of time, the membranes would need to be sealed with protection fluid to prevent bacterial contamination or replaced before it is used next.
3.2.2. Earth Embankment Gully Dams
There are no large dams on Norfolk Island. Various small dams have been constructed over the years, with the most notable being a small dam owned and operated by the Norfolk Island Regional Council on Watermill Creek (~250 ML), a dam on private property in the lower reaches of Headstone Creek and a small dam on council-owned land in the upper reaches of Mission Creek adjacent to the airport. There is also a small disused weir at Cockpit Falls on the lower reaches of Cascade Creek and a small private dam, Cowboy’s Dam, in the upper reaches of Broken Bridge Creek. The Anson Bay Road along the western side of the island has created a small private impoundment, Mission Pool, in the lower reaches of Mission Creek. The lack of readily available rock and the high cost of importing cement means that compacted earth-fill embankment gully dams are the most feasible type of in-stream storage on Norfolk Island. These dams typically have a compacted clay core, a trapezoidal-shaped cross-section, and a crest wide enough to accommodate construction traffic.
While Norfolk Island has an abundance of good-quality clay that could be used in the construction of earth embankments, one of the challenges of constructing gully dams on the island is the highly permeable nature of the soils and the potential for leakage to occur through the base and sides of the reservoir. To estimate leakage from impoundments on the island, a time-lapse camera was set up to record the change in water level on a gauged staff placed in the reservoir footprint of Cowboy’s Dam. The LiDAR data, which were acquired when the reservoir was empty, were used to calculate the relationship between reservoir capacity, wetted area, surface area and height. These data used in conjunction with time-lapse recordings and estimates of net evaporation were used to calculate the average leakage through the base and sides of the reservoir.
To ensure that dam sites across Norfolk Island were objectively and consistently assessed, the CSIRO DamSite model [
18,
19] was applied across the entire island using the LiDAR data. The model has been extensively used in Australia [
20] to examine the opportunity for dams across large regions. The DamSite model comprises a series of algorithms that utilised the DEM and hydrological information to calculate the yield and cost of constructing a dam at 0.5 m height increments at each 1 m grid cell across the entire island. For the purposes of identifying farm-scale gully dams on Norfolk Island and in the absence of spatial data on runoff on Norfolk Island, the DamSite model calculated a ‘preliminary yield’ assuming runoff was a constant 20 mm/year (i.e., 2% of mean annual rainfall).
Based on the DamSite model results, eight potential dam sites were then selected for a more detailed pre-feasibility level analysis, which involved a site visit by an experienced dam engineer, hydrologist and soil scientist. It is likely that all of these sites would require geotechnical lining of the reservoir area to prevent excessive water loss through seepage. All sites, except the site at Cockpit Falls, are on private property. An important consideration on Norfolk Island is avoiding areas of peaty acid sulfate soil (containing hypersulfidic material) that is present in many low-lying reaches of drainage lines [
21]. Peaty soils are non-weight-bearing and would collapse under a lined reservoir, meaning they would need to be excavated prior to lining the base of the reservoir. The excavation, disposal and ongoing management of peaty acidic material within the reservoir footprint would impose an exorbitant cost on the project, and hence sites of peaty soil on Norfolk Island were avoided for gully dams.
As a result of this analysis, it was identified that a dam at Cockpit Falls was likely to be the most technically and politically plausible option due to its favourable topography; it is the site with the largest catchment area, there are no peaty soils in the reservoir footprint and it does not impinge on private land, though it does lie within Cockpit Falls Reserve which is owned in part by the Norfolk Island Council and in part by the Commonwealth Government of Australia and has heritage listing.
The yield of a reservoir at Cockpit Falls was calculated using a behaviour analysis model [
22] operating on a daily timestep over the climate baseline. The reservoir was modelled with and without a high-density polyethylene (HDPE) liner. Without the liner, it was assumed leakage through the potential reservoir would be 35 mm/day (based on measurements made at Cowboy’s Dam). Dam cost and yield were calculated at 0.5 m dam wall height increments.
Although lining the base of a gully dam reservoir with high-density polyethylene (HDPE) is expensive, lined reservoirs had a lower levelised cost than unlined reservoirs. For example, the cost of a 28.1 ML capacity dam at Cockpit Falls without lining was about 35% of the total direct cost with lining; under Scenarios B50 and B20, the yield from the unlined reservoir was modelled to be 6% (18,000 L/day) and 19% (60,000 L/day) of the yield from the lined reservoir, respectively. Consequently, only lined reservoirs are reported here.
Two full supply levels (FSL) are reported (
Figure 2). The first FSL, 32 m ASL, would produce a reservoir of 1 ML capacity and was adopted as the yield (41,000 L/day) was close to the design yield of 45,000 L/day. The second FSL, 36 m ASL, would produce a reservoir of 28.1 ML capacity and was adopted as the maximum height as after allowing for a 1 m flood rise, the potential reservoir would fall just short of inundating the access road (
Figure 2).
3.2.3. Cluster-Scale Roof Harvest Rainwater Systems
Rainwater harvesting in cities around the world has generally been implemented at the household scale often to supplement reticulated water supply. However, there is increasing interest in cluster-scale RHRWSs where water is collected from multiple roofs (residential development or commercial/shopping centre) and conveyed to one or more large ‘communal’ or ‘centralised’ storage tanks. Stated benefits of communal approaches to RHRWSs include economies of scale of capital costs, reduced land footprint, centralised disinfection and flexibility in matching supply and demand for different households [
23]. Cluster-scale harvesting also offers the opportunity to formalise management of local water sources, which addresses some of the limitations of household-scale RHRWSs, particularly relevant in the case of water emergency scenarios. Though not common, there are already a couple of small-scale examples of cluster-scale RHRWSs in the Burnt Pine commercial centre where one business directs roof rainwater to the storage tanks of a neighboring business. There are also some residents who own neighboring properties and pump water from storages on one property to storages on the other.
The largest area of available roof space in close proximity on Norfolk Island is in the Burnt Pine commercial centre, with more than 37,000 m2 of roof catchment, potentially enough to catch at least 12 ML of water in the driest year on record. However, level unutilised land that could be used for siting large rainwater tanks and in close proximity to the commercial centre is limited.
The most cost-effective and technically and socially plausible potential cluster-scale RHRWSs would be situated at the Bicentennial Oval, capturing rainwater from three large council-owned buildings (
Table 2) on the southern side of the oval and storing it in tanks adjacent to the oval. The oval and adjacent land are owned by the Norfolk Island Council.
The yield from cluster-scale RHRWSs was calculated using a modified version of the residential household RHRWS model outlined in [
14]. This model was adapted for cluster-scale RHRWSs by interlinking the overflow of each of the existing building storage tanks to the potential centralised tanks. LiDAR data were used to calculate roof areas and ensure the lowest point of each roof was higher than the top of each of the potential centralised tanks. Pipe flow software was used to ensure that PVC pipe diameter would not limit yield. In reality, PVC pipes are a small cost relative to the tank infrastructure and optimising the pipe diameter was not necessary in this pre-feasibility study, particularly given the absence of design rainfall information for Norfolk Island and that the differences in PVC pipe price were within the uncertainty of the cost estimates. It was assumed that existing rainwater storages connected to each building would only overflow to the centralised tanks when they reached 80% capacity. The initial storage loss was assumed to be 0.5 mm/day, and the roof, gutter and conveyance efficiency was assumed to be 85%. The RHRWS model was run for incrementally larger storage capacities.
Three cluster-scale RHRWS options near Bicentennial Oval are reported (
Figure 3). The first is 15 × 0.5 ML steel rainwater tanks, the largest individual tanks currently available on Norfolk Island, and the largest number of tanks that could fit within the available footprint at the eastern end of Bicentennial Oval. Although larger engineered steel tanks are commercially available from mainland Australia, they are considerably more expensive per litre storage, even before transportation costs and the cost of flying specialised contractors to the island are considered. The second option adopts the same configuration as the first, except rainwater falling on the roofs of the tanks is also captured using ‘water saver’ devices outlined in the rainwater tank farm option. The third option considers storing water in a turkey nest—an excavated basin with raised earth embankment walls around its perimeter. A turkey nest constructed on Bicentennial Oval could have a capacity of 14.6 ML, though it is highly unlikely that this option would be socially plausible as it would result in a considerable loss of this amenity to the Norfolk Island community and is only included here as the cost and performance of a large turkey nest may be of interest to others elsewhere. Due to the highly permeable soil on Norfolk Island, the turkey nest would need to be lined and potentially covered to minimise contamination but allow rainwater falling on the footprint of the turkey nest to enter the storage.
3.2.4. Rainwater Tank Farms
Rainwater tank farms are defined here as being one or multiple ‘stand-alone’ rainwater tanks, where the tanks are not connected to a building, but rather inflows to the tanks are limited to that rain that falls on the roof of the tanks. Under this option, tanks would capture water falling on their roofs through commercially available narrow ‘insect and mosquito resistant’ slots in small plastic plates that can be installed within the corrugations of a steel rainwater tank roof. The plastic plates cost several hundred dollars depending upon the size of the tank, plus labour. The use of rainwater tank farms is likely to be limited to the storage and provision of water during water emergency periods. The performance of 11 different-sized rainwater tanks available on the island between 0.049 ML and 0.5 ML capacity was evaluated. Based on the climate baseline, the most cost-effective tank capacity for Norfolk Island was calculated to be 0.247 ML.
For the purposes of this study, a rainwater tank farm was assumed to consist of 9 × 0.247 ML steel rainwater tanks, a water treatment unit and a smaller tank (25 kL capacity) for storing treated water. It would be feasible to enclose this configuration with security fencing within a level 50 m by 50 m area. The cheapest location for a rainwater tank farm would be a level site with minimal cut and fill requirements, and operational costs could be minimised by siting the tank farm adjacent to a road cutting or lower lying area where water in the tanks could flow via gravity into the tank of a water carter. The highly modular nature of this option means the cost and performance scale linearly.
Figure 4, a slope grid derived using the LiDAR data shows that there are many potential locations where rainwater tank farms could be sited across the whole island.
The performance of rainwater tank farms was evaluated using a modified version of the single household RHRWS model outlined in [
14]. In this case, the model was parameterised such that the roof area was set to the roof area of the rainwater tank farm. The initial storage loss was assumed to be 0.5 mm, and the efficiency of the slots in the gutter for capturing water was assumed to be 80%. It was assumed that a series of small pumps could redistribute water between the rainwater tanks so as to maximise the capture and storage of water.
3.2.5. Deep Groundwater Extraction
Groundwater wells and bores have historically been used as a source of water on Norfolk Island when households have exhausted their roof-harvested rainwater (tank) supply and to source large quantities of water for industrial and agricultural use. However, recent challenges of extracting groundwater from the weathered volcanics during the extended dry period of the summer of 2020, coupled with the potential for the current trend of further declines in the potentiometric surface across the island, provide ongoing challenges for existing groundwater infrastructure [
3]. Any additional development of groundwater to supply water during irregular, short-term ‘water emergency’ situations is better targeted to the deeper agglomerate and fractured unweathered basalt bedrock sequences deposited above present-day sea level (i.e., to avoid the potential for seawater intrusion), where seasonal and inter-annual reductions in groundwater levels exhibit smaller changes. Existing bores situated in the deeper agglomerate and fractured unweathered bedrock have a range in depth of between 76 and 154 m below ground level (median value of 88 m) [
14]. The depth of the hydraulic head of the groundwater surface ranges between 14 and 113 m below ground level (median 55 m), a reflection of the high heterogeneity and variation in the degree of confinement of the groundwater system. Aquifer property data for the agglomerate units and fractured unweathered basalt on Norfolk Island are sparse, but existing indicative short-term (i.e., a few hours) pumped bore yields in the deeper agglomerate and fractured rock system were estimated to vary from 0.1 to 3.8 L/s (median of 0.7 L/s), though it should be noted that no proper pump tests have been conducted on the island. Areas considered likely to have the potential for further development of groundwater within the deeper fractured volcanic rocks/agglomerate material are near the break of slope on the southern side of Mount Pitt, where it is likely that outcropping bedrock would be directly recharged. Other areas with potential include the upper reaches of Watermill Creek, Town Creek, Rocky Point and Mission Creek, which are all recharged via vertical leakage from the weathered volcanics beneath the southern plateau.
Based on historical accounts and local experience of the geological heterogeneity, it was assumed that to establish 12 production bores (AUD 1000/m), 28 exploratory holes (AUD 500/m) would be required to prove the resource, with an average depth of the holes being 75 m. Based on observations from pumping deep bores and existing groundwater yield information, it was assumed that the production bores would average 0.5 L/s over a 1 h period, and due to the requirement for each bore to recover between pumping events, it was assumed each bore could be operated up to three times per week. Additional infrastructure requirements would include tanks to store groundwater between water emergency periods, commercial grade water treatment equipment and access roads for water carters. These additional groundwater extractions would not have a large impact on the island’s groundwater balance as the volume of water extracted would be a low proportion of current annual groundwater extraction (i.e., <2%).
New bores would require a drilling rig to be transported to the island via C-17 aircraft. It is estimated that the drill rig and two operators would be required on the island for 120 days to complete the installation of 12 production bores. Twelve production bores were adopted for this option as they were calculated to potentially provide a combined yield of 38,000 L/day, close to the desired target yield.
A considerably cheaper alternative to drilling and installing new deep bores would be to use existing deep bores. As with the new groundwater production bores, it is assumed that on average the existing production bores would yield 0.5 L/s for a 1 h period three times per week. For this option, ‘water saving’ technology was also considered, where like the rainwater farm option, rainwater falling onto the roofs of the groundwater storage tanks could be stored in conjunction with groundwater.
3.2.6. Upgrade of Existing Wastewater Treatment Plant
With the declaration of a Marine Park in 2018, Norfolk Island is located within the Temperate East Marine Park, and protection of the marine environment is addressed by the Temperate East Marine Parks Network Management Plan 2018 [
24]. As current discharge of waste, including sewage effluent from the existing sewage treatment plant, which is currently in poor condition, into the ocean is not authorised under the management plan, Norfolk Island Regional Council is considering options to cease wastewater discharge. Investigations into the upgrade of the existing sewerage treatment plant have been undertaken, and it has been proposed that the treated wastewater could potentially be used for non-potable uses to improve the security of water on Norfolk Island [
9]. Four preferred options for upgrading the existing plant were proposed, with the first two options, Membrane Aerated Biofilm and Membrane Bioreactor, providing recycled water for agricultural purposes delivered to the community via a standpipe. Although Membrane Aerated Biofilm was the preferred option of [
9], it is an emerging technology that has to date been more typically applied to industrial wastewater. Membrane Bioreactor is a mature technology and has been applied in comparable island settings for marine protection [
25]. The last two options, Trickling Filter and Wetlands and Rotating Biological Contactor and Intermittently Decanted Activated Sludge, were reported to result in treated water of low quality that can only be used for ‘indirect potable reuse’, where pastures are irrigated with the ‘treated wastewater’ and indirect aquifer recharge occurs. It should be noted, however, that field experiments are yet to demonstrate that the proposed 2 ha wetland can produce long-term improvement in the quality of wastewater.
Irrespective of the technology, none of the options examined by [
9] would produce treated wastewater (recycled water) of sufficient quality for irrigation or non-potable use without preventative measures to reduce human exposure (e.g., drip irrigation or withholding periods) or for activities with high likelihood of human exposure (e.g., firefighting). Given the potential for human exposure, it is highly unlikely that the treated wastewater could be safely distributed via standpipes located at the STP or along the reticulation network. For these reasons, it is very difficult to envisage a situation where wastewater from an upgraded STP could be used as an emergency potable water supply without advanced treatment. It would only be possible to do so if the treated wastewater could be substituted for a potable water supply currently used for purposes that do not require high-quality water. While [
9] lists agriculture as a potential user, the practice of irrigating pastures using low-quality water risks contaminating groundwater systems on Norfolk Island that are currently used to replenish potable rainwater tank supplies. Despite these risks, for comparative purposes, an upgrade to the STP using Membrane Bioreactor (MBR) is considered here assuming that the treated wastewater can be substituted for potable water.
This option was the only centralised option where a cost for carting water was included, as this option incurred additional cartage costs in transporting the treated water from the upgraded STP to the area of application and then a cost of transporting the substituted potable water to the storage tanks. As per the other centralised options, the cost of carting water from the storage tanks to the resident/business was not included in the analysis and was assumed to be incurred by the end user.
3.3. Diffuse Intervention Options
Two diffuse intervention options are discussed below.
3.3.1. Vegetation Management for Improving Water Security
Prior to European settlement, Norfolk Island was dominated by subtropical rainforest and native flora of which over 30% is endemic. Since European settlement, however, there has been a complex history of land clearing, regrowth and revegetation, and a large number of species have been introduced and are now naturalised.
LiDAR point cloud data and aerial imagery acquired as part of this study were used to map vegetation on Norfolk Island (see [
3]) (
Figure 5). It was calculated that about 36% of the island is currently under shallow-rooted vegetation/pasture, 27% native vegetation or native vegetation mixed with woody weeds and 12% large contiguous areas of selected woody weeds (i.e., African olive, Cotoneaster, red guava and Hawaiian holly) (
Table 3). On Norfolk Island, many of these woody weed species form dense thickets whose canopies inhibit the development of an understory.
Given deep-rooted vegetation typically uses more water than shallow-rooted vegetation [
26] and consequently more potential groundwater recharge typically occurs under shallow-rooted vegetation than deep-rooted vegetation [
27], it is likely that the increase in deep-rooted woody vegetation on Norfolk Island over time has contributed to a decrease in groundwater recharge and consequently streamflow. As such, a course of reasoning is that replacing existing undesirable deep-rooted woody weeds and eucalyptus plantations on Norfolk Island with shallow-rooted vegetation may result in an increase in groundwater recharge. However, the removal of deep-rooted vegetation from steep slopes can accelerate erosional processes. Although no local scientific studies have been undertaken on erosional processes on Norfolk Island, the soils are very stable and well drained. When clearing woody weeds and establishing pasture on Cape York Peninsula (Queensland), the recommended slope cut-off for stable well-drained soils is 32%. For the stable basalt-derived soils of the Atherton Tablelands (Queensland), the recommended slope cut-off is 35%. Thirty-five percent is also a recommended cut-off for the challenges presented by steep slopes to the stability of machinery and consequently is the slope threshold adopted here for the clearing of vegetation and establishment of shallow rooted pastures.
To model the change in the water balance from deep-rooted to shallow-rooted vegetation, two approaches were used: (i) the generalised relationships developed by [
26] and (ii) using a soil–vegetation–atmosphere transfer model, WAVES [
28]. Soil and vegetation parameters used in this analysis are outlined in the companion paper [
3]. Here WAVES was used to estimate groundwater recharge under pasture, pines and eucalyptus (used as a surrogate for deep-rooted woody weeds given the similarity in remotely sensed evaporation), and the difference multiplied by the area that could potentially be cleared (338 ha) was used to calculate the potential increase in recharge.
Based on recent clearing and ongoing maintenance work undertaken in the Norfolk Island National Park, it was assumed that the average cost of clearing deep-rooted woody weeds was AUD 10,000/ha and an additional AUD 1500/ha in follow-up slashing and maintenance in the first year with an ongoing annual maintenance cost of AUD 750/ha. These costs were applied to areas containing eucalyptus and all dense thickets of woody weeds outside of the national park and on slopes less than 35% (
Table 3).
3.3.2. Managed Aquifer Recharge for Improved Water Security
Although not extensively used on Norfolk Island, three types of managed aquifer recharge are already in use on Norfolk Island: infiltration swales, infiltration ponds or basins, and recharge weirs. Of these, recharge weirs that detain streamflow for infiltration through the streambed are thought to offer the most potential for improving water security on Norfolk Island. While infiltration swales have been constructed on a number of properties across the island, they have largely been constructed to manage erosion caused by localised runoff and subsequently increase soil moisture for household scale horticulture rather than for water conservation or supply purposes. Less common on Norfolk Island are infiltration basins.
The key requirements for managed aquifer recharge are the presence of a suitable aquifer with available storage capacity (see
Figure 6), water available for ‘recharging’ the aquifer and local demand for water. The general recommended minimum depth to groundwater to avoid issues associated with water level rise (e.g., waterlogging, flooding of below-ground infrastructure) is 4 m in rural areas and 8 m in urban areas [
29]. Ideally, recharge weirs should also be located where recharge will not be lost through groundwater discharge to perennial surface water or coastline discharge and should target locations in proximity to existing groundwater bores/wells. Infiltration estimates made at Cowboy’s Dam and silt accumulation observed in depressions suggest the accumulation of silts in drainage lines would be likely and that periodic desilting of the streambed may be required to maintain infiltration rates unless flow is conveyed via a grassed swale to minimise silt accumulation.
Recharge weirs were assumed to be constructed by local landholders and local contractors using locally sourced material and not to engineering specifications. Consequently, the cost of planning, design, and construction of these simple recharge weirs of approximately 2 m height was estimated to be AUD 5000 based on known costs of existing recharge weirs on the island (indexed to 2019) [
14]. Due to the low engineering standards, it was assumed that 10% of the capital cost would be required for annual maintenance and desilting. It was difficult to estimate the increase in potential groundwater recharge that could arise as a result of recharge weirs on Norfolk Island. Nonetheless, as a means of broadly quantifying the potential increase in groundwater recharge that could arise from recharge weirs, estimates of quickflow on Norfolk Island made by [
3] were used as an upper bound estimate of runoff that may occur upstream of those areas with shallow water tables. It should be noted, however, that some of the quickflow response estimated by [
3] is likely to be generated in areas with shallow water tables where recharge weirs would be unsuitable due to lack of storage capacity, not just due to runoff arising from infiltration excess, localised perching or rainfall falling on impervious surfaces. It was estimated that potential runoff in areas with groundwater levels greater than 4 m may be in the order of 100 ML/year. Catchments with the highest impervious surface (Watermill Creek/Town Creek 89.817 m
2, Broken Bridge/Cascade Creek 60,195 m
2, Mission Creek 30,769 m
2, Headstone Creek 28,445 m
2) offer the best opportunity to harvest runoff for recharge weirs. Using a BHA model and a representative height–surface area–volume curve (derived from the eight potential dam sites) and assuming leakage in the drainage lines to be 35 mm/day per m
2, it was calculated that on average a single 2 m high recharge weir could intercept and infiltrate the runoff generated due to infiltration excess, localised perching and impervious surfaces over a catchment area of nearly 0.4 km
2. Over the entire island, this equates to about 100 recharge weirs optimally placed across the island to intercept and infiltrate the majority of the said runoff. Noting that it would not be possible to optimally place every weir, it is assumed that at least 150 × 2 m high recharge weirs would be required.
3.4. Evaluating Intervention Option Performance
Metrics used to compare intervention options were yield, capital cost, operation and maintenance cost (O&M), annualised cost and levelised cost.
All capital and O&M costs are in Australian dollars (AUD) and were indexed to the end of 2019, and costs were sourced from potential local and mainland suppliers as appropriate. Installation and construction costs were based on local rates. At the time of the analysis, the electricity tariff on Norfolk Island was 0.74 AUD/kWh (Operational Plan 2020–2021). Cost estimates took into consideration freight transportation costs to Norfolk Island, a function of weight and volume. Detailed cost estimates for each of the intervention options examined are presented in
Supplementary material. The commercial cost of carting a single 4500 L load of water on Norfolk Island is about AUD 120. With the exception of the upgrade to the STP, the costs of carting water from the centralised options to resident/business end users were not included because it was assumed that water cartage costs would be incurred by the end user, besides which water cartage costs would be incurred equally by all options.
Annualised and levelised costs were calculated assuming a 7% discount rate over the service life of the infrastructure. Using a 3% discount rate had little impact on the ranking of the centralised intervention options.
The assumed service life of each intervention option is shown in
Table 4. The upgraded WTP was assumed to have a service life of 50 years as specified by [
9]. It should also be noted that when ranking the intervention options in terms of levelised costs, the ranked order was relatively insensitive to proportional service life breakdown.
4. Results
Yield and capital and operation costs for each of the management interventions under Scenarios B50 and D50 are presented in
Table 5 and Scenarios B20 and D20 in
Table 6. Detailed costings are provided in
Supplementary material.
For those intervention options that carry water over from one year to the next, the yields are slightly higher under Scenario B20 than Scenario B50 as the former scenario has shorter runs of years of consecutive extended dry periods and often more time to replenish reserves between extended dry periods.
A summary of results for the diffuse intervention options, which seek to reduce the risk of a water emergency occurring rather than minimise the consequences of a water emergency, is presented in
Table 7.
The percentage change in yield under a projected drier future climate (i.e., Scenario C) and the elasticity of yield of the centralised management intervention options are presented in
Table 8. This table shows that storage dampens the elasticity of inflows resulting in a smaller elasticity of yield. The table also shows that the elasticity of yield is lower when intervention options have to service shorter runs of consecutive dry years (i.e., Scenario D20).
5. Discussion
While cost and yield are important considerations when ranking options, other factors that can be difficult to quantify such as uncertainty in yield and cost estimates, water quality and likely community acceptance will also be important considerations when examining options. Intervention options are qualitatively scored against these factors in
Table 9 and are discussed below.
By way of explanation of the qualitative categories used to describe the uncertainty in yield and cost estimates in
Table 9, those options where the transformation of rainfall to yield (or groundwater recharge) was non-linear (e.g., gully dams) were considered to have a high uncertainty in yield estimate, those options where the transformation was approximately linear were considered to have a medium uncertainty (e.g., RHRWS) and those options where the yield is based on an engineered specification (e.g., desalination) were considered to have a low uncertainty in yield estimate. Studies have shown that infrastructure that involves subsurface excavation is particularly susceptible to cost overruns [
30]. Of the options considered here, gully dams and the drilling of groundwater production bores have the greatest risk of incurring cost overruns due to subsurface uncertainties. On the contrary, infrastructure that is modular in nature and only has to be assembled on-site has been found to have lower cost overruns than infrastructure that has to be constructed on-site [
30]. A water quality category of ‘low’ indicates the water is non-potable, and ‘medium’ indicates that the water is likely to be potable with treatment but has a moderate risk of being contaminated that would need to be managed. ‘High’ indicates the water is potable and is likely to only require minimal treatment with a low risk of contamination. Those options with a low ‘likely acceptance’ had more complications in terms of land and infrastructure ownership (e.g., Cockpit Falls dam and existing groundwater bores) and/or requiring community support and involvement in maintenance (e.g., vegetation management and managed aquifer recharge) than those options scored high.
The order of centralised intervention options ranked by levelised cost was similar under Scenarios B50 (
Table 5) and B20 (
Table 6). Under both scenarios, a potential dam at Cockpit Falls has the lowest levelised cost of the intervention options considered. The cluster-scale RHRWS with a turkey nest storage on Bicentennial Oval had the next lowest levelised cost, followed by a 2.3 m
3/s RO desalination unit and then utilising existing deep groundwater bores. As outlined in
Table 9, however, gully dams have high uncertainty in yield and cost. A gully dam at Cockpit Falls is also susceptible to contamination due to the relatively large areas of residential, business and industrial zoned land within its catchment area. If this option were to be considered further, the risk of contamination occurring within the Cockpit Falls catchment would need to be investigated and policies and strategies developed to minimise or reduce the risk of contamination occurring. A further difficulty with this option is that Cascade Reserve, within which the dam and reservoir would be sited, is on the Norfolk Island Heritage Register and protected under the Heritage Act 2002 (NI). It has national environmental significance and other values protected under the Environment Protection and Biodiversity Conservation Act 1999 (Cth) (EPBC Act). Although the 28 ML storage has one-third the levelised cost of the 1 ML storage configuration, the yield of the 28 ML storage configuration is likely to greatly exceed that required for an emergency water supply. Under a projected drier future climate, this could provide a source of water for bushfires on the southeastern side of Mount Pitt and Mount Bates; however, the low position in the landscape would limit its utility.
Relative to other options, desalinisation has few complications. With land tenure and access likely to be easily resolved relative to other interventions, the main issue requiring resolution would be obtaining permission from Parks Australia to discharge relatively modest quantities of waste saline discharge (1.3 L/s) into the adjacent marine park. Although no precedents exist in Australia, recent studies investigating marine ecological changes indicate an increase in marine diversity around discharge outlets of desalination plants [
31]. Strong technical skills on Norfolk Island and the island’s relative proximity to expertise in Sydney and Brisbane would suggest that with appropriate institutional arrangements, ongoing maintenance of intermittently used desalination units should not be an issue on Norfolk Island, as has been experienced on some other Pacific Islands. Desalination also has the lowest levels of uncertainty in terms of current and future yield as it is independent of rainfall, and the uncertainty of estimated cost is low as the major cost items associated with the skid-mounted unit are modular in nature and would arrive on the island as pre-fabricated components that simply need to be assembled on-site.
Sourcing water from existing groundwater bores had a levelised cost of about twice that of desalination. This option would require landholders to effectively forgo their bore and would require their long-term cooperation and access agreements. It would also involve the installation of a large rainwater storage tank, water carter access and potentially water treatment infrastructure on their property. As the bores already exist and yield can be measured, uncertainty in cost and yield estimates would be low. Although this option is one of the cheaper options, finding landholders effectively willing to forgo the use of their private bore, and hence decrease their amenity and personal water security for the security of the community, is likely to be difficult. The alternative, drilling new bores into the deeper unweathered groundwater system on Council or Commonwealth property, was one of the most expensive intervention options considered, in part due to having to fly a drill rig to the island. This option also has high risk due to uncertainty in geological conditions at depth, which results in high uncertainty in estimated yield and cost.
Roof rainwater harvesting does not exhibit the same degree of non-linearity in performance as shown by changes in modelled groundwater recharge and streamflow; consequently, roof rainwater harvesting yield estimates under a future climate are more robust than those options dependent upon groundwater or overland flow.
Although cluster-scale RHRWS and rainwater tank farms were one of the options with the highest levelised cost, the technology is well known on Norfolk Island and the yield can be estimated with relatively high confidence as tank inflows are more linearly related to rainfall than the inflows to gully dams, where rainfall to runoff processes are highly non-linear. The modular nature of RHRWSs and their low-tech technology means their cost of commissioning can be estimated with a relatively high degree of accuracy. Although little technical knowledge is required, as with all options, appropriate institutional arrangements would still be required to ensure their ongoing operation. While rainwater tank farms are more expensive than cluster-scale RHRWSs, they are potentially attractive in that they are standalone structures, highly modular in nature, and their location is not dependent upon existing roofed infrastructure, which means they can be situated at a wide range of locations and assembled relatively quickly. Because they are relatively scale-insensitive, tank farms lend themselves to having their capacity increased in the future, and they can be distributed at multiple locations across the island and so can service different geographical areas, thereby minimising the distance water needs to be carted. However, due to their limited roof catchment area, their use is likely to be limited to the storage and provision of water during extended droughts.
Two ‘diffuse’ interventions, managed aquifer recharge and manipulation of vegetation, which aim to minimise the number of bores that run ‘dry’ by enhancing groundwater recharge, were investigated.
While manipulating vegetation on Norfolk Island to ‘enhance’ groundwater recharge may help limit the rate of fall in groundwater levels, the potential increases in groundwater recharge that could arise from replacing deep-rooted woody weeds with shallow-rooted pastures is likely to be small relative to decreases in groundwater recharge that have occurred as a result of reductions in rainfall (i.e., <15% [
3]). Although the hydrological benefits may be uncertain, weeds are a significant issue on Norfolk Island for a number of reasons other than any hydrological impacts that they have. In particular, weeds threaten the broader environmental values of the island, notably by competing with native plant species, including threatened and endemic species. The ecological integrity of native forests of the island is at risk from propagule pressure of weeds in the more human-modified parts of the landscape. Protection of native forests and their flora and fauna would be facilitated by a reduced abundance of weeds on the island in general. Consequently, there may be other compelling reasons why some options, which may have questionable hydrological benefits, may have attraction. Either way, the complete eradication of deep-rooted woody weeds is likely to be particularly challenging on Norfolk Island. This is because many of the woody weed thickets run the length of creek lines, and many properties on Norfolk Island are long, narrow and perpendicular to the creek lines, meaning all the landholders in the affected drainage line would need to be actively involved in their removal because the risk of reinfestation is likely to be much greater when a cleared area is in close proximity to an untreated area.
Managed aquifer recharge in the form of recharge weirs is likely to have localised impacts on reducing groundwater levels on Norfolk Island because the volume of water available for recharge is small relative to the reductions in groundwater recharge that have occurred across the island. Most overland flow on Norfolk Island is generated in areas where the water table is close to the ground surface, which occurs at locations of low elevation in the landscape, and these areas are generally unsuitable for managed aquifer recharge because there is limited storage capacity in the unsaturated zone and they are relatively long distances down gradient of where the majority of groundwater extraction occurs. Although it could not be quantified as part of this study, the reductions in source water under a drier future climate for managed aquifer recharge are likely to be small as the source water would be derived from impervious surfaces, infiltration excess and temporary perched water tables, which are less likely to be affected by compounding effects of long-term decreases in rainfall and increases in potential evaporation [
32].
Managed aquifer recharge, including swales, are likely to have the most utility locally where they can capture and infiltrate runoff from impermeable surfaces such as roads, roofs and overflowing rainwater tanks, potentially providing local benefits in terms of increasing soil water for gardens and tree crops and localised recharge, preventing soil erosion, improving the quality of water and helping keep acid peat soils saturated.
6. Conclusions
Desalination had the third lowest levelised cost of the options examined; however, it is likely to be more socially acceptable than the two more cost-effective options, gully dams and cluster-scale RHRWSs with an earth embankment ring-tank.
The centralised option with the largest percentage reduction in yield under a projected drier future climate was gully dams, because of the non-linear relationship between rainfall and runoff, followed by cluster-scale RHRWSs. The yields of the remaining centralised intervention options were not impacted under a drier future climate.
Diffuse intervention options, replacing deep-rooted woody weeds with shallow-rooted pastures and managed aquifer recharge (recharge weirs), could in themselves not supply water needed during a water emergency. However, by increasing groundwater accessions, they had the potential to reduce the imbalance between groundwater recharge and discharge by 36% and 16%, respectively.
Ultimately it is likely that a robust emergency water supply strategy would encompass multiple options, thereby providing redundancy and cost-effectiveness. However, all options are entirely contingent upon there being appropriate institutional arrangements and an ongoing commitment to maintaining infrastructure and the operational plan.
Supplementary Materials
The following supporting information can be downloaded at:
https://www.mdpi.com/article/10.3390/w14162461/s1, Table S1. Capital costs for a skid-mounted 2.3 m
3/hour fastRO plant (A50). All costs in 2019 AUD. Table S2. Cost of potential Cockpit Falls dam at FSL of 36 mASL. Table S3. indicative capital costs of cluster-scale RHRWS of Option 1. Table S4. Cost of potential rainwater tank farm. Table S5. Indicative cost of twelve new deep groundwater bores. Table S6. Costs associated with removal of woody weeds. Costs are indicative and will vary between locations depending upon a range of factors such as access and topog-raphy. Note cost of hand clearing dense infestations of wood weeds is prohibitive.
Author Contributions
Conceptualisation and supervision, C.P.; formal analysis C.P., A.Y., L.S., L.R., J.H. and S.M., writing—original draft preparation, C.P.; writing—review and editing C.P., J.V. and A.R.T.; project administration and funding acquisition, C.P. All authors have read and agreed to the published version of the manuscript.
Funding
The Australian Government Department of Infrastructure, Transport, Regional Development and Communications funded the study.
Institutional Review Board Statement
CSIRO Ethics Clearance 134/19.
Informed Consent Statement
Not applicable.
Data Availability Statement
Acknowledgments
First: special thanks are extended to those landholders, the majority of whom chose to remain anonymous, who permitted us to take measurements on their property and trusted us with their data. Many people were generous with their time and patiently answered numerous questions on a wide range of topics. Particular thanks to Hannah Taylor, Claire Quintal, Neil (Snow) Tavener, Derek Greenwood, Nathan Taylor, Chris Nobbs, Adam Jauczius (BoM), Jim Tavener, Merv Buffett, Andrew Barnett, Geoff Bennett, Charles Christian-Bailey, Bruce Taylor, Geoff Edwards Helmut Dresselhaus (Pacific Water Technology) and Aaron Graham. Glen Walker and Tony Ladson provided valuable feedback on an early draft. Numerous organisations and government departments on Norfolk Island also provided assistance, including the Norfolk Island Regional Council, particularly officers Cheryl (Sarlu) LeCren, PJ Wilson and Arthur Travalloni. Nigel Greenup and Joel Christian (Parks Australia) willingly shared knowledge held by Parks Australia. Mayor Robin Adams, the Administrator Eric Hutchinson and Fiona Anderson from the Administrator’s office were encouraging and most welcoming to the assessment team. The highly professional Landpro team performed the valuable task of acquiring LiDAR data for the island under challenging timeframes and conditions.
Conflicts of Interest
The authors declare no conflict of interest.
References
- McGree, S.; Herold, N.; Alexander, L.; Schreider, S.; Kuleshov, Y.; Ene, E.; Finaulahi, S.; Inape, K.; Mackenzie, B.; Malala, H.; et al. Recent Changes in Mean and Extreme Temperature and Precipitation in the Western Pacific Islands. J. Clim. 2019, 32, 4919–4941. [Google Scholar] [CrossRef]
- ABS Census of Population and Housing (Census). Australian Bureau of Statistics. Available online: https://www.abs.gov.au/websitedbs/censushome.nsf/home/2016 (accessed on 20 March 2020).
- Hughes, J.; Petheram, C.; Taylor, A.; Raiber, M.; Davies, P.; Levick, S. Water balance re-construction on Norfolk Island. Water balance of a small island experiencing climate change. Water 2022, 14, 1771. [Google Scholar] [CrossRef]
- Hughes, J.D.; Petrone, K.C.; Silberstein, R.P. Drought, groundwater storage and stream flow decline in southwestern Australia. Geophys. Res. Lett. 2012, 39, L03408. [Google Scholar] [CrossRef]
- Petheram, C.; Potter, N.; Vaze, J.; Chiew, F.; Zhang, L. Towards better understanding of changes in rainfall-runoff relationships during the recent drought in south-eastern Australia. In Proceedings of the 19th International Congress on Modelling and Simulation, Perth, Australia, 12–16 December 2011; pp. 12–16. [Google Scholar]
- Chiew, F.H.S.; Potter, N.J.; Vaze, J.; Petheram, C.; Zhang, L.; Teng, J.; Post, D.A. Observed hydrologic non-stationarity in far south-eastern Australia: Implications for modelling and prediction. Stoch. Environ. Res. Risk Assess. 2014, 28, 3–15. [Google Scholar] [CrossRef]
- MacDonald, M.C.; Elliott, M.; Langidrik, D.; Chan, T.; Saunders, A.; Koster, B.S.; Taafaki, I.J.; Bartram, J.; Hadwen, W.L. Mitigating drought impacts in remote island atolls with traditional water usage behaviors and modern technology. Sci. Total Environ. 2020, 741, 140230. [Google Scholar] [CrossRef] [PubMed]
- Barkey, B.L.; Bailey, R.T. Estimating the impact of drought on groundwater resources of the Marshall Islands. Water 2017, 9, 41. [Google Scholar] [CrossRef] [Green Version]
- Balmoral Group Australia Upgrade of Norfolk’s Island’s sewerage treatment plant. Capital Works Construction Project; Initial business case. Report for the Norfolk Island Regional Council, October 2019; Balmoral Group Australia: Sydney, Australia.
- Hoare, M. Norfolk Island: A Revised and Enlarged History 1774–1998, 5th ed.; University of Queensland Press: Brisbane, Australia, 1999. [Google Scholar]
- Hydro Tasmania. Norfolk Island Renewable Energy Pre-Feasibility Study, Stage 1; Report for Australian Greenhouse Office. Hydro Tasmania No 114419; Hydro Tasmania: Hobart, Tasmania, Australia, 2003. [Google Scholar]
- John, G.; Cuan, P. Norfolk Island lidar. v1. CSIRO. Data Collection. 2020. Available online: https://doi.org/10.25919/5e4a0e4e93d4c (accessed on 20 June 2022).
- Mitchell, V. How important is the selection of computational analysis method to the accuracy of rainwater tank behaviour modelling? Hydrol. Processes Int. J. 2007, 21, 2850–2861. [Google Scholar] [CrossRef]
- Petheram, C.; Taylor, A.; Hughes, J.; Philip, S.; Tavener, N.; Greenwood, D.; Taylor, N.; Wilson, P.; Raiber, M.; Turnadge, C.; et al. Norfolk Island Water Resource Assessment; A Report to the Australian Government from the CSIRO Norfolk Island Water Resource Assessment Team; CSIRO: Canberra, Australia, 2020. [CrossRef]
- Special Rapporteur on the Human Right to Safe Drinking Water and Sanitation. Available online: https://sr-watersanitation.ohchr.org/en/rightstowater_5.html (accessed on 20 April 2022).
- Moise, A.; Wilson, L.; Grose, M.; Whetton, P.; Watterson, I.; Bhend, J.; Bathols, J.; Hanson, L.; Erwin, T.; Bedin, T.; et al. Evaluation of CMIP3 and CMIP5 models over the Australian region to inform confidence in projections. Aust. Meteorol. Oceanogr. J. 2015, 65, 19–53. [Google Scholar] [CrossRef]
- Chiew, F.H.S.; Teng, J.; Vaze, J.; Post, D.A.; Perraud, J.M.; Kirono, D.G.C.; Viney, N.R. Estimating climate change impact on runoff across southeast Australia: Method, results, and implications of the modelling method. Water Resour. Res. 2009, 45, 129624384. [Google Scholar] [CrossRef]
- Read, A.; Gallant, J.; Petheram, C. DamSite: An automated method for the regional scale identification of dam wall locations. In Proceedings of the 34th Hydrology & Water Resources Symposium, Sydney, Australia, 19–22 November 2012. Engineers Australia. [Google Scholar]
- Petheram, C.; Gallant, J.; Read, A. DamSite: An automated and rapid method for identifying dam wall locations. Environ. Model. Softw. 2017, 92, 189–201. [Google Scholar] [CrossRef]
- Petheram, C.; Gallant, J.; Stone, P.; Wilson, P.; Read, A. Rapid assessment of potential for development of large dams and irrigation across continental areas: Application to northern Australia. Rangel. J. 2018, 40, 431–449. [Google Scholar] [CrossRef]
- Fitzpatrick, R. Management of Excavated Peaty Acid Sulfate Soil with Hypersulfidic Material from a Potential New Headstone Dam on Norfolk Island; CSIRO: Adelaide, Australia, 2020. [CrossRef]
- McMahon, T.A.; Adeloye, A.J. Water Resources Yield; Water Resources Publications: Littleton, CO, USA, 2005.
- Cook, S.; Sharma, A.; Chong, M. Performance analysis of a communal residential rainwater system for potable supply: A case study in Brisbane, Australia. Water Resour. Manag. 2013, 27, 4865–4875. [Google Scholar] [CrossRef]
- Director of National Parks. Temperate East Marine Parks Network Management Plan 2018; Director of National Parks: Canberra, Australia, 2018.
- CitiWater Magnetic Island Water Recycling Project. City of Townsville. Available online: http://www.soe-townsville.org/sustainable/citiwater.html (accessed on 22 July 2021).
- Zhang, L.; Dawes, W.R.; Walker, G.R. Response of mean annual evapotranspiration to vegetation changes at catchment scale. Water Resour. Res. 2001, 37, 701–708. [Google Scholar] [CrossRef]
- Petheram, C.; Walker, G.; Grayson, R.; Thierfelder, T.; Zhang, L. Towards a framework for predicting impacts of land-use on recharge: 1. A review of recharge studies in Australia. Aust. J. Soil Res. 2002, 40, 397–417. [Google Scholar] [CrossRef]
- Zhang, L.; Dawes, W. Waves—An Integrated Energy and Water Balance Model. CSIRO Land and Water Technical Report No. 31/98; 1998. Available online: https://research.csiro.au/software/waves/ (accessed on 27 June 2022).
- NRMMC-EPHC-NHMRC. Australian Guidelines for Water Recycling: Managed Aquifer Recharge; National Water Quality Management Strategy Document No. 24; Natural Resource Management Ministerial Council, Environmental Protection and Heritage Council, National Health and Medical Research Council: Canberra, Australia, 2009. [Google Scholar]
- Ansar, A.; Flyvbjerg, B.; Budzier, A.; Lunn, D. Should we build more large dams? The actual costs of hydropower megaproject development. Energy Policy 2014, 69, 43–56. [Google Scholar] [CrossRef] [Green Version]
- Kelaher, B.P.; Clark, G.F.; Johnston, E.L.; Coleman, M.A. Effect of desalination discharge on the abundance and diversity of reef fishes. Environ. Sci. Technol. 2020, 54, 735–744. [Google Scholar] [CrossRef]
- Clark, R.; Gonzalez, D.; Dillon, P.; Charles, S.; Cresswell, D.; Naumann, B. Reliability of water supply from stormwater harvesting and managed aquifer recharge with a brackish aquifer in an urbanising catchment and changing climate. Environ. Model. Softw. 2015, 72, 17–125. [Google Scholar] [CrossRef]
| Publisher’s Note: MDPI stays neutral with regard to jurisdictional claims in published maps and institutional affiliations. |
© 2022 by the authors. Licensee MDPI, Basel, Switzerland. This article is an open access article distributed under the terms and conditions of the Creative Commons Attribution (CC BY) license (https://creativecommons.org/licenses/by/4.0/).


 ,
, 


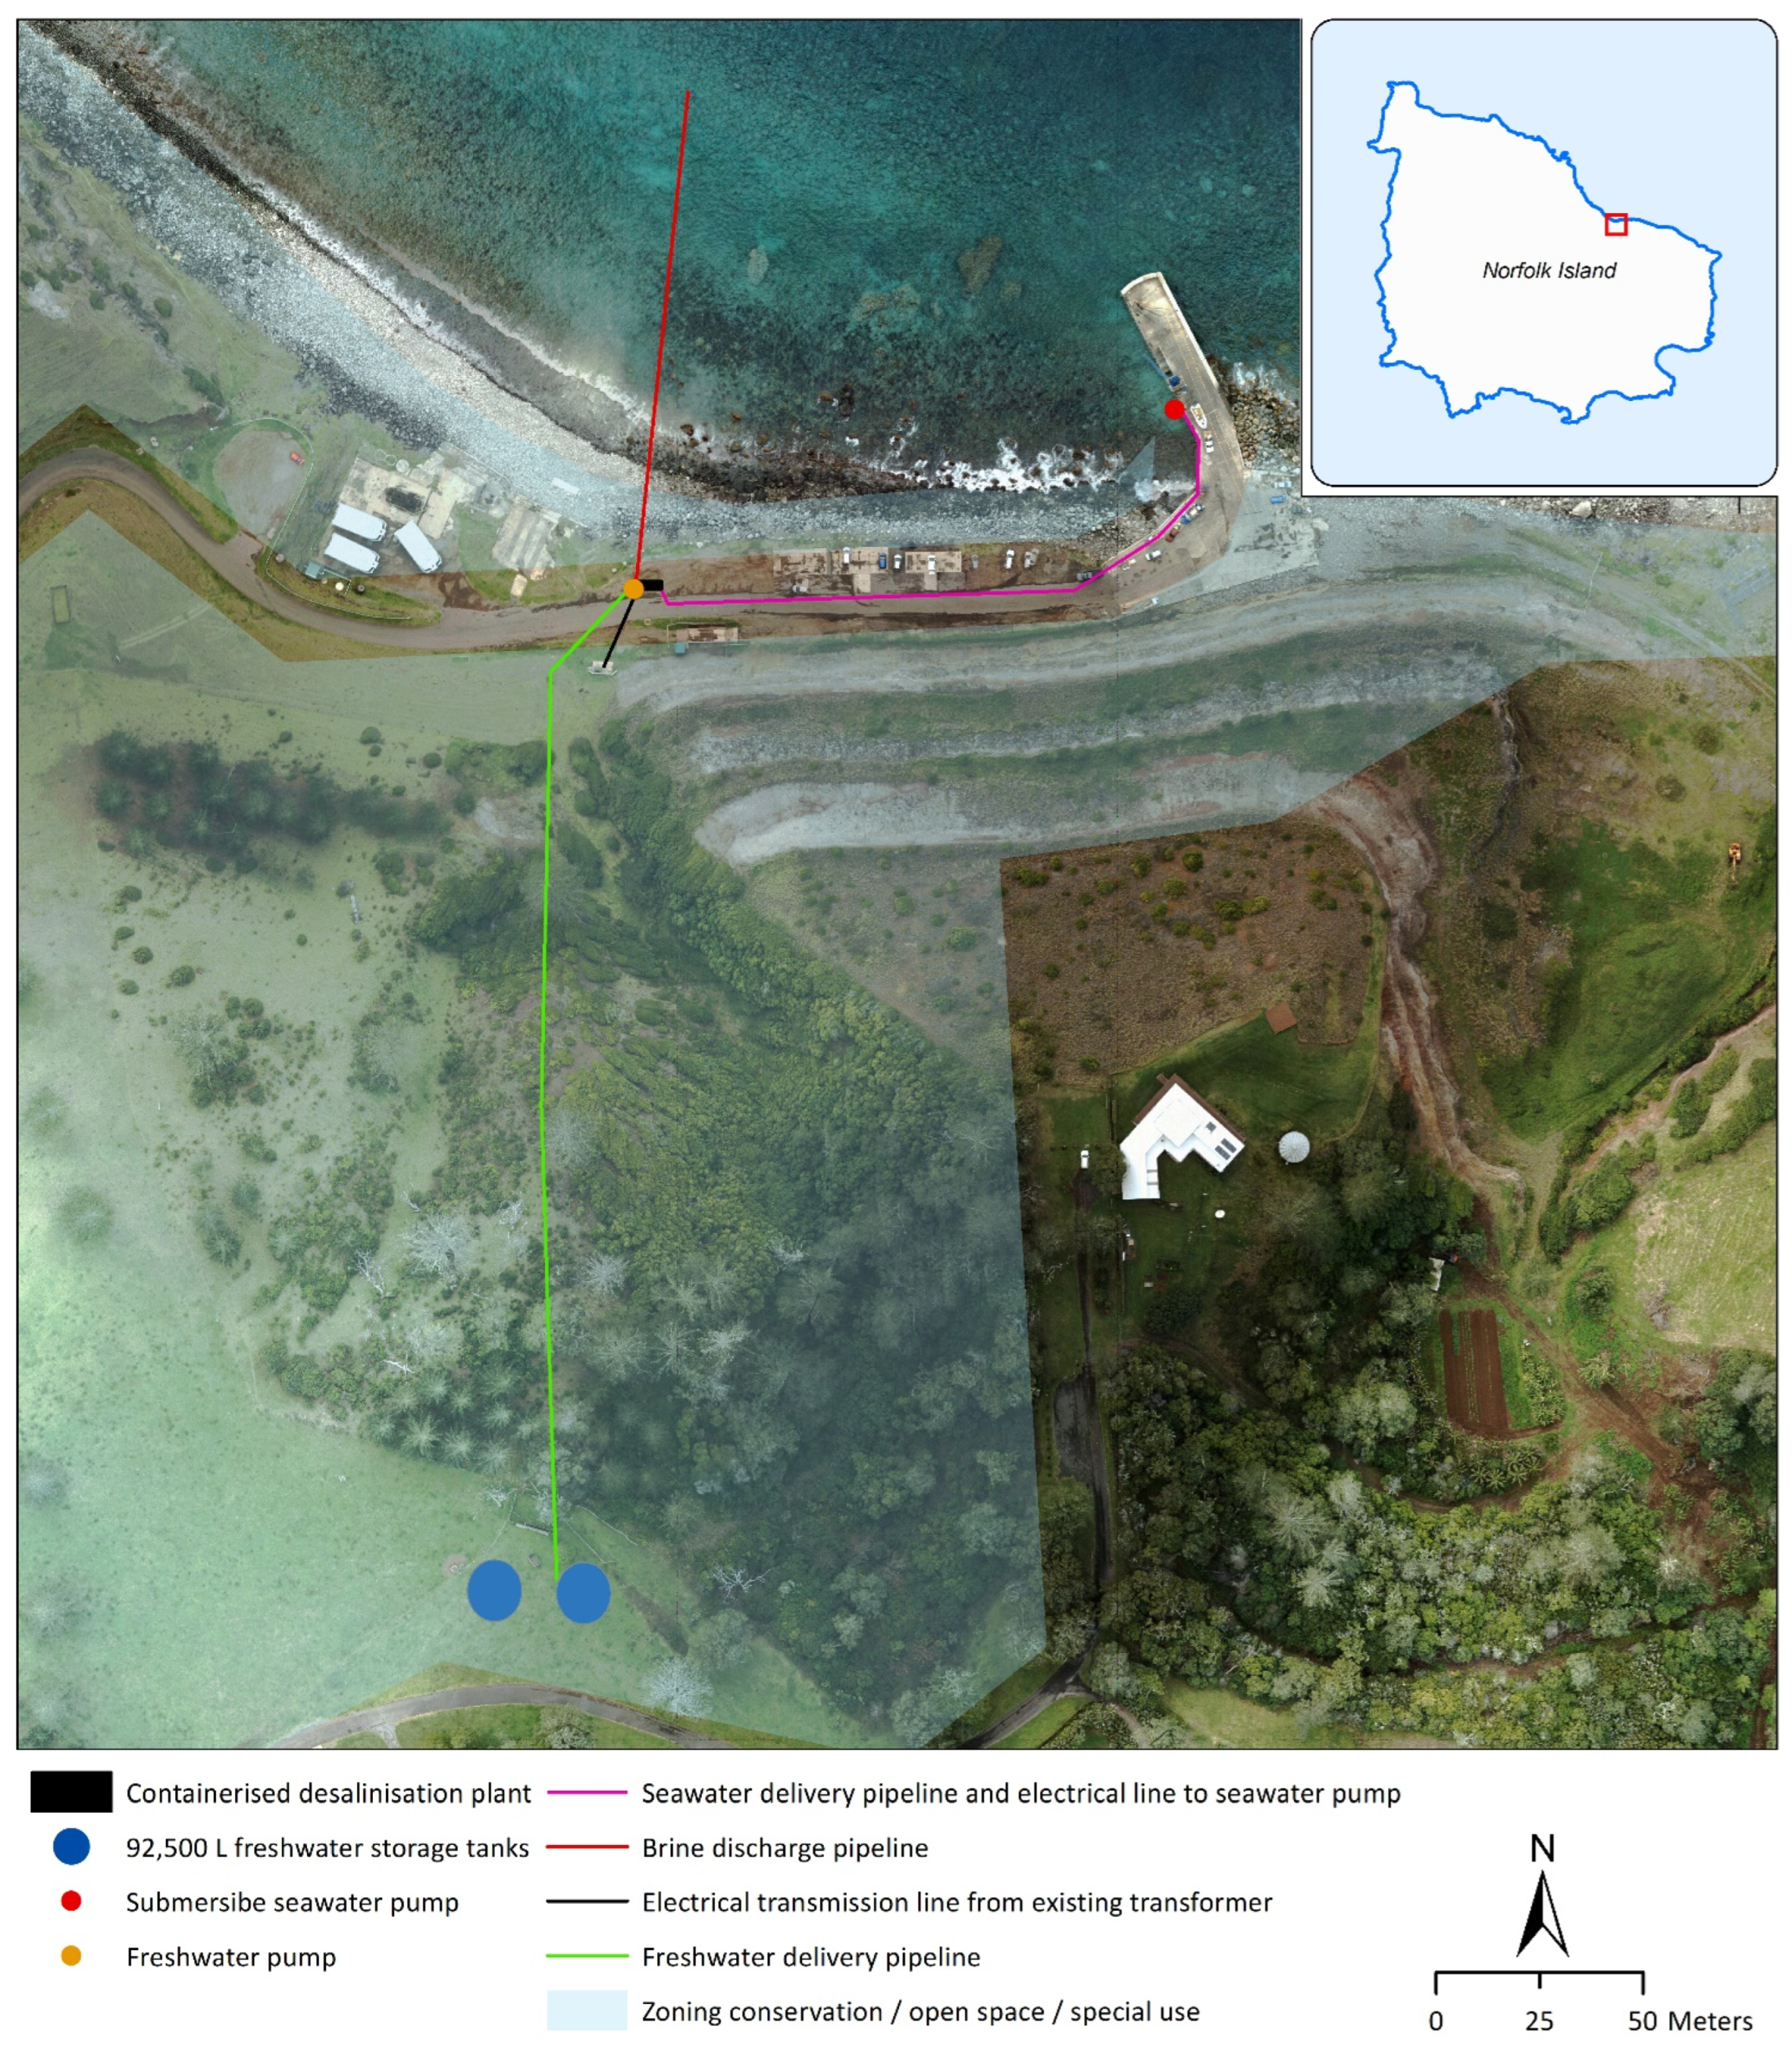
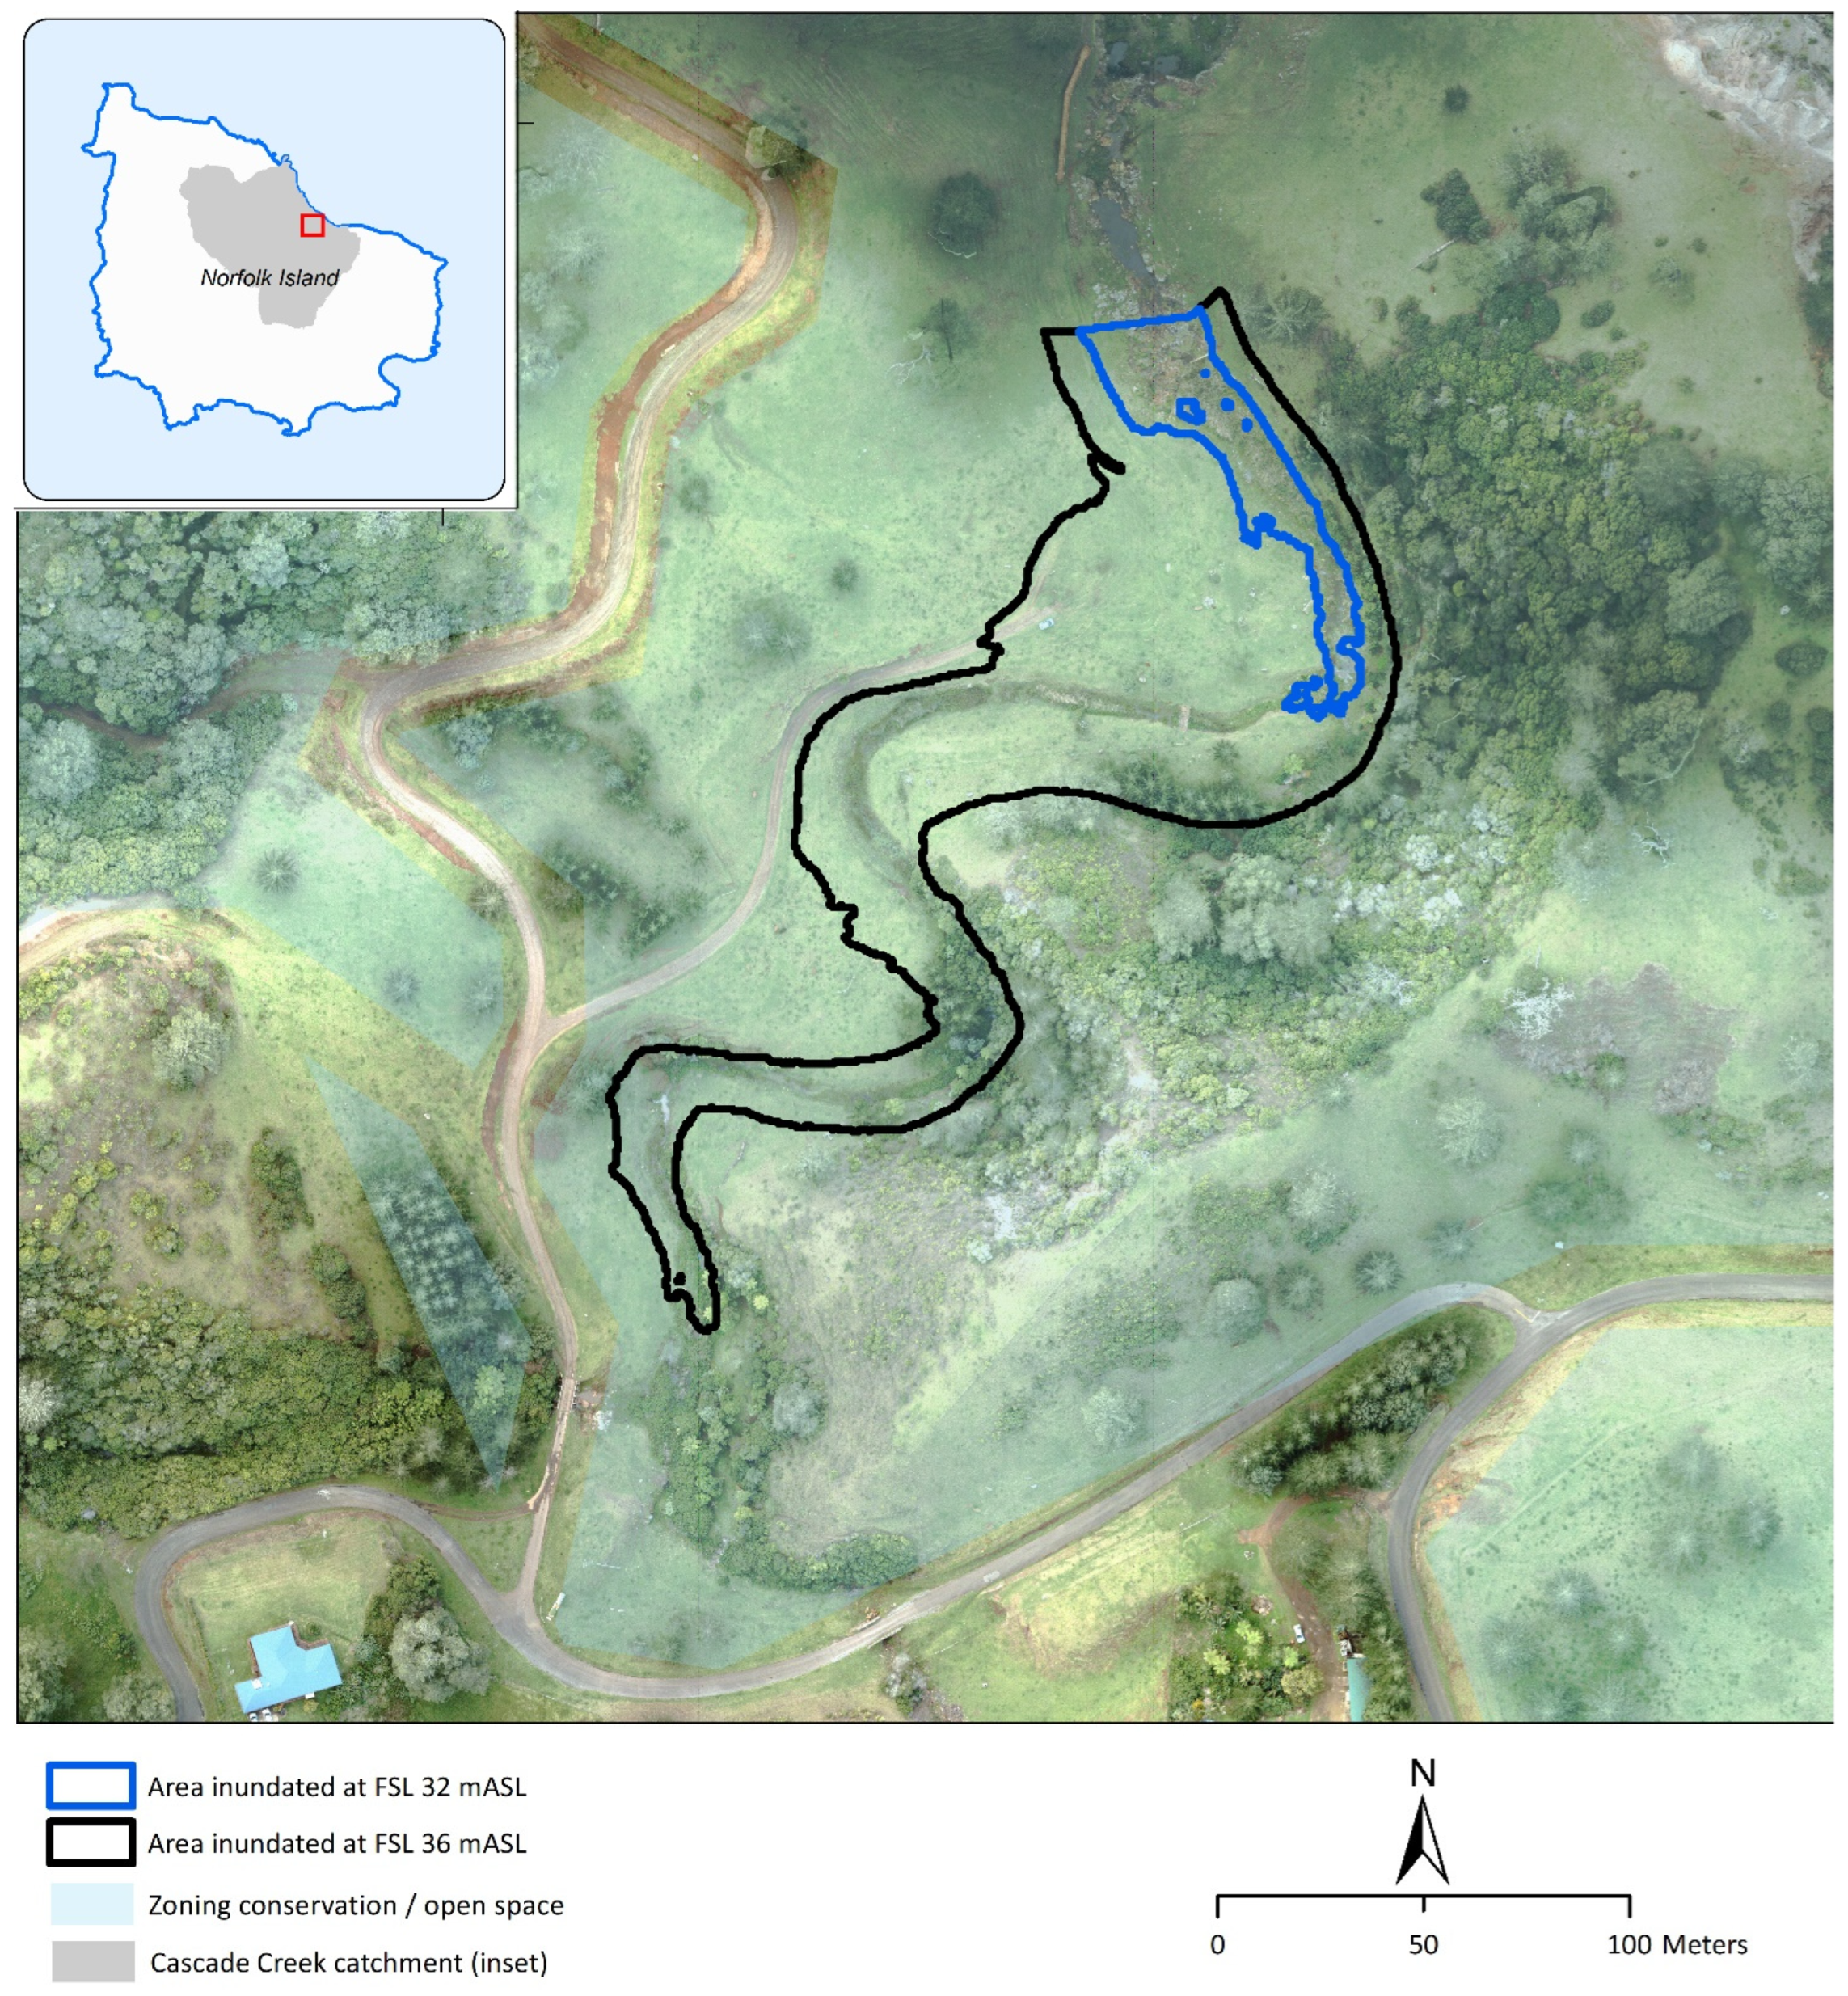
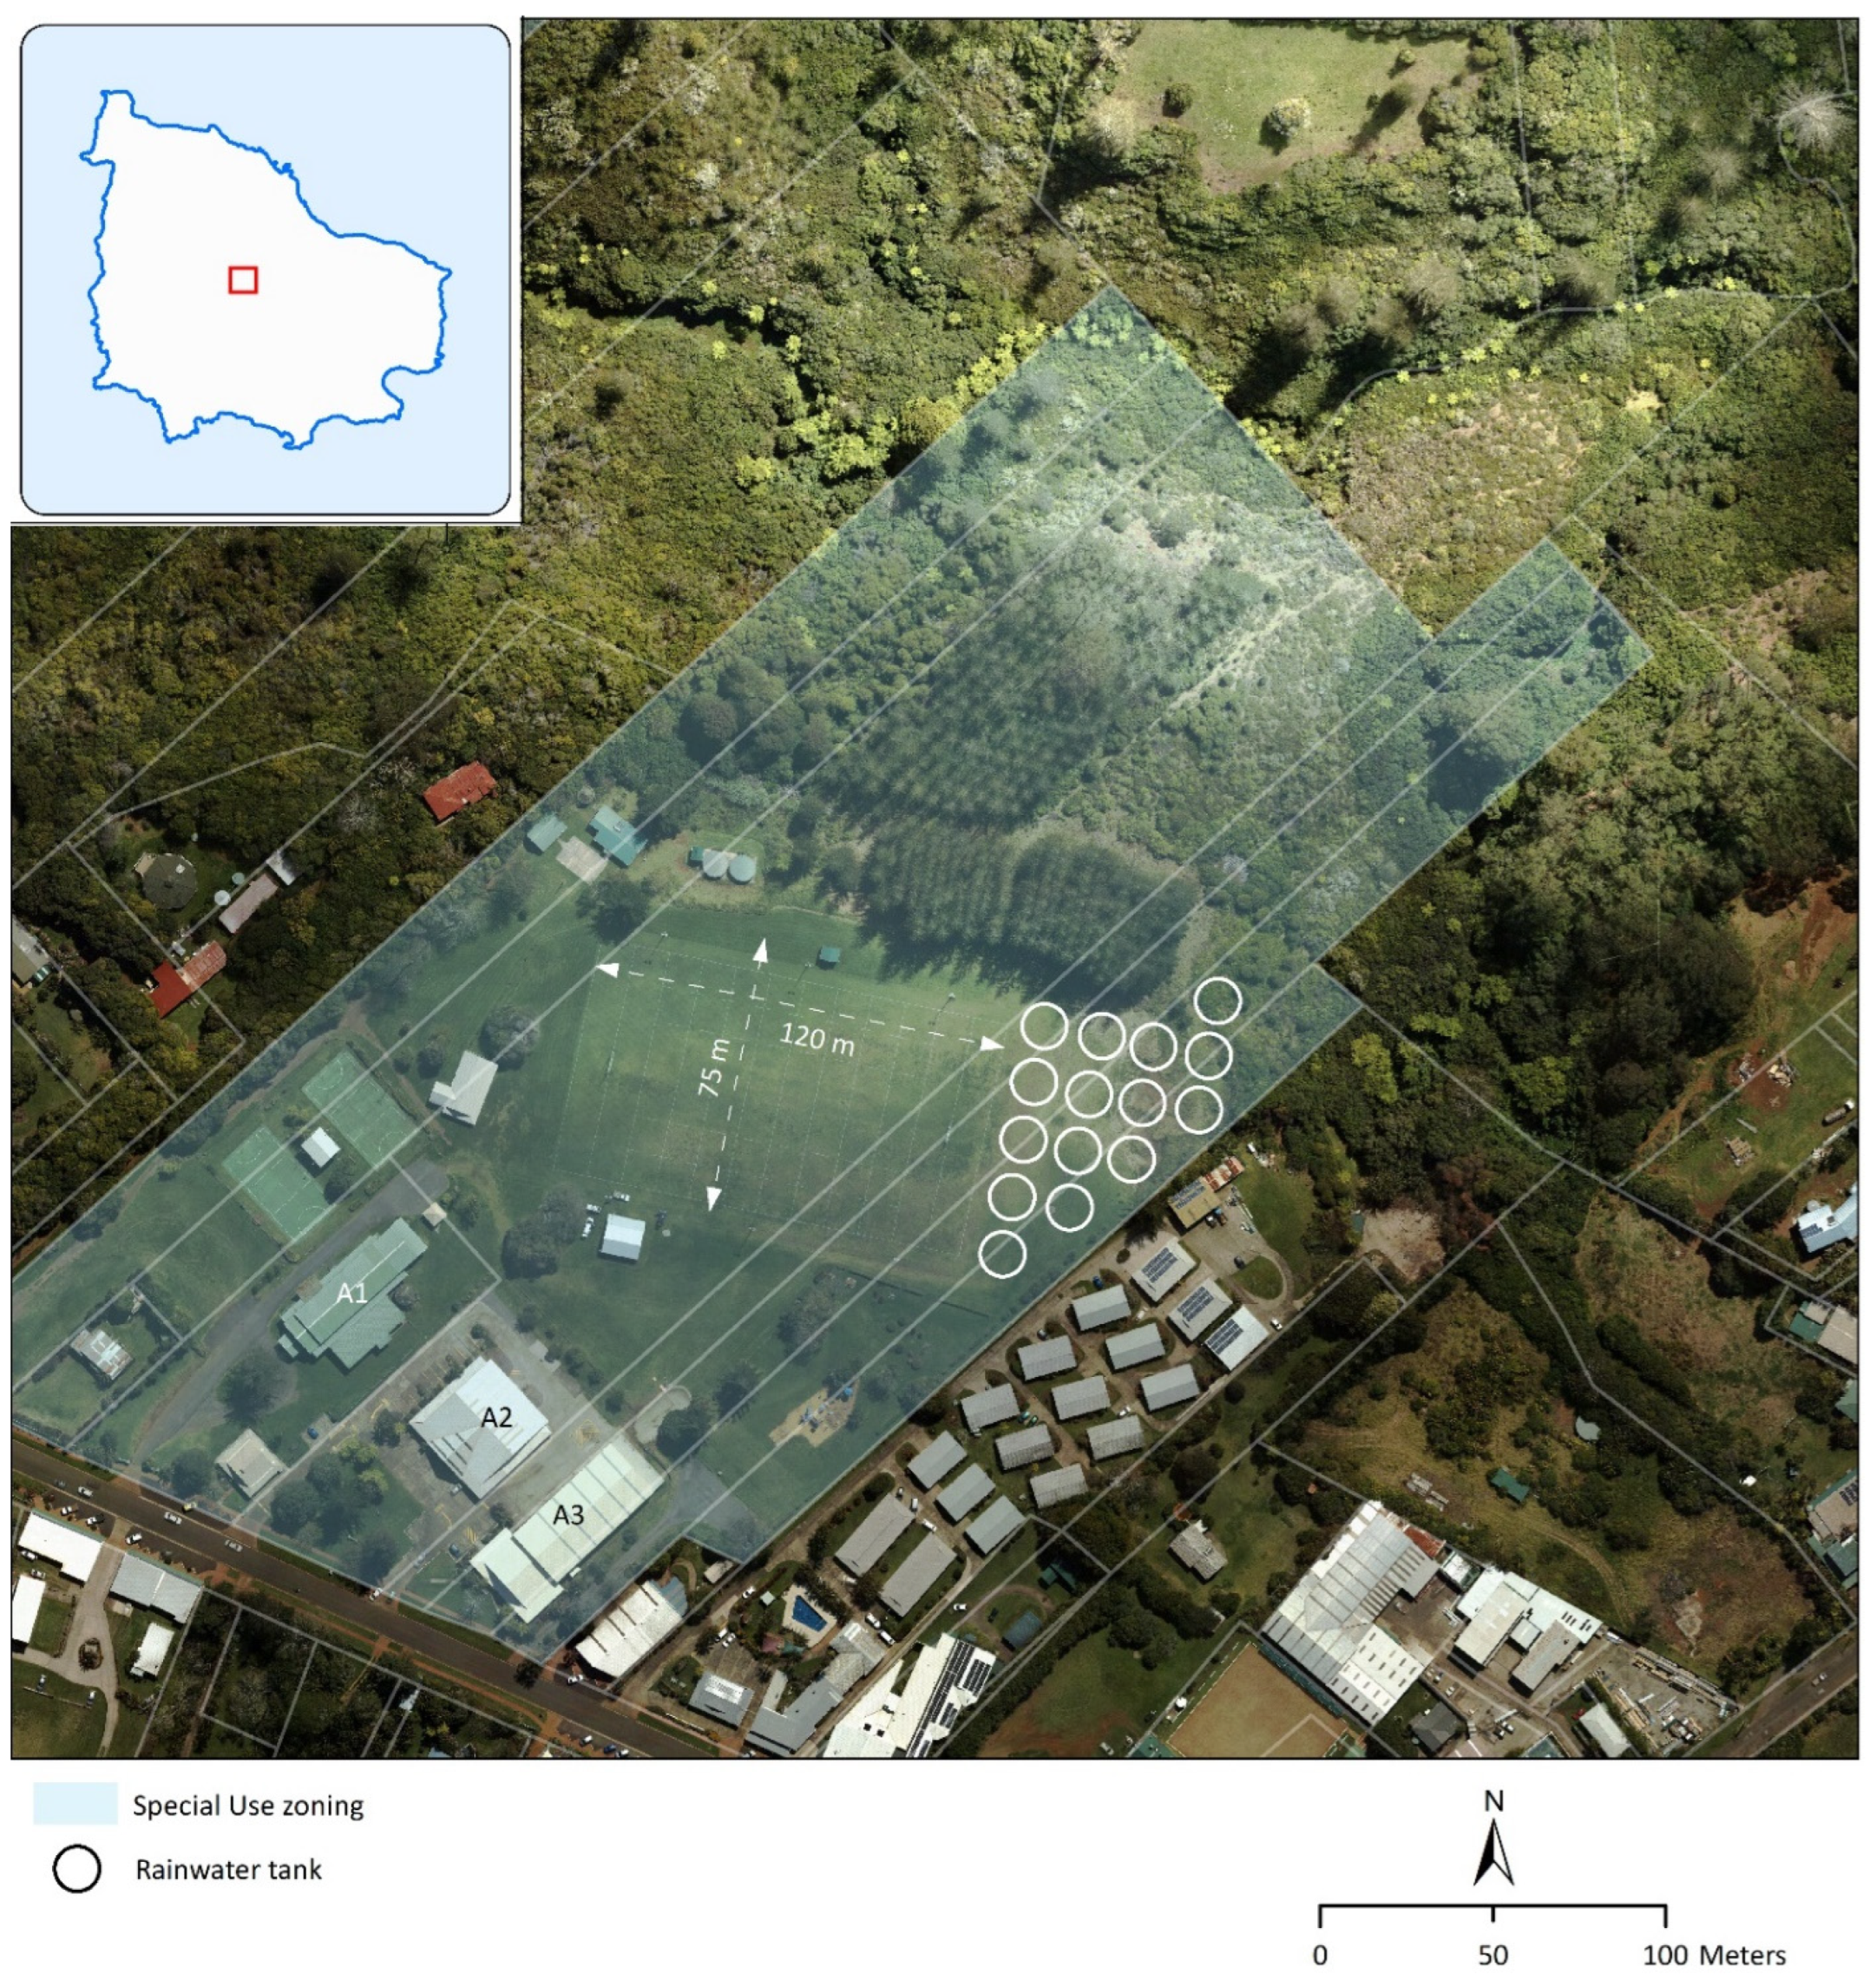
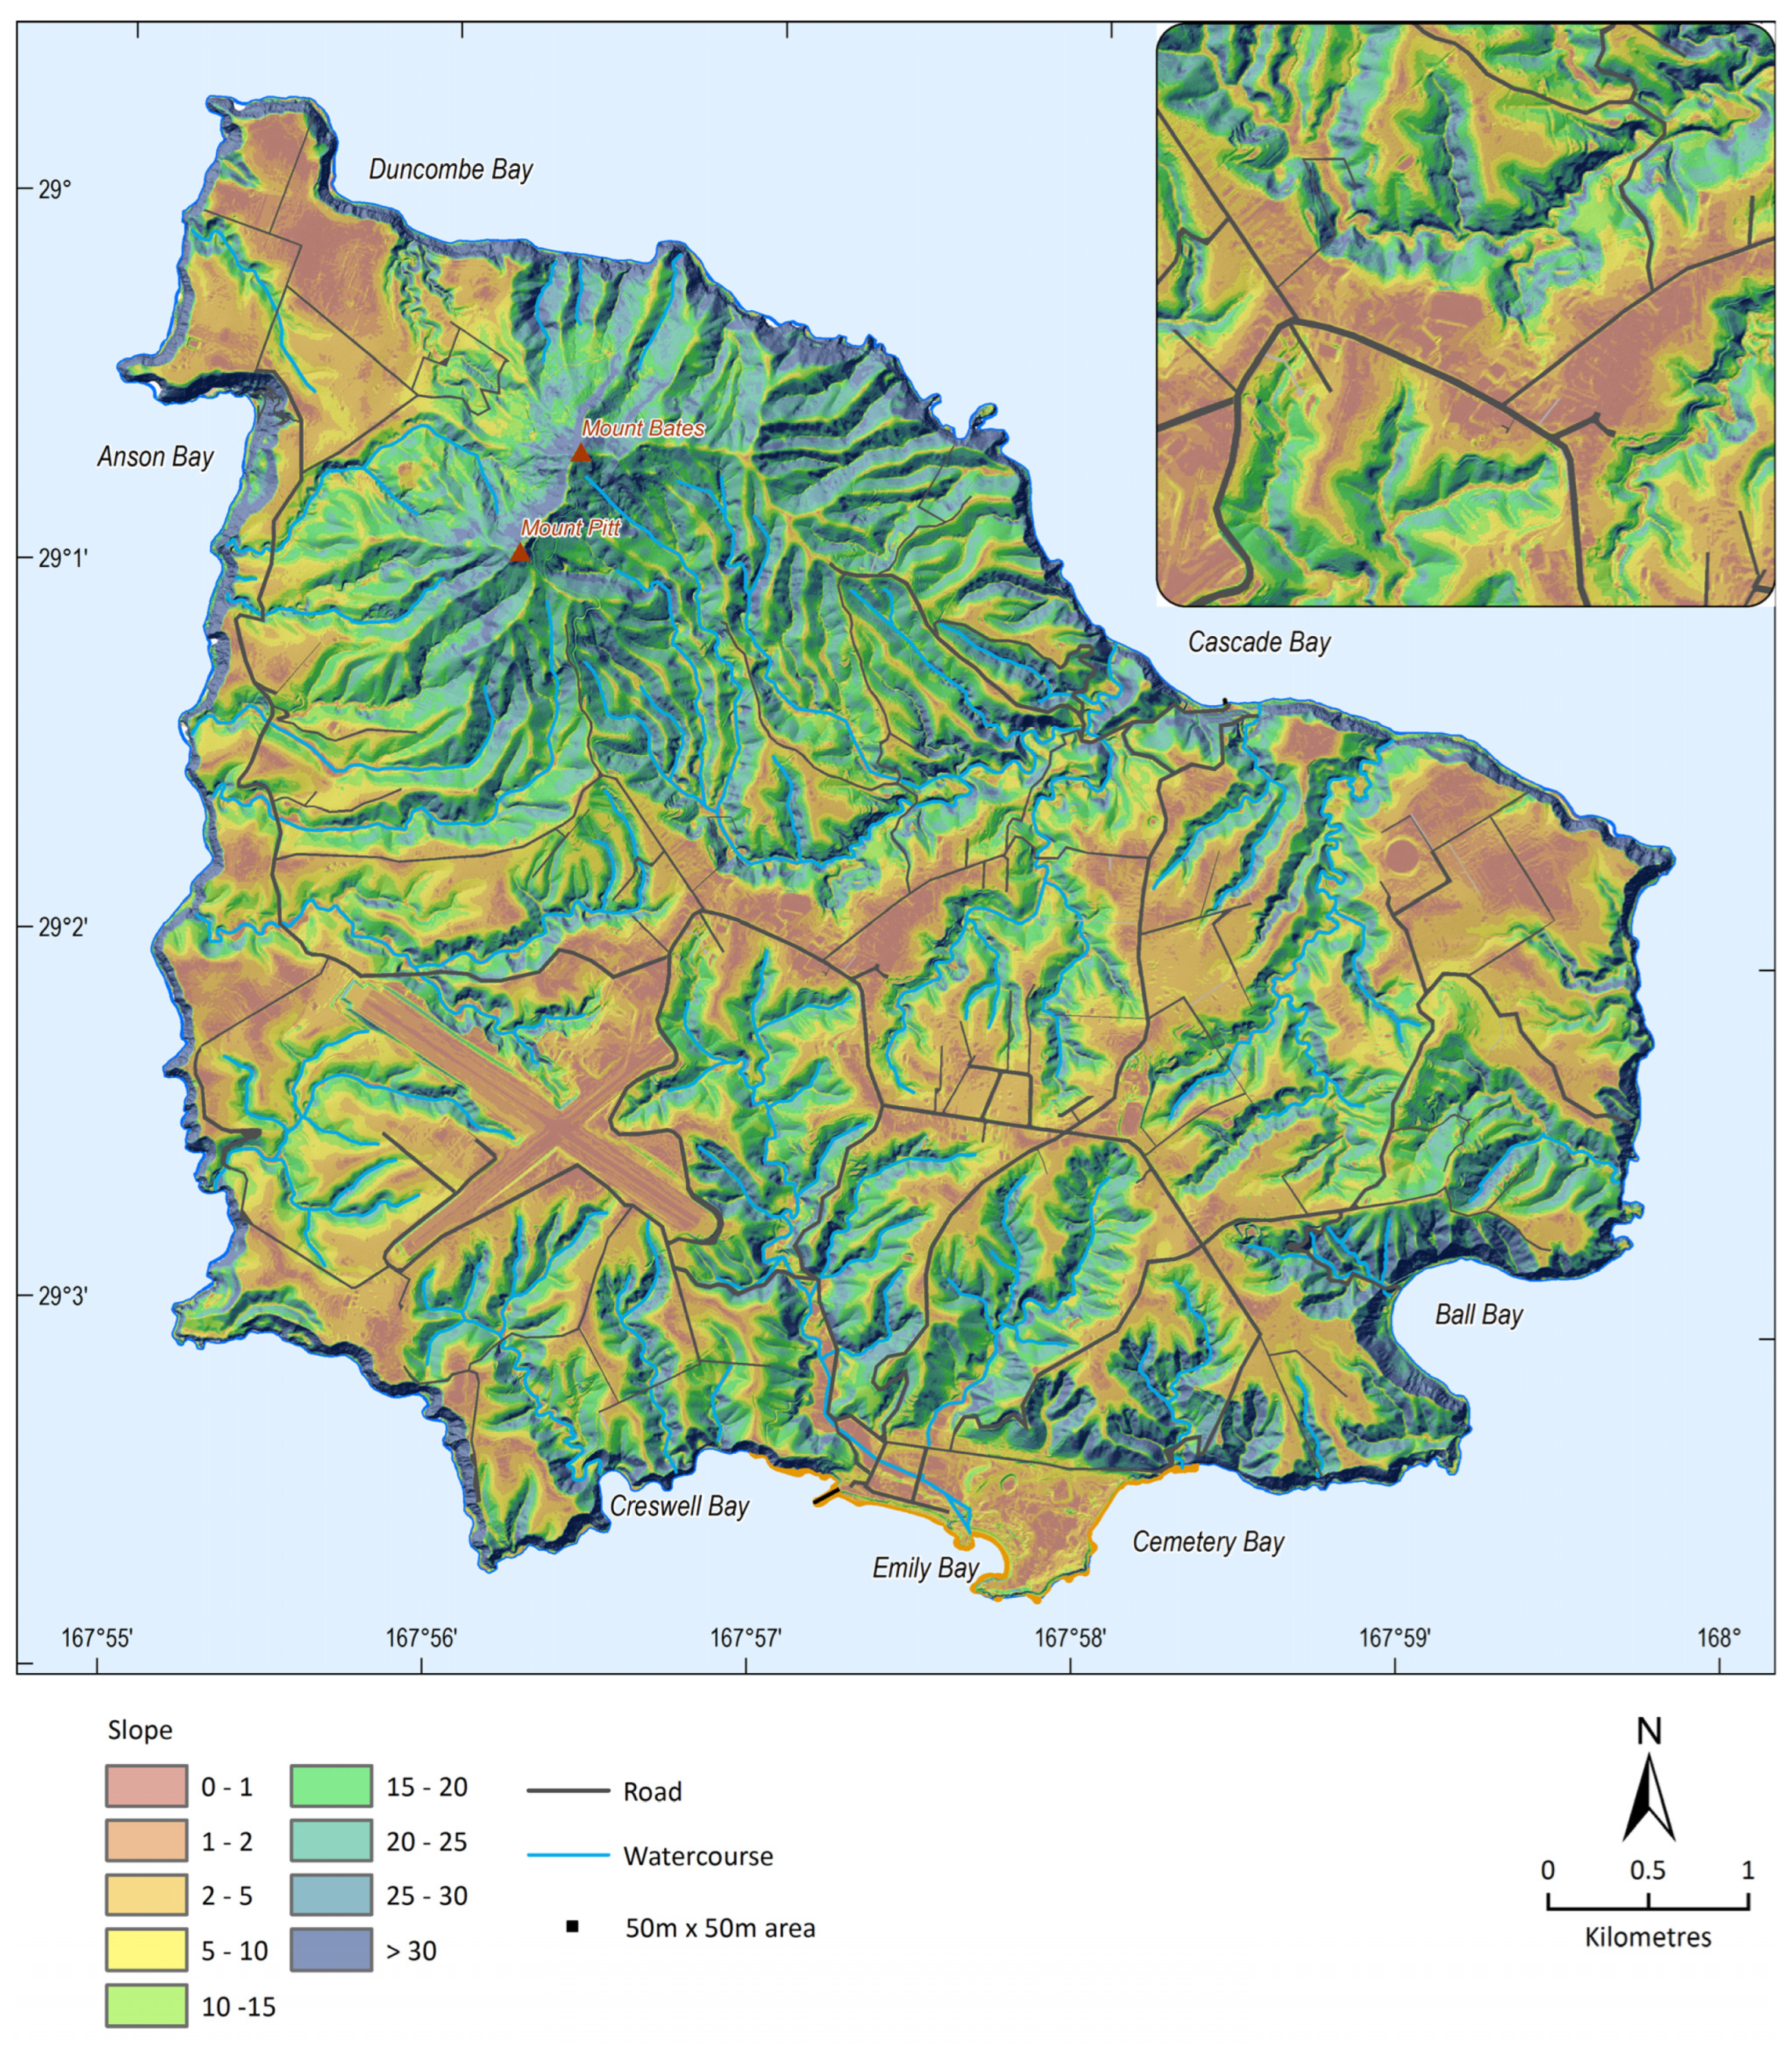
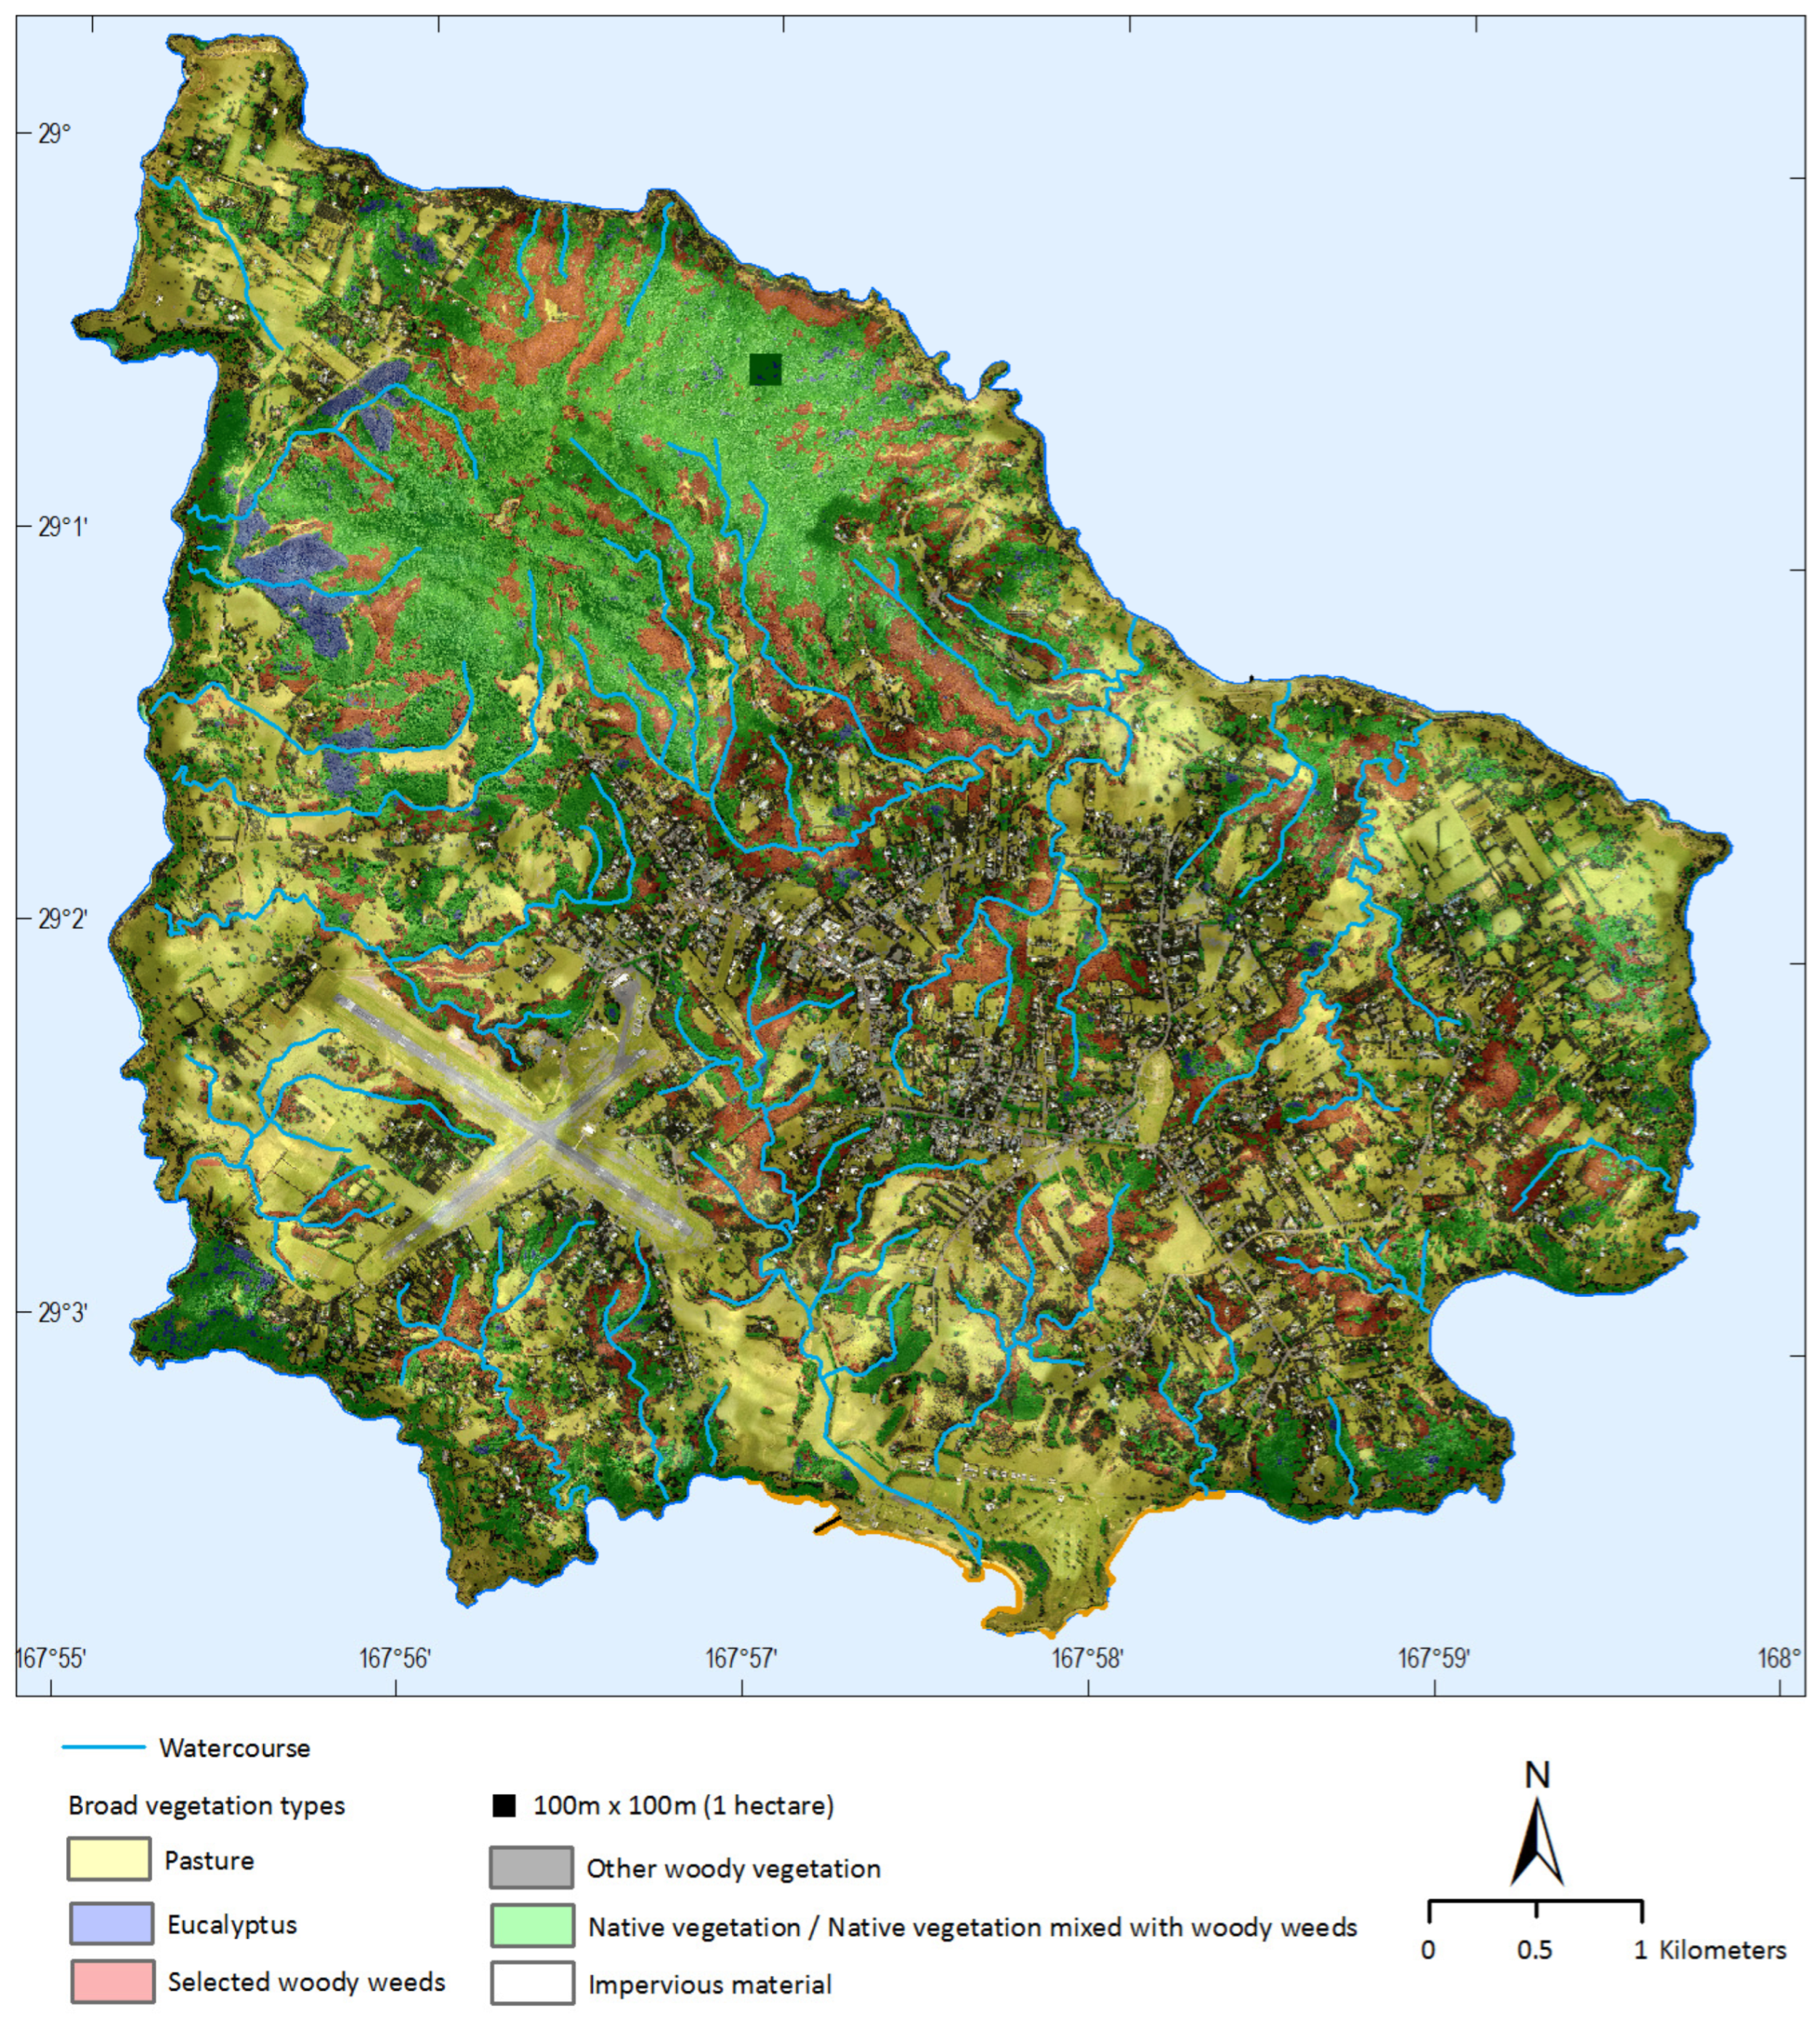
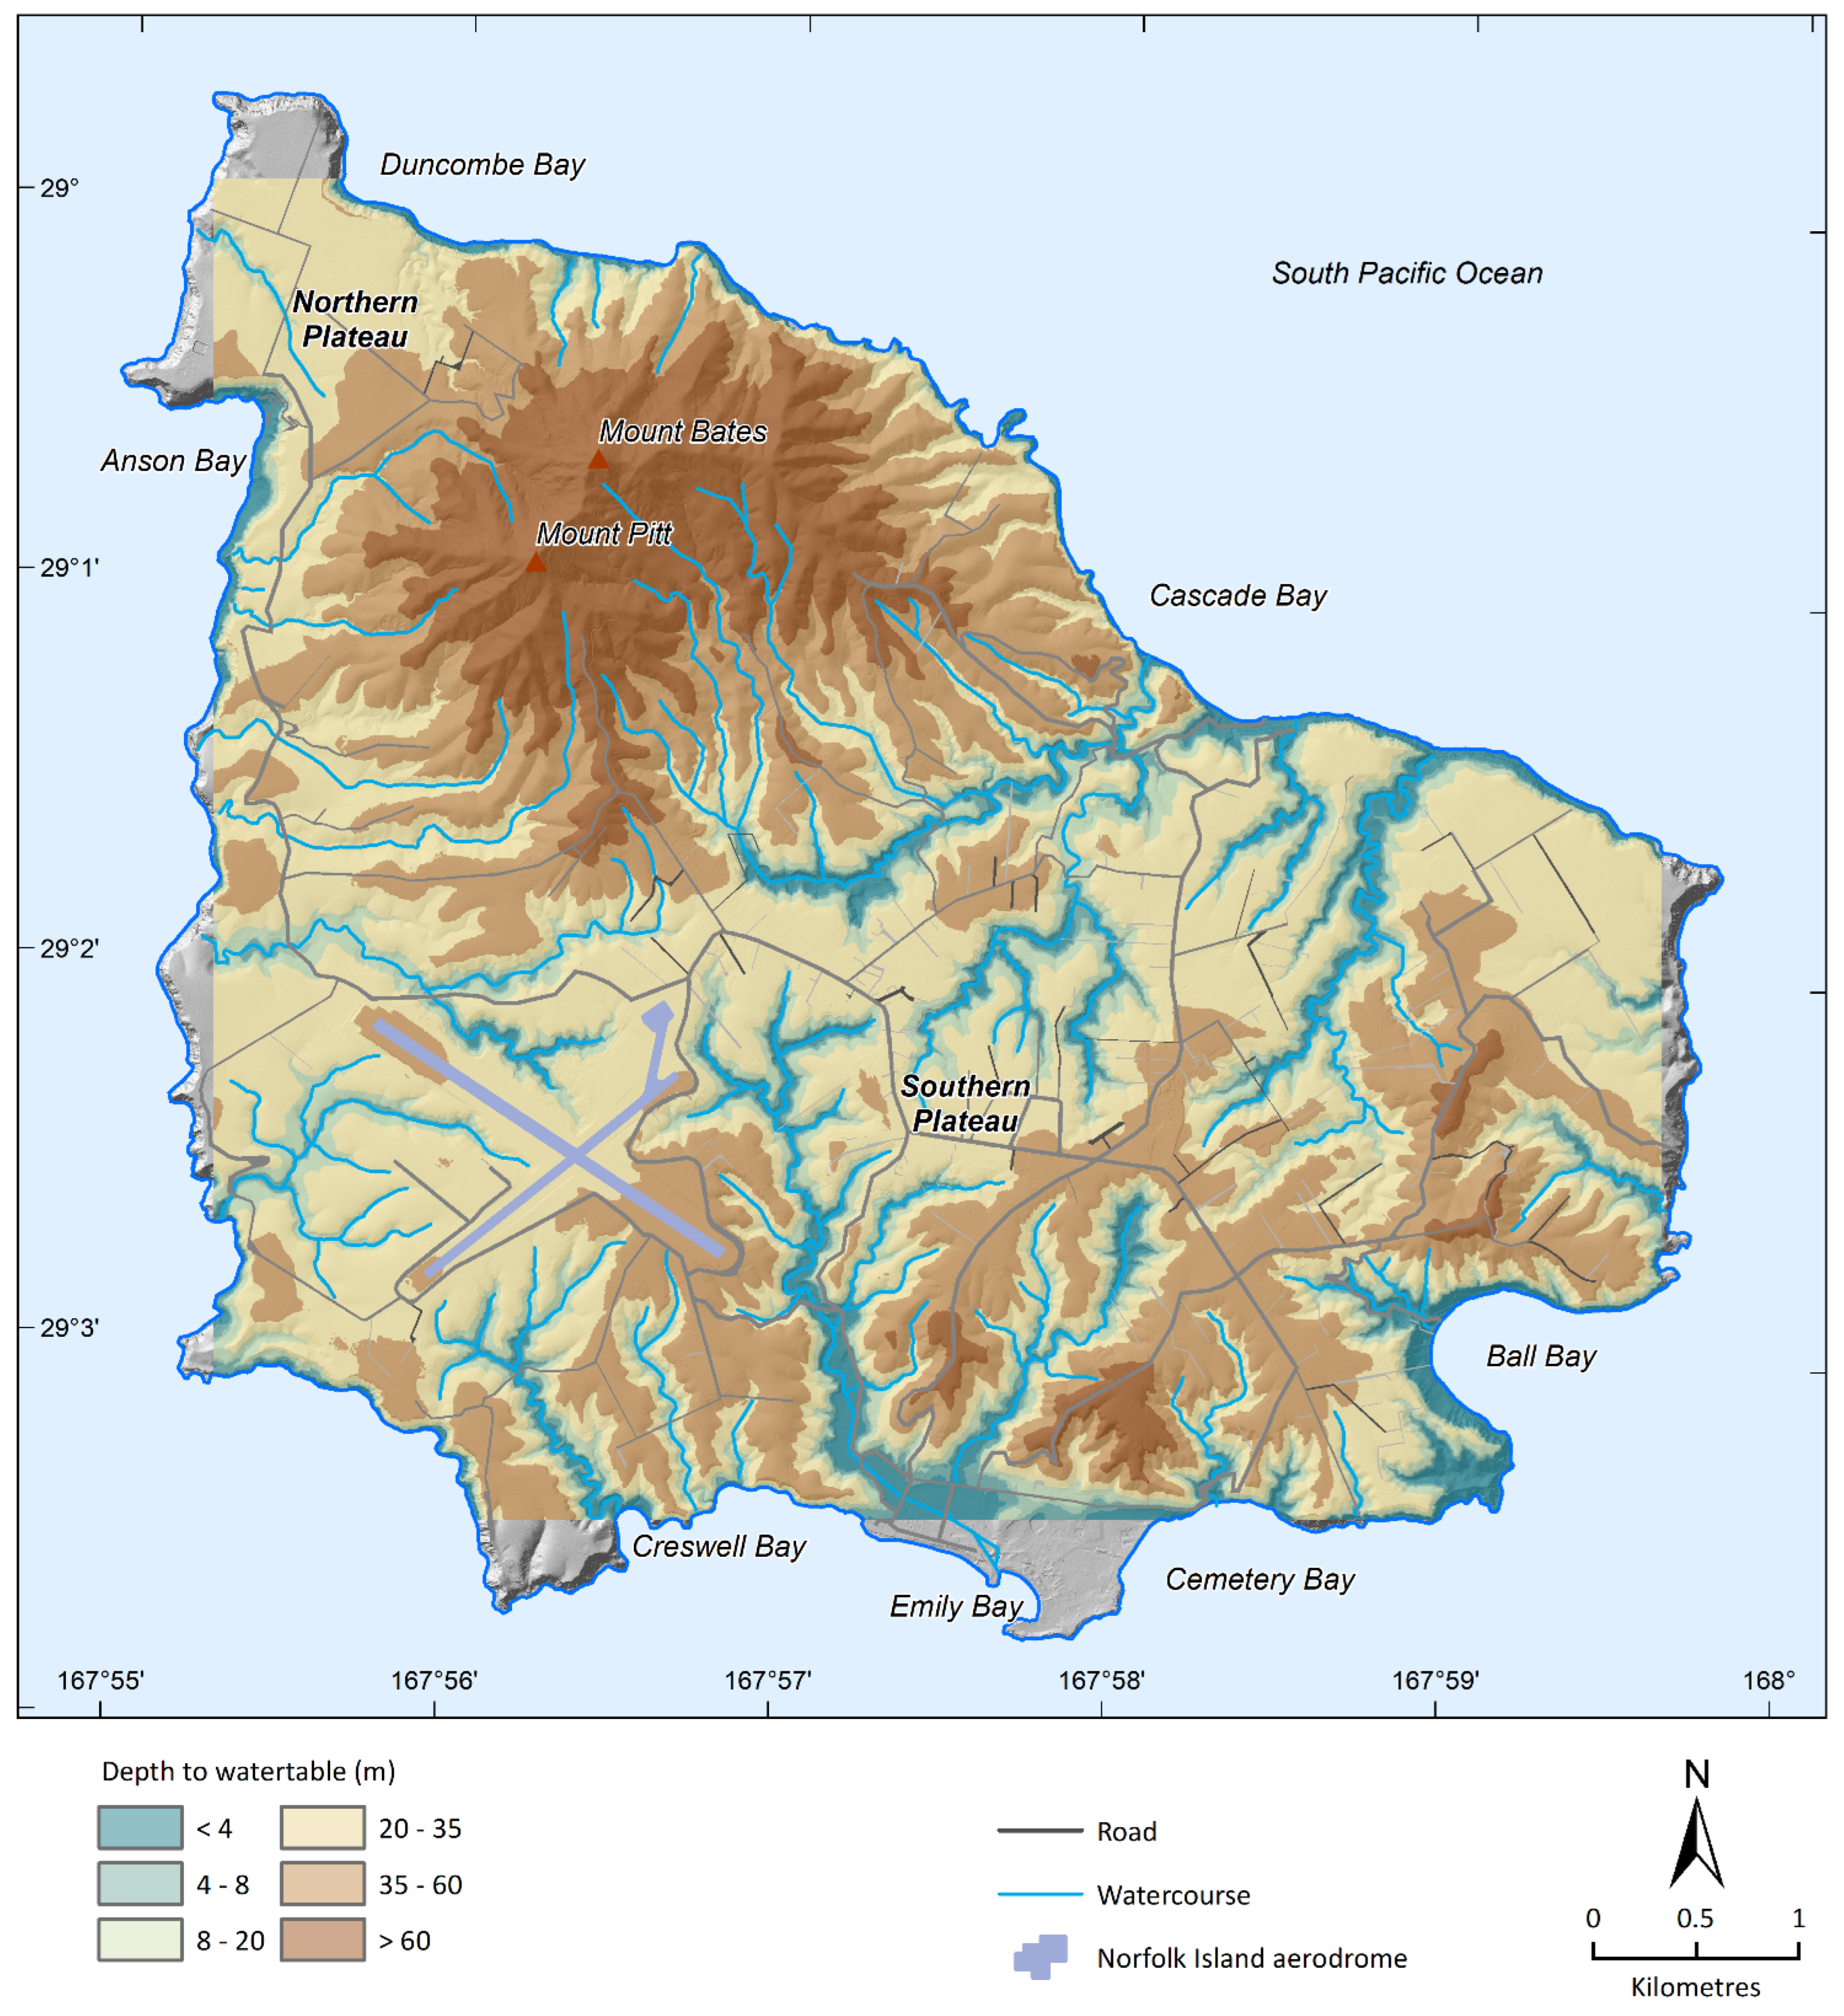