
Problems of Local Flooding in Functional Urban Areas in Poland


Department of Land Improvement, Environmental Development and Spatial Management, Poznań University of Life Sciences, Piątkowska 94, 60-649 Poznań, Poland
Water 2022, 14(16), 2453; https://doi.org/10.3390/w14162453
Submission received: 20 July 2022
/
Revised: 6 August 2022
/
Accepted: 8 August 2022
/
Published: 9 August 2022
(This article belongs to the Special Issue Functional Urban Areas: A Key Challenge in Integrated Urban Water Management)
Abstract
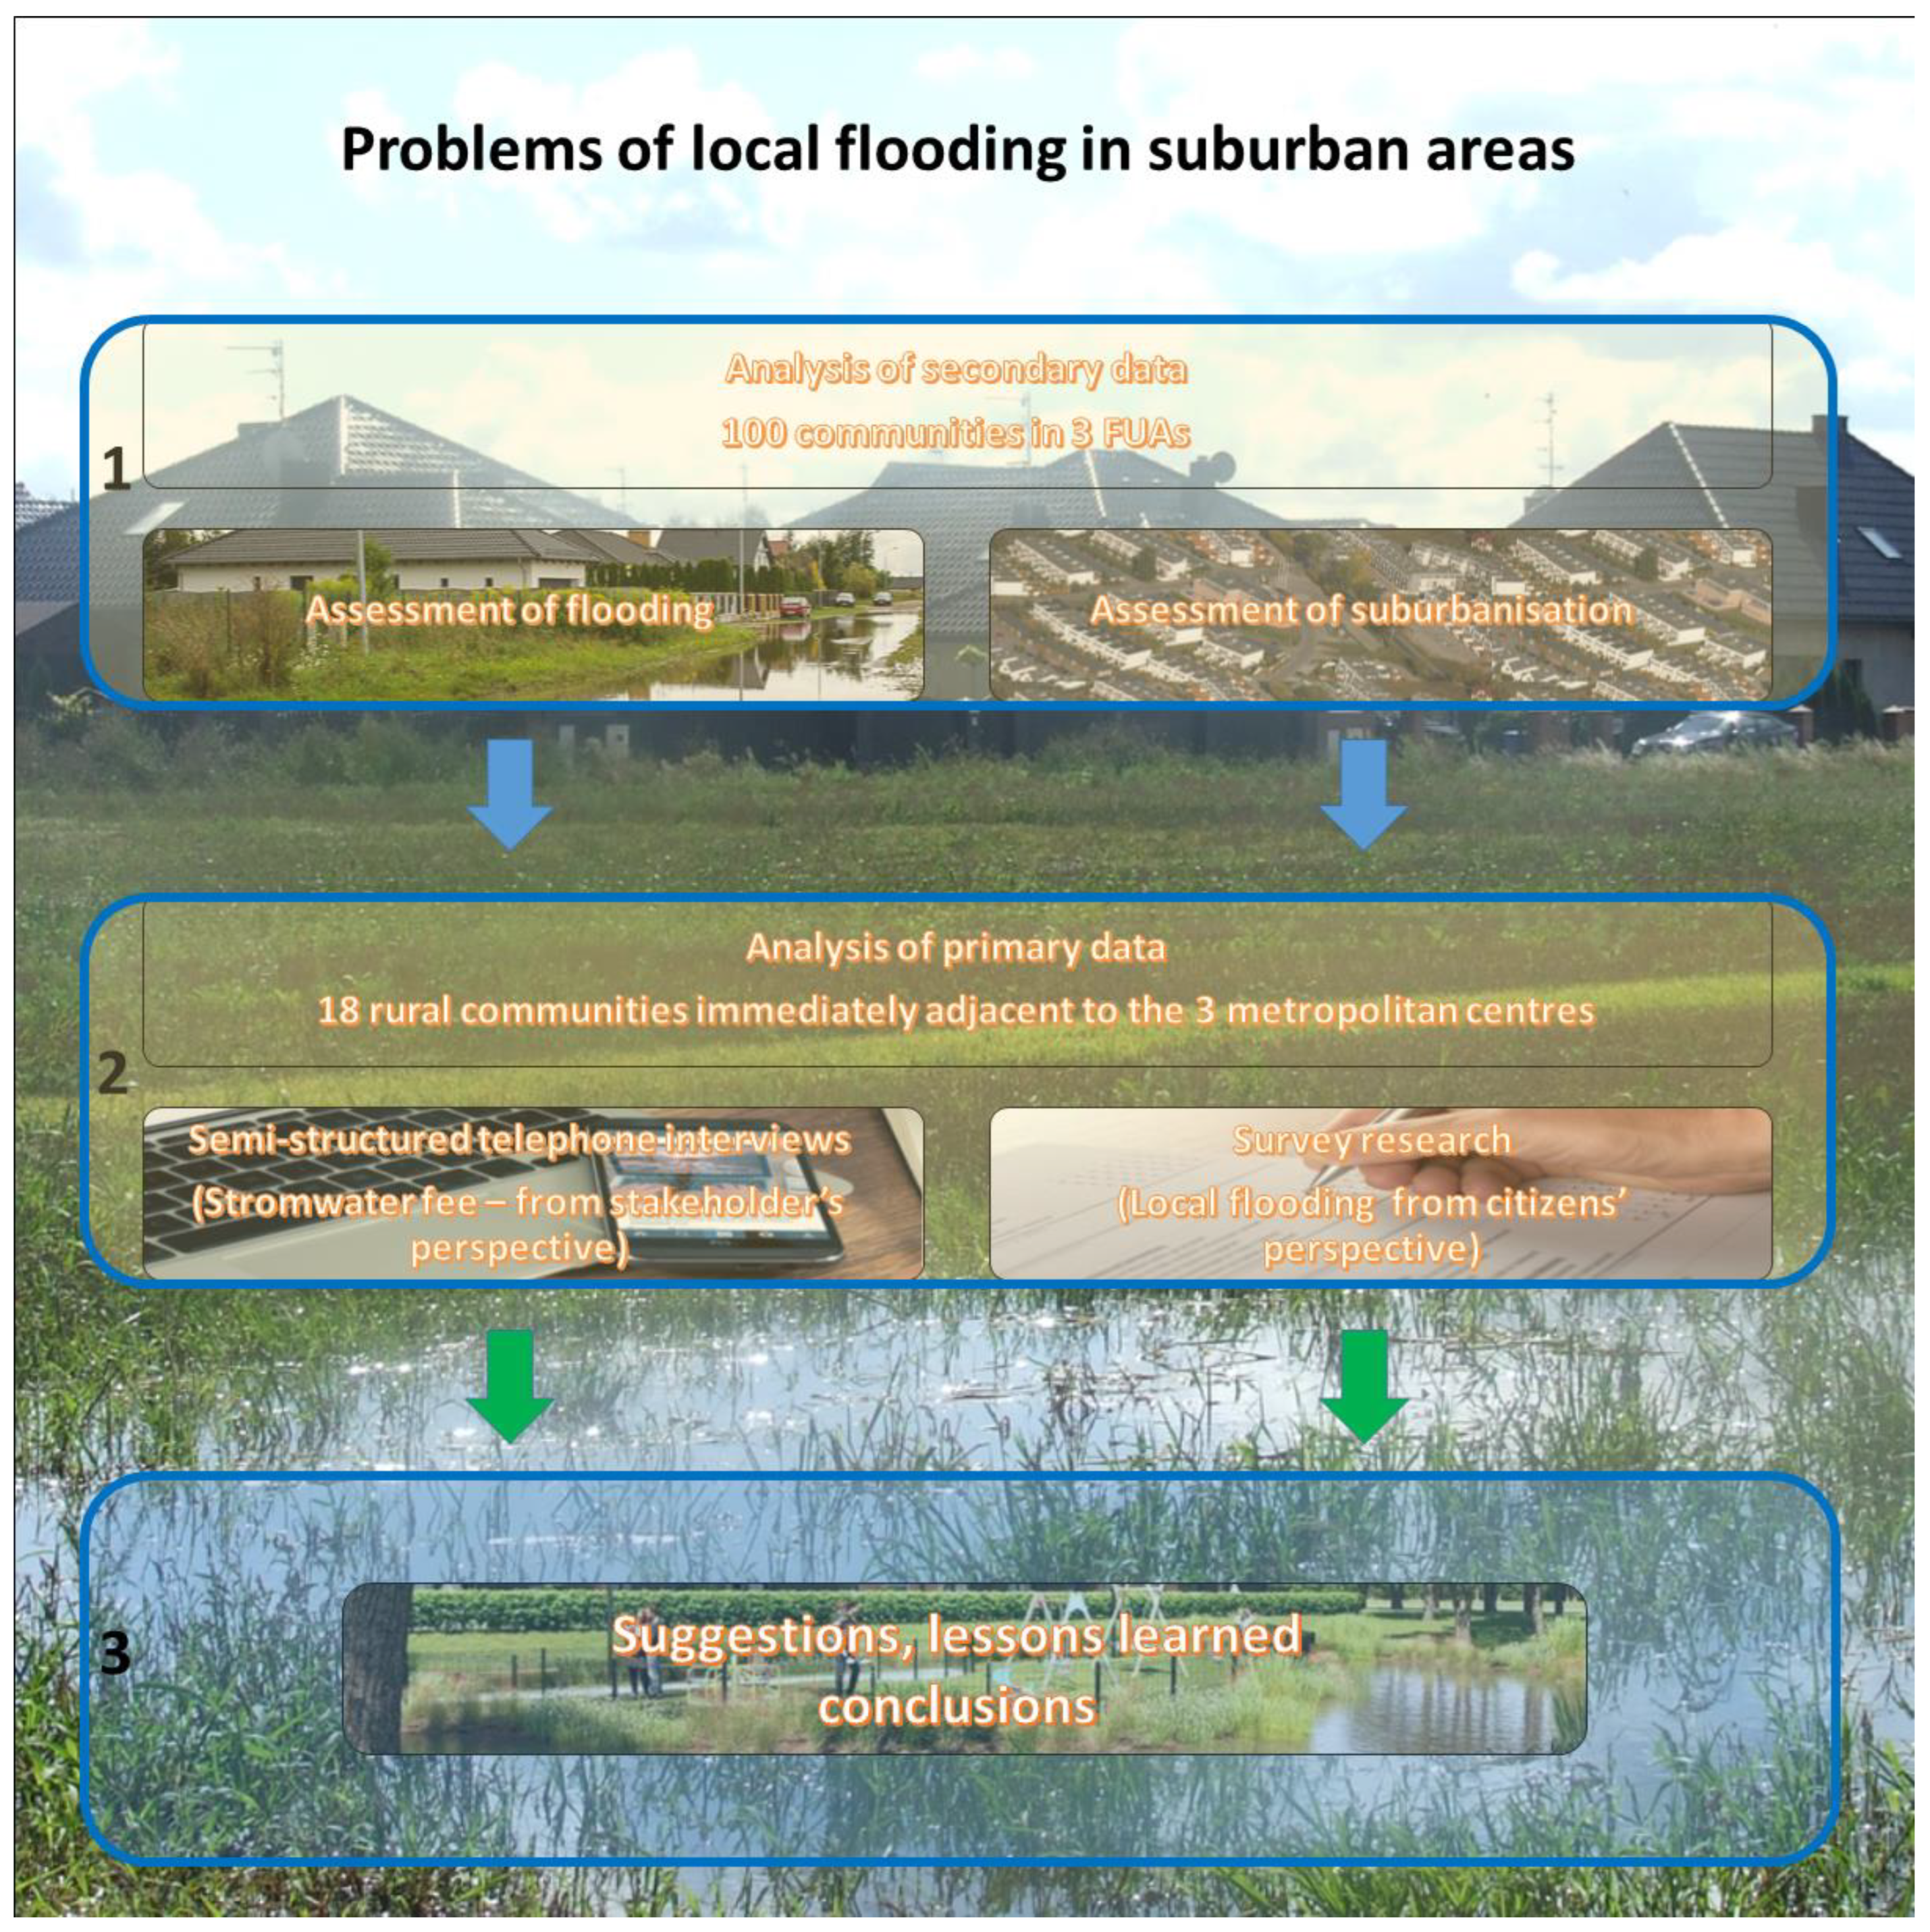
:The research process of developing recommendations for rural communities directly adjacent to metropolitan cities in the field of local flooding protection, especially retention fee was preceded by: analysis of secondary data in 100 communities in three Functional Urban Areas (Metropolitan Areas, MA) in Poland: Poznań MA, Wrocław MA and Łódź MA (assessment of flooding and urbanization), analysis of primary data in 18 rural communities immediately adjacent to the metropolitan centers: semi-structured telephone interviews (stormwater fee from the stakeholder perspective) and survey research (local floodings from the citizen perspectives). To illustrate the scale of the flooding problem in MAs, flood risk maps were used along with data from the State Fire Service on local threats, and for assessing the scale of suburbanization data obtained from Statistics Poland. Although residents confirmed their readiness to co-finance the activities supporting the development of water retention, local authorities were hesitant to introduce additional charges for the residents. Therefore, a better solution would be to set the fees already at the national level. However, communities should be given more power with regards to the distribution of collected funds which, in turn, should be allocated directly to the local programs for the enhancement of retention capacity in the local catchments.
1. Introduction
According to the IPCC’s latest report, the Earth’s average temperature will continue to rise until at least the middle of the 21st century, with higher warming expected in cities forming the so-called heat islands [1]. An increase of global temperature by 1 °C will each time result in, among other things, local disturbances in the water cycle and intensification of extreme weather phenomena. At this moment, we are observing increasingly frequent and longer heatwaves, droughts, and heavy rainfalls around the world. In the 21st century, in Central and Western Europe (including Poland), a further increase of pluvial floods (by a 1.5 °C Global Warming Level (GWL) with a medium confidence and 2.0 °C GWL with a high confidence), river floods (by a 2.0 °C GWL and above with a high confidence) as well as hydrological, agricultural, and ecological droughts (by a 2.0 °C GWL and above and mid-century time period, regardless of the greenhouse gas emissions scenario, with a medium confidence) are expected.
Furthermore, until 2100 sea levels (SL) are predicted to rise by 0.21–1.01 meters (compared to 1995–2014), with the most pessimistic scenarios assuming a rise of up to 2 m. On the other hand, populations that currently inhabit coastal areas up to 2 meters above the SL stands at 267 million, according to the latest calculation, of which 191 million (62%) live in tropical countries [2]. With a SL rise of 1 m (in 2100), the number of endangered populations will rise to 410 million, including 295 million (72%) in tropical countries. In Europe, countries most sensitive to the projected change are the Netherlands and Belgium, with over 85% of coasts below 5 meters above SL. Other countries at potential risk include Germany and Romania, where 50% of the coastline is below 5 m above the SL, Poland (30%), Denmark (20%), and France, the UK and Estonia (10–15%). Generally speaking, 9% of the entire European coastal zone lies below 5 meters above SL [3].
In turn, according to data from the United Nations, it is estimated that by the year 2100, the world population will reach 11 billion, of which approx. 85% will live in cities (68% in 2050) [4]. Currently, about 45% of urban residents live in cities with population of less than 250,000, and nearly 60% in cities below 1 million residents. In 2015, there were 29 megacities (with populations exceeding 10 million inhabitants) and 467 urban agglomerations with a population of over 1 million worldwide.
Naturally, the issue of demographic development looks different on a European scale, where the estimated population growth will reach only 2% by 2050 and, when it comes to Poland’s population, the prognosis shows that by 2050 it will drop to 33 million, and in 2100 to barely 23 million [4,5].
Functional Urban Areas (FUAs) in Europe will see their population grow by an average of only 4% by 2050, with almost half of the FUAs experiencing population decline and 10% losing more than 25% of their population between 2015 and 2050. It should be noted that the scale of the phenomenon is completely different in rural communities (in Polish gmina administrative units at a local level, Poland is divided into 2477 gminas, including 302 urban communities, 652 urban–rural communities and 1523 rural communities) adjacent to the cities located within the FUAs. A high dynamic of the population change (up to 75% within a decade, e.g., in years 2005–2014, in the rural community of Komorniki located south of Poznań [6]) is observed not only in rural communities neighboring the capital or other large cities with the population reaching over 500 thousand, but also smaller provincial, regional, subregional, and even local centers. It is spatially and temporally diversified and results, among other things, from the proximity of the core city, transport accessibility, local authorities’ policy, developers’ strategies, housing preferences of the middle class, size, and importance of the city, macroeconomic situation, or environmental conditions [7,8,9,10].
Urbanization entails changes in spatial structure. Between 2000 and 2006, Europe lost 1120 km2 annually to built-up and urbanized land. A clear positive change was noticed between 2012 and 2018 but, still, 539 km2 per year were being transformed. Overall, from 2000 to 2018, as much as 78% of the land occupied by developed and urbanized land was agricultural land. During that period, land take consumed 0.6% of all arable lands and permanent crops, 0.5% of all pastures and mosaic farmlands and 0.3% of all grasslands into urban areas [11]. Relative to their size, Cyprus, the Netherlands, and Albania had the largest percentage of transformed areas. The main drivers of land take included industrial and commercial, residential areas, as well as construction sites.
It is anticipated that by 2030 built-up areas will grow in most European Union countries. The largest absolute increase is projected for Italy (144 thousand hectares). Poland is in the third place in this ranking with an increase of 121 thousand hectares. It is surpassed only by Germany, with a projected increase of 128 thousand hectares. The highest relative growth in built-up areas is in Romania and Belgium (approx. 6%) [12]. The sprawl of built-up areas is an ongoing process even in the regions with a declining population (e.g., the eastern part of Germany) [13,14].
It is worth noting that Europe has seen a 20% increase in built-up land over two decades with a 6% increase in population [15,16]. In Poland, between 2002 and 2011, the number of single-family houses increased by approx. 15%, with a population growth of less than 1% [17]. Between 2002 and 2016, according to the Local Data Bank of Statistics Poland, there was a 10% increase in built-up areas, with a minimal population growth of less than 1%. The largest growth of built-up areas was in Mazowieckie (27%) and Małopolskie (26%) provinces (administrative units at regional level, Poland is divided into 16 provinces/voivodeships/regions, in Polish: województwo) with the population increase of 4.5% and in Śląskie province (35%), where there was a 4% decrease of the population. A high rise of the built-up area (over 20%) with a simultaneous decline in population was also observed in Łódzkie (26%) and Świętokrzyskie (20%) provinces.
Urban growth involves significant changes in land use and functional linkages between urban and rural areas. Especially in the case of chaotic suburbanization, this also results in high costs, both those directly borne by residents, businesses, or local authorities, and those resulting from the value of lost time [18,19]. Spatial chaos and the crisis in spatial management can be recognized as one of the most serious barriers to sustainable socio-economic development of the country [20]. Changes in the relationship between urban and rural uses also lead to changes in the residents’ quality of life, environment, and ecosystem services, including water resources. Such changes are most visible in suburban areas [21,22,23].
Various scenarios of urban development in Europe based on IPCC predictions independently indicate further expansion within the margin of 0.4–0.7% per year, which is more than ten times higher than the expansion of any other type of use. This means that the intensification of this process will be particularly evident in suburban areas, including large parts of Poland [24].
The observed intensive transformation of land used for agricultural purposes into built-up and urbanized areas lead to a discussion on proper management of water resources, both in terms of quantity and quality, as well as dangers resulting from increasingly frequent extreme phenomena (heavy rainfalls and long dry periods) [25,26].
According to the Emergency Events Database (EM-DAT) [27], managed by the Center for Research of the Epidemiology of Disasters (CRED), 490 floods occurred in Europe between 1996 and 2020, including 11 in Poland. These floods cost the lives of 115 people, the most tragic of which was the so-called “the flood of the millennium” of 1997, which resulted in 55 fatalities. The next catastrophic events with the highest amounts of deaths were the floods of 2001 (27 people) and of 2010 (16 people). The estimated number of victims was 224,500 in 1997, 100,000 in 2010, 15,000 in 2001, and the loss amounts to $3.5 billion (1997), $0.7 billion (2001), and $3.1 billion (2010).
As per the report of the Polish Chamber of Insurance (PIU) and Deloitte SCCE, compensations paid in Poland by insurance companies to victims of the 2010 flood (in May and June) were approx. PLN 1.7 billion and the total incurred losses were estimated at PLN 12.8 billion (including private and public property, agricultural losses). In 2018, the same flood losses would already cost PLN 16.2 billion, which is 21% more than in 2010 [28].
Against the background of these catastrophic floods, losses caused by urban floods are significantly lower, but they cause numerous local floods, which in total affect increasingly larger groups of residents. Phenomena resulting from heavy rainfall in urban areas are increasingly affecting the suburban areas undergoing suburbanization. At the same time, due to the scale of the phenomenon, its local character, and especially the lower number of losses and casualties (compared to large cities), this problem has not yet received adequate attention.
Taking into account the above-mentioned predictions, both demographic and environmental, we are facing a tough challenge that is creating FUAs resistant to threats (particularly in the context of water), in a sustainable manner and having regard to the interests and needs of future generations.
There are still numerous gaps in the knowledge and research concerning local flooding problems in suburban areas especially in connection with an economic instrument supporting the improvement of water (rainwater) management.
Previous studies on flooding are dominated by analyzes typically focusing on cities [29,30,31] or concerning specific environmental units, e.g., river catchments [32,33]. Suburban areas, although they arouse great interest among geographers [34,35,36], have not yet been adequately covered in research on local flooding problems. This paper is an original approach that attempts to assess the problem especially in suburban areas, using available, but not always commonly used data.
Suburbanization is seen as one of the strongest challenges in integrated water management in Poland [37]. It is important to monitor and sustainably plan the changes taking place in spatial development [38]. It is particularly important to involve the public in the planning process [39]. Therefore, this study also analyzed subjective opinions of inhabitants. Local spatial development plans introduce a lot of arrangements aimed at preventing the effects of climate change, but unfortunately many of them are only the so-called recommendations, not requirements [40]. In many cases, local spatial plans have been adopted which completely or largely ignore the problem of water resources management and they should be updated [41].
At the EU level, concepts like natural based solutions (NBS), green infrastructure (GI) and natural water retention measures (NWRM) are being increasingly integrated into a range of environmental policies. Unfortunately, their impact depends on how well they are implemented on the ground. The biggest gaps have been identified, e.g., in flood management [42].
To encourage users to rationally manage water and limit pollution, as well as cover costs associated with drainage and facilities for its treatment, economical instruments in form of fees are needed [43].
The main objective of this study is to assess the phenomenon of local flooding in rural municipalities directly adjacent to metropolitan cities, where in the scale of functional urban areas the phenomenon of suburbanization occurs most intensively, both from the subjective perspective of residents (based on surveys) and objective statistical data of the State Fire Service (SFS) on interventions related to heavy rainfall. So far, the SFS data has been used in the context of the spatial distribution of fire sites [44] and the risk of occurrence of unexpected emergencies connected with the use of chemical, biological or radioactive substances [45].
In addition, the work deliberately is concentrated on suburban areas which surround the so-called second-tier cities which are often seen as important tools in leading sustainable economic and social development and can play an important role in linking the urban and the rural [46,47].
It is in this study that for the first time an attempt has been made to evaluate both readiness to incur additional costs by residents in order to reduce the risk of flooding and the willingness of local authorities to place additional burdens on residents.
Moreover, based on the collected data on the attitude of local authorities to the introduction of fiscal solutions related to the management of rainwater as well as on the opinions of residents about the willingness to bear the costs of protection against flooding, a new economic instrument (the so-called retention fee) was assessed, identifying the possibilities for its optimization and further use.
The study hypothesizes that residents’ willingness to incur additional costs for stormwater management stems from their own negative experiences with local flooding and depends on their income.
The whole research process of developing recommendations for rural communities directly adjacent to metropolitan cities in the field of local flooding protection can be divided into three steps (Figure 1).
The structure of the paper is as follows: in the following, Section 2, an overview of research area is presented. This is followed by an outline of the research design and a presentation of diagnostic indicators.
In Section 3 empirical results are presented. This section is divided into four subsections which are included in the Material and Methods section.
Section 1 concerns the issue of local flooding, the second-suburbanization, the third, the problem of retention fees from the perspective of local authorities, and the fourth-from the perspective of residents. Section 1 and Section 2 discuss the entire metropolitan areas, and Section 3 and Section 4 focus only on rural communes in the immediate vicinity of regional capitals.
In Section 4, possible further steps are discussed in the context of the existing and planned regulations and the results obtained and in light of the research results of other authors. Conclusions are then drawn in the final section.
2. Materials and Methods
2.1. Research Area
In the first phase of the research, analyses were conducted within the boundaries of three monocentric metropolitan areas with core cities of more than 500,000 residents, i.e., in the Łódź Metropolitan Area (ŁMA), the Poznań Metropolitan Area (PMA) and the Wrocław Metropolitan Area (WrMA). The cities of Łódź, Wrocław, and Poznań are ranked third–fifth in Poland in terms of population. Moreover, according to the European Observation Network for Territorial Development and Cohesion (ESPON), together with their functional areas, they are among the so-called weak Metropolitan European Growth Areas (weak MEGA), next to Kraków, the Upper Silesian conurbation, the Tri-City (Gdańsk, Gdynia, Sopot), and Szczecin. Only Warsaw was qualified as a potential European metropolis (potential MEGA) in Poland [48]. Hence, cities such as Łódź, Poznań, and Wrocław are often seen as second-tier cities, i.e., non-capital centers whose economic performance and social achievements are important enough to influence the national economy [49,50,51]. According to Rondinelli, second-tier cities usually range in size from approximately 100,000 in population to the second largest city in a country [52]. In addition, these cities have seen significant improvements in accessibility, which has contributed to the attractiveness and competitiveness of surrounding areas as well [53].
Metropolitan areas in the study were adopted with reference to the planning documents in force (on 30 April 2019) on the regional level (i.e., Provincial Regional Spatial Development Plans, which define functional urban areas of the voivodship center [54,55,56].
The analyzed metropolitan areas comprise between 27 and 45 municipalities. Poznań Metropolitan Area is the largest metropolitan area, both in terms of its area (6200 km2) and population (1.4 million). It consists of 6 urban, 21 urban–rural, and 18 rural communities. The Łódź Metropolitan Area is the smallest in terms of its area (2500 km2). Its share in the area of Łódzkie province is less than 14%. Yet, the Łódź Metropolitan Area’s share in the voivodeship’s population is the highest among the analyzed metropolitan areas and amounts to 44%. The number of communities forming individual metropolitan areas represents 16–20% of the total number of communities in a given province. They comprise 14–21% of the province area, and their population is 37–44% of the province population (Table 1).
2.2. Assesment of Flooding
To illustrate the scale of the flooding problem in metropolitan areas, flood risk maps determined in the first planning cycle (flood risk map for p = 1% for the baseline scenario) [59] were used along with data from the State Fire Service for the years 2013–2017 on local threats caused by:
- Water rise in watercourses and on natural or artificial reservoirs, snowmelt as well as rising groundwater levels.
- Heavy rainfall.
State Fire Service data is particularly important for identifying areas of local flooding that is not included in flood risk maps. SFS data are collected according to the Principles of Event Registering in the Decision Support System of the State Fire Service [60]. Standards for flood risk maps were set in the European Union (EU) Floods Directive [61]. They are based on the preliminary assessment of the flood risk and the identification of areas of potential significant flood risk [62].
2.3. Assesment of Suburbanisation
To assess the scale of suburbanization, two of the most common indicators found in the literature were selected [63,64,65,66] by relating them to data from the 2000–2019 period obtained from the Local Data Bank, Statistics Poland:
- Net migration rate [67]
For the analyses, the average net migration rate per 1000 inhabitants in a given year from the 2000–2019 period was adopted according to the following Equation (1):
where:
n = number of years (2015 was not analyzed since according to Statistics Poland, due to the insufficient quality of foreign permanent migration data for 2015, the applicable data were not published).
Ni = net migration rate per 1000 inhabitants in a given year i and according to the Equation (2):
where:
- Ii = number of immigrants (internal and external) per year i.
- Ei = number of emigrants (inward and outward) per year i.
- Mi = population of a given area (community) in the middle of year i, i.e., 30 June.
- 2.
- The number of dwellings completed [68]
For the analyses, the average number of dwellings completed per 1000 inhabitants in a given year from the 2000–2019 period was adopted according to the Equation (3):
where:
- Hi = number of dwellings completed in year i.
2.4. Stormwater Fee from The Stakeholders’ Perspective
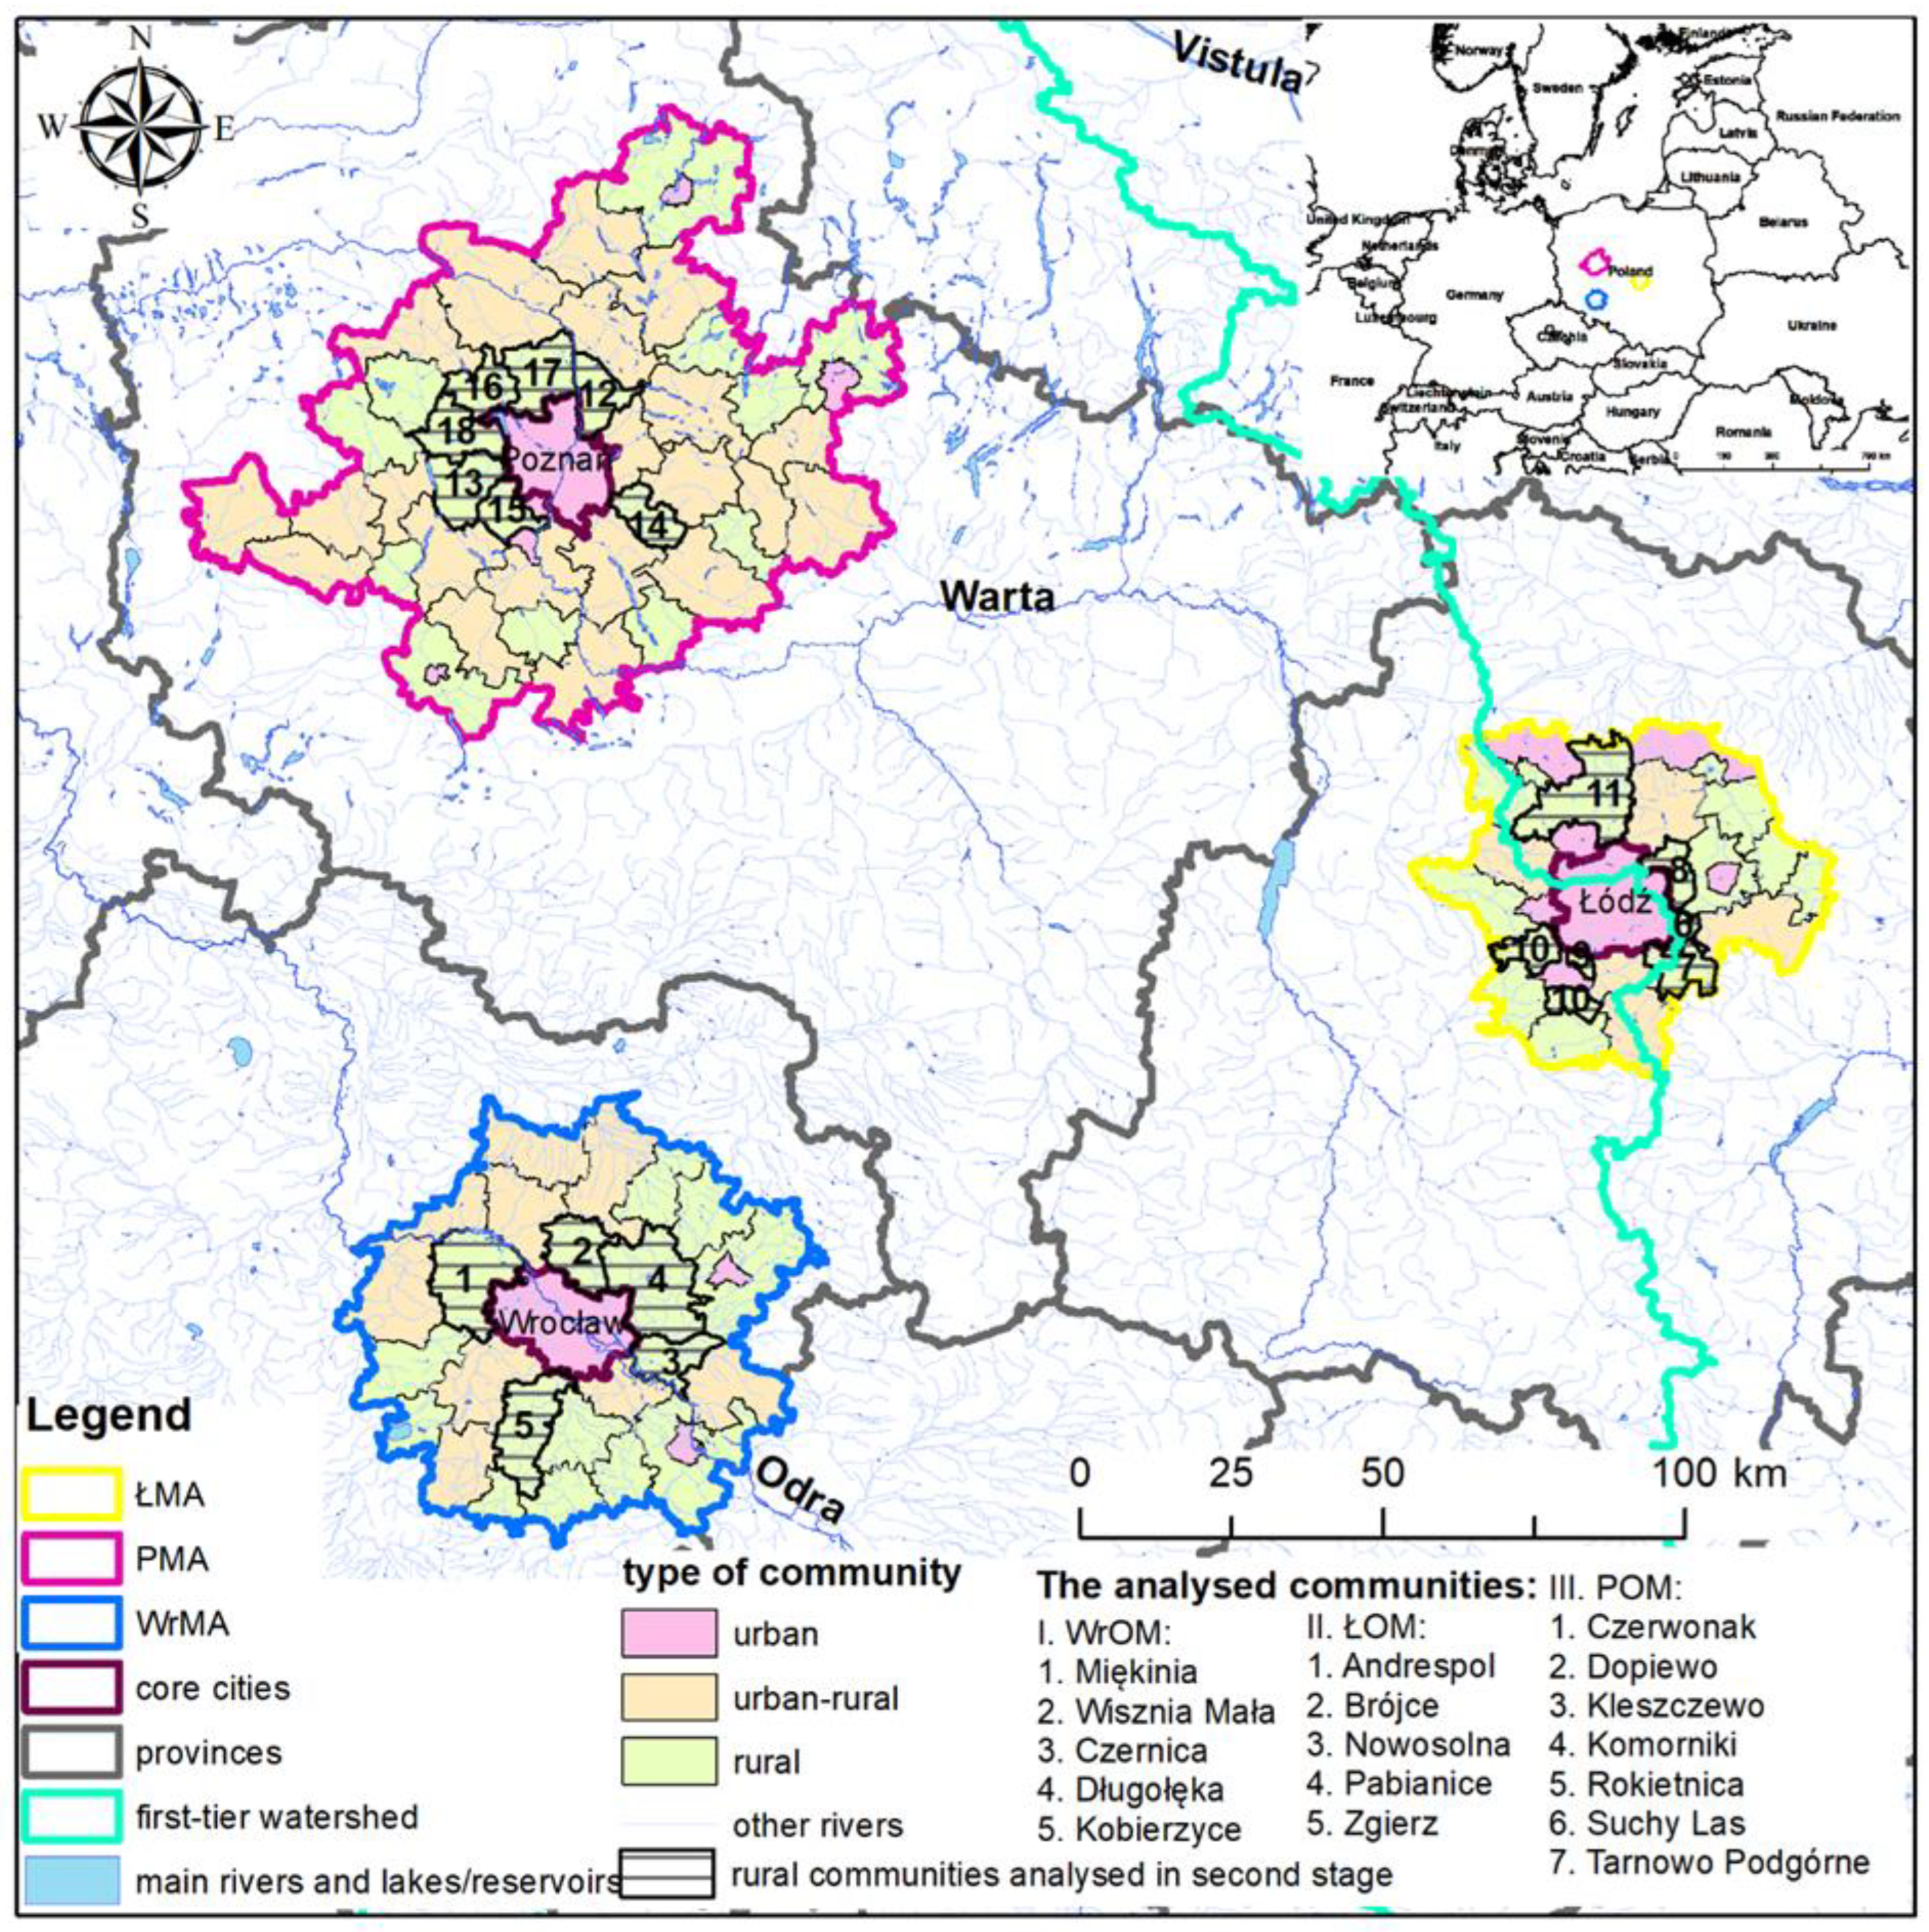
In the second phase, the research area was limited to rural communities immediately adjacent to the metropolitan centers of the analyzed FUAs. In total, the research was carried out in 18 rural communities, including 7 communities in PMA (Czerwonak, Dopiewo, Kleszczewo, Komorniki, Rokietnica, Suchy Las, Tarnowo Podgórne), 6 in ŁMA (Andrespol, Brójce, Ksawerów, Nowosolna, Pabianice, Zgierz), and 5 in WrMA (Czernica, Długołęka, Kobierzyce, Miękinia, Wisznia Mała) (Figure 2).
The population of the analyzed communities ranges from 5.1 thousand (Nowosolna in ŁMA) to 33.8 thousand (Długołęka in WrMA), while the area ranges from 13.6 km2 (Ksawerów in ŁMA) to 21.3 km2 (Długołęka again). The highest population density was recorded in the smallest community, Ksawerów (562), and the lowest in Zgierz in ŁMA (71). The number of entities of the national economy employing more than 49 people per 10 thousand population ranges from 0.9 (in Wisznia Mała in WrMA) to 33.1 (Tarnowo Podgórne in PMA) (Table 2).
Firstly, semi-structured telephone interviews [69] were conducted in April 2017 with representatives of the communities about the stormwater fee. A pre-prepared questionnaire was used, but the interview format was open-ended, with the order of questions asked changing. One interview was conducted in each rural community (n = 18). The interviews ranged from 5–20 min in length. Responses were provided by community officials from environmental protection, municipal management, or spatial planning departments.
The answers obtained allowed formulating guidelines to optimize retention fees applicable in Poland as of 1 January 2018.
2.5. Challenge of Local Flooding from Citizens’ Perspective
In the next step the survey research was conducted among a randomly selected group of inhabitants of the rural communities analyzed. The questionnaire form, question types, and the way in which they were formulated as well as the size of the research sample were designed taking into account previous works [70,71] and the experience of the diploma theses directed by the author, which can be treated as pilot studies.
The survey was conducted both in the traditional form (paper-and-pencil method) as well as in the modern form (computer aided survey methods) [72]. At the beginning, the survey was conducted directly in the field using a paper questionnaire or a tablet (cell phone) with a questionnaire and later also online. Online surveys were sent to addresses from the collected contact database of associations, local groups, Internet fora, volunteer fire brigades, housing estate groups (and other locally related groups) on social networks (including Facebook) using a Google form. In the field, questionnaires were provided in person at the respondents’ place of residence with the option of collecting the completed forms on the next day at their place of residence or at a previously agreed contact point (e.g., library, health center, shop).
Responses were obtained directly in the field from 174 respondents, and online from 344 respondents. The obtained data were analyzed in terms of their reliability and the presence of gross errors. Incomplete responses or those provided in a manner which was not in line with the instructions were rejected as well (minors were omitted). The questionnaires in which the place of residence was indicated as rural municipalities other than the ones covered by the analysis were excluded from the analyses, which was crucial for this survey. In this way, a sample of 221 persons was selected for further research studies.
The questionnaire includes multiple choice and open-ended questions, but most of them contain defined sets of answers. The research was carried out in the period from 13 June to 25 July 2018 and from 24 September to 6 December 2018 in 18 rural communities the population of which in 2018 was 299,554.
The analyses were carried out using Statistica 12 by StatSoft and StatXact by Cytel. The level of significance assumed was α = 0.05 (with a maximum measurement error not exceeding 7%). The result was considered statistically significant when p < α. The Shapiro–Wilk test was used to test the distribution of variables for normality. In order to compare the variables, the Mann–Whitney test (for comparison between 2 groups) or the Kruskal–Wallis test (for 3 or more groups) were used to compare the variables due to an inconsistency with the normal distribution or for variables measured on an ordinal scale. In addition, Dunn’s multiple comparisons test was calculated in order to establish which groups differed [73].
In order to test the relationship between the variables, Spearman’s rank correlation coefficient was calculated [74]. In order to examine the relationship between categorical variables, the chi-squared test of independence, Fisher’s exact test, or the Fisher–Freeman–Halton test were examined [73]. The Bonferroni correction for the adopted significance α level was also applied [75].
Most of the respondents were women (64.7%). The mean age in general was 39, and the standard deviation equaled 11. The age of the youngest respondent was 18 and 80 of the oldest. The average respondent had been living in their flat for 16 years (with a standard deviation of 15 years), and the length of residence varied from one to 64 years. The dominant group were people with higher education (65%). The share of people with secondary education was also significant (28%). Respondents with basic vocational education constituted 6%, and with primary education 1%. As many as 91% of the respondents belong were employed. The remaining persons were retirees and pensioners (9 persons: 4%), students and pupils (8 persons: 4%) and the unemployed (2 persons: 1%). Most of the respondents had an approximate average net monthly income per family member ranging from Euro 500 to 1250 (41%). Five people did not provide their answers in this regard.
2.6. Finding Solutions and Improvements
In the last phase, willingness to incur additional costs for stormwater management by citizen and willingness to introduce a stormwater fee by local stakeholders in communities will be discussed in the context of the Water Law Act [76], which includes a fee for discharging stormwater and snowmelt [77] (stormwater fee) and a fee for reducing natural field retention [78] (retention fee). Improvement possibilities of the local water management system will be discussed also taking into account official suggestions of possible changes in the fees.
3. Results
3.1. Problem of Flooding
According to the flood risk maps of the first planning cycle, areas at risk of flooding occupied the largest area in the Wrocław Metropolitan Area, covering 7.4% of its territory and were associated with the Oder, Widawa, Bystrzyca, Ślęza, and Oława rivers. In total, areas at risk based on the analyzed flood risk maps were found in 22 of the 27 municipalities belonging to the WrMA. The share of areas at risk of flooding in 6 municipalities did not exceed 3%, and the highest values were recorded in the rural municipality of Oława—24.7% (Odra and Oława rivers), rural municipality Czernica—28.9% (Odra and Widawa rivers) and urban–rural municipality Siechnice—34.7% (Odra and Oława rivers).
The smallest area was occupied by flood risk areas in Łódź Metropolitan Area, covering only 0.6% of the ŁMA associated with the rivers: Bzura, Ner and Grabia. Flood risk areas were identified in 14 municipalities (out of 28), whereby only in the municipality of Ozorków (river Bzura) the share of flood risk areas exceeded 3% and amounted to 5.7%. The reason is that the territory of the ŁMA is divided by the first-tier watershed into two large rivers systems, the Odra, and the Vistula (both within the Baltic Sea drainage basin).
In the Poznań Metropolitan Area, flood risk areas were identified in 22 municipalities (out of 45). They account for 1.7% of the Poznań Metropolitan Area and are associated with rivers: Warta, Główna, the Mosiński Canal, Cybina and Wełna. The highest share of the municipality’s area at risk of flooding is found in the urban municipality of Puszczykowo (11.2%—the Warta River, the Mosiński Canal), the urban–rural municipality of Mosina (11.0%—the Warta River, the Mosiński Canal), the urban–rural municipality of Śrem (10.4%—the Warta River) and the rural municipality of Kościan (8.4%—the Mosiński Canal). In 12 municipalities, flood risk areas cover less than 3% of their area.
According to SFS data, the highest number of local threats caused by water rise in watercourses and on natural or artificial reservoirs, snowmelt as well as rising groundwater levels in the period 2013–2017 was recorded in the Wrocław Metropolitan Area-741. Only four municipalities did not record a single local hazard (rural municipalities of Oleśnica and Dobroszyce and urban–rural municipalities of Prusice and Środa Śląska). On average, 27 local hazards were recorded per municipality, with the urban–rural municipality of Sobótka (150) and the city of Wrocław (146) standing out. It is worth noting that in the case of Sobótka, as many as 144 local hazards occurred in 2013. Wrocław also had the highest number of such incidents in 2013 (60), but a similar number was also recorded in 2017 (55). The WrMA Area also recorded the highest average number of hazards caused by rainfall (88 per municipality). The State Fire Service intervened most frequently in the capital of Lower Silesia (760 times in total), although the number of incidents exceeding 100 was also recorded in smaller municipalities, i.e., again in Sobótka (159) and the urban–rural municipalities of Siechnice (143), Kąty Wrocławskie (123), and the rural municipality of Czernica (127). In the case of Wrocław, a high number of local hazards was recorded in 2013, 2014 and 2017 (213–226). In Sobótka, 2013 was decisive (120), similarly in Czernica (111) and Siechnice (116). In the municipality of Kąty Wrocławskie, on the other hand, local hazards were recorded mainly in 2013 (40) and 2015 (45).
In the Łódź Metropolitan Area, in the period under review, 558 incidents caused by water inflows (an average of 20 per municipality) and 2181 caused by rainfall (an average of 78) were recorded. In the case of risks caused by water inflows, almost half were recorded in the urban–rural municipality of Koluszki (250, including 144 in 2013). No incident was registered only in the rural municipality of Parzęczew. Threats caused by precipitation were mostly recorded in the largest urban center, i.e., Łódź (726). The highest number of local hazards was recorded in 2017 (352). More than 100 local hazards were also registered in 2013 (128) and 2016 (136). A high number of incidents caused by precipitation also occurred in the aforementioned municipality of Koluszki (296) and the rural municipalities of Brzeziny (133) and Andrespol (122). In Koluszki, the accumulation of hazards took place in 2013 (160), in Brzeziny in 2015 (78), and in Andrespol in 2017 (46).
The smallest number of local threats caused by water inflows was recorded in the Poznań Metropolitan Area (152) in the analyzed period. In nine (out of forty-five) municipalities, no such events were registered. The highest number was recorded in the capital city of Greater Poland (26). However, these figures are significantly lower than in the ŁMA and the WrMA. On the other hand, the number of local hazards caused by precipitation, although it was the highest overall in the PMA, averaged 58 per municipality, 20 local hazards less than in the ŁMA and 30 less than in the WrMA. The highest number of local hazards caused by precipitation, as in the other metropolitan areas, was recorded in the main city of Poznań (442). A value above 100 occurred there in 2013 (116) and 2015 (105). In addition, a total of more than 100 precipitation-related hazards were still recorded in the urban gminas: Gniezno (143), Luboń (116), and the urban–rural ones: Środa Wielkopolska (125), Opalenica (115), Rogoźno (111), and Swarzędz (103). In the case of Środa Wielkopolska (72), Swarzędz (37), and Rogoźno (107), most hazards occurred in 2017. In Opalenica (70) and Gniezno (65), the most local hazards were recorded in 2016. In Luboń, most local hazards (32) occurred in 2015, but this value is not much different from the annual number of threats, which ranged from 17 to 24 in other years.
The occurrence of local flooding can be associated with the sudden intense rainfall, which happened e.g., on 25 June 2013 in the Sobótka and Siechnice municipalities, on 10 June 2013 in the Czernica and Siechnice municipalities and on 6 June 2013 in the Koluszki municipality.
3.2. Scale of Suburbanization
The highest average net migration rate between 2000 and 2019 was recorded in metropolitan areas excluding cities with district rights. It ranged from 4.3 in the Łódź Metropolitan Area (without Łódź), through 7.5 in the Poznań Metropolitan Area (without Poznań) to 8.5 in the Wrocław Metropolitan Area (without Wrocław). Comparing cities with district rights, only Wrocław achieved a positive average migration balance (1.5). The highest outflow of inhabitants is recorded in Poznań (−3.6). The average net migration rate in Łódź is −1.8. Looking at the metropolitan areas as a whole, the worst situation noted occurs in the ŁMA (0.3), where the favourable migration balance of the areas surrounding Łódź (31.2 thousand in absolute numbers) fails to compensate for the constant negative migration in Łódź (−24.9 thousand). A positive migration balance (3.0) was recorded in the PMA, despite the constant negative balance in Poznań (−38.1 thousand), which was due to the positive result of the other municipalities forming the PMA, where the population growth as a result of migration was 115.2 thousand, which was more than the total in the whole WrMA (78.4 thousand) and the ŁMA without Łódź. The situation was different in the WrMA, where the positive migration balance (4.1) was influenced by both Wrocław and the other municipalities constituting the WrMA. In Wrocław, the positive balance of migration flows in the two decades was 17.7 thousand, and in the other municipalities 60.8 thousand. The net migration rate is improving most dynamically in the WrMA excluding Wrocław. A further positive trend for the net migration rate is also expected in the PMA without Poznań and the ŁMA without Łódź, but at a much lower level than in Wrocław.
The PMA (without Poznań) and the WrMA (without Wrocław) as a whole experienced a population growth of 23.7–24.0% between 2000 and 2019. The highest increases were found in the communities directly neighboring Poznań, i.e., in Dopiewo (by 160.4%), Komorniki (158.9%), Rokietnica (137.0%), Kórnik (95.4%, urban–rural community), Kleszczewo (85.8%), Suchy Las (79.2%), Tarnowo Podgórne (72.6%). In this group, the average net migration rate ranged from 9.1 (Tarnowo Podgórne) to 13.7 (Dopiewo). A similar situation was noticed in the WrMA. The highest increases were found in Czernica (101.2%), Długołęka (79.0%), Kobierzyce (78.9%), Siechnice (77.9%, urban–rural community). The average net migration rate for this group ranged from 12.8 (Długołęka) to 16.3 (Siechnice). The ŁMA (without Łódź), on the other hand, only experienced a population growth of 3.9%. However, here also the highest increases concerned rural communities directly neighboring Łódź, i.e., Nowosolna (59.4%) and Pabianice (41.9). The average net migration rate in the same communities ranged from 17.9 (Pabianice) to 27.3 (Nowosolna).
The highest number of housing units completed per 1000 inhabitants was recorded in the Wrocław Metropolitan Area (7.6), which achieved the best average values for both Wrocław (8.2) and the remaining communities of this metropolitan area (6.7). In total, in the analyzed 20-year period, 155.0 thousand housing units were put into use in the WrMA, of which 103.7 were in Wrocław. The Łódź Metropolitan Area is the least favourable in terms of the analyzed indicator (2.7). In 2000–2019, a total of 34.6 thousand housing units were completed in Łódź, and 59.3 thousand in the remaining ŁMA communities. On average, 6 housing units per 1000 inhabitants were completed per year in the Poznań Metropolitan Area (5.6 in Poznań alone and 6.2 in the other communities). The PMA also noted the highest total number of housing completions (165.7 thousand), but unlike the WrMA, here the largest share in the total number was accounted for by the other municipalities without Poznań (103.1 thousand).
The average number of dwellings completed per 1000 inhabitants in a given year from the 2000–2019 ranged in the WrMA from 1.2 (Domaniów) to 16.3 (Siechnice), in the PMA from 1.6 (Kiszkowo) to 21.0 (Komorniki) and in the ŁMA from 1.1 (city Ozorków) to 10.1 (Nowosolna). An index value above 10 was noticed in one community in the ŁMA (Nowosolna), in 5 communities in the WrMA (Siechnice—16,3, Kobierzyce—14.9, Czernica—14.3, Długołęka—12.8, Kąty Wrocławskie—10.3) and in 7 in the PMA (Komorniki—21.0, Dopiewo—18.9, Rokietnica—16.00, Suchy Las 13.3, Kórnik—13.3, Kleszczewo 12.6 and Tarnowo Podgórne).
3.3. Rainwater Fee from the Local Authorities’ Perspective
The rainwater fee at a local (communal, municipal) level is for rainwater drainage to the sewer system. Additionally, at the national scale there are rainwater fees for rainwater drainage to rivers [77]. Nationwide fees are regulated by the Regulation of the Council of Ministers [79]. Rainwater fees at the national level are fees for utilising rivers as rainwater receivers and are incurred by administrators/owners of sewers who hold relevant permits for rainwater discharge from the sewer system to the river. At the local level, the rainwater fee was introduced only by approximately 3–5% of the total number of Polish communities [77].
Based on the research carried out in rural communities surrounding three Polish metropolitan cities, it was found that rainwater fees are not applicable in any of them. Additionally, only two rural communities out of seventeen wanted to introduce such a fee.
As the main reason for not introducing the tax, local decision-makers mentioned primarily public aversion to pay any additional taxes. Polish local authorities are elected by direct universal suffrage in a free and secret ballot. Therefore, they are reluctant to make decisions that could lead to a decline in voter support.
3.4. Rainwater Management from the Citizens’ Perspective
Among the respondents, 63% see the need to regulate the problem of rainwater and snowmelt management. At the same time, 22% of the respondents admit to their lack of knowledge about methods of rainwater management, and another 23% describe their knowledge as poor. The largest group among the respondents are people with an average knowledge of these methods (35%). 14% of the respondents described their knowledge as good, and only 6% considered that they were very well aware of the topic.
One in five respondents (19%) has their own individual rainwater management system. At the same time, a similar group (20%) does not have the knowledge of how to deal with rainwater on their property. In the case of 18% of the respondents, rainwater is discharged into the rainwater drainage system and in the case of 16% to the combined sewerage. In total, 27% of the respondents use natural infiltration within their plots.
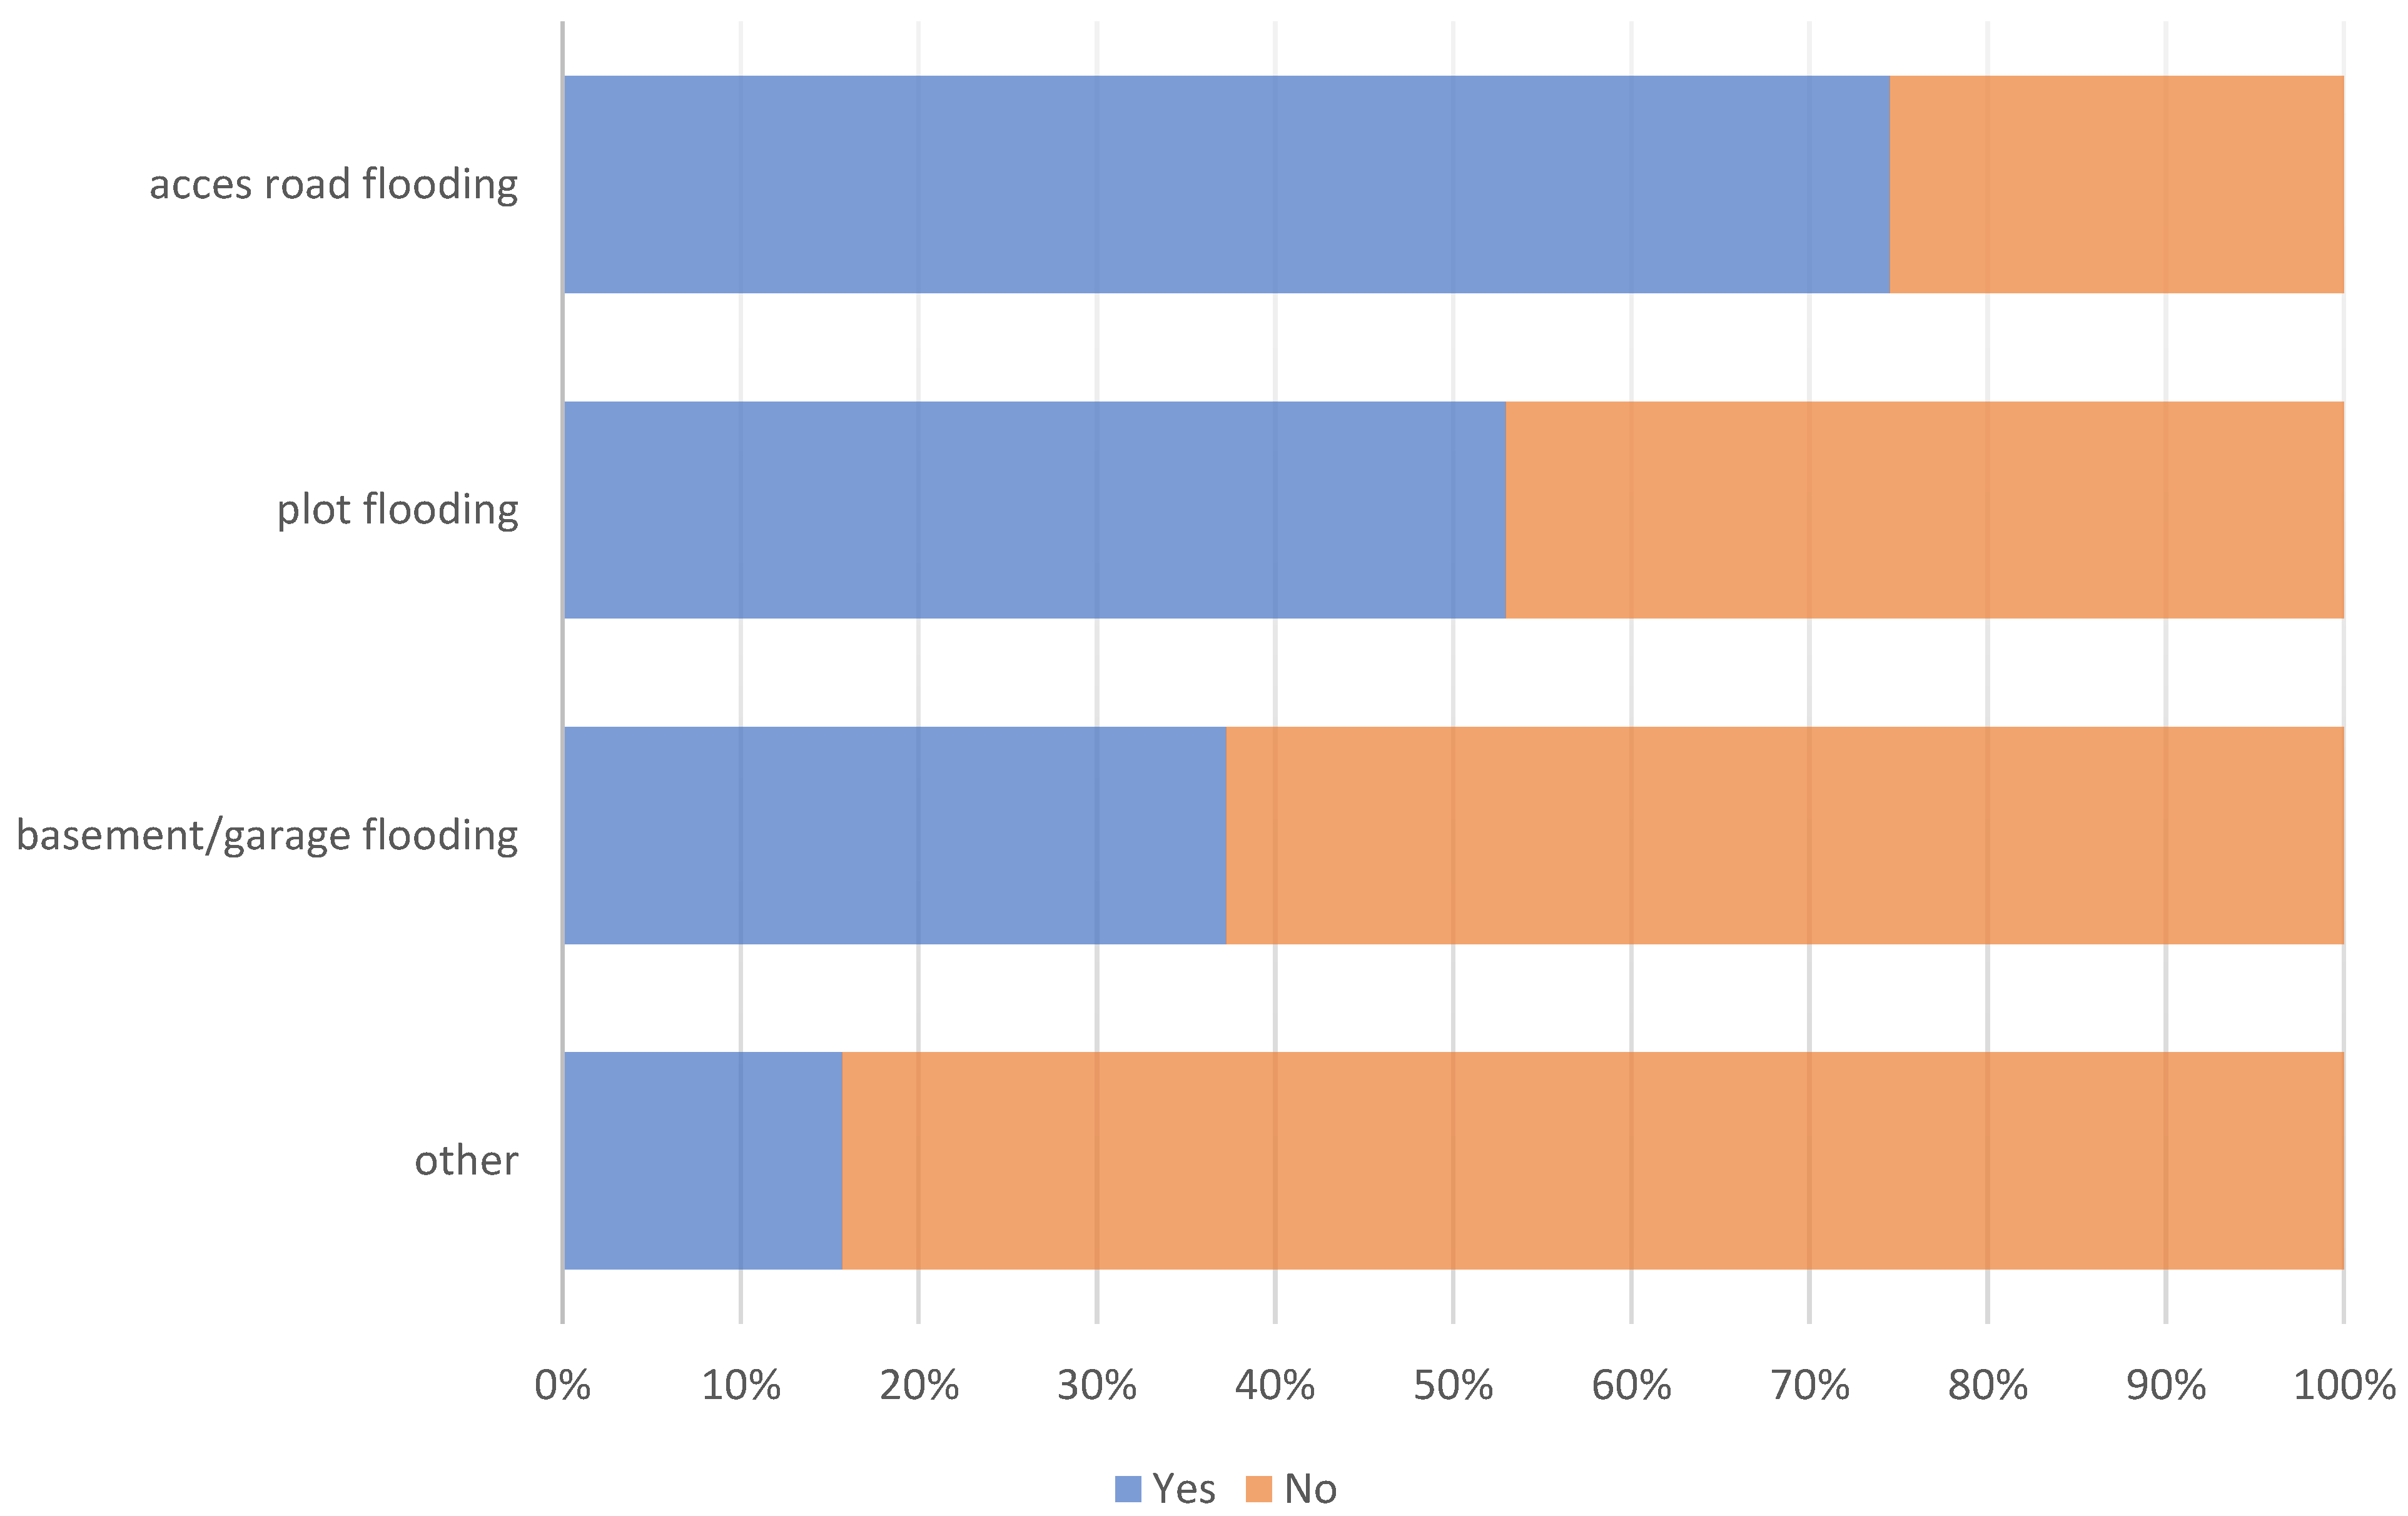
Problems with local flooding were highlighted by 23% of respondents (51 people), including 33 from the rural municipalities bordering Poznan, 11 from those bordering Wrocław and 7 bordering Lodz. The plots that were flooded most often where those declared by three quarters of those who experienced flooding. Plots of more than half of the respondents were flooded, and basements or garages were flooded in the case of 37% of the respondents. Other types of flooding were mentioned by 8 people, while only 1, marking the answer “other”, did not indicate any other flooding forms (Figure 3).
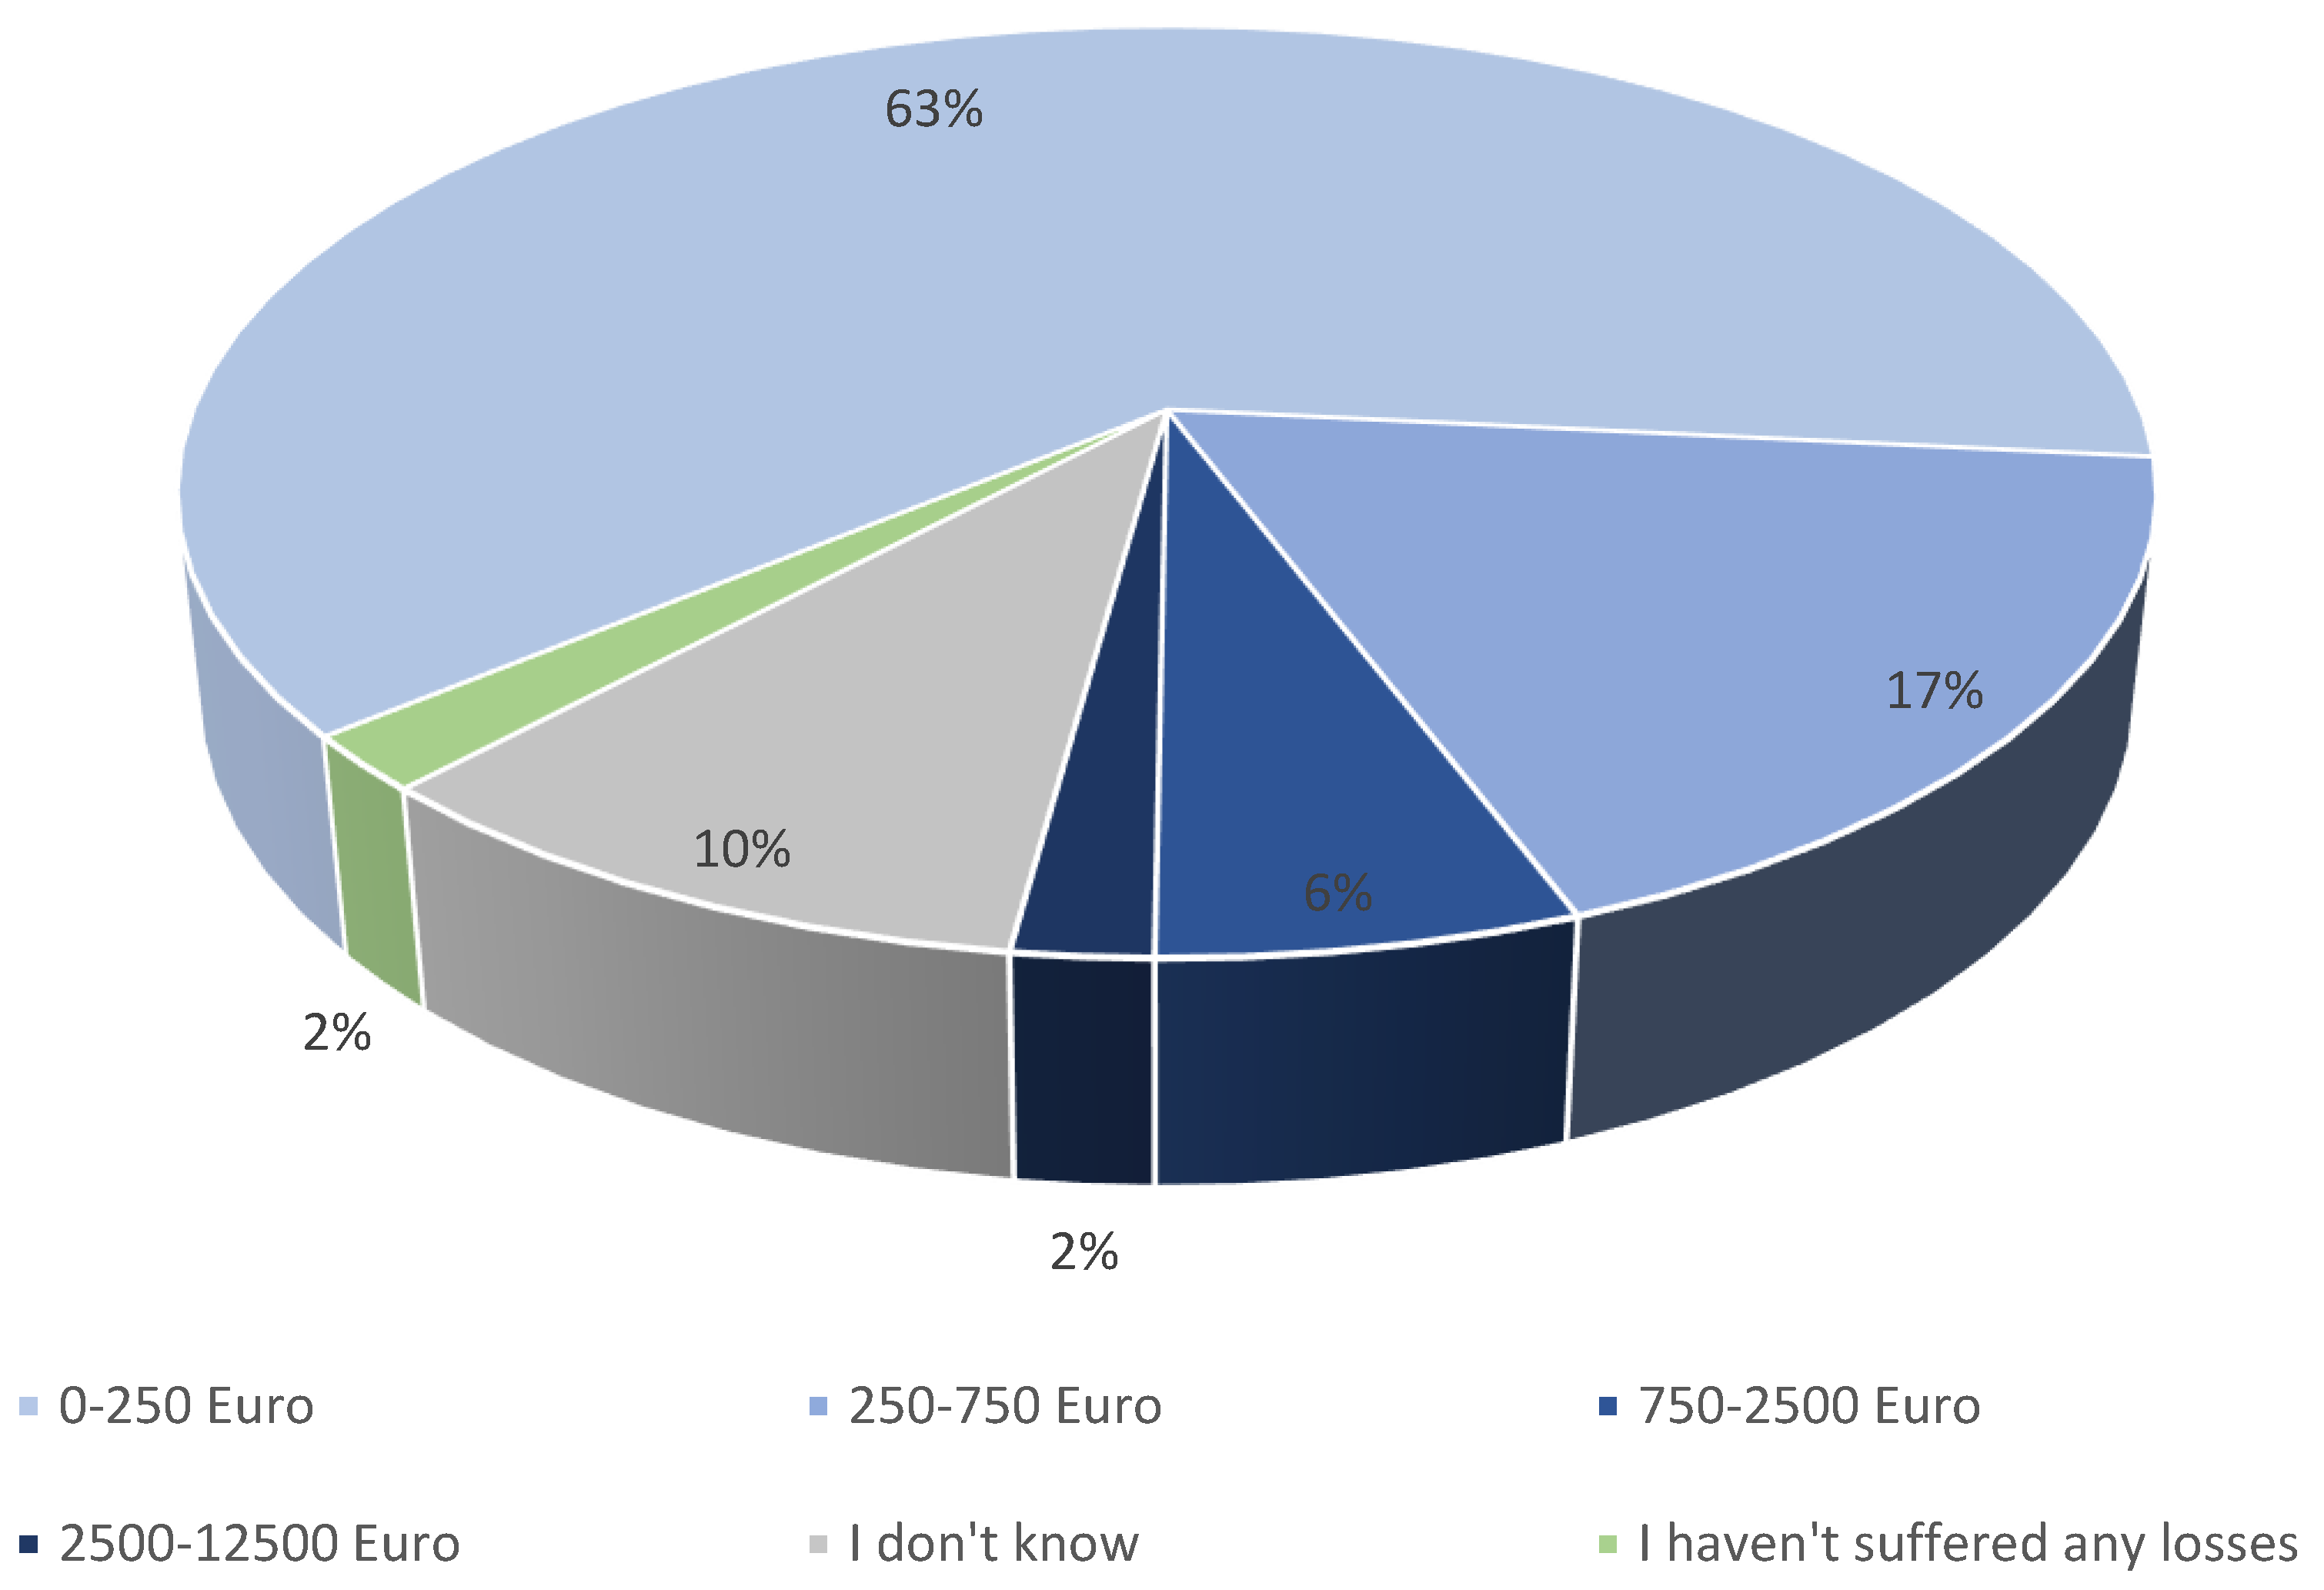
Most people (71%) experience flooding a few times a year. Smaller groups are those people where flooding occurs once a year (16%). Local flooding was declared every few years by 7 out of 51 respondents. Most often, the respondents made an estimation of their losses as a result of flooding as below 250 Euro (63% of people in the case of who local flooding occurred). In the case of 17% of respondents, the value of losses ranged from Euro 250 to 750. Only 6% of people suffered losses in the range of Euro 750 to 2500 and 2% in the range of Euro 2500 to 12,500 (Figure 4).
Although only every fourth respondent experienced local flooding, as many as 57% of them were in a position to incur additional costs to improve rainwater management in their places of residence. Within this group, 61% of respondents linked their decision with improving security (reducing the local flooding risk) of their housing estate, and 39% with the improvement of the housing estate’s (landscape’s) aesthetics. With respect to possible forms of rainwater management, it is worth noting that as many as 89% of the respondents considered the proximity of surface waters (lakes, spurts, streams, reservoirs) as a factor which increases the attractiveness (value) of the real estate. At the same time, 42% of the respondents in this group condition their positive assessment with the lack of risk of local flooding, and 58% with a proper way of managing the whole area.
4. Discussion and Lessons Learned
In the light of the surveys conducted, an important step towards rational water resources management was the introduction of a fee for the reduction of natural land retention (also commonly referred to as the retention fee, rain tax or concrete tax). Under the Act of 20 July 2017—Water Law Act [76], the fee shall be paid for properties larger than 3500 m2 that are not located within an area covered by an open or closed sewage system. The fee is payable when the share of the biologically active area is reduced to less than 30% of the total area of the property.
The Act assigns obligation to collect the fee to communities, but the funds collected constitute, in a substantial part (90%), the guaranteed income of the entity responsible for national water management (Wody Polskie State Water Holding—WPSWH). The communities may keep only 10% of the fee revenue in their budgets, to perform the necessary collection activities.
The retention fee is not a local fee; therefore, the communities may not waive it, nor freely shape its amount (e.g., through exemptions or rate calculations). The collection of the fee is mandatory. A different approach applies in the case of rainwater drainage fees (also called stormwater fee) [43], which was introduced, e.g., in Poznań [78,80] and Wrocław [81]. According to Boguniewicz-Zabłocka and Capodaglio, in 2020 almost 95% of Polish towns had already implemented rainwater drainage fee structures [43].
Rainwater fees are in place also in other countries. Their amounts and methods of calculation vary. In Germany, councils of most cities have introduced a new stormwater fee over the last few years based on the anticipated volume of stormwater discharge from each development site. The stormwater fee is calculated according to a sealed area of a development site and ranges from €0.35 to €1.92 per 1 m2 of the sealed area. After the introduction of the fee, many landowners installed on-site stormwater infiltration facilities [82]. In the U.S. communities, the most common methods used to calculate stormwater fees are amounts of produced runoff and the impervious area of property [83].
Meanwhile, rainwater and snowmelt drainage fees that municipalities could introduce independently were not established in any of the rural communities analyzed. Local governments were not interested in imposing additional financial burdens on their residents (future voters) on their own accord. For this reason, the retention fee, the collection of which is mandatory and introduced top-down on the national level, proves to be a good solution. But, unfortunately, the share of 10% from the potential revenue for municipalities that manage water resources is far too low, since the funds collected from the fees should provide the opportunity to implement measures to increase the retention capability of the basin locally, i.e., in the community.
In Poland there are also some concerns about the obligation to pay the retention fee. Circumstances determining whether it arises are not clearly defined in the Water Law Act [76]. Such terms as “biologically active area”, “open or closed sewage systems”, “property”, and “structures permanently connected with the land” have not been precisely defined yet. The above, combined with the level of public awareness, can give rise to practical problems. This is because in unusual situations it is difficult to determine whether the obligation to pay the fee arises.
A special difficulty for communities that are required to collect fees may be the lack of necessary data. Although the legislator obligated the entities obliged to submit relevant declarations, failure to do so does not exempt the community from the duty to issue the information determining the fee amount. Data released to the public show that even in large local governments, the sum of all fees is not necessarily high. However, on a national scale, these funds will constitute a substantial part of income for WPSWH.
The year 2022 may be, in a way, critical for the retention fee. This is especially true when it comes to defining the duties of communities and responsibilities in this respect. Indeed, work is underway on an amendment to the Water Law Act and a new act on drought prevention.
The planned changes should lead to a significant increase in the number of people who will have to pay the retention fee. This is because the fee is supposed to apply to owners of properties larger than 600 m2. Moreover, the obligation to pay will arise if a house, garage, parking lot, or paved paths and driveways on a plot occupy a total of 50% of the ground surface. As a result, no longer only owners of large-area facilities, but also many owners of single-family plots will be subject to the fee.
The anticipated increase in the number of persons who would pay the retention fee is also a result of a proposal to remove from the legal act the rule that the fee is not payable by owners of properties that are included in open or closed sewage systems. Presently, an owner of a building located in a sewered area that covers up to 80% of the plot does not pay any retention fees. The person only pays for the discharge of rainwater into the sewer system. However, in the above-mentioned case, after the change in the regulations, such a person will be obligated to pay the retention fee.
According to the draft project, the retention fee for 2022 will be calculated as follows:
- Without water retention devices, for sealed surfaces permanently connected to the ground-PLN 1.50 per 1 m2 per 1 year (€0.32 average €/PLN exchange rate in January–April 2022 acc. to NBP—the central bank of the Republic of Poland: €1 = PLN 4.63) (currently, it is PLN 0.5 (€0.11) [52].
- With water retention devices, for sealed surfaces, with a capacity of up to 10% of the annual outflow from sealed surfaces permanently connected to the ground-PLN 0.90 (€0.19) per 1 m2 per 1 year (currently, it is PLN 0.30 (€0.06)).
- With water retention devices, for sealed surfaces, with a capacity from 10 to 30% of the annual outflow from sealed surfaces permanently connected to the ground-PLN 0.45 (€0.1) per 1 m2 per 1 year (currently, it is PLN 0.15 (€0.03)).
Currently, according to The Water Law Act, the maximum retention fee rate is PLN 1.00 (€0.22). The current rate may be changed by relevant ordinance but must comply with the Water Law.
If the owner of the property with water retention devices for sealed surfaces, with a capacity above 30% of the annual outflow from sealed surfaces permanently connected to the ground have to pay only PLN 0.05 (€0.01) per 1 m2 per 1 year.
The retention fee should motivate the property owners to install rainwater collection devices on their properties. Therefore, it would be advisable to tax also semi-detached and terraced houses built on smaller plots, even with the size of 300 m2 or 200 m2. Usually, the smaller the property, the smaller the proportion of the biologically active area.
Spot field studies and cartographic analyses (performed in places indicated by residents in the questionnaires), as well as surveys, confirm that local flooding is very common on newly constructed streets in the areas with terraced houses, with very good surface sealing. On plots of 180 m2, the biologically active area covers 45–60 m2 or 25–30%. The costs of handling the collection of fees from such small plots of land are the reason against charging fees. In the aforementioned case, the annual fee would be between PLN 45.00 (€9.72) and 60.00 (€12.96) (after the proposed increase PLN 67.50–90.00 (€14.58–19.44)).
The Polish Ministry of Climate and Environment estimated the maximum revenue from the retention reduction fee on a national scale at PLN 180 (€38.88) million per annum. The final total sum of these fees is likely to be much smaller, as it is expected that the property owners will respond to the announcement of the fee by installing devices to retain rainwater there, which in a way was also the intention behind introducing the retention fee [82].
According to the conducted surveys, 55% of persons are willing to pay additional costs to improve the management of rainwater in their areas of residence. 36% of the respondents declared that they could pay the lowest amount (up to PLN 100) while 16% were willing to pay an amount of up to PLN 300. Using the Fisher–Freeman–Halton test, the correlation between the approximate average net monthly income per household member and willingness to incur additional costs to improve the management of rainwater was demonstrated (p = 0.009). The amounts are similar to the existing ones and the proposed retention fees.
Similar results were described on the basis of a survey conducted in six pilot sponge cities in China [83]. The residents were willing to pay stormwater fees to found the maintenance of green infrastructure facilities. Of the respondents, 17% would like to pay about 6–10 CNY/month (€ 0.85–1.41; average €/CNY exchange rate in January–April 2022 acc. to ECB—European Central Bank: €1 = CNY 7.08), and 17.8% would like to pay more than 20 CNY/month (about €2.82).
It should be remembered, however, that proper management of water resources, including planning small water retention, requires an adequate spatial database, in particular, information on soil conditions which is necessary to determine the possibilities and forms of water retention [84,85,86]. As part of the proposed changes in the retention fee in Poland, a greater share from the potential revenue for communities should be considered. Depending on the scale of losses caused by local floodings, this share could increase even up to 50% (with the current 10%). At the same time, it is crucial to immediately allocate the collected funds to planned actions/measures to support the increase of retention capacity in the local catchments (or alternatively education in the field of rational water management).
On the other hand, the development of local programs of measures enhancing retention capacity based on the identified environmental and socio-economic problems and conditions seems to be more important at the preliminary stage than determining the distribution of revenues from fees between local governments and WPSWH. Such studies together with mandatory map attachments could form the basis for fixing the amount of the retention fee. In turn, the residents would immediately be able to see what actions are going to be taken in their local river basin to minimize the problem of local flooding. It is also important to simplify procedures as much as possible, e.g., by introducing a central system to calculate the fees, so that the collected funds could be used to develop the retention programs rather than bureaucracy.
5. Conclusions
Based on the conducted analyses and surveys carried out in three Polish metropolitan areas connected with second-tier cities, it can be concluded that the highest rate of suburbanization is observed in communities that are directly adjacent to metropolitan centers. That process has consequences for communities in the form of local flooding, thus the spatial scope of the so-called urban flooding into suburban areas is extended. That situation makes it necessary to monitor management of rainwater and, more broadly, water resources also in the system of functional urban areas.
Moreover, in the study the willingness of the respondents to incur additional costs to improve the management of rainwater in their area of residence, also persons who have not experienced the negative effects of flooding, was demonstrated.
Rural communities directly adjacent to second-tier cities, although they are part of functional urban areas, conduct an independent spatial policy and water management. Therefore, in their case, it is necessary to apply an appropriate water policy, adapted to their needs, different than in cities, taking into account also economic instruments, such as the retention or stormwater fee.
Although the residents confirm their readiness to co-finance the activities supporting development of water retention, local authorities are hesitant to introduce additional charges for the residents. Therefore, due to the local electoral regulations, a better solution would be to set the fees at the national level. However, communities should be given more power with regards to distribution of collected funds which, in turn, should be allocated directly to local programs of measures enhancing retention capacity in the local catchments. In the process of determining fees and allocating funds, it is necessary to take into account the spatial differentiation of water management problems and actual water retention capacities considering the constitutional principle of sustainable development and the ultimate goal of spatial management: the spatial order, referring to the definitions and principles of the integrated water resources management and the paradigm of territorial oriented policy. In this work some legislative changes are proposed, namely increasing the share from the potential revenue for communities. This share should depend on scale of losses caused by local floodings.
Funding
This research was funded by POLISH NATIONAL SCIENCE CENTER, project No 2013/09/D/HS4/01858 and the APC was funded by the MINISTRY OF SCIENCE AND HIGHER EDUCATION, program “Regional Initiative Excellence” in the years 2019–2022, Project No. 005/RID/2018/19.
Institutional Review Board Statement
Not applicable.
Informed Consent Statement
Not applicable.
Data Availability Statement
Not applicable.
Conflicts of Interest
The author declares no conflict of interest. The funders had no role in the design of the study; in the collection, analyses, or interpretation of data; in the writing of the manuscript, or in the decision to publish the results.
References
- Masson-Delmotte, V.P.; Zhai, A.; Pirani, S.L.; Connors, C.; Péan, S.; Berger, N.; Caud, Y.; Chen, L.; Goldfarb, M.I.; Gomis, M.; et al. (Eds.) Intergovernmental Panel on Climate Change: IPCC, 2021: Climate Change 2021: The Physical Science Basis. Contribution of Working Group I to the Sixth Assessment Report of the Intergovernmental Panel on Climate Change; Cambridge University Press: Cambridge, UK, in press; Available online: https://www.ipcc.ch/report/ar6/wg1/#SPM (accessed on 31 August 2021).
- Hooijer, A.; Vernimmen, R. Global LiDAR land elevation data reveal greatest sea-level rise vulnerability in the tropics. Nat. Commun. 2021, 12, 3592. [Google Scholar] [CrossRef] [PubMed]
- Urban Sprawl in Europe. The Ignored Challenge. 2006. No. 10 EEA. Available online: https://www.eea.europa.eu/publications/eea_report_2006_10/eea_report_10_2006.pdf/view (accessed on 31 August 2021).
- United Nations. World Population Prospects 2019 Highlights; United Nations: New York, NY, USA, 2019; Available online: https://population.un.org/wpp/Publications/Files/WPP2019_Highlights.pdf (accessed on 31 August 2021).
- Frenkel, I. Prognoza demograficzna Polski do 2050 roku ze szczególnym uwzględnieniem obszarów wiejskich. Wieś I Rol. 2016, 1, 19–58. [Google Scholar] [CrossRef]
- Mrozik, K.; Noskowiak, A. Suburbanizacja a możliwości zrównoważonego rozwoju przestrzennego wybranych gmin wiejskich Poznańskiego Obszaru Metropolitalnego. Infrastrukt. I Ekol. Teren. Wiej. 2018, 3, 755–769. [Google Scholar]
- Heffner, K. Proces suburbanizacji a polityka miejska w Polsce. In Miasto—Region—Gospodarka w Badaniach Geograficznych; Marszał, T., Ed.; Uniwersytetu Łódzkiego: Łódź, Poland, 2016; pp. 75–110. [Google Scholar]
- Mrozik, K.; Idczak, P. Suburbanizacja w wybranych gminach wiejskich Bydgosko-Toruńskiego Obszaru Metropolitalnego. Studi. I Pr. WNEiZ 2015, 42, 183–194. [Google Scholar]
- Tokarczyk-Dorociak, K.; Kazak, J.; Szewrański, S. The Impact a Large City on Land Use in Suburban Area—The Case of Wrocław (Poland). J. Ecol. Eng. 2018, 19, 89–98. [Google Scholar] [CrossRef]
- Mrozik, K.; Waszczuk, M. Przestrzenne aspekty suburbanizacji w wybranych gminach wiejskich Białostockiego Obszaru Funkcjonalnego. Studi. Obsz. Wiej. 2019, 55, 53–68. [Google Scholar] [CrossRef]
- European Environment Agency (EEA). Land Take in Europe. Indicator Assessment. Available online: https://www.eea.europa.eu/data-and-maps/indicators/land-take-3/assessment (accessed on 31 August 2021).
- Main Land-Use Patterns in the EU within 2015–2030. JRC Policy Insight. February 2019. Available online: https://ec.europa.eu/jrc/sites/default/files/jrc115895.pdf (accessed on 31 August 2021).
- Haase, D.; Kabisch, N.; Haase, A. Endless Urban Growth? On the Mismatch of Population, Household and Urban Land Area Growth and Its Effects on the Urban Debate. PLoS ONE 2013, 8, e66531. [Google Scholar] [CrossRef] [PubMed] [Green Version]
- Rienow, A.; Stenger, D.; Menz, G. Sprawling cities and shrinking regions—Forecasting urban growth in the Ruhr for 2025 by coupling cells and agents. Erdkunde 2014, 68, 85–107. [Google Scholar] [CrossRef]
- rban Sprawl in Europe. Joint EEA-FOEN Report. No. 11. EEA. Available online: https://www.eea.europa.eu/publications/urban-sprawl-in-europe (accessed on 31 August 2021).
- Lisowski, A.; Grochowski, M. Procesy suburbanizacji. Uwarunkowania, formy i konsekwencje. In Ekspertyzy Do Koncepcji Zagospodarowania Przestrzennego Kraju; Saganowski, K., Zagrzejewska-Fiedorowicz, M., Żuber, P., Eds.; Ministry of Regional Development: Warsaw, Poland, 2008; Volume 1, pp. 217–280. [Google Scholar]
- Zamieszkane Budynki. Narodowy Spis Powszechny Ludności i Mieszkań 2011. Available online: https://stat.gov.pl/download/cps/rde/xbcr/gus/L_zamieszk_budynki_nsp_2011.pdf (accessed on 31 August 2021).
- Gibas, P.; Heffner, K. Społeczne i ekonomiczne koszty bezładu przestrzeni—Osadnictwo obszarów wiejskich. Studi. KPZK 2018, 182, 163–195. [Google Scholar]
- Lityński, P.; Hołuj, A. Koszty migracji wahadłowych ze strefy podmiejskiej do miasta rdzeniowego ośrodków wojewódzkich. Studi. KPZK 2018, 182, 114–162. [Google Scholar]
- Śleszyński, P.; Kowalewski, A.; Markowski, T.; Legutko-Kobus, P.; Nowak, M. The Contemporary Economic Costs of Spatial Chaos: Evidence from Poland. Land 2020, 9, 214. [Google Scholar] [CrossRef]
- Przybyla, C.; Bykowski, J.; Mrozik, K.; Napierala, M. The Role of Water and Drainage System Infrastructure in the Process of Suburbanization. Rocz. Ochr. Sr. 2011, 13, 769–786. [Google Scholar]
- Nilsson, K.; Pauleit, S.; Bell, S.; Aalbers, C.; Sick Nielsen, T.A. Peri-Urban Futures: Scenarios and Models for Land Use Change in Europe; Springer: Berlin/Heidelberg, Germany, 2013; p. 453. [Google Scholar]
- Mrozik, K. Zmiany jakości życia mieszkańców w gminie wiejskiej podlegającej suburbanizacji. Pr. Nauk. UE We Wroc. 2013, 320, 91–101. [Google Scholar]
- Nilsson, K.; Nielsen, T.S.; Aalbers, C.; Bell, S.; Boitier, B.; Chery, J.P.; Fertner, C.; Groschowski, M.; Haase, D.; Loibl, W.; et al. Strategies for Sustainable Urban Development and Urban Rural Linkages. Eur. J. Spat. Dev. 2014, 4, 1–26. Available online: https://archive.nordregio.se/Global/EJSD/Research%20briefings/article4.pdf (accessed on 31 August 2021).
- Petrovic, A.M. Challenges of torrential flood risk management in Serbia. J. Geogr. Inst. Jovan Cvijic Sasa 2015, 65, 131–143. [Google Scholar] [CrossRef]
- Petrovic, A.M.; Kovacevic-Majkic, J.; Milosevic, M.V. Application of run-off model as a contribution to the torrential flood risk management in Topiderska Reka watershed, Serbia. Nat. Hazards 2016, 82, 1743–1753. [Google Scholar] [CrossRef]
- Emergency Events Database. Available online: https://public.emdat.be/ (accessed on 19 September 2021).
- Climate of Risk. How Can Prevention and Insurance Reduce the Impact of Natural Disasters on the Environment? Available online: https://piu.org.pl/wp-content/uploads/2019/07/raport-klimatyczny-web_eng.pdf (accessed on 19 September 2021).
- Tanim, A.H.; McRae, C.B.; Tavakol-Davani, H.; Goharian, E. Flood Detection in Urban Areas Using Satellite Imagery and Machine Learning. Water 2022, 14, 1140. [Google Scholar] [CrossRef]
- Walczykiewicz, T.; Skonieczna, M. Rainfall Flooding in Urban Areas in the Context of Geomorphological Aspects. Geosciences 2020, 10, 457. [Google Scholar] [CrossRef]
- Seleem, O.; Heistermann, M.; Bronstert, A. Efficient Hazard Assessment for Pluvial Floods in Urban Environments: A Benchmarking Case Study for the City of Berlin, Germany. Water 2021, 13, 2476. [Google Scholar] [CrossRef]
- Benito, G.; Sanchez-Moya, Y.; Medialdea, A.; Barriendos, M.; Calle, M.; Rico, M.; Sopeña, A.; Machado, M.J. Extreme Floods in Small Mediterranean Catchments: Long-Term Response to Climate Variability and Change. Water 2020, 12, 1008. [Google Scholar] [CrossRef] [Green Version]
- Bryła, M.; Walczykiewicz, T.; Skonieczna, M.; Żelazny, M. Selected Issues of Adaptive Water Management on the Example of the Białka River Basin. Water 2021, 13, 3540. [Google Scholar] [CrossRef]
- Hlaváček, P.; Kopáček, M.; Horáčková, L. Impact of Suburbanisation on Sustainable Development of Settlements in Suburban Spaces: Smart and New Solutions. Sustainability 2019, 11, 7182. [Google Scholar] [CrossRef] [Green Version]
- Majewska, A.; Denis, M.; Krupowicz, W. Urbanization Chaos of Suburban Small Cities in Poland: ‘Tetris Development’. Land 2020, 9, 461. [Google Scholar] [CrossRef]
- Werner, P.A.; Kaleyeva, V.; Porczek, M. Urban Sprawl in Poland (2016–2021): Drivers, Wildcards, and Spatial Externalities. Remote Sens. 2022, 14, 2804. [Google Scholar] [CrossRef]
- Mrozik, K.; Przybyla, C.; Pyszny, K. Problems of the Integrated Urban Water Management. The Case of the Poznan Metropolitan Area (Poland). Rocz. Ochr. Sr. 2015, 17, 230–245. [Google Scholar]
- Mrozik, K. Assessment of Retention Potential Changes as an Element of Suburbanization Monitoring on Example of an Ungauged Catchment in Poznan Metropolitan Area (Poland). Rocz. Ochr. Sr. 2016, 18, 188–200. [Google Scholar]
- Solarek, K.; Pudelko, A.; Mierzwicki, K.; Bartosik, Z.; Pyjor, A. The potential of the research by design method in balancing water problems: An integrated water and space management program for a part of the Warsaw agglomeration. Cities 2022, 121, 10345. [Google Scholar] [CrossRef]
- Andrzejewska, A.K. Challenges of Spatial Planning in Poland in the Context of Global Climate Change—Selected Issues. Buildings 2021, 11, 596. [Google Scholar] [CrossRef]
- Solarek, K.; Kubasińska, M. Local Spatial Plans in Supporting Sustainable Water Resources Management: Case Study from Warsaw Agglomeration—Kampinos National Park Vicinity. Sustainability 2022, 14, 5766. [Google Scholar] [CrossRef]
- de Luca, C.; Naumann, S.; Davis, M.; Tondelli, S. Nature-Based Solutions and Sustainable Urban Planning in the European Environmental Policy Framework: Analysis of the State of the Art and Recommendations for Future Development. Sustainability 2021, 13, 5021. [Google Scholar] [CrossRef]
- Boguniewicz-Zabłocka, J.; Capodaglio, A.G. Analysis of Alternatives for Sustainable Stormwater Management in Small Developments of Polish Urban Catchments. Sustainability 2020, 12, 10189. [Google Scholar] [CrossRef]
- Mordwa, S.; Ostrowska, M. The influence of land cover on the spatial distribution of fire sites: A case study of Lodzkie Voivodeship, Poland. Eur. Spat. Res. Policy 2020, 27, 171–197. [Google Scholar] [CrossRef]
- Matuszkiewicz, R. Statistical analysis of State Fire Service intervention during chemical, radiation and biological hazards. In Proceedings of the International Conference on Fire and Environmental Safety Engineering (FESE), Lviv State Univ Life Safety, Lviv, Ukraine, 7–8 November 2018. [Google Scholar]
- Parkinson, M.; Meegan, R.; Karecha, J. City size and economic performance: Is bigger better, small more beautiful or middling marvellous? Eur. Plan. Stud. 2015, 23, 1054–1068. [Google Scholar] [CrossRef]
- Van der Gaast, K.; van Leeuwen, E.; Wertheim-Heck, S. City-Region Food Systems and Second Tier Cities: From Garden Cities to Garden Regions. Sustainability 2020, 12, 2532. [Google Scholar] [CrossRef] [Green Version]
- ESPON Project 1.4.3. Study on Urban Functions. Final Report. Available online: https://www.espon.eu/sites/default/files/attachments/fr-1.4.3_April2007-final.pdf (accessed on 30 June 2020).
- Cardoso, R.V.; Meijers, E.J. Contrasts between first-tier and second-tier cities in Europe: A functional perspective. Eur. Plan. Stud. 2016, 24, 996–1015. [Google Scholar] [CrossRef]
- Dogaru, T.; Burger, M.; van Oort, F.; Karreman, B. The Geography of Multinational Corporations in CEE Countries: Perspectives for Second-Tier City Regions and European Cohesion Policy. Investig. Reg. J. Reg. Res. 2014, 29, 193–214. [Google Scholar]
- Parkinson, M.; Meegan, R. Economic place making: Policy messages for European cities. Policy Stud. 2013, 34, 377–400. [Google Scholar] [CrossRef]
- Rondinelli, D. Dynamics of growth of secondary cities in developing countries. Geogr. Rev. 1983, 73, 42–57. [Google Scholar] [CrossRef]
- Komornicki, T.; Rosik, P.; Śleszyński, P.; Solon, J.; Wiśniewski, R.; Stępniak, M.; Czapiewski, K.; Goliszek, S.; Regulska, E. Wpływ Budowy Autostrad i Dróg Ekspresowych Finansowanych ze Środków UE w Latach 2004–2012 na Rozwój Ekonomiczny Regionów; Ministry of Regional Development: Warsaw, Poland, 2013. Available online: https://www.ewaluacja.gov.pl/media/24516/Wp%C5%82yw%20budowy%20autostrad%20i%20dr%C3%B3g%20ekspresowych%20na%20rozw%C3%B3j%20spo%C5%82eczno-gospodarczy%20i%20terytorialny%20Polski.pdf (accessed on 30 June 2020).
- Biuletyn Informacji Publicznej (BIP) Urzędu Marszałkowskiego Województwa Łódzkiego. Nowy Plan Zagospodarowania Przestrzennego Województwa. Available online: https://bip.lodzkie.pl/urzad-marszalkowski/programy/item/7929-nowy-plan-zagospodarowania-przestrzennego-wojew%C3%B3dztwa (accessed on 30 April 2019).
- Wielkopolskie Biuro Planowania Przestrzennego. Plan Zagospodarowania Przestrzennego Województwa Wielkopolskiego. Available online: http://www.wbpp.poznan.pl/index.php?option=com_content&task=view&id=198&Itemid=1 (accessed on 30 April 2019).
- Biuletyn Informacji Publicznej (BIP) Urząd Marszałkowski Województwa Dolnośląskiego. Plan Zagospodarowania Przestrzennego Województwa Dolnośląskiego. Perspektywa 2020. Available online: http://bip.umwd.dolnyslask.pl/dokument,iddok,23975,idmp,435,r,r (accessed on 30 April 2019).
- Statistics Poland. Local Data Bank. Available online: https://bdl.stat.gov.pl/BDL/start (accessed on 17 June 2020).
- National Register of Boundaries. Available online: https://www.geoportal.gov.pl/dane/panstwowy-rejestr-granic (accessed on 30 September 2020).
- Mapy Zagrożenia Powodziowego. Available online: https://wody.isok.gov.pl/imap_kzgw/?gpmap=gpMZP (accessed on 14 July 2018).
- Zasady Ewidencjonowania Zdarzeń w Systemie Wspomagania Decyzji Państwowej Straży Pożarnej. Available online: https://www.google.com/url?sa=t&rct=j&q=&esrc=s&source=web&cd=&ved=2ahUKEwj9yfiqrqX1AhUMkMMKHdp1AUAQFnoECAsQAQ&url=https%3A%2F%2Fwww.gov.pl%2Fattachment%2F4a4a6c0e-28f4-4826-a60a-9e75c43e9d63&usg=AOvVaw0U8PtejeJNB1InvSQEZR8z (accessed on 14 September 2021).
- European Commission. Directive 2007/60/EC of the European Parliament and of the Council of 23 October 2007 on the assessment and management of flood risks. Off. J. Eur. Union 2007, 288, 27–34. Available online: https://eur-lex.europa.eu/eli/dir/2007/60/oj (accessed on 10 July 2022).
- Rauter, M.; Thaler, T.; Attems, M.-S.; Fuchs, S. Obligation or Innovation: Can the EU Floods Directive Be Seen as a Tipping Point Towards More Resilient Flood Risk Management? A Case Study from Vorarlberg, Austria. Sustainability 2019, 11, 5505. [Google Scholar] [CrossRef] [Green Version]
- Lityński, P. The Intensity of Urban Sprawl in Poland. ISPRS Int. J. Geo-Inf. 2021, 10, 95. [Google Scholar] [CrossRef]
- Sroka, W.; Mikolajczyk, J.; Wojewodzic, T.; Kwoczynska, B. Agricultural Land vs. Urbanisation in Chosen Polish Metropolitan Areas: A Spatial Analysis Based on Regression Trees. Sustainability 2018, 10, 837. [Google Scholar] [CrossRef] [Green Version]
- Wysocka, D.; Biegańska, J.; Grzelak-Kostulska, E. Construction Activity as an Element of Suburban Zone Development. Land 2021, 10, 1229. [Google Scholar] [CrossRef]
- Surówka, K.; Wyrobek, J.; Surówka, M. The Condition of Polish Housing Against the Background of Selected European Countries. Eur. Res. Stud. J. 2020, 23, 469–482. [Google Scholar] [CrossRef]
- Pripoaie, R.; Cretu, C.-M.; Turtureanu, A.-G.; Sirbu, C.-G.; Marinescu, E.Ş.; Talaghir, L.-G.; Chițu, F.; Robu, D.M. A Statistical Analysis of the Migration Process: A Case Study—Romania. Sustainability 2022, 14, 2784. [Google Scholar] [CrossRef]
- Plaziak, M.; Szymanska, A.I. Construction Sector in the Czech Republic and Poland: Focus on the Housing Segment in Selected Regions. Entrep. Bus. Econ. Rev. 2014, 2, 47–63. [Google Scholar] [CrossRef] [Green Version]
- Kleovoulou, E.G.; Konstantinou, C.; Constantinou, A.; Kuijpers, E.; Loh, M.; Galea, K.S.; Stierum, R.; Pronk, A.; Makris, K.C. Stakeholders′ Perceptions of Environmental and Public Health Risks Associated with Hydrocarbon Activities in and around the Vasilikos Energy Center, Cyprus. Int. J. Environ. Res. Public Health 2021, 18, 13133. [Google Scholar] [CrossRef]
- Zydroń, A.; Szoszkiewicz, K.; Chwiałkowski, C. Valuing Protected Areas: Socioeconomic Determinants of the Willingness to Pay for the National Park. Sustainability 2021, 13, 765. [Google Scholar] [CrossRef]
- Oppenheim, A.N. Questionnaire Design, Interviewing and Attitude Measurement; Pinter: London, UK; Washington, DC, USA, 1997; ISBN 10:0826451764. [Google Scholar]
- Ságvári, B.; Gulyás, A.; Koltai, J. Attitudes towards Participation in a Passive Data Collection Experiment. Sensors 2021, 21, 6085. [Google Scholar] [CrossRef]
- Górska, P.; Górna, I.; Miechowicz, I.; Przysławski, J. Changes in Eating Behaviour during SARS-CoV-2 Pandemic among the Inhabitants of Five European Countries. Foods 2021, 10, 1624. [Google Scholar] [CrossRef]
- Rymarz, J.; Niewczas, A.; Hołyszko, P.; Dębicka, E. Application of Spearman’s Method for the Analysis of the Causes of Long-Term Post-Failure Downtime of City Buses. Appl. Sci. 2022, 12, 2921. [Google Scholar] [CrossRef]
- Theis, S.; Poesch, M.S. Assessing Conservation and Mitigation Banking Practices and Associated Gains and Losses in the United States. Sustainability 2022, 14, 6652. [Google Scholar] [CrossRef]
- Ustawa z Dnia 20 Lipca 2017 r. (t.j. Dz. U. z 2021r. poz. 2233 ze zm.) (The Water Law Act of 20 July 2017). Available online: https://isap.sejm.gov.pl/isap.nsf/download.xsp/WDU20170001566/U/D20171566Lj.pdf (accessed on 25 February 2022).
- Godyń, I.; Grela, A.; Stajno, D.; Tokarska, P. Sustainable Rainwater Management Concept in a Housing Estate with a Financial Feasibility Assessment and Motivational Rainwater Fee System Efficiency Analysis. Water 2020, 12, 151. [Google Scholar] [CrossRef] [Green Version]
- Godyń, I.; Muszyński, K.; Grela, A. Assessment of the Impact of Loss-of-Retention Fees on Green Infrastructure Investments. Water 2022, 14, 560. [Google Scholar] [CrossRef]
- Rozporządzenie Rady Ministrów z Dnia 22 Grudnia 2017r. w Sprawie Jednostkowych Stawek Opłat za Usługi Wodne (Dz. U. z 2017r. poz. 2502) (The Coucil of Ministers’ Decree of 22 December 2017 Regarding Unit Rates of Fees for Water Services). Available online: https://isap.sejm.gov.pl/isap.nsf/download.xsp/WDU20170002502/O/D20172502.pdf (accessed on 25 February 2022).
- Matej-Łukowicz, K.; Wojciechowska, E. Opłaty za odprowadzanie wód deszczowcyh. Fees for discharge of stormwater. Res. Pap. Wroc. Univ. Econ. 2015, 441, 104–114. [Google Scholar] [CrossRef] [Green Version]
- Tokarczyk-Dorociak, K.; Walter, E.; Kobierska, K.; Kolodynski, R. Rainwater management in the urban landscape of Wroclaw in terms of adaptation to climate changes. J. Ecol. Eng. 2017, 18, 171–184. [Google Scholar] [CrossRef]
- Responses of the Minister of Climate and Environment to a parliamentary interpellation from 9 November 2020. Available online: https://www.google.com/url?sa=t&rct=j&q=&esrc=s&source=web&cd=&cad=rja&uact=8&ved=2ahUKEwiosbXsgoX4AhXx_CoKHd2GAZMQFnoECAIQAQ&url=https%3A%2F%2Fwww.sejm.gov.pl%2FSejm9.nsf%2FInterpelacjaTresc.xsp%3Fkey%3DBVADS6&usg=AOvVaw2SfTHl8qHtocnw9XZc7Si8 (accessed on 25 February 2022).
- Qiao, X.-J.; Randrup, T.B. Willingness to Pay for the Maintenance of Green Infrastructure in Six Chinese Pilot Sponge Cities. Water 2022, 14, 428. [Google Scholar] [CrossRef]
- Mrozik, K.D.; Przybyla, C.T. An Attempt to Introduce Cultivation and Planning Measures into the Decision-Making Process in Order to Improve Water-Retaining Capacity of River Catchments. Pol. J. Environ. Stud. 2013, 22, 1767–1773. [Google Scholar]
- Antón, R.; Ruiz-Sagaseta, A.; Orcaray, L.; Arricibita, F.J.; Enrique, A.; Soto, I.D.; Virto, I. Soil Water Retention and Soil Compaction Assessment in a Regional-Scale Strategy to Improve Climate Change Adaptation of Agriculture in Navarre, Spain. Agronomy 2021, 11, 607. [Google Scholar] [CrossRef]
- Ket, P.; Oeurng, C.; Degré, A. Estimating Soil Water Retention Curve by Inverse Modelling from Combination of In Situ Dynamic Soil Water Content and Soil Potential Data. Soil Syst. 2018, 2, 55. [Google Scholar] [CrossRef] [Green Version]
Figure 1.
Flow chart of developing recommendations for rural communities directly adjacent to metropolitan cities in the field of local flooding protection.
Figure 1.
Flow chart of developing recommendations for rural communities directly adjacent to metropolitan cities in the field of local flooding protection.

Figure 2.
Location of the analyzed rural communities and metropolitan areas.

Figure 3.
Form of local flooding among respondents declaring occurrence of flooding (n = 51). Source: own study based on questionnaire research. This is a figure.
Figure 3.
Form of local flooding among respondents declaring occurrence of flooding (n = 51). Source: own study based on questionnaire research. This is a figure.

Figure 4.
Losses incurred as a result of local flooding among the respondents declaring an occurrence of flooding (n = 51). Source: own study based on questionnaire research.
Figure 4.
Losses incurred as a result of local flooding among the respondents declaring an occurrence of flooding (n = 51). Source: own study based on questionnaire research.


| Metropolitan Area | Number of Communities: Urban, Urban–Rural, Rural, Total | Area in km2 | Population in Thousands | Share in the Number of Communities of the Province | Share in the Population of the Province | Share in the Area of the Province |
|---|---|---|---|---|---|---|
| ŁMA | 7, 5, 16, 28 | 2498.9 | 1068.4 | 15.8 | 13.7 | 43.5 |
| PMA | 6, 21, 18, 45 | 6201.9 | 1447.2 | 19.9 | 20.8 | 41.4 |
| WrMA | 3, 9, 15, 27 | 3797.1 | 1064.8 | 16 | 19 | 36.7 |
Table 2.
Basic information about analyzed communities.
| Name | MA | Area in km2 | Population in Thousands | Population Per 1 km2 | Entities of the National Economy Employing More Than 49 People Per 10 Thousand Population |
|---|---|---|---|---|---|
| Andrespol | ŁMA | 25.7 | 14.2 | 552 | 4.2 |
| Brójce | ŁMA | 69.0 | 6.7 | 97 | 7.5 |
| Czernica | WrMA | 83.6 | 16.6 | 199 | 2.4 |
| Czerwonak | PMA | 82.5 | 27.6 | 335 | 7.2 |
| Długołęka | WrMA | 212.8 | 33.8 | 159 | 5.3 |
| Dopiewo | PMA | 108.0 | 28.1 | 260 | 7.8 |
| Kleszczewo | PMA | 74.5 | 8.9 | 119 | 10.1 |
| Kobierzyce | WrMA | 149.3 | 21.8 | 146 | 20.7 |
| Komorniki | PMA | 66.4 | 30.6 | 461 | 13.4 |
| Ksawerów | ŁMA | 13.6 | 7.7 | 562 | 9.1 |
| Miękinia | WrMA | 179.5 | 17.0 | 95 | 7.1 |
| Nowosolna | ŁMA | 54.0 | 5.1 | 94 | 3.9 |
| Pabianice | ŁMA | 87.7 | 7.6 | 87 | 1.3 |
| Rokietnica | PMA | 79.3 | 18.6 | 235 | 6.4 |
| Suchy Las | PMA | 116.0 | 18.1 | 156 | 21.5 |
| Tarnowo Podgórne | PMA | 101.7 | 28.1 | 276 | 33.1 |
| Wisznia Mała | WrMA | 103.4 | 10.6 | 102 | 0.9 |
| Zgierz | ŁMA | 199.0 | 14.5 | 73 | 4.1 |
| Min | 13.6 | 5.1 | 73 | 0.9 | |
| Max | 21.3 | 33.8 | 562 | 33.1 | |
| Mean | 10.0 | 17.5 | 223 | 9.2 | |
| Std. deviation | 5.3 | 8.8 | 155 | 8.0 |
Publisher’s Note: MDPI stays neutral with regard to jurisdictional claims in published maps and institutional affiliations. |
© 2022 by the author. Licensee MDPI, Basel, Switzerland. This article is an open access article distributed under the terms and conditions of the Creative Commons Attribution (CC BY) license (https://creativecommons.org/licenses/by/4.0/).
Share and Cite
MDPI and ACS Style
Mrozik, K.D. Problems of Local Flooding in Functional Urban Areas in Poland. Water 2022, 14, 2453. https://doi.org/10.3390/w14162453
AMA Style
Mrozik KD. Problems of Local Flooding in Functional Urban Areas in Poland. Water. 2022; 14(16):2453. https://doi.org/10.3390/w14162453
Chicago/Turabian StyleMrozik, Karol Dawid. 2022. "Problems of Local Flooding in Functional Urban Areas in Poland" Water 14, no. 16: 2453. https://doi.org/10.3390/w14162453
Note that from the first issue of 2016, this journal uses article numbers instead of page numbers. See further details here.