
Phosphorus Adsorption on Blast Furnace Slag with Different Magnetism and Its Potential for Phosphorus Recovery


1
China-UK Low Carbon College, Shanghai Jiao Tong University, Shanghai 201306, China
2
State Environmental Protection Key Laboratory of Environmental Risk Assessment and Control on Chemical Process, East China University of Science and Technology, Shanghai 200237, China
3
School of Environmental Science and Engineering, Shanghai Jiao Tong University, Shanghai 200240, China
*
Authors to whom correspondence should be addressed.
Water 2022, 14(16), 2452; https://doi.org/10.3390/w14162452
Submission received: 21 June 2022
/
Revised: 2 August 2022
/
Accepted: 4 August 2022
/
Published: 9 August 2022
(This article belongs to the Section Wastewater Treatment and Reuse)
Abstract
:Phosphorus (P) is one of the essential nutrients for all life but also is involved in the major factor of water eutrophication. This study aimed to investigate a low-cost approach for highly efficient P removal and recovery from wastewater with blast furnace slag (BFS) as the adsorbent. The adsorption characteristics were consistent with the Langmuir adsorption isotherm (q0 0.1370~0.3848 mg/g) and quasi-secondary kinetic model (R2 = 0.9986~0.9997), suggesting monomolecular-layer chemical adsorption might be the dominant pathway. According to the determination of scanning electron microscope and energy dispersive spectroscopy, P was distributed uniformly with other elements in the surface of BFS and even formed needle-like crystals. This indicated that P might be also further deposited in the surface of BFS after the initially chemical adsorption via coordination with the active sites, which led to the slow accumulation of P along with the adsorption experiments. The binding energy and atomic composition analysis of X-ray photoelectron spectroscopy revealed that phosphate mainly existed as HPO42− in the surface of BFS, especially for those non-magnetic particles with relative low Fe content (<30%), indicating the preference of P to the hydroxyl basic sites. Compared with those magnetic particles, the adsorption capacity of the non-magnetic particles was larger and could be restored more easily with the elution of sulfate acid, resulting in about two times the P recovery capability. Based on the P adsorption mechanism in the surface of BFS, the operation conditions of the BFS adsorption column for P recovery were optimized in an alkaline condition with a low phosphate concentration and long residual time. Therefore, non-magnetic BFS with small size could be used to recover P resources from rural wastewater with low P concentration and facilitated the on-site reuse of P resources in rural districts.
1. Introduction
Phosphorus (P) is one of the essential or even limiting nutrients for all livings, but it is also a key factor promoting the eutrophication of surface water [1]. In order to prevent eutrophication, many technologies such as chemical, biological, and physicochemical methods have been developed to remove or recover P from wastewater [2]. Chemical technologies of P removal are prone to secondary pollution, require the consumption of large amounts of chemicals, and do not allow for the recovery of P [3]. Biological P removal technologies face limitations such as stringent reaction conditions and residual sludge treatment and have to incorporate deep P removal to meet the discharging standards [4]. The physicochemical technologies, including chemical precipitation, ion exchange, and crystallization, face problems such as expensive cost and complex operation [5,6,7]. Nevertheless, adsorption methods based on filters are widely used for P removal or recovery from wastewater because of the simplicity and cost-effectiveness [8].
As a typical process used in rural domestic sewage dephosphorization [9], constructed wetland (CW) is mainly composed of filters, plants, microorganisms, and other components and removes pollutants in wastewater via physical filter, chemical precipitation and biological degradation [10,11]. For P removal, the main method includes chemical adsorption of phosphate via coordination complexation and ion exchange, physical adsorption triggered by electrostatic attraction, and the subsequent chemical deposition on filter surface [12,13]. Metal oxides in the surface of filters are important P adsorption sites, which provide multiply charged cations such as Fe3+, Al3+, Ca2+, Mg2+, etc. Phosphate adsorbed on surfaces rich in Fe3+ and Al3+ might result in the formation of hydroxyl ferric phosphate or hydroxyl ferric phosphate, whereas those rich in Ca2+ and Mg2+ might react with phosphate to form calcium or magnesium phosphate precipitates [14]. Thus, adsorbents with a huge specific surface area and abundance of cation sites might facilitate phosphate removal in sewage. However, the performance of CW is often affected by factors such as suspended particles, organic loading rate, hydraulic retention time, plant growth, and redox conditions [15], which might accelerate the clogging and reduce the effective adsorption capacity. Since the filters in CW cannot be restored onsite, they have to be replaced with new filters after saturation and thus cause expensive costs and even secondary pollution [10]. Compared with CW, the adsorption column based on filter adsorption has certain advantages in regeneration of filters on-site and recovery of P resources from rural sewage as well as dealing with the adverse effects in influent [16]. For example, the suspended solids and biomass in influent might be removed via backwashing, and its P adsorption capacity might be restored by leaching; thus, the leached P might be used for the rural planting.
Common filters currently used in CW can be generally divided into two categories: natural minerals such as bentonite, bauxite, natural zeolite, etc. [17,18], and industrial waste including fly ash [19], steel slag [20], slag [21], red mud [22], etc. Blast furnace slag (BFS) is an industrial solid waste generated from gangue in iron ore, ash in fuel, and non-volatile components in flux (usually limestone) in the process of blast furnace ironmaking, which has been given great attention recently as a potential adsorption material for phosphate removal since it is easily available and cost-effective [23,24]. In this paper, BFS with different sizes and magnetisms was used as adsorbents to adsorb and recover P in batch and column experiments with synthetic wastewater as the influent. The batch adsorption tests were carried out to reveal the adsorption properties of BFS along with the detection of scanning electron microscope and energy dispersive spectroscopy (SEM-EDS), X-ray fluorescence (XRF), and X-ray photoelectron spectroscopy (XPS) to explore the adsorption mechanisms of P. In addition, column experiments were carried out to optimize the operation conditions. These results might reveal the potential of BFS in P adsorption and recovery from a low-concentration solution and thus guide P recovery in rural sewage and promote the on-site reuse of P resources in rural districts.
2. Materials and Methods
2.1. Adsorption Material and Chemicals
In order to match the practical application of P recovery in rural sewage treatment, amorphous BFS from a local steel plant was selected as the P adsorption filter, which was in low crystalline and divided into two groups with sizes of 1~2 mm (BFS1) and 2~4 mm (BFS2), respectively. Before the experiments, the BFS was separated into two groups, with or without magnetism, and immersed in 5 mM sulfate acid solution for 24 h and then leached with pure water at the rate of 0.5 L h−1 until the pH of the effluent was close to 7.0. All chemicals required in the experiments, namely KH₂PO4, K2HPO4, and H2SO4, were of analytical purity and purchased from Sinopharm Chemical Reagent Co., Ltd., Shanghai, China.
2.2. Batch Adsorption Experiment
2.2.1. Adsorption Isotherm
Stock solution of P (160 mg L−1) was prepared by dissolving 0.3510 g KH2PO4 and 0.4490 g K2HPO4 in pure water and diluting to 1000 mL. Then, 10 g pretreated BFS with particle sizes of 1~2 mm or 2~4 mm were added in 250 mL conical flask with 200 mL of P solution (concentrations being 1, 5, 10, 20, and 40 mg L−1). The adsorption reaction was conducted using a constant temperature shaker at 200 ± 1 r min−1 and 25 ± 0.5 °C for static adsorption. Samples were collected from the supernatant at 1 h intervals and then filtered through 0.45 μm PVDF membrane (Shanghai Titan Scientific Co., Ltd., Shanghai, China) to determine the P concentration using the ammonium molybdate spectrophotometric method. The equilibrium adsorption of P by BFS was recorded to evaluate the theoretical adsorption capacity of BFS via the construction of the adsorption isotherm. All the experiments were repeated three times. The adsorption data were fitted with Langmuir and Freundlich adsorption isothermal equations, respectively, and revealed the isothermal adsorption properties of P on BFS. The model equations are as follows [25,26,27]:
where qe is the adsorption capacity at equilibrium (mg g−1); q0 is the theoretical maximum adsorption capacity of the adsorbent (mg g−1); Ce is the mass concentration of the adsorbate at adsorption equilibrium (mg L−1); b is the Langmuir adsorption equilibrium constant (L mg−1); n and k are the Freundlich adsorption isotherm constants.
2.2.2. Adsorption Kinetics
Next, 10 g pretreated BFS with particle sizes of 1~2 mm or 2~4 mm were added in 250 mL conical flask with 200 mL of P solution (20 mg L−1). To maintain the static adsorption, reaction batches were placed in a constant temperature shaker at 200 ± 1 r min−1 and 25 ± 0.5 °C. Samples were collected from the supernatant at 1 h intervals, then filtered with 0.45 μm PVDF membrane, and determined with ammonium molybdate spectrophotometric method for the concentration of P. These experiments were repeated three times. The data were fitted with the quasi-first-order kinetic model and quasi-second-order kinetic model [28,29,30], which were used to reveal the time-dependence adsorption of P on BFS.
where qt is the amount adsorbed at time t (mg g−1); qe is the amount adsorbed when adsorption reaches equilibrium (mg g−1); k1 is the quasi-first-order kinetic rate constant; and k2 is the quasi-second-order kinetic rate constant.
2.3. Characterization
The surface chemical components were estimated with the Energy Scattering X-ray Fluorescence Spectrometer (XRF, Shimadzu EDX-720, Tokyo, Japan) (Table S1). In order to reveal the adsorption mechanism of P on BFS, especially for the different sites of the complex surface, a scanning electron microscope (SEM, JEOL JSM-7800F, Tokyo, Japan) equipped with energy-dispersive X-ray spectroscopy (EDS) was used to characterize the surface morphology and chemical composition of BFS samples before and after P adsorption. XRF was used to assess the surface components of metal elements, and X-ray photoelectron spectroscopy (XPS, Shimadzu AXIS UltraDLD, Tokyo, Japan) was used to analyze P adsorbed in the surface of BFS before adsorption and after adsorption and acid washing (regeneration).
2.4. Column Adsorption Experiment
2.4.1. Column Adsorption Device
In this study, cylindrical Plexiglas (column height of 1 m, inner diameter of 45 mm, and outer diameter of 55 mm) was used as the fixed bed device with 1675 g BFS as filters. The synthetic wastewater was pumped into column following the bottom-up direction to facilitate full contact between the solution and adsorbents and achieve better performance of P adsorption. As soon as the saturation of the adsorbent, 5.0 mM sulfate acid was pumped from the top of column with the flow rate of 0.5 L h−1 until the concentration of P in effluent below 0.5 mg L−1; thus, the adsorbent was regenerated.
2.4.2. Influence Factors
According to the previous works on adsorption of P [8], several factors affected the P adsorption with specific materials, mainly focused on the particle size of filters, initial P concentration (5, 10, 20 mg L−1), pH (4.0, 7.0, 9.0), and hydraulic retention time (HRT, 4 and 2 h). Therefore, the column adsorption experiments were carried out to optimize the operation of P adsorption with different BFSs.
2.4.3. Thomas Models
The Thomas model was proposed by Henry C. Thomas in 1944 on the basis of the Langmuir adsorption–desorption kinetics hypothesis. The rate of driving force follows the second-order reversible reaction kinetics, and there is no axial dispersion. It is an ideal model commonly used to describe the dynamic adsorption curve of the columnar adsorption bed and can calculate the equilibrium adsorption capacity and adsorption rate constant of the adsorbent. The model takes the following form [31]:
A simplification of Equation (6) in the linearized form of Thomas model is [32]:
where t is the accumulation time or the service time (h); C0 is the concentration of the solute to entry into the column (mg L−1); Ct is the concentration of the solute to depart from the column at time t (mg L−1); KTh is the Thomas rate constant (L·mg−1·h−1); Q is the volumetric flow rate (L d−1); q0 is the equilibrium solute uptake per gram of the adsorbent bed (mg g−1); M is the amount of adsorbent in the column (g); and Vt is the effective volume of the treated water (L).
3. Results and Discussion
3.1. Adsorption Isotherm
BFS with different particle sizes were used to adsorb P in solution with different initial concentrations. The variation of P concentration in the supernatant and the calculated adsorption amount along with time were recorded. All of the P concentrations in the supernatant were almost unchanged after 7 h, which indicated that the adsorbent might reach saturation, and the adsorption equilibrium was established in this experimental condition. The variation curves of P adsorption amounts in BFS1 (Figure 1a,b) and BFS2 (Figure 1c,d), along with the extended time, clearly showed that BFS with fine particle size presented a higher adsorption capacity than those with large-sized particles. This should be ascribed to the difference in specific surface area since adsorption mainly takes place on the surface active sites of adsorbents [33]. In addition, a higher initial P concentration might facilitate the establishment of adsorption equilibrium with a higher adsorption amount, which might provide higher mass transfer power.
The Langmuir and Freundlich adsorption isotherms were fitted to the experimental data of BFS1 and BFS2, respectively (Table 1). The correlation coefficients (R2) of Langmuir adsorption isotherm were slightly higher than those of Freundlich adsorption isotherm, which were consistent with the previous works [34]. This might be ascribed to the coordination complexation of P with active sites in the surface of BFS, which was named chemical adsorption and dominated the process of P adsorbed in the surface of BFS [11].
In addition, the fitting results of the Langmuir adsorption isotherm showed that the theoretical maximum adsorption capacity of BFS1 and BFS2 was 0.3056 mg g−1 and 0.1275 mg g−1, respectively, indicating that the P adsorption capacity of fine-grained BFS was significantly higher than that with large-sized particles. This was consistent with the previous work [34] in which the specific surface area of the amorphous BFS with a particle size of 0.1 mm was estimated to be 15 times of that of BFS1, whereas the P adsorption capacity, 6.47 mg g−1, was about 21 times that of BFS1. Thus, this gap might be attributed to the difference in specific surface area of these two BFS particles.
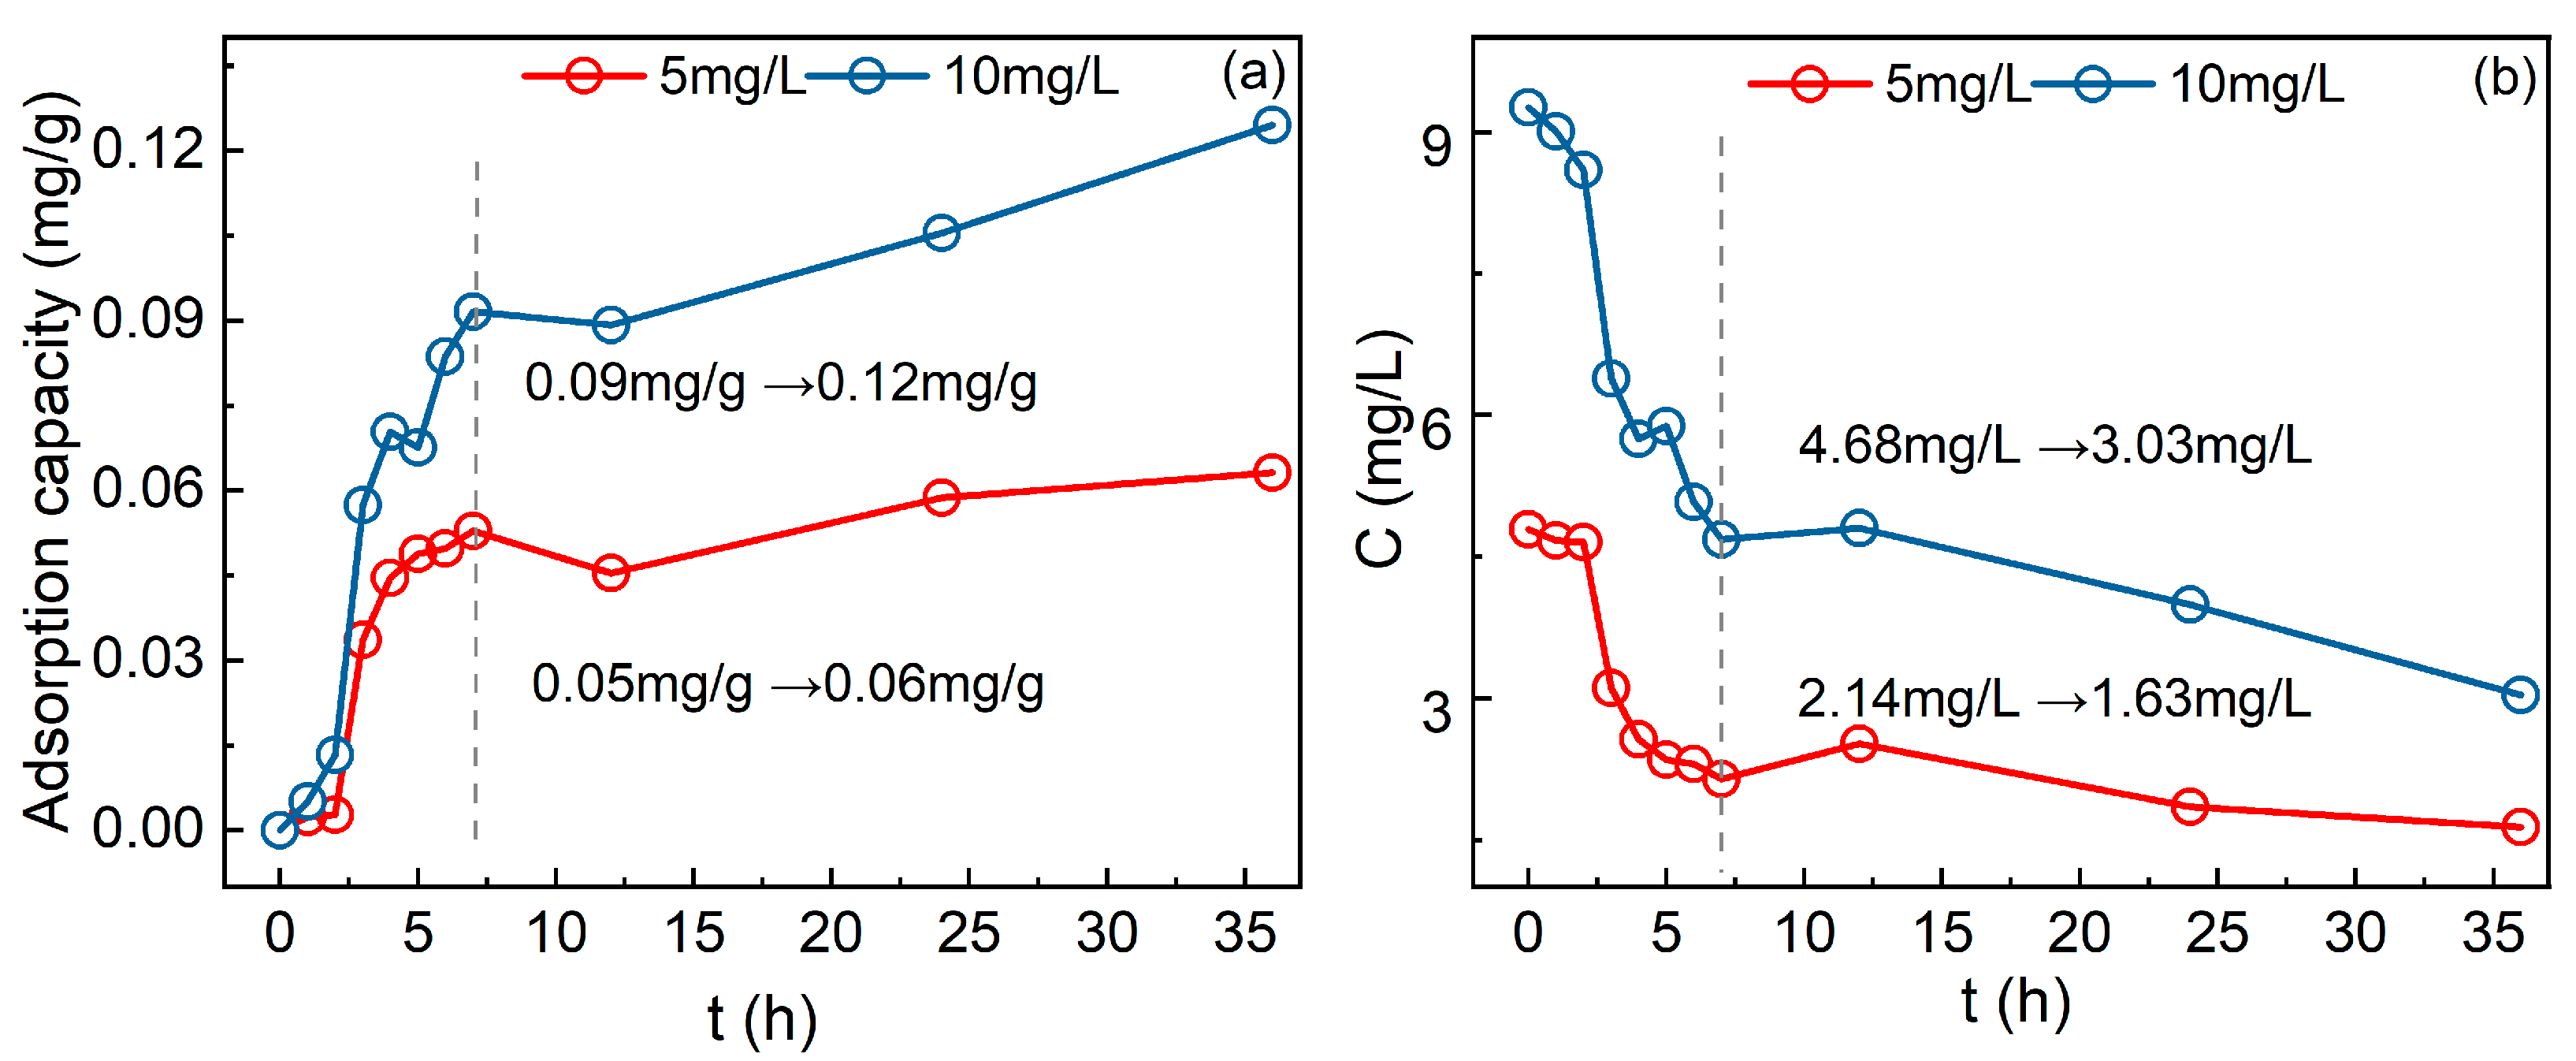
It should be noticed that adsorption equilibriums were nearly established after 7 h in all of the static experiments, whereas the concentration of P in supernatants still decreased gradually along with the time extension. The static adsorption experiments with initial P concentrations of 5 mg L−1 and 10 mg L−1 both showed that P was removed continuously from solutions after the adsorption equilibrium (Figure 2). For experiments with initial P concentration of 5 mg L−1, the P concentration in the supernatant gradually decreased from 2.14 mg L−1 to 1.63 mg L−1 after 36 h, and the adsorption amount increased slightly from 0.05 mg g−1 to 0.06 mg g−1. This indicated that there was still P adsorption or deposition in the surface of BFS after the rapid chemical adsorption, mainly via coordination of phosphate with the active sites in the surface of BFS [35].
3.2. Adsorption Kinetics
To determine the kinetic properties of P adsorbed on BFS, the progress of P adsorption on BFS during the experiment was carried out with the initial P concentration of 20 mg L−1. Based on the variation of P concentration in the supernatant along with the experiment, the quasi-first-order kinetic and the quasi-second-order kinetic models were applied to fit the data (Table 2). It could reflect the adsorption rate of the adsorbent and further obtain the equilibrium adsorption capacity and analyze the P adsorption mechanism. The quasi-second-order kinetic model showed better effects in simulation of the progress of P adsorption in the surface of BFS; the R2 of quasi-second-order kinetic model was 0.9965 (BSF1) and 0.9986 (BSF2), which was higher than that of quasi-first-order kinetic model. This confirmed that chemical adsorption, i.e., interaction of phosphate with the active sites in the surface, might be the dominant pathway for P adsorption on BFS. At the same time, the equilibrium adsorption capacity of BFS1, about 0.3015 mg g−1, was significantly higher than that of BFS2, about 0.1217 mg g−1 (Table 2), which was consistent with the prediction of isothermal model (Table 1).
3.3. Mechanism of P Adsorption on BFS
According to the batch experiments, P adsorption of BFS might be dominated by the chemical adsorption. However, BFS was a rather complex mixture composited with the Fe-Mn oxides, aluminosilicate, and even CaO and might present different crystal, glassy, and amorphous states due to the different baking and annealing temperatures. Therefore, the active sites responsible for the coordination complexation of P on surface of BFS should be determined further with the SEM-EDS, XRF, and XPS.
3.3.1. SEM-EDS Characterization
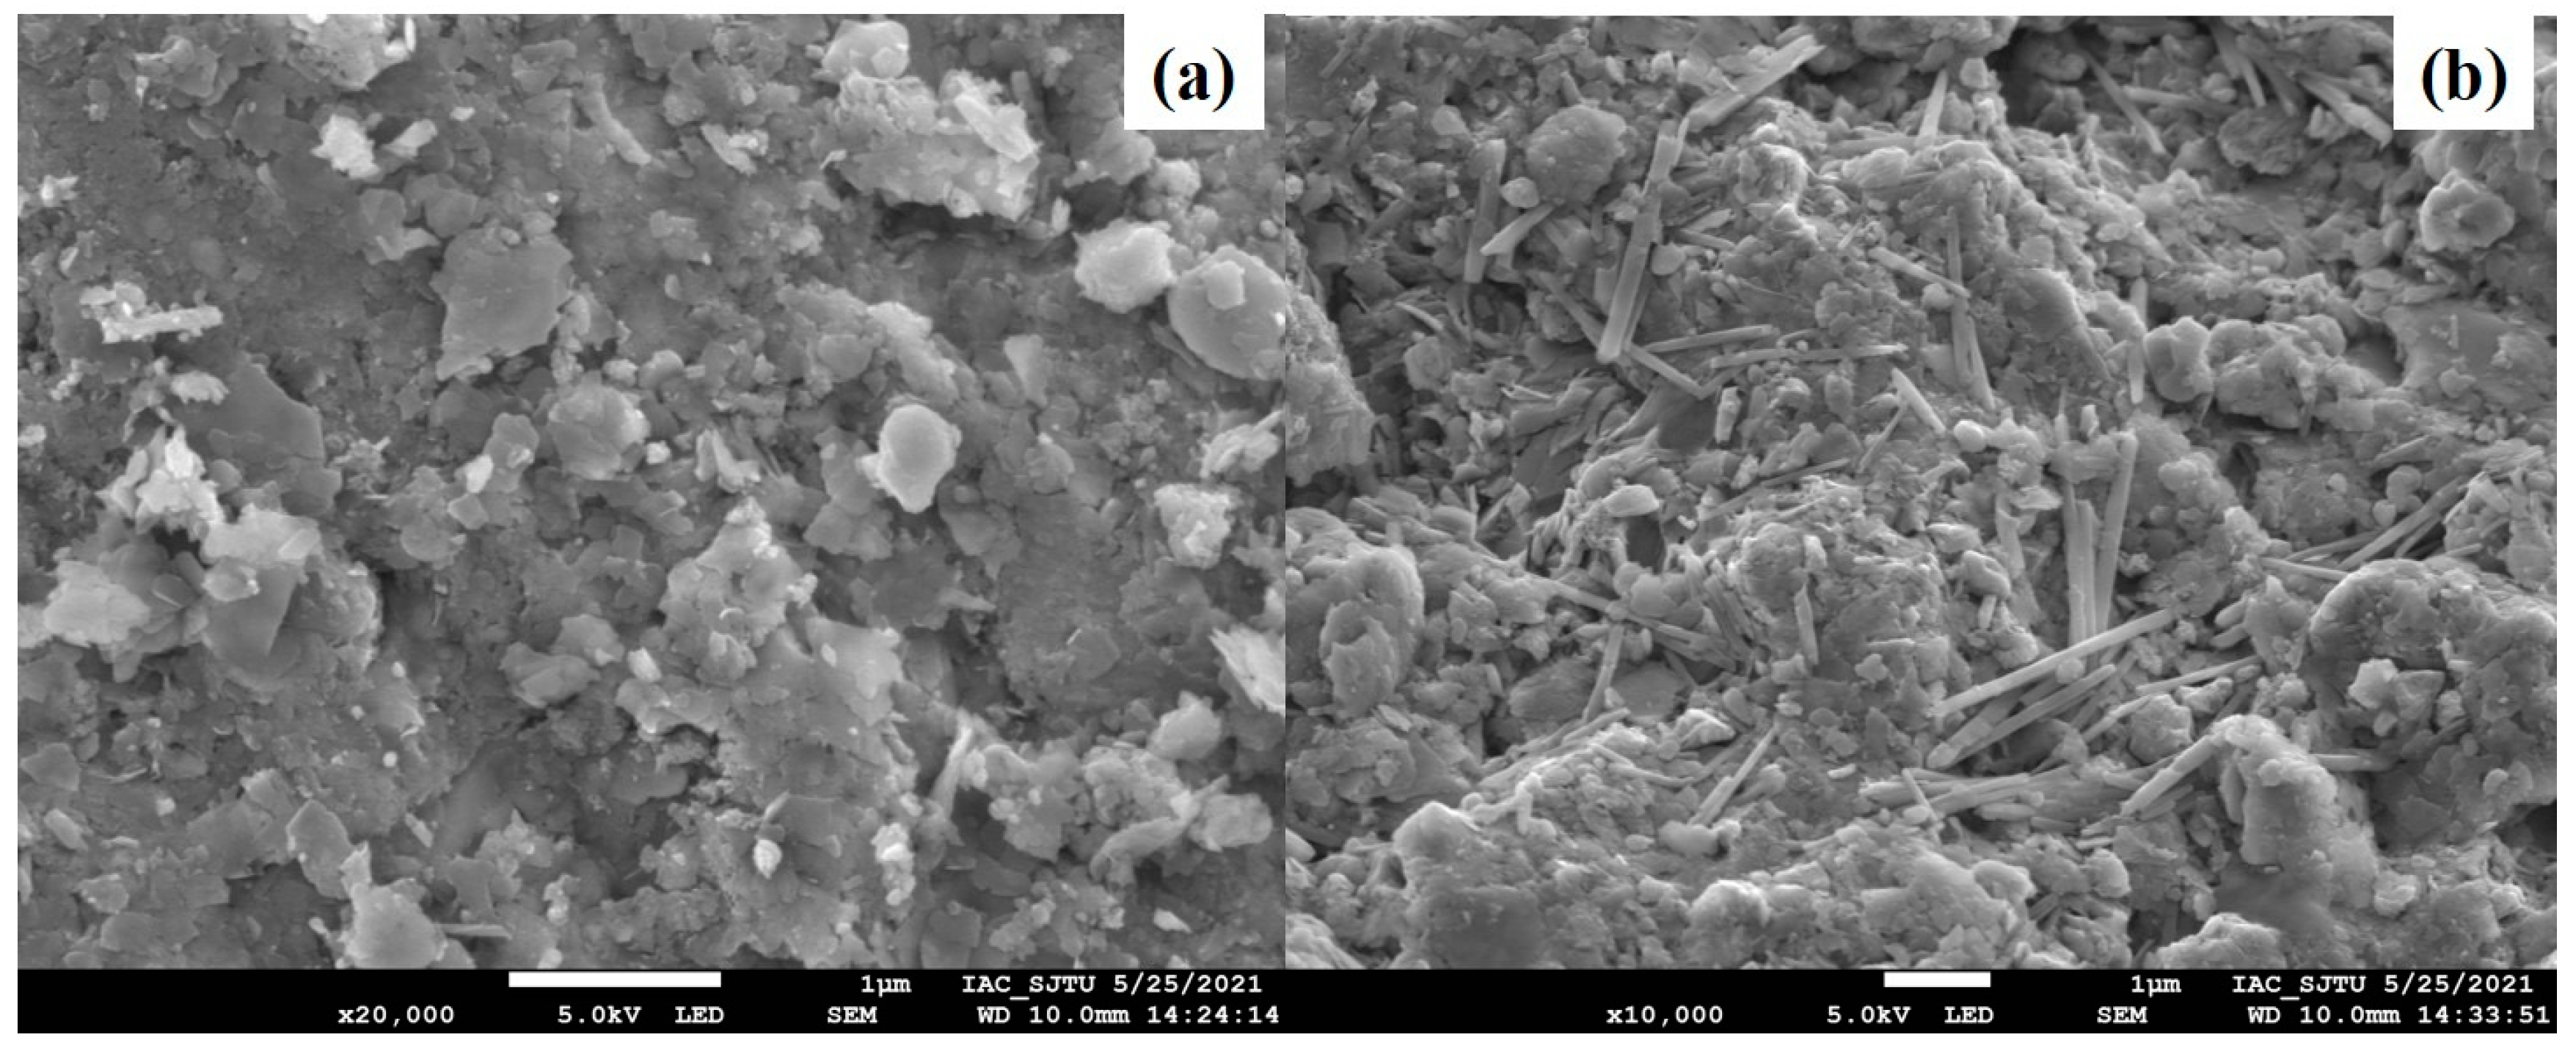
In order to explore the forms of P adsorbed on BFS, BFS1 samples before and after adsorption equilibrium with an initial P concentration of 80 mg L−1 solution were determined with SEM combined with EDS (Figure 3). The surface of the BFS before adsorption was mainly covered with the lamellar and granular particle (Figure 3a), whereas some needle-like crystals appeared in the surface of BFS after adsorption (Figure 3b). This indicated that P might not only coordinate with the active sites in the surface of BFS but also deposit further as chemical crystallization in the surface of BFS [35], thus changing the morphology of the BFS surface [36,37]. Combined with the results of the adsorption isotherm, it is suggested that phosphate might be firstly adsorbed on the BFS surface via chemisorption and then deposited further as needle-like crystal clusters that provide the reaction interface for subsequent chemical deposition, which was also consistent with the prolonged adsorption experiment (Figure 2).
EDS analysis was performed with the BFS1 samples before and after adsorption, and the main element components are shown in Table 3, which reveals that the surface of BFS was mainly composited with silicon, manganese, aluminum, and iron elements. The atomic percentage of P on the BFS1 surface increased slightly from 1.17% to 1.40%, which indicates that the phosphate was retained in the surface of the BFS. However, the actual atom percentage of elements should be lower than those shown in Table 3, as other elements, including oxygen, potassium, and sulfur, were not included. P was uniformly distributed in the surface, indicating monomolecular layer adsorption, which was consistent with the results of the Langmuir adsorption isotherm (Figure 4). The needle-like crystals did not show obvious enrichment of P, indicating the formation of a complex compound rather than pure phosphate crystals (Figure S1).
3.3.2. XRF Characterization
XRF was also used to detect the surface chemical composites of BFS before and after P adsorption (Table S1). Atomic percentages of Fe and Mn in BFS with magnetism were larger than 50%, whereas that without magnetism contained less than 20% Fe and Mn. On the other hand, more Al and Si, which were larger than 70%, existed in the non-magnetic BFS, but less Al and Si existed in the magnetic BFS, about 30%. Therefore, BFS might be a complex mixture rather than a uniform compound [33], and the adsorption of phosphate in the surface of BFS should be further investigated according to different magnetisms. In addition, compared with the non-magnetic BFS, magnetic BFS seemed more unstable, as its chemical compositions changed obviously after the elution with 5 mM sulfate acid.
3.3.3. XPS Characterization
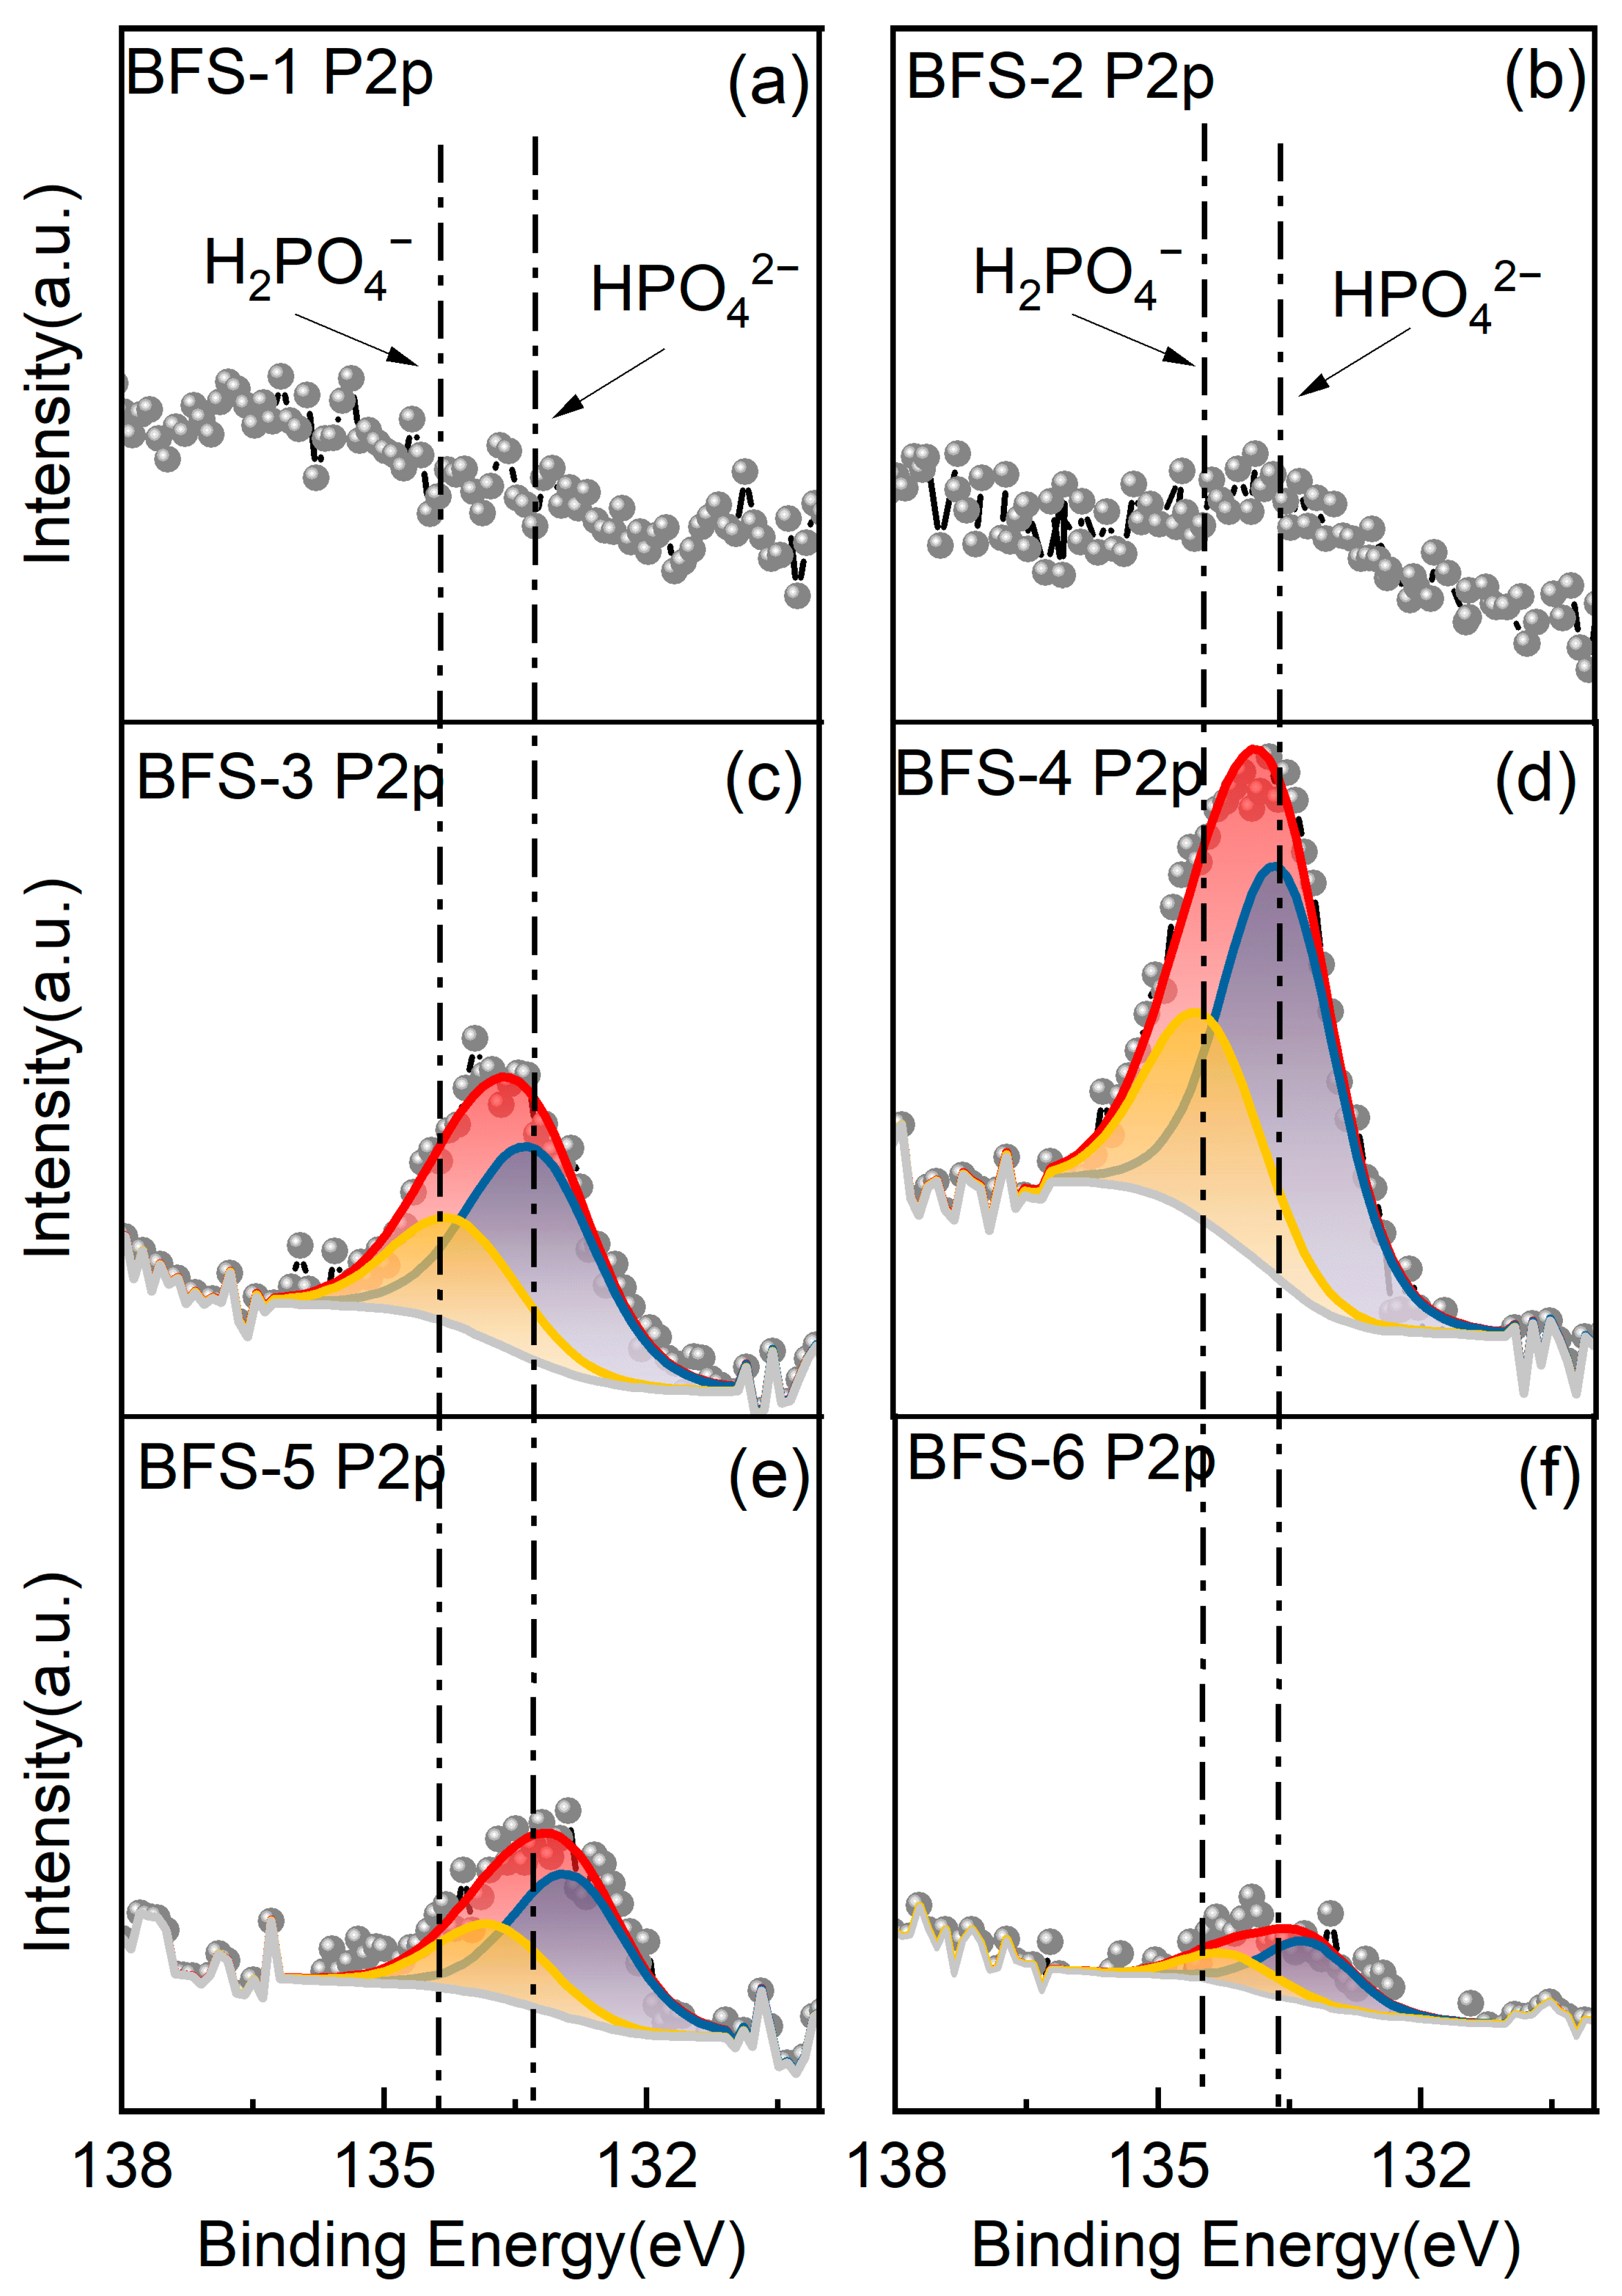
XPS P(2p) narrow spectrum scans of BFS before and after P adsorption are shown in Figure 5, and the binding energy and atomic composition are shown in Table S2. Although there were about 1.0% P elements in the surface of BFS before adsorption, there were no obvious P(2p) peaks in the XPS test (Figure 5a, b), which might be due to the difference in the detecting principles of these two methods. The P(2p) peak was detected in the samples after P adsorption and even elution. However, compared with that of magnetic BFS, the P adsorbed on non-magnetic BFS was slightly higher, which might be due to the difference in surface structure of these two materials.
Peaks with binding energy about 133.3~133.6 eV were much higher than those with binding energy, about 133.8~134.45 eV, indicating that phosphate in the surface was mainly in form of HPO42− rather than H2PO4−. In general, phosphate in the solution might change from PO43− to HPO42−, H2PO4−, and H3PO4 along with the decrease of pH (Figure S2). The synthetic solution was prepared with the equimolar KHPO4 and KH2PO4, which might exist as the equimolar HPO42− and H2PO4− under neutral conditions. Therefore, the excessive HPO42− adsorbed in the surface of BFS might be attributed to the properties of binding sites, mainly for the hydroxylated alkaline metal sites such as Al3+, Fe2+, and Fe3+, whereas the neutral sites such as iron-manganese oxide might be responsible for the adsorption of H2PO4− [38]. This was confirmed with the XPS determination of BFS eluted with sulfate acid (Figure 5e,f), as H2PO4−and HPO42− coordinating with hydroxyl oxides in the surface of BFS might be eluted more easily by sulfate acid than those binding with the non-hydroxylated metal sites, such as iron-manganese oxides.
In view of the P recovery, since more phosphate might be adsorbed in the surface of non-magnetic BFS than that of magnetic BFS, and the phosphate adsorbed in the surface of non-magnetic BFS could be eluted more easily with sulfate acid than that in the surface of magnetic BFS, non-magnetic BFS might be more suitable as the adsorbent in the packing column for P recovery. According to the changes of P in the surface of BFS, P recovered from the adsorption column filled with non-magnetic BFS might be twice that of the magnetic BFS within one cycle, and thus, the adsorption–regeneration cycle could be prolonged greatly, and the consumption of sulfate acid could be reduced.
3.4. Optimization of Column Adsorption
In order to optimize the operation conditions for P recovery, column experiments were carried out considering the initial concentration of P, pH, and HRT.
3.4.1. Effects of Initial P Concentration on P Adsorption
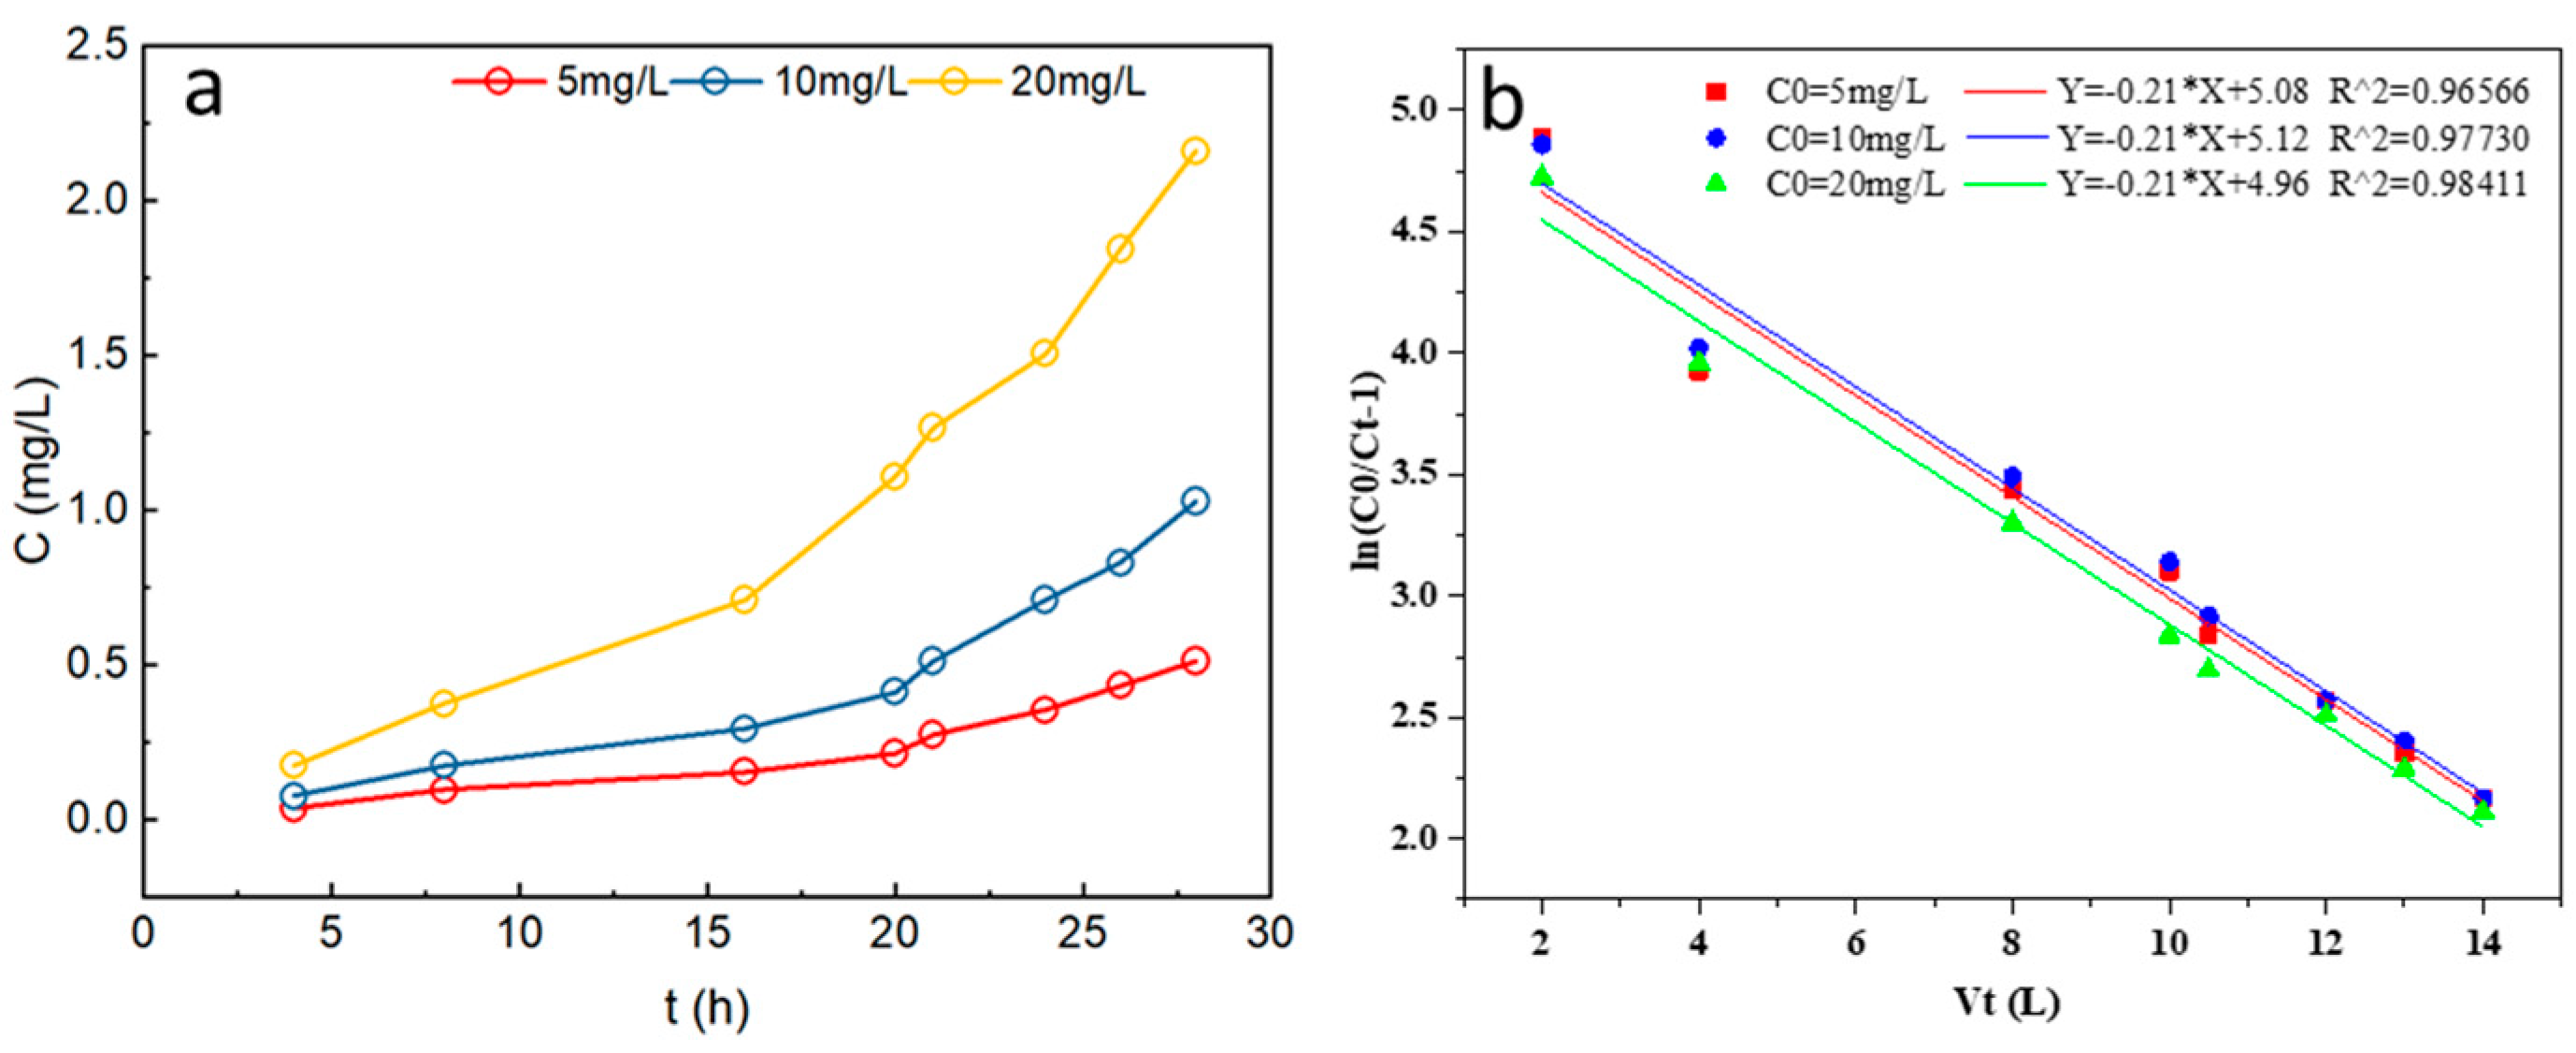
According to the static adsorption experiments, the residual phosphate concentration in the supernatant might be increased along with the increase of initial phosphate concentration, which was determined by the properties of adsorbents. For column experiments, the residual concentration of P in the effluent should meet the limits of the discharge standard (Ct = 0.5 mg L−1, GB18918-2002 IA); thus, the adsorption–regeneration cycle should be shortened along with the increase of initial P concentration. When the influent concentration was set as 5, 10, and 20 mg L−1, the column experiments were stopped and regenerated at 30 h, 21 h, and 12 h, respectively (Figure 6). Since most of the P concentration in the rural sewage was below 5 mg L−1, the adsorption period for P recovery should be restricted within 30 h, corresponding to 15 L sewage or 25 times the volume of the adsorption column. In addition, the adsorbents were eluted with 5 mM sulfate acid at the flow rate of 0.5 L h−1 until the concentration of P in effluent was less than 0.5 mg L−1. Therefore, P in sewage could be concentrated and recovered efficiently within the cyclic adsorption and elution and reused for crops on-site.
The Thomas model fitting the results of the dynamic adsorption of BFS is shown in Table S3, which reveals that the Thomas rate constant KTh decreased gradually along with the increase of influent P concentration, from 0.5011 L·mg−1·d−1 to 0.1249 L·mg−1·d−1. At the same time, the equilibrium adsorption capacity q0 of the adsorption column gradually increased. This indicated that the adsorption process was dominated by mass transfer, and the concentration diffusion was the main driving force for the adsorption reaction. This was consistent with the static adsorption (Figure 1), which was higher in the influent concentration with greater concentration diffusion, thus improving the equilibrium adsorption capacity with a shorter adsorption cycle.
3.4.2. Effects of pH on P Adsorption
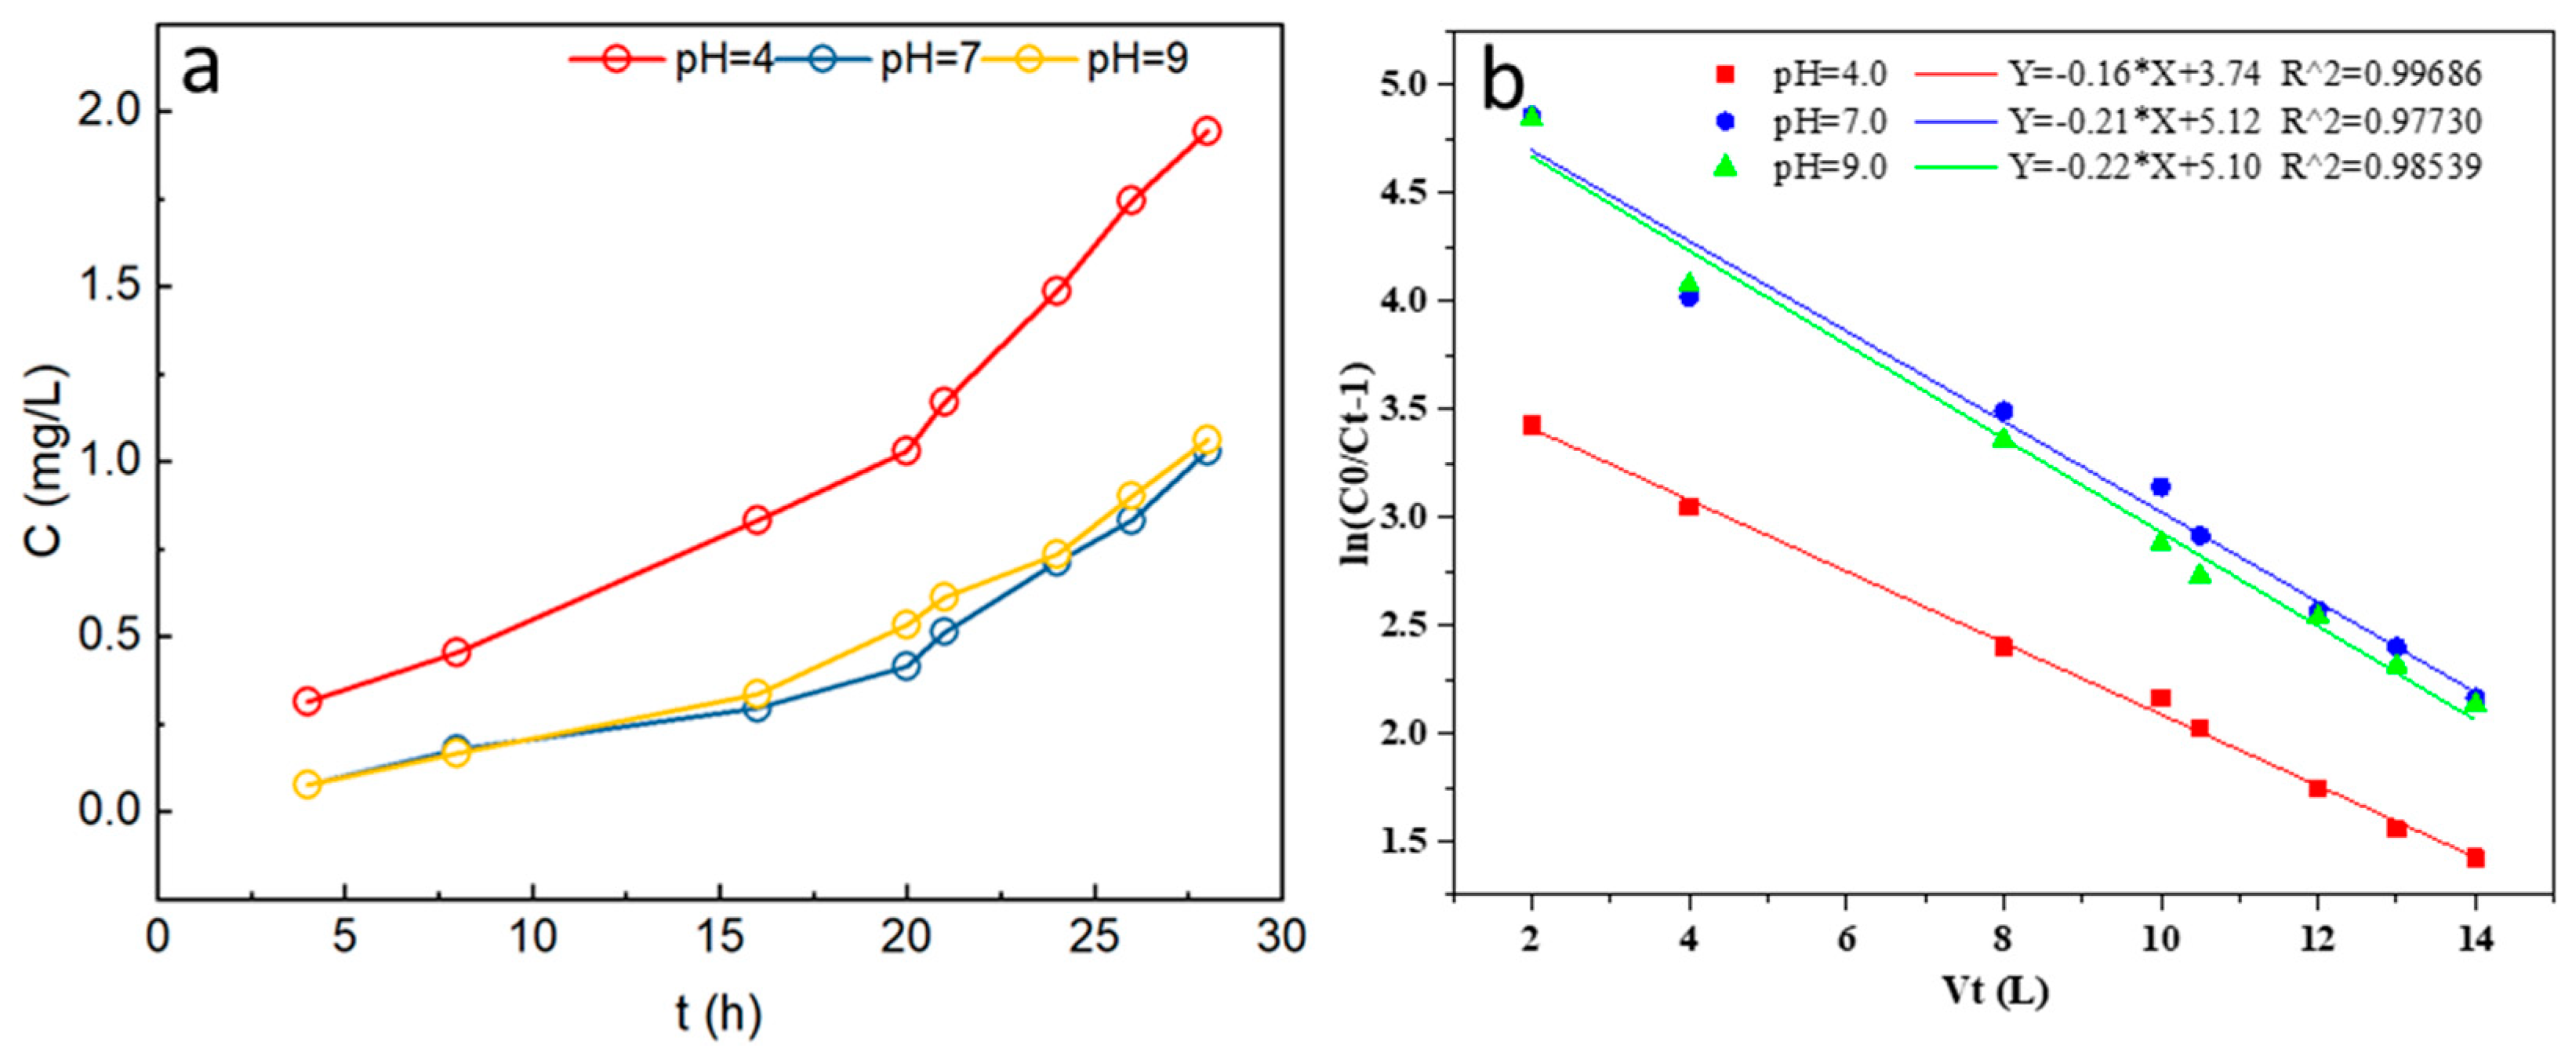
According to the analysis of XPS, P might be adsorbed on hydroxyl metal oxides in the surface of BFS mainly via ion exchange. Since H+ in an acidic solution might compete as hydroxyl with the phosphate, it might be adverse for phosphate adsorption. According to the profiles of adsorption experiments with different initial pH (pH = 4.0, 7.0, 9.0) (Figure 7), it could be seen that experiments with neutral and alkaline inlets were penetrated much later than those with an acidic inlet, indicating that phosphates were removed more efficiently in these two conditions. Therefore, these experiments verified indirectly that phosphate adsorption on BFS mainly takes place via the ion exchange and is favored with the neutral or alkaline conditions. Moreover, the fit results of the Thomas model showed that the Thomas rate constant KTh and the equilibrium adsorption capacity q0 of the adsorption column with neutral and alkaline influent were higher than those with acidic influent (Table S4), indicating that neutral and alkaline influent were more suitable to P adsorption than the acidic influent.
In fact, the pH of the solution affected not only the ionization state of the functional groups in the surface of adsorbent but also the ionic form of P in the solution [39]. According to the hydrolysis of phosphate in aqueous solutions, orthophosphate might be present in different forms at different pH conditions (Figure S2). When pH < 2.1, the orthophosphate in the solution was mainly in form of H3PO4 and then in form of H2PO4− at 2.1 < pH < 7.2, HPO42− at 7.2 < pH < 12.3, and PO43− at 12.3 < pH < 14. For P adsorption in the surface of BFS via ion exchange of hydroxyl, neutral or alkaline conditions might be favored, whereas acidic conditions might favor desorption of phosphate.
3.4.3. Effects of HRT on P Adsorption
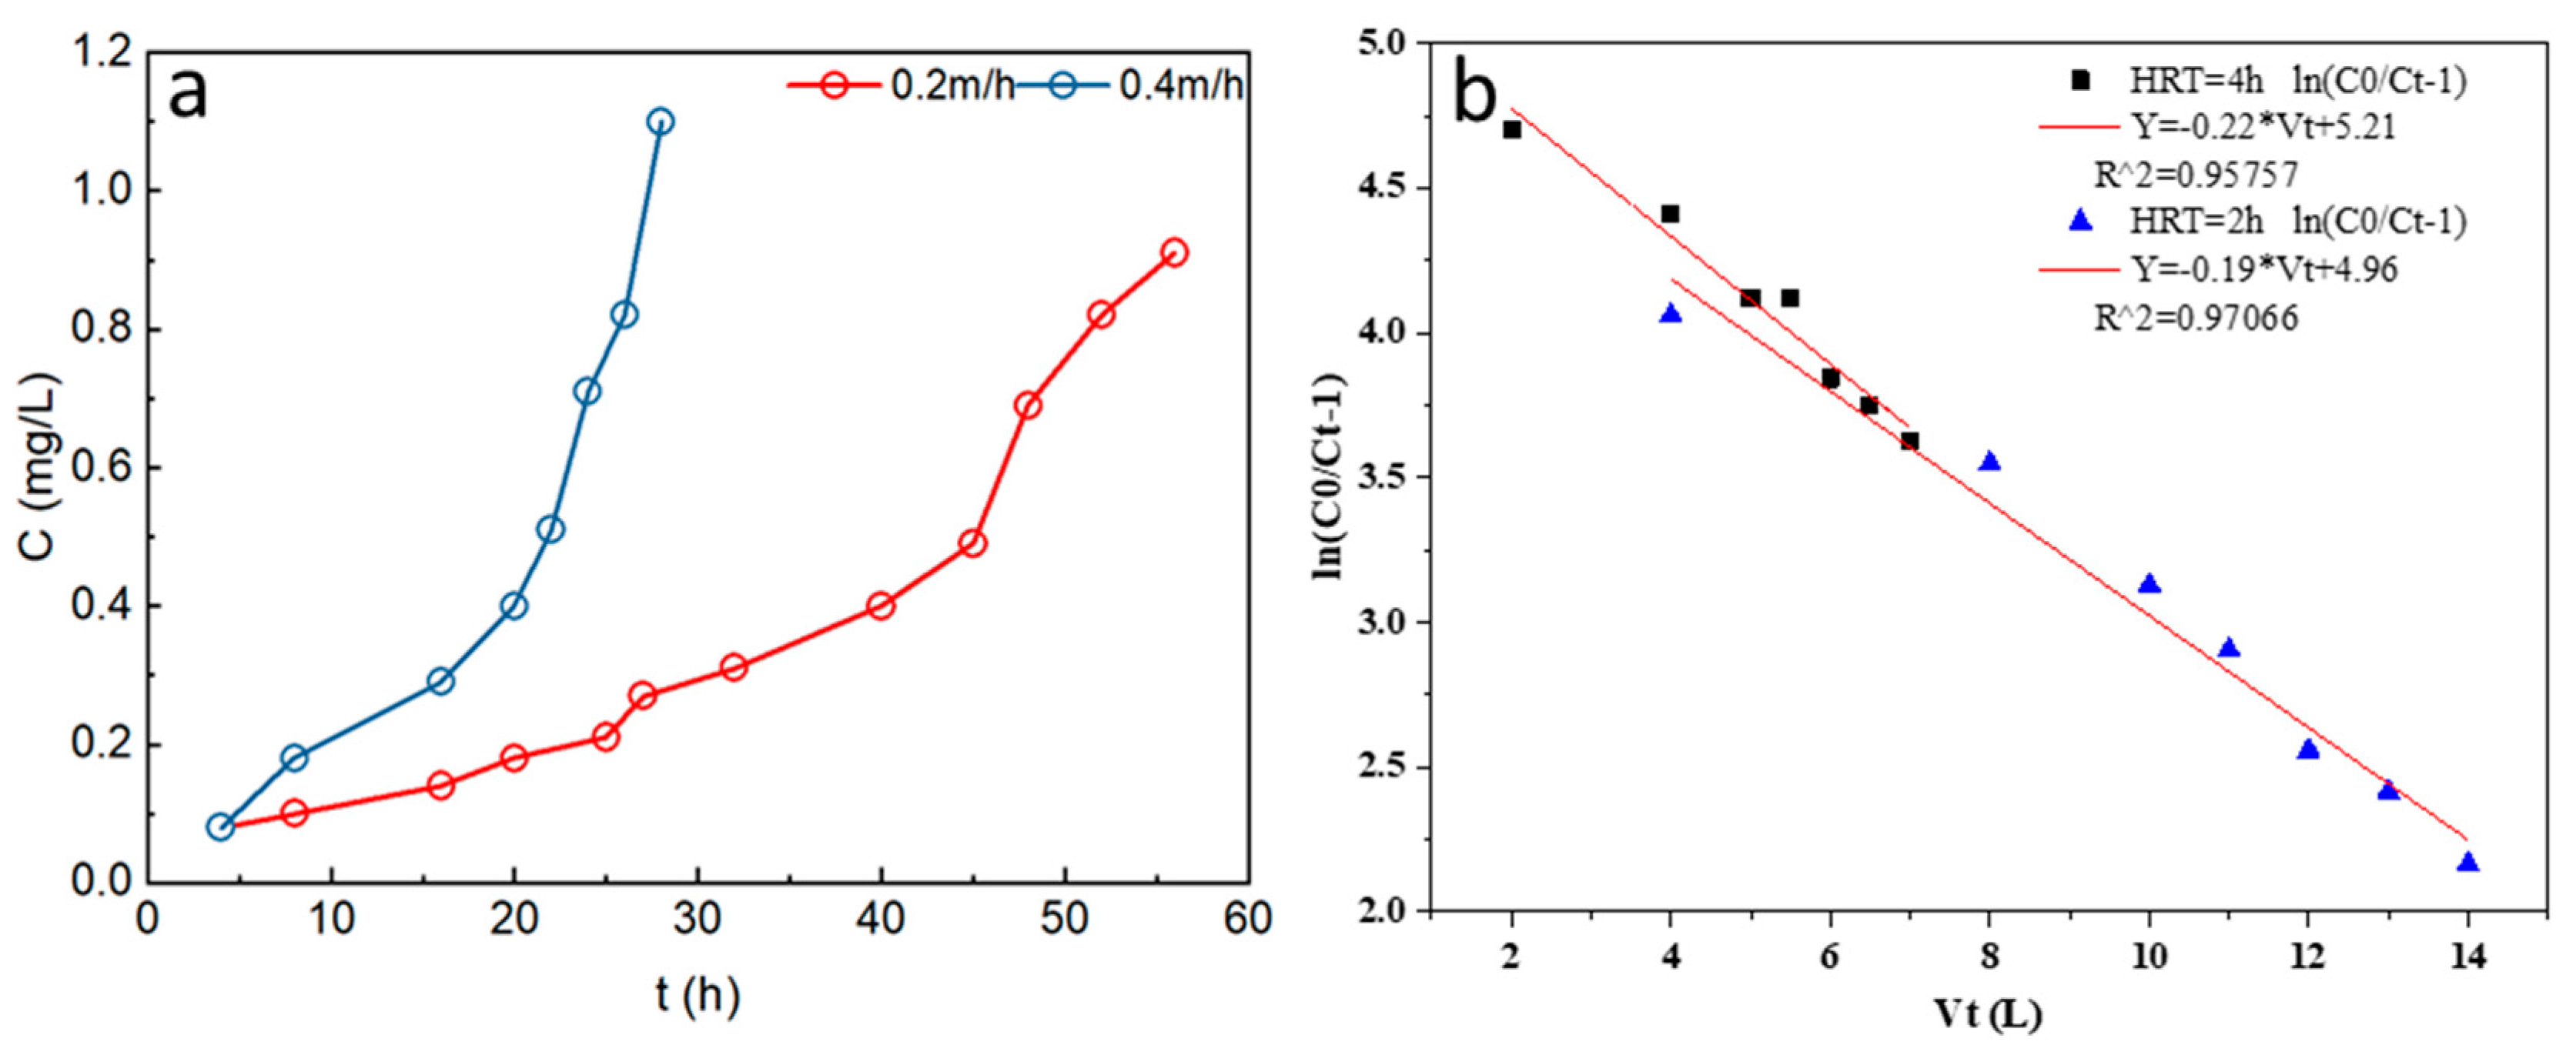
In addition to the properties of adsorbents and adsorbates, adsorption kinetics also had important impacts on the practical applications, especially for the contact time of adsorbents and adsorbates, that is, hydraulic retention time (HRT). In this study, solution with P concentration of 10.0 mg L−1 was pumped into BFS filter columns with the current of 0.25 L h−1 and 0.5 L h−1, resulting in HRT of about 4 h and 2 h, respectively. It showed that the P concentrations in effluent exceeded the standard limits (Ct = 0.5 mg L−1) at 42 h and 21 h (Figure 8), both of which corresponded with the filtering volume of 10.5 L and 20 times the volume of the adsorbent. According to the above analysis (Figure 2 and Figure 3), P adsorption in the surface of BFS was mainly via coordination with surface active sites at the beginning and subsequently chemical deposition after the establishment of adsorption equilibrium. In order to improve the P retention capability of BFS, the HRT of the practical column should be extended greatly, and thus, the regeneration cycle could be prolonged, and the P could be concentrated and recovered economically.
The Thomas rate constant KTh decreased significantly, and the equilibrium adsorption capacity q0 of the adsorption column decreased slightly along with the increase of HRT (Table S5). This indicated that the time for BFS to reach saturation, or the regeneration cycle of BFS, might be shortened along with the increase of HRT, which is an important guide for practical applications.
According to the above results, P might be retained initially in the surface of BFS via coordination with the active metal sites in the surface of BFS, which is chemisorption. Then, P might be further deposited with other metal ions in the surface of BFS along with the time extension. Phosphate retained in the surface of BFS mainly existed in the form of HPO42−. Therefore, P recovery via the adsorption of BFS might be facilitated with a high initial P concentration and pH value as well as a long HRT, which is consistent with the previous work [1]. However, the phosphate adsorbed in the surface of non-magnetic BFS was much greater than that in magnetic BFS and was easier to be eluted, indicating that P recovery efficiency with non-magnetic BFS was better than that of magnetic BFS. In rural sewage, most of the P concentration was lower than 5 mg L−1, and pH was slightly acidic; thus, non-magnetic BFS with a large specific surface area should be mixed with some alkaline medium to improve the pH condition of the filter bed, and the retention time should be extended to improve the adsorption capability and recovery efficiency of P in the field process.
4. Conclusions
The batch adsorption experiments of BFS showed that P adsorption on BFS could be fitted well with the Langmuir adsorption isothermal model and the quasi-secondary kinetic model, which suggests that chemisorption was dominant in this experiment. According to the extended experiments, besides the chemisorption of P adsorption on BFS, chemical deposition might take place in the surface of BFS, which promotes the retention of P on BFS. The characteristics of BFS determined with SEM-EDS revealed that P adsorbed in the surface of BFS was distributed uniformly, and some needle-like crystal clusters were produced after P adsorption, which is consistent with the results of extended batch experiments. XPS revealed that phosphate mainly existed as HPO42− on the surface of BFS, especially for those non-magnetic particles with relative low Fe content and high Al content, indicating its preference for the hydroxyl basic sites. In addition, more P was retained on non-magnetic BFS, and the P adsorbed on non-magnetic BFS could be eluted more easily than that on magnetic BFS, which demonstrates the potential of non-magnetic BFS for P recovery. Based on the column experiments, P recovery with non-magnetic BFS might be simulated by the Thomas model, which was facilitated with the high initial P concentration and pH as well as long HRT.
Supplementary Materials
The following supporting information can be downloaded at: https://www.mdpi.com/article/10.3390/w14162452/s1, Table S1: XRF determination revealed the surface chemical composites of BFS with size of 1.0–2.0 mm; Table S2: Binding energy and atomic composition of P in the surface of BFS; Table S3: Results of the Thomas model at different influent P concentration; Table S4: Results of the Thomas model at different influent pH; Table S5: Results of the Thomas model at different HRT; Figure S1: SEM-EDS detection of non-magnetic BFS1 after phosphorus adsorption; Figure S2: The fluorescent components of urban sewage identified with PARAFAC analysis.
Author Contributions
Conceptualization, Z.W. and X.W.; methodology, Z.W.; validation, R.Z., J.L., and N.Z.; formal analysis, Z.W. and X.W.; investigation, X.W.; resources, Z.W. and L.L.; data curation, R.Z.; writing—original draft preparation, X.W.; writing—review and editing, Z.W. and L.L.; visualization, J.L.; supervision, Z.W.; project administration, Z.W.; funding acquisition, Z.W. All authors have read and agreed to the published version of the manuscript.
Funding
This work was sponsored by Major Science and Technology Program for Water Pollution Control and Treatment in China (No. 2017ZX07206004).
Institutional Review Board Statement
Not applicable.
Informed Consent Statement
Not applicable.
Data Availability Statement
The data are available in the case that they are required.
Acknowledgments
The authors are sincerely thankful for the funding support.
Conflicts of Interest
The authors declare no conflict of interest.
Abbreviations
P, phosphorus; BFS, blast furnace slag; SEM-EDS, scanning electron microscope and energy dispersive spectroscopy; XPS, X-ray photoelectron spectroscopy; HRT, hydraulic retention time; CW, constructed wetlands; XRF, X-ray fluorescence.
References
- Bacelo, H.; Pintor, A.M.; Santos, S.C.; Boaventura, R.A.; Botelho, C.M. Performance and prospects of different adsorbents for phosphorus uptake and recovery from water. Chem. Eng. J. 2020, 381, 122566. [Google Scholar] [CrossRef]
- Cordell, D.; Rosemarin, A.; Schröder, J.; Smit, A. Towards global phosphorus security: A systems framework for phosphorus recovery and reuse options. Chemosphere 2011, 84, 747–758. [Google Scholar] [CrossRef] [PubMed]
- Wang, Z. Selection of chemical phosphorus removal scheme based on Analytic Hierarchy Process. E3S Web Conf. 2021, 245, 03073. [Google Scholar] [CrossRef]
- Yang, F.; Zhang, C.; Rong, H.; Cao, Y. Research progress and application prospect of anaerobic biological phosphorus removal. Appl. Microbiol. Biotechnol. 2019, 103, 2133–2139. [Google Scholar] [CrossRef]
- Özacar, M. Adsorption of phosphate from aqueous solution onto alunite. Chemosphere 2003, 51, 321–327. [Google Scholar] [CrossRef]
- Li, B.; Huang, H.M.; Boiarkina, I.; Yu, W.; Huang, Y.F.; Wang, G.Q.; Young, B.R. Phosphorus recovery through struvite crystallisation: Recent developments in the understanding of operational factors. J. Environ. Manag. 2019, 248, 109254. [Google Scholar] [CrossRef]
- Kim, D.; Yoo, I.; Park, B.; Lee, Y.; Kim, S.; Chang, D.; Sunwoo, Y.; Shin, H.; Eo, Y.; Hong, K. Alternative technique for removal of phosphorus in wastewater using chemically surface-modified silica filter. J. Ind. Eng. Chem. 2012, 18, 1560–1563. [Google Scholar] [CrossRef]
- Kumar, P.S.; Korving, L.; van Loosdrecht, M.C.; Witkamp, G.-J. Adsorption as a technology to achieve ultra-low concentrations of phosphate: Research gaps and economic analysis. Water Res. X 2019, 4, 100029. [Google Scholar] [CrossRef]
- Yi, X.; Lin, D.; Li, J.; Zeng, J.; Wang, D.; Yang, F. Ecological treatment technology for agricultural non-point source pollution in remote rural areas of China. Environ. Sci. Pollut. Res. 2021, 28, 40075–40087. [Google Scholar] [CrossRef]
- Vymazal, J. Removal of nutrients in various types of constructed wetlands. Sci. Total Environ. 2007, 380, 48–65. [Google Scholar] [CrossRef]
- Flower, H.; Rains, M.; Taşcı, Y.; Zhang, J.-Z.; Trout, K.; Lewis, D.; Das, A.; Dalton, R. Why is calcite a strong phosphorus sink in freshwater? Investigating the adsorption mechanism using batch experiments and surface complexation modeling. Chemosphere 2022, 286, 131596. [Google Scholar] [CrossRef] [PubMed]
- Cui, L.; Zhu, X.; Ma, M.; Ouyang, Y.; Dong, M.; Zhu, W.; Luo, S. Phosphorus Sorption Capacities and Physicochemical Properties of Nine Substrate Materials for Constructed Wetland. Arch. Environ. Contam. Toxicol. 2008, 55, 210–217. [Google Scholar] [CrossRef] [PubMed]
- Loganathan, P.; Vigneswaran, S.; Kandasamy, J.; Bolan, N.S. Removal and Recovery of Phosphate from Water Using Sorption. Crit. Rev. Environ. Sci. Technol. 2014, 44, 847–907. [Google Scholar] [CrossRef]
- Babatunde, A.; Zhao, Y. Equilibrium and kinetic analysis of phosphorus adsorption from aqueous solution using waste alum sludge. J. Hazard. Mater. 2010, 184, 746–752. [Google Scholar] [CrossRef] [PubMed] [Green Version]
- Yang, Y.; Zhao, Y.Q.; Wang, S.P.; Guo, X.C.; Ren, Y.X.; Wang, L.; Wang, X. A promising approach of reject water treatment using a tidal flow constructed wetland system employing alum sludge as main substrate. Water Sci. Technol. 2011, 63, 2367–2373. [Google Scholar] [CrossRef]
- Johansson, L. Blast furnace slag as phosphorus sorbents—column studies. Sci. Total Environ. 1999, 229, 89–97. [Google Scholar] [CrossRef]
- Wang, S.; Peng, Y. Natural zeolites as effective adsorbents in water and wastewater treatment. Chem. Eng. J. 2010, 156, 11–24. [Google Scholar] [CrossRef]
- Pandey, S. A comprehensive review on recent developments in bentonite-based materials used as adsorbents for wastewater treatment. J. Mol. Liq. 2017, 241, 1091–1113. [Google Scholar] [CrossRef]
- Xu, K.; Deng, T.; Liu, J.; Peng, W. Study on the phosphate removal from aqueous solution using modified fly ash. Fuel 2010, 89, 3668–3674. [Google Scholar] [CrossRef]
- Blanco, I.; Molle, P.; de Miera, L.E.S.; Ansola, G. Basic Oxygen Furnace steel slag aggregates for phosphorus treatment. Evaluation of its potential use as a substrate in constructed wetlands. Water Res. 2016, 89, 355–365. [Google Scholar] [CrossRef]
- Xue, Y.; Hou, H.; Zhu, S. Characteristics and mechanisms of phosphate adsorption onto basic oxygen furnace slag. J. Hazard. Mater. 2009, 162, 973–980. [Google Scholar] [CrossRef]
- Bhatnagar, A.; Vilar, V.J.; Botelho, C.M.; Boaventura, R.A. A review of the use of red mud as adsorbent for the removal of toxic pollutants from water and wastewater. Environ. Technol. 2011, 32, 231–249. [Google Scholar] [CrossRef] [PubMed] [Green Version]
- Haynes, R.J. Use of Industrial Wastes as Media in Constructed Wetlands and Filter Beds—Prospects for Removal of Phosphate and Metals from Wastewater Streams. Crit. Rev. Environ. Sci. Technol. 2015, 45, 1041–1103. [Google Scholar] [CrossRef]
- Gong, G.; Ye, S.; Tian, Y.; Wang, Q.; Ni, J.; Chen, Y. Preparation of a new sorbent with hydrated lime and blast furnace slag for phosphorus removal from aqueous solution. J. Hazard. Mater. 2009, 166, 714–719. [Google Scholar] [CrossRef]
- Hongwei, C.; Lin, L.; Jie, Z.; Xiangxun, P.; Dewu, Z. Characteristics of adsorption of arsenic by red soil from sandstone weathering. In Proceedings of the 2011 International Conference on Remote Sensing, Environment and Transportation Engineering, Nanjing, China, 24–26 June 2011; pp. 3910–3912. [Google Scholar]
- Kannan, N.; Sundaram, M.M. Kinetics and mechanism of removal of methylene blue by adsorption on various carbons—a comparative study. Dye. Pigment. 2001, 51, 25–40. [Google Scholar] [CrossRef]
- Seidmohammadi, A.; Asgari, G.; Dargahi, A.; Leili, M.; Vaziri, Y.; Hayati, B.; Shekarchi, A.; Mobarakian, A.; Bagheri, A.; Khanghah, S.B.N.; et al. A Comparative Study for the Removal of Methylene Blue Dye from Aqueous Solution by Novel Activated Carbon Based Adsorbents. Prog. Color Colorants Coat. 2019, 12, 133–144. [Google Scholar] [CrossRef]
- Ma, L.; Huang, L.; Xu, Y.; Liu, C.; Wang, F.; Xing, H.; Ma, S. Dynamics and Model Research on the Electrosorption by Activated Carbon Fiber Electrodes. Water 2021, 13, 62. [Google Scholar] [CrossRef]
- Jafari, S.; Zhao, F.; Zhao, D.; Lahtinen, M.; Bhatnagar, A.; Sillanpää, M. A comparative study for the removal of methylene blue dye by N and S modified TiO2 adsorbents. J. Mol. Liq. 2015, 207, 90–98. [Google Scholar] [CrossRef]
- Dargahi, A.; Samarghandi, M.R.; Shabanloo, A.; Mahmoudi, M.M.; Nasab, H.Z. Statistical modeling of phenolic compounds adsorption onto low-cost adsorbent prepared from aloe vera leaves wastes using CCD-RSM optimization: Effect of parameters, isotherm, and kinetic studies. Biomass- Convers. Biorefinery 2021, 1–15. [Google Scholar] [CrossRef]
- Zhao, B.; Shang, Y.; Xiao, W.; Dou, C.; Han, R. Adsorption of Congo red from solution using cationic surfactant modified wheat straw in column model. J. Environ. Chem. Eng. 2014, 2, 40–45. [Google Scholar] [CrossRef]
- Nuić, I.; Trgo, M.; Perić, J.; Medvidović, N.V. Analysis of breakthrough curves of Pb and Zn sorption from binary solutions on natural clinoptilolite. Microporous Mesoporous Mater. 2013, 167, 55–61. [Google Scholar] [CrossRef]
- Kostura, B.; Huczala, R.; Leško, J.; Ritz, M. Retention of phosphates from aqueous solutions with in sol–gel-derived amorphous CaO–MgO–Al2O3–SiO2 system as a model of blast furnace slag. Chem. Pap. 2018, 72, 401–408. [Google Scholar] [CrossRef]
- Kostura, B.; Kulveitová, H.; Leško, J. Blast furnace slags as sorbents of phosphate from water solutions. Water Res. 2005, 39, 1795–1802. [Google Scholar] [CrossRef]
- Vu, M.T.; Nguyen, L.N.; Johir, A.H.; Ngo, H.H.; Skidmore, C.; Fontana, A.; Galway, B.; Bustamante, H.; Nghiem, L.D. Phosphorus removal from aqueous solution by steel making slag—Mechanisms and performance optimisation. J. Clean. Prod. 2021, 284, 124753. [Google Scholar] [CrossRef]
- Bowden, L.I.; Jarvis, A.P.; Younger, P.; Johnson, K.L. Phosphorus Removal from Waste Waters Using Basic Oxygen Steel Slag. Environ. Sci. Technol. 2009, 43, 2476–2481. [Google Scholar] [CrossRef] [PubMed]
- Koilraj, P.; Kannan, S. Phosphate uptake behavior of ZnAlZr ternary layered double hydroxides through surface precipitation. J. Colloid Interface Sci. 2010, 341, 289–297. [Google Scholar] [CrossRef]
- Bhatnagar, A.; Sillanpää, M. Utilization of agro-industrial and municipal waste materials as potential adsorbents for water treatment—A review. Chem. Eng. J. 2010, 157, 277–296. [Google Scholar] [CrossRef]
- Delaney, P.; McManamon, C.; Hanrahan, J.P.; Copley, M.; Holmes, J.; Morris, M.A. Development of chemically engineered porous metal oxides for phosphate removal. J. Hazard. Mater. 2011, 185, 382–391. [Google Scholar] [CrossRef]
Figure 1.
Static phosphate adsorption experiments of BFS. Shift of P equilibrium adsorption amount with the different initial concentrations of P. (a) BFS1 and (c) BFS2 and the corresponding adsorption isotherms fitted with Langmuir and Freundlich models. (b) BFS1; (d) BFS2.
Figure 1.
Static phosphate adsorption experiments of BFS. Shift of P equilibrium adsorption amount with the different initial concentrations of P. (a) BFS1 and (c) BFS2 and the corresponding adsorption isotherms fitted with Langmuir and Freundlich models. (b) BFS1; (d) BFS2.

Figure 2.
Batch adsorption experiments of P with extended time: (a) changes of equilibrium adsorption capacity and (b) shift of P concentration in supernatant.
Figure 2.
Batch adsorption experiments of P with extended time: (a) changes of equilibrium adsorption capacity and (b) shift of P concentration in supernatant.

Figure 3.
Surface morphology of BFS1 samples detected with SEM: (a) before P adsorption; (b) after P adsorption.
Figure 3.
Surface morphology of BFS1 samples detected with SEM: (a) before P adsorption; (b) after P adsorption.

Figure 4.
Element compositions in the surface of BFS1 samples detected with EDS: (a) before P adsorption; (b) after P adsorption.
Figure 4.
Element compositions in the surface of BFS1 samples detected with EDS: (a) before P adsorption; (b) after P adsorption.

Figure 5.
XPS P(2p) narrow-spectrum scan of BFS1 samples. (a) Magnetic BFS1 before P adsorption; (b) non-magnetic BFS1 before P adsorption; (c) magnetic BFS1 after P adsorption; (d) non-magnetic BFS1 after P adsorption; (e) magnetic BFS1 after regeneration; (f) non-magnetic BFS1 after regeneration.
Figure 5.
XPS P(2p) narrow-spectrum scan of BFS1 samples. (a) Magnetic BFS1 before P adsorption; (b) non-magnetic BFS1 before P adsorption; (c) magnetic BFS1 after P adsorption; (d) non-magnetic BFS1 after P adsorption; (e) magnetic BFS1 after regeneration; (f) non-magnetic BFS1 after regeneration.

Figure 6.
Column experiments with different initial P concentration. (a) Shift of P concentration in effluent; (b) fitting curves of Thomas model.
Figure 6.
Column experiments with different initial P concentration. (a) Shift of P concentration in effluent; (b) fitting curves of Thomas model.

Figure 7.
Column experiments with different initial pH. (a) Shift of P concentration in effluent; (b) fitting curves of the Thomas model.
Figure 7.
Column experiments with different initial pH. (a) Shift of P concentration in effluent; (b) fitting curves of the Thomas model.

Figure 8.
Column experiments with different HRT. (a) Shift of P concentration in effluent; (b) fitting curves of the Thomas model.
Figure 8.
Column experiments with different HRT. (a) Shift of P concentration in effluent; (b) fitting curves of the Thomas model.


Table 1.
Adsorption isotherm model parameters of BFS *.
| Sample | Langmuir | Freundlich | ||||
|---|---|---|---|---|---|---|
| q0 (mg g−1) | B (L mg−1) | R2 | n | k | R2 | |
| BFS1 | 0.3058 | 0.0766 | 0.9937 | 1.8151 | 0.0338 | 0.9738 |
| BFS2 | 0.1275 | 0.1050 | 0.9986 | 2.1307 | 0.0199 | 0.9731 |
Note: * The mass of BFS was 10 g, emerged in 200 mL of phosphate solution with different P concentration, and the initial pH of the solution was 7.0.
Table 2.
Adsorption kinetic parameters of BFS.
| Sample | Quasi-First-Order Dynamics Model | Quasi-Second Order Dynamics Model | ||||
|---|---|---|---|---|---|---|
| qe (mg g−1) | k1 (min−1) | R2 | qe (mg g−1) | k2 (g·mg−1 ·min−1) | R2 | |
| BFS1 | 0.2311 | −0.6367 | 0.9080 | 0.3015 | 0.6206 | 0.9965 |
| BFS2 | 0.1068 | −0.5658 | 0.9785 | 0.1217 | 2.5766 | 0.9986 |
Note: The mass of BFS was 10 g, emerged in 200 mL of phosphate solution with P concentration of 20 mg L−1, and the initial pH of the solution was 7.0.
Table 3.
Main elements and content in the surface of BFS (atom %).
| Element | Al | Si | P | Mn | Fe |
|---|---|---|---|---|---|
| BFS1—Before | 11.03 | 48.3 | 1.17 | 36.01 | 3.49 |
| BFS1—After | 14.72 | 35.90 | 1.40 | 39.88 | 7.19 |
Note: Detected BFS1 before and after the P adsorption with P concentration of 80 mg L−1.
Publisher’s Note: MDPI stays neutral with regard to jurisdictional claims in published maps and institutional affiliations. |
© 2022 by the authors. Licensee MDPI, Basel, Switzerland. This article is an open access article distributed under the terms and conditions of the Creative Commons Attribution (CC BY) license (https://creativecommons.org/licenses/by/4.0/).
Share and Cite
MDPI and ACS Style
Wu, X.; Zhan, R.; Liu, L.; Lan, J.; Zhao, N.; Wang, Z. Phosphorus Adsorption on Blast Furnace Slag with Different Magnetism and Its Potential for Phosphorus Recovery. Water 2022, 14, 2452. https://doi.org/10.3390/w14162452
AMA Style
Wu X, Zhan R, Liu L, Lan J, Zhao N, Wang Z. Phosphorus Adsorption on Blast Furnace Slag with Different Magnetism and Its Potential for Phosphorus Recovery. Water. 2022; 14(16):2452. https://doi.org/10.3390/w14162452
Chicago/Turabian StyleWu, Xiaoxin, Rui Zhan, Lili Liu, Jinjing Lan, Ning Zhao, and Zhiping Wang. 2022. "Phosphorus Adsorption on Blast Furnace Slag with Different Magnetism and Its Potential for Phosphorus Recovery" Water 14, no. 16: 2452. https://doi.org/10.3390/w14162452
Note that from the first issue of 2016, this journal uses article numbers instead of page numbers. See further details here.