
Sanitary Sewerage Master Plan for the Sustainable Use of Wastewater on a University Campus

 , , ,
, , ,  ,
,
Abstract
:1. Introduction
2. Materials and Methods
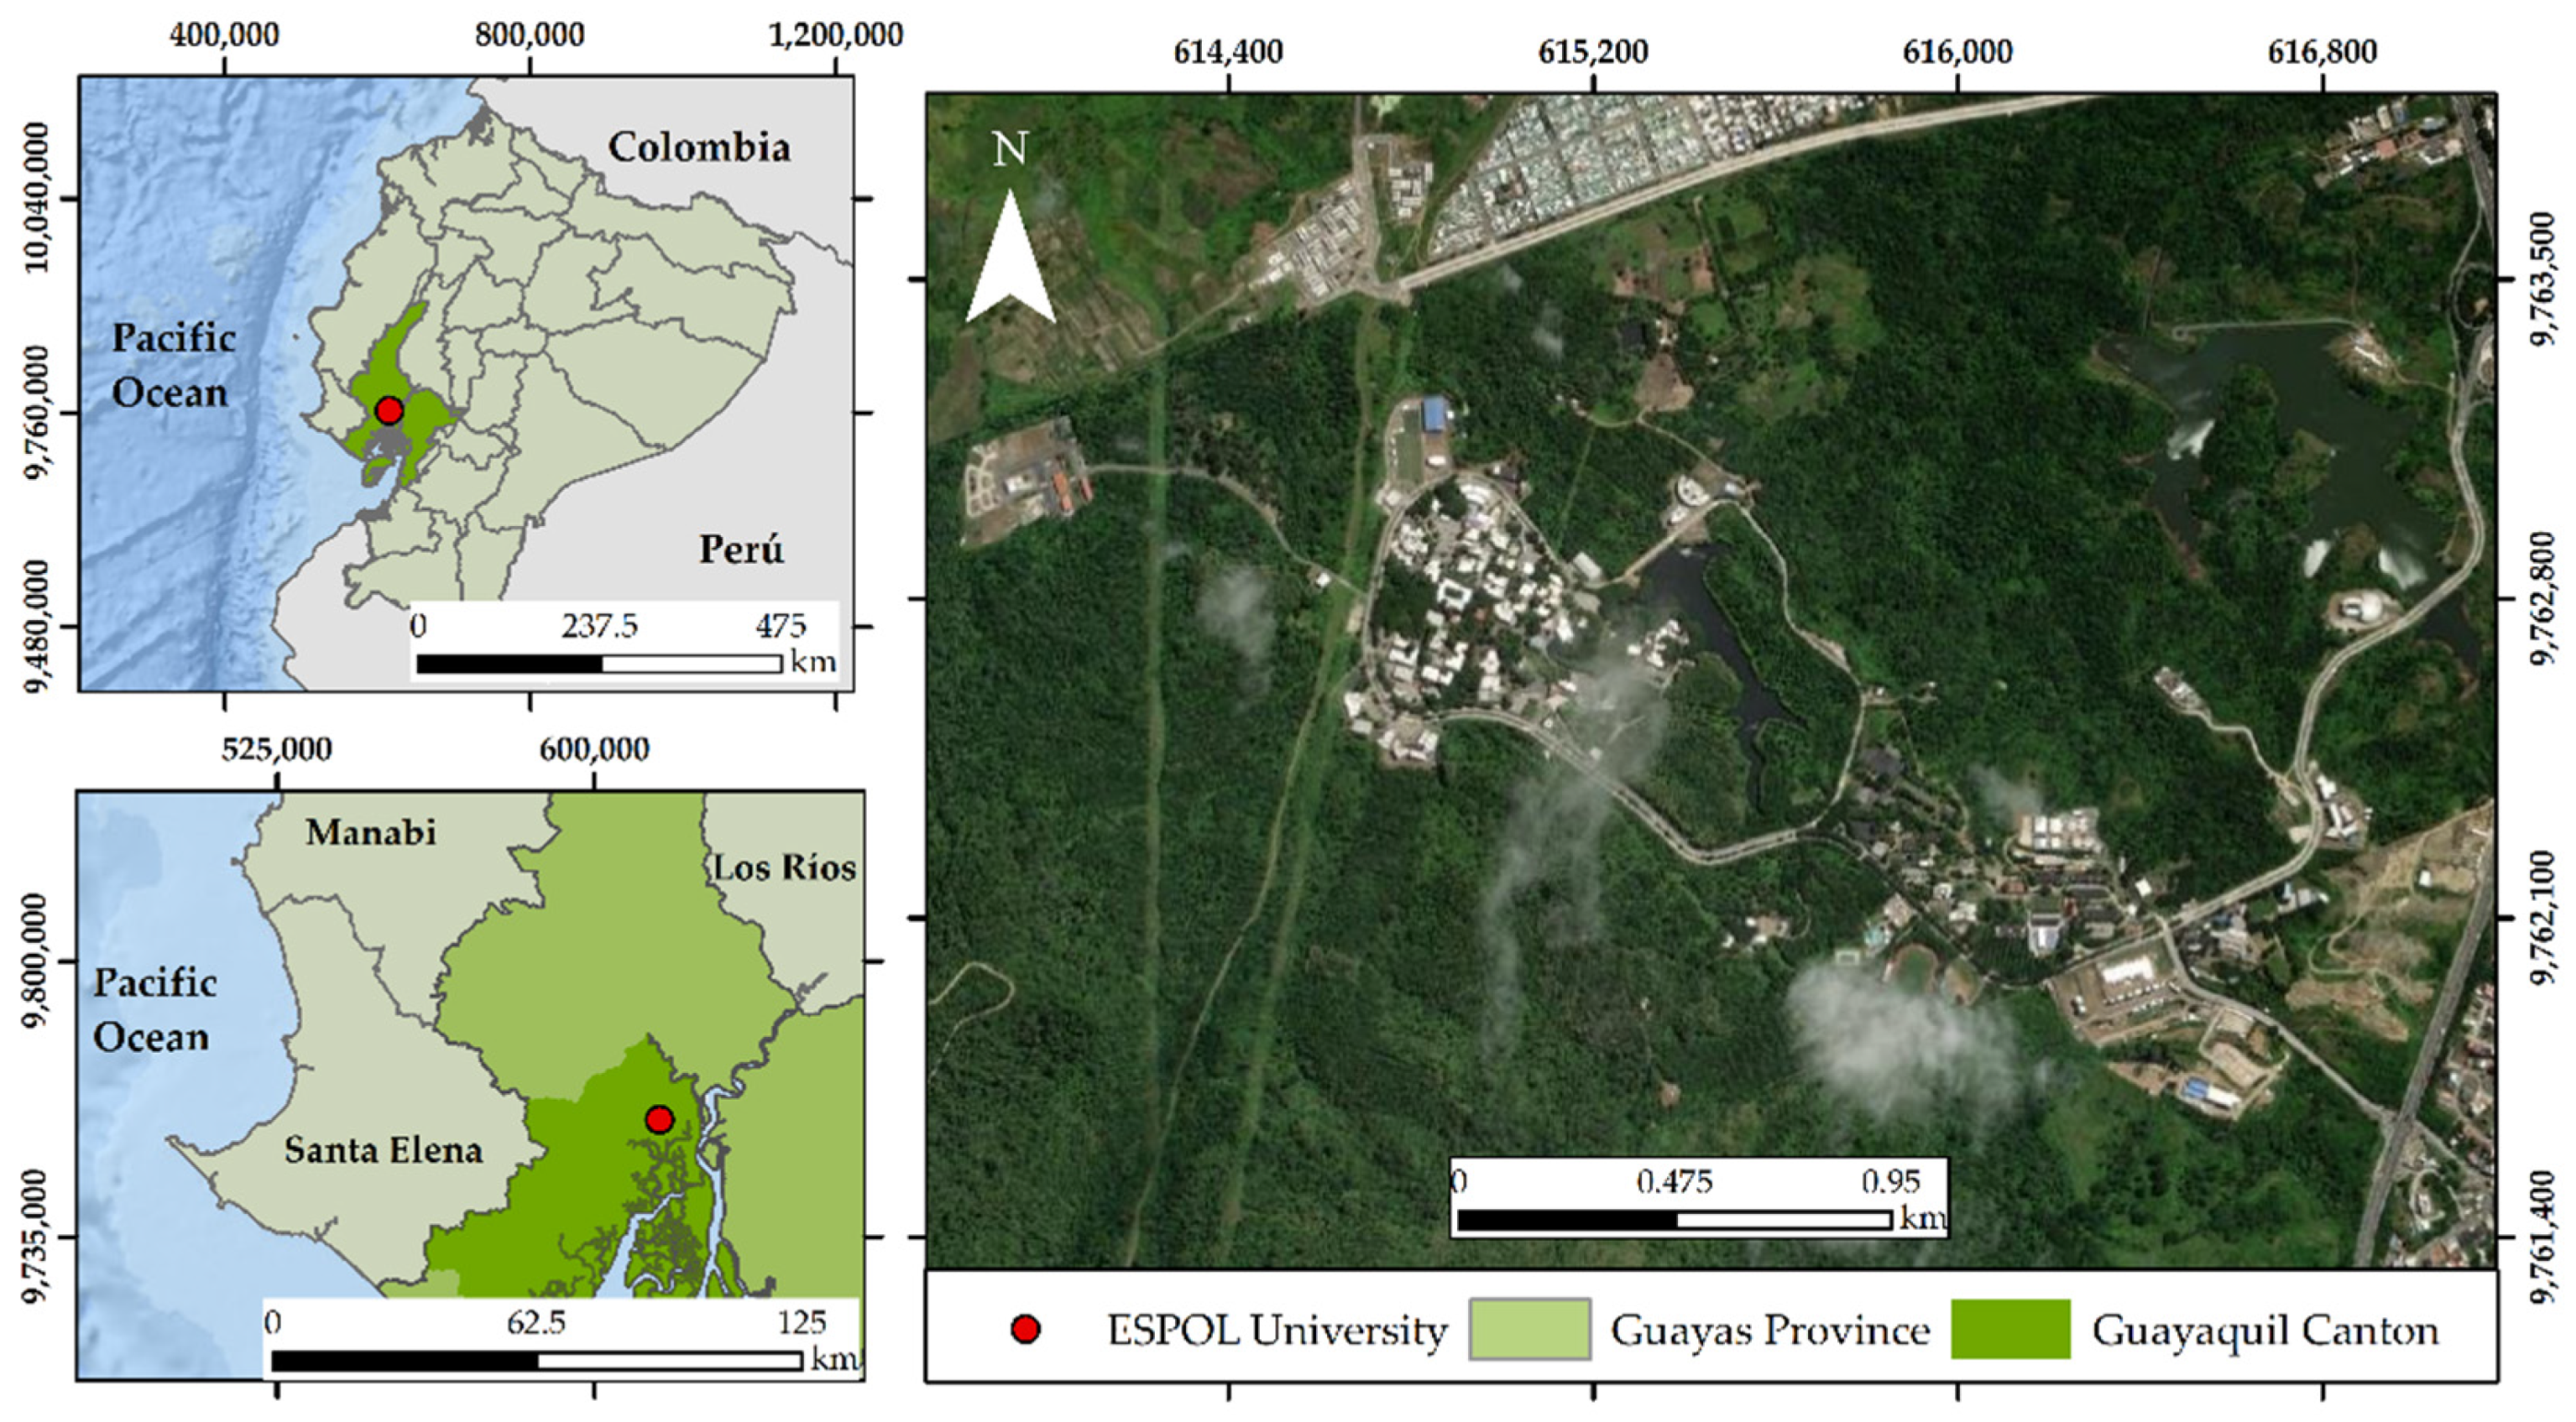
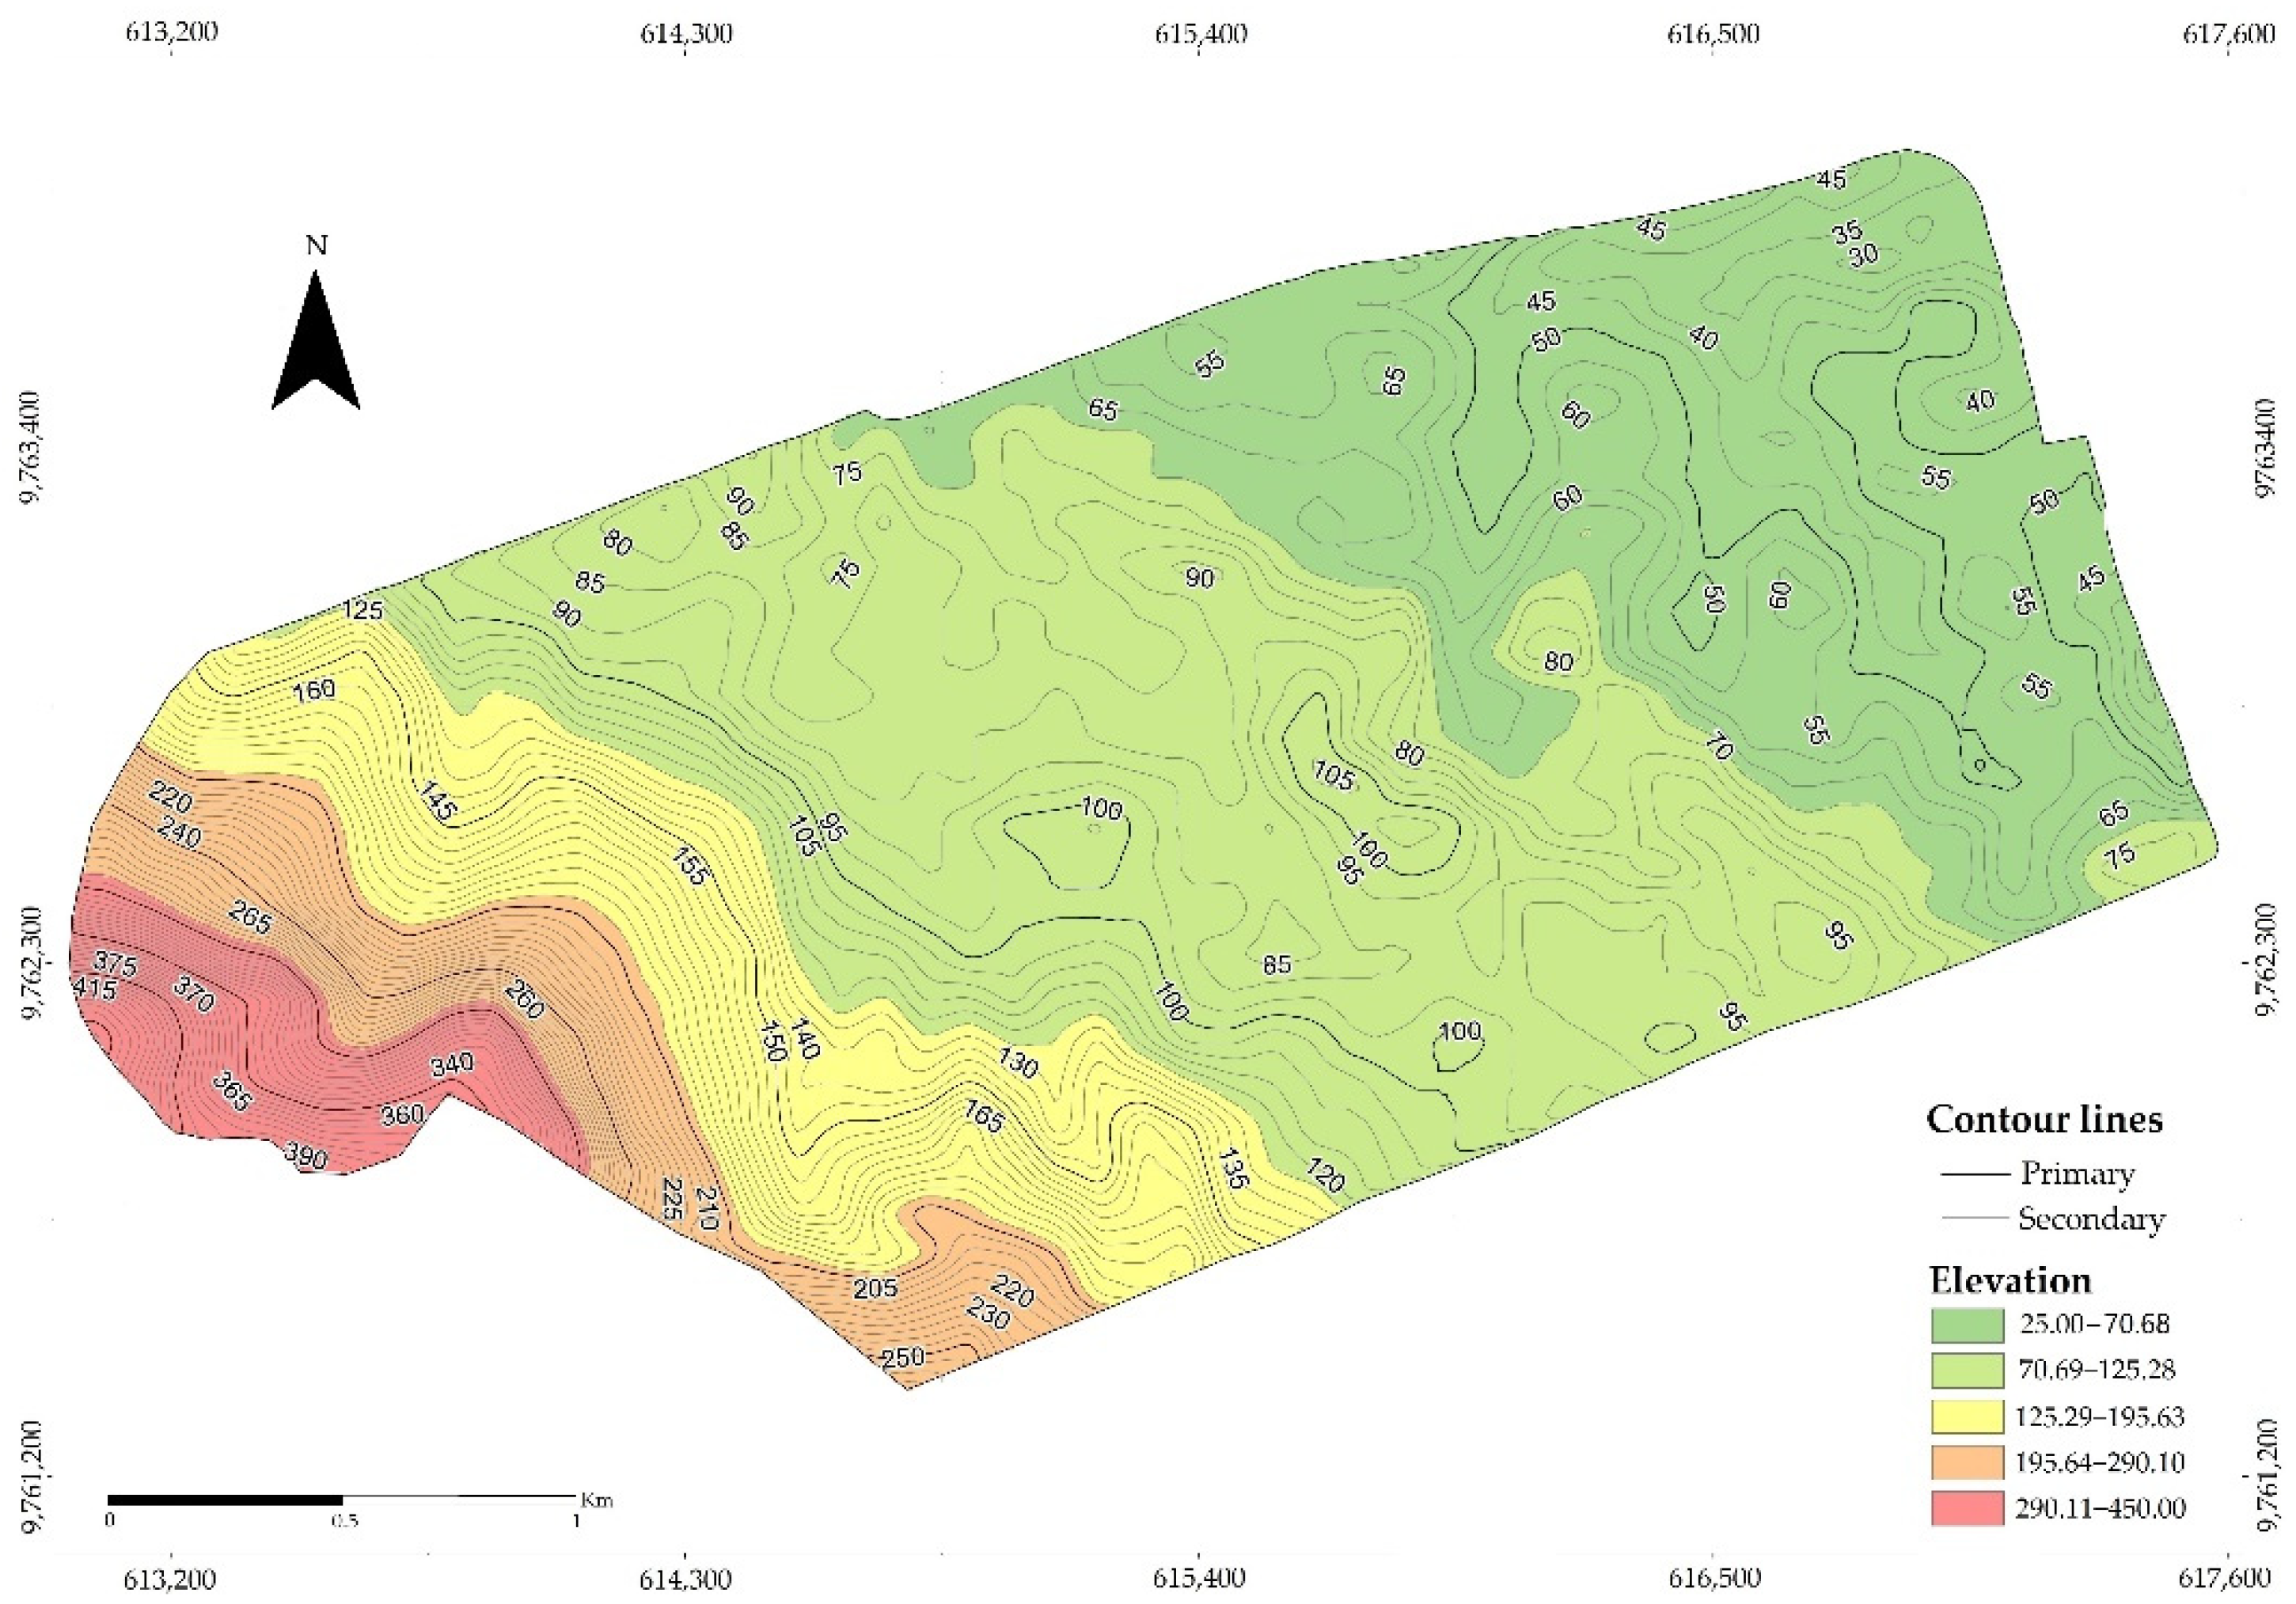
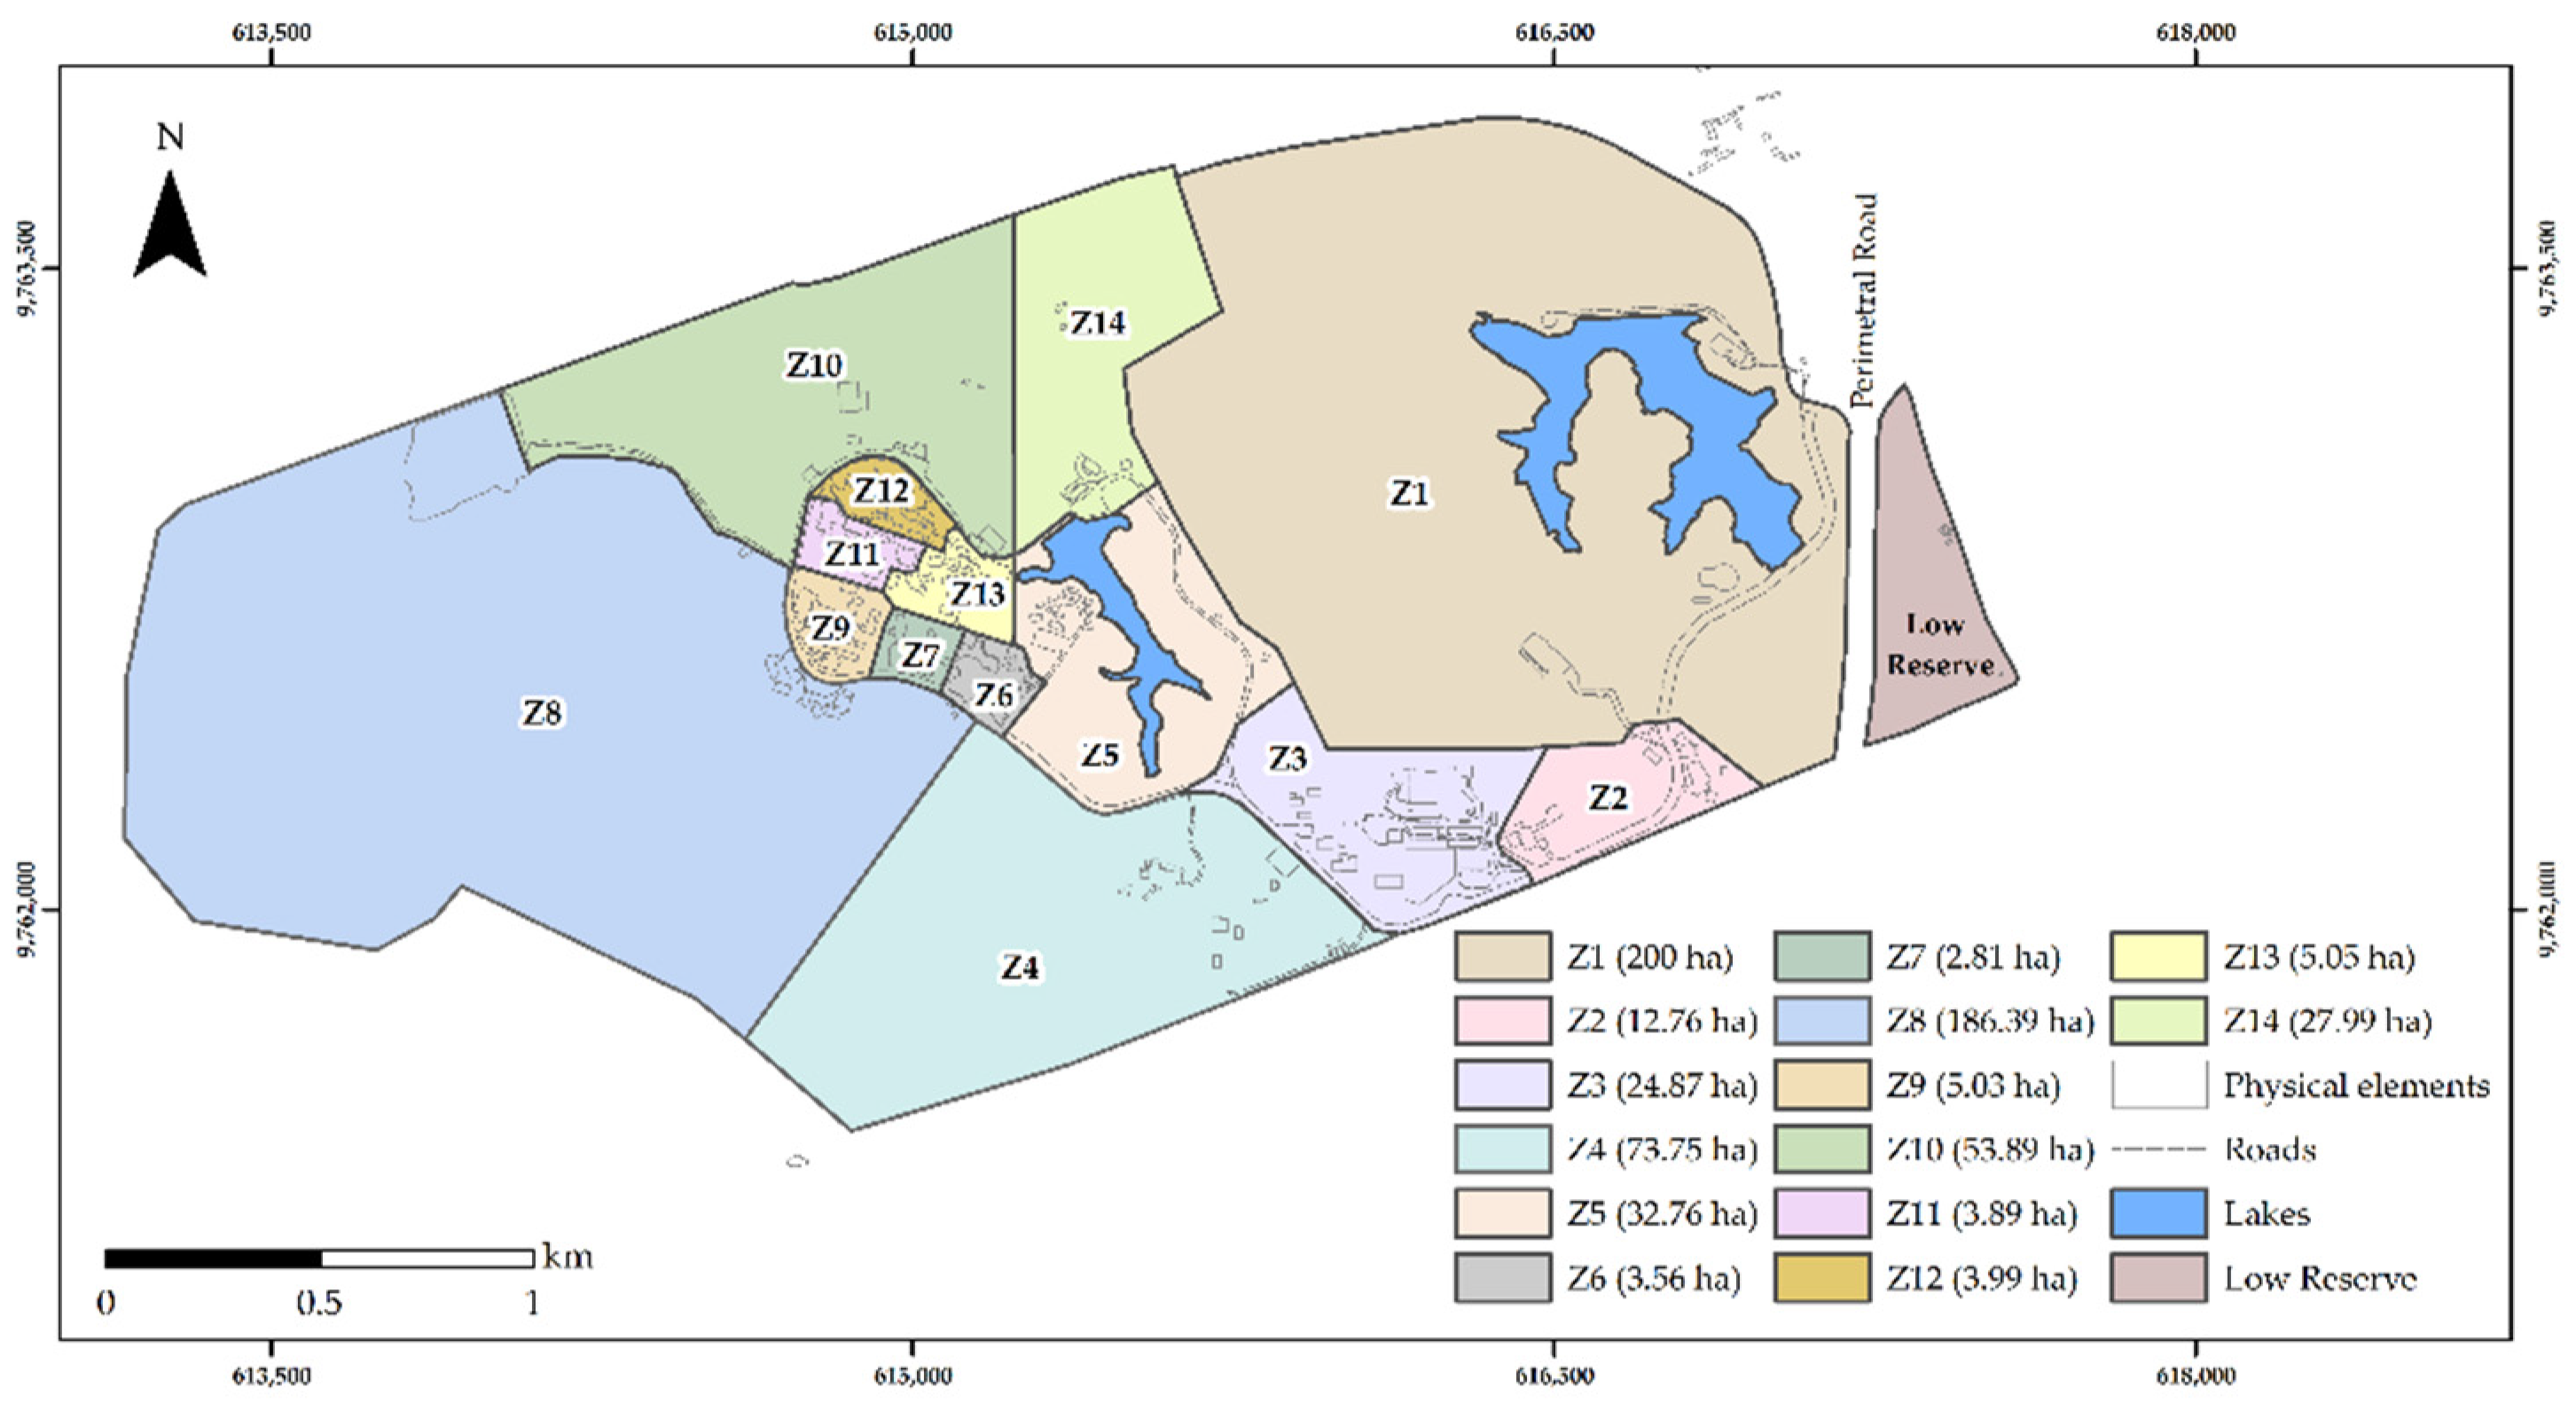
2.1. Study Area
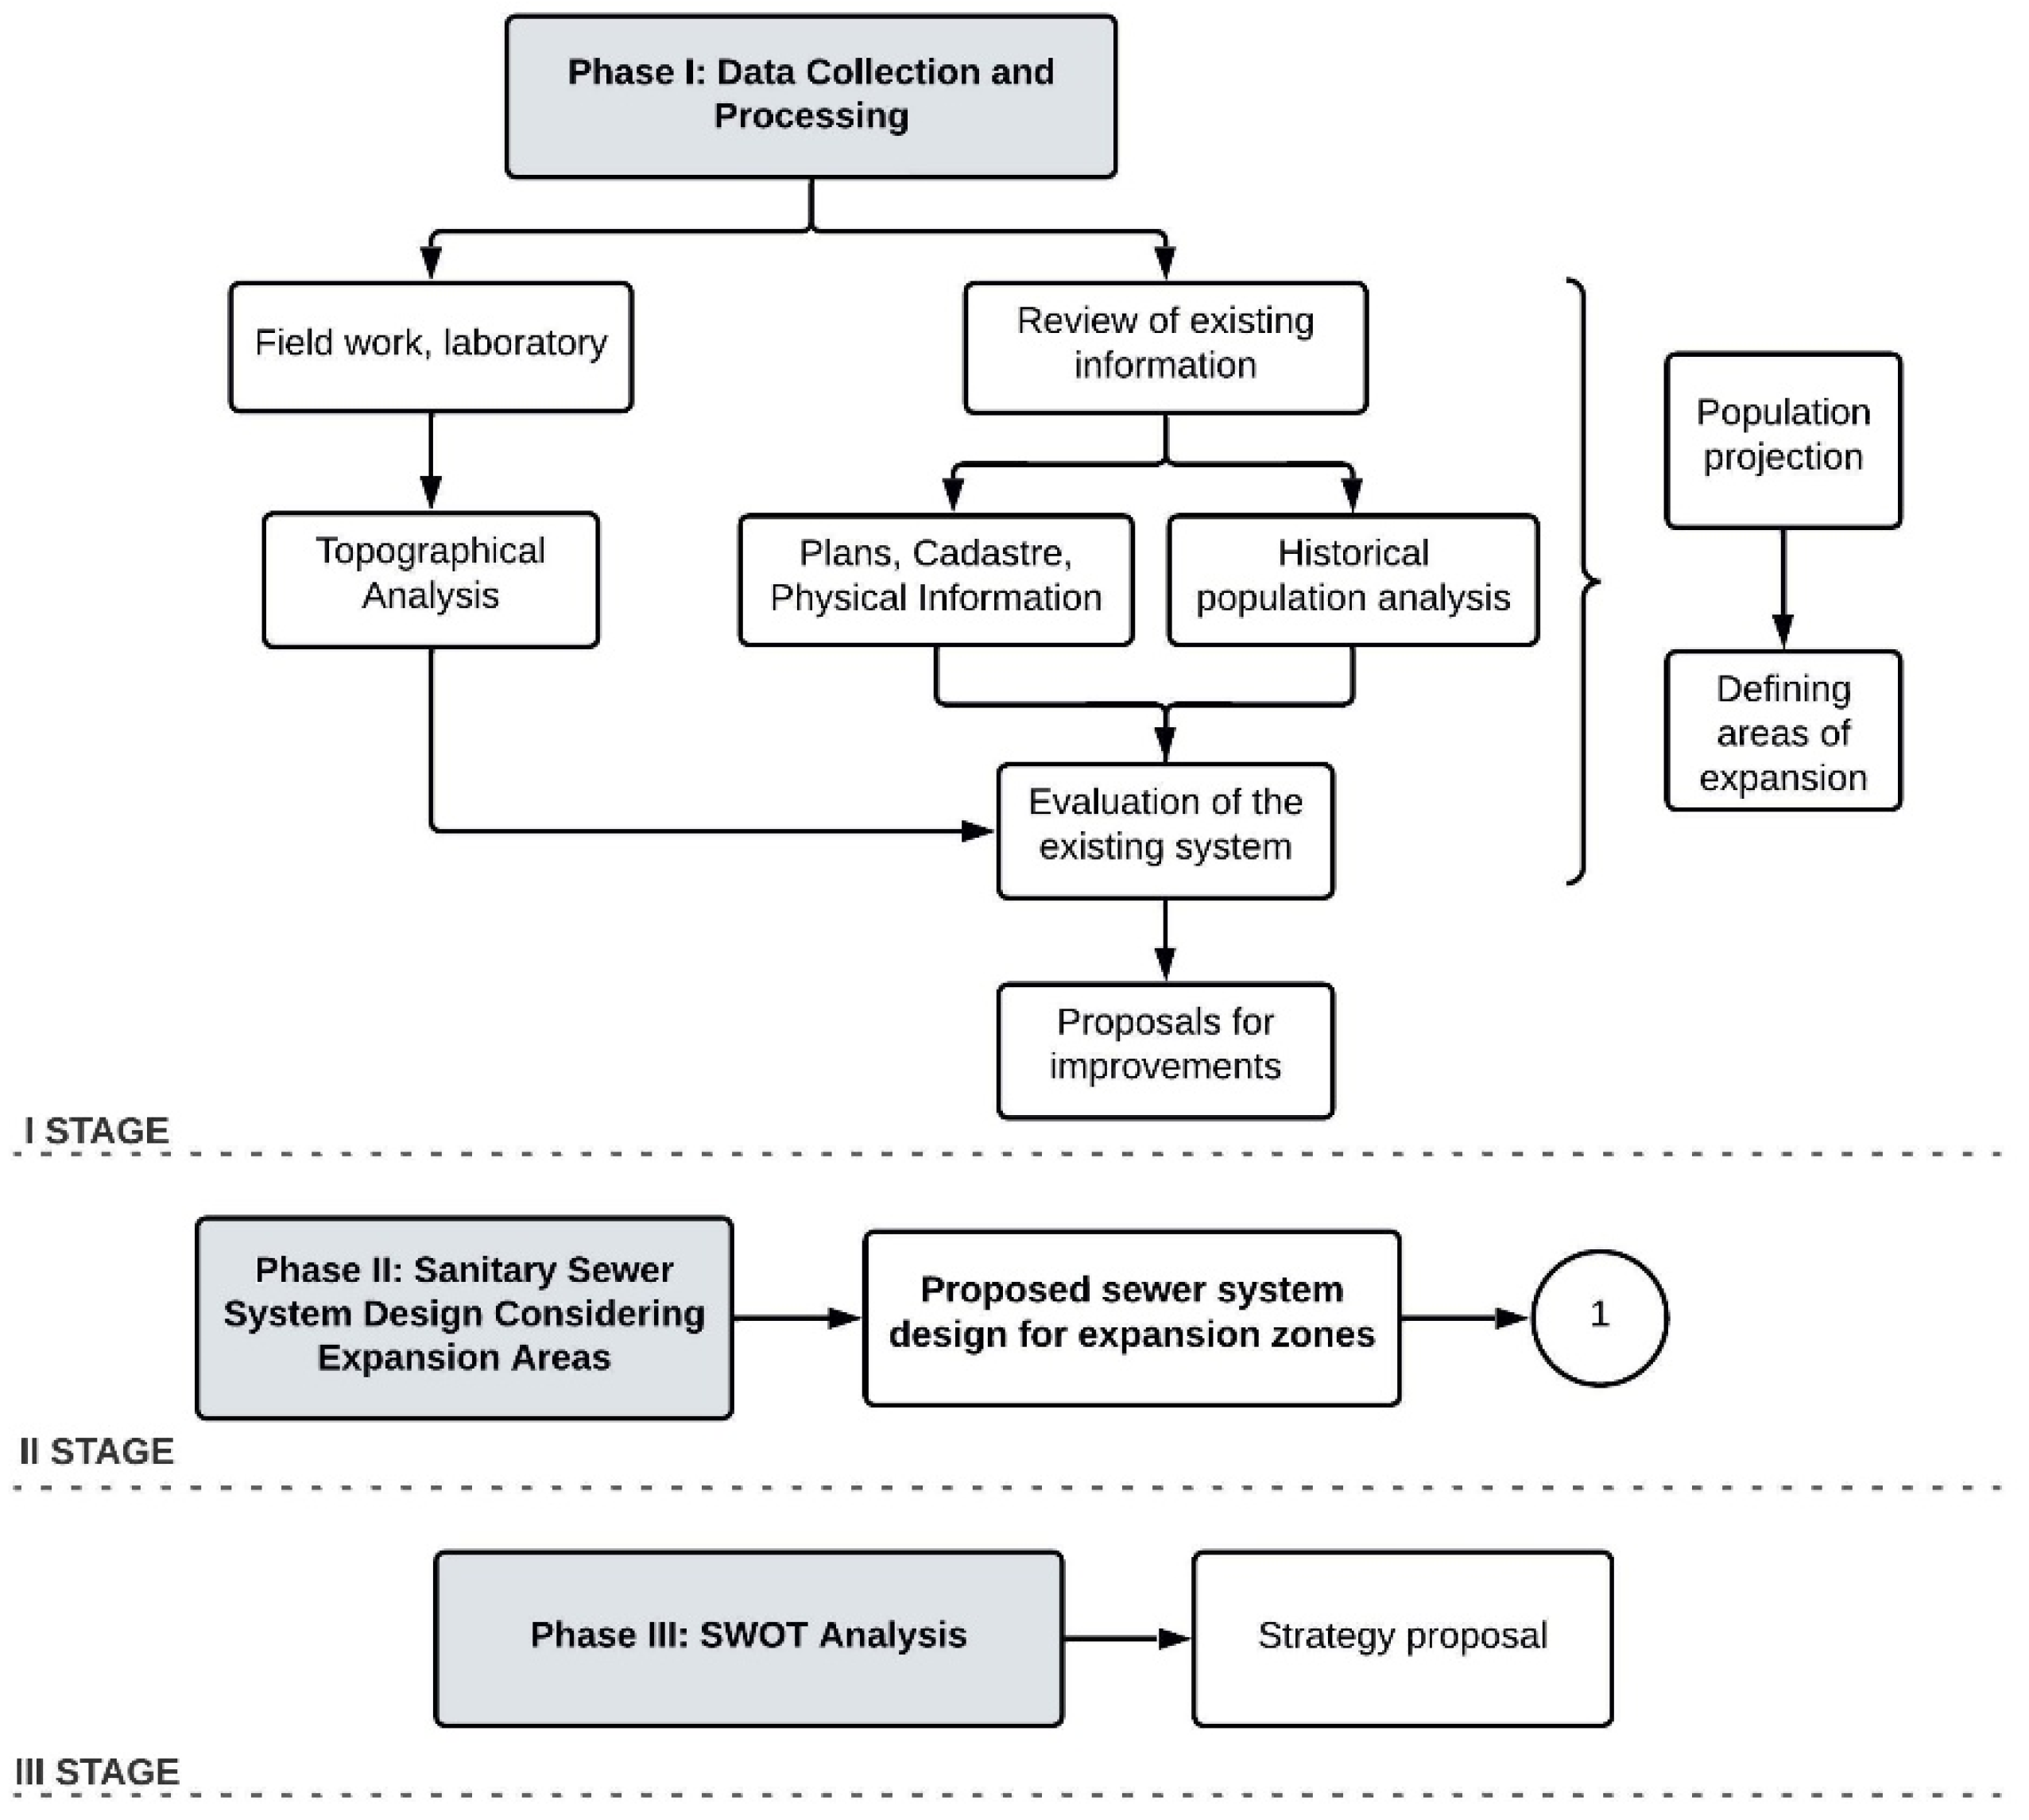
2.2. Stage I: Data Collection and Processing
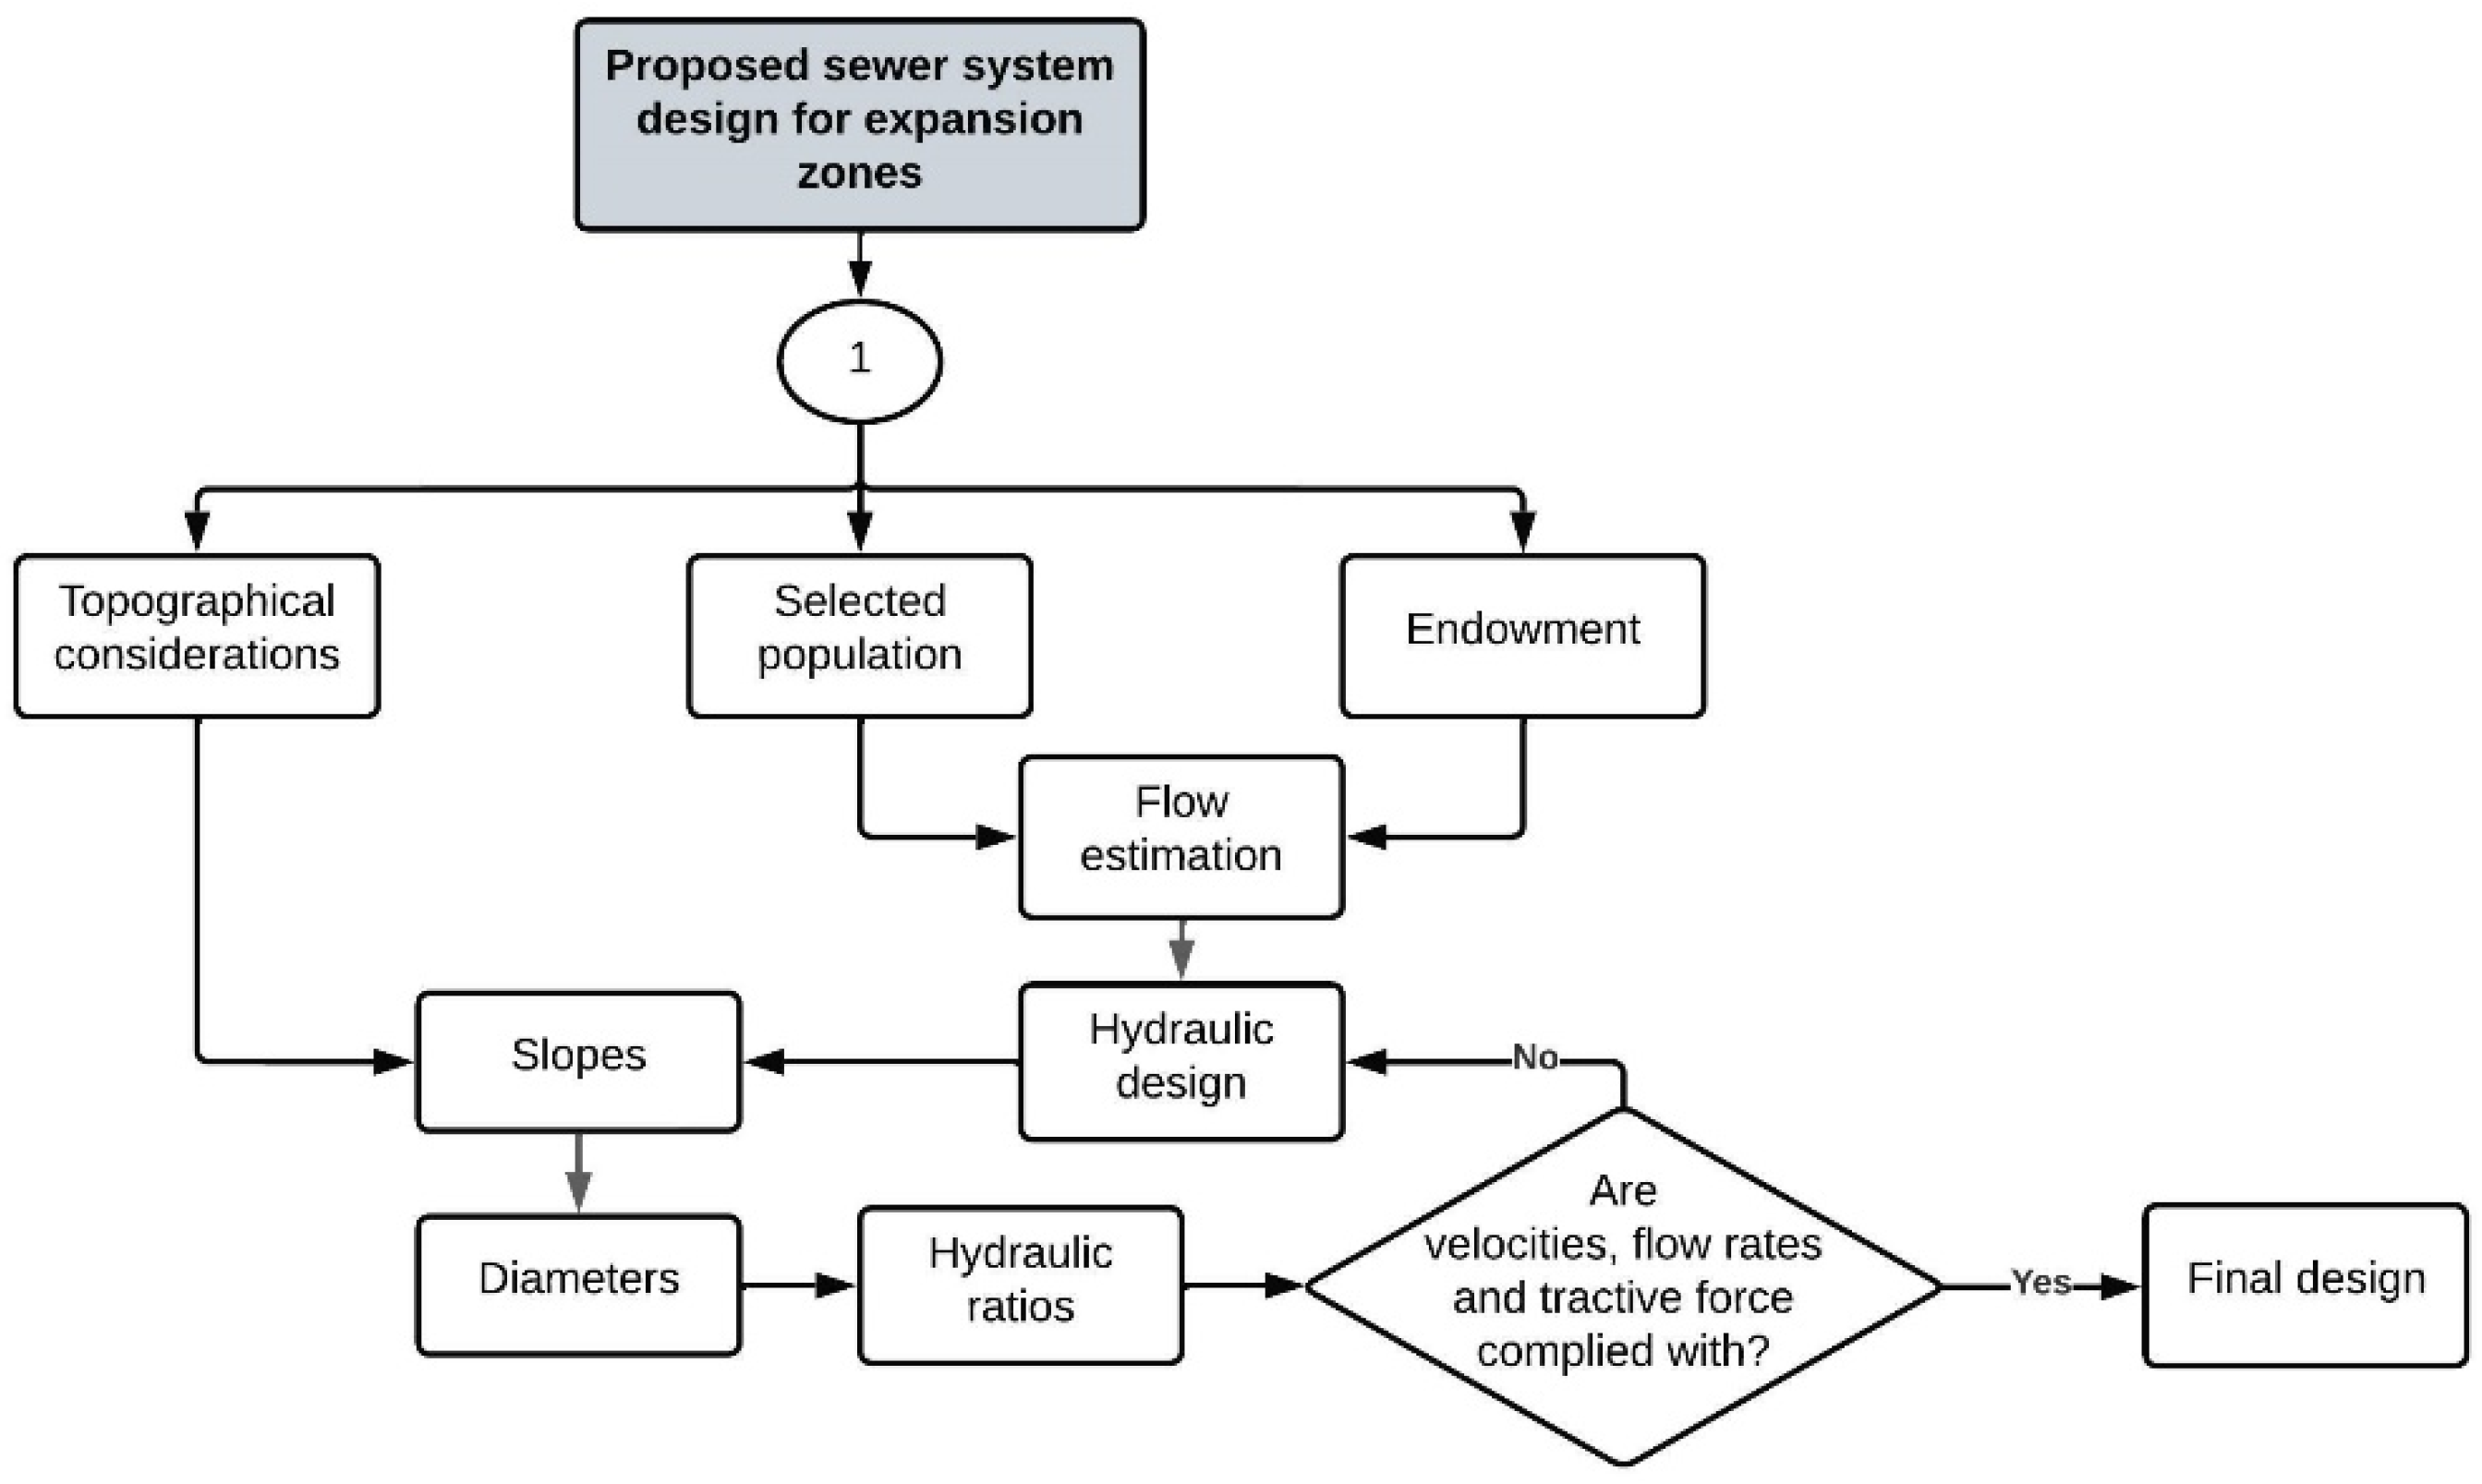
2.3. Stage II: Technical Proposal Design
2.4. Stage III: SWOT Analysis
3. Results
3.1. Existing Information
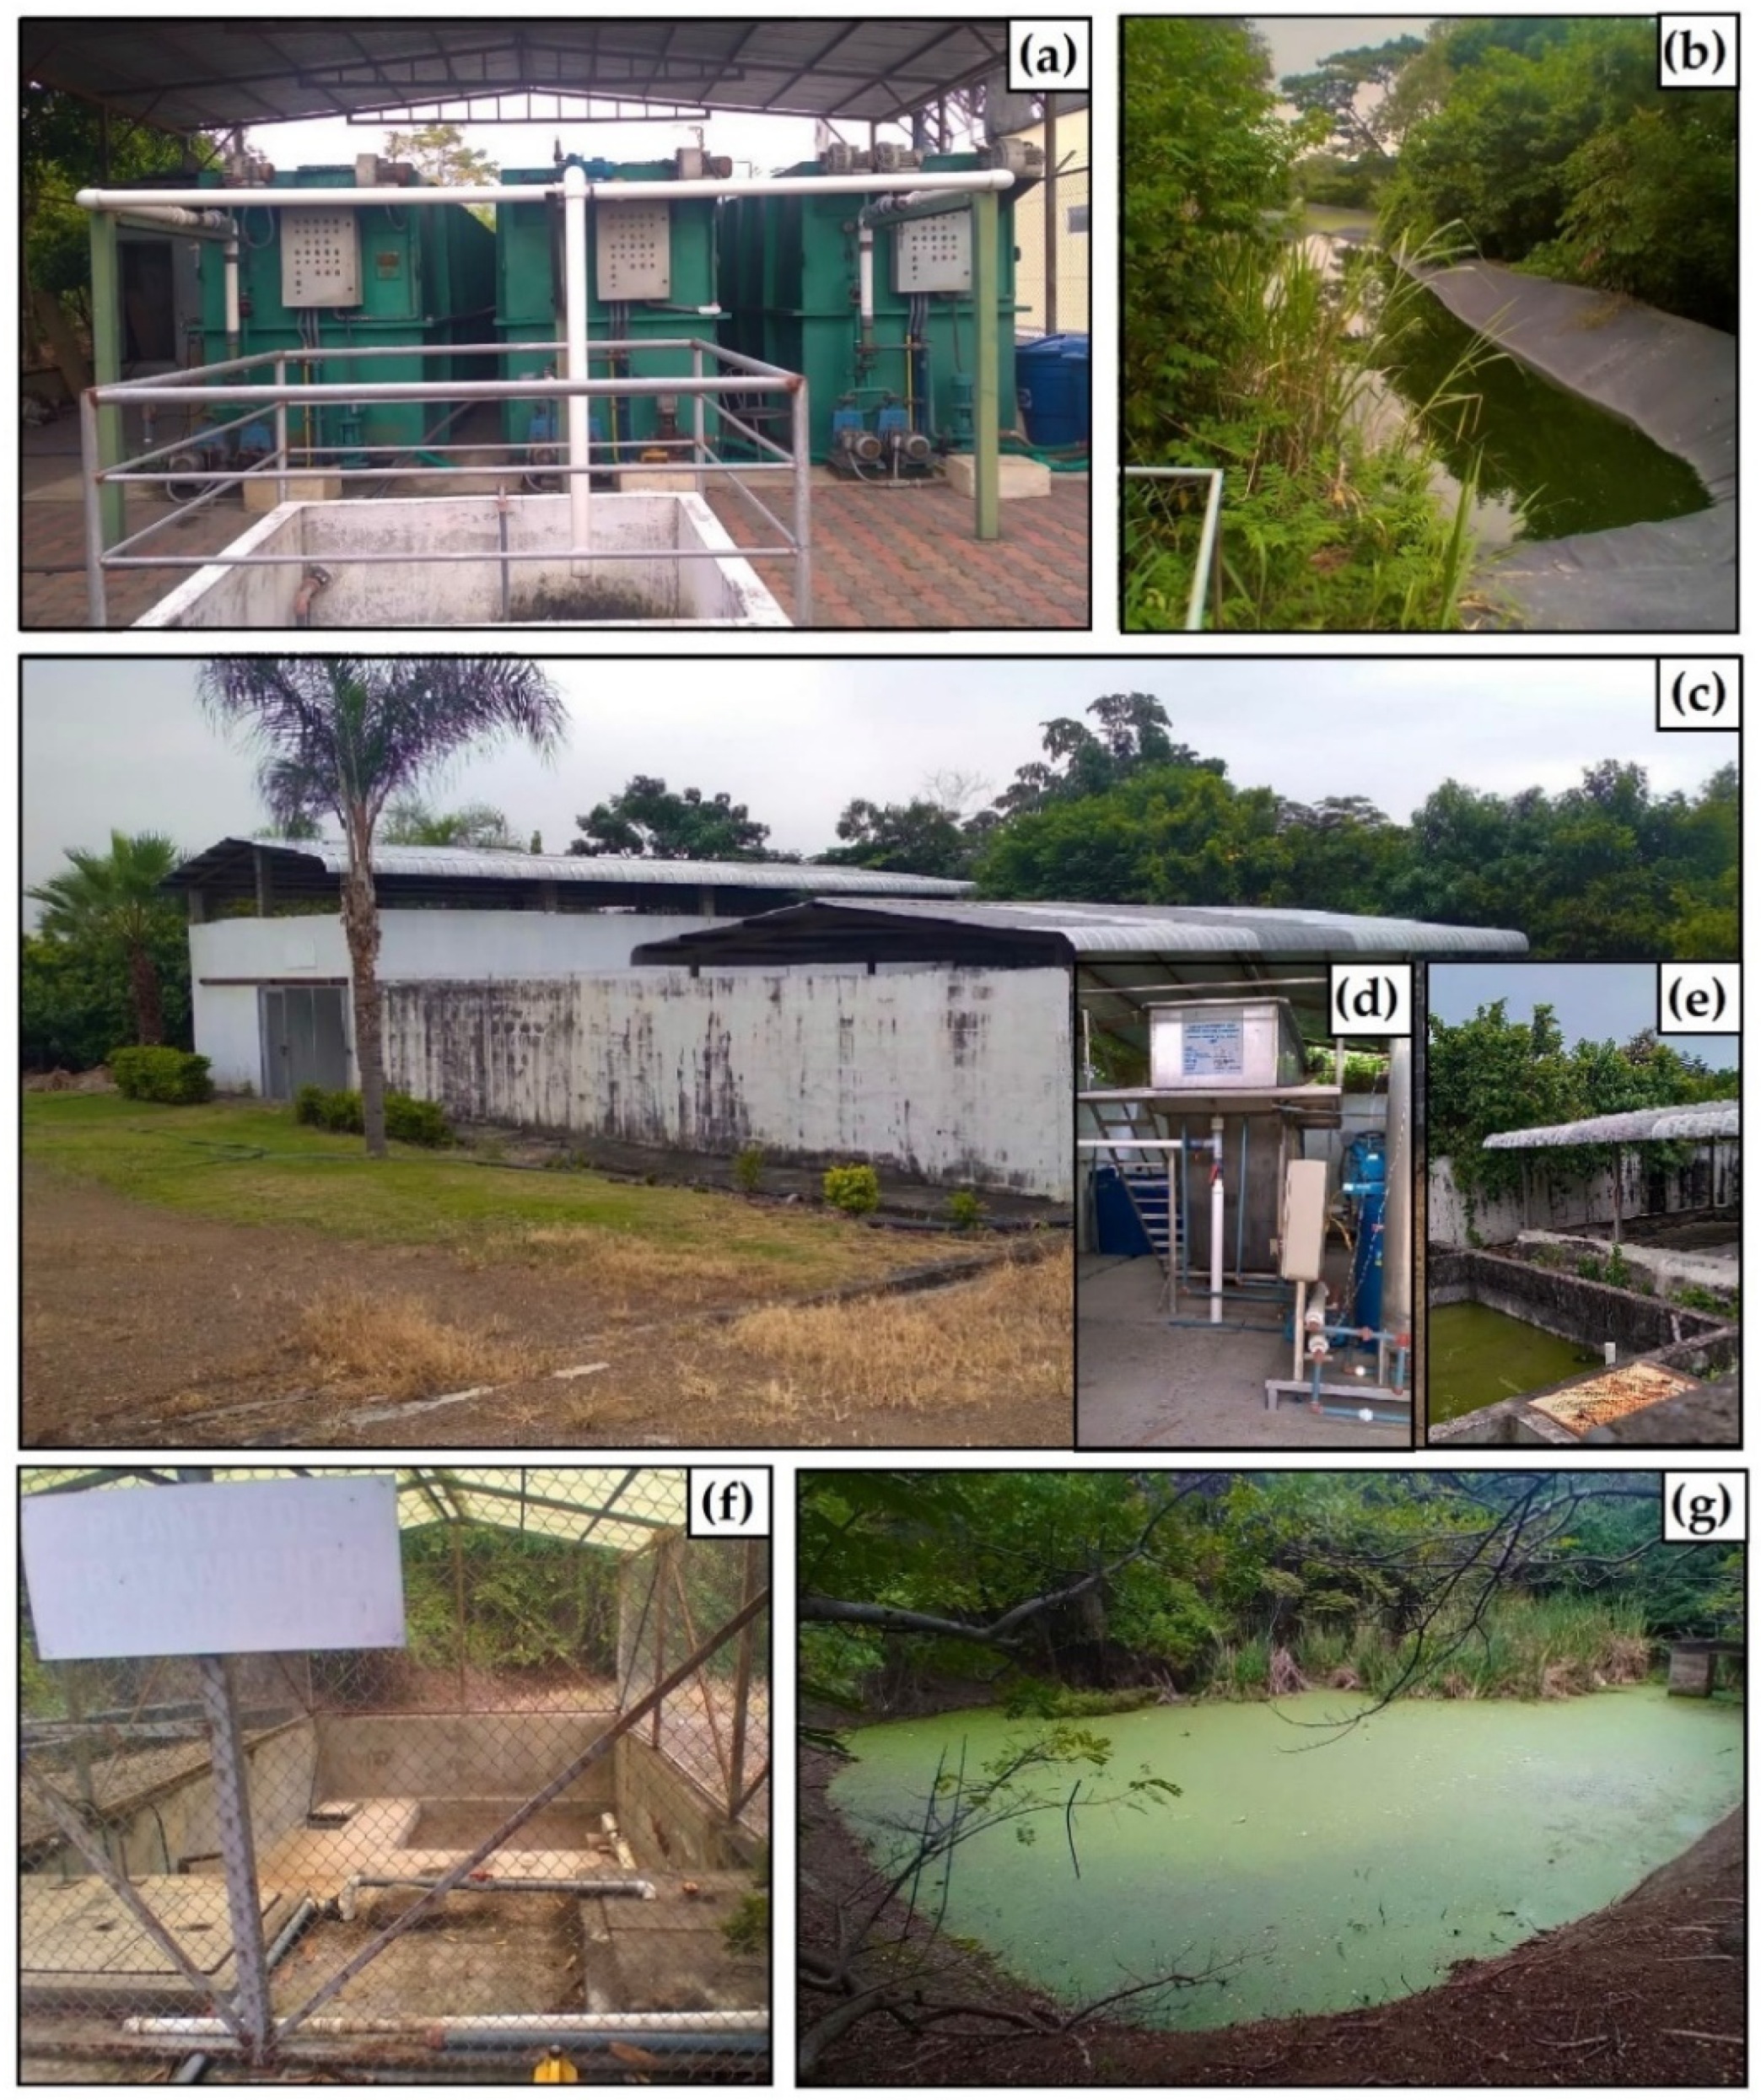
3.2. Sewerage and Treatment System
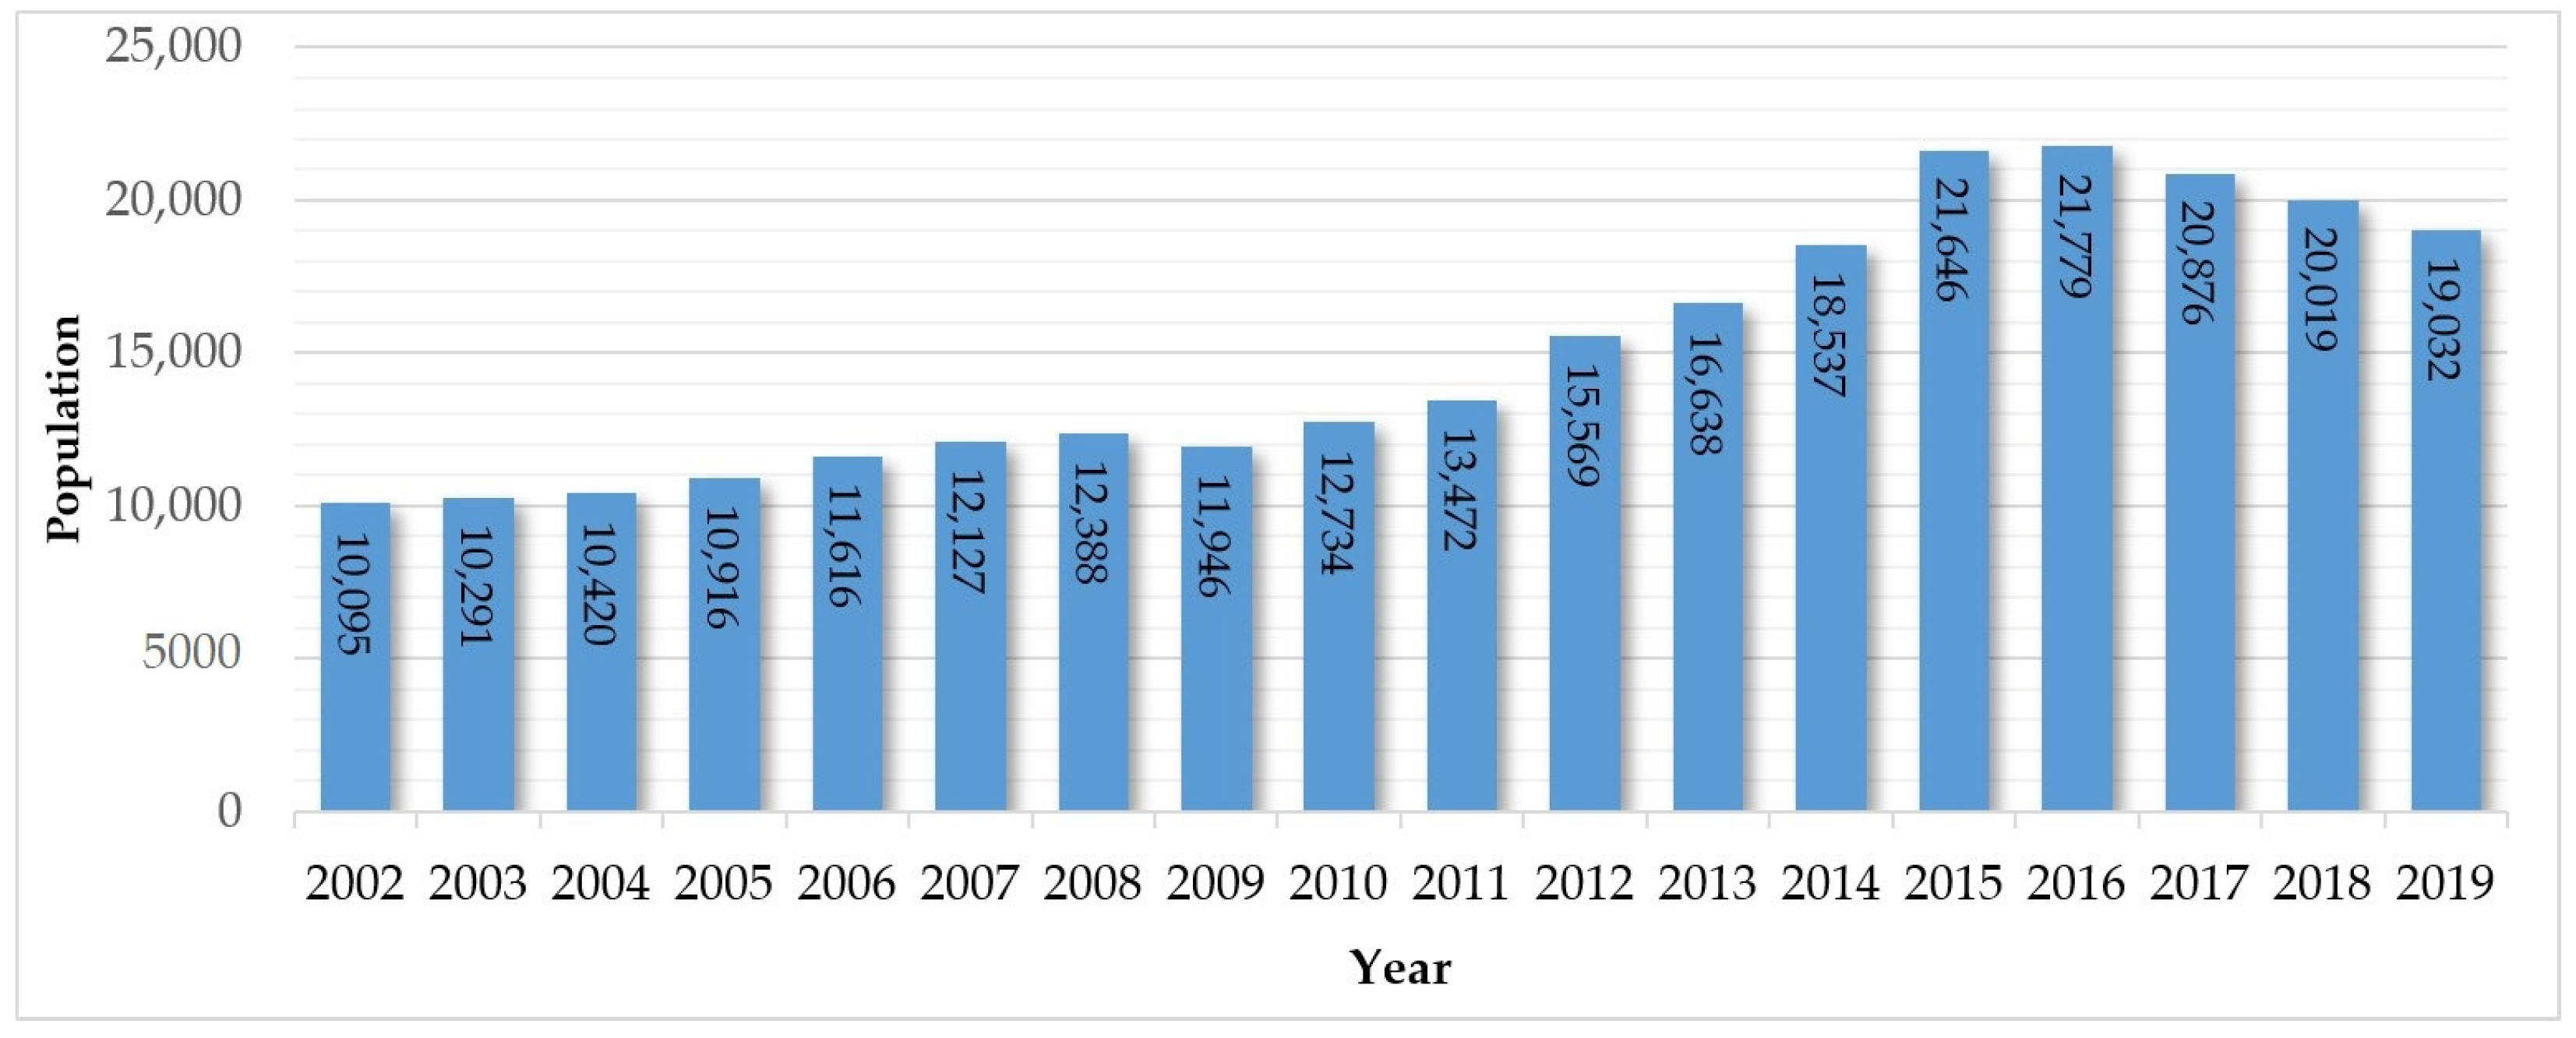
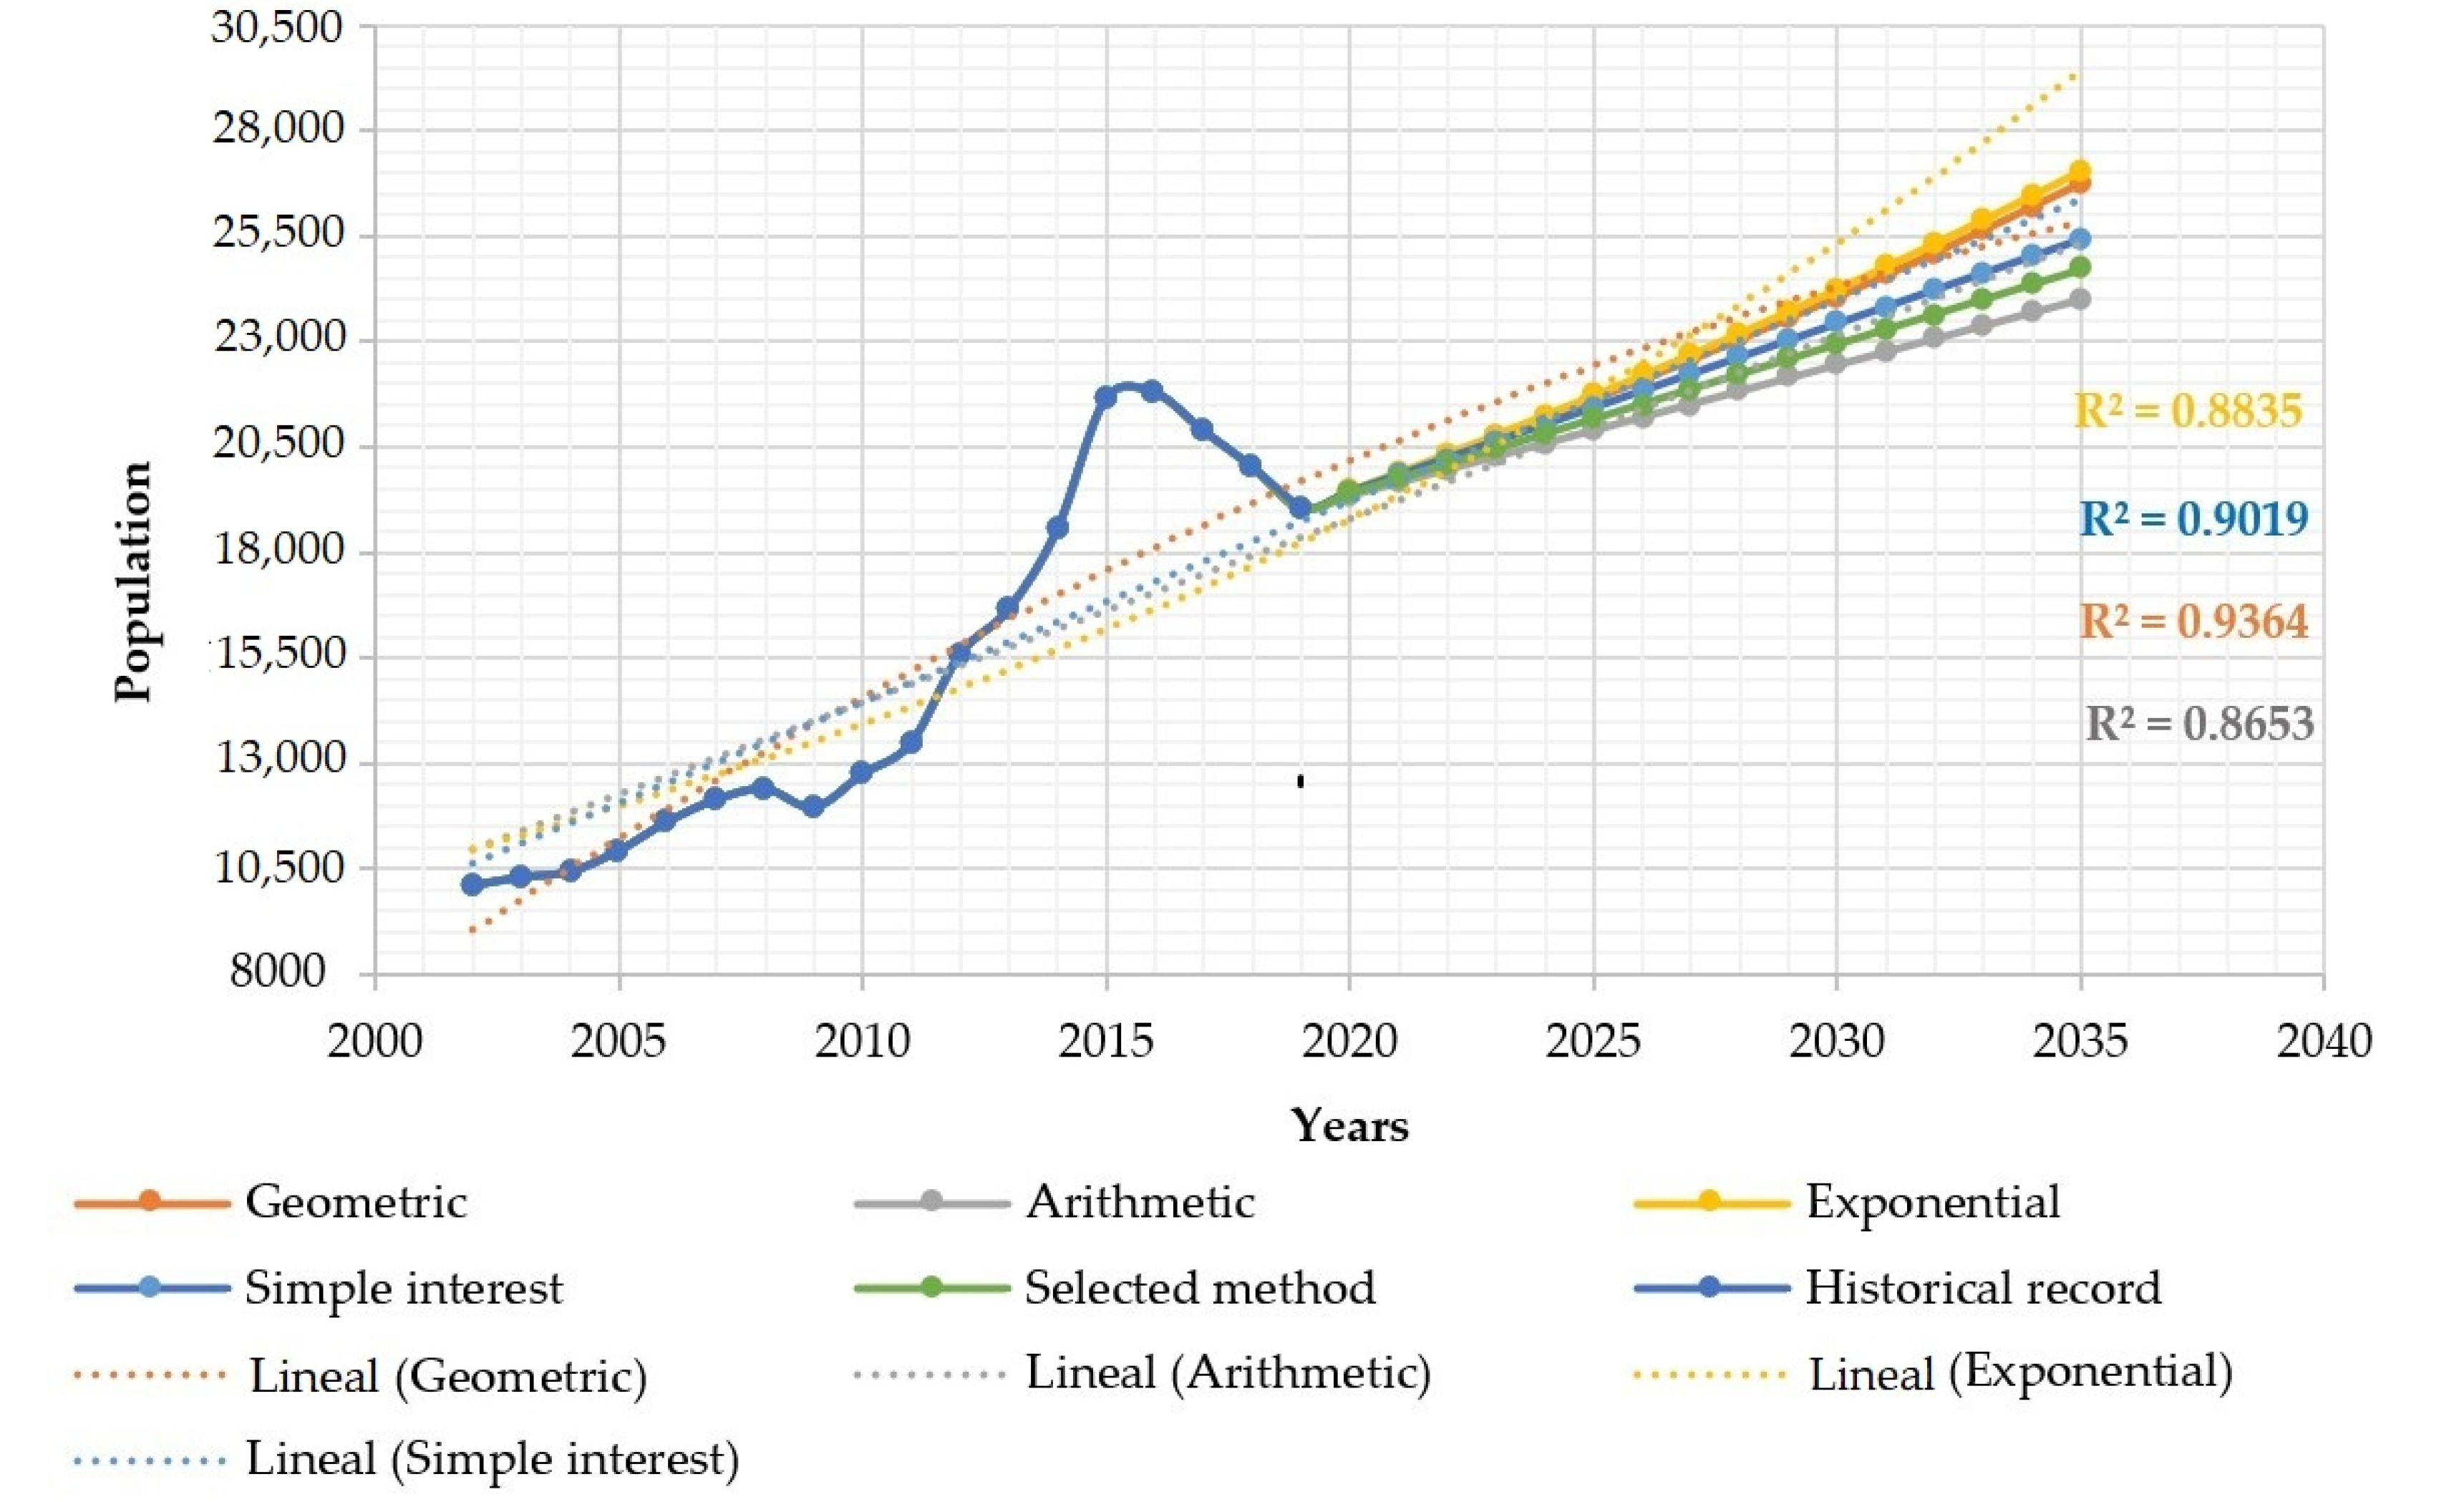
3.3. Population Projection
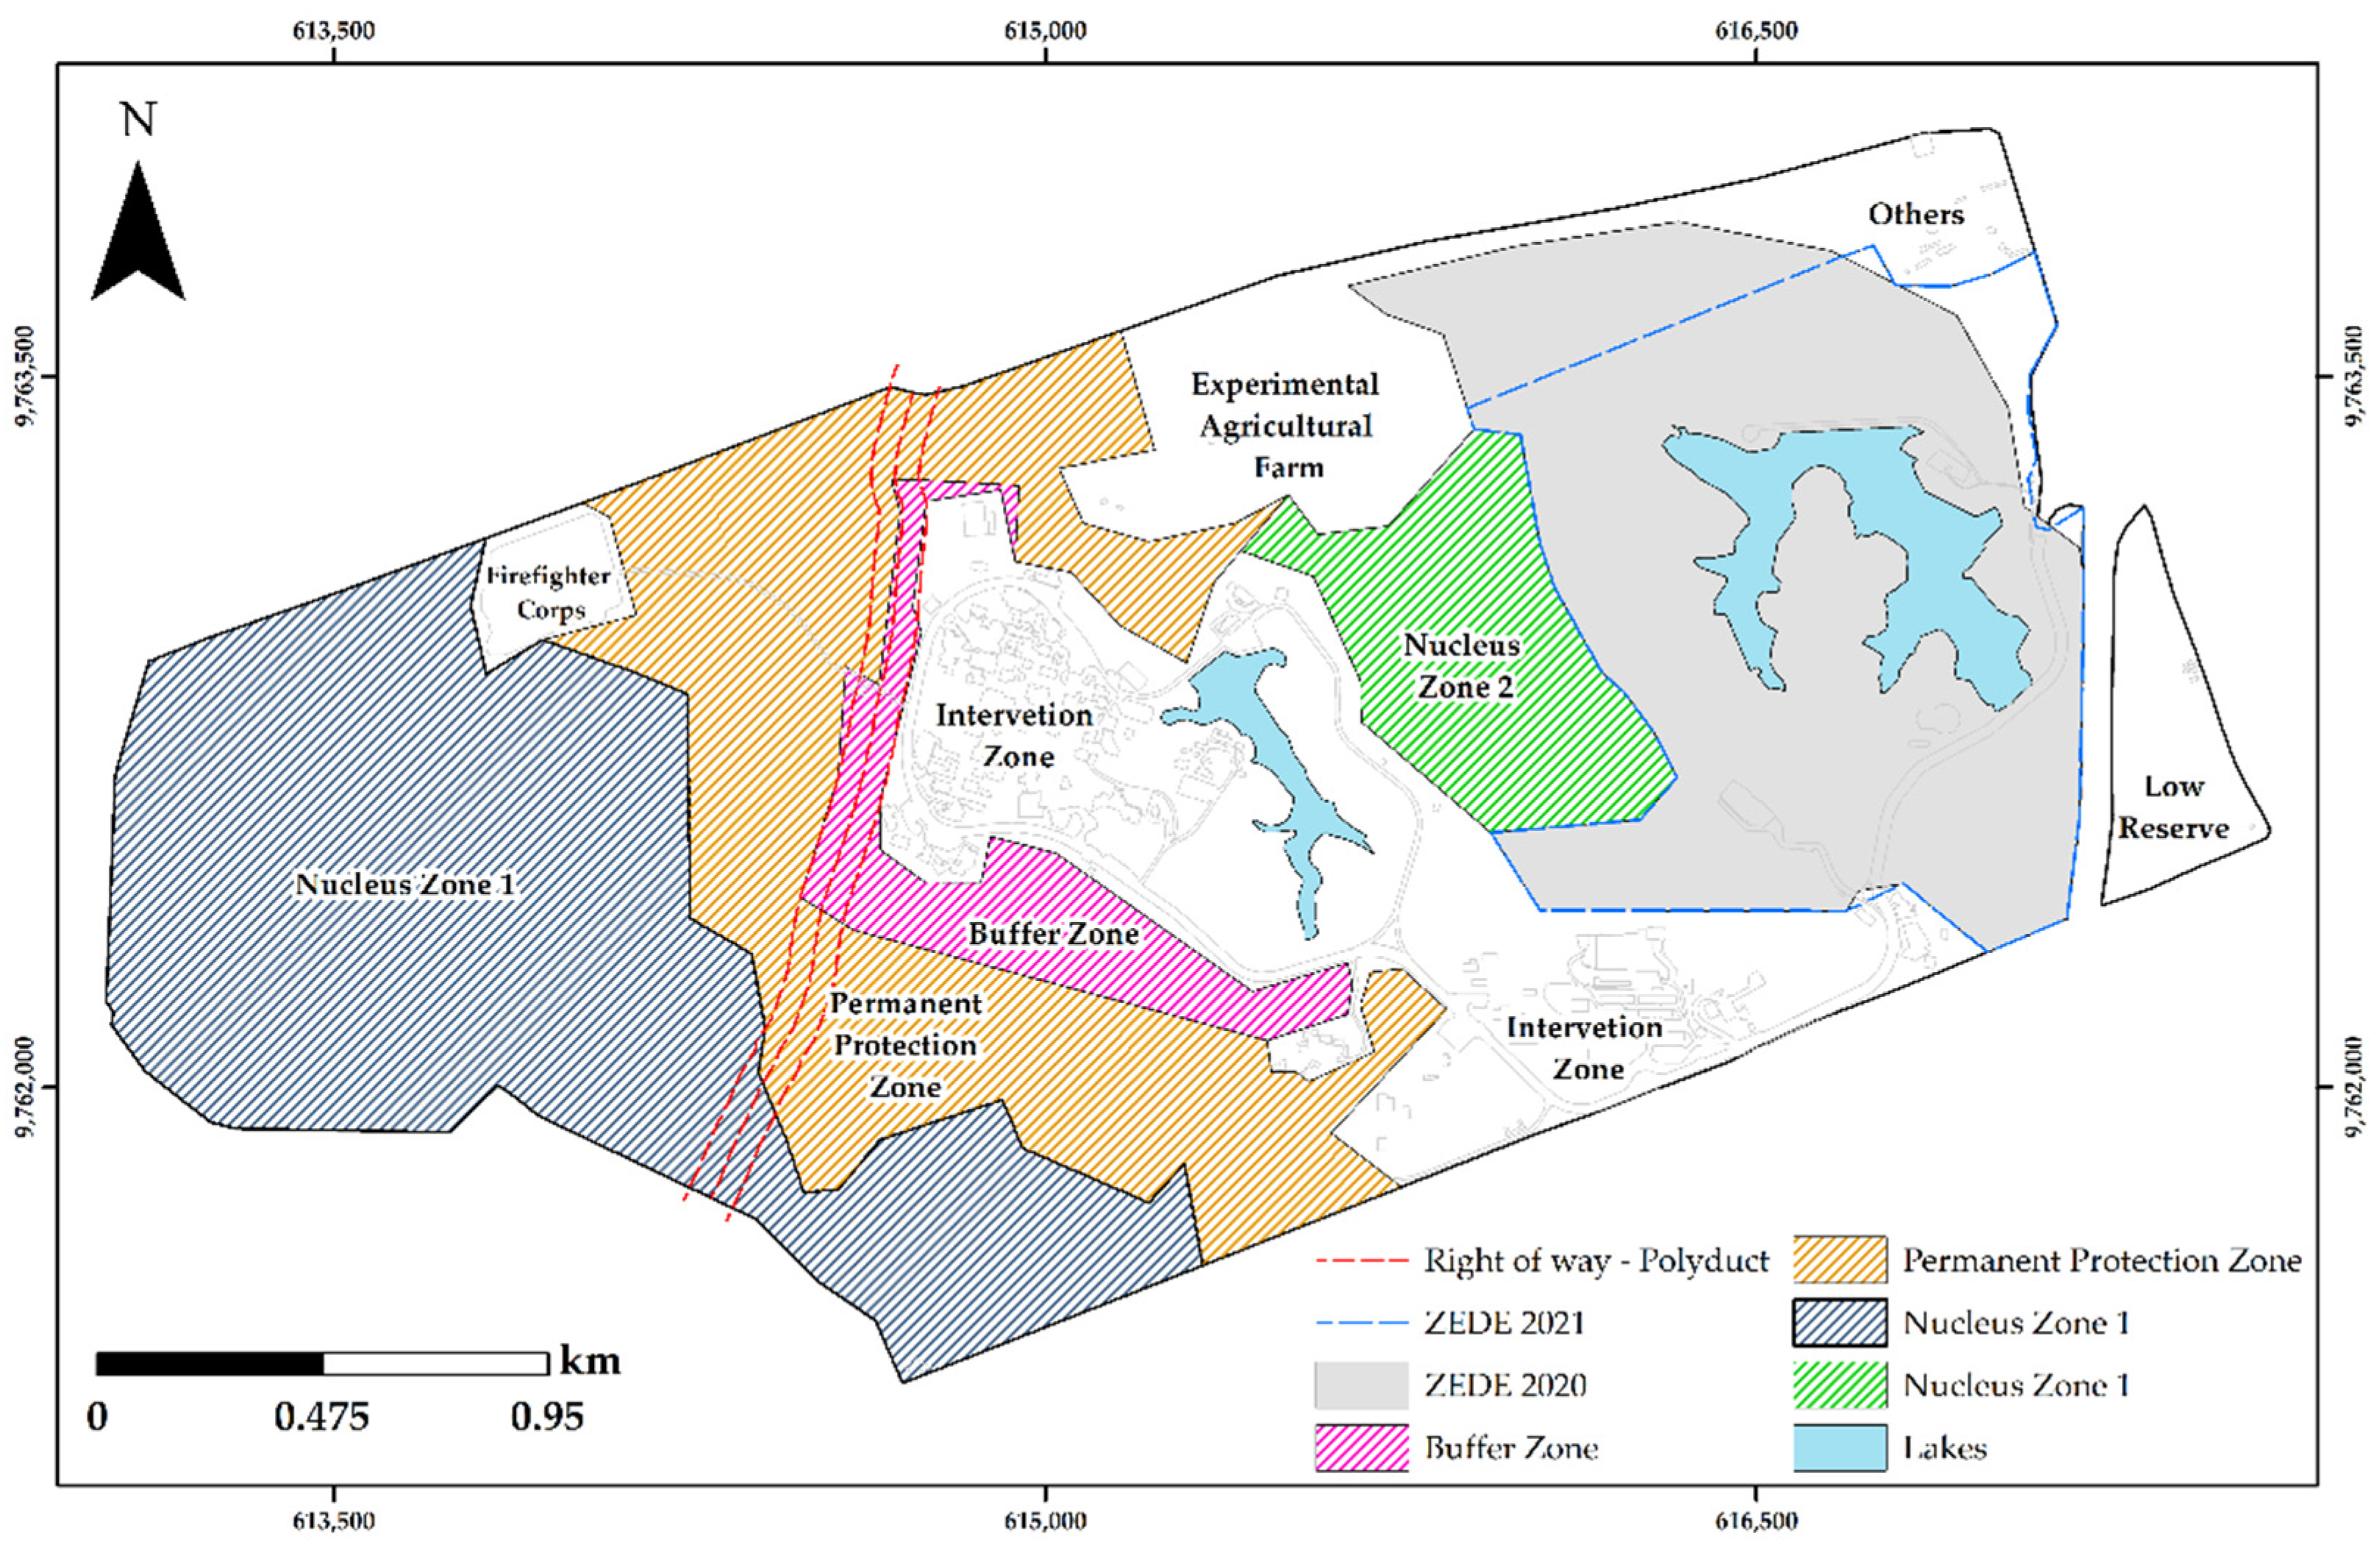
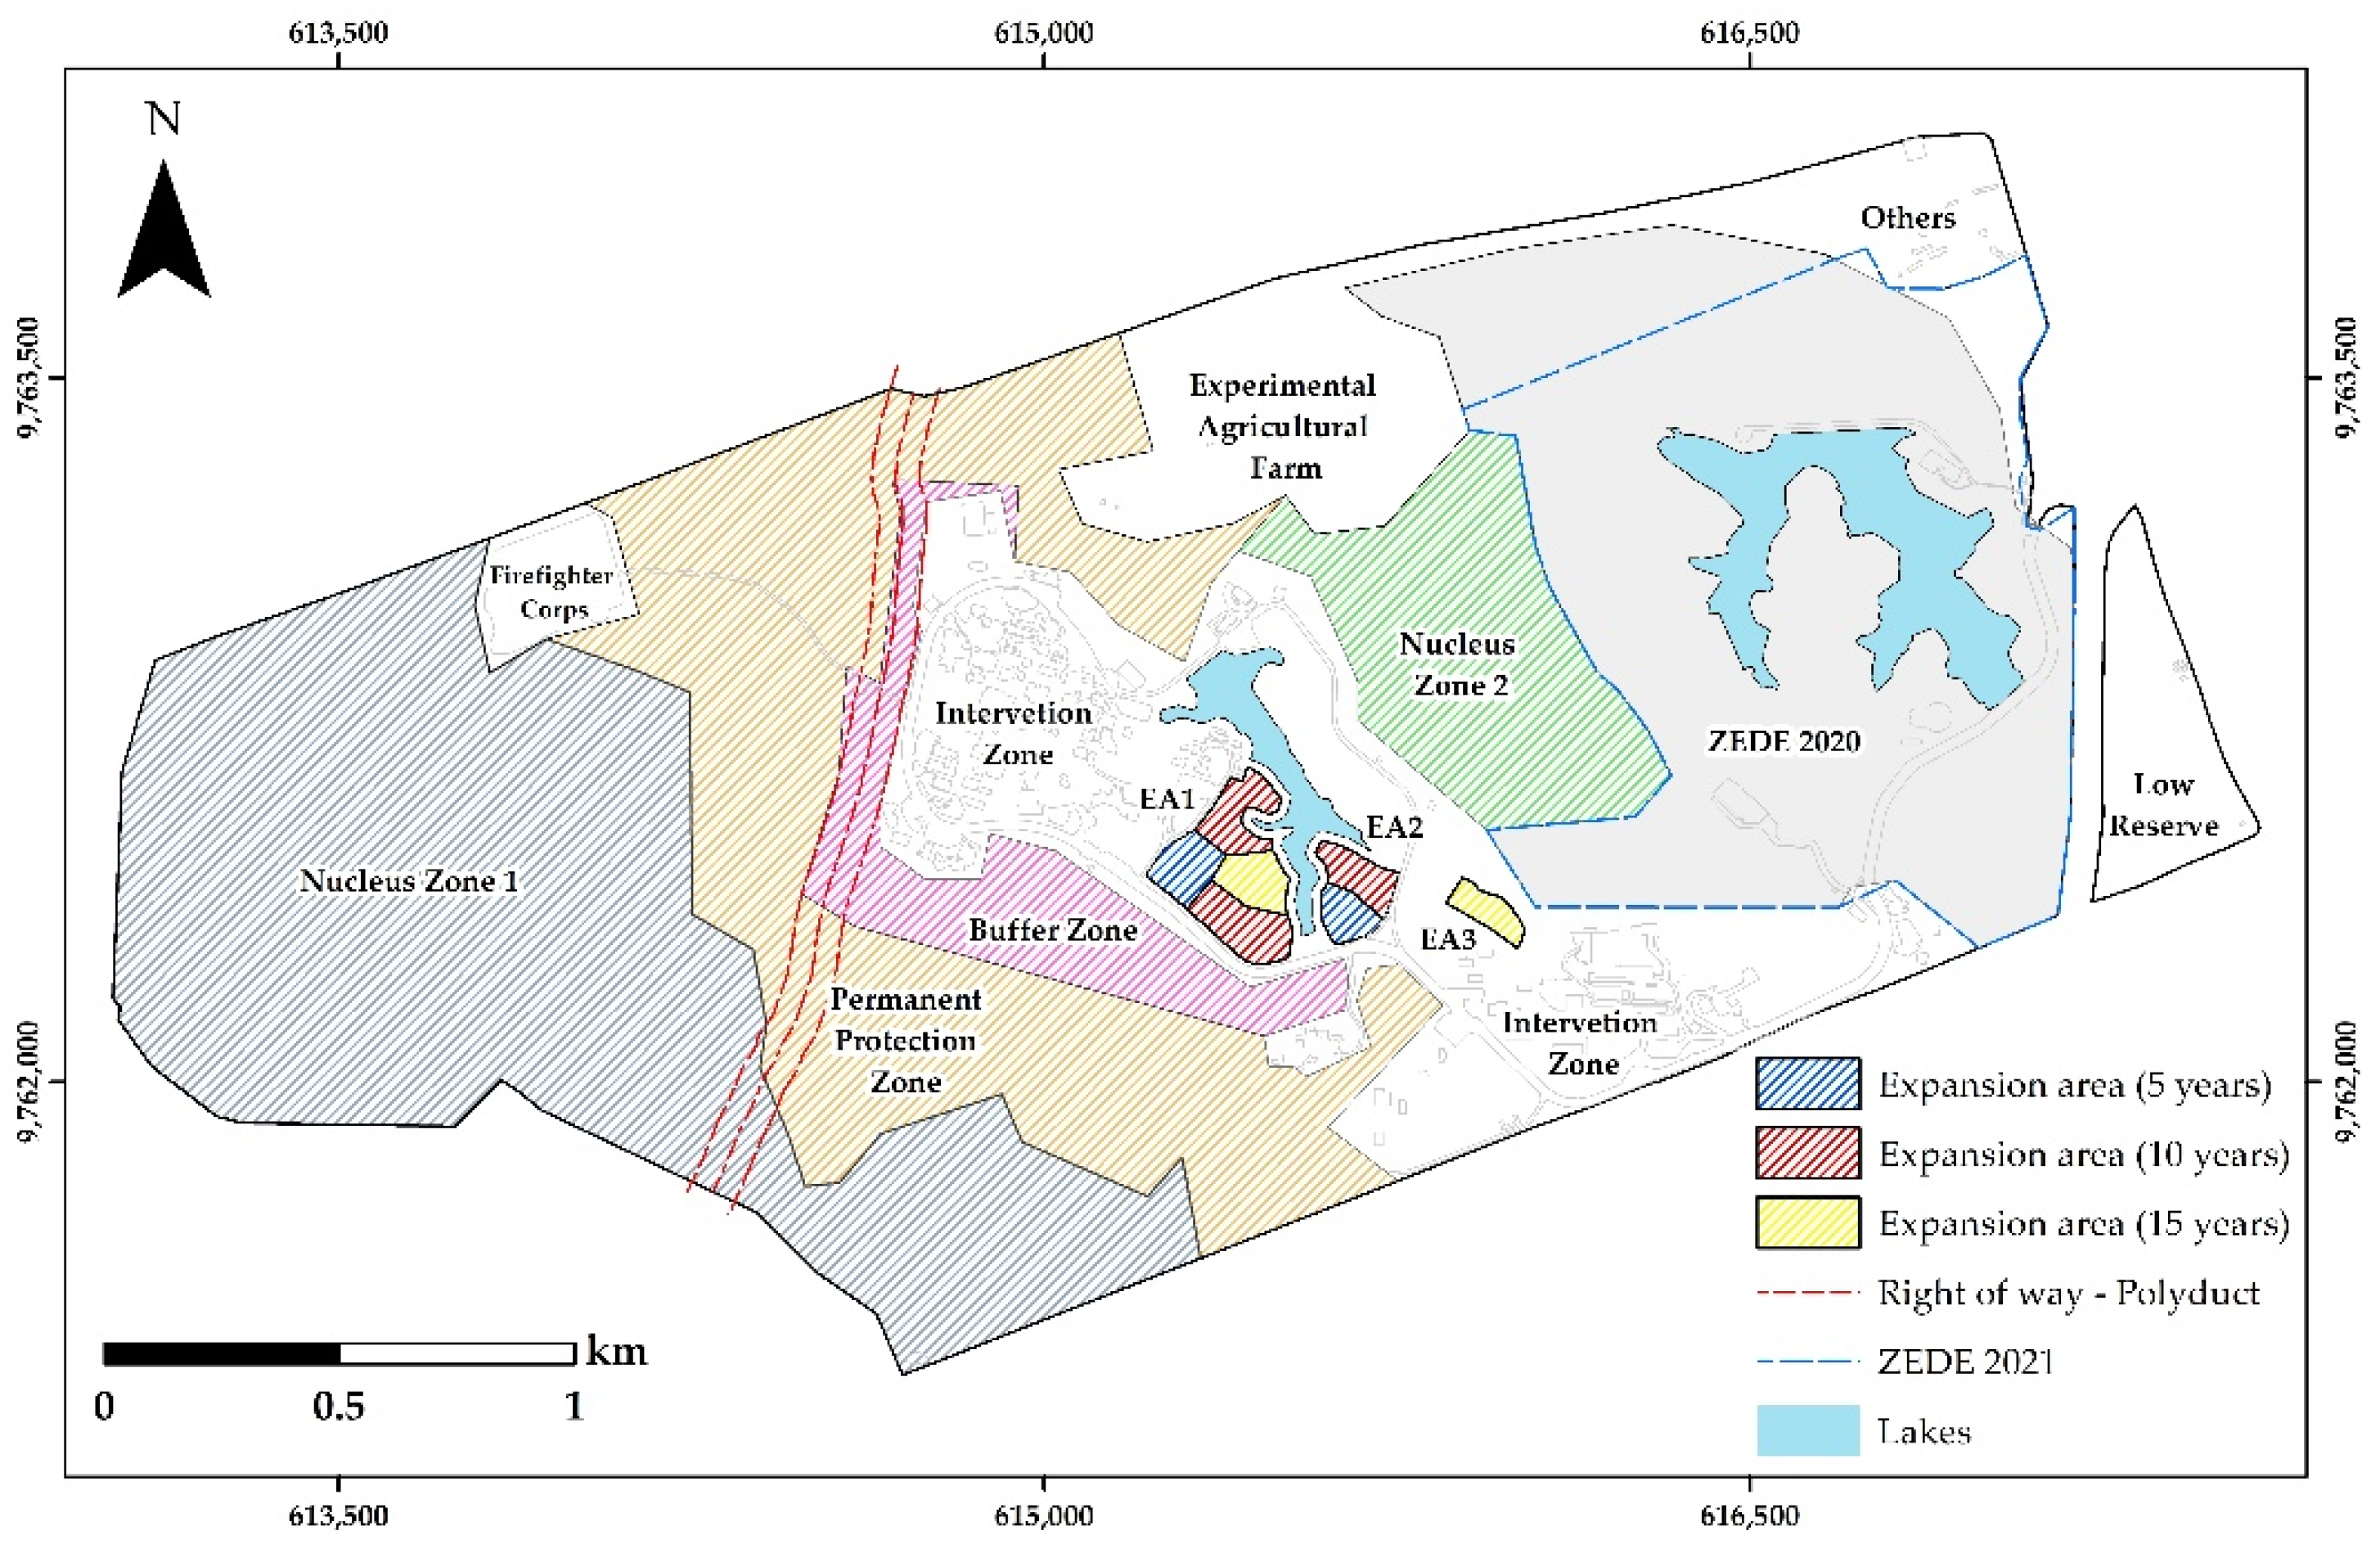
3.4. Definition of Expansion Areas
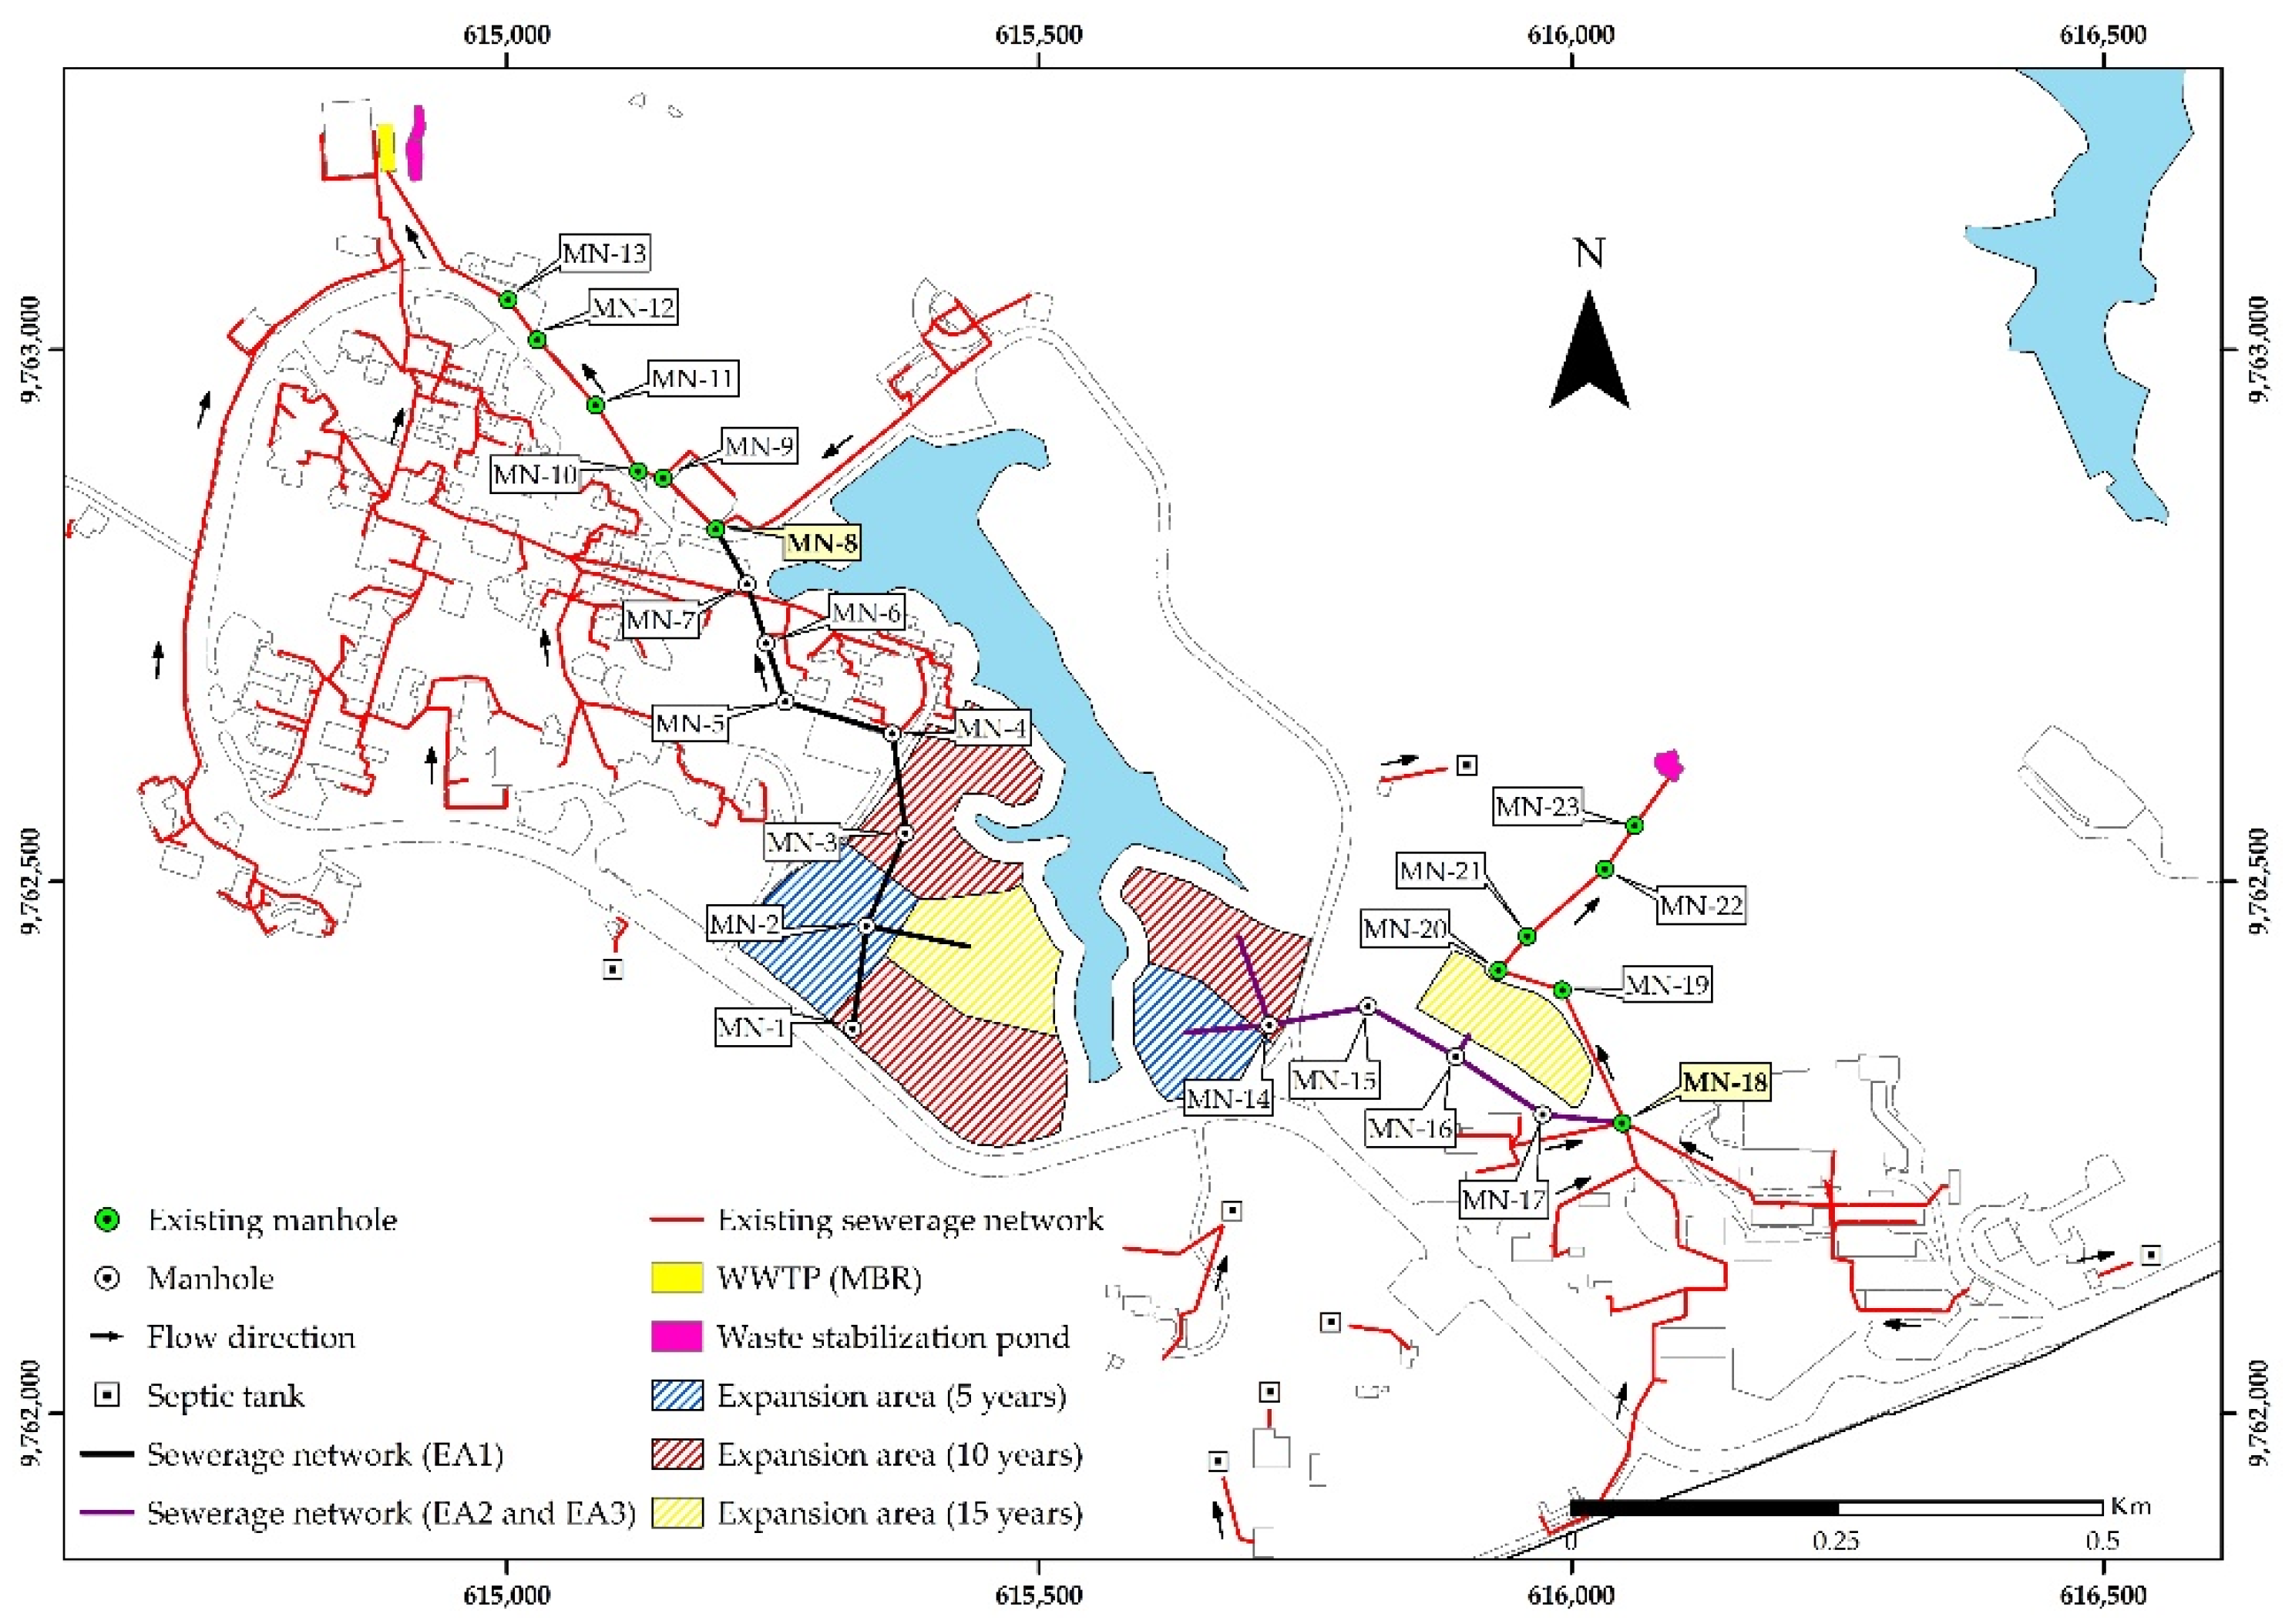
3.5. Sewerage Design in Expansion Areas
- Scenario 1: EA1 average flow vs. plant capacity during 6 h of operation.
- Scenario 2: EA1 design flow vs. plant capacity during 6 h of operation.
3.6. SWOT Analysis
4. Discussion
- Conduct evaluation studies of the sewerage system and treatment systems for the establishment of sustainable techniques in the management of wastewater, which supply the current and future demand, promoting the sustainable development of the campus.
- Promote effective water reuse through tertiary treatment systems, which contemplate the installation of green filters for future irrigation plans and agricultural experimentation. Unconventional treatments, such as nature-based treatment systems, represent efficient tools in wastewater purification with low implementation, operation and maintenance costs, as well as limited energy use [67,68,69]. Within these systems, the vegetation filters and soil application system or commonly called green filters, allow reaching levels of purification suitable for the reuse of water [70,71], through mechanisms of absorption in the soil, biodegradation and absorption by plants, processes responsible for eliminating contaminants in the water [72,73].
- Develop educational workshops on sustainable water management at the institutional and inter-institutional levels.
- Establish academic–business cooperation alliances to promote research and financing for projects that seek to implement the circular water economy.
- It is proposed that treated wastewater be used for irrigation of green areas and for studying crops in the area of the university’s Agricultural Experimental Farm due to its nutrients [74].
5. Conclusions
- (i)
- The sewerage system for the proposed EAs will be made up of 200 mm diameter pipes that will supply a maximum flow of 12.37 L/s for a design period of 15 years. The new discharge generated will be connected to two existing inspection wells, connected by pipes with adequate dimensions, guaranteeing the transport of residual water to the treatment systems.
- (ii)
- From the existing treatment systems, the WWTP-MBR and the adjoining pond system in CA1, together with the stabilisation pond located in CA2, will receive the new discharge from the proposed systems. Therefore, the evaluation of these systems, together with the SWOT analysis, included preventive, corrective, and predictive strategies: (i) evaluation of the capacity of the treatment systems, (ii) permanent analysis of water quality that guarantees the required removal percentages, and (iii) implementation of tertiary treatment systems that contemplate the effective reuse of water.
- (iii)
- The importance of the master plan is that it allows the identification of problems associated with poor management and improves it through a comprehensive management model that provides solutions based on technical and sustainable criteria, being the innovative part that opens the opportunity for studies carried out by the same students under the supervision of professionals; allowing to strengthen learning.
Author Contributions
Funding
Institutional Review Board Statement
Informed Consent Statement
Data Availability Statement
Acknowledgments
Conflicts of Interest
References
- UNICEF. Water Security for All; UNICEF: New York, NY, USA, 2021. [Google Scholar]
- UNESCO World Water Assessment Programme. Informe Mundial de Las Naciones Unidas Sobre El Desarrollo de Los Recursos Hídricos 2020: Agua y Cambio Climático; UNESCO: Paris, France, 2020. [Google Scholar]
- Organización de Naciones Unidas Objetivos de Desarrollo Sostenible. Available online: https://www.un.org/sustainabledevelopment/es/water-and-sanitation/ (accessed on 11 February 2022).
- Metcalf & Eddy Inc. Wastewater Engineering Treatment and Reuse, 4th ed.; McGraw-Hill: New York, NY, USA, 2003. [Google Scholar]
- Sette Ramalho, R. Tratamiento de Aguas Residuales, 2nd ed.; Reverte: Barcelona, Spain, 1996; ISBN 8429179755. [Google Scholar]
- Basiglini, E.; Pintore, M.; Forni, C. Effects of Treated Industrial Wastewaters and Temperatures on Growth and Enzymatic Activities of Duckweed (Lemna minor L.). Ecotoxicol. Environ. Saf. 2018, 153, 54–59. [Google Scholar] [CrossRef] [PubMed]
- Crini, G.; Lichtfouse, E. Advantages and Disadvantages of Techniques Used for Wastewater Treatment. Environ. Chem. Lett. 2019, 17, 145–155. [Google Scholar] [CrossRef]
- Marteleira, R.; Pinto, G.; Niza, S. Regional Water Flows—Assessing Opportunities for Sustainable Management. Resour. Conserv. Recycl. 2014, 82, 63–74. [Google Scholar] [CrossRef]
- Ait Kadi, M.; Ziyad, A. Integrated Water Resources Management in Morocco. In Global Water Security; Water Resources Development and Management, Ed.; Springer: Singapore, 2018; pp. 143–163. [Google Scholar]
- INTERAGUA. Informe Anual; INTERAGUA: Guayaquil, Ecuador, 2019. [Google Scholar]
- Peprah, C.; Oduro-Ofori, E.; Asante-Wusu, I. Analysis of Accessibility to Water Supply and Sanitation Services in the Awutu-Senya East Municipality, Ghana. J. Sustain. Dev. 2015, 8, 310. [Google Scholar] [CrossRef] [Green Version]
- Reymond, P.; Abdel Wahaab, R.; Moussa, M.S.; Lüthi, C. Scaling up Small Scale Wastewater Treatment Systems in Low- and Middle-Income Countries: An Analysis of Challenges and Ways Forward through the Case of Egypt. Util. Policy 2018, 52, 13–21. [Google Scholar] [CrossRef]
- Herrera-Franco, G.; Carrión-Mero, P.; Aguilar-Aguilar, M.; Morante-Carballo, F.; Jaya-Montalvo, M.; Morillo-Balsera, M.C. Groundwater Resilience Assessment in a Communal Coastal Aquifer System. The Case of Manglaralto in Santa Elena, Ecuador. Sustainability 2020, 12, 8290. [Google Scholar] [CrossRef]
- Herrera Franco, G.; Carrión Mero, P.; Briones Bitar, J. Management Practices for a Sustainable Community and Its Impact on Development, Manglaralto-Santa Elena, Ecuador. In Proceedings of the 17th LACCEI International Multi Conference for Engineering, Education, and Technology, Montego Bay, Jamaica, 24–26 July 2019. [Google Scholar]
- Smol, M.; Adam, C.; Preisner, M. Circular Economy Model Framework in the European Water and Wastewater Sector. J. Mater. Cycles Waste Manag. 2020, 22, 682–697. [Google Scholar] [CrossRef] [Green Version]
- Nelson, K.L.; Murray, A. Sanitation for Unserved Populations: Technologies, Implementation Challenges, and Opportunities. Annu. Rev. Environ. Resour. 2008, 33, 119–151. [Google Scholar] [CrossRef]
- Hernandez-Sancho, F.; Molinos-Senante, M.; Sala-Garrido, R. Cost Modelling for Wastewater Treatment Processes. Desalination 2011, 268, 1–5. [Google Scholar] [CrossRef]
- Hunter, R.G.; Day, J.W.; Wiegman, A.R.; Lane, R.R. Municipal Wastewater Treatment Costs with an Emphasis on Assimilation Wetlands in the Louisiana Coastal Zone. Ecol. Eng. 2019, 137, 21–25. [Google Scholar] [CrossRef]
- Moral Pajares, E.; Gallego Valero, L.; Román Sánchez, I. Cost of Urban Wastewater Treatment and Ecotaxes: Evidence from Municipalities in Southern Europe. Water 2019, 11, 423. [Google Scholar] [CrossRef] [Green Version]
- Zhang, R.; Xie, W.-M.; Yu, H.-Q.; Li, W.-W. Optimizing Municipal Wastewater Treatment Plants Using an Improved Multi-Objective Optimization Method. Bioresour. Technol. 2014, 157, 161–165. [Google Scholar] [CrossRef] [PubMed]
- Baah, K.; Dubey, B.; Harvey, R.; McBean, E. A Risk-Based Approach to Sanitary Sewer Pipe Asset Management. Sci. Total Environ. 2015, 505, 1011–1017. [Google Scholar] [CrossRef]
- Luque-Espinar, J.A.; Navas, N.; Chica-Olmo, M.; Cantarero-Malagón, S.; Chica-Rivas, L. Seasonal Occurrence and Distribution of a Group of ECs in the Water Resources of Granada City Metropolitan Areas (South of Spain): Pollution of Raw Drinking Water. J. Hydrol. 2015, 531, 612–625. [Google Scholar] [CrossRef]
- Meffe, R.; de Bustamante, I. Emerging Organic Contaminants in Surface Water and Groundwater: A First Overview of the Situation in Italy. Sci. Total Environ. 2014, 481, 280–295. [Google Scholar] [CrossRef]
- Reynolds, L.J.; Sala-Comorera, L.; Martin, N.A.; Nolan, T.M.; Stephens, J.H.; Gitto, A.; O’Hare, G.M.P.; O’Sullivan, J.J.; Meijer, W.G. Correlation between Antimicrobial Resistance and Faecal Contamination in Small Urban Streams and Bathing Waters. Sci. Total Environ. 2020, 739, 140242. [Google Scholar] [CrossRef]
- Wolf, L.; Zwiener, C.; Zemann, M. Tracking Artificial Sweeteners and Pharmaceuticals Introduced into Urban Groundwater by Leaking Sewer Networks. Sci. Total Environ. 2012, 430, 8–19. [Google Scholar] [CrossRef]
- Organización de las Naciones Unidas. Informe de La Comisión Mundial Sobre El Medio Ambiente y El Desarrollo: Nuestro Futuro Común; Oxford University Press: Oxford, UK, 1987. [Google Scholar]
- Herrera-Franco, G.; Alvarado, J.; Gordillo, P.; Veintimilla, L.; Merchan, B.; Carrión-Mero, P.; Berrezueta, E. Communication Methods on Water Care during the COVID-19 Pandemic and Its Impact on the Resilience of the Rural Community of “Libertador Bolívar”, Ecuador. In Sustainable Water Resources Management XI; WIT Press: Southampton, UK, 2021; pp. 109–118. [Google Scholar]
- Garcia-Cuerva, L.; Berglund, E.Z.; Binder, A.R. Public Perceptions of Water Shortages, Conservation Behaviors, and Support for Water Reuse in the U.S. Resour. Conserv. Recycl. 2016, 113, 106–115. [Google Scholar] [CrossRef] [Green Version]
- Nguyen, T.T.; Ngo, H.H.; Guo, W.; Wang, X.C.; Ren, N.; Li, G.; Ding, J.; Liang, H. Implementation of a Specific Urban Water Management-Sponge—City. Sci. Total Environ. 2019, 652, 147–162. [Google Scholar] [CrossRef]
- Gricelda, H.F.; Paúl, C.M.; Niurka, A.M. Participatory Process for Local Development: Sustainability of Water Resources in Rural Communities: Case Manglaralto-Santa Elena, Ecuador. In Handbook of Sustainability Science and Research; Filho, W.L., Ed.; Springer: Cham, Switzerland, 2018; pp. 663–676. [Google Scholar] [CrossRef]
- Naciones Unidas. Informe de Los Objetivos de Desarrollo Sostenible; United Nations: New York, NY, USA, 2019. [Google Scholar]
- Organización de las Naciones Unidas para la Educación, la C. y la C. No Dejar a Nadie Atrás; UNESCO: Paris, France, 2019. [Google Scholar]
- Agencia de Protección Ambiental de los Estado Unidos Usando El Agua Eficientemente. Available online: https://espanol.epa.gov/watersense/usando-el-agua-eficientemente (accessed on 5 April 2022).
- Lara Cabrea, N. Tratamiento Piloto de Aguas Grises Domésticas Para Reúso En Inodoros y Áreas Verdes; Universidad Alas Peruanas: Trujillo, Peru, 2017. [Google Scholar]
- Meléndez-Pérez, J.A.; Lemos-Lima, M.M.C.; Dominguez, I.; Oviedo-Ocaña, E.R. Reutilización de Aguas Grises Domésticas Para El Uso Eficiente Del Recurso Hídrico: Aceptación Social y Análisis Financiero. Un Caso En Portugal. Rev. UIS Ing. 2019, 18, 223–236. [Google Scholar] [CrossRef]
- Ezzat, S.M.; Elkorashey, R.M. Wastewater as a Non-Conventional Resource: Impact of Trace Metals and Bacteria on Soil, Plants, and Human Health. Hum. Ecol. Risk Assess. An Int. J. 2020, 26, 2245–2265. [Google Scholar] [CrossRef]
- Ofori, S.; Puškáčová, A.; Růžičková, I.; Wanner, J. Treated Wastewater Reuse for Irrigation: Pros and Cons. Sci. Total Environ. 2021, 760, 144026. [Google Scholar] [CrossRef] [PubMed]
- Porcelli, A.M.; Martínez, A.N. Análisis Legislativo Del Paradigma de La Economía Circular. Rev. Direito GV 2018, 14, 1067–1105. [Google Scholar] [CrossRef]
- González Ordaz, G.I.; Vargas Hernández, J. La Economía Circular Como Factor de La Responsabilidad Social. Econ. Coyunt. 2017, 2, 105–130. [Google Scholar]
- Che, W.; Zhao, Y.; Yang, Z.; Li, J.; Shi, M. Integral Stormwater Management Master Plan and Design in an Ecological Community. J. Environ. Sci. 2014, 26, 1818–1823. [Google Scholar] [CrossRef] [PubMed]
- Huang, Z.; Yu, H.; Peng, Z.; Zhao, M. Methods and Tools for Community Energy Planning: A Review. Renew. Sustain. Energy Rev. 2015, 42, 1335–1348. [Google Scholar] [CrossRef]
- Marques Arsénio, A.; Câmara Salim, I.; Hu, M.; Pedro Matsinhe, N.; Scheidegger, R.; Rietveld, L. Mitigation Potential of Sanitation Infrastructure on Groundwater Contamination by Nitrate in Maputo. Sustainability 2018, 10, 858. [Google Scholar] [CrossRef] [Green Version]
- Nie, L. Enhancing Urban Flood Resilience—A Case Study for Policy Implementation. Proc. Inst. Civ. Eng. Water Manag. 2016, 169, 85–93. [Google Scholar] [CrossRef]
- ESPOL Bosque Protector “La Prosperina”. Available online: http://www.bosqueprotector.espol.edu.ec/biodiversidad/ (accessed on 12 May 2022).
- López Alaña, J.; Zambrano Figueroa, C. Análisis Del Sistema Existente y Diseños de Optimización Del Sistema Matriz de Agua Potable de La ESPOL; Escuela Superior Politécnica del Litoral: Guayaquil, Ecuador, 2021. [Google Scholar]
- Instituto Ecuatoriano de Normalización. Norma Para Estudio y Diseño de Agua Potable y Disposición de Agua Residuales Para Poblaciones Mayores a 1000 Habitantes; Instituto Ecuatoriano de Normalización: Quito, Ecuador, 1992.
- Ministerio del Ambiente Agua y Transición Ecológica del Ecuador. Revisión Del Anexo 1 Del Libro vi Del Texto Unificado de Legislación Secundaria Del Ministerio Del Ambiente: Norma de Calidad Ambiental y Descarga de Efluentes Al Recurso Agua; Ministerio del Ambiente Agua y Transición Ecológica del Ecuador: Quito, Ecuador, 2015.
- Ministerio de Desarrollo Urbano y Vivienda del Ecuador. Norma Hidrosanitaria NHE Agua; Ministerio de Desarrollo Urbano y Vivienda del Ecuador: Quito, Ecuador, 2011.
- Avalos Sánchez, R.I.; Guerrero Bermúdez, R.A. Diagnóstico y Propuesta de Soluciones Técnicas Para El Sistema de Aguas Servidas Del Campus Gustavo Galindo; Escuela Superior Politécnica del Litoral: Guayaquil, Ecuador, 2020. [Google Scholar]
- Arias Vivanco, V.A.; Fernández Cuesta, A.d.C.; Merchán Sanmartin, B. Análisis y Diseño de Optimización Del Sistema Depurador de Aguas Residuales de La Zona 2 y 4 de ESPOL; Escuela Superior Politécnica del Litoral: Guayaquil, Ecuador, 2021. [Google Scholar]
- INTERAGUA. Manual de Diseño de Redes de Alcantarillado; INTERAGUA: Guayaquil, Ecuador, 2015. [Google Scholar]
- Dyson, R.G. Strategic Development and SWOT Analysis at the University of Warwick. Eur. J. Oper. Res. 2004, 152, 631–640. [Google Scholar] [CrossRef]
- Escuela Superior Politécnica del Litoral (ESPOL) Gerencia de Planificación Estratégica—ESPOL. Available online: http://planificacion.espol.edu.ec/historicoirc (accessed on 12 May 2022).
- Quiñonez Zambrano, J.K.; Vintimilla Peña, A.A. Análisis Del Sistema Existente y Propuesta Del Sistema Depurador Para Las Aguas Residuales Del Área de Tecnologías de La ESPOL; Escuela Superior Politécnica del Litoral: Guayaquil, Ecuador, 2020. [Google Scholar]
- Merchán-Sanmartín, B.; Aguilar-Aguilar, M.; Morante-Carballo, F.; Carrión-Mero, P.; Guambaña-Palma, J.; Mestanza-Solano, D.; Berrezueta, E. Design of Sewerage System and Wastewater Treatment in a Rural Sector: A Case Study. Int. J. Sustain. Dev. Plan. 2022, 17, 51–61. [Google Scholar] [CrossRef]
- Crombet Grillet, S.; Abalos Rodríguez, A.; Rodríguez Pérez, S.; Pérez Pompa, N. Evaluación Del Tratamiento Anaerobio de Las Aguas Residuales de Una Comunidad Universitaria. Rev. Colomb. Biotecnol. 2016, 18, 49–56. [Google Scholar] [CrossRef]
- Goli, A.; Shamiri, A.; Khosroyar, S.; Talaiekhozani, A.; Azizi, K.; Sanaye, R. A Review on Different Aerobic and Anaerobic Treatment Methods in Dairy Industry Wastewater. J. Environ. Treat. Tech. 2019, 7, 113–141. [Google Scholar]
- Zhao, K.; Wu, Y.W.; Young, S.; Chen, X.J. Biological Treatment of Dairy Wastewater: A Mini Review. J. Environ. Inform. Lett. 2020, 4, 22–31. [Google Scholar] [CrossRef]
- Galván-Arzola, U.; Miramontes-Martínez, L.R.; Escamilla-Alvarado, C.; Botello-Álvarez, J.E.; Alcalá-Rodríguez, M.M.; Valencia-Vázquez, R.; Rivas-García, P. Anaerobic Digestion of Agro-Industrial Waste: Anaerobic Lagoons in Latin America. Rev. Mex. Ing. Química 2022, 21, IA2680. [Google Scholar]
- Owusu-Twum, M.Y.; Sharara, M.A. Sludge Management in Anaerobic Swine Lagoons: A Review. J. Environ. Manage. 2020, 271, 110949. [Google Scholar] [CrossRef] [PubMed]
- Wang, S. Values of Decentralized Systems That Avoid Investments in Idle Capacity within the Wastewater Sector: A Theoretical Justification. J. Environ. Manag. 2014, 136, 68–75. [Google Scholar] [CrossRef]
- Maurer, M. Specific Net Present Value: An Improved Method for Assessing Modularisation Costs in Water Services with Growing Demand. Water Res. 2009, 43, 2121–2130. [Google Scholar] [CrossRef]
- Panebianco, S.; Pahl-Wostl, C. Modelling Socio-Technical Transformations in Wastewater Treatment—A Methodological Proposal. Technovation 2006, 26, 1090–1100. [Google Scholar] [CrossRef]
- Deng, Y.; Cardin, M.-A.; Babovic, V.; Santhanakrishnan, D.; Schmitter, P.; Meshgi, A. Valuing Flexibilities in the Design of Urban Water Management Systems. Water Res. 2013, 47, 7162–7174. [Google Scholar] [CrossRef]
- Fane, A.G.; Fane, S.A. The Role of Membrane Technology in Sustainable Decentralized Wastewater Systems. Water Sci. Technol. 2005, 51, 317–325. [Google Scholar] [CrossRef]
- Marques, J.; Cunha, M.; Savić, D. Using Real Options in the Optimal Design of Water Distribution Networks. J. Water Resour. Plan. Manag. 2015, 141, 1–10. [Google Scholar] [CrossRef] [Green Version]
- Crites, R.W.; Middlebrooks, E.J.; Reed, S.C. Natural Wastewater Treatment Systems; CRC Press: Boca Raton, FL, USA, 2010; ISBN 9780429189197. [Google Scholar]
- Martínez-Hernández, V.; Leal, M.; Meffe, R.; de Miguel, A.; Alonso-Alonso, C.; de Bustamante, I.; Lillo, J.; Martín, I.; Salas, J.J. Removal of Emerging Organic Contaminants in a Poplar Vegetation Filter. J. Hazard. Mater. 2018, 342, 482–491. [Google Scholar] [CrossRef] [PubMed]
- Viccaro, M.; Cozzi, M.; Caniani, D.; Masi, S.; Mancini, I.; Caivano, M.; Romano, S. Wastewater Reuse: An Economic Perspective to Identify Suitable Areas for Poplar Vegetation Filter Systems for Energy Production. Sustainability 2017, 9, 2161. [Google Scholar] [CrossRef] [Green Version]
- de Miguel, A.; Meffe, R.; Leal, M.; González-Naranjo, V.; Martínez-Hernández, V.; Lillo, J.; Martín, I.; Salas, J.J.; de Bustamante, I. Treating Municipal Wastewater through a Vegetation Filter with a Short-Rotation Poplar Species. Ecol. Eng. 2014, 73, 560–568. [Google Scholar] [CrossRef]
- Bustamante, I. Land Application: Its Effectiveness in Purification of Urban and Industrial Wastewaters in La Mancha, Spain. Environ. Geol. Water Sci. 1990, 16, 179–185. [Google Scholar] [CrossRef]
- Pradana, R.; Hernández-Martín, J.A.; Martínez-Hernández, V.; Meffe, R.; de Santiago-Martín, A.; Pérez Barbón, A.; de Bustamante, I. Attenuation Mechanisms and Key Parameters to Enhance Treatment Performance in Vegetation Filters: A Review. J. Environ. Manag. 2021, 300, 113752. [Google Scholar] [CrossRef]
- Kibuye, F.A.; Gall, H.E.; Elkin, K.R.; Ayers, B.; Veith, T.L.; Miller, M.; Jacob, S.; Hayden, K.R.; Watson, J.E.; Elliott, H.A. Fate of Pharmaceuticals in a Spray-Irrigation System: From Wastewater to Groundwater. Sci. Total Environ. 2019, 654, 197–208. [Google Scholar] [CrossRef]
- Escuela Superior Politécnica del Litoral Granja Experimental de ESPOL, Espacio Que Beneficia a Estudiantes, Investigadores y Agricultores Del País. Available online: http://www.espol.edu.ec/noticias/granja-experimental-de-espol-espacio-que-beneficia-estudiantes-investigadores-y (accessed on 8 June 2022).
- Carr, R.M.; Blumenthal, U.J.; Duncan Mara, D. Guidelines for the Safe Use of Wastewater in Agriculture: Revisiting WHO Guidelines. Water Sci. Technol. 2004, 50, 31–38. [Google Scholar] [CrossRef] [Green Version]
- Cirelli, G.L.; Consoli, S.; Licciardello, F.; Aiello, R.; Giuffrida, F.; Leonardi, C. Treated Municipal Wastewater Reuse in Vegetable Production. Agric. Water Manag. 2012, 104, 163–170. [Google Scholar] [CrossRef]
- Khanpae, M.; Karami, E.; Maleksaeidi, H.; Keshavarz, M. Farmers’ Attitude towards Using Treated Wastewater for Irrigation: The Question of Sustainability. J. Clean. Prod. 2020, 243, 118541. [Google Scholar] [CrossRef]
- Dou, T.; Troesch, S.; Petitjean, A.; Gábor, P.T.; Esser, D. Wastewater and Rainwater Management in Urban Areas: A Role for Constructed Wetlands. Procedia Environ. Sci. 2017, 37, 535–541. [Google Scholar] [CrossRef]
- ElZein, Z.; Abdou, A.; ElGawad, I.A. Constructed Wetlands as a Sustainable Wastewater Treatment Method in Communities. Procedia Environ. Sci. 2016, 34, 605–617. [Google Scholar] [CrossRef] [Green Version]
- Boyer, T.; Polasky, S. Valuing Urban Wetlands: A Review of Non-Market Valuation Studies. Wetlands 2004, 24, 744–755. [Google Scholar] [CrossRef]
- Stefanakis, A. The Role of Constructed Wetlands as Green Infrastructure for Sustainable Urban Water Management. Sustainability 2019, 11, 6981. [Google Scholar] [CrossRef] [Green Version]
- Septiariva, I.Y.; Suryawan, I.W.K.; Suhardono, S.; Sofiyah, E.S.; Zahra, N.L. Strategy and Master Plan for Water Supply and Domestic Wastewater in Klungkung Regency, Bali. IOP Conf. Ser. Mater. Sci. Eng. 2021, 1096, 012058. [Google Scholar] [CrossRef]
- van der Wulp, S.A.; Dsikowitzky, L.; Hesse, K.J.; Schwarzbauer, J. Master Plan Jakarta, Indonesia: The Giant Seawall and the Need for Structural Treatment of Municipal Waste Water. Mar. Pollut. Bull. 2016, 110, 686–693. [Google Scholar] [CrossRef]
- Services of the San Francisco Public Utilities Commission. City and County of San Francisco 2030 Sewer System Master Plan; Services of the San Francisco Public Utilities Commission: San Francisco, CA, USA, 2010.
- Peter, L.L.; Yang, Y. Urban Planning Historical Review of Master Plans and the Way towards a Sustainable City: Dar Es Salaam, Tanzania. Front. Archit. Res. 2019, 8, 359–377. [Google Scholar] [CrossRef]
- Tian, L.; Shen, T. Evaluation of Plan Implementation in the Transitional China: A Case of Guangzhou City Master Plan. Cities 2011, 28, 11–27. [Google Scholar] [CrossRef]
- Nguyen, L.H.; Tran, V.N.T. Evaluating Future Water Quality of Urban Rivers in Hanoi under Effect of Urbanization and Climate Change—the Application of Weap Model for Cau Bay River. Vietnam J. Sci. Technol. 2020, 58, 195. [Google Scholar] [CrossRef]
- INTERAGUA C. Ltda. Ajuste y Revisión Del Plan Maestro de Agua Potable, Alcantarillado Sanitario y Alcantarillado Pluvial. Tomo I; INTERAGUA C. Ltda.: Guayaquil, Ecuador, 2011. [Google Scholar]
- Guerrero-Latorre, L.; Ballesteros, I.; Villacrés-Granda, I.; Granda, M.G.; Freire-Paspuel, B.; Ríos-Touma, B. SARS-CoV-2 in River Water: Implications in Low Sanitation Countries. Sci. Total Environ. 2020, 743, 140832. [Google Scholar] [CrossRef]
- Donoso, J.M.; Rios-Touma, B. Microplastics in Tropical Andean Rivers: A Perspective from a Highly Populated Ecuadorian Basin without Wastewater Treatment. Heliyon 2020, 6, e04302. [Google Scholar] [CrossRef] [PubMed]
- Jerves-Cobo, R.; Lock, K.; Van Butsel, J.; Pauta, G.; Cisneros, F.; Nopens, I.; Goethals, P.L.M. Biological Impact Assessment of Sewage Outfalls in the Urbanized Area of the Cuenca River Basin (Ecuador) in Two Different Seasons. Limnologica 2018, 71, 8–28. [Google Scholar] [CrossRef]
- Capparelli, M.V.; Cipriani-Avila, I.; Jara-Negrete, E.; Acosta-López, S.; Acosta, B.; Pérez-González, A.; Molinero, J.; Pinos-Vélez, V. Emerging Contaminants in the Northeast Andean Foothills of Amazonia: The Case of Study of the City of Tena, Napo, Ecuador. Bull. Environ. Contam. Toxicol. 2021, 107, 2–10. [Google Scholar] [CrossRef] [PubMed]
- Montalvo-Cedillo, C.; Jerves-Cobo, R.; Domínguez-Granda, L. Determination of Pollution Loads in Spillways of the Combined Sewage Network of the City of Cuenca, Ecuador. Water 2020, 12, 2540. [Google Scholar] [CrossRef]
- Stumpf, C.H.; Gonzalez, R.A.; Noble, R.T. Investigating the Coastal Water Quality of the Galapagos Islands, Ecuador. In Science and Conservation in the Galapagos Islands; Springer: Cham, Switzerland, 2013; pp. 173–184. [Google Scholar]
- Merchán, B.; Ullauri, P.; Amaya, F.; Dender, L.; Carrión, P.; Berrezueta, E. Design of a Sewage and Wastewater Treatment System for Pollution Mitigation in El Rosario, El Empalme, Ecuador. WIT Trans. Ecol. Environ. 2021, 251, 77–85. [Google Scholar]
- Morante Carballo, F.; Marcatoma Brito, L.; Carrión Mero, P.; Aguilar Aguilar, M.; Tumbaco Ramírez, J. Urban Wastewater Treatment through a System of Green Filters in the Montañita Commune, Santa Elena, Ecuador. WIT Trans. Ecol. Environ. 2019, 239, 233–249. [Google Scholar] [CrossRef] [Green Version]
- Jerves-Cobo, R.; Benedetti, L.; Amerlinck, Y.; Lock, K.; De Mulder, C.; Van Butsel, J.; Cisneros, F.; Goethals, P.; Nopens, I. Integrated Ecological Modelling for Evidence-Based Determination of Water Management Interventions in Urbanized River Basins: Case Study in the Cuenca River Basin (Ecuador). Sci. Total Environ. 2020, 709, 136067. [Google Scholar] [CrossRef]
- U.I. Greenmetric UI Greenmetric World University Ranking. Available online: https://greenmetric.ui.ac.id/rankings/ranking-by-region-2021/latin_america (accessed on 3 July 2022).
- Morante-Carballo, F.; Merchán-Sanmartín, B.; Cárdenas-Cruz, A.; Jaya-Montalvo, M.; Mata-Perelló, J.; Herrera-Franco, G.; Carrión-Mero, P. Sites of Geological Interest Assessment for Geoeducation Strategies, ESPOL University Campus, Guayaquil, Ecuador. Land 2022, 11, 771. [Google Scholar] [CrossRef]
- Carrión-Mero, P.; Morante-Carballo, F.; Palomeque-Arévalo, P.; Apolo-Masache, B. Environmental Assessment and Tourist Carrying Capacity for the Development of Geosites in the Framework of Geotourism, Guayaquil, Ecuador. WIT Trans. Ecol. Environ. 2021, 253, 149–160. [Google Scholar]
- Avelar, S.; Vasconcelos, C.; Mansur, K.L.; Anjos, S.C.; Vasconcelos, G.F. Targeting Sustainability Issues at Geosites: A Study in Região Dos Lagos, Rio de Janeiro, Brazil. Geoheritage 2018, 10, 1–9. [Google Scholar] [CrossRef]
- Esteban Ibáñez, M.; Musitu Ferrer, D.; Amador Muñoz, L.V.; Claros, F.M.; Olmedo Ruiz, F.J. University as Change Manager of Attitudes towards Environment (The Importance of Environmental Education). Sustainability 2020, 12, 4568. [Google Scholar] [CrossRef]


| Zone | Z1 | Z2 | Z3 | Z4 | Z5 | Z6 | Z7 | Z8 | Z9 | Z10 | Z11 | Z12 | Z13 | Z14 |
|---|---|---|---|---|---|---|---|---|---|---|---|---|---|---|
| Population | 93 | 2430 | 2335 | 59 | 619 | 144 | 31 | 2997 | 2911 | 33 | 2640 | 2761 | 1205 | 774 |
| Area | Type of Treatment System | Description |
|---|---|---|
| CA1 | Membrane biological reactor wastewater treatment plant (WWTP-MBR) |
|
| Pond systems |
| |
| CA2 | Stabilisation ponds |
|
| CA3 | Dissolved air flotation wastewater treatment plant (WWTP-DAF) |
|
| CA4 | WWTP—total oxidation activated sludge | Currently not operational. |
| The entire campus | Septic tank | They require cleaning and maintenance. |
| Parameter | Unity | Concentration at the Entrance (Domestic Wastewater) | Outlet Concentration (Purified Effluent) | Current Use |
|---|---|---|---|---|
| TSS | mg/L | 236 | 14 | Lawn irrigation |
| COD | mgO2/L | 594 | 70 | |
| BOD5 | mgO2/L | 350 | 60 |
| Area | Type of Treatment System | Description |
|---|---|---|
| CA1 | WWTP-MBR |
|
| Pond systems |
| |
| CA2 | Stabilisation ponds |
|
| The entire campus | Septic tank |
|
| Zone | Year 2019 | Year 2035 | ||||||
|---|---|---|---|---|---|---|---|---|
| Population | Delimited Area [ha] | Populated Area [ha] | Green Area [ha] | Population | Delimited Area [ha] | Populated Area [ha] | Green Area [ha] | |
| Total ZEDE | 93 | 133 | 2.57 | 130.43 | 1517 | 133 | 46 | 87 |
| Total ESPOL | 18,935 | 524.99 | 14.80 | 510.19 | 24,699 | 524.99 | 25.36 | 499.63 |
| Total | 19,028 | 657.99 | 17.37 | 640.62 | 26,216 | 657.99 | 71.36 | 586.63 |
| Density [people/ha] | 28.92 | 39.84 | ||||||
| Expansion Zone | Endowment | Coefficient of Return (CR) | Population | Area | Coefficient of Manning (n) |
|---|---|---|---|---|---|
| 1 | 62.5 | 0.8 | 3760 | 7.04 | 0.013 |
| 2–3 | 62.5 | 0.8 | 1914 | 3.57 | 0.013 |
| Segment | Population | Qavg (L/s) | F | Qmax (L/s) | Qinf (L/s) | Qilli (L/s) | Qdes (L/s) | Qdes (m3/s) | |
|---|---|---|---|---|---|---|---|---|---|
| MN-1 | MN-2 | 518 | 0.45 | 3.97 | 1.78 | 0.097 | 0.097 | 1.98 | 0.0020 |
| MN-2 | MN-3 | 940 | 0.82 | 3.82 | 3.11 | 0.176 | 0.176 | 3.47 | 0.0035 |
| MN-3 | MN-4 | 1597 | 1.39 | 3.66 | 5.07 | 0.299 | 0.299 | 5.67 | 0.0057 |
| MN-4 | MN-5 | 2142 | 1.86 | 3.56 | 6.62 | 0.401 | 0.401 | 7.43 | 0.0074 |
| MN-5 | MN-6 | 2729 | 2.37 | 3.48 | 8.24 | 0.511 | 0.511 | 9.26 | 0.0093 |
| MN-6 | MN-7 | 3263 | 2.83 | 3.41 | 9.66 | 0.611 | 0.611 | 10.88 | 0.0109 |
| MN-7 | MN-8 | 3760 | 3.26 | 3.36 | 10.96 | 0.704 | 0.704 | 12.37 | 0.0124 |
| Segment | Length (m) | Qdes (m3/s) | S (m/m) | Ødes (m) | Øext (m) | Øint (m) | v (m/s) | τ (N/m2) | Auto Cleaning | Non Erosion | ||
|---|---|---|---|---|---|---|---|---|---|---|---|---|
| vmin ≥ 0.6 | τ ≥ 1.2 | vmax ≤ 2.5 | ||||||||||
| MN-1 | MN-2 | 97.38 | 0.0020 | 0.030 | 0.06 | 0.24 | 0.2 | 0.72 | 5.44 | OK | OK | OK |
| MN-2 | MN-3 | 94.78 | 0.0035 | 0.019 | 0.08 | 0.24 | 0.2 | 0.73 | 4.94 | |||
| MN-3 | MN-4 | 94.23 | 0.0057 | 0.020 | 0.09 | 0.24 | 0.2 | 0.84 | 6.18 | |||
| MN-4 | MN-5 | 104.56 | 0.0074 | 0.010 | 0.11 | 0.24 | 0.2 | 0.71 | 3.97 | |||
| MN-5 | MN-6 | 58.02 | 0.0093 | 0.015 | 0.12 | 0.24 | 0.2 | 0.86 | 5.75 | |||
| MN-6 | MN-7 | 58.02 | 0.0109 | 0.011 | 0.13 | 0.24 | 0.2 | 0.81 | 4.96 | |||
| MN-7 | MN-8 | 64.02 | 0.0124 | 0.015 | 0.13 | 0.24 | 0.2 | 0.94 | 6.67 | |||
| Segment | Qexisting (L/s) | Qadditonial (L/s) | QTotal (L/s) | Øcalculated (mm) | Øexisting (mm) | Complies | Øadopted (mm) | |
|---|---|---|---|---|---|---|---|---|
| MN-8 | MN-9 | 1.65 | 12.98 | 14.63 | 130.0 | 200 | OK | 200 |
| MN-9 | MN-10 | 3.14 | 12.98 | 16.12 | 146.9 | |||
| MN-10 | MN-11 | 3.15 | 12.98 | 16.13 | 147.0 | |||
| MN-11 | MN-12 | 3.20 | 12.98 | 16.18 | 147.1 | |||
| MN-12 | MN-13 | 3.28 | 12.98 | 16.26 | 147.4 | |||
| Segment | S (m/m) | v (m/s) | τ (N/m2) | Auto Cleaning | Non Erosion | ||
|---|---|---|---|---|---|---|---|
| vmin ≥ 0.6 | τ ≥ 1.2 | vmax ≤ 2.5 | |||||
| MN-8 | MN-9 | 0.0095 | 1.09 | 4.28 | OK | OK | OK |
| MN-9 | MN-10 | 0.006 | 0.95 | 3.05 | |||
| MN-10 | MN-11 | 0.006 | 0.95 | 3.05 | |||
| MN-11 | MN-12 | 0.006 | 0.95 | 3.05 | |||
| MN-12 | MN-13 | 0.006 | 0.95 | 3.05 | |||
| Segment | Population | Qavg (L/s) | F | Qmax (L/s) | Qinf (L/s) | Qilli (L/s) | Qdes (L/s) | Qdes (m3/s) | |
|---|---|---|---|---|---|---|---|---|---|
| MN-14 | MN-15 | 1340 | 1.16 | 3.71 | 4.32 | 0.25 | 0.25 | 4.82 | 0.0048 |
| MN-15 | MN-16 | 1340 | 1.16 | 3.71 | 4.32 | 0.25 | 0.25 | 4.82 | 0.0048 |
| MN-16 | MN-17 | 1914 | 1.66 | 3.60 | 5.98 | 0.36 | 0.36 | 6.70 | 0.0067 |
| MN-17 | MN-18 | 1914 | 1.66 | 3.60 | 5.98 | 0.36 | 0.36 | 6.70 | 0.0067 |
| Segment | Length (m) | Qdes (m3/s) | S (m/m) | Ødes (m) | Øext (m) | Øint (m) | v (m/s) | τ (N/m2) | Auto Cleaning | Non Erosion | ||
|---|---|---|---|---|---|---|---|---|---|---|---|---|
| vmin ≥ 0.6 | τ ≥ 1.2 | vmax ≤ 2.5 | ||||||||||
| MN-14 | MN-15 | 94.1 | 0.0048 | 0.01 | 0.097 | 0.22 | 0.2 | 0.63 | 3.36 | OK | OK | OK |
| MN-15 | MN-16 | 95.03 | 0.0048 | 0.01 | 0.097 | 0.22 | 0.2 | 0.63 | 3.36 | |||
| MN-16 | MN-17 | 98.29 | 0.0067 | 0.009 | 0.112 | 0.22 | 0.2 | 0.66 | 3.44 | |||
| MN-17 | MN-18 | 75.24 | 0.0067 | 0.01 | 0.110 | 0.22 | 0.2 | 0.69 | 3.77 | |||
| Segment | Qexisting (L/s) | Qadditonial (L/s) | QTotal (L/s) | Øcalculated (mm) | Øexisting (mm) | Complies | Øadopted (mm) | |
|---|---|---|---|---|---|---|---|---|
| MN-18 | MN-19 | 19.10 | 6.70 | 25.8 | 200 | 200 | OK | 200 |
| MN-19 | MN-20 | 19.10 | 6.70 | 25.8 | 162.4 | |||
| MN-20 | MN-21 | 19.10 | 6.70 | 25.8 | 162.4 | |||
| MN-21 | MN-22 | 19.10 | 6.70 | 25.8 | 153.9 | |||
| MN-22 | MN-23 | 19.10 | 6.70 | 25.8 | 153.9 | |||
| Segment | S (m/m) | v (m/s) | τ (N/m2) | Auto Cleaning | Non Erosion | ||
|---|---|---|---|---|---|---|---|
| vmin ≥ 0.6 | τ ≥ 1.2 | vmax ≤ 2.5 | |||||
| MN-18 | MN-19 | 0.003 | 0.84 | 2.05 | OK | OK | OK |
| MN-19 | MN-20 | 0.009 | 1.27 | 4.97 | |||
| MN-20 | MN-21 | 0.009 | 1.27 | 4.97 | |||
| MN-21 | MN-22 | 0.012 | 1.40 | 6.35 | |||
| MN-22 | MN-23 | 0.012 | 1.40 | 6.35 | |||
| Endowment [L/hab∙day] | CR | Population | Operating Time | Qmed | |
|---|---|---|---|---|---|
| [L/s] | [m3/h] | ||||
| 62.50 | 0.80 | 10254 | 16 | 8.90 | 32.04 |
| Population | Operating Time [h] | Qmed (L/s) | F | Qmax (L/s) | Qinf (L/s) | Qilicito (L/s) | Qdesing (L/s) | Qdesing (m3/s) | |
|---|---|---|---|---|---|---|---|---|---|
| [L/s] | [m3/h] | ||||||||
| 3760 | 16 | 3.26 | 11.74 | 3.36 | 10.95 | 0.704 | 0.704 | 12.36 | 44.50 |
| Parameters | Scenario 1 | Scenario 2 |
|---|---|---|
| Average flow rate value of CA1 year 2019 [m3/h] | 0.80 | 10,254 |
| Value of the average flow rate of EA1 [m3/h] | 11.74 | - |
| Value of the design flow rate of EA1 [m3/h] | - | 44.50 |
| Future flow rate [m3/h] | 43.78 | 76.54 |
| WWTP-MBR Capacity [m3/h] | 83.30 | 83.30 |
| Capacity at which the WWTP-MBR would operate | 52.50% | 91.90% |
| WWTP-MBR wasted capacity | 47.50% | 8.10% |
| Study | Situation | Flow [m3/day] | Length [m] | Width [m] | Water Mirror Depth [m] | Volume [m3] | Retention Time [Days] | Minimum Retention Time [Days] |
|---|---|---|---|---|---|---|---|---|
| Quiñonez & Vintimilla [54] | Existing | 1215.24 | 25 | 20 | 1.20 | 600 | 0.5 | 1–5 |
| Arias & Fernández [50] | Additional | 1972.54 | 25 | 20 | 1.20 | 600 | 0.3 | 1–5 |
| Case study | Expansion | 2489.40 | 25 | 20 | 1.20 | 600 | 0.2 | 1–5 |
| Internal Environment | Strengths | Weaknesses | |
| External Environment | |||
|
1. The current system contemplates sufficient infrastructure to supply the campus wastewater discharge. 2. There are various types of treatment systems. 3. Interaction of academia and research centres to optimise the current systems. 4. Environmental management plans. |
1. Age of the transport and treatment infrastructures. 2. Poor maintenance. 3. Designs without considering future scenarios. 4. Overflow of treatment systems. 5. Limited budget for operation and maintenance. | ||
| Opportunities | Strategies: Strengths + Opportunities | Strategies: Weaknesses + Opportunities | |
| 1.a. Redesign of pipelines in areas identified with hydraulic problems. 2.c. Design irrigation systems that use treated water. 3.a.b. Develop studies for the establishment of innovative and sustainable techniques in the transport and treatment of wastewater. 4.d. Develop wastewater management campaigns at the institutional and inter-institutional levels. | 1.3.b. Repower treatment systems to meet current and future demand. 2.c. Propose effective operation and maintenance (OPEX) plans to reuse water safely. 5.a. Establish cooperative alliances for financing redesign and repowering projects. | |
| Threats | Strategies: Strengths-Threats | Strategies: Weaknesses-Threats | |
| 1.d. Use of appropriate materials for the fulfilment of the useful life of the project. 3.c. Carry out undergraduate projects that contemplate the evaluation of the capacity of the treatment systems. 4.c. Carry out periodic water quality analyses at the inlet and outlet of the systems. | 2.b. Conduct evaluation studies of the lagoon isolation system to prevent infiltration. 3.b. Conduct workshops on the most common problems in sewerage systems due to a lack of user knowledge. 3.c. Implement tertiary treatment to limit the discharge of nutrients to water bodies, e.g., the use of green filters. | |
Publisher’s Note: MDPI stays neutral with regard to jurisdictional claims in published maps and institutional affiliations. |
© 2022 by the authors. Licensee MDPI, Basel, Switzerland. This article is an open access article distributed under the terms and conditions of the Creative Commons Attribution (CC BY) license (https://creativecommons.org/licenses/by/4.0/).
Share and Cite
Merchán-Sanmartín, B.; Carrión-Mero, P.; Suárez-Zamora, S.; Aguilar-Aguilar, M.; Cruz-Cabrera, O.; Hidalgo-Calva, K.; Morante-Carballo, F. Sanitary Sewerage Master Plan for the Sustainable Use of Wastewater on a University Campus. Water 2022, 14, 2425. https://doi.org/10.3390/w14152425
Merchán-Sanmartín B, Carrión-Mero P, Suárez-Zamora S, Aguilar-Aguilar M, Cruz-Cabrera O, Hidalgo-Calva K, Morante-Carballo F. Sanitary Sewerage Master Plan for the Sustainable Use of Wastewater on a University Campus. Water. 2022; 14(15):2425. https://doi.org/10.3390/w14152425
Chicago/Turabian StyleMerchán-Sanmartín, Bethy, Paul Carrión-Mero, Sebastián Suárez-Zamora, Maribel Aguilar-Aguilar, Omar Cruz-Cabrera, Katherine Hidalgo-Calva, and Fernando Morante-Carballo. 2022. "Sanitary Sewerage Master Plan for the Sustainable Use of Wastewater on a University Campus" Water 14, no. 15: 2425. https://doi.org/10.3390/w14152425