Article

An Energy Efficient Process for Degrading Perfluorooctanoic Acid (PFOA) Using Strip Fountain Dielectric Barrier Discharge Plasma

1
Laboratory of Plasma Physics, Beijing Institute of Graphic Communication, Beijing 102600, China
2
Department of Chemistry, Drexel University, Philadelphia, PA 19104, USA
*
Author to whom correspondence should be addressed.
Water 2022, 14(15), 2420; https://doi.org/10.3390/w14152420
Submission received: 9 July 2022 / Revised: 31 July 2022 / Accepted: 2 August 2022 / Published: 4 August 2022
(This article belongs to the Section Wastewater Treatment and Reuse)

Abstract

:
Perfluorooctanoic acid (PFOA) is an artificially synthesized per-fluorinated chemical widely used in industry. It is often released into the environment without treatment and causes pollution in groundwater. In this paper, we employed a strip fountain dielectric barrier discharge (SF-DBD) plasma source to degrade PFOA from the water. The effects of power supply mode, discharge gases, pH, the conductivity of the solution, concentration, etc., on the degradation efficiency were studied. For a 200 mL sample of 75 mg/L PFOA, a 99% degradation efficiency with a 204.5 μg/kJ energy production rate was achieved using an average power of 43 W negative pulse argon plasma for 50 min at atmospheric pressure. The total organic carbon concentration (TOC) decreased by 63% after a 60 min treatment. The SF-DBD proves to be a promising and energy-saving technique to efficiently remove PFOA from water.

1. Introduction

Perfluorooctanoic acid (PFOA) is a type of artificially synthesized per-fluorinated compound (PFC) [1]. The C-F bond in the molecule has a large bond energy (485 kJ/mol), which makes PFOA a chemical with excellent thermal stability, chemical stability, surface inactivity, and high hydrophobicity [2,3,4]. Therefore, PFOA is commonly used as a surfactant in the industry to produce firefighting coating, soap, shampoo, etc. [5]. Previous studies have shown that PFOA does not degrade naturally [6,7]. It is highly persistent in the environment and has been detected in rivers, lakes, and groundwater [8]. The accumulation of PFOA can cause potential harm to ecologically sustainable systems [9]. Hence, nowadays it is required to degrade PFOA before releasing the PFOA waste into the environment [10].
Advanced oxidation processes (AOPs), such as ozone or hydrogen peroxide [11], can degrade PFOA, but the efficiency is low. Similar results were also found using other AOPs, including photocatalysis [12], sonolysis [13], activated persulfate [14], electrolysis [15], and ionizing radiation [16] in PFOA degradation. For instance, a complete defluorination of 0.1 mM PFOA was observed when treated with 0.1 M persulfate and heat (70 °C) after 18 h. This hybrid method that combines Fenton like reagents and humic acids was able to quantitatively remove the PFOA at 25 °C in under 100 min [17]. PFOA at a concentration of 1.35 mM was decomposed by a photochemical system with 50 mM persulfate and 4 h of irradiation from a 200-W xenon−mercury lamp. The amount of PFOA decreased with irradiation, and after 4 h of irradiation, PFOA disappeared on the HPLC chromatogram [18]. It took 6 h to degrade PFOA by 98.3% using a UV with TiO2 and HClO4 at pH4 [19]. The degradation efficiency was 99.1% after being treated with 4 h of ozonation in the presence of a photocatalysis, but its defluorination ratio only reached 44.3% [20]. Research is currently ongoing to develop advanced oxidation/reduction processes for effective degradation of PFOA.
Among the AOPs, the non-thermal dielectric barrier discharge (DBD) plasma technique has been used as a pre/posttreatment method or in combination with other techniques for wastewater treatment [21,22]. It is known that non-thermal plasma generates a huge number of highly active species, high energy electrons, UV radiation, and shock waves [23], which can efficiently degrade hydrocarbon organic pollutants. Other than hydrocarbons, it was recently reported that PFOA in water could also be removed by non-thermal plasma [24]. Hayato et al. [25] showed an 89% degradation when a 200 mL of 44.9 mg/L PFOA aqueous solution was treated with DBD plasma for 140 min. Stratton et al. [26] also showed a 90% removal of PFOA rate when a 6 mg/L of PFOA aqueous solution was exposed to a 76.5 W non-thermal DBD plasma for 0.5 h, and the energy efficiency was 54.9 μg/kJ. They showed that the non-thermal plasma can degrade PFOA, but the long treatment time and high-power consumption make them less competitive for the task. The static non-thermal DBD plasma can only treat one waste solution with a small volume (such as 1 mL) at a time, which renders it unready for commercialization.
Discharge plasma is an emerging AOP which is characterized by the production of active substances (high-energy electrons, •OH, −O, H2O2, O3, NO2, NO, etc.) and physical effects (such as local high temperature, ultraviolet light, strong electric field, electro-liquefication cavitation, supercritical water oxidation, etc.) throughout the discharge process [27]. More importantly, the discharge plasma has the advantages of high efficiency and the avoidance of secondary pollution, which is very attractive for water treatment [28]. In this study, we report a plasma method for rapid and efficient removal of PFOA in aqueous solutions by using a plasma source: a strip fountain dielectric barrier discharge (SF-DBD) plasma reactor [29]. This plasma source allows gaseous-liquid interaction with a large interface at the atmospheric pressure. To learn more about the efficiency of the SF-DBD for PFOA degradation, the effects of the power mode, such as the nano-discharge, sinusoidal wave discharge, and positive and negative discharges, on the PFOA degradation have been investigated. The process parameters, such as the average power, the treatment period, the discharge gas, PFOA concentration, pH, and conductivity of solutions on the degradation have also been explored. In addition, the total organic carbon (TOC) concentrations of pollutants before and after treatment are compared.

2. Materials and Methods

2.1. Materials

PFOA (purity > 95%) was purchased from Alfa Aesar (Tewksbury, MA, USA). Other agents, such as isopropanol (C3H8O; analytical grade), sulfuric acid (H2SO4; analytical grade), sodium hydroxide (NaOH; analytical grade), sodium nitrite (NaNO2; analytical grade), sodium nitrate (NaNO3; analytical grade), benzoquinone (C6H4O2; analytical grade), 2, 2, 6, 6-tetramethylpiperidine (C9H19N; analytical grade), ammonium acetate (CH3COONH4; HPLC grade), methanol (CH3OH; HPLC grade), and acetonitrile (C2H3N; HPLC grade) were purchased from Aladdin Reagent (Shanghai, China) Co. LTD. All agents were not further purified before use. The gases (O2, Ar; purity > 99.999%) were bought from Praxair technologies (Beijing, China). The PFOA solution was then prepared in deionized water.

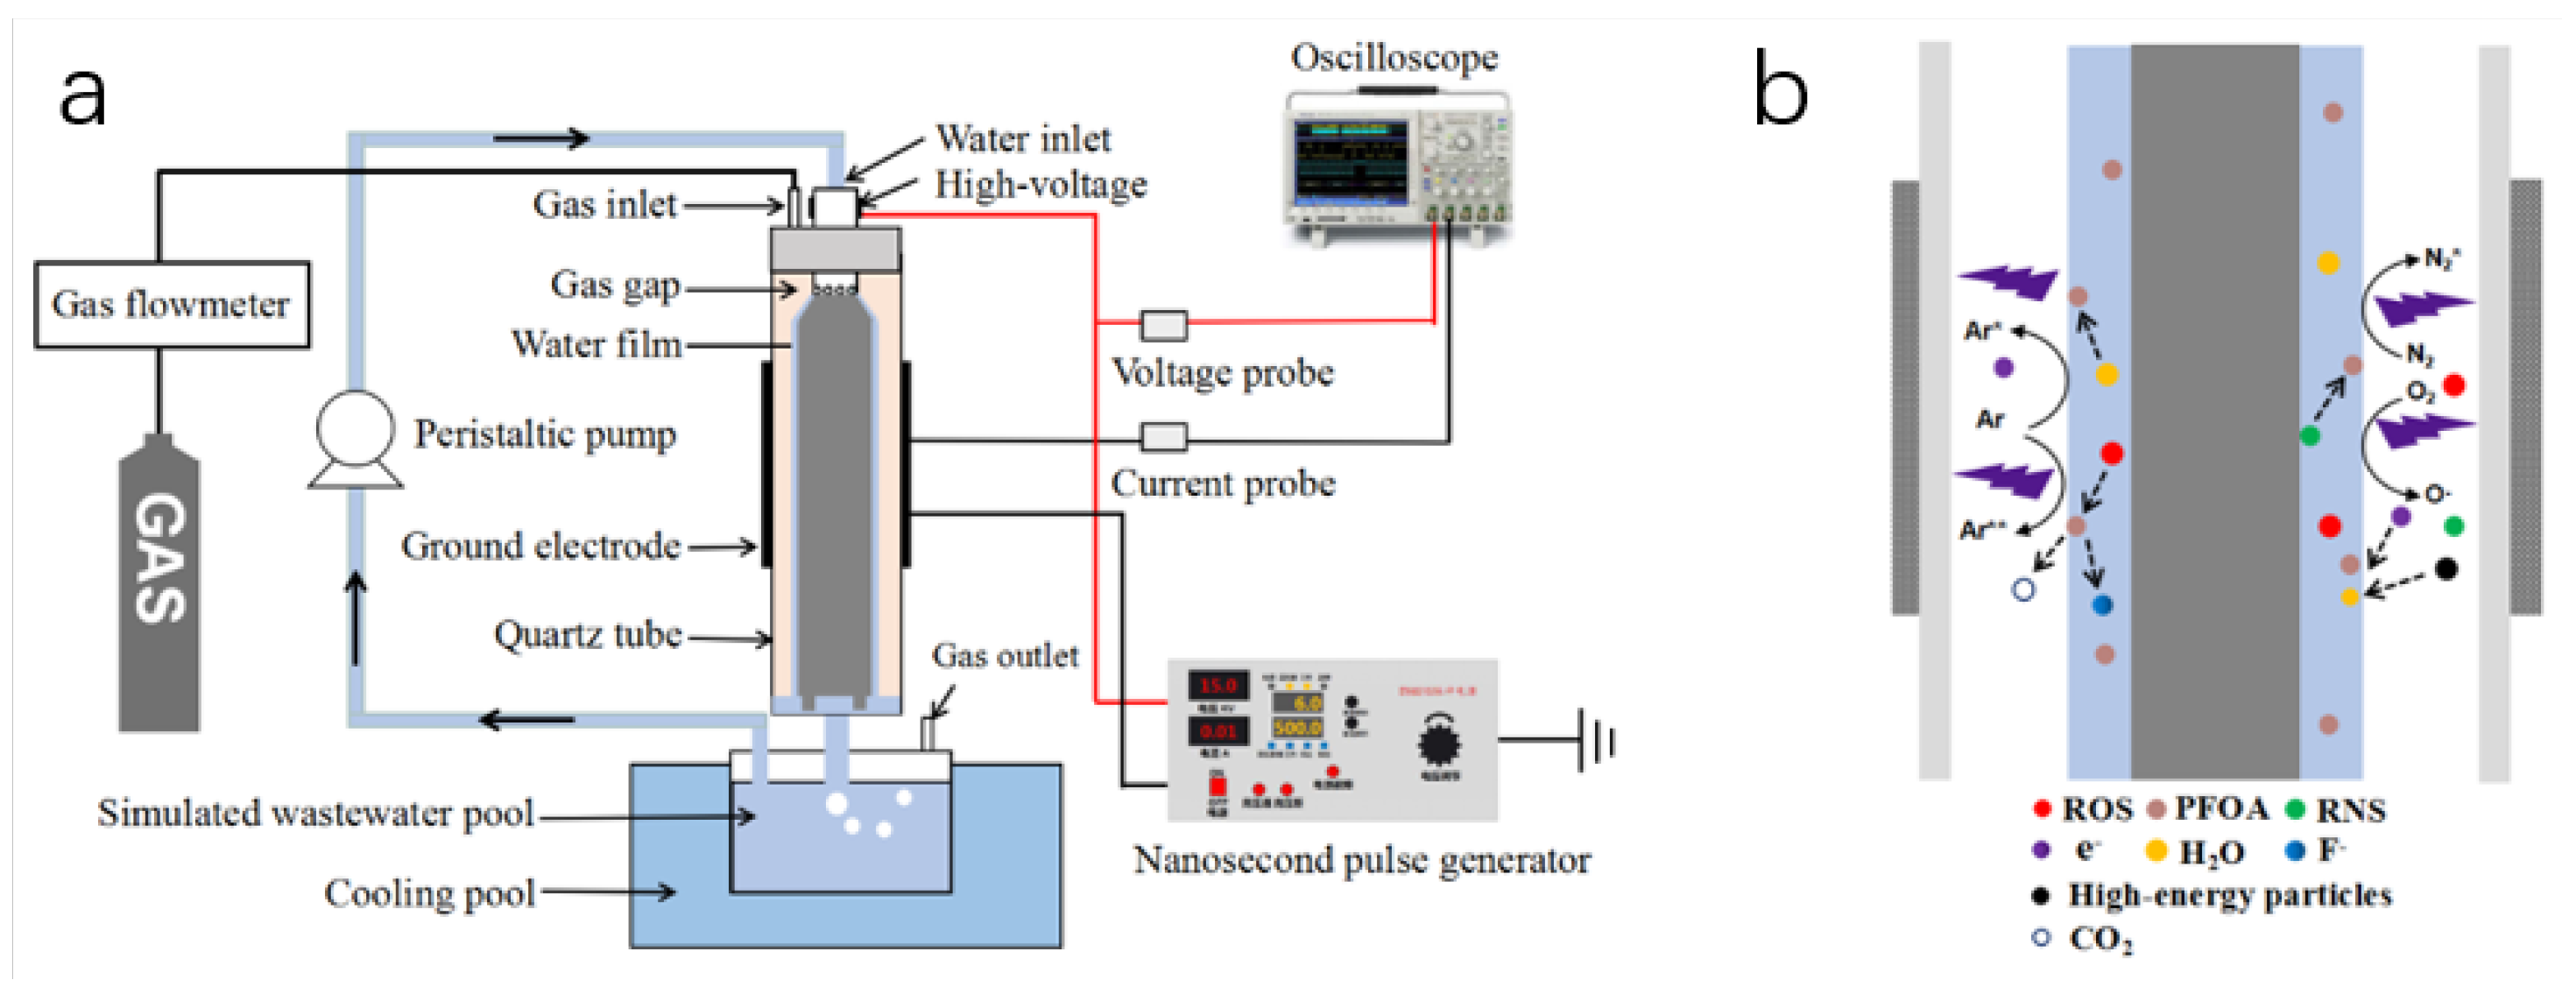
2.2. Experiment Setup

The SF-DBD plasma system used to treat PFOA solution is schematically shown in Figure 1. It consists of a fountain strip that releases a falling film of water that passes through an electric field generated from a high voltage power supply. The voltage and current were monitored on a digital oscilloscope and were measured using a high-voltage probe and a current transformer, respectively. The gas flowmeter controls the flow rate of working gas into the DBD reactor at a constant rate. The quartz tube (48 mm in outer diameter, 44 mm in inner diameter, 200 mm in height) was used as a dielectric layer, which is covered by a grounded stainless-steel net with a length of 10 mm. The inner stainless steel tube acts as the high voltage electrode. The discharge gap was fixed at 2~3 mm. When the solution flows from top to down, a 1 mm thick water layer formed on the surface of the high electrode. A cooling tank is added outside the treated solution pool to keep the solution temperature near 297 K during the whole process. For comparison, air, argon, and oxygen gases were selected as the discharge gases. Unless otherwise specified, the volume of all processed PFOA solution was 200 mL, the initial concentration was 75 mg/L, the initial pH of the solution was around 4.3, the conductivity was around 65 μs/cm, the solution temperature was around 297 K, and the duration between the samples’ treatment and analysis was 10 min.

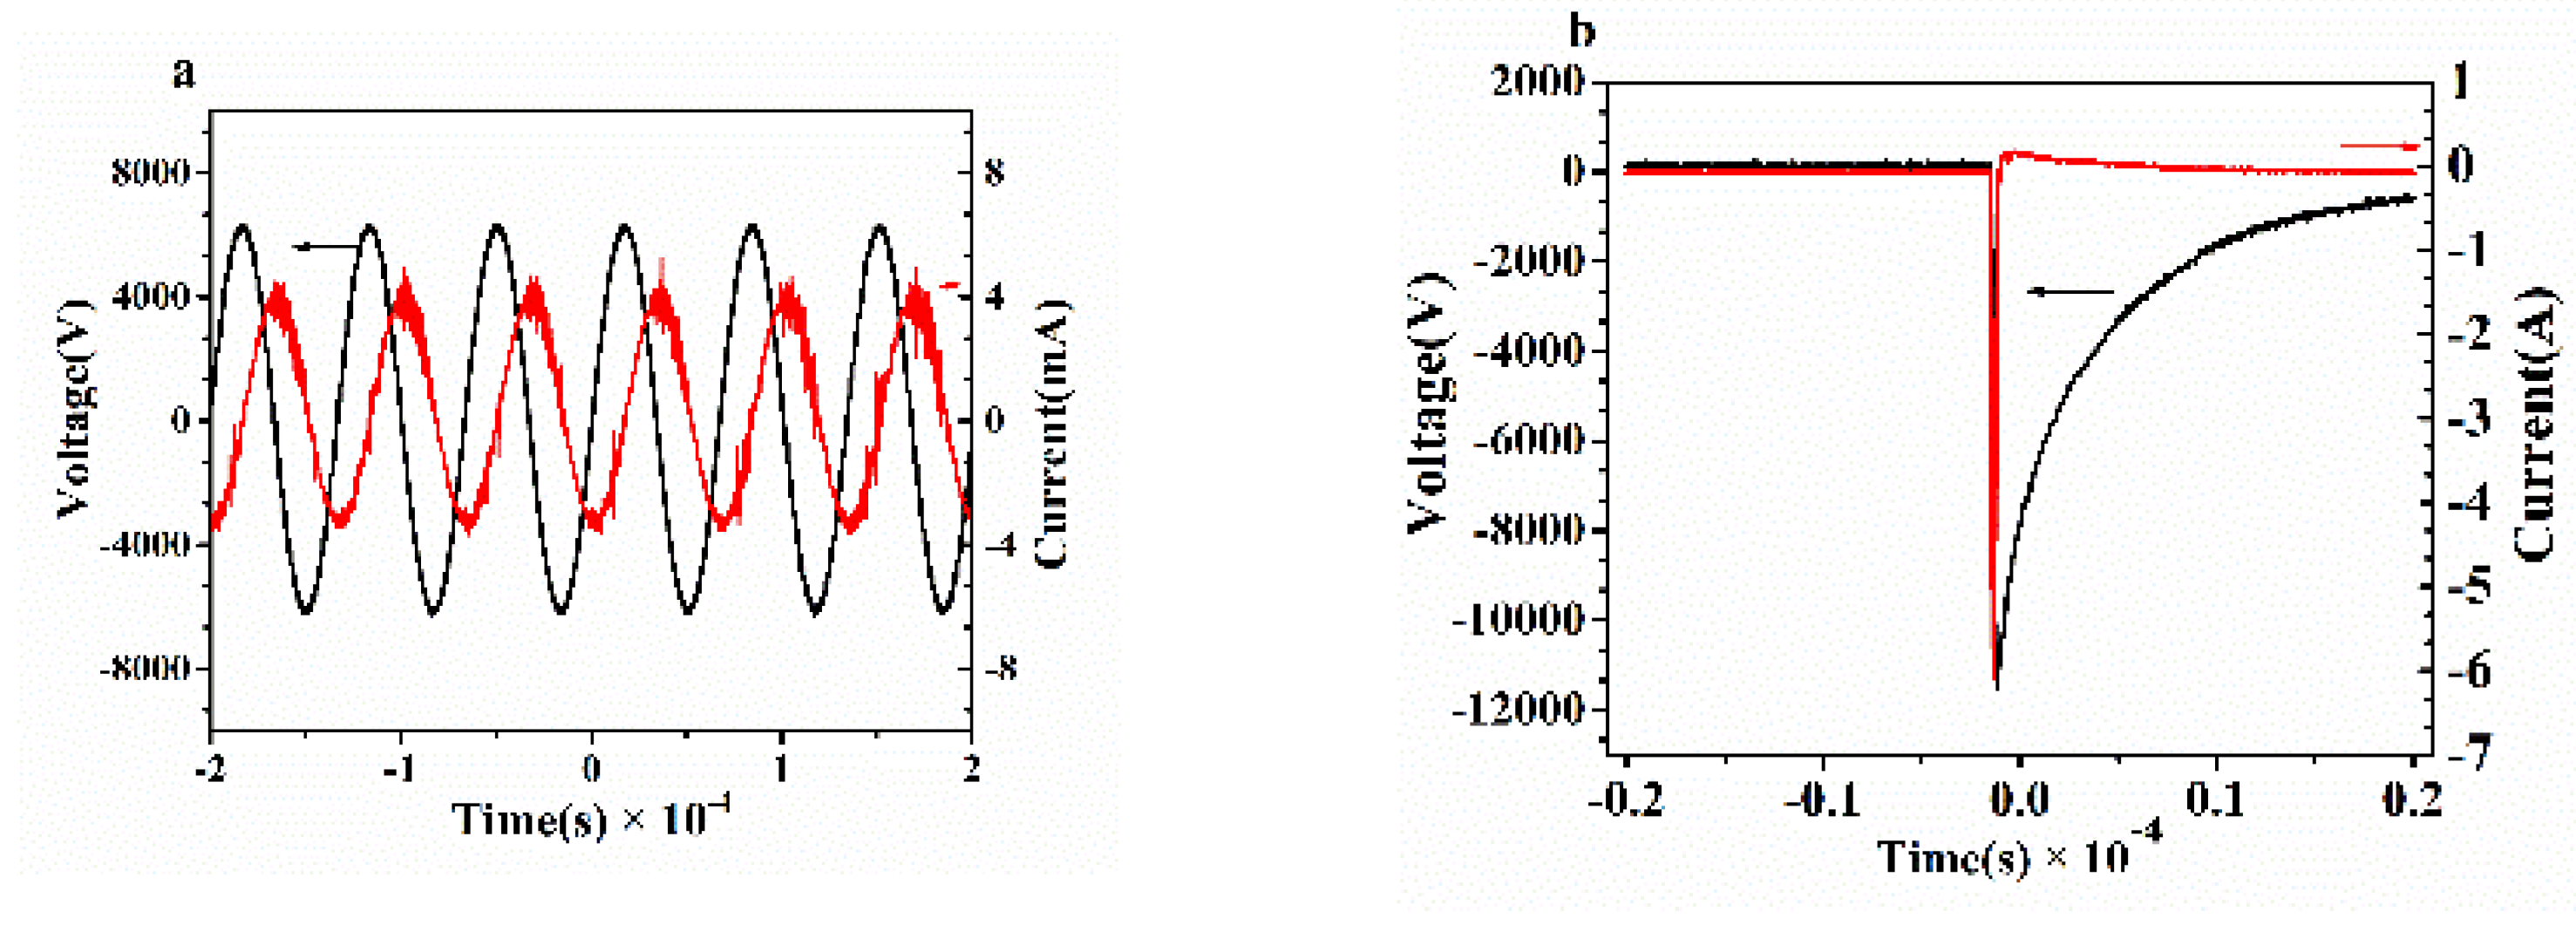
2.3. Discharge Power and I, V Characteristics

Three power sources were used to treat PFOA-contaminated wastewater. Their waveforms were detected using a digital oscilloscope (DPO 4104, Tektronix Inc, Beaverton, OR, USA)., USA). For the sinusoidal AC power supply (CTP-2000K, Nanjing Suman Electronic Co., Ltd., Nanjing, China) the input voltage was in the range of 0~30 kV with a frequency in the range of 8~40 kHz; for the negative pulse power supply (SY6515, Chengdu Senyuan Technology Co., Ltd., Chengdu, China), the voltage was in the range of 0~16 kV with a frequency in the range of 0~15 kHz, pulse width of 0.5~0.8 μs, and the pulse rising edge period in the range of 104~112 ns. The typical I and V waveforms of three power supplies are presented in Figure 2a,b respectively.

2.4. Analytical Methods

The PFOA degradation or removal efficiency, DE, is defined as
D E = C 0 C t C 0 × 100
where C0 and Ct represent the PFOA concentrations (mg L−1) at initial and at t times, respectively.
As for the process conditions of the ion chromatograph (IC) (Thermo Dionex, ICS-1100, Waltham, MA USA), F- in the reaction solution was determined by the manual sampler (the injection volume was 1 mL), the mobile phase was Na2CO3 (9 mmol L−1), and the flow rate was 1 mL/min. The detection limit was 20 μg/L.
The total organic carbon (TOC) of PFOA was determined by the TOC analyzer (N/C-2100, Analytik Jena, Jena, Germany).
The calculated defluorination rate D F (%) is based on Equation (2):
D F = C F 15 × C P F O A × 100
CF, and CPFOA are fluoride ion concentration (mol L−1) at t time and the PFOA concentrations (mol L−1) were at initial state, respectively.
The PFOA degradation kinetics in SF-DBDwas evaluated by fitting the experimental data with the first-order Equation (3):
C t = C 0 e kt
where k is the kinetic constant.
In pulse mode, the average power ( P ) in discharge is calculated based on Equation (4) [30]:
P = f t 1 t 2 U I d t
where t1 is the pulse start time, t2 is the pulse end time, f is pulse frequency, I is instantaneous current, and U is instantaneous voltage.
The energy yield G (μg kJ-1) can be obtained from Equation (5) [31], which is defined as the removed amount of PFOA (μg) per kilojoule consumed during the treatment period.
G = C 0 C t × V × D E P × T × 1000 3.6
where V (L), T (h), and P (W) are solution volume, degradation time, and average power, as well as the degradation rate, respectively.
All experiments were conducted in duplicate.

3. Result and Discussion

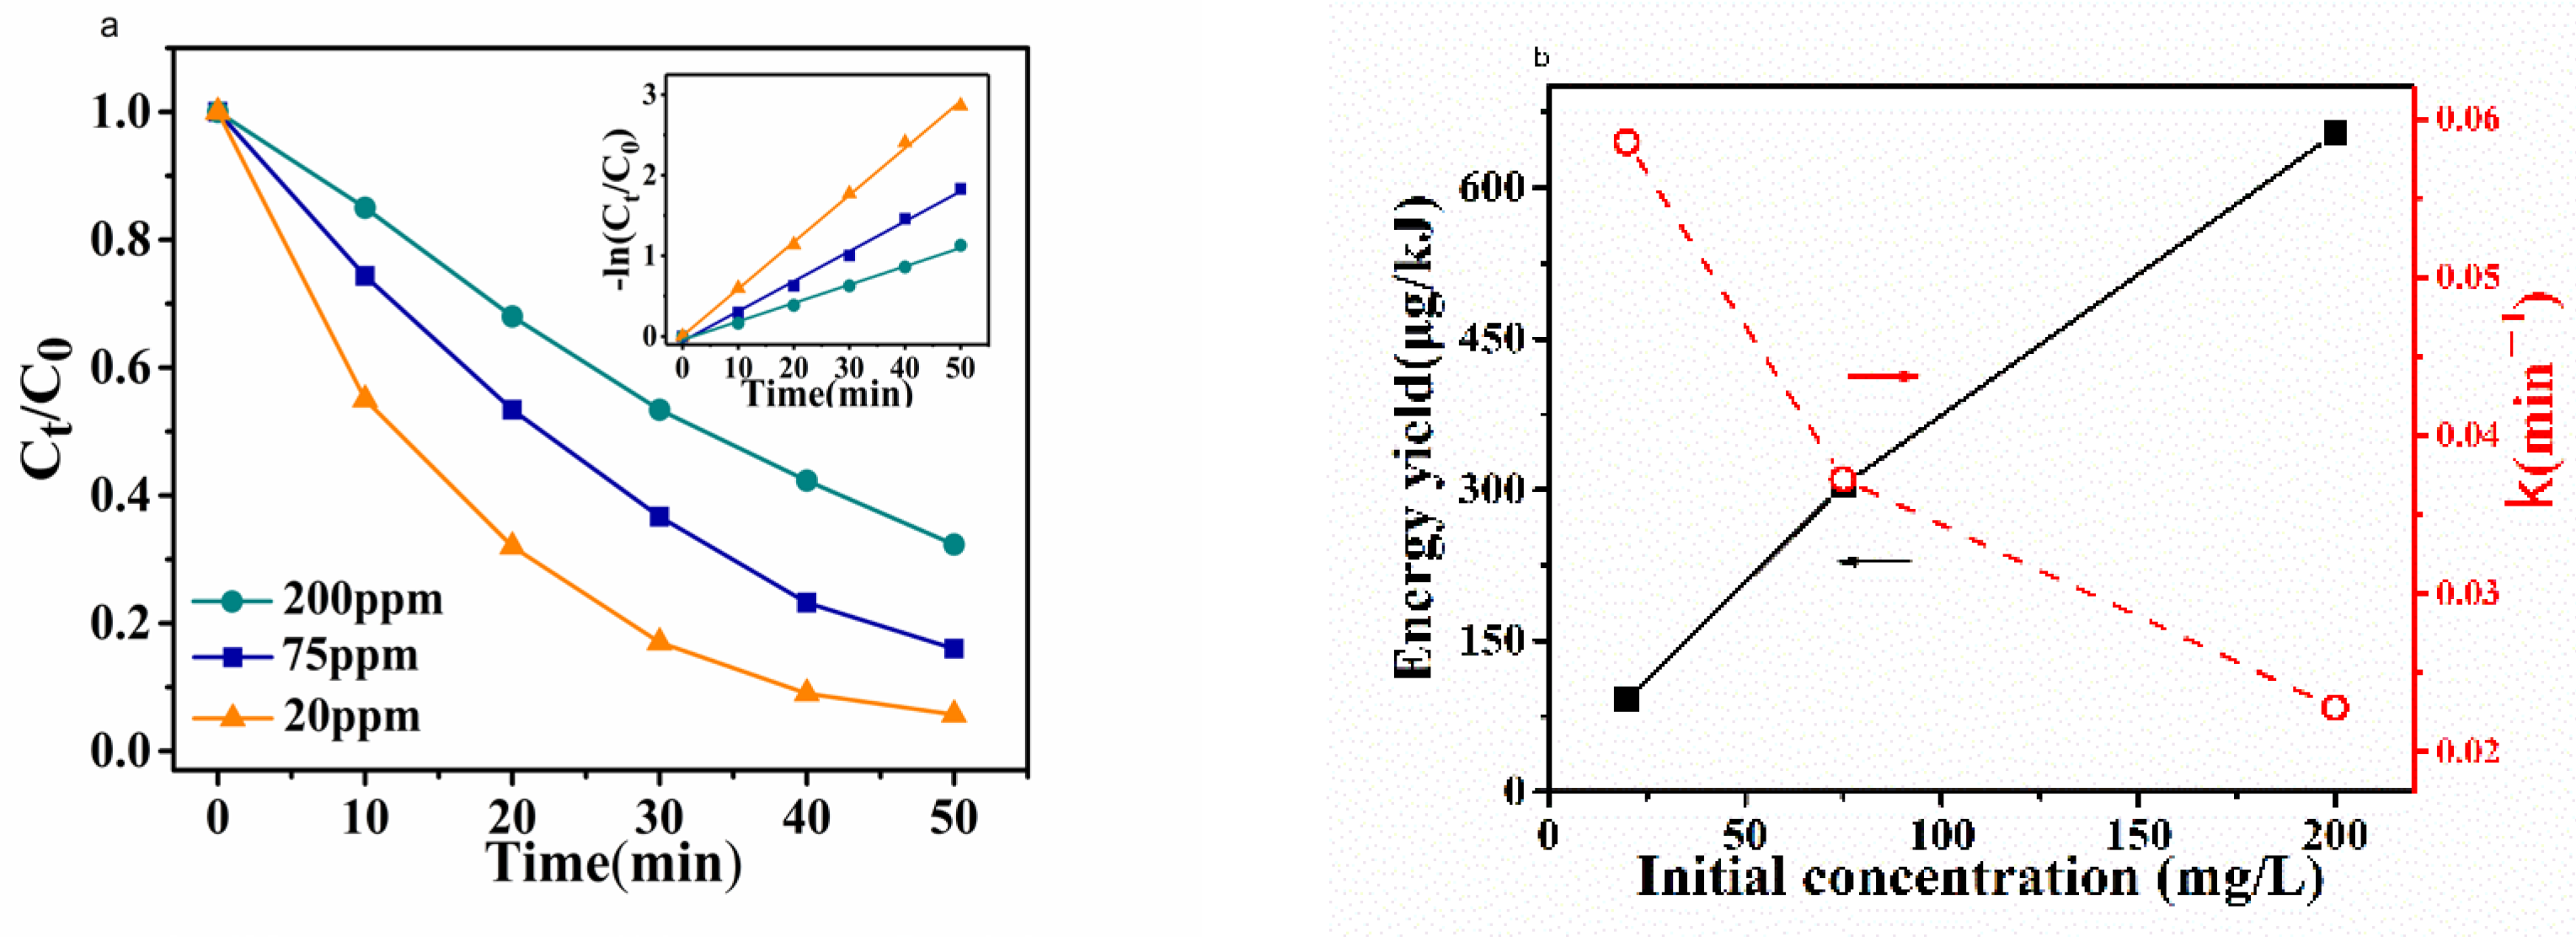
3.1. Effect of the PFOA Concentration on the Degradation Efficiency and Rate

Figure 3 shows that the PFOA concentration can affect the degradation efficiency and rate. The degradation efficiencies of PFOA are 94.3%, 84%, and 67.7%, after 60 min of Ar-plasma treatment, when the concentrations are 20 mg/L, 75 mg/L, and 200 mg/L, respectively. The degradation follows a first-order reaction kinetics as shown in Figure 3a inset. When the concentration increased 10-fold from 20 mg/L to 200 mg/L, the energy yield only increased 7.2-fold from 91.1 μg/kJ to 654 μg/kJ (Figure 3b). Similar results were reported before and were explained by the efficient average power consumption [32], and the concentration of the active species in plasma remained the same at a fixed average power. Therefore, the higher the PFOA concentration, the longer the discharge time, which in turn leads to a lower degradation efficiency [33]. This was evidenced by the decrease in the kinetic constant from 0.0584 to 0.0228 min−1 when the concentration increased from 20 mg/L to 200 mg/L (Figure 3b).
The PFOA concentration can affect the degradation efficiency and rate. Therefore, for consistency, in all the subsequent experiments 75 mg/L of PFOA concentration was used to study other factors that can affect the degradation efficiency and rate.

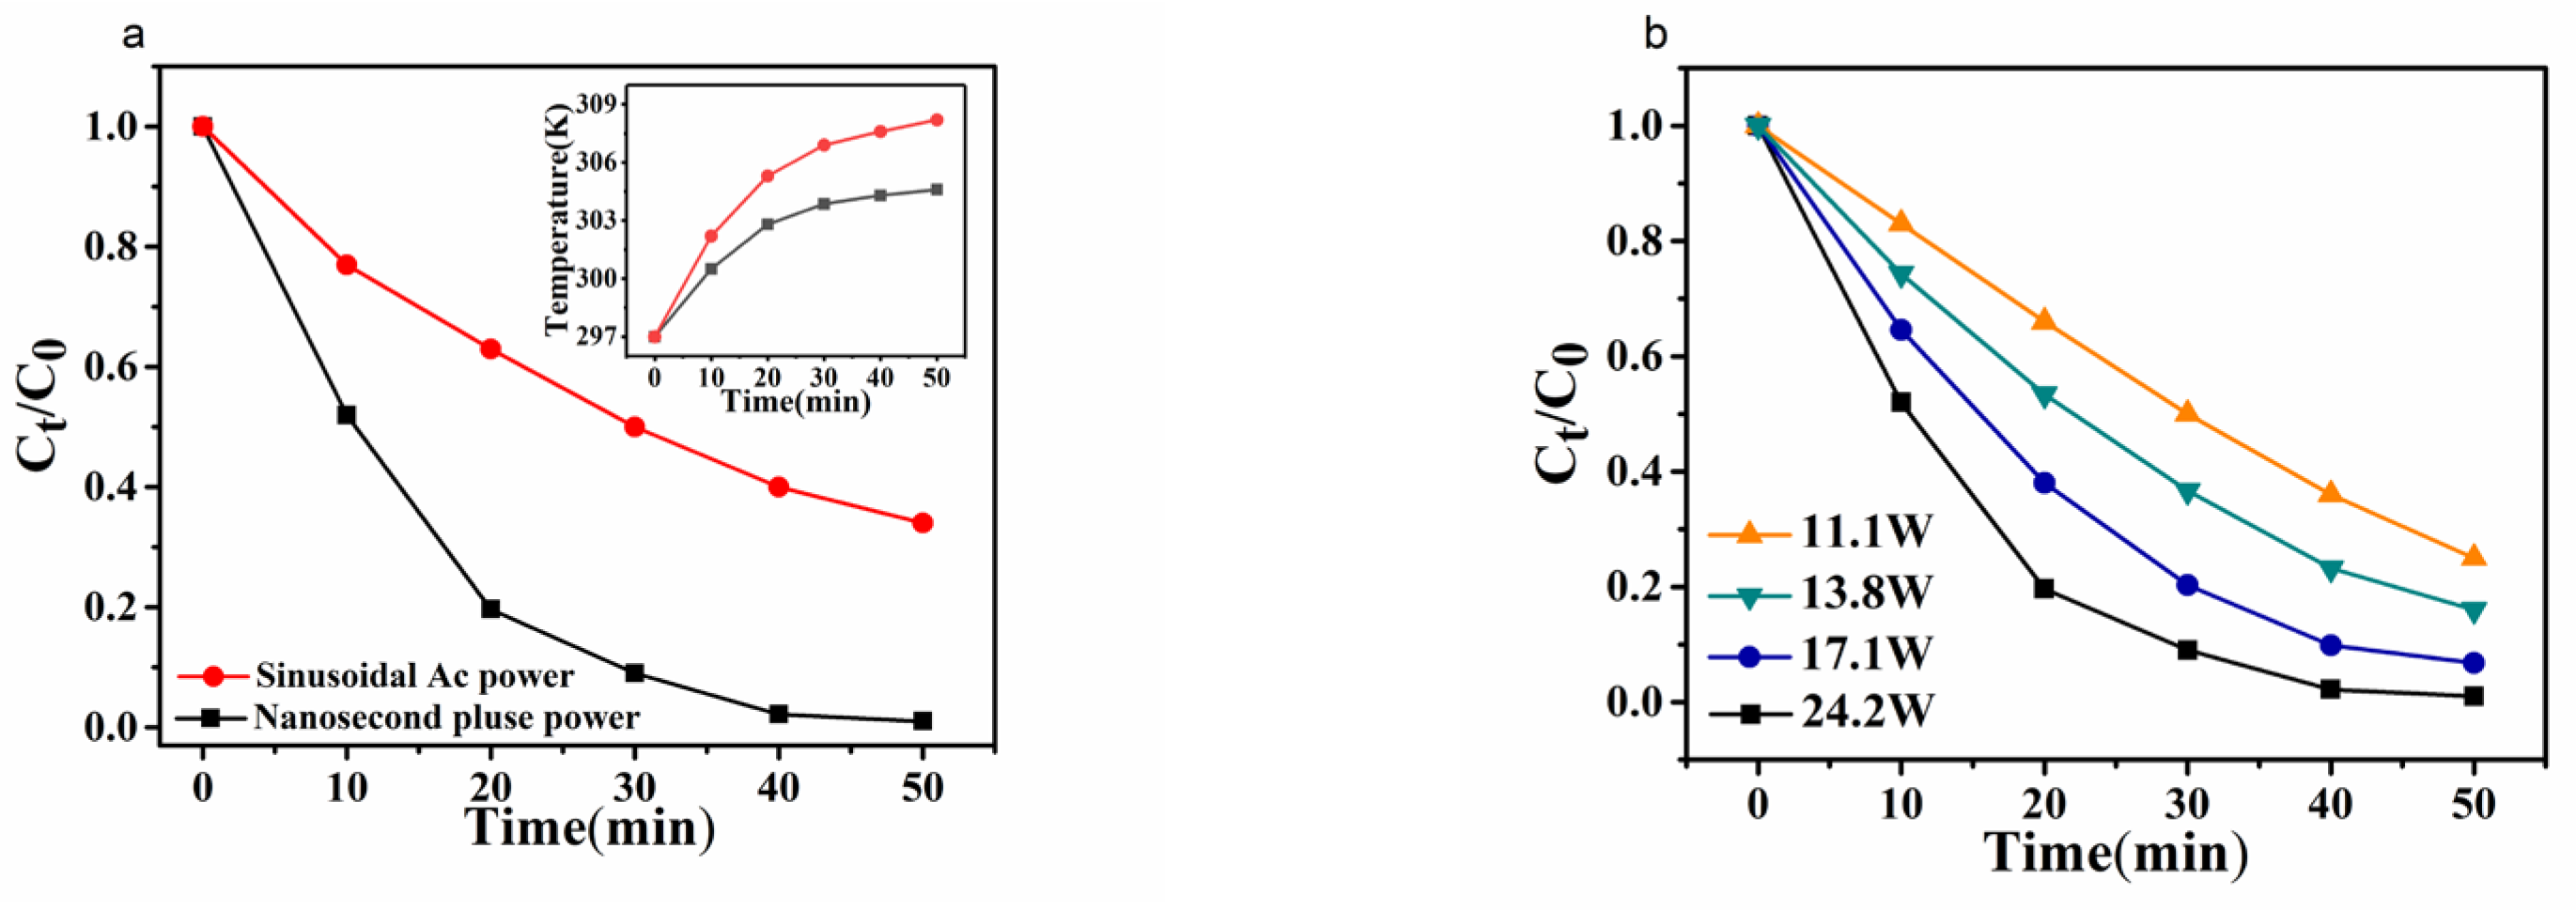
3.2. Effect of Type of Power Supply and the Average Power and on the Degradation Efficiency

It is known that the concentrations of particles in plasma vary with the type of power supplies [34]. To decontaminate the water, sinusoidal AC power supply DBD plasma was mostly used in previous studies [34,35]. Recently, the discharge driven by nanosecond pulse power supply has attracted a lot of attention because it exhibits high current density, high average electron energy, less electrolysis, and low Joule heat. Therefore, it is worth comparing how the type of power supplies would affect the degradation efficiency. The plasma generated from two power supplies, sinusoidal AC power supply and nanosecond pulse power supply, were compared in our study.
Figure 4b and Table 1 show the degradation efficiencies of PFOA under the Ar plasma from two different power supplies. The degradation efficiencies are 66% and 99% after 50-minute treatment for the sinusoidal AC power, and nanosecond pulse power, respectively, under similar efficient power (~24.5 W). This difference in degradation efficacy can be explained using the efficient energy consumption applied to the degradation process [36]. For the sinusoidal AC power supply, a high joule heat is generated during the discharge process in the continuous mode, which consumes some applied energy that cannot be used to degrade PFOA. On the other hand, in the nanosecond pulsed discharge mode, the charged species gained less kinetic energy from the pulsed power, so the temperature of the plasma does not derivate too far from the room temperature and less energy is wasted on heating the plasma species [36]. To confirm the temperature change, the temperature of the solution before and after the plasma treatment without a cooling system under the two power supplies was measured (Figure 4a inset). After the 50 min plasma treatment, an 11.2 K temperature increase was observed for the sinusoidal AC discharge mode, while only a7.6 K increase in temperature was seen for the nanosecond pulse discharge mode. The slight temperature increase also suggests that the temperature change does not contribute to the degradation of PFOA, since PFOA is stable even at much higher temperatures [37]. To avoid experimental errors caused by temperature, in the latter experiments we added a water circulation system around the reaction pool to keep the solution temperature constant.
Figure 4b and Table 1 show that the degradation efficiencies were 99%, 93.2%, 84%, and 75%, when the average powers were 24.2 W, 17.1 W, 13.8 W, and 11.1 W, respectively after the SF-DBD plasma discharge treatment for 50 min. The higher degradation efficiency at higher average power is most likely caused by a higher density of active species at higher average power [34].
Table 2 lists the degradation efficiency and the energy yield of our system, compared to those of other plasma systems reported in the literature. The comparison shows that the energy yield based on the negative pulse discharge mode was much higher than any of the reported methods, indicating the designed nanosecond pulsed SF-DBD system is promising in improving the degradation efficiency of PFOA with reduced energy consumption.

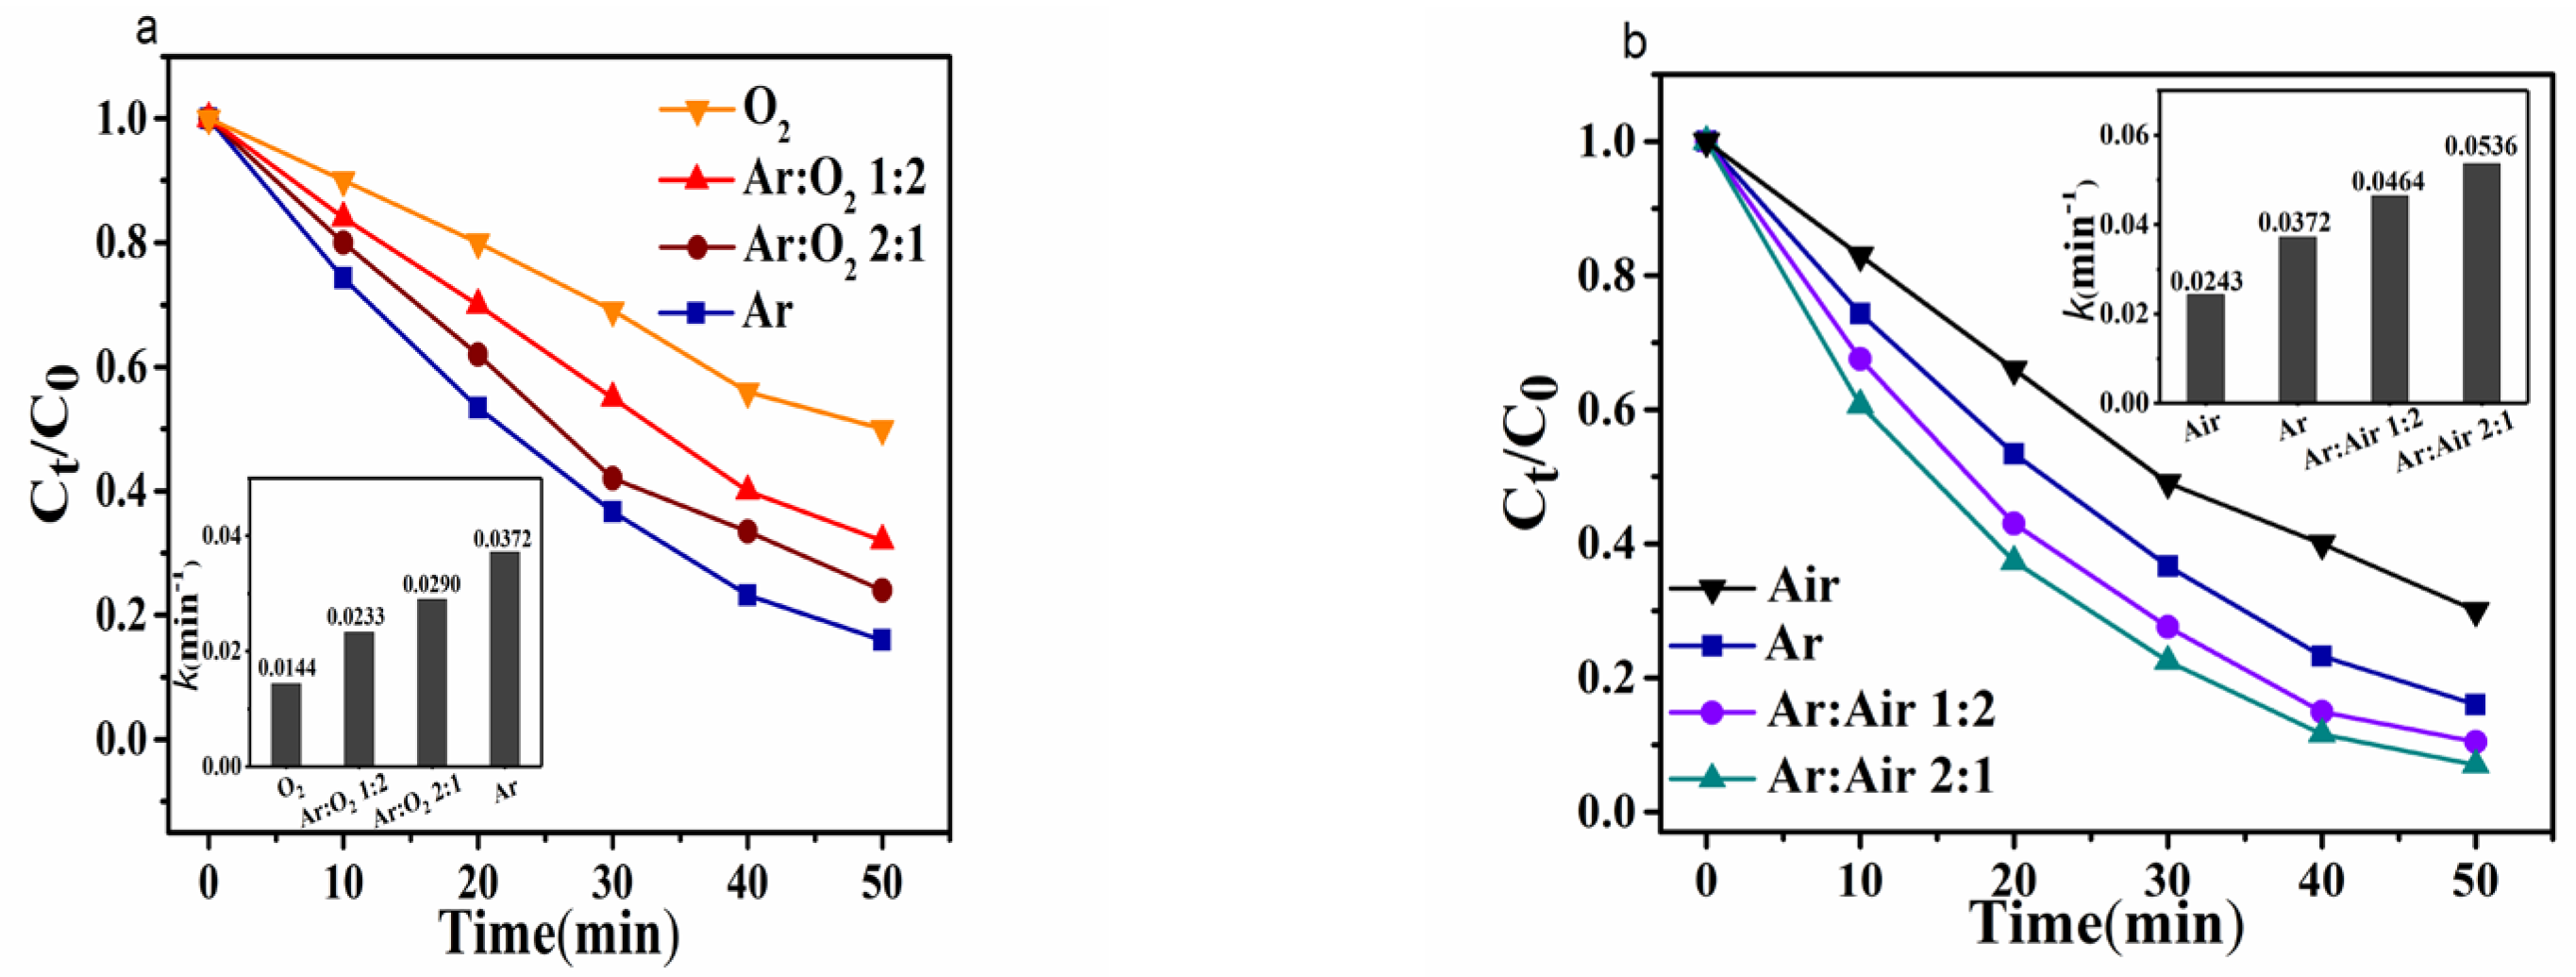
3.3. Effect of the Discharge Gas on the Degradation Rate

It is expected that the degradation efficiencies of plasma generated from different gases are different because different discharge gases produce different active species [42]. Therefore, we compared the degradation of PFOA in argon, air, and oxygen plasma.
Figure 5 shows the degradation constant in argon plasma is highest at 0.046 min−1, followed by air plasma at 0.0351 min−1, and oxygen plasmas at 0.0247 min−1. The degradation efficiency follows the same order, which is the same as that for the degradation of antibiotic tetracycline [43].
There are two reasons for the high degradation constant for the argon plasma: the first is that the discharge in Ar plasma is uniform [10], leading to a larger interaction area; the second is that the dissociation energy in Ar plasma was significantly lower than that in oxygen and nitrogen plasmas [44]. The degradation efficiency of oxygen plasma being lower than that of air plasma may be explained by the active species in each plasma. Ozone and hydrogen peroxide are two major components in oxygen plasma, which were known to be inefficient in PFOA degradation [25,9]. The air plasma is much more complex since it contains both reactive oxygen species (ROS) and reactive nitrogen species (RNS), and species generated from the mixture of nitrogen and oxygen, such as NO, NO2, NO3, ONOO, were found to be more reactive than ROS or RNS only [10,22].
Since the air plasma (mixture of N2 and O2 in the air) is more efficient in degrading PFOA than the O2 plasma, it is of interest to know whether mixing argon with O2 or air will increase the efficiency more than any of the single gas components. We then mixed Ar with oxygen and air respectively and explored their efficiencies on the PFOA degradation. Figure 6a shows that mixing Ar with O2 produced a plasma that is more efficient in degrading PFOA than O2 plasma, but less than that of argon plasma. The kinetic constant of degradation increased with the increase of the percent of argon gas. However, an interesting observation of the Ar/air mixture system is that this mixture produced a plasma that is more efficient at degrading PFOA than either argon or air plasma alone (Figure 6b). The highest degradation rate constant (0.0638 min−1) was observed for a plasma from a mixture of Ar and air at a 2:1 ratio, which is 1.8 times of that from Ar (0.03507 min−1). The reaction mechanism is under investigation and will be reported in due course.

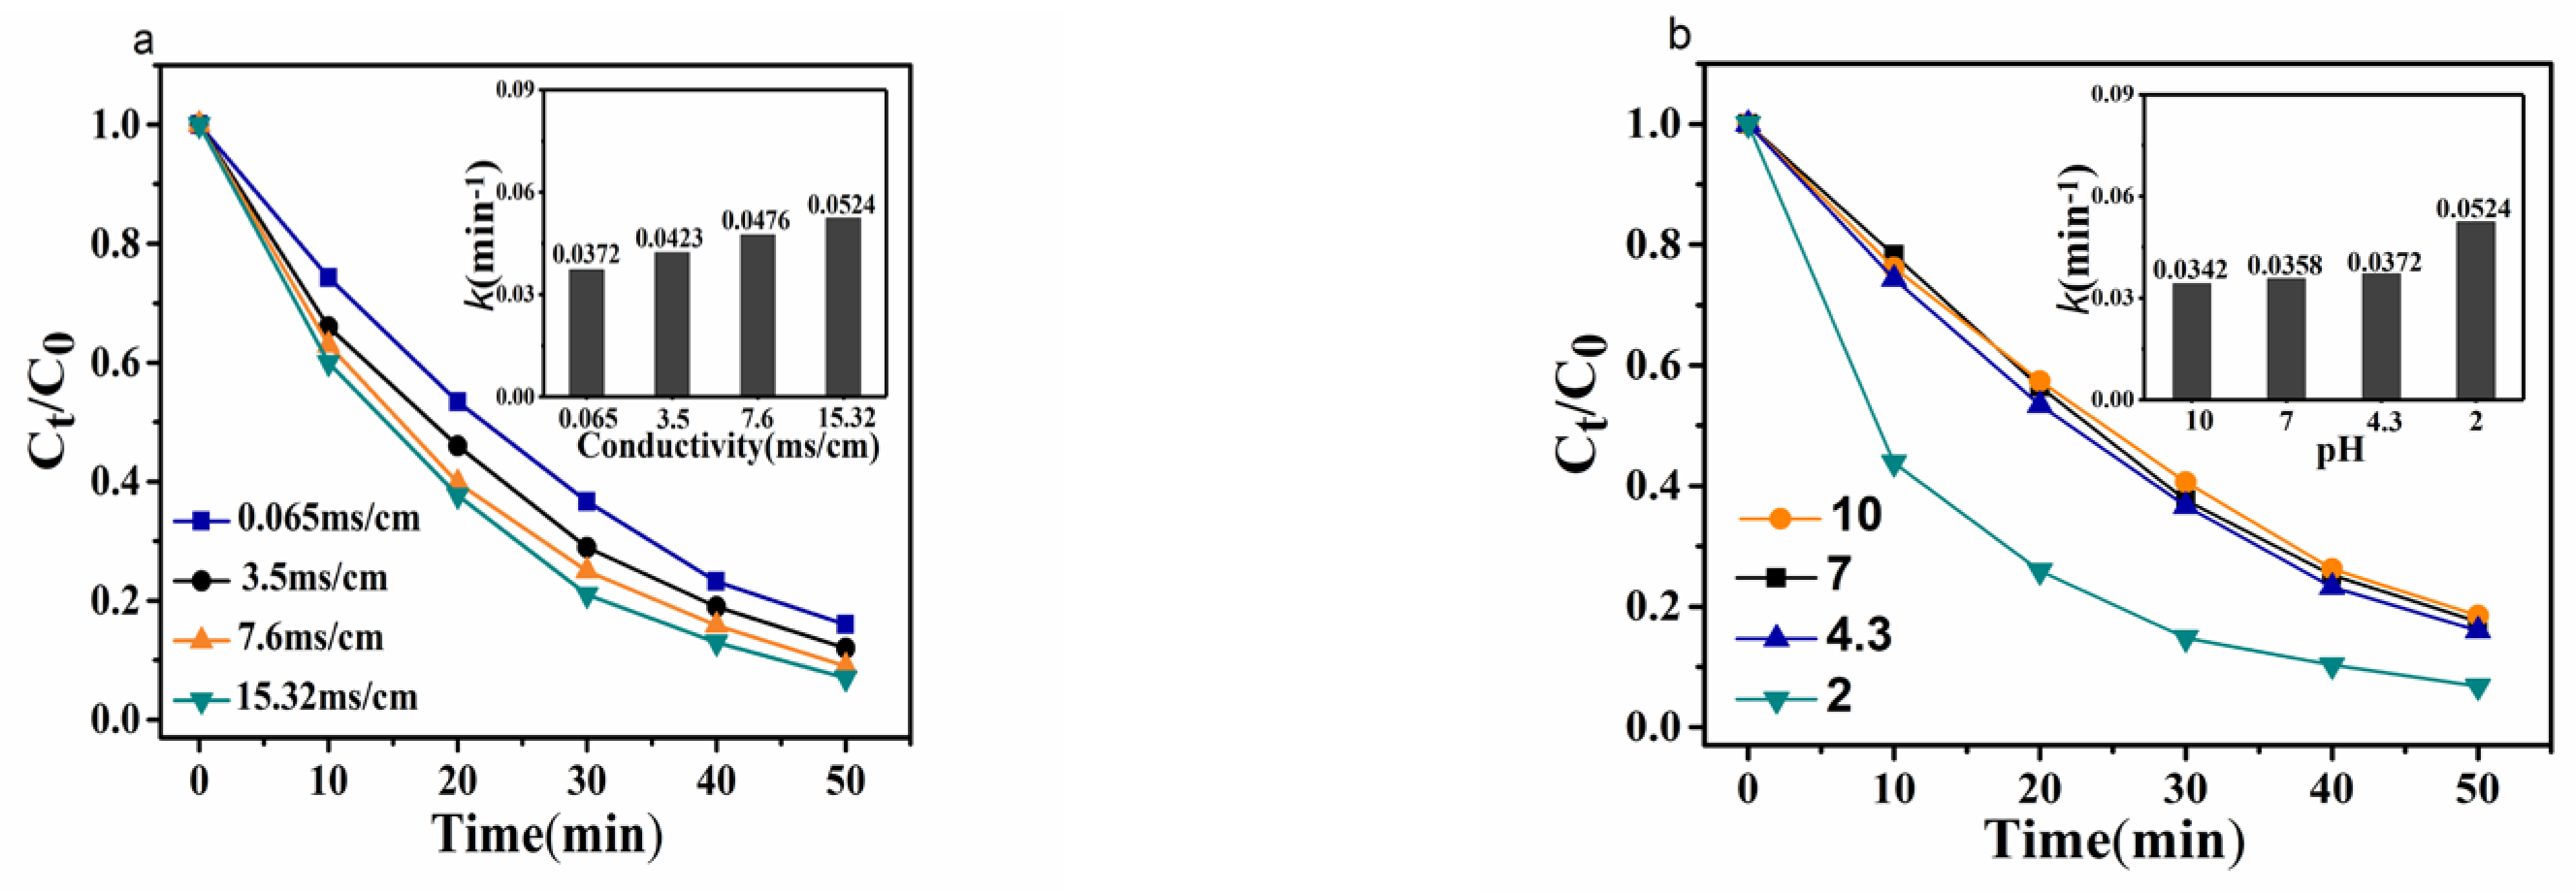
3.4. Effect of the pH and Conductivity on the Degradation Efficiency

Wastewater released from the industry often contains a high concentration of salts, which may deteriorate the efficiency of any waste treatment methods [11]. Thus, to evaluate the efficiency of our method, it is necessary to study the effect of salts on the degradation of PFOA. Since there is no common salt in wastewater, we used NaCl as a representative one, and the conductivity of the solution was used as the factor to affect the degradation efficiency since the conductivity is a common property of all salt solutions. Figure 7a reveals that, the higher the conductivity, the higher the degradation efficiency and the greater the reaction rate. This suggests that the high conductivity of a solution would further increase the degradation rate, but not slow it down, which is an advantage of the SF-DBD method for PFOA degradation. This may be explained by the increase in plasma discharge current because of the higher conductivity, which leads to an increase in plasma density, resulting in more active charged species for the degradation of PFOA.
We also investigated the pH effect on the degradation efficiency. Figure 7b shows that the effect of pH on the degradation rate is negligible between pH 4 and 10, but the kinetic constant at pH 2 increased 1.45 times from 0.03507 min−1 to 0.05243 min−1. The result suggests that protons play a role [45] in the degradation of PFOA in our experimental conditions, which are under investigation for the reaction mechanisms.

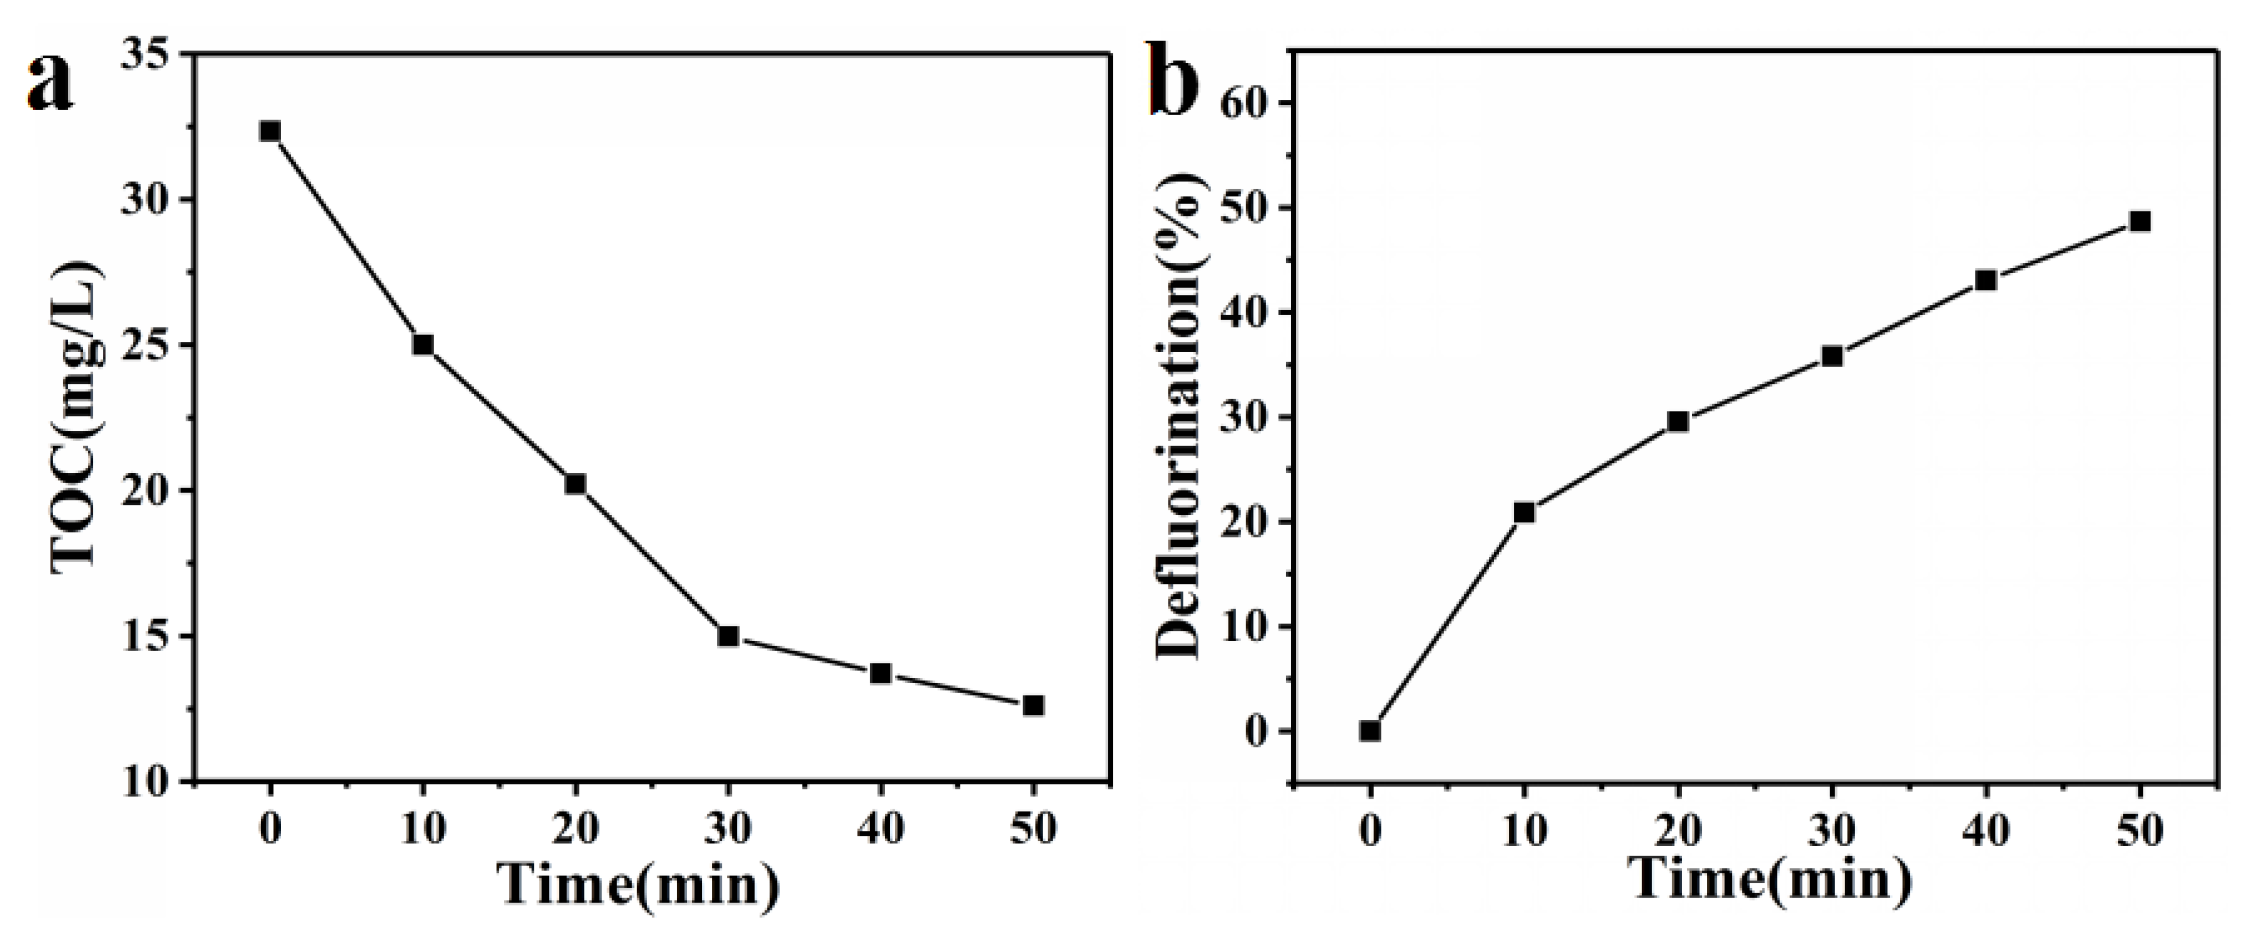
3.5. Total Organic Carbon Concentration and Defluorination Efficiency

Total organic carbon concentration (TOC) and defluorination efficiency are often used as indicators of the degradation of organic matters into inorganic substances, but not organic intermediates, to evaluate the efficiency of a waste treatment process [45]. Figure 8a shows that the TOC of PFOA decreased from 32.34 mg/L to 12 mg/L in 50 min. Figure 8b indicates that the defluorination efficiency of PFOA gradually increased along with the discharge period and reached over 49% after a 50 min treatment, which is much more efficient than previous DBD or photocatalytic methods [38,46]. This indicates that this SF-DBD plasma source is effective in the decomposition of the PFOA and its intermediate products into inorganic substances.
The degradation mechanisms of PFOA have been studied recently, but it is debatable which active species contributed the most to degrading PFOA. Takeuchi et al. [39] believed that hydroxyl radicals could not effectively degrade PFOA. Singh et al. [23] deduced that the solvated electrons were the main active species for degradation. Stratton et al. [26] also reported that the solvated electron quench agents could significantly slow down the PFOA degradation and concluded that solvated electrons played a critical role in PFOA degradation. Our experiments seem to indicate that the reaction mechanisms are different and complex under different gases, which are currently under investigation and will be reported in due course.

4. Conclusions

In this paper, we reported a PFOA degradation method using a strip fountain dielectric barrier discharge (SF-DBD) plasma source. Our results showed that, when the treatment was performed with a pulsed power supply and in acidic conditions with high conductivity, the degradation rate and energy yield can be greatly increased. For a 200 mL sample of 75 mg/L PFOA, a 99% degradation efficiency with a 204.5 μg/kJ energy production rate was achieved within 50 min, which is greater than the reported plasma and other degradation methods. The SF-DBD proves to be a promising energy-saving technique to efficiently remove PFOA from water.

Author Contributions

Conceptualization: Q.C. and H.-F.J.; methodology: J.C.; software: Y.F.; data curation: X.P. and D.T.; validation: Z.L. and L.Y.; writing—original draft preparation: Y.F.; writing—review and editing: J.C.; writing—English editing: E.F. All authors have read and agreed to the published version of the manuscript.

Funding

The research was funded by the National Natura Science Foundation of China (No. 11875090, 12075032, 11775028, and 12105021).

Institutional Review Board Statement

Not applicable.

Informed Consent Statement

Not applicable.

Data Availability Statement

Not applicable.

Conflicts of Interest

The authors declare no conflict of interest.

References

  1. Jiang, L.; Wang, S.; Chen, W.; Lin, J.; Yu, X.; Feng, M.; Wan, K. Removal of per-and polyfluoroalkyl substances by electron beam and plasma irradiation: A mini-review. Water 2022, 14, 1684. [Google Scholar] [CrossRef]
  2. Khan, M.J.; Jovicic, V.; Zbogar-Rasic, A.; Poser, A.; Freichels, K.; Delgado, A. Effectiveness of non-thermal plasma induced degradation of per- and polyfluoroalkyl substances from water. Water 2022, 14, 1408. [Google Scholar] [CrossRef]
  3. Wan, H.; Miills, R.; Qu, K.; Hower, J.C.; Mottaleb, M.A.; Bhattacharyya, D.; Xu, Z. Rapid removal of PFOA and PFOS via modified industrial solid waste: Mechanisms and influences of water matrices. Chem. Eng. J. 2022, 433, 133271. [Google Scholar] [CrossRef]
  4. Xie, J.; Zhang, C.; Waite, T.D. Integrated flow anodic oxidation and ultrafiltration system for continuous defluorination of perfluorooctanoic acid (PFOA). Water Res. 2022, 216, 118319. [Google Scholar] [CrossRef]
  5. Espana, V.A.A.; Mallavarapu, M.; Naidu, R. Treatment technologies for aqueous perfluorooctanesulfonate (PFOS) and perfluorooctanoate (PFOA): Acritical review with an emphasis on field testing. Environ. Technol. Innov. 2015, 4, 168–181. [Google Scholar] [CrossRef]
  6. Leung, S.C.E.; Shukla, P.; Chen, D.; Eftekhari, E.; An, H.; Zare, F.; Ghasemi, N.; Zhang, D.; Nguyen, N.T.; Li, Q. Emerging technologies for PFOS/PFOA degradation and removal: A review. Sci. Total Environ. 2022, 827, 153669. [Google Scholar] [CrossRef]
  7. Xiao, F.; Asce, M. An Overview of the Formation of PFOA and PFOS in Drinking-Water and Wastewater Treatment Processes. J. Environ. Eng. 2022, 148, 01822001. [Google Scholar] [CrossRef]
  8. Hansen, K.J.; Johnson, H.O.; Eldridge, J.S.; Butenhoff, J.L.; Dick, L.A. Quantitative characterization of trace levels of PFOS and PFOA in the Tennessee river. Environ. Sci. Technol. 2002, 36, 1681–1685. [Google Scholar] [CrossRef]
  9. Vecitis, C.D.; Park, H.; Cheng, J.; Mader, B.T.; Hoffmann, M.R. Treatment technologies for aqueous perfluorooctanesulfonate (PFOS) and perfluorooctanoate (PFOA). Front. Environ. Sci. Eng. China 2009, 3, 129–151. [Google Scholar] [CrossRef]
  10. Ghasemi, N.; Zare, F.; Hosano, H. A Review of Pulsed Power Systems for Degrading Water Pollutants Ranging from Microorganisms to Organic Compounds. IEEE Access 2019, 7, 150863–150891. [Google Scholar] [CrossRef]
  11. Trojanowicz, M.; Bojanowska-Czajka, A.; Bartosiewicz, I.; Kulisa, K. Advanced oxidation/reduction processes treatment for aqueous perfluorooctanoate (PFOA) and perfluorooctanesulfonate (PFOS)–A review of recent advances. Chem. Eng. J. 2018, 336, 170–199. [Google Scholar] [CrossRef]
  12. Chen, J.; Zhang, P.; Liu, J. Photodegradation of perfluorooctanoic acid by 185 nm vacuum ultraviolet light. J. Environ. Sci. 2007, 19, 387–390. [Google Scholar] [CrossRef]
  13. Moriwaki, H.; Takagi, Y.; Tanaka, M.; Tsuruho, K.; Okitsu, K.; Maeda, Y. Sonochemical decomposition of perfluorooctane sulfonate and perfluorooctanoic acid. Environ. Sci. Technol. 2005, 39, 3388–3392. [Google Scholar] [CrossRef]
  14. Lee, Y.; Lo, S.; Chiueh, P.; Liou, Y.; Chen, M. Microwave-hydrothermal decomposition of perfluorooctanoic acid in water by iron-activated persulfate oxidation. Water Res. 2010, 44, 886–892. [Google Scholar] [CrossRef] [PubMed]
  15. Lin, H.; Niu, J.; Ding, S.; Zhang, L. Electrochemical degradation of perfluorooctanoic acid (PFOA) by Ti/SnO2–Sb, Ti/SnO2–Sb/PbO2 and Ti/SnO2–Sb/MnO2 anodes. Water Res. 2012, 46, 2281–2289. [Google Scholar] [CrossRef]
  16. Trojanowicz, M.; Bartosiewicz, I.; Bojanowska-Czajka, A.; Kulisa, K.; Szreder, T.; Bobrowski, K.; Nichipor, H.; Garcia-Reyes, J.F.; Nałęcz-Jawecki, G.; Męczyńska-Wielgosz, S.; et al. Application of ionizing radiation in decomposition of perfluorooctanoate (PFOA) in waters. Chem. Eng. J. 2019, 357, 698–714. [Google Scholar] [CrossRef]
  17. Santos, A.; Rodrigues, S.; Pardo, F.; Romero, A. Use of fenton reagent combined with humic acids for the removal of PFOA from contaminated water. Sci. Total Environ. 2016, 563–564, 657–663. [Google Scholar] [CrossRef]
  18. Hori, H.; Yamamoto, A.; Hayakawa, E.; Taniyasu, S.; Yamashita, N.; Kutsuna, S.; Kiatagawa, H.; Arakawa, R. Efficient Decomposition of Environmentally Persistent Perfluorocarboxylic Acids by Use of Persulfate as a Photochemical Oxidant. Environ. Sci. Amp; Technol. 2005, 39, 2383–2388. [Google Scholar] [CrossRef]
  19. Cho, I.-H. Degradation and reduction of acute toxicity of environmentally persistent perfluorooctanoic acid (PFOA) using VUV photolysis and TiO2 photocatalysis in acidic and basic aqueous solutions. Toxicol. Environ. Chem. 2011, 93, 925–940. [Google Scholar] [CrossRef]
  20. Huang, J.; Wang, X.; Pan, Z.; Li, X.; Ling, Y.; Li, L. Efficient degradation of perfluorooctanoic acid (PFOA) by photocatalytic ozonation. Chem. Eng. J. 2016, 296, 329–334. [Google Scholar] [CrossRef]
  21. Mouele, E.M.; Tijani, J.; Badmus, K.; Pereao, O.; Babajide, O.; Zhang, C.; Shao, T.; Sosnin, E.; Tarasenko, V.; Fatoba, O.; et al. Removal of Pharmaceutical Residues from Water and Wastewater Using Dielectric Barrier Discharge Methods—A Review. Environ. Res. Public Health 2021, 18, 1683. [Google Scholar] [CrossRef] [PubMed]
  22. Mouele, E.S.M.; Tijani, J.O.; Fatoba, O.O.; Petrik, L.F. Degradation of organic pollutants and microorganisms from wastewater using different dielectric barrier discharge configurations—a critical review. Environ. Sci. Pollut. Res. 2015, 22, 18362–18435. [Google Scholar] [CrossRef] [PubMed]
  23. Singh, R.K.; Fernando, S.; Baygi, S.F.; Multari, N.; Thagard, S.M.; Holsen, T.M. Breakdown products from perfluorinated alkyl substances (PFAS) degradation in a plasma-based water treatment process. Environ. Sci. Technol. 2019, 53, 2731–2738. [Google Scholar] [CrossRef]
  24. Saleem, M.; Biondo, O.; Sretenovic, G.; Tomei, G.; Magaotto, M.; Pavarin, D.; Marotta, E.; Paradisi, C. Comparative performance assessment of plasma reactors for the treatment of PFOA; reactor design, kinetics, mineralization and energy yield. Chem. Eng. J. 2020, 382, 123031. [Google Scholar] [CrossRef]
  25. Obo, H.; Takeuchi, N.; Yasuoka, K. Decomposition of perfluorooctanoic acid in water using multiple plasma generation. IEEE Trans. Plasma Sci. 2013, 41, 3634–3639. [Google Scholar] [CrossRef]
  26. Stratton, G.R.; Dai, F.; Bellona, C.L.; Holsen, T.M.; Dickenson, E.R.; Thagard, S.M. Plasma-based water treatment: Efficient transformation of perfluoroalkyl substances in prepared solutions and contaminated groundwater. Environ. Sci. Technol. 2017, 51, 1643–1648. [Google Scholar] [CrossRef] [PubMed]
  27. Joshi, A.A.; Loke, B.R.; Arce, P.; Finney, W.C. Formation of hydroxyl radicals, hydrogen peroxide and aqueous electrons by pulsed streamer corona discharge in aqueous solution. J. Hazard. Mater. 1995, 41, 3–30. [Google Scholar] [CrossRef]
  28. Lu, X.; Naidis, G.V.; Laroussi, M.; Reuter, S.; Graves, D.B.; Ostrikov, K. Reactive species in non-equilibrium atmospheric-pressure plasmas: Generation, transport, and biological effects. Phys. Rep. 2016, 630, 1–84. [Google Scholar] [CrossRef] [Green Version]
  29. Yunqiu, C.; Jiushan, C.; Haifeng, J.; Qiang, C. Removal of tetracycline from wastewater by atmospheric pressure falling film dielectric barrier discharge plasma. Chin. J. Environ. Eng. 2020, 14, 359–371. [Google Scholar]
  30. Cui, T.; Shen, C.; Han, A.; Han, W.; Li, J.; Sun, X.; Shen, J.; Wang, L. Use of a novel coupled-oxidation tubular reactor (COTR)/NTP-DBD catalytic plasma in a synergistic electro-catalysis system for odorous mercaptans degradation. Chemosphere 2019, 216, 533–544. [Google Scholar] [CrossRef]
  31. Vanraes, P.; Ghodbane, H.; Davister, D.; Wardenier, N.; Nikiforov, A.; Verheust, Y.P.; van Hulle, S.W.H.; Oualid, H. Removal of several pesticides in a falling water film DBD reactor with activated carbon textile: Energy efficiency. Water Res. 2017, 116, 1–12. [Google Scholar] [CrossRef] [PubMed] [Green Version]
  32. Zhang, Q.; Zhang, H.; Zhang, Q.; Huang, Q. Degradation of norfloxacin in aqueous solution by atmospheric-pressure non-thermal plasma: Mechanism and degradation pathways. Chemosphere 2018, 210, 433–439. [Google Scholar] [CrossRef] [PubMed]
  33. Lukes, P.; Dolezalova, E.; Sisrova, I.; Clupek, M. Aqueous-phase chemistry and bactericidal effects from an air discharge plasma in contact with water: Evidence for the formation of peroxynitrite through a pseudo-second-order post-discharge reaction of H2O2 and HNO2. Plasma Sources Sci. Technol. 2014, 23, 015019–3. [Google Scholar] [CrossRef]
  34. Pioro, E.P. Review of Dextromethorphan 20 mg/Quinidine 10 mg (NUEDEXTA((R))) for Pseudobulbar Affect. Neurol. Ther. 2014, 3, 15–28. [Google Scholar] [CrossRef] [PubMed] [Green Version]
  35. Shang, K.; Li, W.; Wang, X.; Lu, N.; Jiang, N.; Li, J.; Wu, Y. Degradation of p-nitrophenol by DBD plasma/Fe2+/persulfate oxidation process. Sep. Purif. Technol. 2019, 218, 106–112. [Google Scholar] [CrossRef]
  36. Fang, X.; Guan, Z.; Wang, L. Research on Treatment of Wastewater by High Voltage Pulse Discharge. High Volt. Eng. 2000, 26, 29–31. [Google Scholar]
  37. Song, Z.; Tang, H.; Wang, N.; Zhu, L. Reductive defluorination of perfluorooctanoic acid by hydrated electrons in a sulfite-mediated UV photochemical system. J. Hazard. Mater. 2013, 262, 332–338. [Google Scholar] [CrossRef]
  38. Wang, X.; Wang, P.; Liu, X.; Hu, L.; Wang, Q.; Xu, P.; Zhang, G. Enhanced degradation of PFOA in water by dielectric barrier discharge plasma in a coaxial cylindrical structure with the assistance of peroxymonosulfate. Chem. Eng. J. 2020, 389, 124381. [Google Scholar] [CrossRef]
  39. Takeuchi, N.; Kitagawa, Y.; Kosugi, A.; Tachibana, K.; Obo, H.; Yasuoka, K. Plasma–liquid interfacial reaction in decomposition of perfluoro surfactants. J. Phys. D Appl. Phys. 2014, 47, 045203. [Google Scholar] [CrossRef]
  40. Yasuoka, K.; Sasaki, K.; Hayashi, R. An energy-efficient process for decomposing perfluorooctanoic and perfluorooctane sulfonic acids using dc plasmas generated within gas bubbles. Plasma Sources Sci. Technol. 2011, 20, 034009. [Google Scholar] [CrossRef]
  41. Hayashi, R.; Obo, H.; Takeuchi, N.; Yasuoka, K. Decomposition of Perfluorinated Compounds in Water by DC Plasma within Oxygen Bubbles. Electr. Eng. Jpn. 2015, 190, 9–16. [Google Scholar] [CrossRef]
  42. Majumdar, A.; Singh, R.K.; Palm, G.J.; Hippler, R. Dielectric barrier discharge plasma treatment on E. coli: Influence of CH4/N2, O2, N2/O2, N2, and Ar gases. J. Appl. Phys. 2009, 106, 084701. [Google Scholar] [CrossRef]
  43. Mahyar, A.; Miessner, H.; Mueller, S.; Aziz, K.H.H.; Kalass, D.; Moeller, D.; Kretschmer, K.; Robles, S.M.; Noack, J. Development and application of different non-thermal plasma reactors for the removal of perfluorosurfactants in water: A comparative study. Plasma Chem. Plasma Processing 2019, 39, 531–544. [Google Scholar] [CrossRef]
  44. Laurita, R.; Barbieri, D.; Gherardi, M.; Colombo, V.; Lukes, P. Chemical analysis of reactive species and antimicrobial activity of water treated by nanosecond pulsed DBD air plasma. Clin. Plasma Med. 2015, 3, 53–61. [Google Scholar] [CrossRef]
  45. Wu, J.; Xiong, Q.; Liang, J.; He, Q.; Yang, D.; Deng, R.; Chen, Y. Degradation of benzotriazole by DBD plasma and peroxymonosulfate: Mechanism, degradation pathway and potential toxicity. Chem. Eng. J. 2020, 384, 123300. [Google Scholar] [CrossRef]
  46. Li, F.; Wei, Z.; He, K.; Blaney, L.; Cheng, X.; Xu, T.; Liu, W.; Zhao, D. A concentrate-and-destroy technique for degradation of perfluorooctanoic acid in water using a new adsorptive photocatalyst. Water Res. 2020, 185, 116219. [Google Scholar] [CrossRef]
Figure 1. (a) Schematic diagram of the SF-DBD system used in PFOA-polluted water treatment. (b) The reactor diagram used in PFOA simulated wastewater treatment.
Water 14 02420 g001
Figure 2. The typical I and V waveforms of two used powers (a) sinusoidal ac; (b) negative pulse.
Water 14 02420 g002
Figure 3. (a) degradation of PFOA with various concentrations of PFOA. Inset shows the first-order degradation kinetics curves of PFOA under Ar-plasma treatment. (The lines were fitted results). (b) energy yield and kinetic constant at different concentrations. The experimental conditions: negative pulse power supply, peak voltage: 13 kV, power frequency: 6 kHz, pulse width: 500 ns; Ar plasma; average power: 26 W.
Water 14 02420 g003
Figure 4. The degradation efficiency of PFOA in (a) sinusoidal AC power supply and nanosecond pulse power supply (working gas: Ar; initial concentration: 75 mg L−1) (b) different applied power in nanosecond pulse power supply.
Water 14 02420 g004
Figure 5. (a) The degradation efficiency of PFOA under plasma from three different gases. (b) First-order kinetics and kinetic constants under plasma from different discharge gases (the lines were fitted results and the inset shows the kinetic constants). Experimental conditions: negative pulsed power, peak voltage = 12 kV, power frequency = 6 kHz, pulse width = 500 ns, average power = 22 W.
Water 14 02420 g005
Figure 6. (a) The degradation efficiencies and kinetic constants of PFOA in O2, Ar and mixtures of O2 and Ar; (b) The degradation efficiencies and kinetic constants of PFOA in the air, Ar and mixtures of air and Ar; Experimental conditions: the power supply: negative pulse power supply; peak voltage: 12 kV; power frequency: 6 kHz; pulse width: 500 ns; average power: 22 W.
Water 14 02420 g006
Figure 7. (a) Degradation efficiencies and rate constants of PFOA under different solution conductivity; (b) Degradation efficiencies and rate constants of PFOA under different pH. Experimental conditions: the power supply: negative pulse power supply; peak voltage: 11 kV; working gas: Ar; power frequency: 6 kHz; pulse width: 500 ns; power: 15 W; [NaCl] = 1 M; [H2SO4] = 1 M; [NaOH] = 1 M.
Water 14 02420 g007
Figure 8. Variation of (a) TOC concentration and (b) the defluorination versus SFDBD plasma treatment time. Experimental conditions: negative pulse power; peak voltage: 15 kV; power frequency: 6 kHz; pulse width:500 ns; power: 43 W.
Water 14 02420 g008
Table 1. Energy yield under various parameters.
Discharge ModeInitial Concentration (mg L−1)Work GasAverage Power (W)Degradation Efficiency (%)Energy Yield
(μg kJ−1)
SF-DBD75Ar11.175337.8
SF-DBD75Ar13.884304.3
SF-DBD75Ar17.193.2272.5
SF-DBD75Ar24.299204.5
AC-DBD75Ar24.766136.4
Table 2. Comparison of energy yields in various treatment processes.
MethodsConcentration (mg/L)Water Volume (mL)Treatment (min)Power (W)Degradation Efficiency (%)Energy Yield (μg/kJ)Ref.
DBD Plasma/PMS/O35150120394.833.3[38]
DC Plasma41.42015010989.03[39]
DC plasma5050240//7.2[40]
DC plasma41.4/180321001.67[41]
Multiple plasma44.92001406088.815.8[25]
our work752005024.299204.5-
Publisher’s Note: MDPI stays neutral with regard to jurisdictional claims in published maps and institutional affiliations.

