
Tomato Evapotranspiration, Crop Coefficient and Irrigation Water Use Efficiency in the Winter Period in a Sunken Chinese Solar Greenhouse


1
Beijing Key Laboratory of Urban Hydrological Cycle and Sponge City Technology, College of Water Sciences, Beijing Normal University, Beijing 100875, China
2
PowerChina Zhongnan Engineering Corporation Limited, Changsha 410014, China
*
Author to whom correspondence should be addressed.
Water 2022, 14(15), 2410; https://doi.org/10.3390/w14152410
Submission received: 3 July 2022
/
Revised: 26 July 2022
/
Accepted: 29 July 2022
/
Published: 3 August 2022
(This article belongs to the Special Issue Agricultural Water Saving: Advanced Technologies for Water Resources Efficient Utilization)
Abstract
:In the Northern China Plain (NCP), sunken solar greenhouses (SSG) are now increasingly being used for vegetable cultivation in winter due to low winter temperatures. Investigating plant transpiration and determining crop coefficients are helpful when developing irrigation scheduling and improving crop growth. In this study, a three-season experiment was conducted in a commercial tomato SSG to investigate changes in microclimate, sap flow (SF), photosynthesis traits and plant physiological parameters, and to calculate the crop coefficient and evaluate the irrigation efficiency using current irrigation management practices. Results show that the average transmissivity from top plastic covers was 0.69, and the inside temperature increased by approximately 10 °C in November and 15–18 °C in December, which guaranteed the growth of tomatoes in winter. The leaf photosynthesis rate (Pn) is linearly related to radiation, however, a concave quadratic function is a better fit for Pn and VPD, with the highest Pn at approximately 1.0 kPa VPD; leaf transpiration is positively and linearly related to both radiation and VPD. Therefore, increasing greenhouse transmissivity and maintaining an internal VPD of approximately 1 kPa could produce a high leaf Pn and low transpiration concurrently. Daily total SF was linearly correlated with solar radiation, VPD and temperature with determination coefficients of 0.87–0.96, 0.89–0.91 and 0.62–0.84, respectively. Correcting the slope of SF to radiation with VPD (SF = (0.12 + 0.14VPD)Rs), R2 increased by 0.08, and the root mean square error and relative error decreased by 0.047 mm day−1 and 6.53%, respectively. Therefore, this integrated equation is recommended to estimate daily tomato transpiration when plant height is approximately 1.5 m, and the leaf area index (LAI) is between 2 and 2.5. During the fruit expansion and ripening period, the average basal crop coefficients (Kcb) for greenhouse tomatoes in winter was between 0.99 and 1.11. The irrigation efficiency increased from 0.3 in the first season to 0.6–0.69 in the second and third seasons when the tensiometer method was used. Therefore, using the tensiometer method to guide tomato irrigation could markedly improve irrigation efficiency in greenhouses.
1. Introduction
Due to the low temperatures in winter in the Northern Hemisphere, solar greenhouses are widely used to improve air temperature and enhance vegetable growth cultivation globally, including in North China [1]. Tomatoes are a vegetable that is widely consumed worldwide due to its high contents of lycopene, vitamin C and vitamin B [2,3]. Based on data from the FAO, the global total production of fresh tomato was 186.82 million tons in 2020, and the production in China accounted for 35% of the total (https://www.fao.org/faostat/zh/#data/QCL/visualize, accessed on 12 March 2022). The North China Plain (NCP) is the primary vegetable production region in China and produces approximately 30% of all vegetables produced in China [4].
Tomato plant growth and yield production are sensitive to soil water status and thus irrigation [5]. Bogale, et al. [6] found that tomato yields decreased by 24–38% when irrigation was 50% of the full irrigation amount. Liu, et al. [7] showed that with the same amount of drip irrigation, increasing irrigation frequency can markedly improve the yield, water use efficiency and some nutritional quality indices of tomatoes. Wang and Xing [8] also showed that compared with the 100% ETo irrigation level, where ETo is the reference crop evapotranspiration, the 75% ETo irrigation level increased water use efficiency, lycopene, and vitamin C by 7.25%, 26.87% and 17.68%, respectively, indicating that excessive irrigation will reduce the quality of tomato fruit. Therefore, developing irrigation scheduling based on crop water requirements or evapotranspiration could enhance crop production and improve the quality of tomato fruits.
Under soil surface mulch conditions, crop evapotranspiration (ET) is dominated by crop transpiration (Tr). Sap flow methods are widely used currently to investigate crop transpiration [9,10]. At the daily scale, given that the change in water storage in the crops is negligible compared to the daily water flux, the daily total sap flow (SF) equals the crop Tr [11,12]. Thus, SF data are used to schedule irrigation and assess water use efficiency [13,14,15].
Crop Tr is strongly influenced by microclimate. In most cases, crop Tr is well correlated with solar radiation, vapor pressure deficit and air temperature under sufficient soil water conditions [10,13,16,17]. However, the correlation between crop Tr and microclimate depends on the type of crop, growing environment, moisture conditions and agronomic practices [9,16,18]. Under greenhouse cultivation conditions, crop Tr is reported to first be related to radiation and vapor pressure deficits due to its strong decoupling condition [10,19]. Therefore, some radiation-based methods have been developed to estimate crop ET and Tr under protected cultivation conditions [20,21].
Plant transpiration is also controlled by stomatal conductance. Under protected conditions such as screenhouses, shading could increase canopy conductance for irrigated citrus, banana plants, grapefruit, and apple orchards [13,22,23,24]. The increased canopy conductance under protected conditions may partially compensate for the potential reduction in photosynthesis due to shading and finally have a marginal effect on crop growth and yield [13]. Also, Liu, et al. [13] reported that compared with the outside, the banana Tr inside a screenhouse was reduced by 10% and this reduction rate in banana Tr was much lower than the 33% reduction in reference crop evapotranspiration ETo and 44% in water evaporation of a Class-A pan, primarily due to an inside plant regulation mechanism increasing its canopy conductance to shift the reduction in radiation. Increased stomatal conductance could thus enhance crop photosynthesis and improve crop growth and yield production [25,26].
Recently, a new type of solar greenhouse has been used in winter to efficiently improve the inside temperature in the North China Plain (NCP). This greenhouse is characterized by a 0.5–2 m lower soil surface and 3–7 m thick back wall compared to a traditional solar greenhouse, in which the soil surface is the same as the outside surface and the thickness of the back walls is approximately 20–50 cm [27,28]. Liu, et al. [29] investigated the microclimate in this new type of greenhouse, which is referred to as a sunken solar greenhouse (SSG), and found that the inside temperature was on average 16.3–18.2 °C higher than the outside in winter growth seasons, which markedly improved cucumber growth and resulted in high cucumber yield.
Currently, tomatoes are increasingly cultivated in SSG in North China to achieve high yields and economic benefits. Based on a field investigation and the literature, local farmers often use far more water (300~600 mm) than that required (200~300 mm) to avoid water deficits in greenhouse plants, including tomato and cucumber crops [30,31,32]. Liu, et al. [33] compare the total irrigation water in drip irrigation and local furrow irrigation in cucumber greenhouse and found that the total drip irrigation water (410–640 mm) in seven crop seasons was approximately half of the furrow irrigation amount (700~1200 mm), however achieved similar cucumber yield. This high water use practice by local farmers intensifies water resource risk in the North China Plain, in which the water resources (including surface water resource and groundwater resource) per capita are approximately 240 m3 and are 1/30 of 7500 m3 in global mean water [34]. Therefore, it is critical to know the exact crop evapotranspiration of tomatoes in this new type of greenhouse to support irrigation planning and water resource allocation.
In this study, a three-season experiment from 2018 to 2021 was conducted in a commercial sunken solar greenhouse on the NCP to (1) investigate the sap flow and plant transpiration curves in the winter; (2) analyze the sap flow response to the microclimate and determine the crop coefficient; and (3) evaluate the irrigation water use efficiency in the winter season in the present cultivation practice in the SSG.
2. Materials and Methods
2.1. Field Description
A three-season winter experiment from September 2018 to January 2021 was performed in a commercial solar greenhouse at the Dacaozhuang National Seed Breeding Experimental Station in Ningjin County, Hebei Province, China (37°30′6″ N; 114°57′22″ E). Based on the data from the Chinese national weather station in Ningjin county, the annual mean temperature in the study area is 13 °C, and the annual total sunshine hours are approximately 2430 h. During winter, the monthly mean temperatures are 5, −1 and −3 °C in November, December, and January, respectively, which are not suitable for most vegetables. The mean annual total precipitation is 430 mm, and the mean annual relative humidity is 66%. The soil texture at 0–40 cm depth in the greenhouse is silty loam, with a mean field capacity of 0.40 cm3 cm−3, a wilting point of 0.22 cm3 cm−3 and a soil bulk density of 1.40 g cm−3. The contents of nitrate nitrogen, available potassium, and available phosphorus in the 0–40-cm-deep soil layer measured before this experiment were 29.81 mg kg−1, 150.5 mg kg−1, and 7.02 mg kg−1, respectively.
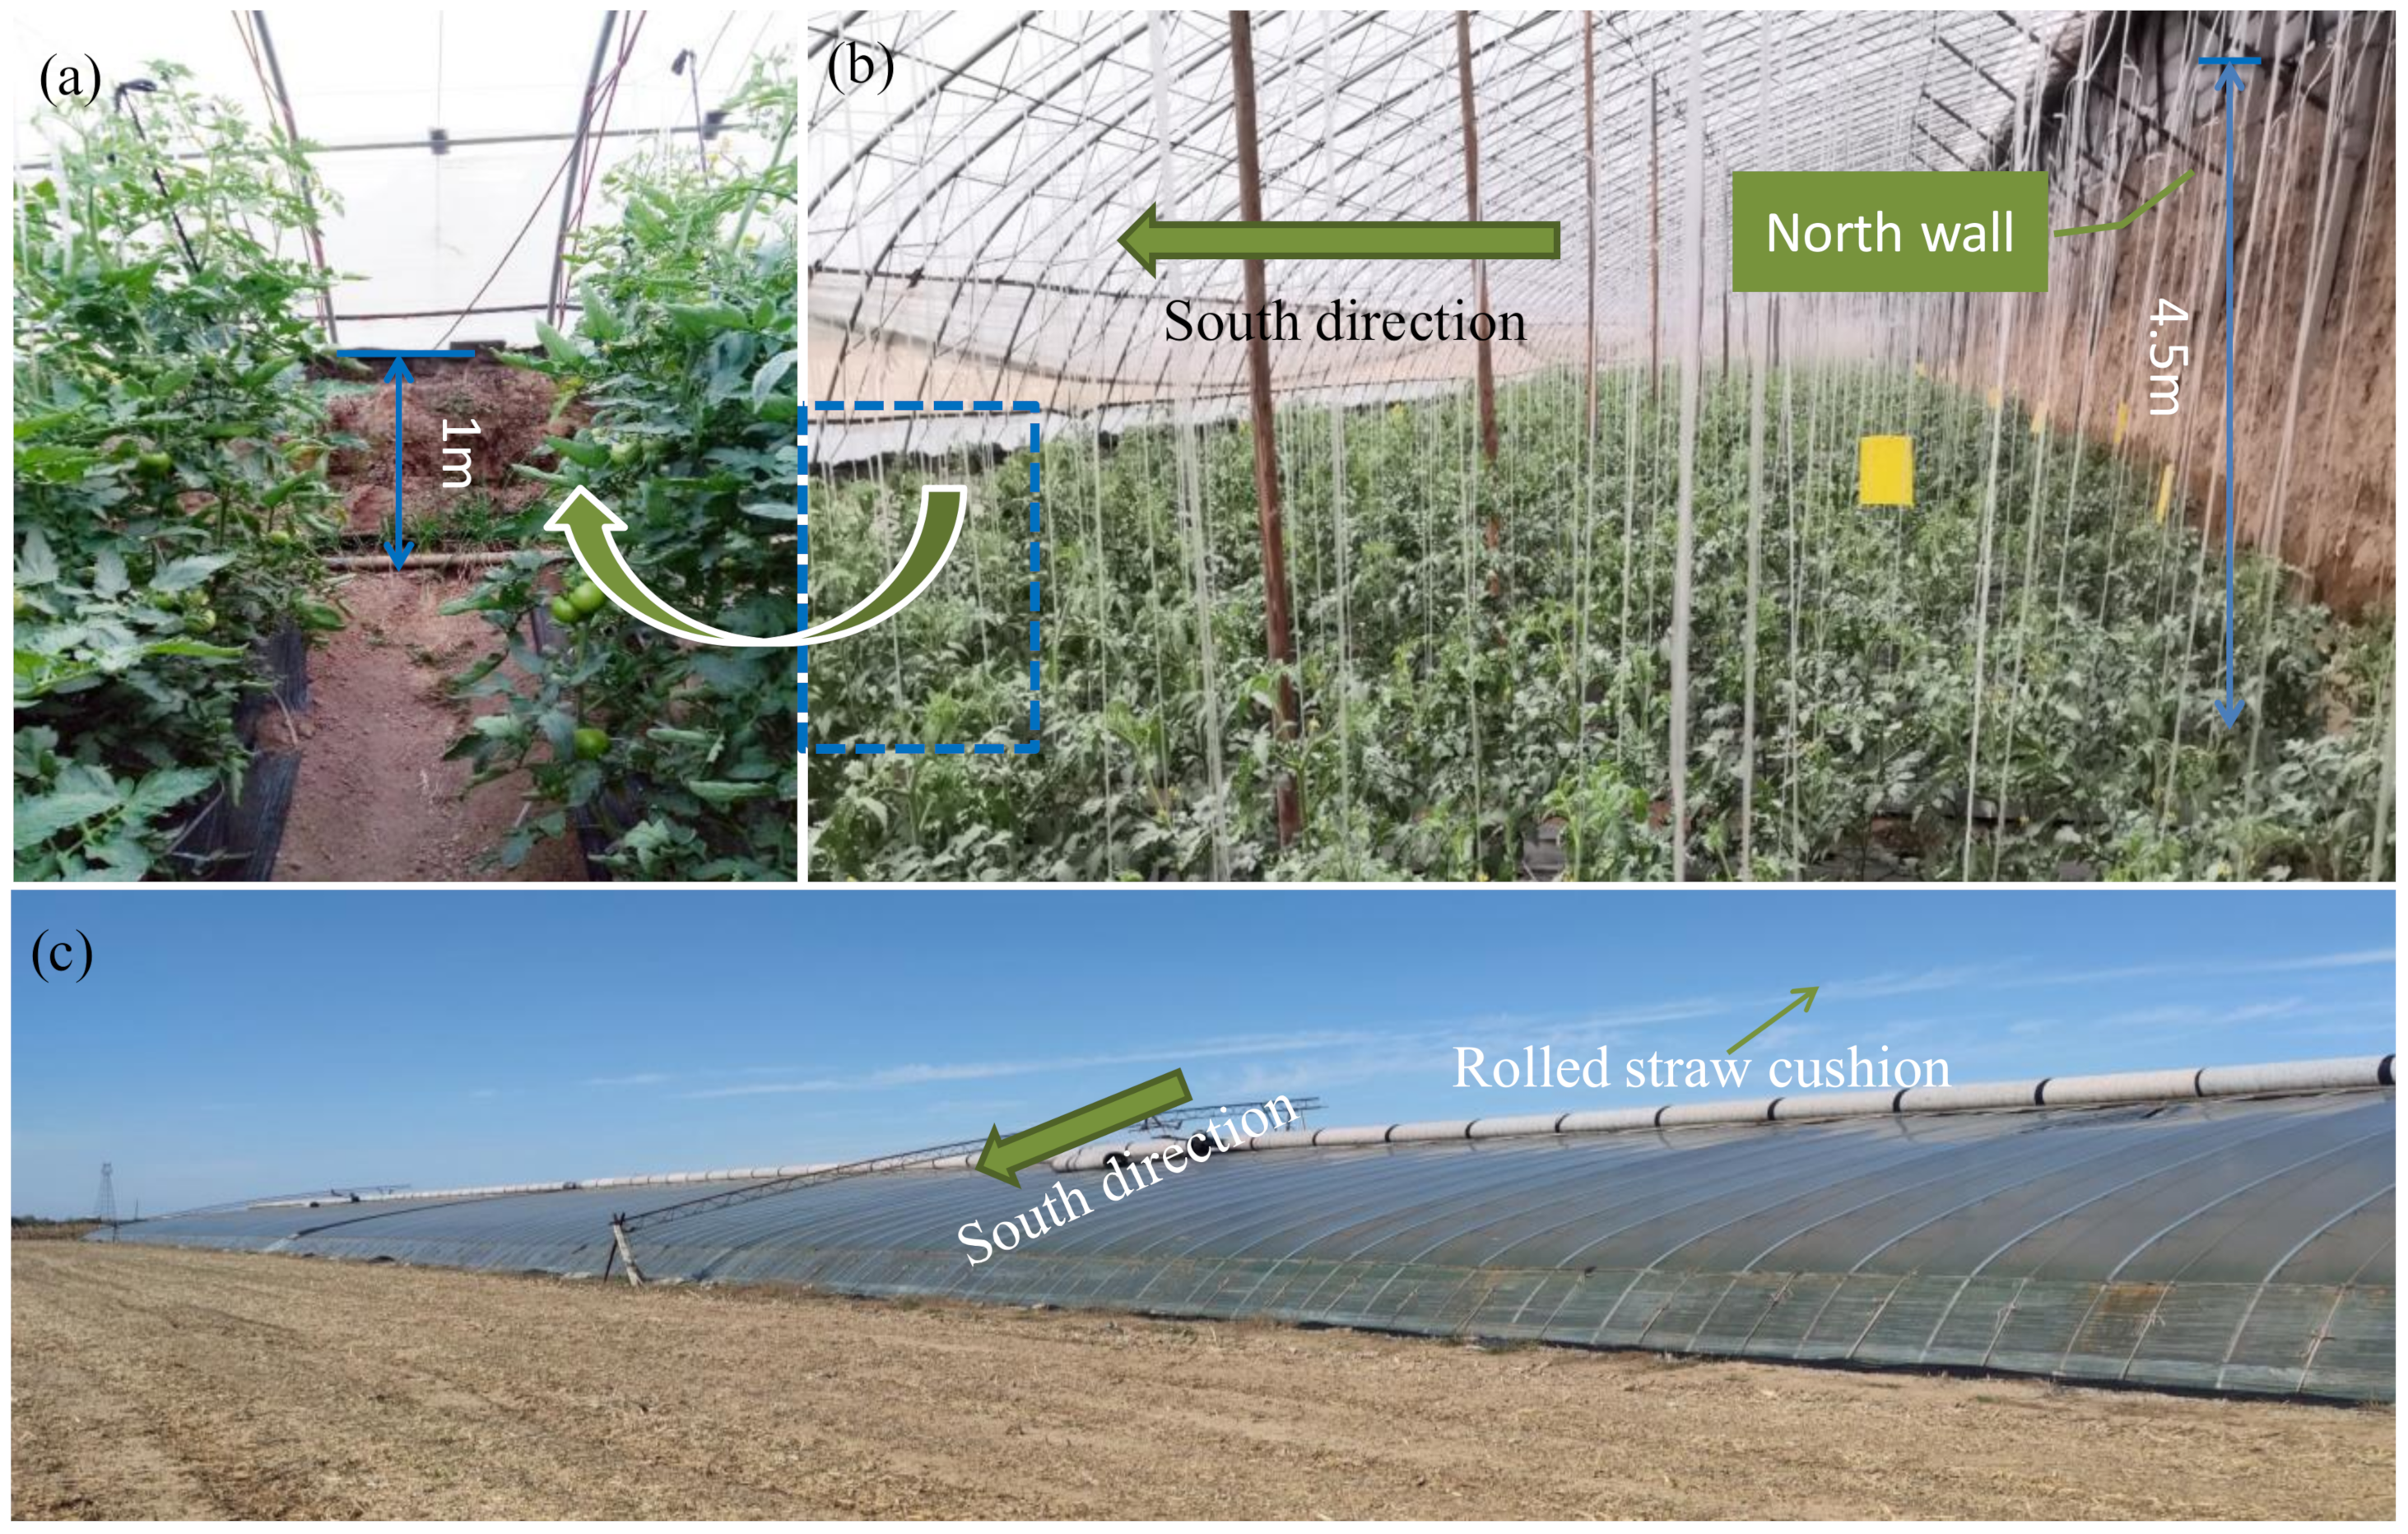
The SSG used in this study is a new type of commercial greenhouse in the NCP. The soil surface in the SSG is 1 m lower than the ground level. The SSG is 166 m in length and 10 m in width with a total area of 1660 m2. To collect more solar radiation for plant growth, the SSG is oriented east–west and faces the south. The top of the back wall is 1.2 m thick, and the bottom is 5 m thick. The top of the greenhouse was covered with a 0.1-mm thick transparent polyethylene film. At night in winter, the outside of the film is covered with a rolled straw curtain to reduce convective heat loss. The vent at the top of the greenhouse near the north wall is used for natural ventilation and is typically opened at noon for approximately 1–2 h when the inside temperature increases to 25–30 °C in winter. Photos of the sunken solar greenhouse (SSG) used in this study are shown in Figure 1.
2.2. Plant Management
Three successive tomato cultivation seasons in winter from September to January (from September 2018 to January 2021) were included in this study. Tomatoes were planted in single ridge and double rows, and each ridge was 9 m long, 1 m wide and 0.15–0.2 m high. The distance between ridges was 0.4 m for field management and tomato harvesting. The plant spacing was 0.4 m in each row, and the average planting density was 3.6 plants per m2. Drip irrigation was used in the experiments. A drip tape with 9-m length was installed in each tomato planting row, and two drip tapes were installed on each ridge. The length of the drip tape in each row was 9 m length, which was the length of the plant row. All ridges were covered by 1-m-wide and 0.008-mm-thick black plastic sheets to reduce weed growth. The empty surface between two adjacent ridges was not covered by a plastic sheet.
The dripper flow rate was 2.5 L h−1 under a working pressure of 0.1 MPa (Hebei Runtian Water-Saving Equipment Co., Ltd., Shijiazhuang, China). Irrigation water was initially taken from a well near the SSG and then stored in a 10 m−3 underground reservoir inside the SSG. To control the working pressure and record the irrigation water amount, a filter, water meter, and pressure meter were installed in the drip irrigation system’s head. In the first season (2018), the farmer irrigated the field according to his experience, and irrigation generally began when the farmer noticed that leaf emergence was poor, and plant and growth rates had slowed. With local practice, the soil water content varied widely, and the water use efficiency was low (see Section 4.1). Then, in the second and third seasons, we installed three dial-type tensiometers (Beijing Waterstar Tech Co., Ltd., Beijing, China) at a depth of 20 cm under the drip tape to enable the farmers to schedule irrigation [35,36,37]. In this case, irrigation was started when the soil matric potential reached −35 kPa. The total irrigation for the 2018, 2019 and 2020 growing seasons was 516 mm, 508 mm and 461 mm, respectively, and the corresponding irrigation amount per plant were 143, 141 and 128 L plant−1, respectively.
Fertilizer was supplied through basal and top-dressing applications. The base fertilizer was a compound fertilizer with a N:P2O5:K2O nutrient distribution of 15:15:15 (Lomon Land Agriculture Co., Ltd., Mianzhu, China). The top-dressing fertilizers were soluble fertilizers with N:P2O5:K2O nutrient distributions of 15:5:35 (Lomon Land Agriculture Co., Ltd., Mianzhu, China) and 20:20:20 (Hong Sifang Co., Ltd., Hefei, China). The average amounts of N, P2O5 and K2O applied in each planting season were 133 kg ha−1 for the base fertilizer and 83, 68 and 114 kg ha−1 for the top-dressing fertilizer, respectively. Field management, including pesticide and fungicide application, crop tip pruning and other agronomic practices, was the same as local management and was performed by the owner of the SSG.
3. Measurement
3.1. Sap Flow
The sap flow measurement period was from flowering and expansion to ripening, during which the tomato plants were sufficiently large to install the sap flow gauges (Flow32-1K, Campbell Scientific, Logan, UT, USA), and crop transpiration was high. Eight representative plants with similar growth statuses were selected in the middle of the SSG for sap flow measurement. These eight plants were arranged in two adjacent crop rows, with four plants in each row, controlled by two irrigation tapes. The irrigation tape was 9-m length, therefore, the eight selected plants were assumed to accept the same amount of irrigation water. One set of SF gauges was installed on a plant stem approximately 15 cm above the ground. The measured signals were sampled and converted to sap flow flux at 60-s intervals, and then averaged and recorded at 30-min intervals using a CR1000 datalogger (Campbell Scientific, Logan, UT, USA).
3.2. Soil Water
Three soil water sensors (Model MPS-6 sensor, METER Group, Inc., Pullman, WA, USA) were installed in the SSG to measure the soil matric potential (SMP) 20 cm deep in the three planting seasons. The SMP data measured by the sensor were sampled at 60-s intervals and then averaged and recorded at 30-min intervals using an EM50 datalogger (METER Group, Inc., Pullman, WA, USA). To guide farmers in irrigation, three dial-type tensiometers (Beijing Waterstar Tech. Co., Ltd., Beijing, China) were installed simultaneously 20 cm deep in the 2019 and 2020 planting seasons. The tensiometer data were manually recorded every day.
3.3. Microclimate
Meteorological data were measured in the center of the SSG using a meteorological station. Monitoring factors included total solar radiation (Model TBQ-2, Jinzhou Sunshine Technology Co. Ltd., Jinzhou, China), soil heat flux density (HF-1, Jinzhou Sunshine Technology Co. Ltd., Jinzhou, China), air temperature, relative humidity (Model VP-4, METER Group, Inc., Pullman, WA, USA) and air velocity (two-dimensional ultrasonic anemometer ATMOS 22, METER Group, Inc., Pullman, WA, USA) at a height of 2 m. The microclimate parameters outside the SSG were measured by the automatic climate station at the experimental station. All microclimate data were sampled at 60-s intervals and averaged and recorded at 30-min intervals.
3.4. Photosynthetic Index
The photosynthetic parameters of the tomato crop were measured in the middle growth period in the last two seasons using a Li-6800 portable photosynthesis system (LI-COR Biosciences, Lincoln, NE, USA). The measured days were 21/12/2019, 22/12/2019, 26/12/2020 and 27/12/2020. During measurement, the first full growth leaf from the top down was selected. Three leaves from three different plants were selected, and the mean for each index was used for data analysis. The primary measured indices at the leaf level included net photosynthetic rate (Pn), transpiration rate (TrL), stomatal conductance (Gs) and intercellular CO2 concentration (Ci). The measurement period was 11:00–16:00 on December 21, 2019, 10:00–16:00 on December 22, 2019, and 9:00–16:00 on both December 26 and 27 in 2020. The minor differences in the measurement period among the four days were due to the outside climate conditions and top-curtain management.
3.5. Plant Growth and Yield
Three sample plants were labeled at the first measurement and then used for the following measurements in the winter. Plant height and leaf area were first measured when plant height was approximately 100 cm high and then approximately once a month.
Leaf area was determined by the maximum leaf length and width. Eleven leaves with different sizes were taken from field plants. The leaf area for each leaf was measured using a leaf area meter (Model LI-3000C, LI-COR Biosciences, Lincoln, NE, USA), and the maximum length and width were also measured simultaneously. Then, the relationship between leaf area and the maximum leaf length and width was fitted as: A = 0.37 L × W (N = 11, R2 = 0.92), where A is the area of a leaf (cm2), and L and W are leaf length and width, respectively (cm). The mean leaf area per plant (A) and the soil surface (S, in cm2) covered by a plant were used to calculate the leaf area index (LAI), which was derived as LAI = A/S.
Fresh tomato fruits were harvested and sold in sequence according to the order of fruit ripening. At each sale date, the total production of fresh tomatoes in the SSG was recorded. The sum of all sales was recorded as the seasonal tomato yield and then converted to the amount in unit area (ton ha−1) for data comparison and water productivity calculation. It should be noted that the tomato yield in this study only considered the saleable fruits.
4. Calculation
4.1. Reference Crop Evapotranspiration
Because of the extra high aerodynamic resistance induced by low wind velocity (0.01–0.3 m s−1), ETo will be underestimated in greenhouse under low wind velocity situations [38]. Therefore, the ETo inside greenhouse, referred to ETo,GH, was computed using a modified Penman–Monteith method established in greenhouse [38,39], in which a constant aerodynamic resistance of 295 s m−1 was utilized to counterbalance the effect of the low wind speed on ETo.
where ETo,GH is the reference evapotranspiration (mm d−1); Rn is the net radiation (MJ m−2 d−1); G is the soil heat flux density (MJ m−2 d−1); T is the mean air temperature (°C); Δ is the saturation slope of the saturation vapor pressure curve at T (kPa °C−1); γ is the psychrometric constant (kPa °C−1); and VPD is the vapor pressure deficit (kPa).
4.2. Basal Crop Coefficient
The basal crop coefficient (Kcb) was defined as the ratio of crop transpiration (Tr) to reference crop evapotranspiration ETo when the average soil water content of the root zone was adequate to sustain full plant transpiration [40]. In this study, the soil surface was covered by a plastic sheet, and the total water use was from crop transpiration. At the daily base, the crop transpiration amount can be regarded as the daily sap flow when the water storage in plant tissue is negligible. Then, Kcb is calculated as the ratio of plant sap flow (SF) to ETo,GH:
where Kcb is the basal crop coefficient; SF is the daily sap flow amount (mm d−1); and ETo,GH is the daily reference evapotranspiration (mm d−1) in greenhouse.
4.3. Irrigation Water Use Efficiency and Irrigation Water Productivity
The irrigation water use efficiency (IE) is defined as the ratio of real crop evapotranspiration to the irrigation water amount (I) [41]. In this study, the irrigation water amount was directly measured by a water meter deployed in the main pipe, and the real crop evapotranspiration was considered to be crop transpiration and was replaced by SF because the soil surface was covered by plastic sheets, and the soil evaporation can be negligible. Irrigation water productivity (WPI) is defined as the ratio of crop production to irrigation water depth [42]. The equations for these two indicators are:
where IE is the irrigation water use efficiency (dimensionless); SF is the measured sap flow amount (mm); I is the irrigation depth (mm); WPI is the irrigation water productivity (kg m−3); and Y is the total tomato yield in a growth season (kg ha−1). Because sap flow was only measured in the flowering and ripening stages, we only calculated the IE in the SF measurement period, and the irrigation depth in the SF measurement period was used.
4.4. Statistical Analysis
All computations in this study were performed using a Microsoft Excel template, and all graphs in this study were generated using Origin 2018 (OriginLab Co., Northampton, MA, USA). The regressed relationships between SF and microclimatic variables were calculated in Microsoft Excel and evaluated by parameters of the root mean square error (RMSE), the mean relative error (MRE), the Nash-Sutcliffe efficiency (NSE), and the determination coefficient of the regressed lines (R2):
where Pi is the ith simulated value; Qi is the ith observed value; Pave is the mean of the simulated data; Qave is the mean of the observed data; and n is the total number of observed values. Low absolute MRE, high NSE and R2, and low RMSE indicate a better fit. When NSE > 0.5, the fitting result is acceptable [43,44,45].
5. Results
5.1. Inside and Outside Microclimate and Soil Matric Potential
The inside and outside monthly mean solar radiation, temperature, relative humidity, vapor pressure deficit and wind speed in October, November, December, and January in the three experimental seasons are summarized in Table 1. The internal meteorological data in the first season were measured from October 27, 2018; thus, the mean meteorological data in October are only for October 27–31 in 2018. Wind speed measurements are missing for the 2018 season due to instrument damage.
During the winter, the outside solar radiation (Rs) was higher in October (11–15 MJ m−2 d−1) and then gradually decreased to 6.9–9.3 MJ m−2 d−1 in November and December. Similarly, the interior Rs decreased from 8.3–8.9 to 5–6 MJ m−2 d−1 in November and December. The transmissivity of the top plastic cover, which is the ratio of inside and outside Rs, ranged from 0.62 to 0.72 with a mean of 0.69.
The outside temperature (Temp) decreased from approximately 15 °C in October to –1 °C in December. Although the inside temperature showed a sequential decline from 18 °C in October to 14–17 °C in December, the inside temperature difference among the three months was small (~2–4 °C). The inside monthly mean temperatures were 3–4 °C in October, ~10 °C in November and 15–18 °C in December higher than the corresponding outside temperatures, indicating a marked temperature improvement in winter in this SSG.
The inside monthly mean relative humidity (RH) ranged from 57% to 92% and was 2% to 29% higher than that of outside, primarily due to the short period of natural ventilation. Particularly in December, the inside monthly mean RH was 29%, 18% and 23% higher than those outside in the three growing seasons, respectively. The inside vapor pressure deficit (VPD) was also generally 0–0.67 kPa higher than that of outside due to the 3–18 °C higher temperature, indicating that in most cases, the reduced VPD due to the higher inside RH is not sufficient to offset the increased VPD due to the higher inside temperature. The monthly mean inside wind velocities ranged between 0.14 and 0.32 m s−1 due to the isolated greenhouse environment; the monthly average outside wind speed ranged from 0.41 to 2.12 m s−1.
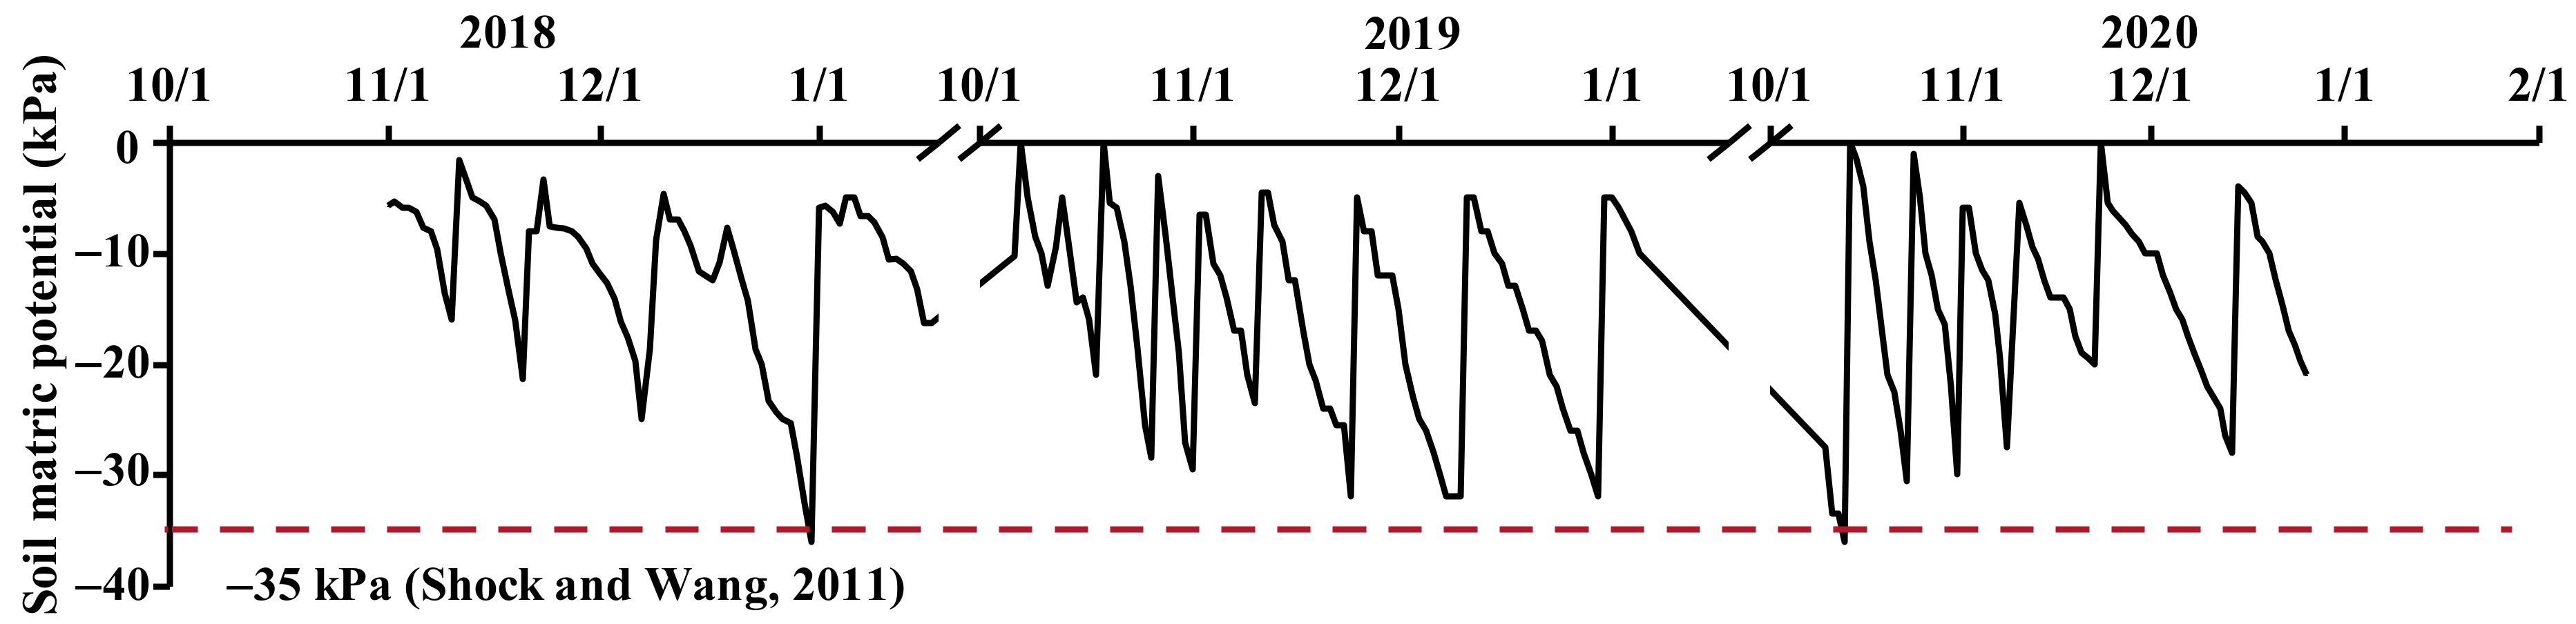
The soil matric potentials (SMPs) measured at a depth of 20 cm in the root zone are shown in Figure 2. In the 2018 season, irrigation started when the SMP reached −15 to −35 kPa, indicating high SMP variation and unstable irrigation management. In the 2019 and 2020 seasons, most irrigation started when the SMP reached the target threshold of −35 kPa, indicating relatively good irrigation management. Over the three seasons, the SMPs were higher than −35 kPa, the non-water-stress threshold for tomato by Shock and Wang [46]. Therefore, tomato crops in the three seasons grew with sufficient soil water conditions.
5.2. Growth and Yield
Table 2 shows the plant growth indices (LAI and height) and commercial fruit yield in the three seasons. The measured LAI varied between 0.92 and 3.31, and plant height varied between 81 and 165 cm. Typically, crop LAI and height may increase with growth, as shown in the data from the 2019 season. The LAI decreased from 2.86 to 2.2 in the 2018 season and from 3.3 to 2.2 in the 2020 season. The crop height decreased from 165 to 147 cm in the 2018 season primarily due to crop management. With local practice, the stems and leaves above the fifth fruit branch were trimmed after the fifth branch had flowered to suppress apical dominance. The leaves at the lower part of the stems were also removed during the later growth stages to enhance ventilation and radiation transmission in the canopy as well as to reduce water and nutrition consumption.
The commercial tomato fruit yields were similar in the 2018 and 2020 seasons, with production levels of 86.5 and 83.6 ton ha−1, respectively. The yield in the 2019 season was 56.3 ton ha−1 and was 33–35% lower than those in the 2018 and 2020 seasons due to the extra high temperature (maximum daily temperature > 40 °C) at the beginning of the 2019 tomato season, which damaged the tomato seedling development, limited tomato plant growth in the early season, and finally resulted in a smaller plant LAI and lower height (Table 2).
5.3. Photosynthetic Traits
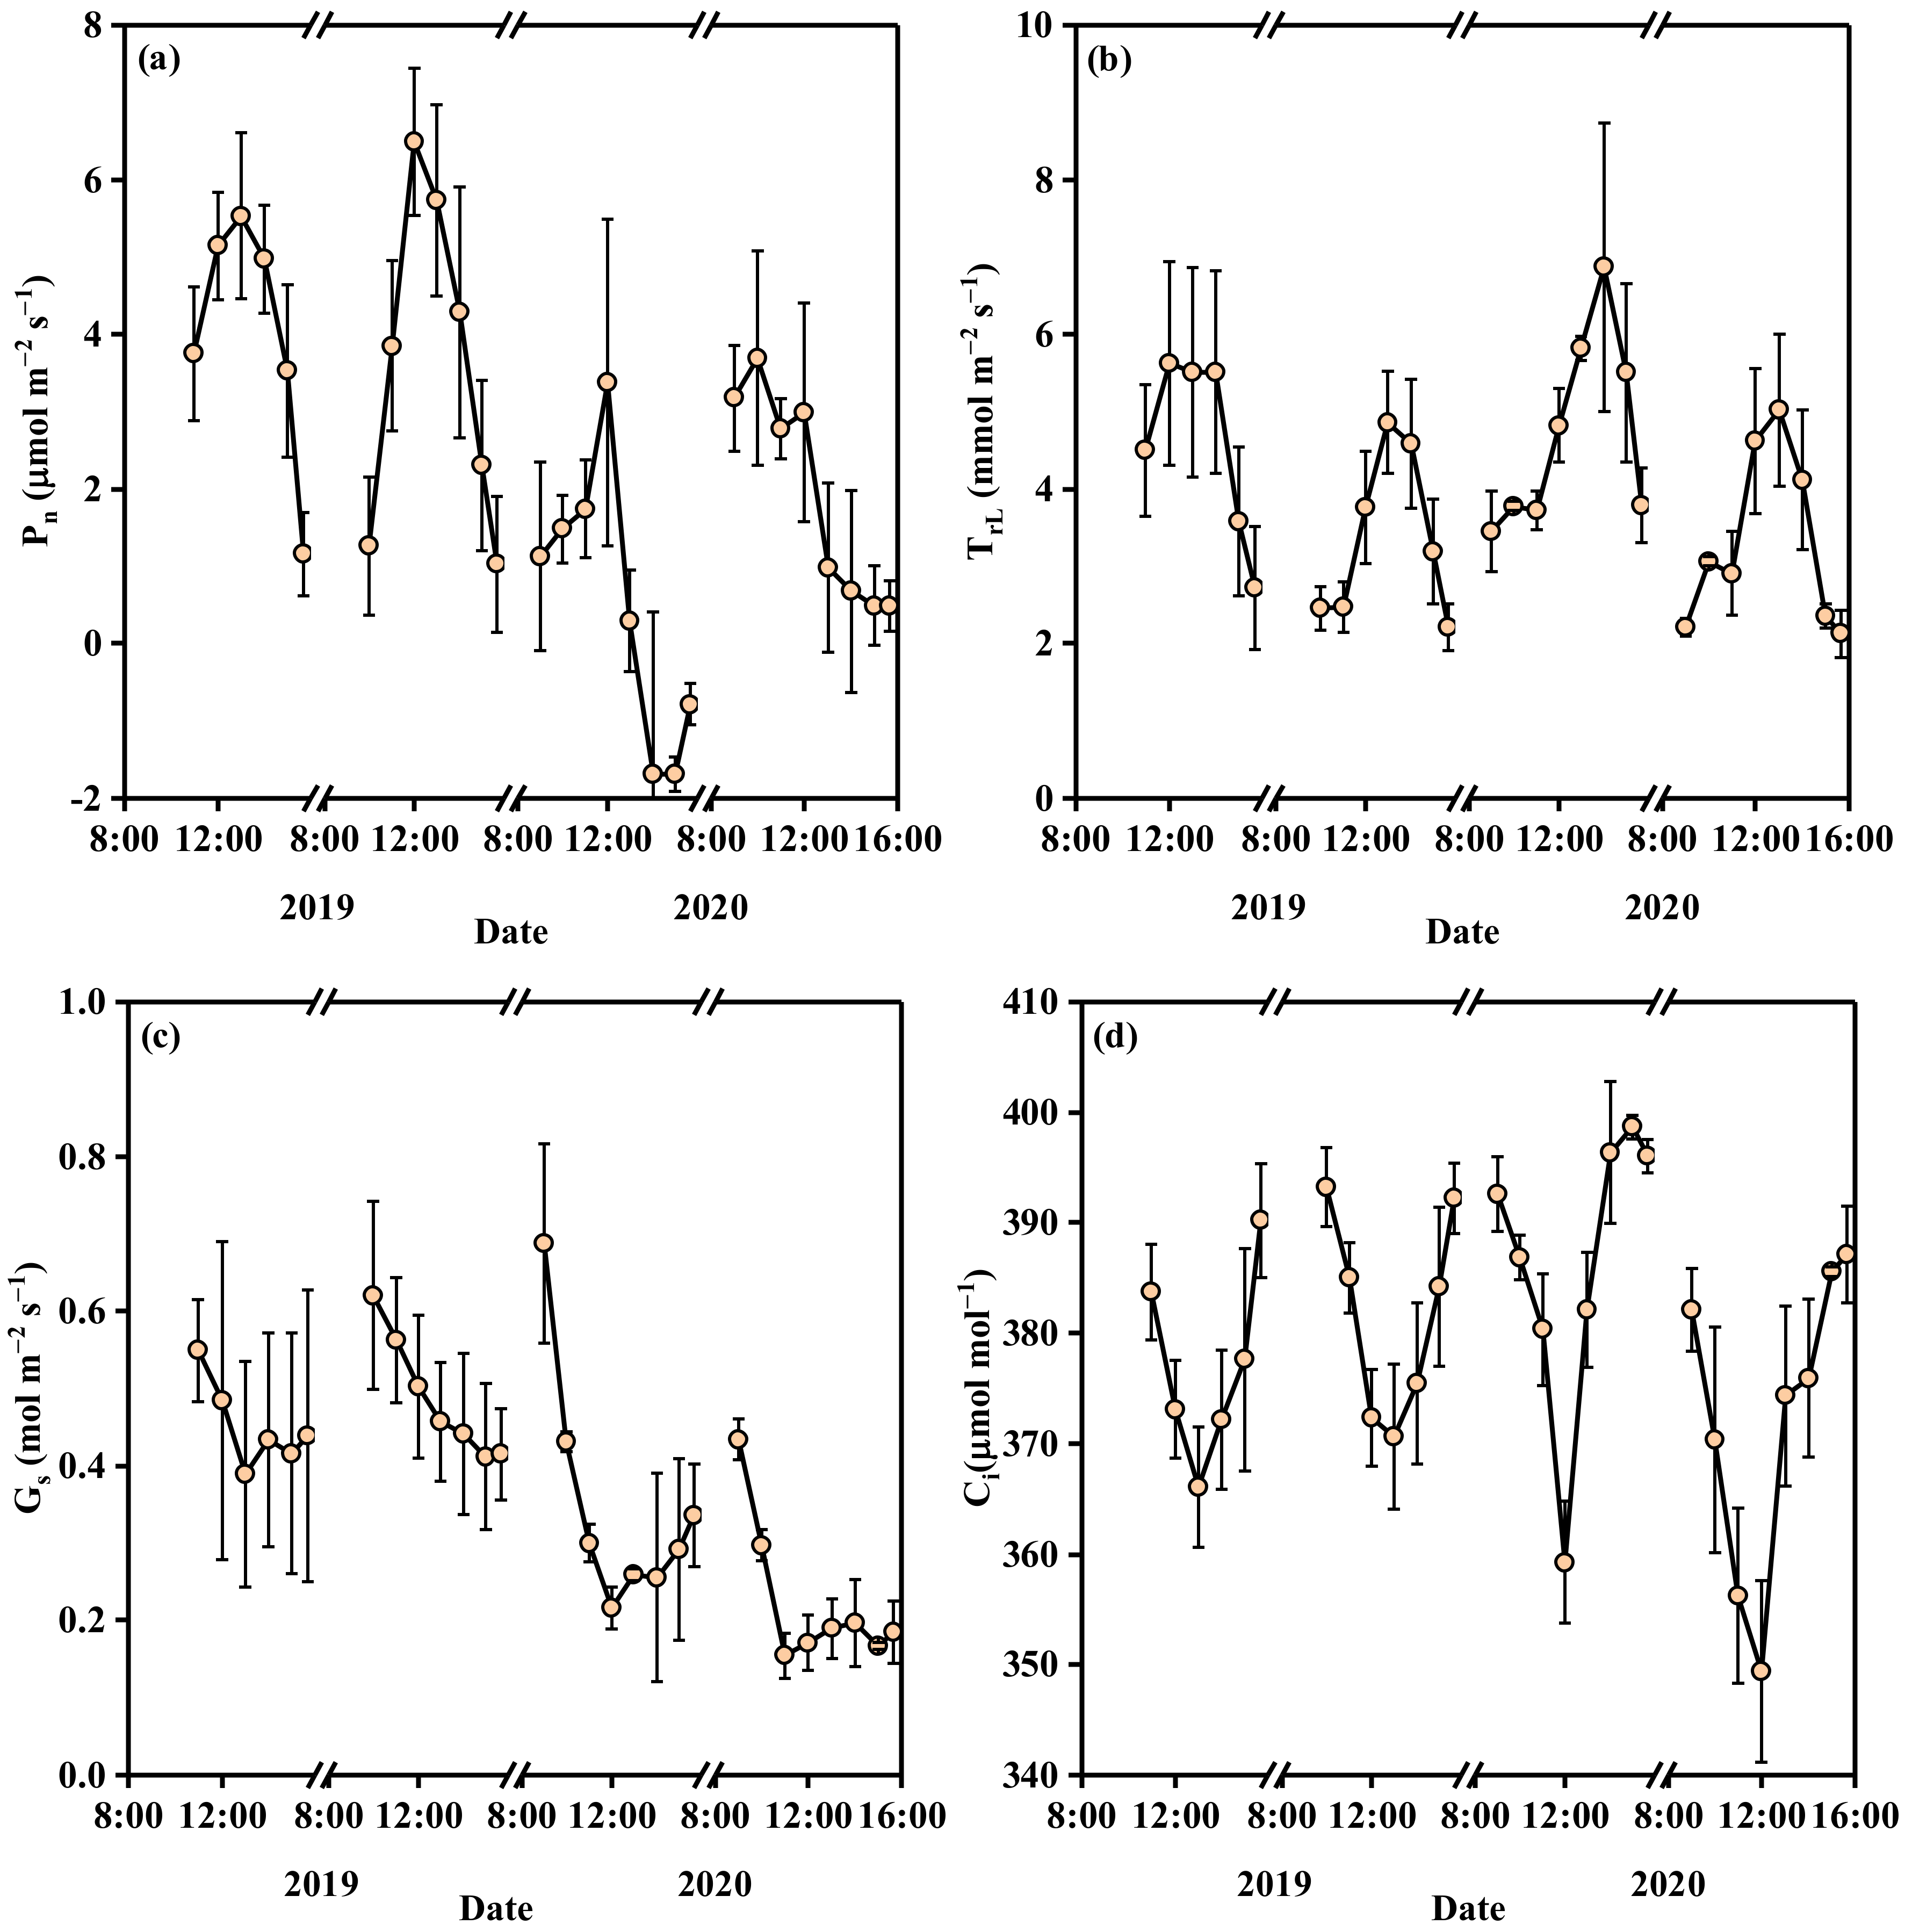
The diurnal variation in the net photosynthetic rate (Pn), transpiration rate (TrL), stomatal conductance (Gs) and intercellular CO2 concentration (Ci) from December 21 to 22, 2019, and December 26 to 27, 2020, are shown in Figure 3. Because the SSG must be covered with a straw curtain approximately one hour before sunset to reduce heat loss and is uncovered until the inside temperature begins to rise in the morning, the measurement started at 9:00–11:00 and ended at 16:00.
The Pn on sunny days first increased and then decreased in the range of −1.7 to 6.5 µmol m−2 s−1, and the highest Pn was found at 12:00–13:00. The daily curves of TrL were similar to those of Pn and varied from 2.1 to 6.9 mmol m−2 s−1. The highest TrL was found at 12:00–14:00. The highest Gs was generally found in the morning and then showed a decreasing-flat trend in the afternoon with a range of 0.15 to 0.69 mol m−2 s−1. Ci first decreased and then increased in the range of 350 to 400 µmol mol−1. The lowest Ci was found at 12:00–13:00.
5.4. Sap Flow and Basal Crop Coefficient
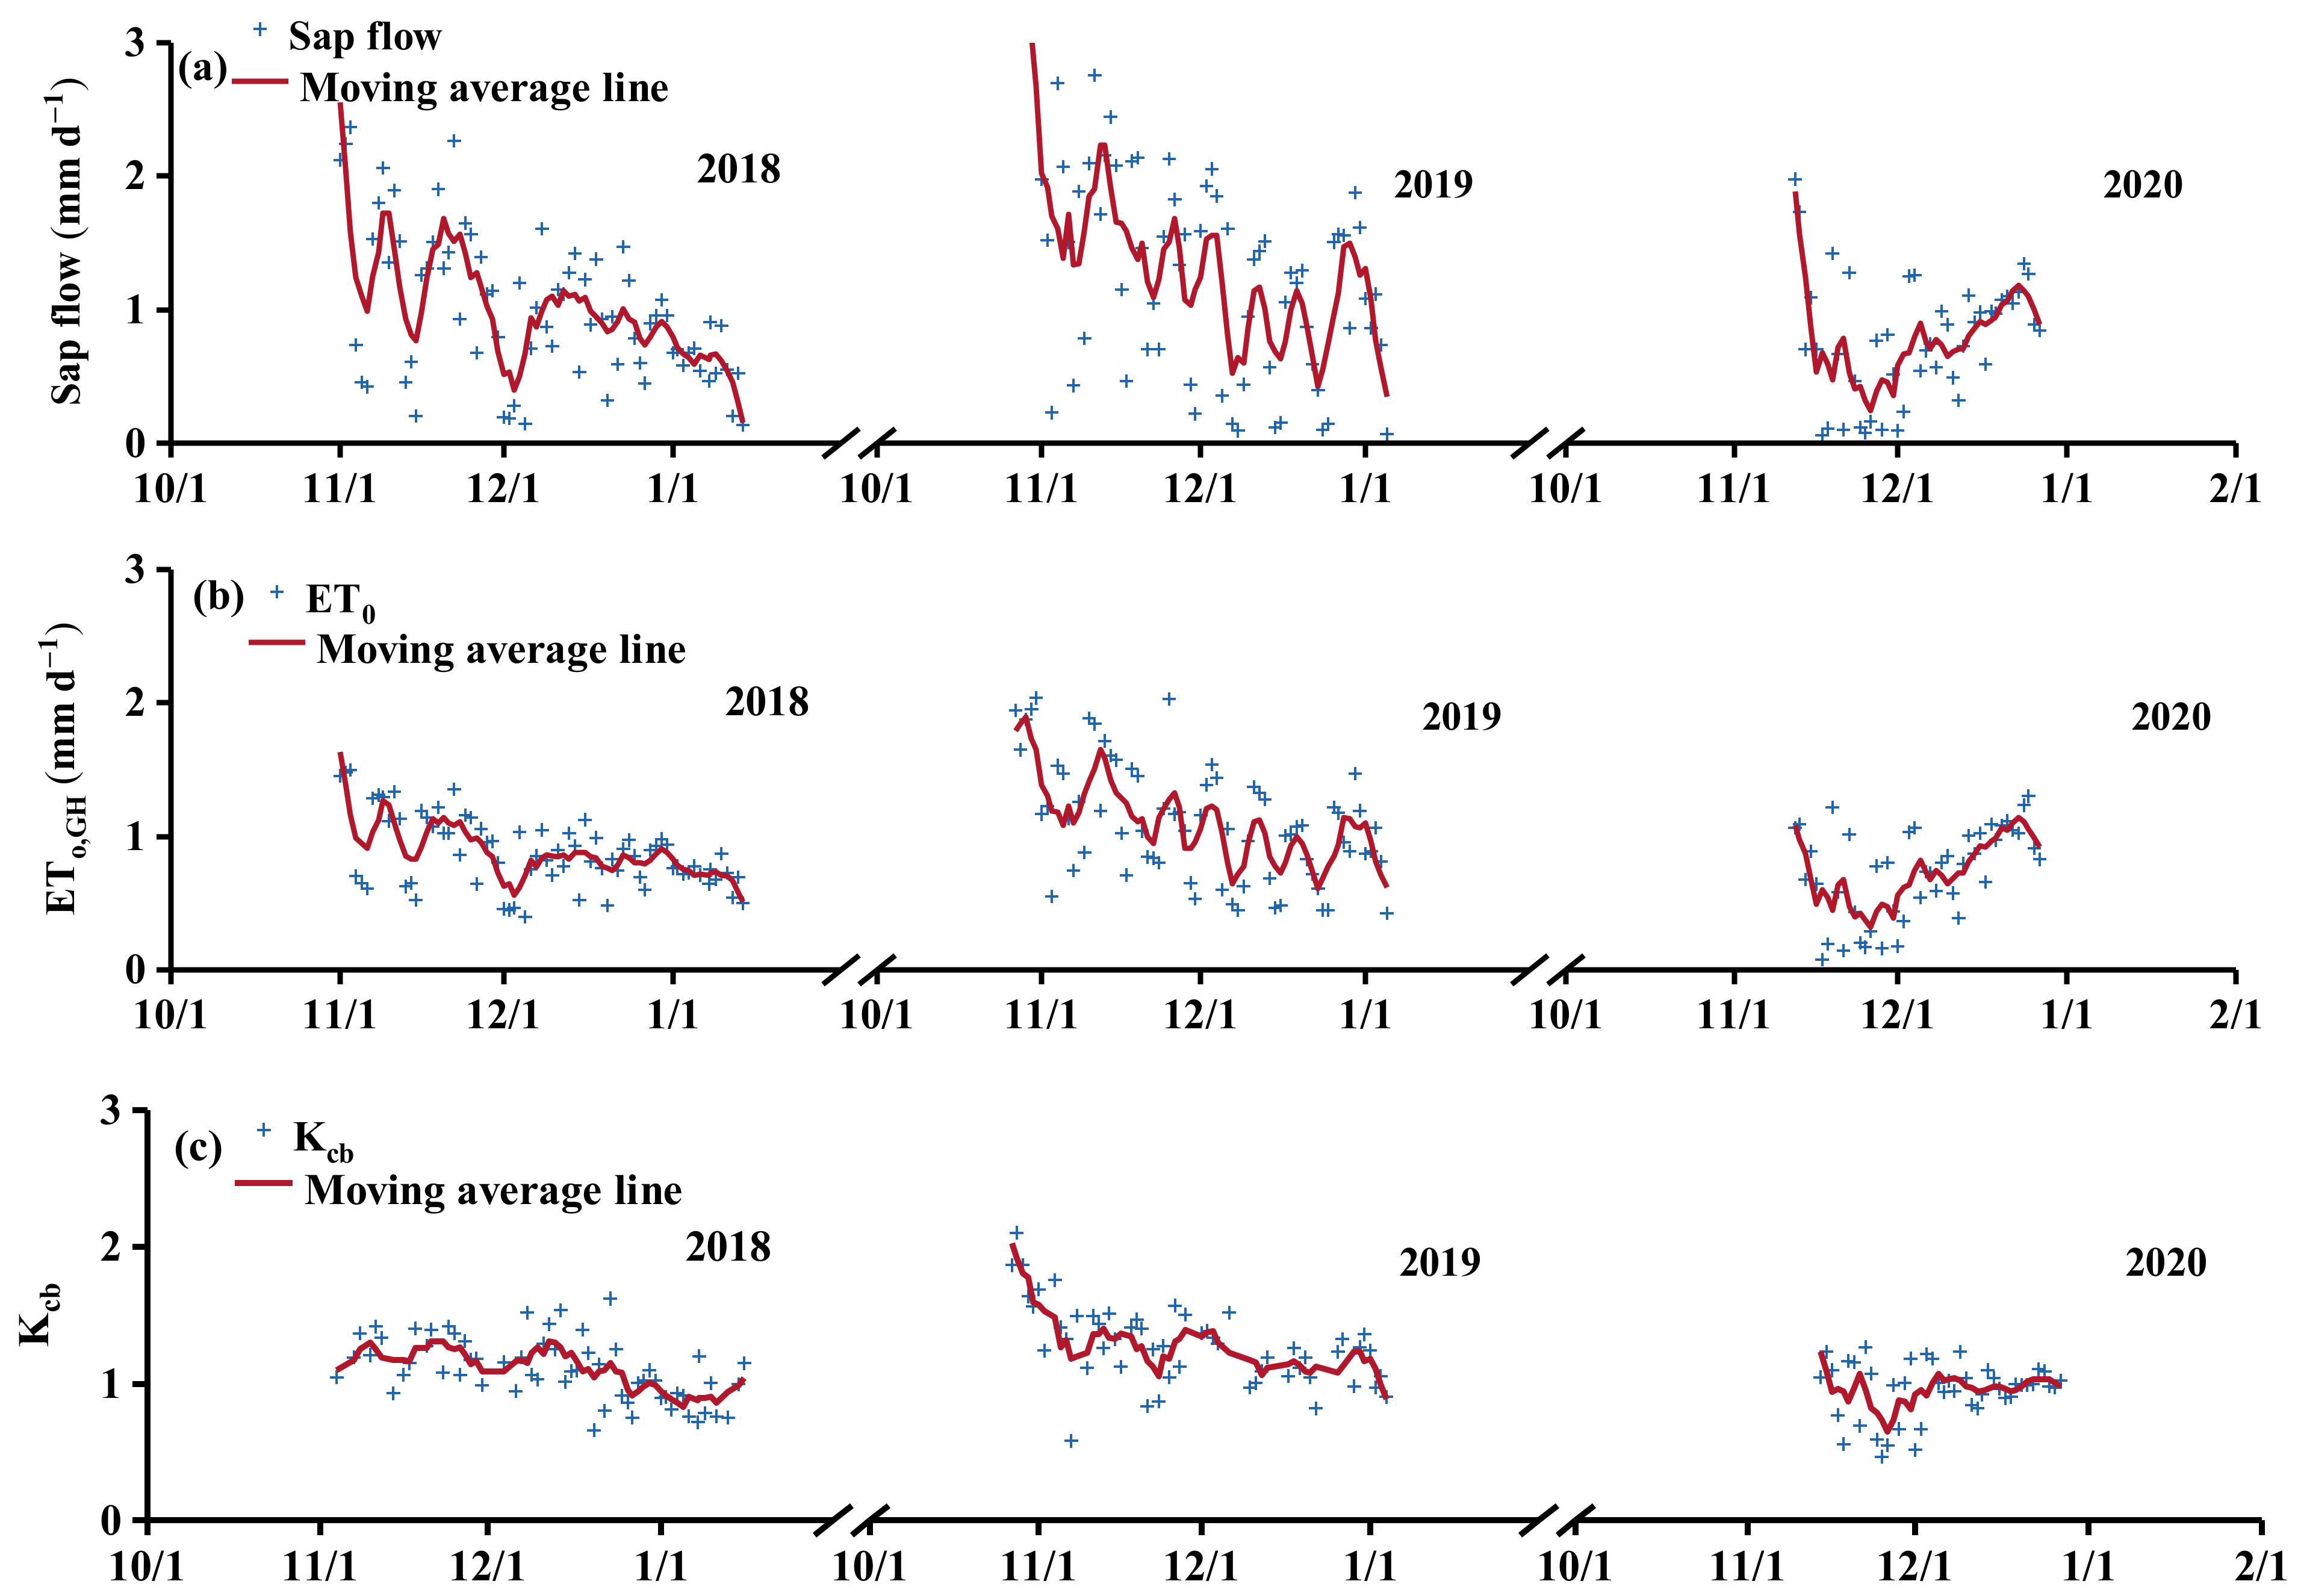
Sap flow was measured during fruit expansion and ripening. The seasonal trend of daily SF was consistent with that of ETo,GH (Figure 4a,b). Average SF were 1.3, 1.5, and 0.7 mm day−1 in November in the 2018, 2019 and 2020 seasons, respectively, and the corresponding values were 0.9, 1.0, and 0.9 mm day−1 in December. Similarly, the average ETo,GH were 1.0, 1.2, and 0.8 mm day−1 in November in the 2018, 2019 and 2020 seasons, respectively, and they were 0.8, 1.0, and 0.8 mm day−1 in December.
Figure 4c shows the daily basal crop coefficient in the three seasons. Kcb varied marginally during the experimental period and showed a marginal decline in the later period in the 2018 and 2019 seasons due to leaf aging. Average Kcb in the SF measurement period were 1.06, 1.11, and 0.99 in the 2018, 2019, and 2020 seasons, respectively.
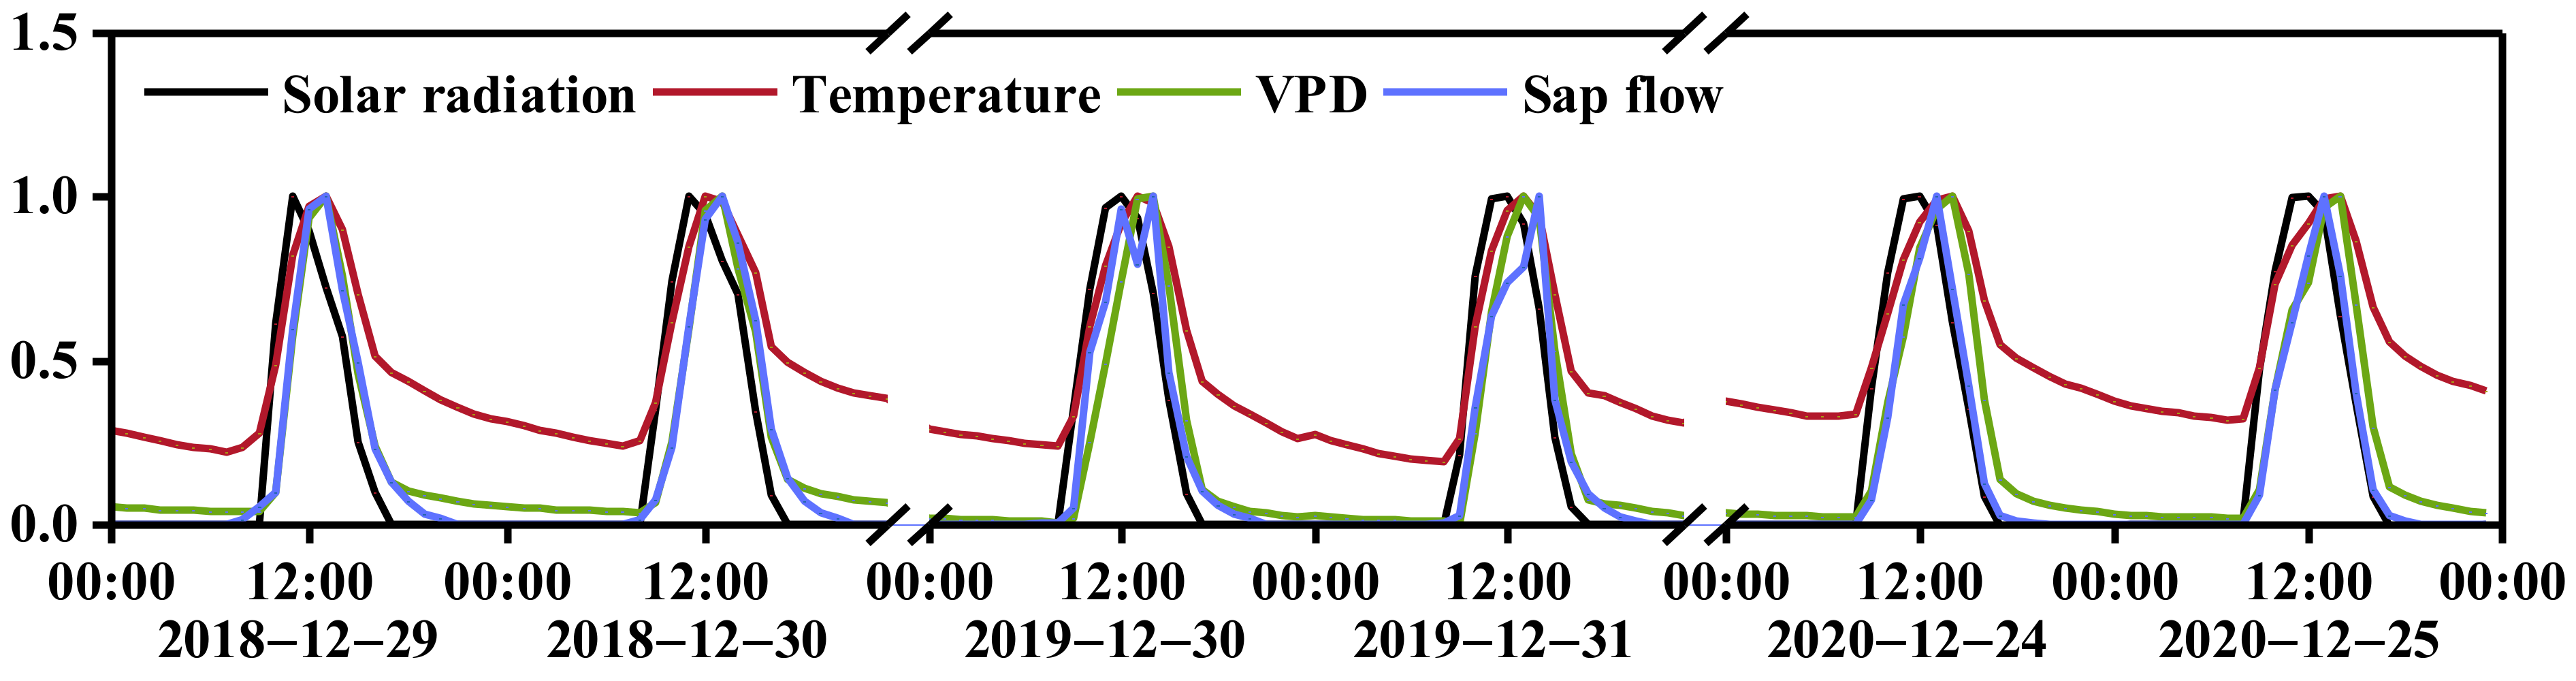
In each season, two typical sunny days (December 29 and 30, 2018, December 30 and 31, 2019, and December 24 and 25, 2020) were selected to display the daily courses of SF, solar radiation, VPD and temperature, as shown in Figure 5. The daily courses of SF were consistent with the solar radiation, VPD and temperature. All these factors first increased in the morning, reached a maximum at noon, and then decreased gradually. The solar radiation reached maximum between 11:00 and 12:00, and the temperature, VPD and SF reached their maximums between 13:00 and 14:00. The SF lagged solar radiation by 1–2 h. When the hourly SF, solar radiation, VPD and temperature are normalized, and the corresponding daily curve is shown in Figure 6, the SF clearly lagged solar radiation.
6. Discussion
6.1. SF and Microclimate Factors
Crop SF is strongly influenced by the climatic environment and plant morphology, such as LAI, when soil water is abundant [47,48]. As shown in Figure 5 and Figure 6, the shapes of the daily curves of SF are consistent with radiation, VPD, and temperature, indicating strong coupling between crop SF and the inside microclimate. Similar findings were reported for tomato and rose plants in other studies [9,10,20,21,47,49]. The relationships between daily SF and these microclimatic variables (i.e., solar radiation, VPD and temperature) during fruit expansion and ripening were regressed, and results are shown in Table 3.
The crop SF was linearly related to solar radiation in the three experimental seasons, with determination coefficients R2 of 0.87–0.96, indicating that solar radiation accounts for 87–96% of the variation in SF and therefore can be used to predict the daily SF of tomato in SSG in winter. The slopes of the regression lines ranged from 0.15 to 0.21. When all data were pooled, the slope was 0.18, and R2 equaled 0.82. The small variation in slope rate (0.15–0.21) indicated a stable and strong relationship between solar radiation and SF across different experimental seasons. Similarly, Gong, et al. [20] analyzed the relationship between tomato crop evapotranspiration (ET) and microclimate in greenhouses by the path analysis method and found that the correlation between hourly ET and net radiation was highest with a correlation coefficient of 0.74 under full irrigation and 0.84 under deficient irrigation. Mao, et al. [10] found that the determination coefficients of tomato SF and light intensity in greenhouses during the daytime were 0.86 and 0.89 for sunny and cloudy days in autumn-winter, respectively.
Daily SF was also linearly correlated with VPD (Table 3), and R2 reached 0.89–0.91, which shows a strong relationship between SF and VPD. However, the slopes of the regression lines varied widely from 1.76 to 4.13 across the three experimental seasons. When all data were pooled, the slope was 2.92, and R2 equaled 0.61. Similarly, Qiu, et al. [50] found that under different water conditions, the R2 of linear fitting between daily sap flow and VPD of greenhouse tomato was 0.63–0.75. Zheng, et al. [51] studied greenhouse grapevine under different levels of irrigation and fertilization and found that the R2 of the linear fit of hourly sap flow and VPD ranged from 0.41 to 0.92.
The relationship between SF and temperature can also be fitted with linear equations, but R2 equaled 0.62–0.84, which is markedly lower than those of solar radiation (0.87–0.96) and VPD (0.89–0.91). When all data were pooled, R2 equaled 0.58. Because temperature is not the direct factor controlling canopy conductance and transpiration, estimating SF using temperature could result in large errors compared to radiation and VPD, which is consistent with other studies. Xia, et al. [52] conducted a regression analysis of the SF and microclimate of the Caragana korshinskii arid desert region of northwest China and found that the correlation coefficients of SF with solar radiation and VPD were approximately 0.5, while the correlation coefficient with temperature was only 0.3. Xu, et al. [53] found that the coefficients of determination of Populus alba var. pyramidalis SF with radiation and VPD were between 0.6 and 0.8 but were 0.5 with temperature.
As shown in Table 3, crop SF has good linear fitting results with solar radiation and VPD. However, the slope rates of the regression line varied to some extent with seasons. To improve the accuracy of the estimated SF, both solar radiation and VPD were considered, and the regressed results are shown in Table 4. The fitting results were evaluated using R2, RMSE, MRE and NSE. When the slope of the regression line of SF to solar radiation was corrected with VPD, R2 equaled 0.93–0.97 in the three experimental seasons. When all data were pooled, R2 equaled 0.90. Both MRE (−1.4–3.3%) and NSE (0.87–0.97) were also within the acceptable range [44,45]. Compared to estimating SF with only radiation (Table 3), the RMSE and absolute MRE decreased by 0.047 mm day−1 and 6.53%, respectively, and both NSE and R2 increased by 0.08 when the slope was corrected by VPD. When the slope of the regression lines of SF to VPD was corrected by solar radiation, the R2 for the three experimental seasons was between 0.88 and 0.92; the MRE was between 1% and 3.2%; and the NSE was between 0.87 and 0.91, which are not markedly improved compared to estimating SF with only VPD (Table 3). Thus, radiation is the dominant factor for crop transpiration in greenhouses. Therefore, correcting the slope of SF to radiation with VPD can improve the prediction accuracy of SF estimation and can be used to estimate daily tomato transpiration when plant height is approximately 1.5 m, and LAI is between 2 and 2.5.
6.2. Basal Crop Coefficient of Tomato in This Study and the FAO 56 Paper
The basal crop coefficient is the ratio of crop transpiration under standard conditions to ETo,GH. In this study, the SMPs were above −35 kPa over the three seasons, indicating sufficient soil moisture for tomato based on the threshold of −35 kPa by Shock and Wang [46]. Under water-sufficient conditions in this study, Kcb varied marginally during the measurement period (from flowering to harvest), except for a small decline in the later growth stage due to leaf aging, although LAI did not decrease markedly (Figure 4). The mean Kcb in the middle growth stage (November and December) was 1.06, 1.11 and 0.99 in the 2018, 2019 and 2020 seasons, respectively.
The FAO recommendation for Kcb of tomato crops in the middle growth stage is 1.1 [40], which is close to the results (0.99–1.11) in this study. However, Qiu, et al. [54] discovered in a solar greenhouse that the crop coefficient of tomato in autumn and winter varied from 0.77–0.83 in the first season to 0.94–0.97 in the second season, and explained that the Kc variation in the same season was primarily caused by planting density. Therefore, we conclude that Kcb may vary by greenhouse and with planting density. The small variation in tomato Kcb (0.99–1.11) in the middle stage in the three winter seasons in this study shows that this SSG could maintain a good and stable microclimatic environment for tomato growth in winter; thus, the Kcb found in this study can be used to calculate tomato crop water consumption and plan irrigation scheduling in SSGs on the NCP.
6.3. Photosynthesis Traits and Microclimate
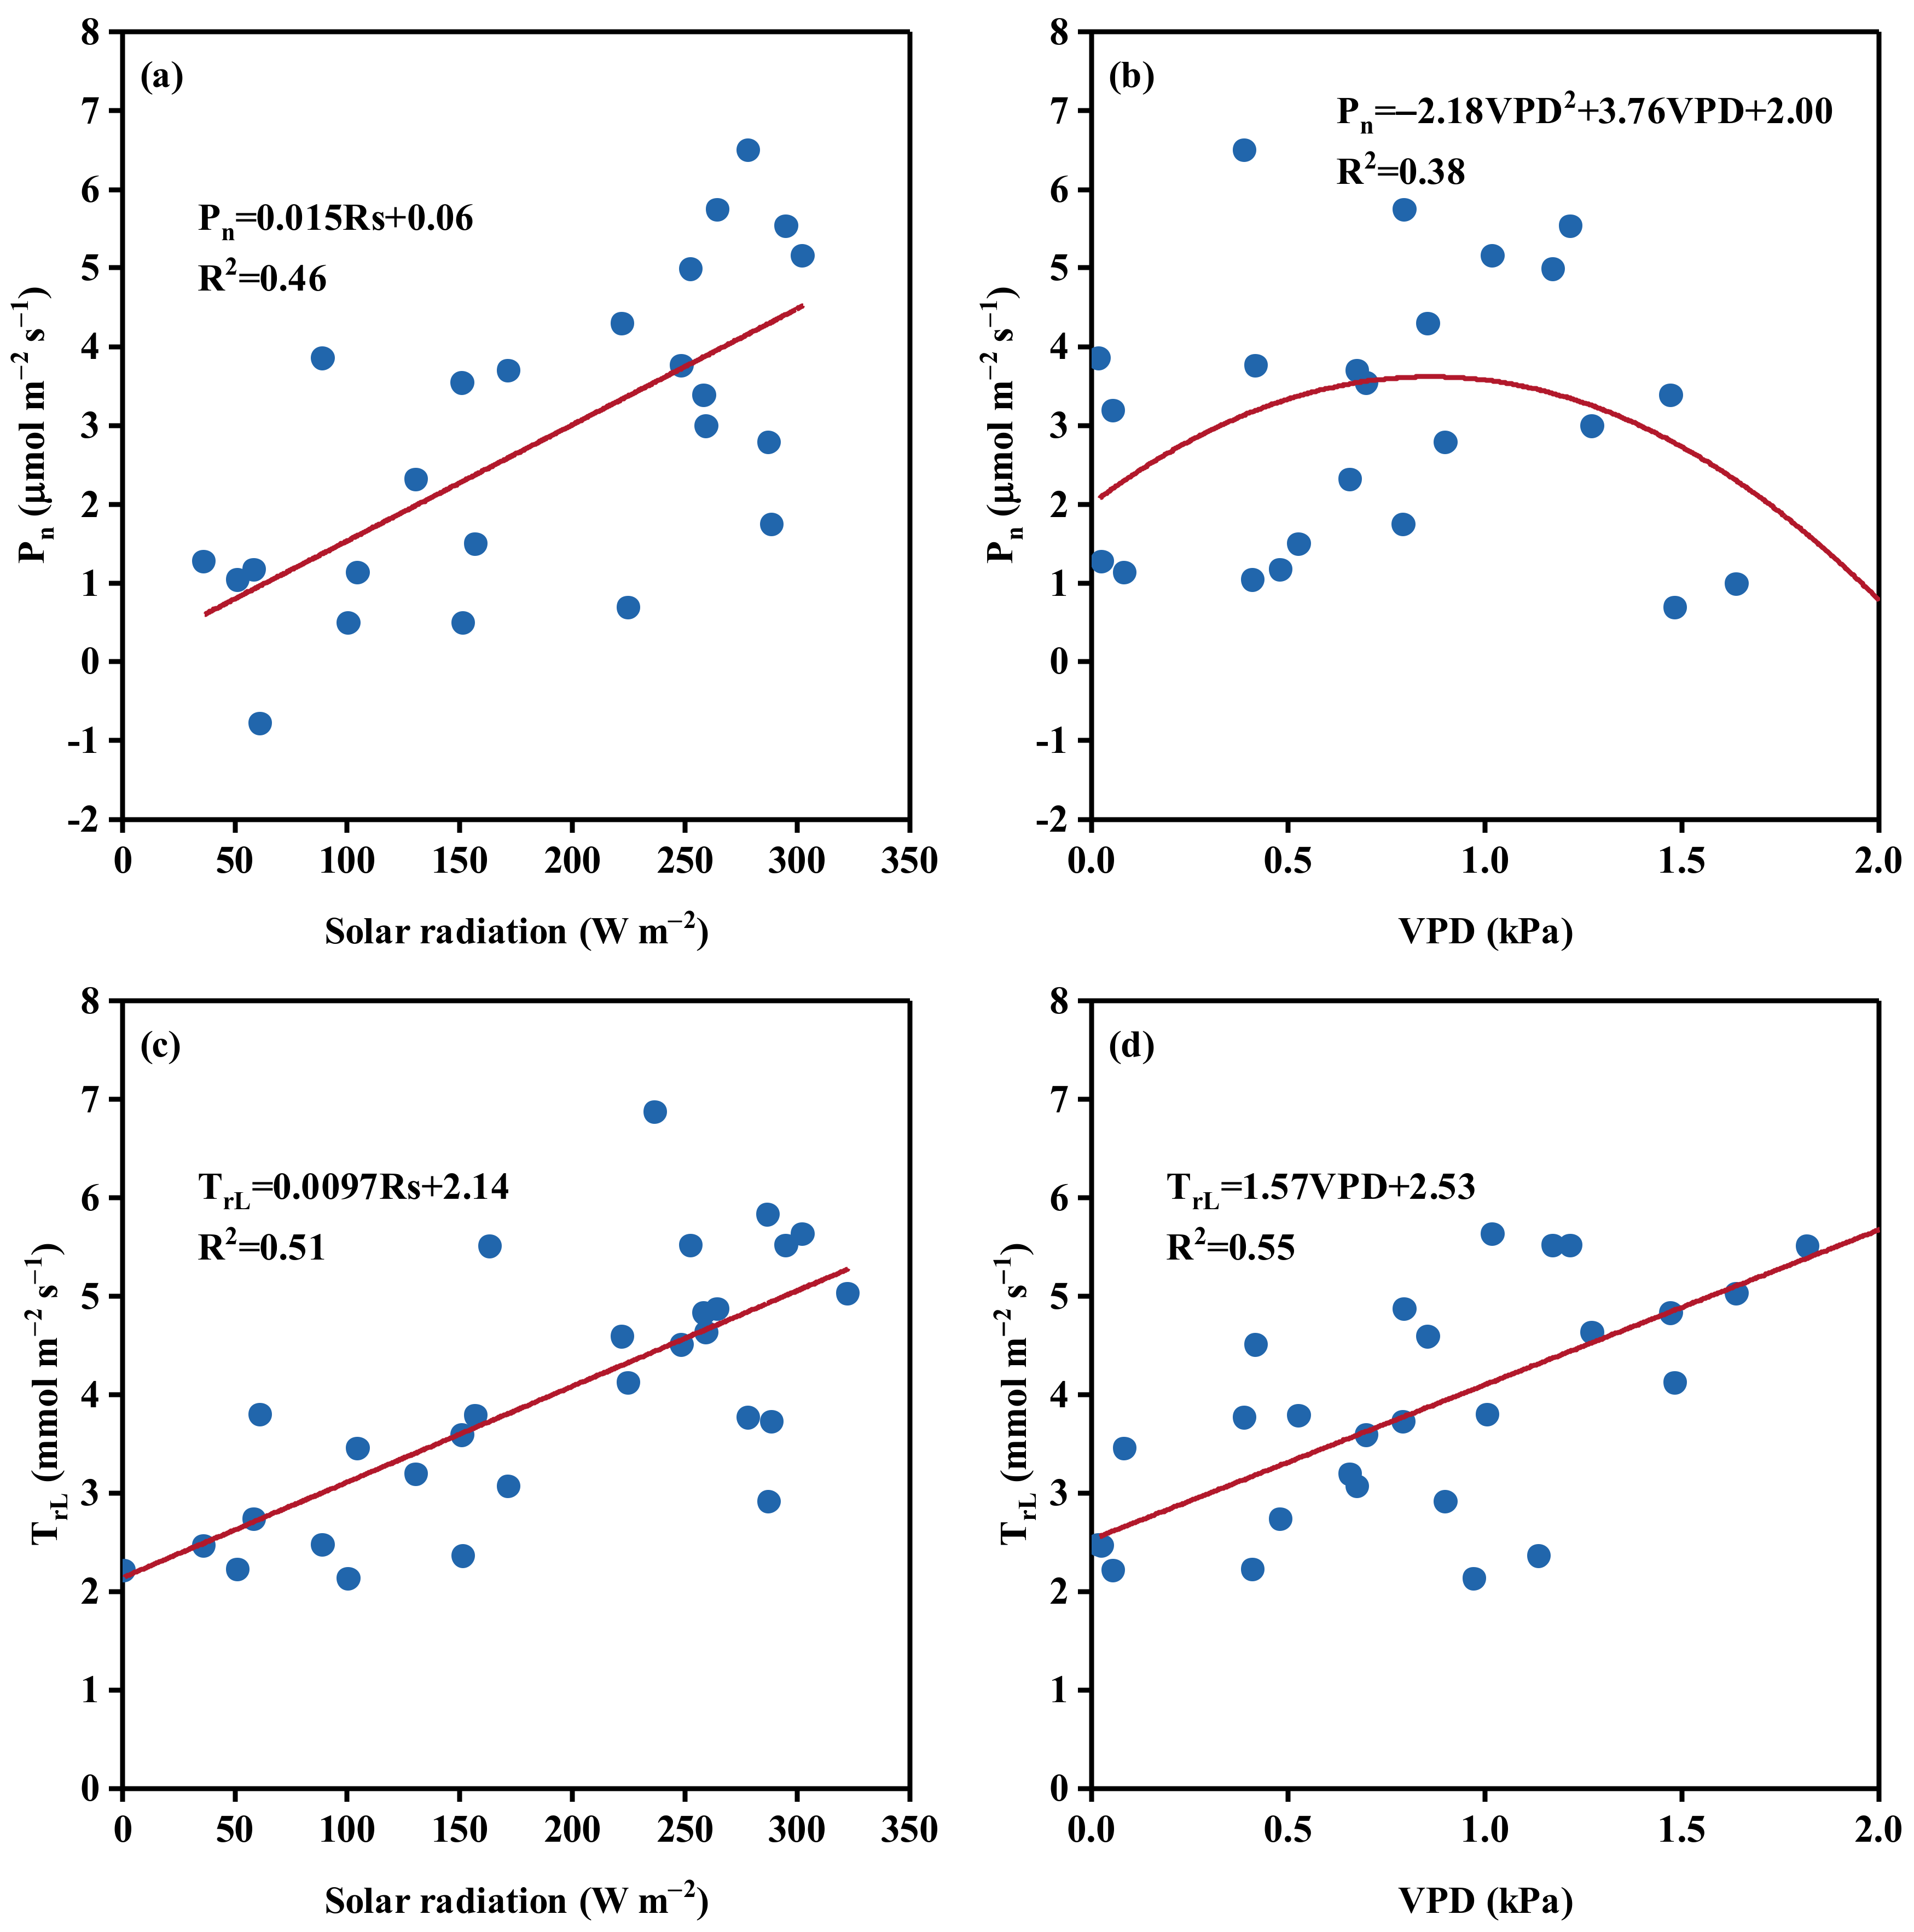
The daily courses of Pn and leaf transpiration rate TrL were consistent with those of radiation and VPD (Figure 2 and Figure 4), indicating a strong coupling of Pn and TrL to radiation and VPD. Similar relationships were found for wheat and conifers outside [55,56] and for tomatoes in greenhouse cultivation [57]. Figure 7a shows that Pn is linearly related to solar radiation and generally increasing with increasing radiation. The positive linear relationship between Pn and radiation shows that increasing inside radiation could enhance Pn and photosynthetic production accumulation, which may ultimately increase crop yield. Therefore, improving greenhouse transmissivity using high transmission material is a useful way to enhance inside crop growth. However, Pn is related to VPD with a concave quadratic curve (Figure 7b). When VPD is within 0–1 kPa, Pn is positively related to VPD, and a higher Pn (5–6 µmol m−2 s−1) was found when VPD is approximately 1 kPa. Then, Pn decreased markedly with increasing VPD (1 to 1.5 kPa). This result shows that a small VPD (0–1 kPa) could enhance the photosynthesis rate and that a high VPD (>1.0 kPa) may limit the photosynthesis rate. Li, et al. [25] investigated the plant photosynthesis and stomatal conductivity of tomatoes in a greenhouse and found that low VPD (<1 kPa) could induce high stomatal conductivity and photosynthesis under both sufficient and deficient soil water conditions under the same radiation conditions, indicating a higher radiation use efficiency for low VPD. Zhang, et al. [58] also found that controlling VPD in greenhouse tomatoes below 0.5 kPa resulted in higher Pn rates than when VPD was not controlled.
Figure 7c and d show that leaf TrL was positively related to both solar radiation and VPD, and their linear relationships were regressed. Generally, increasing radiation could provide more inside available energy for water vaporization in stomata and finally increase the transpiration rate. A higher VPD indicates a larger water vapor gradient between the leaf surface and the surrounding environment, which forces water molecules in the leaf stomata to leave faster than those with a small vapor gradient based on the water vapor diffusion law. The response of Pn to VPD is different from that of transpiration. Lu, et al. [57] and Zhang, et al. [59] also found that for greenhouse tomatoes, there was higher transpiration and lower photosynthesis at high VPD. Thus, we could control the VPD to be approximately 1 kPa. In this case, Pn could be the highest, and transpiration can be reduced at the maximum rate. Shamshiri, et al. [60] also reported that the optimal VPD range for greenhouse tomatoes is between 0.3 and 1.0 kPa. The relationships between TrL to radiation and VPD under instantaneous measurement are similar to the relationship between SF to radiation and VPD at daily scale (Table 3 and Table 4), indicating greenhouse transpiration at both leaf and plant scale are mainly controlled by radiation and VPD. While it should be noted that, at the leaf scale under instantaneous measurement, the R2 (0.51 and 0.55) in the regression lines between leaf Tr and radiation and VPD (Figure 7c,d) was smaller than that (0.87–0.96) at the daily scale (Table 3), which indicates that instantaneous leaf transpiration could be controlled by a complex mechanism and that the prediction of transpiration at the leaf scale using only microclimate could result in a large error. Sun, et al. [61] found that the determination coefficient R2 of tomato leaf transpiration and leaf-to-air vapor pressure deficit was 0.23–0.38, and that leaf transpiration was affected by both nonstomatal factors, such as soil water conditions and mesophyll conductivity, and stomatal factors.
6.4. Irrigation Water Productivity and Water Use Efficiency
Under traditional irrigation management, farmers typically irrigate crops based on their experience. With this management, crops are typically overirrigated, particularly in greenhouse cultivation, because farmers want to produce the highest yield and gain the largest economic benefit through overirrigation to reduce water stress risk. In greenhouse cultivation on the NCP, the seasonal irrigation water ranges between 300 and 600 mm, and is approximately 50% higher than the crop evapotranspiration (200~300 mm) [10,30,31,32], which finally results in an IE as low as 0.3 (Table 5). The excess water coming from overirrigation finally then leaves the root zone. Along with water seepage, nutrients (e.g., NO3−N and NH4−N ions) in soil water could leach into the deep soil layer and groundwater, and thus result in groundwater pollution [62,63].
As shown in Table 5, in this study, the IE in the first season is 0.31 under traditional irrigation water management by the farmer, indicating that approximately 70% of irrigation water is lost. This IE is near the reported data between 0.3 and 0.5 under local management [33]. In the second and third seasons, the tensiometer method was used to guide irrigation management. With this improvement, the IE increased to 0.60 in the second season and 0.69 in the third season. Both showed doubled IE compared to traditional management in the first season. There is still approximately 30% space for improving IE from 0.69 currently to 1.0. Based on this result, we recommend using the tensiometer method and a –35 kPa soil matric threshold to guide tomato irrigation in greenhouses.
As can be seen from Table 5, water productivity (WPI) was the highest (18.1 kg m−3) in the 2020 season, followed by 16.8 kg m−3 in the 2018 season and 11.1 kg m−3 in the 2019 season. The minimum WPI in 2019 was primarily due to the lower tomato fruit production (Table 1). Similar results were reported elsewhere (e.g., 22–24 kg m−3 for drip-irrigated tomatoes in winter (Li, et al. [64]), 11–16 kg m−3 when irrigation amounts were 50~100% ETo (Agbna, et al. [65])).
7. Conclusions
In this study, a three-season winter experiment was performed in a commercial sunken solar greenhouse (SSG) in the NCP to investigate the tomato sap flow and internal microclimate, and to determine the crop coefficient. The primary conclusions are as follows:
- The SSG can increase the temperature by approximately 10 °C in November and 15 to 18 °C in December, which is beneficial for tomato growth.
- The leaf photosynthesis rate is linearly related to solar radiation; however, a concave quadratic curve is better for Pn and VPD, with the highest Pn at approximately 1.0 kPa VPD. Leaf transpiration is positively linearly related to solar radiation and VPD, and the daily sap flow of tomato crops was most related to solar radiation, followed by VPD. Correcting the slope of SF to radiation with VPD could improve SF estimation accuracy, yielding a smaller RMSE and MRE. Therefore, this integrated regression equation is recommended to estimate daily tomato transpiration when plant height is approximately 1.5 m, and LAI is between 2 and 2.5 in this SSG.
- The average basal crop coefficients Kcb during tomato fruit expansion and ripening were 1.06, 1.11, and 0.99 in the 2018, 2019, and 2020 seasons, respectively.
- The irrigation efficiency increased from 0.3 in the first season to 0.6–0.69 in the second and third seasons when the tensiometer method was used. Thus, the tensiometer method by which irrigation begins when the soil matric potential is at a depth of 20 cm in the root zone is -35 kPa, is recommended to guide tomato irrigation in greenhouses.
Author Contributions
Conception and design of experiments, H.L.; performance of experiments and analysis of data, L.Y. and L.L.; writing—review and editing, L.Y. and X.T. and H.L. All authors have read and agreed to the published version of the manuscript.
Funding
This research was funded by the Science and Technology Major Project of Inner Mongolia Autonomous (NO. NMKJXM202105), National Nature Science Foundation of China (NO. 91479004, 51939005) and the 111 Project (B18006).
Institutional Review Board Statement
Not applicable.
Informed Consent Statement
Not applicable.
Data Availability Statement
Not applicable.
Acknowledgments
We greatly appreciated the support of Jiaqi Wang, the owner of the solar greenhouse.
Conflicts of Interest
The funders had no role in the design of the study; in the collection, analyses, or interpretation of data; in the writing of the manuscript; or in the decision to publish the results.
References
- Liu, H.; Yuan, B.; Hu, X.; Yin, C.; Tang, X. Cucumber production and the economic revenues under various nitrogen applications in an unheated solar greenhouse on the North China Plain. Agron. J. 2021, 113, 3444–3459. [Google Scholar] [CrossRef]
- Martínez-Hernández, G.B.; Boluda-Aguilar, M.; Taboada-Rodríguez, A.; Soto-Jover, S.; Marín-Iniesta, F.; López-Gómez, A. Processing, Packaging, and Storage of Tomato Products: Influence on the Lycopene Content. Food Eng. Rev. 2015, 8, 52–75. [Google Scholar] [CrossRef]
- Muzolf-Panek, M.; Kleiber, T.; Kaczmarek, A. Effect of increasing manganese concentration in nutrient solution on the antioxidant activity, vitamin C, lycopene and polyphenol contents of tomato fruit. Food Addit. Contam. A 2017, 34, 379–389. [Google Scholar] [CrossRef] [PubMed]
- National Bureau of Statisctis of China. China Rural Statistical Yearbook; China Statistics Press: Beijing, China, 2021.
- Zheng, J.; Huang, G.; Jia, D.; Wang, J.; Mota, M.; Pereira, L.S.; Huang, Q.; Xu, X.; Liu, H. Responses of drip irrigated tomato (Solanum lycopersicum L.) yield, quality and water productivity to various soil matric potential thresholds in an arid region of Northwest China. Agric. Water Manag. 2013, 129, 181–193. [Google Scholar] [CrossRef]
- Bogale, A.; Nagle, M.; Latif, S.; Aguila, M.; Müller, J. Regulated deficit irrigation and partial root-zone drying irrigation impact bioactive compounds and antioxidant activity in two select tomato cultivars. Sci. Hortic. 2016, 213, 115–124. [Google Scholar] [CrossRef]
- Liu, H.; Li, H.; Ning, H.; Zhang, X.; Li, S.; Pang, J.; Wang, G.; Sun, J. Optimizing irrigation frequency and amount to balance yield, fruit quality and water use efficiency of greenhouse tomato. Agric. Water Manag. 2019, 226, 105787. [Google Scholar] [CrossRef]
- Wang, X.; Xing, Y. Evaluation of the effects of irrigation and fertilization on tomato fruit yield and quality: A principal component analysis. Sci. Rep. 2017, 7, 350. [Google Scholar] [CrossRef] [Green Version]
- Han, C.; Chen, N.; Zhang, C.; Liu, Y.; Khan, S.; Lu, K.; Li, Y.; Dong, X.; Zhao, C. Sap flow and responses to meteorological about the Larix principis-rupprechtii plantation in Gansu Xinlong mountain, northwestern China. For. Ecol. Manag. 2019, 451, 117519. [Google Scholar] [CrossRef]
- Mao, H.; Ullah, I.; Jiheng, N.; Javed, Q.; Azeem, A. Estimating tomato water consumption by sap flow measurement in response to water stress under greenhouse conditions. J. Plant Interact. 2017, 12, 402–413. [Google Scholar]
- Brito, P.; Lorenzo, J.R.; Gonzalez-Rodriguez, A.M.; Morales, D.; Wieser, G.; Jimenez, M.S. Canopy transpiration of a semi arid Pinus canariensis forest at a treeline ecotone in two hydrologically contrasting years. Agric. For. Meteorol. 2015, 201, 120–127. [Google Scholar] [CrossRef]
- Clausnitzer, F.; Köstner, B.; Schwärzel, K.; Bernhofer, C. Relationships between canopy transpiration, atmospheric conditions and soil water availability—Analyses of long-term sap-flow measurements in an old Norway spruce forest at the Ore Mountains/Germany. Agric. For. Meteorol. 2011, 151, 1023–1034. [Google Scholar] [CrossRef]
- Liu, H.; Cohen, S.; Lemcoff, J.H.; Israeli, Y.; Tanny, J. Sap flow, canopy conductance and microclimate in a banana screenhouse. Agric. For. Meteorol. 2015, 201, 165–175. [Google Scholar]
- Momii, K.; Hiyama, H.; Takeuchi, S. Field sugarcane transpiration based on sap flow measurements and root water uptake simulations: Case study on Tanegashima Island, Japan. Agric. Water Manag. 2021, 250, 106836. [Google Scholar] [CrossRef]
- Zhang, Y.; Kang, S.; Ward, E.J.; Ding, R.; Zhang, X.; Zheng, R. Evapotranspiration components determined by sap flow and microlysimetry techniques of a vineyard in northwest China: Dynamics and influential factors. Agric. Water Manag. 2011, 98, 1207–1214. [Google Scholar] [CrossRef]
- Deng, Y.; Wu, S.; Ke, J.; Zhu, A. Effects of meteorological factors and groundwater depths on plant sap flow velocities in karst critical zone. Sci. Total Environ. 2021, 781, 146764. [Google Scholar] [CrossRef] [PubMed]
- Tanny, J. Microclimate and evapotranspiration of crops covered by agricultural screens: A review. Biosyst. Eng. 2013, 114, 26–43. [Google Scholar] [CrossRef]
- Hayat, M.; Iqbal, S.; Zha, T.; Jia, X.; Qian, D.; Bourque, C.P.A.; Khan, A.; Tian, Y.; Bai, Y.; Liu, P.; et al. Biophysical control on nighttime sap flow in Salix psammophila in a semiarid shrubland ecosystem. Agric. For. Meteorol. 2021, 300, 108329. [Google Scholar] [CrossRef]
- Olufayo, A.A.; Oguntunde, P.G.; Omotayo, F.S. Influence of Climatic Variables on Whole-plant Water use of Cocoa under Limited Soil Moisture Condition. J. Agric. Ecol. Res. 2019, 19, 1–8. [Google Scholar]
- Gong, X.; Qiu, R.; Sun, J.; Ge, J.; Li, Y.; Wang, S. Evapotranspiration and crop coefficient of tomato grown in a solar greenhouse under full and deficit irrigation. Agric. Water Manag. 2020, 235, 106154. [Google Scholar] [CrossRef]
- Li, B.; Shi, B.; Yao, Z.; Kumar Shukla, M.; Du, T. Energy partitioning and microclimate of solar greenhouse under drip and furrow irrigation systems. Agric. Water Manag. 2020, 234, 106096. [Google Scholar] [CrossRef]
- Zhou, K.; Jerszurki, D.; Sadka, A.; Shlizerman, L.; Rachmilevitch, S.; Ephrath, J. Effects of photoselective netting on root growth and development of young grafted orange trees under semi-arid climate. Sci. Hortic. 2018, 238, 272–280. [Google Scholar] [CrossRef]
- Mupambi, G.; Anthony, B.M.; Layne, D.R.; Musacchi, S.; Serra, S.; Schmidt, T.; Kalcsits, L.A. The influence of protective netting on tree physiology and fruit quality of apple: A review. Sci. Hortic. 2018, 236, 60–72. [Google Scholar] [CrossRef]
- Jifon, J.L.; Syvertsen, J.P. Moderate shade can increase net gas exchange and reduce photoinhibition in citrus leaves. Tree Physiol. 2003, 23, 119–127. [Google Scholar] [CrossRef] [PubMed] [Green Version]
- Li, Q.; Wei, M.; Li, Y.; Feng, G.; Wang, Y.; Li, S.; Zhang, D. Effects of soil moisture on water transport, photosynthetic carbon gain and water use efficiency in tomato are influenced by evaporative demand. Agric. Water Manag. 2019, 226, 105818. [Google Scholar] [CrossRef]
- Kimura, K.; Yasutake, D.; Koikawa, K.; Kitano, M. Spatiotemporal variability of leaf photosynthesis and its linkage with microclimates across an environment-controlled greenhouse. Biosyst. Eng. 2020, 195, 97–115. [Google Scholar] [CrossRef]
- Chen, S.N.; Li, Z.F.; Liu, F.; Yang, S.B.; Li, M. Risk evaluation of solar greenhouse cucumbers low temperature disaster based on GIS spatial analysis in Tianjin, China. Geomat. Nat. Hazards Risk 2019, 10, 576–598. [Google Scholar] [CrossRef]
- Li, A.; Huang, L.; Zhang, T. Field test and analysis of microclimate in naturally ventilated single-sloped greenhouses. Energy Build. 2017, 138, 479–489. [Google Scholar] [CrossRef]
- Liu, H.; Yin, C.; Hu, X.; Tanny, J.; Tang, X. Microclimate Characteristics and Evapotranspiration Estimates of Cucumber Plants in a Newly Developed Sunken Solar Greenhouse. Water 2020, 12, 2275. [Google Scholar] [CrossRef]
- Sun, Y.; Hu, K.L.; Fan, Z.B.; Wei, Y.P.; Lin, S.; Wang, J.G. Simulating the fate of nitrogen and optimizing water and nitrogen management of greenhouse tomato in North China using the EU-Rotate_N model. Agric. Water Manag. 2013, 128, 72–84. [Google Scholar] [CrossRef]
- Wang, C.; Gu, F.; Chen, J.; Yang, H.; Jiang, J.; Du, T.; Zhang, J. Assessing the response of yield and comprehensive fruit quality of tomato grown in greenhouse to deficit irrigation and nitrogen application strategies. Agric. Water Manag. 2015, 161, 9–19. [Google Scholar] [CrossRef]
- Zhao, Y.; Luo, J.; Chen, X.; Zhang, X.; Zhang, W. Greenhouse tomato–cucumber yield and soil N leaching as affected by reducing N rate and adding manure: A case study in the Yellow River Irrigation Region China. Nutr. Cycl. Agroecosyst. 2012, 94, 221–235. [Google Scholar] [CrossRef]
- Liu, H.; Yuan, B.; Hu, X.; Yin, C. Drip irrigation enhances water use efficiency without losses in cucumber yield and economic benefits in greenhouses in North China. Irrig. Sci. 2022, 40, 135–149. [Google Scholar] [CrossRef]
- National Bureau of Statisctis of China. China National Statistical Yearbook; China Statistics Press: Beijing, China, 2021.
- Feng, Z.; Kang, Y.; Wan, S.; Liu, S. Effect of Drip Fertigation on Potato Productivity with Basal Application of Loss Control Fertilizer in Sandy Soil. Irrig. Drain. 2018, 67, 210–221. [Google Scholar] [CrossRef]
- Liu, H.; Yin, C.; Gao, Z.; Hou, L. Evaluation of cucumber yield, economic benefit and water productivity under different soil matric potentials in solar greenhouses in North China. Agric. Water Manag. 2021, 243, 106442. [Google Scholar] [CrossRef]
- Sun, J.; Kang, Y.; Wan, S.; Hu, W. Influence of drip irrigation level on salt leaching and vegetation growth during reclamation of coastal saline soil having an imbedded gravel–sand layer. Ecol. Eng. 2017, 108, 59–69. [Google Scholar] [CrossRef]
- Fernández, M.D.; Bonachela, S.; Orgaz, F.; Thompson, R.; López, J.C.; Granados, M.R.; Gallardo, M.; Fereres, E. Measurement and estimation of plastic greenhouse reference evapotranspiration in a Mediterranean climate. Irrig. Sci. 2010, 28, 497–509. [Google Scholar] [CrossRef] [Green Version]
- Fernández, M.D.; Bonachela, S.; Orgaz, F.; Thompson, R.; López, J.C.; Granados, M.R.; Gallardo, M.; Fereres, E. Erratum to: Measurement and estimation of plastic greenhouse reference evapotranspiration in a Mediterranean climate. Irrig. Sci. 2011, 29, 91–92. [Google Scholar] [CrossRef] [Green Version]
- Allen, R.G.; Pereira, L.S.; Raes, D.; Smith, M. Crop Evapotranspiration Guidelines for Computing Crop Water Requirements; Food and Agriculture Organization of the United Nations: Rome, Italy, 1998.
- Perry, C. Efficient irrigation; Inefficient communication; Flawed recommendations. Irrig. Drain. 2007, 56, 367–378. [Google Scholar] [CrossRef]
- Rodrigues, G.C.; Pereira, L.S. Assessing economic impacts of deficit irrigation as related to water productivity and water costs. Biosyst. Eng. 2009, 103, 536–551. [Google Scholar] [CrossRef] [Green Version]
- Abedinpour, M. Evaluation of growth-stage-specific crop coefficients of maize using weighing lysimeter. Soil Water Res. 2016, 10, 99–104. [Google Scholar] [CrossRef] [Green Version]
- Legates, D.R.; McCabe, G.J. Evaluating the use of “goodness-of-fit” Measures in hydrologic and hydroclimatic model validation. Water Resour. Res. 1999, 35, 233–241. [Google Scholar] [CrossRef]
- Moriasi, D.N.; Arnold, J.G.; Van Liew, M.W.; Bingner, R.L.; Harmel, R.D.; Veith, T.L. Model evaluation guidelines for systematic quantification of accuracy in watershed simulations. Trans ASABE 2007, 50, 885–900. [Google Scholar] [CrossRef]
- Shock, C.C.; Wang, F. Soil Water Tension, a Powerful Measurement for Productivity and Stewardship. Hortscience 2011, 46, 178–185. [Google Scholar] [CrossRef] [Green Version]
- Liu, F.; Cohen, Y.; Fuchs, M.; Plaut, Z.; Grava, A. The effect of vapor pressure deficit on leaf area and water transport in flower stems of soil-less culture rose. Agric. Water Manag. 2006, 81, 216–224. [Google Scholar] [CrossRef]
- Tie, Q.; Hu, H.; Tian, F.; Guan, H.; Lin, H. Environmental and physiological controls on sap flow in a subhumid mountainous catchment in North China. Agric. For. Meteorol. 2017, 240–241, 46–57. [Google Scholar] [CrossRef]
- Siddiq, Z.; Chen, Y.; Zhang, Y.; Zhang, J.; Cao, K. More sensitive response of crown conductance to VPD and larger water consumption in tropical evergreen than in deciduous broadleaf timber trees. Agric. For. Meteorol. 2017, 247, 399–407. [Google Scholar] [CrossRef]
- Qiu, R.; Du, T.; Kang, S.; Chen, R.; Wu, L. Influence of Water and Nitrogen Stress on Stem Sap Flow of Tomato Grown in a Solar Greenhouse. J. Am. Soc. Hortic. Sci. 2015, 140, 111–119. [Google Scholar] [CrossRef] [Green Version]
- Zheng, S.; Wang, T.; Wei, X.; Li, B.; Bai, Y. Grapevine Sap Flow in Response to Physio-Environmental Factors under Solar Greenhouse Conditions. Water 2020, 12, 3081. [Google Scholar]
- Xia, G.; Kang, S.; Li, F.; Zhang, J.; Zhou, Q. Diurnal and seasonal variations of sap flow ofCaragana korshinskii in the arid desert region of north-west China. Hydrol. Process 2008, 22, 1197–1205. [Google Scholar] [CrossRef]
- Xu, X.; Tong, L.; Li, F.; Kang, S.; Qu, Y. Sap flow of irrigated Populus alba var. pyramidalis and its relationship with environmental factors and leaf area index in an arid region of Northwest China. J. For. Res. 2017, 16, 144–152. [Google Scholar] [CrossRef]
- Qiu, R.; Song, J.; Du, T.; Kang, S.; Tong, L.; Chen, R.; Wu, L. Response of evapotranspiration and yield to planting density of solar greenhouse grown tomato in northwest China. Agric. Water Manag. 2013, 130, 44–51. [Google Scholar] [CrossRef]
- Garcia, R.L.; Long, S.P.; Wall, G.W.; Osborne, C.P.; Kimball, B.A.; Nie, G.Y.; Pinter, P.J.; Lamorte, R.L.; Wechsung, F. Photosynthesis and conductance of spring-wheat leaves: Field response to continuous free-air atmospheric CO2 enrichment. Plant Cell. Environ. 1998, 21, 659–669. [Google Scholar] [CrossRef]
- Wang, F.; Zhang, F.; Gou, X.; Fonti, P.; Xia, J.; Cao, Z.; Liu, J.; Wang, Y.; Zhang, J. Seasonal variations in leaf-level photosynthesis and water use efficiency of three isohydric to anisohydric conifers on the Tibetan Plateau. Agric. For. Meteorol. 2021, 308–309, 108581. [Google Scholar] [CrossRef]
- Lu, N.; Nukaya, T.; Kamimura, T.; Zhang, D.; Kurimoto, I.; Takagaki, M.; Maruo, T.; Kozai, T.; Yamori, W. Control of vapor pressure deficit (VPD) in greenhouse enhanced tomato growth and productivity during the winter season. Sci. Hortic. 2015, 197, 17–23. [Google Scholar] [CrossRef]
- Zhang, D.; Zhang, Z.; Li, J.; Chang, Y.; Du, Q.; Pan, T. Regulation of Vapor Pressure Deficit by Greenhouse Micro-Fog Systems Improved Growth and Productivity of Tomato via Enhancing Photosynthesis during Summer Season. PLoS ONE 2015, 10, e0133919. [Google Scholar] [CrossRef]
- Zhang, D.; Du, Q.; Zhang, Z.; Jiao, X.; Song, X.; Li, J. Vapour pressure deficit control in relation to water transport and water productivity in greenhouse tomato production during summer. Sci. Rep. 2017, 7, 43461. [Google Scholar] [CrossRef]
- Shamshiri, R.R.; Jones, J.W.; Thorp, K.R.; Ahmad, D.; Man, H.C.; Taheri, S. Review of optimum temperature, humidity, and vapour pressure deficit for microclimate evaluation and control in greenhouse cultivation of tomato: A review. Int. Agrophys. 2018, 32, 287–302. [Google Scholar] [CrossRef]
- Sun, Q.; Wang, Y.; Chen, G.; Yang, H.; Du, T. Water use efficiency was improved at leaf and yield levels of tomato plants by continuous irrigation using semipermeable membrane. Agric. Water Manag. 2018, 203, 430–437. [Google Scholar] [CrossRef]
- Min, L.; Shen, Y.; Pei, H.; Wang, P. Water movement and solute transport in deep vadose zone under four irrigated agricultural land-use types in the North China Plain. J. Hydrol. 2018, 559, 510–522. [Google Scholar] [CrossRef]
- Scanlon, B.R.; Gates, J.B.; Reedy, R.C.; Jackson, W.A.; Bordovsky, J.P. Effects of irrigated agroecosystems: 2. Quality of soil water and groundwater in the southern High Plains, Texas. Water Resour. Res. 2010, 46, 2095–2170. [Google Scholar] [CrossRef]
- Li, Y.; Wang, L.; Xue, X.; Guo, W.; Xu, F.; Li, Y.; Sun, W.; Chen, F. Comparison of drip fertigation and negative pressure fertigation on soil water dynamics and water use efficiency of greenhouse tomato grown in the North China Plain. Agric. Water Manag. 2017, 184, 1–8. [Google Scholar] [CrossRef]
- Agbna, G.H.D.; Dongli, S.; Zhipeng, L.; Elshaikh, N.A.; Guangcheng, S.; Timm, L.C. Effects of deficit irrigation and biochar addition on the growth, yield, and quality of tomato. Sci. Hortic. 2017, 222, 90–101. [Google Scholar] [CrossRef]
Figure 1.
Photos of the sunken solar greenhouse. (a) A view of the sunken soil inside. (b) Inside view during tomato planting. (c) Outside view in winter. The front plastic cover faces south, and the rolled straw cushion is on the top of the roof.
Figure 1.
Photos of the sunken solar greenhouse. (a) A view of the sunken soil inside. (b) Inside view during tomato planting. (c) Outside view in winter. The front plastic cover faces south, and the rolled straw cushion is on the top of the roof.

Figure 2.
Changes in soil matric potential at 20 cm depth in the three seasons. The red dashed line indicates thresholds of soil matric potentials of −35 kPa for tomato plants, as proposed by Shock and Wang [46].
Figure 2.
Changes in soil matric potential at 20 cm depth in the three seasons. The red dashed line indicates thresholds of soil matric potentials of −35 kPa for tomato plants, as proposed by Shock and Wang [46].

Figure 3.
Diurnal variation in net photosynthetic rate (Pn) (a), transpiration rate (TrL) (b), stomatal conductance (Gs) (c) and intercellular CO2 concentration (Ci) (d). Typical days shown in Figure 3 are December 21 to 22 in 2019, and December 26 to 27 in 2020.
Figure 3.
Diurnal variation in net photosynthetic rate (Pn) (a), transpiration rate (TrL) (b), stomatal conductance (Gs) (c) and intercellular CO2 concentration (Ci) (d). Typical days shown in Figure 3 are December 21 to 22 in 2019, and December 26 to 27 in 2020.

Figure 4.
Seasonal course of sap flow (a), reference crop evapotranspiration (ETo,,GH) (b) and basal crop coefficient (Kcb) (c) in greenhouse in three seasons. The red line is the 5-day moving average, and the data in the red line was the averaged value over the five days of the previous two days, present day and the following two days.

Figure 5.
Daily courses of sap flow with solar radiation (a), vapor pressure difference (VPD) (b) and temperature (c). Typical days shown are December 29–30 in 2018, December 30–31 in 2019 and December 24–25 in 2020.
Figure 5.
Daily courses of sap flow with solar radiation (a), vapor pressure difference (VPD) (b) and temperature (c). Typical days shown are December 29–30 in 2018, December 30–31 in 2019 and December 24–25 in 2020.

Figure 6.
Daily curves of normalized solar radiation, temperature, vapor pressure difference (VPD) and sap flow (SF). Typical days shown are December 29–30 in 2018, December 30–31 in 2019 and December 24–25 in 2020.
Figure 6.
Daily curves of normalized solar radiation, temperature, vapor pressure difference (VPD) and sap flow (SF). Typical days shown are December 29–30 in 2018, December 30–31 in 2019 and December 24–25 in 2020.

Figure 7.
Related relationships of net photosynthetic rate (Pn) with solar radiation (a), Pn with VPD (b), leaf transpiration rate (TrL) with solar radiation (c), and TrL with VPD (d).
Figure 7.
Related relationships of net photosynthetic rate (Pn) with solar radiation (a), Pn with VPD (b), leaf transpiration rate (TrL) with solar radiation (c), and TrL with VPD (d).


Table 1.
Monthly mean values of solar radiation, temperature, relative humidity, vapor pressure deficit and wind speed.
Table 1.
Monthly mean values of solar radiation, temperature, relative humidity, vapor pressure deficit and wind speed.
| Years | Time Period | Solar Radiation /(MJ m−2 d−1) | Temperature /oC | Relative Humidity /% | Vapor Pressure Deficit /kPa | Wind Speed /m s−1 | |||||
|---|---|---|---|---|---|---|---|---|---|---|---|
| In | Out | In | Out | In | Out | In | Out | In | Out | ||
| 2018 * | October | N.M. ** | 14.74 | 20.91 | 11.47 | 57.70 | 55.61 | 1.36 | 0.70 | N.M. | 1.14 |
| November | N.M. | 9.33 | 16.84 | 6.59 | 87.86 | 75.89 | 0.33 | 0.26 | N.M. | 1.27 | |
| December | 5.94 | 8.63 | 13.99 | −1.60 | 91.17 | 62.34 | 0.22 | 0.22 | N.M. | 1.23 | |
| 2019 | October | 8.34 | 11.62 | 17.94 | 14.98 | 78.18 | 68.23 | 0.64 | 0.62 | 0.23 | 1.86 |
| November | 5.79 | 8.33 | 17.88 | 7.19 | 86.73 | 65.36 | 0.42 | 0.38 | 0.25 | 0.95 | |
| December | 4.96 | 6.92 | 14.28 | −0.37 | 89.69 | 71.48 | 0.31 | 0.19 | 0.32 | 0.41 | |
| 2020 | October | 8.92 | 12.44 | 18.10 | 14.16 | 76.46 | 60.69 | 0.67 | 0.70 | 0.19 | 2.12 |
| November | 5.07 | 8.05 | 16.78 | 7.57 | 86.16 | 68.60 | 0.40 | 0.40 | 0.14 | 1.15 | |
| December | 5.73 | 8.40 | 16.69 | −1.01 | 84.86 | 61.98 | 0.48 | 0.24 | 0.14 | 0.85 | |
Note: * The 2018 meteorological data were measured from 27 October 2018; thus, the October 2018 meteorological data are only for 27–31 October 2018. Wind speed measurements are missing for 2018 due to instrument damage. ** N.M. means no data for the corresponding items due to instrument problems.
Table 2.
Leaf area index (LAI), plant height and yield in each tomato growth season.
| Growth Seasons | Date | LAI | Height/cm | Seasonal Yield/ton ha−1 |
|---|---|---|---|---|
| 2018 season | 2018.11.01 | 2.86 | 165 | 86.5 |
| 2019.01.01 | 2.20 | 147 | ||
| 2019 season | 2019.10.04 | 0.92 | 81 | 56.3 |
| 2019.10.26 | 1.62 | 119 | ||
| 2019.11.23 | 1.55 | 125 | ||
| 2019.12.21 | 1.68 | 123 | ||
| 2020 season | 2020.10.05 | 2.19 | 111 | 83.6 |
| 2020.11.10 | 3.31 | 155 | ||
| 2020.12.26 | 2.19 | 152 |
Table 3.
Linear regression results of daily sap flow (SF) and microclimate variables. Fitted data are for December. The linear fitting of SF with radiation, VPD and temperature was performed with Microsoft Excel, in which SF and microclimate variables are dependent and independent variables, respectively.
| Microclimate Variables | Seasons | Regressed Lines | RMSE/mm d−1 | MRE/% | NSE | R2 |
|---|---|---|---|---|---|---|
| Solar radiation (MJ m−2 d−1) | 2018 | SF = 0.16Rs | 0.147 | 6.79 | 0.82 | 0.87 |
| 2019 | SF = 0.21Rs | 0.142 | 4.43 | 0.94 | 0.96 | |
| 2020 | SF = 0.15Rs | 0.122 | 0.80 | 0.85 | 0.92 | |
| All data | SF = 0.18Rs | 0.221 | 8.89 | 0.79 | 0.82 | |
| VPD (kPa) | 2018 | SF = 4.13VPD | 0.106 | 1.13 | 0.91 | 0.91 |
| 2019 | SF = 3.30VPD | 0.202 | −3.94 | 0.88 | 0.89 | |
| 2020 | SF = 1.76VPD | 0.104 | −1.63 | 0.90 | 0.90 | |
| All data | SF = 2.92VPD | 0.334 | −7.29 | 0.50 | 0.61 | |
| Temperature (°C) | 2018 | SF = 0.15T − 1.12 | 0.220 | 5.74 | 0.61 | 0.62 |
| 2019 | SF = 0.21T − 1.94 | 0.235 | 7.74 | 0.84 | 0.84 | |
| 2020 | SF = 0.16T − 1.90 | 0.170 | −9.88 | 0.72 | 0.79 | |
| All data | SF = 0.16T − 1.33 | 0.314 | 4.98 | 0.57 | 0.58 |
Table 4.
Linear regression to sap flow (SF) was performed with VPD and radiation. The linear fitting passed through the origin.
Table 4.
Linear regression to sap flow (SF) was performed with VPD and radiation. The linear fitting passed through the origin.
| Microclimate Variables | Seasons | Regressed Lines | RMSE/mm d−1 | MRE/% | NSE | R2 |
|---|---|---|---|---|---|---|
| Solar radiation (MJ m−2 d−1) | 2018 | SF = (0.09 + 0.28VPD)Rs | 0.098 | 3.28 | 0.92 | 0.93 |
| 2019 | SF = (0.14 + 0.18VPD)Rs | 0.102 | 2.84 | 0.97 | 0.97 | |
| 2020 | SF = (0.07 + 0.14VPD)Rs | 0.088 | −1.40 | 0.93 | 0.93 | |
| All data | SF = (0.12 + 0.14VPD)Rs | 0.174 | 2.36 | 0.87 | 0.90 | |
| VPD (kPa) | 2018 | SF = (3.32 + 0.13Rs)VPD | 0.104 | 0.98 | 0.91 | 0.92 |
| 2019 | SF = (4.24 − 0.12Rs)VPD | 0.207 | 3.08 | 0.87 | 0.88 | |
| 2020 | SF = (1.18 + 0.10Rs)VPD | 0.114 | 3.18 | 0.87 | 0.90 | |
| All data | SF = (3.38 + 0.01Rs)VPD | 0.278 | 8.95 | 0.67 | 0.72 |
Table 5.
Water productivity (WPI) during the tomato growing period and irrigation depth, sap flow (SF) amount and irrigation water use efficiency (IE) during SF measurements.
Table 5.
Water productivity (WPI) during the tomato growing period and irrigation depth, sap flow (SF) amount and irrigation water use efficiency (IE) during SF measurements.
| Seasons | WPI (kg m−3) | SF Measurement Period * | ||
|---|---|---|---|---|
| Irrigation Depth (mm) | SF Amount (mm) | IE | ||
| 2018 | 16.8 | 255 | 78 | 0.31 |
| 2019 | 11.1 | 162 | 98 | 0.60 |
| 2020 | 18.1 | 52 | 36 | 0.69 |
Note: * Sap flow was measured in the 2018 season from 1 November 2018, to 16 January 2019; in the 2019 season from 27 October 2019, to January 5, 2020; and in the 2020 season from 12 November 2020, to 27 December 2021.
Publisher’s Note: MDPI stays neutral with regard to jurisdictional claims in published maps and institutional affiliations. |
© 2022 by the authors. Licensee MDPI, Basel, Switzerland. This article is an open access article distributed under the terms and conditions of the Creative Commons Attribution (CC BY) license (https://creativecommons.org/licenses/by/4.0/).
Share and Cite
MDPI and ACS Style
Yang, L.; Liu, H.; Tang, X.; Li, L. Tomato Evapotranspiration, Crop Coefficient and Irrigation Water Use Efficiency in the Winter Period in a Sunken Chinese Solar Greenhouse. Water 2022, 14, 2410. https://doi.org/10.3390/w14152410
AMA Style
Yang L, Liu H, Tang X, Li L. Tomato Evapotranspiration, Crop Coefficient and Irrigation Water Use Efficiency in the Winter Period in a Sunken Chinese Solar Greenhouse. Water. 2022; 14(15):2410. https://doi.org/10.3390/w14152410
Chicago/Turabian StyleYang, Li, Haijun Liu, Xiaopei Tang, and Lun Li. 2022. "Tomato Evapotranspiration, Crop Coefficient and Irrigation Water Use Efficiency in the Winter Period in a Sunken Chinese Solar Greenhouse" Water 14, no. 15: 2410. https://doi.org/10.3390/w14152410
Note that from the first issue of 2016, this journal uses article numbers instead of page numbers. See further details here.