
Analysis of Socio-Economic Factors That Influence Loss of Life in Sediment-Related Disasters

1
SABO Frontier Foundation, Tokyo 1020093, Japan
2
Department of Forest Science, Graduate School of Agriculture and Life Sciences, The University of Tokyo, Tokyo 1138657, Japan
*
Author to whom correspondence should be addressed.
Water 2022, 14(15), 2408; https://doi.org/10.3390/w14152408
Submission received: 27 June 2022
/
Accepted: 28 July 2022
/
Published: 3 August 2022
(This article belongs to the Special Issue Natural Disasters Occurrence, Reduction, and Restoration in Mountain Regions)
Abstract
:Non-structural measures, including relocation from a hazard zone, land development regulations, and evacuation, are important sediment-related countermeasures. Such measures depend on the behaviour of residents and are affected by socio-economic conditions. In Japan, the declining birth rate and ageing population are expected to result in rapid changes in socio-economic conditions; accordingly, there is a need to evaluate the impact of such changes. However, there is no established methodology for the establishment of non-structural measures that considers the socio-economic conditions of all areas. Therefore, this study analysed the regional characteristics of disaster-affected areas with high numbers of casualties to elucidate the impact of socio-economic conditions. The results imply that severe losses occurred under various topographical and socio-economic conditions, such as in urban areas with high population densities and in mountainous areas with increasing depopulation. More data are needed, especially regarding socio-economic conditions. Importantly, the community-based analytical method used in this study enables a comparative analysis of disasters in different regions at different times.
1. Introduction
More than 1000 sediment-related disasters occur annually in Japan; they occur in both urban and mountainous areas under different socio-economic conditions, and their causes differ among areas. Sediment-related disasters in this context are disasters that cause direct damage to human lives and houses as a result of sediment movement, and are broadly classified as debris flows, slope failures and landslides [1]. Because Japan is a mountainous and densely populated country, many areas are vulnerable to sediment-related hazards. Despite ongoing preventive structural measures being undertaken annually, many sediment-related casualties occur. Therefore, the importance of non-structural measures, such as land development regulations and evacuation warnings, is regaining attention. However, these measures require the cooperation of residents, and it is important to consider socio-economic factors and to select appropriate measures for both urban and mountainous areas.
According to the FY2020 White Paper on Forest and Forestry [2], mountain villages, most of which are located in mid-mountainous areas (mountainous areas on the outer edges of plains), experienced a significant outflow of population, particularly of young people, during the recent period of rapid economic growth in Japan (ca. the 1960s). Additionally, depopulation and ageing are rapidly progressing. The report also indicated that many villages face problems, such as fewer households, a large proportion of older residents, difficulties in maintaining village functions, the potential for village disappearance, and an absence of newcomers. These problems are worse in mountain villages than in flatlands or mid-mountainous areas. Furthermore, Karasaki [3] described a situation in which social changes (e.g., agricultural decline, depopulation, and widespread ageing) are causing the ties between local community members to fade; thus, the nature of local communities is changing. Such changes threaten livelihoods, particularly in mid-mountainous areas.
Kanai [4] focused on sediment-related disasters in urban areas, in a study that traced the relationship between the conditions of residential land and major sediment-related disasters from the Meiji period (1868–1912) to the collapse of the bubble economy. He concluded that post-war housing policies that prioritised single-family homes, combined with urban planning that prioritised the economy, led to residential land development that drastically changed the topography. After the collapse of the bubble economy, the number of housing starts declined, and the housing industry was restructured. These changes resulted in the emergence of a business model in which large numbers of houses with land were built for sale at low prices. A related issue is the inappropriate disposal of construction soil. Although this was a problem during the period of rapid economic growth and in construction related to the 1964 Tokyo Olympics, there was no shortage of locations to dispose of the soil because of strong demand for soil and sand as aggregate for coastal reclamation, road construction, and building construction. However, during the 1990s, a period of low economic growth, the need for dumping sites increased, resulting in mountainous areas being chosen for the disposal of construction soil. This situation resulted in disaster-prevention structures that were established under conventional socio-economic conditions no longer functioning because of the changes in the socio-economic conditions, which led to sediment-related disasters.
Differences in socio-economic conditions among regions are also affected by the intensification of disasters due to climate change and population decline; these factors are relevant to the nature of future sediment-related disaster countermeasures. However, to date, research has not sufficiently considered socio-economic conditions and the causes of sediment-related disasters. Therefore, this study analysed the socio-economic conditions of major sediment-related disaster sites where casualties occurred, considering the relationship between the occurrence of casualties and socio-economic conditions. It provides key information for the assessment of sediment-related disaster countermeasures in the context of socio-economic conditions.
2. Literature Review of Human Suffering Caused by Sediment-Related Disasters
In one case, the mortality rate from sediment-related disasters was higher among people in their 40s and 50s than among older adults. This can be explained by social norms that influenced the living spaces of different age groups using the data from 38 cases occurring between 1881 and 2019 [5]. Additionally, Jason [6] reported that disaster preparedness was negatively associated with renter status, although the reasons for this were unclear. Socio-economic conditions can affect loss of life as a result of sediment-related disasters. Václav et al. [7] demonstrated that the memory and experience of past disasters in a community affect where people live, indicating that by reducing the number of residents in sediment-disaster-related areas, past disasters have a significant socio-economic impact on subsequent losses from sediment-related disasters.
In terms of non-structural measures based on the Sediment-related Disaster Prevention Act (enacted in 2001), 41% of respondents to a survey that covered 47 prefectures (up to three items selected; percentage of total points when first, second, and third choice scored 3, 2, and 1 points, respectively; same below) indicated ‘concern about a decrease in land prices’ as the reason why residents opposed the designation of areas based on the Sediment-related Disaster Prevention Act. The top responses were ‘dissatisfaction with structural restrictions on building’ (25%) and ‘dissatisfaction with the lack of implementation of structural measures, if designated’ (17%) [8]. These results imply that the designation of areas and the development of controls and structural regulations under the Sediment-related Disaster Prevention Law are affected by the possibility of land sales (e.g., the degree of population increase or decrease), the type of homeownership (e.g., owner-occupied or rental housing), and conditions that affect the implementation of structural measures (e.g., financial status of government agencies and population size).
Of these, population size and the rate of increase or decrease are among the socio-economic conditions that require the most attention. In the previous section, we discussed the population declines in agricultural and mountain villages as a socio-economic condition that influences sediment-related-disaster countermeasures. In some villages, ageing residents cannot drive and have problems moving to evacuation centres [9]. In addition, population size can affect the ability to provide assistance: if the number of residents in a village with a declining population decreases further because of a sediment-related disaster, assistance becomes more difficult, thus increasing the risk of a disaster and potentially producing a vicious cycle.
The initial budget for erosion-control projects declined continuously from 1972 to 2006, with a peak decline in 1998 [10]. Since then, the rate of increase or decrease has been approximately 1.0 [11]. Data from 27 prefectures show that, from FY2009 to FY2013, the cost of non-structural measures was less than 10% of that of structural measures annually [12]. Thus, each prefecture primarily promoted structural measures, while providing less financial support to non-structural measures. In addition, considering the large number of designated zones, it would be difficult to allocate sufficient financial resources toward explaining the conditions in each zone. Therefore, the financial situations of municipalities located closest to residents at risk and responsible for building-evacuation precautions under the Sediment-related Disaster Prevention Law may directly affect the human loss resulting from a lack of sediment-related disaster countermeasures. Mizuyama [13] described the need for a cost–benefit analysis of evacuation alerts and provided a discussion of the costs of gathering information and recommending evacuation, the cost of providing food at evacuation sites, and other expenses to support evacuation. It has been estimated that the financial and human resources of municipalities that conduct such activities affect human loss.
In this study, we presumed that socio-economic conditions (e.g., the population size and its increase or decrease, the financial status of administrative agencies, and the type of home ownership) were related to the occurrence of casualties resulting from sediment-related disasters. We analysed these and other conditions at disaster sites.
3. Method
In our study, we selected study areas based on the magnitude of human loss resulting from sediment-related disasters. A characteristic of sediment-related disasters, as distinct from other natural disasters, is that the forces generated by water and rocks are extremely large and have considerable potential to impact people’s lives. In addition to its significant effect of further decreasing resident numbers in mountainous areas with continuing population decline, loss of life is an important indicator that can both maintain the memory of disasters and aid in the implementation of disaster-prevention activities.
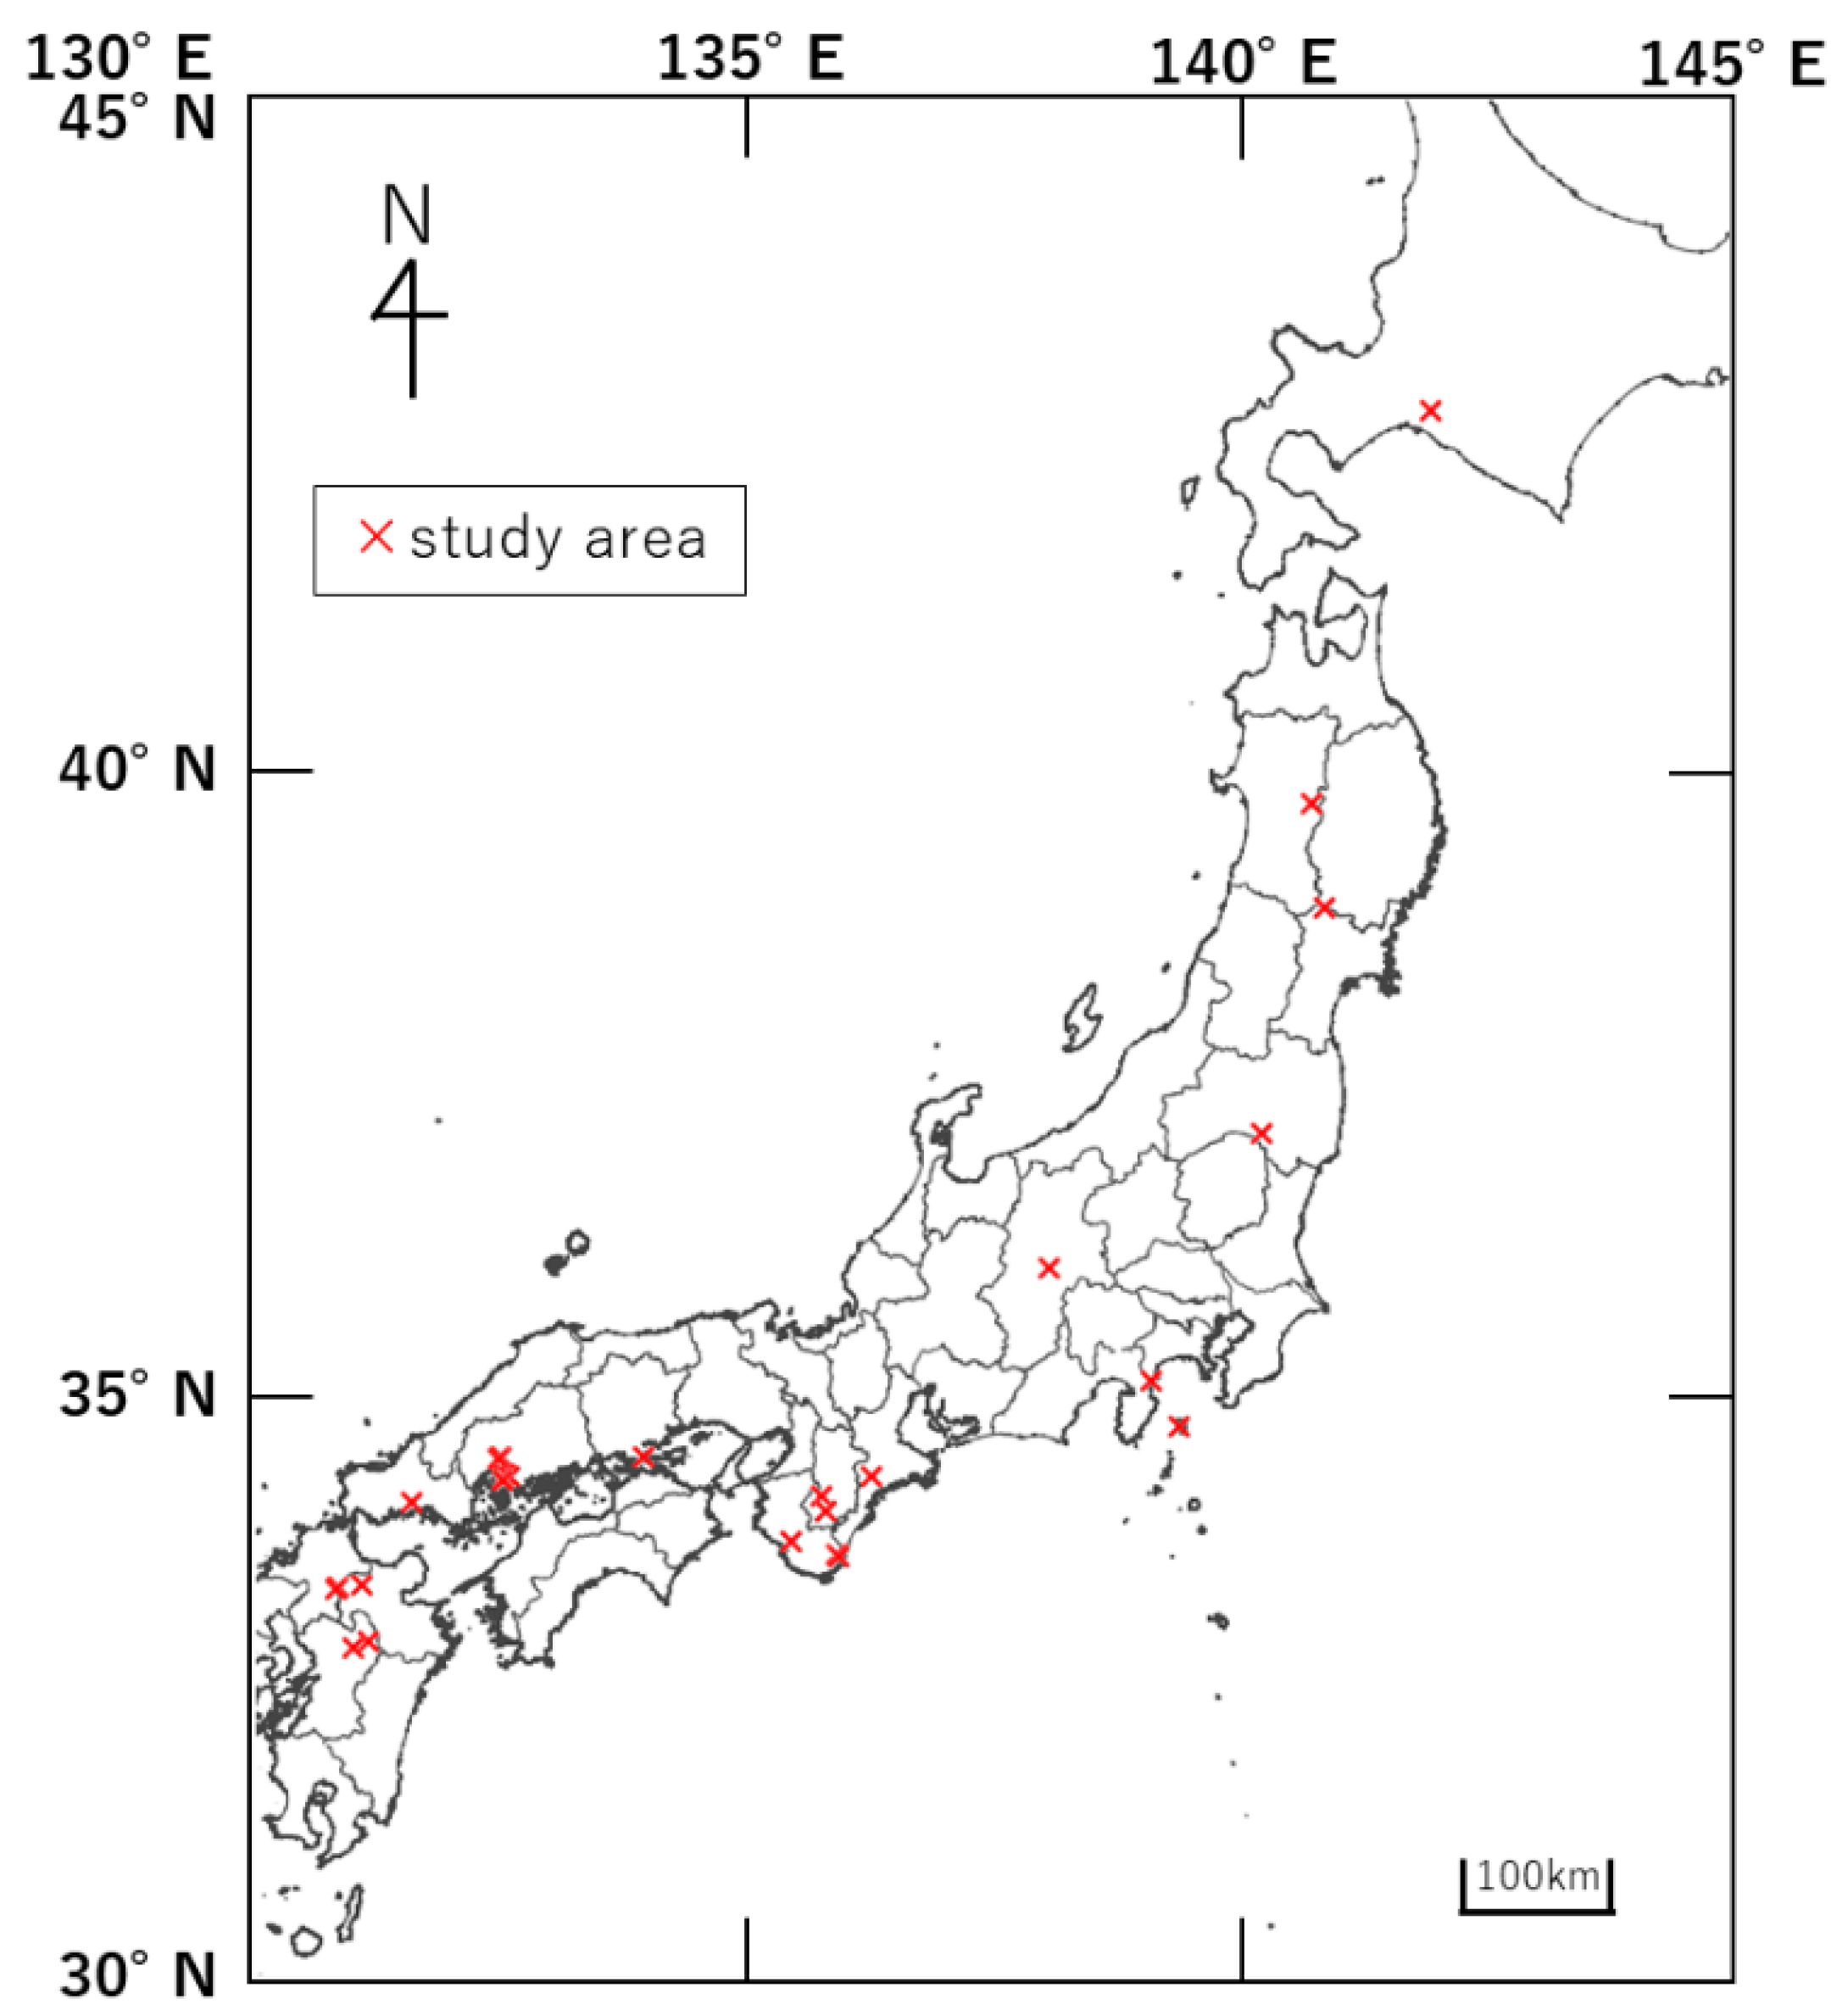
We collected study cases from the annual reports of major sediment-related disasters listed by the Erosion Control Department of the Ministry of Land, Infrastructure, Transport and Tourism, Japan, from 2004 to August 2021 [14]. All study cases were defined as community units, smaller than municipalities. The cases selected included fatalities or missing persons. We supplemented these cases with reports from national or prefectural verification committees and academic papers related to disasters. Based on these results, 28 cases with ≥5 people missing or dead per location were included (Table 1, Figure 1). In Table 1, the term ‘meteorological phenomenon’ is based on the definition provided by the Japan Meteorological Agency [15]. The term ‘agricultural community’ is based on units from the agricultural census [16].
The disaster phenomena included in the 28 cases were 13 cases of debris flow (reported in terms of the agricultural community names: Sendatsu, Motomachi, Hanaoka, Ui, Ichinono, Iseki-1, Uno, Muroya, Kamirakuchi, Ohara, Yashiki, Nango, and Fukuoka), 3 cases of landslides (Iizawa, Nagano-6, and Kurokawa), 2 cases of slope failure (Yoshino, and Kajigaharu-yukihiro), and 10 unknown cases (3 cases described as ‘debris flow and other’: Kidani, Kawasumi, and Koyaura; 5 cases without a description of the disaster in the annual reports: Kouei, Tenjin, Onishi, Tachi, and Ishizume, and 2 cases without a description of the disaster phenomenon: Takiya and Nojiri). The most common disaster among these cases was a debris flow that damaged a wide area.
Published data were collected to elucidate the characteristics of the ‘place’ and ‘people’ in the study area affected by the targeted sediment-related disaster, including conditions that affected losses during the sediment-related disaster. We used the agricultural community unit as the unit of the study area. According to the Census of Agriculture and Forestry [17], an agricultural community is ‘a community based on agriculture in part of a municipal area,’ and ‘specifically, a production community closely connected to the maintenance and management of agricultural roads and water facilities, common forests, marriage, funerals, and other aspects of life. In addition, an agricultural community functions as a unit of self-governance and administration’. As such, an agricultural community is considered similar to the unit used in normal times and in times of disaster. However, the sub-regional units from the census [18] were used in cases where data were not organised into units of agricultural community.
4. Results
4.1. Topography, Geology, and Rainfall Conditions
In this study, the topographical conditions of the study areas can be summarised as follows: average elevation of the centre and average slope of the centre [20], geology [21], and annual precipitation [22] (Table 2).
None of the study areas had an average elevation <10 m above sea level; however, 17.9% and 24.9% of the areas had an average elevation of 30–50 m or ≥200 m, respectively, while the corresponding national averages are 10.2% and 14.9%. Thus, although the affected areas were generally higher in elevation compared to the nation as a whole, many areas were located at relatively low elevations of 30–50 m. No bias suggesting an impact on the amount of human harm could be identified.
The average slopes of the central part of the areas were <5° for 11 (42.9%), 5–15° for 16 (53.6%), and >15° for 1 (27.1°). The areas with an average central land slope of ≥5°, which constituted half of the settlements, are presumably located in areas with poor agricultural production; accordingly, many of them tend to have low agricultural incomes and an ageing population. The average slope does not directly affect the number of human casualties, although it is necessary to consider the impact of social conditions as well.
The geological classification of the sediment movement that caused damage to each area was established. The number of movements classified was larger than the number of target areas because two areas included two geological classifications. Based on the results, we classified the geological units into sedimentary rock, igneous rock, and accretionary complexes; igneous rock constituted the largest proportion (70%), followed by sedimentary rock (17%) and accretionary complexes (13%). Among igneous rock, granite was the most common rock type, constituting 30% (nine sites) of the total, because of the large number of disasters in Hiroshima Prefecture. The frequency of slope failures and debris flows caused by heavy rainfall is once every 10–1000 years based on 34 reports of such events in Japan, but the frequency is as high as once every 10–100 years for siliceous and granitic rocks and as low as once every 1000 years for accretionary sedimentary rocks of the Mesozoic to Paleozoic boundaries [23]. Therefore, the geological features of an area may lead to different disaster experiences. It is possible that differences in the frequency of incidents due to geology may also affect the number of human casualties, but this cannot be confirmed due to the bias in the cases collected in this study.
We compiled annual rainfall data from the nearest rainfall stations for each area. Japan, which is located on the eastern edge of monsoon Asia (one of the world’s rainiest regions), receives an average annual precipitation of 1718 mm, which is approximately twice the global average (880 mm) [24]. Thus, half of the study areas generally receive rainfall above the average for Japan, while the remaining areas receive below-average rainfall. Some of the affected areas had experienced very high rainfall of as much as 3784.7 mm/year, while others had low rainfall of 1301.5 mm/year (the lowest value excluding earthquake-damaged areas). However, no direct relationship between the amount of rainfall and the number of human casualties was observed.
4.2. Land Use
The land-use status of each area was summarised based on the agricultural area classification [25] and changes in land-use status determined from aerial photographs [26].
- Type of agricultural area
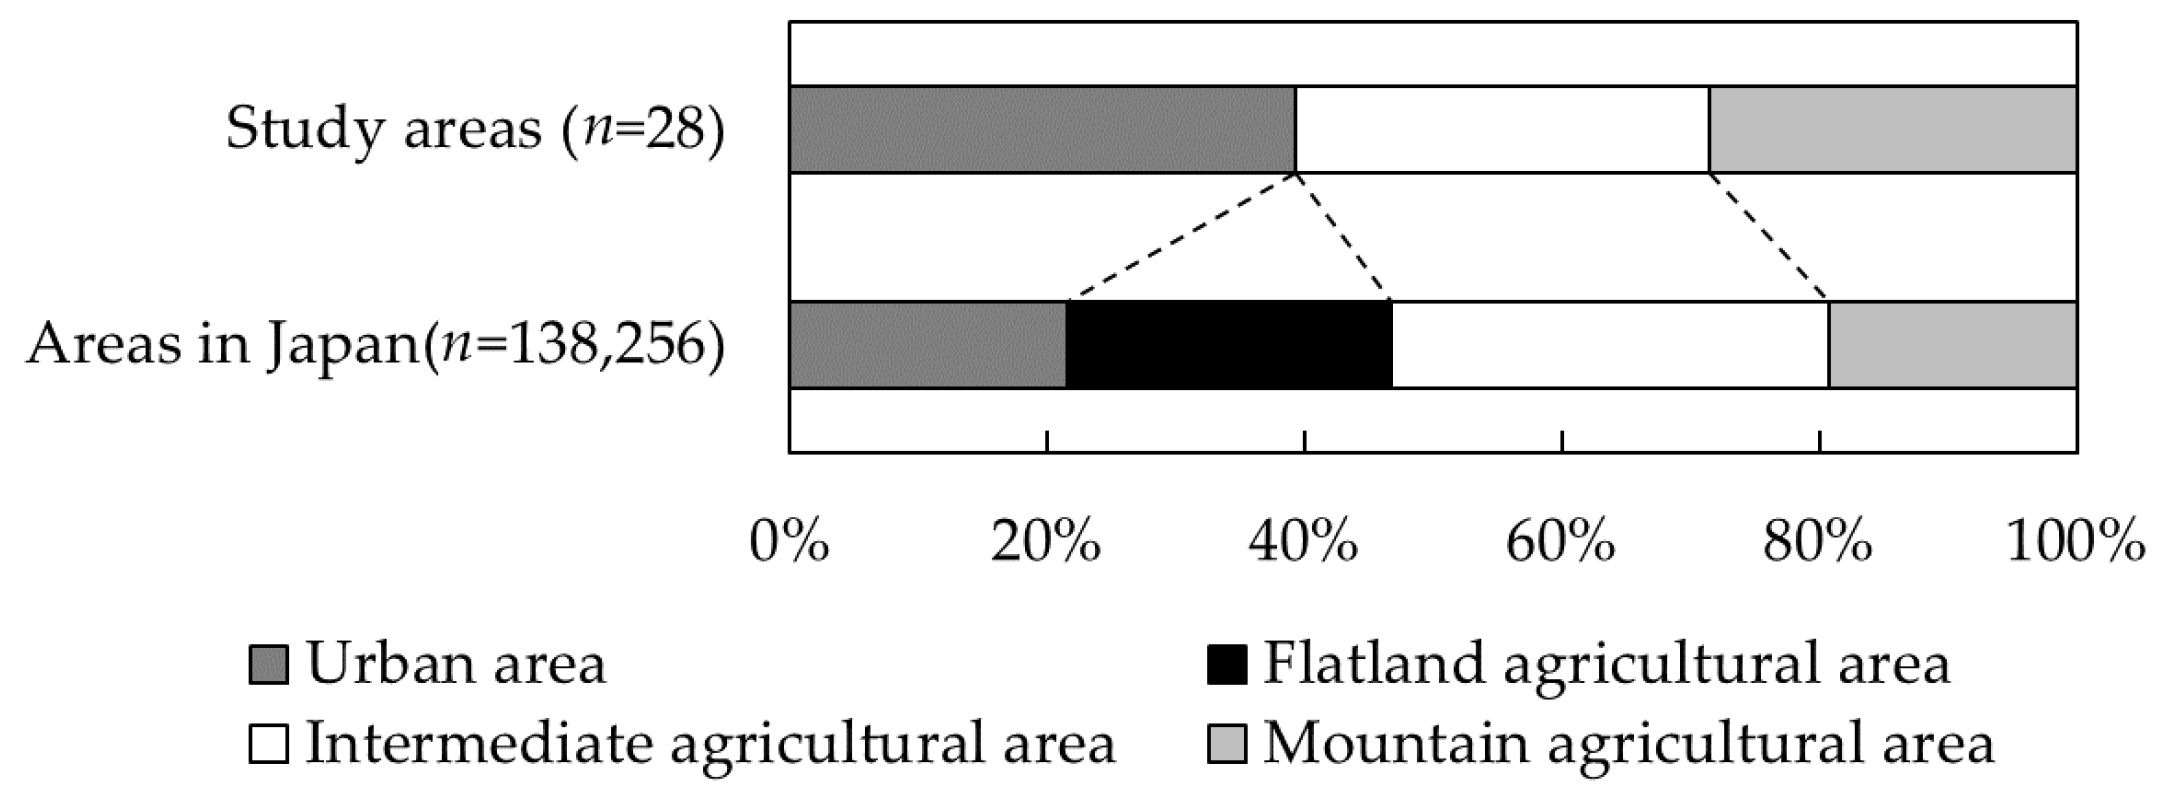
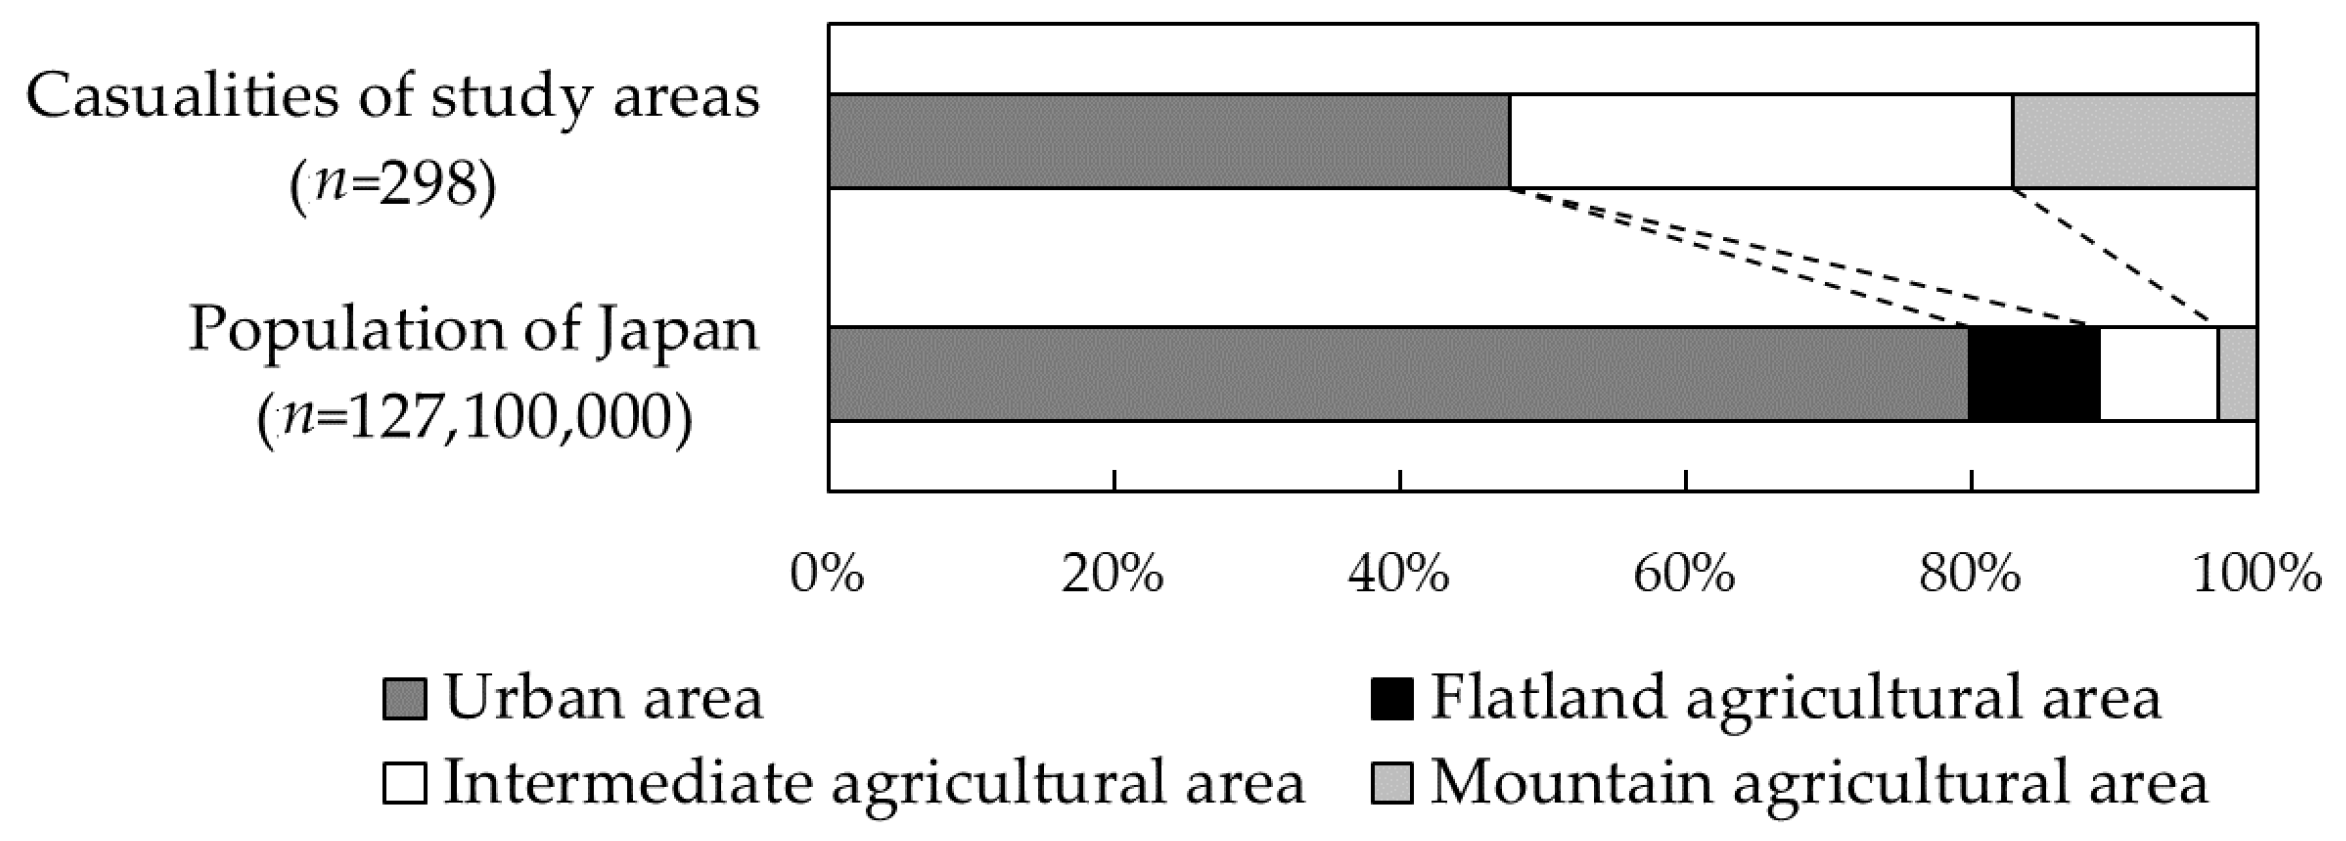
The study areas were organised based on agricultural area type, which is one of the main land-use categories. In accordance with the Ministry of Agriculture, Forestry and Fisheries of Japan [27], agricultural areas were classified on the basis of the land-use characteristics in each municipality. This classification is based on the conditions that define the regional agricultural structure and is used as a fundamental consideration in analyses of agricultural and forestry statistics, as well as in the promotion of agricultural policy. The classification comprises the following categories: urban area, flat agricultural area, intermediate agricultural area between flat and mountain areas, and mountain agricultural area. Comparison of agricultural area categories in the study areas and the nation as a whole [28] revealed that none of the study areas was ‘flatland agricultural area’; the proportions of the other categories (urban area, intermediate agricultural area, and mountain agricultural area) were all higher in the study areas than nationwide (Figure 2). The ratio of the number of fatalities in ‘urban areas’ in the study areas was lower than the ratio of population in Japan, whereas the ratio in ‘intermediate agricultural areas’ and ‘mountainous agricultural areas’ was fourfold and sixfold higher, respectively (Figure 3). The ‘mountainous agricultural areas’ have had the highest rate of population decline, with a consistent decline since 1970, and had the highest ageing rate (38.5%) [28]. Sediment-related disasters occurred in various areas, but the effects of loss of life were greater in mid-mountain areas and mountainous areas than in urban areas.
As the distribution of the number of human casualties differs significantly from that of the population in each agricultural area category, it is expected that land use and living patterns in each agricultural area category have an impact on the occurrence of human casualties.
- Changes in land use
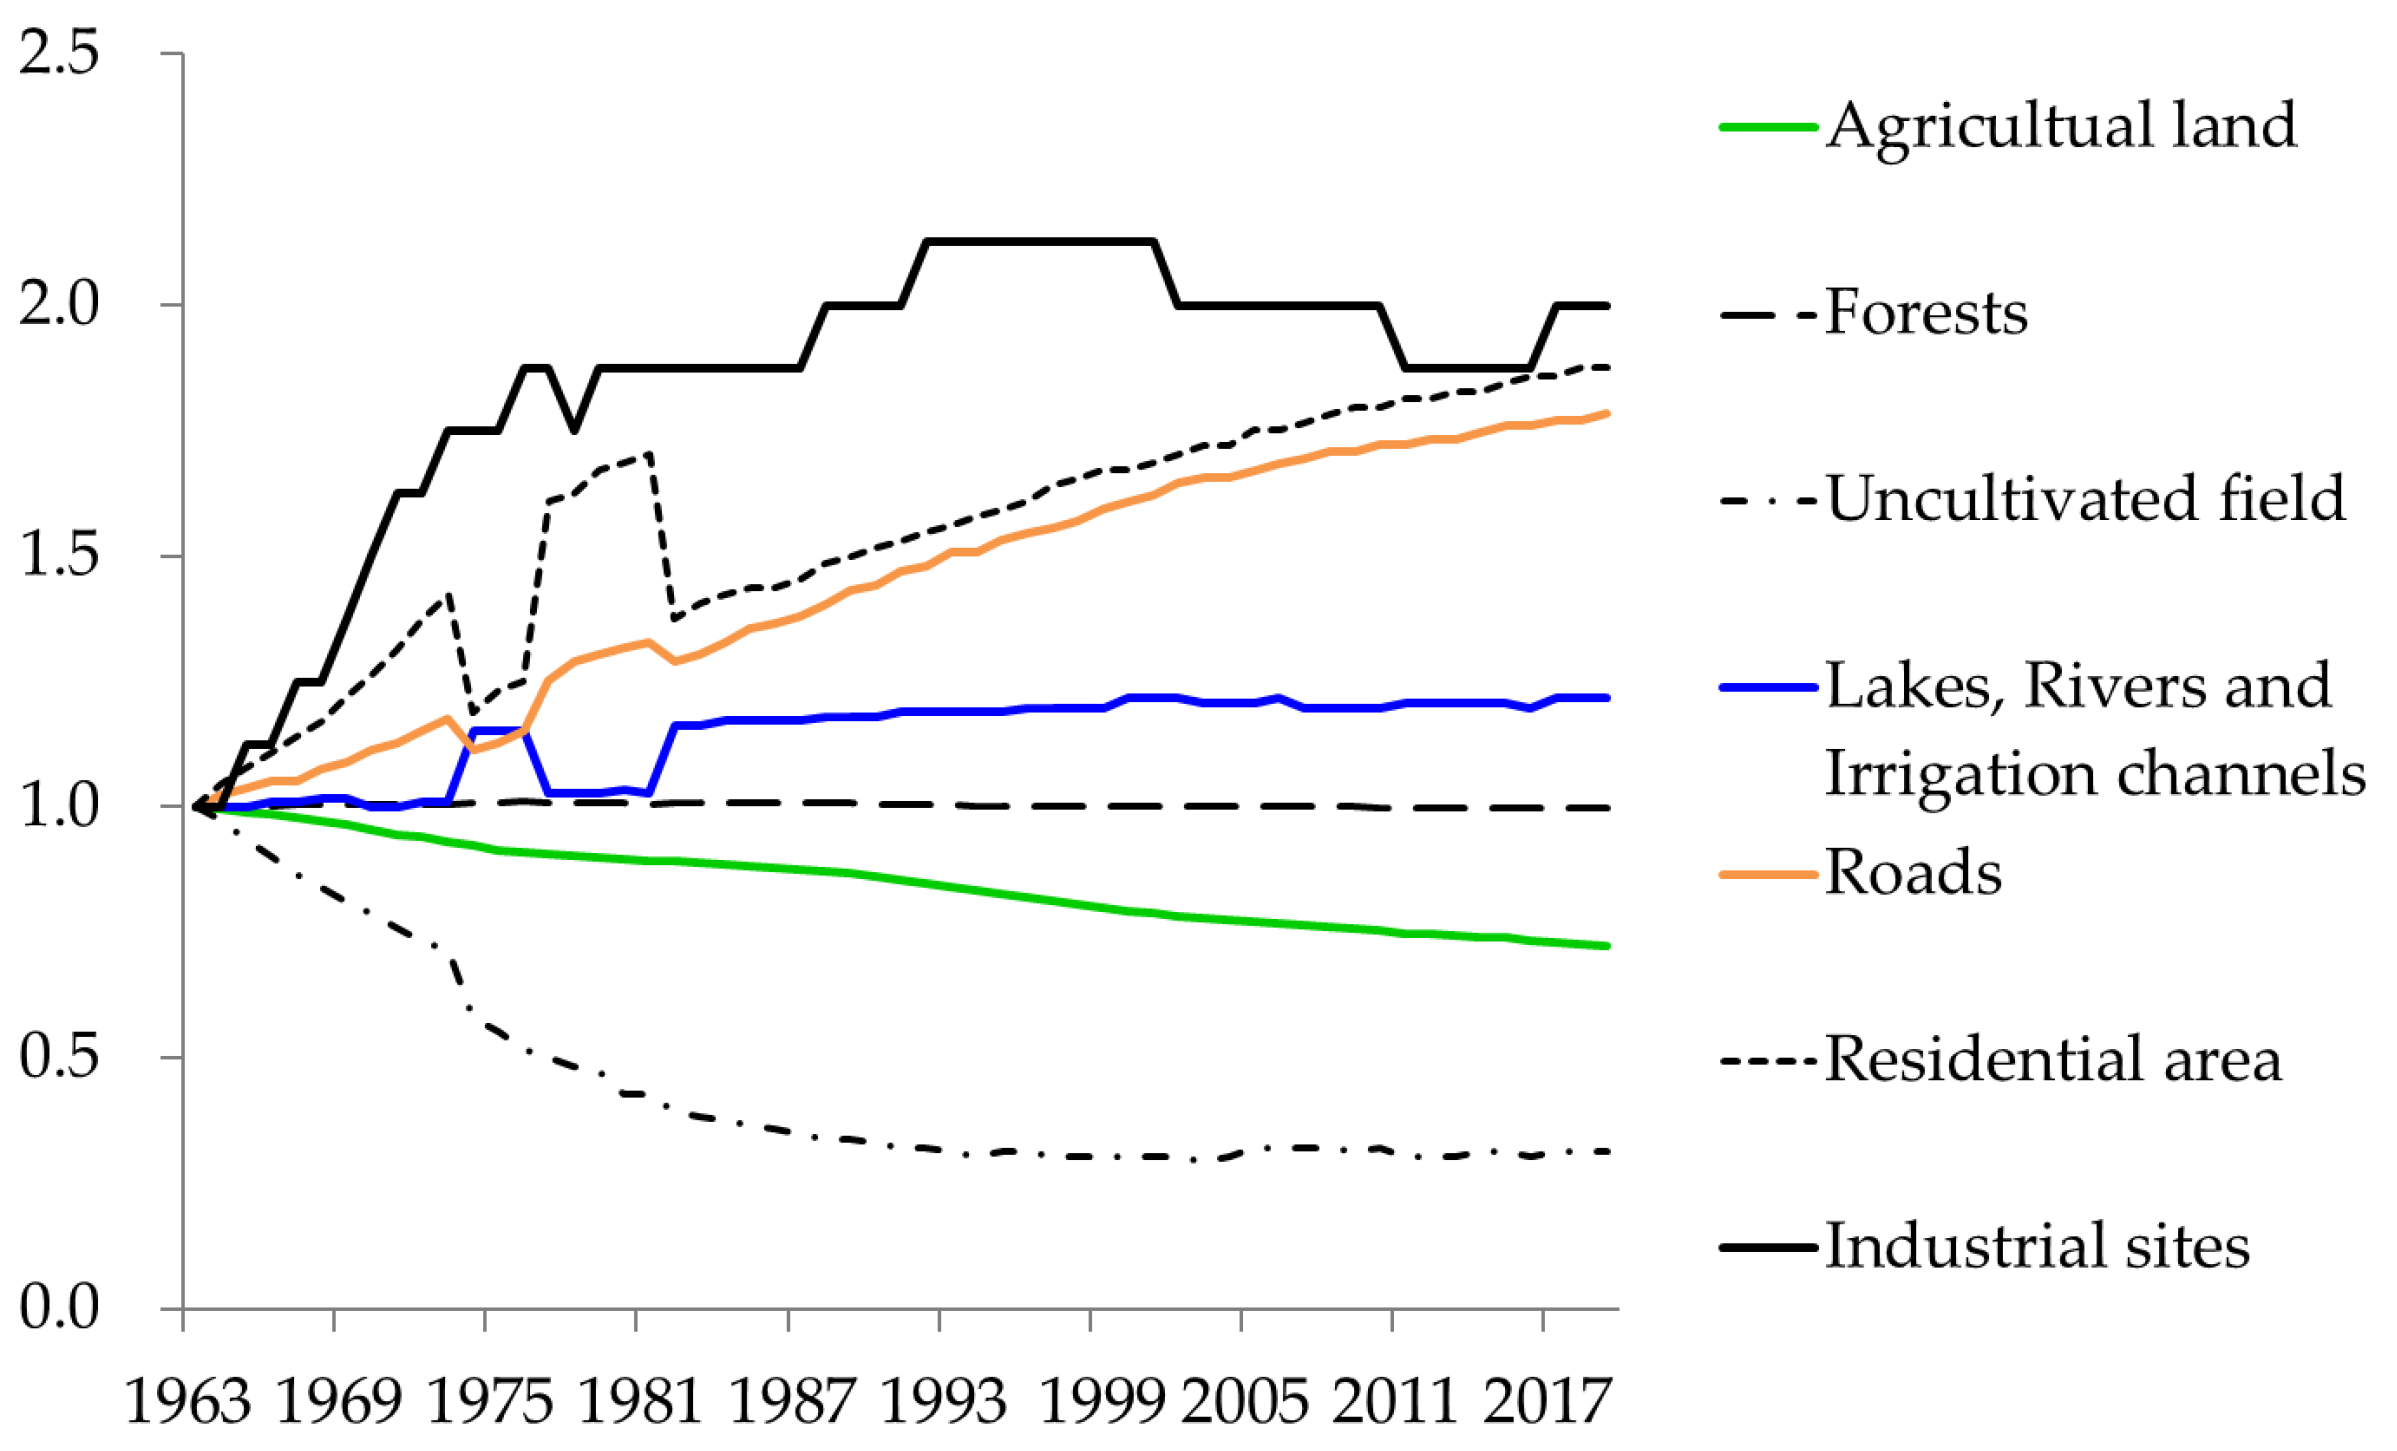
Among the tertiary-mesh land-use data of the National Land-use Data, the oldest data (1976) were compared with the newest (2016). The average values of the mesh units comprising each set of data were as follows, in descending order: ‘building sites’, ‘forests’, ‘saltwater areas’, ‘other sites (including golf courses)’, and ‘land for transportation’. The types of land that decreased were as follows, in descending order: ‘rice paddies’, ‘wastelands’, ‘other agricultural land’, ‘beaches’, and ‘river and lakes’ (Table 3). Based on the changes in the land-use classification of Japan [29] (Figure 4), ‘residential land’ and ‘roads’ have increased continuously during the same period, while ‘agricultural land’ has decreased continuously; ‘forests’ have increased and decreased at regular intervals. The study areas were unique in that ‘forests’ continuously increased in these areas.
The increase in ‘forest’ was likely the result of a decrease in ‘wasteland’ in mountainous areas because of afforestation and other factors. Furthermore, the increase in ‘building sites’ was generally consistent with the decrease in ‘rice paddies’ and some ‘wasteland’, implying that the overall trend in the target villages was for rice paddies and wasteland to be used for residential areas.
Analysis of the changes in land use (only building sites, forests, rice paddies, and wasteland with large increases or decreases were extracted) in each study area revealed that the changes varied among areas, but the main patterns were that ‘rice paddies’ decreased and ‘building sites’ increased, while ‘wasteland’ decreased, and ‘forest’ increased. Where ‘rice paddies’ decreased and ‘building sites’ increased, the expansion of residential areas was one cause of human suffering. Where ‘wasteland’ decreased and ‘forest’ increased, it is possible that the increase in forested areas, which at first glance would not be expected to cause landslides, led to a decline in awareness of landslide hazards.
The results indicate that land-use change and the associated expansion of settlements tend to increase human suffering.
4.3. Population and Its Change
We checked the population size (total population, sex ratio, and population aged ≥ 65 years) and population trends [30], together with the long-term status of population trends aggregated according to municipality [31].
- Population size and population trends in recent years
Table 4 shows the population size and recent population trends in the study areas. The total populations ranged from 40 to 5472 in 2005 and from 18 to 4771 in 2015, with considerable variation. The populations of all study areas except one (Muroya) declined; the average rate of decline was 23.8%. Sex ratios (here, the ratio of the female population to the male population) remained virtually unchanged at 1:1 in 2005 and 2015, but Yoshino and Nango experienced declines of >0.5 (the female population declined more than the male population). The proportion of the population aged ≥ 65 increased from 27.8% in 2005 to 36.7% in 2015. Based on the median values in 2015, the average area had a total population of 559, a male-to-female ratio of 1.1, a population in which 38.2% were aged ≥ 65 years, and a population decline rate of 19.6% over 10 years. Population size and composition, as well as population trends in recent years, did not directly affect the number of disasters with high numbers of human casualties.
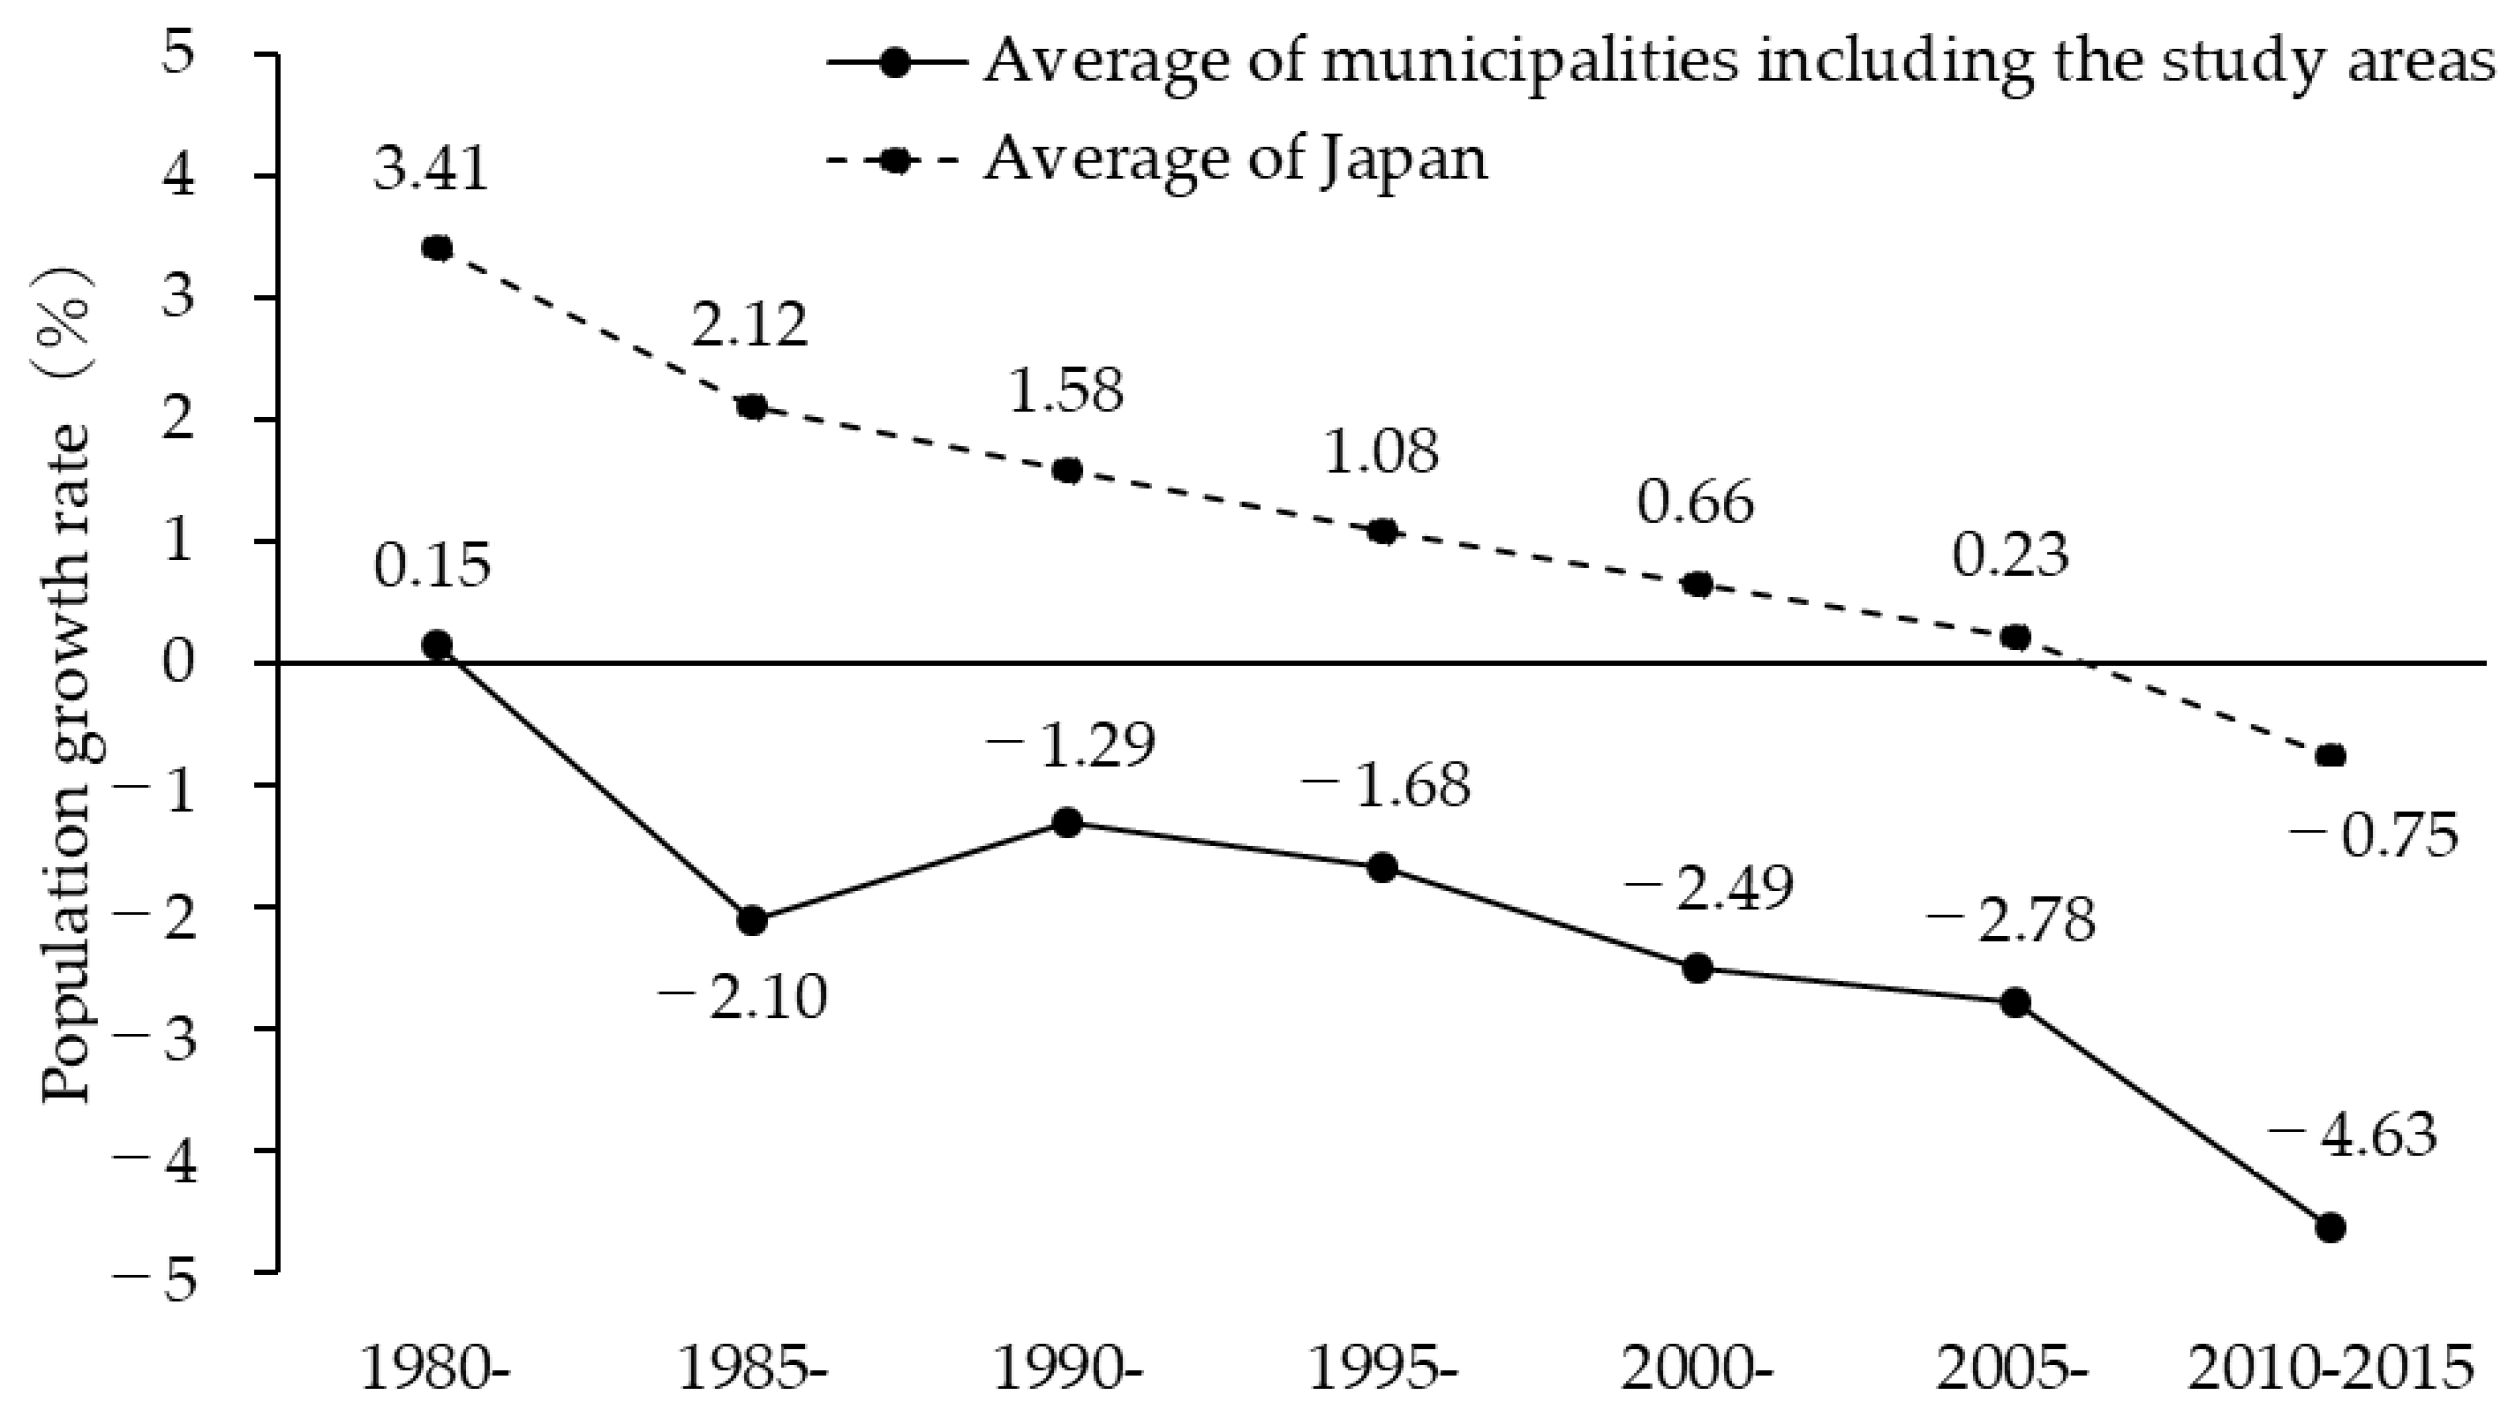
- Long-term population trends (1995–2015)
The population growth rates of the 20 municipalities included in the study areas tended to decline from 1985 to 2015, similar to the national trend (Figure 5). However, the degree of change during this period was −4.8%, which was slightly larger than the national rate of −4.2%. It was also 3.3% lower on average for each year, compared to the nation as a whole. Over approximately the past 30 years, disasters with large human losses have occurred in municipalities with large population losses.
4.4. Residency Status
The residential status in each area was summarised based on the length of residence [32] and housing type (proportion of households living in owner-occupied houses) [33].
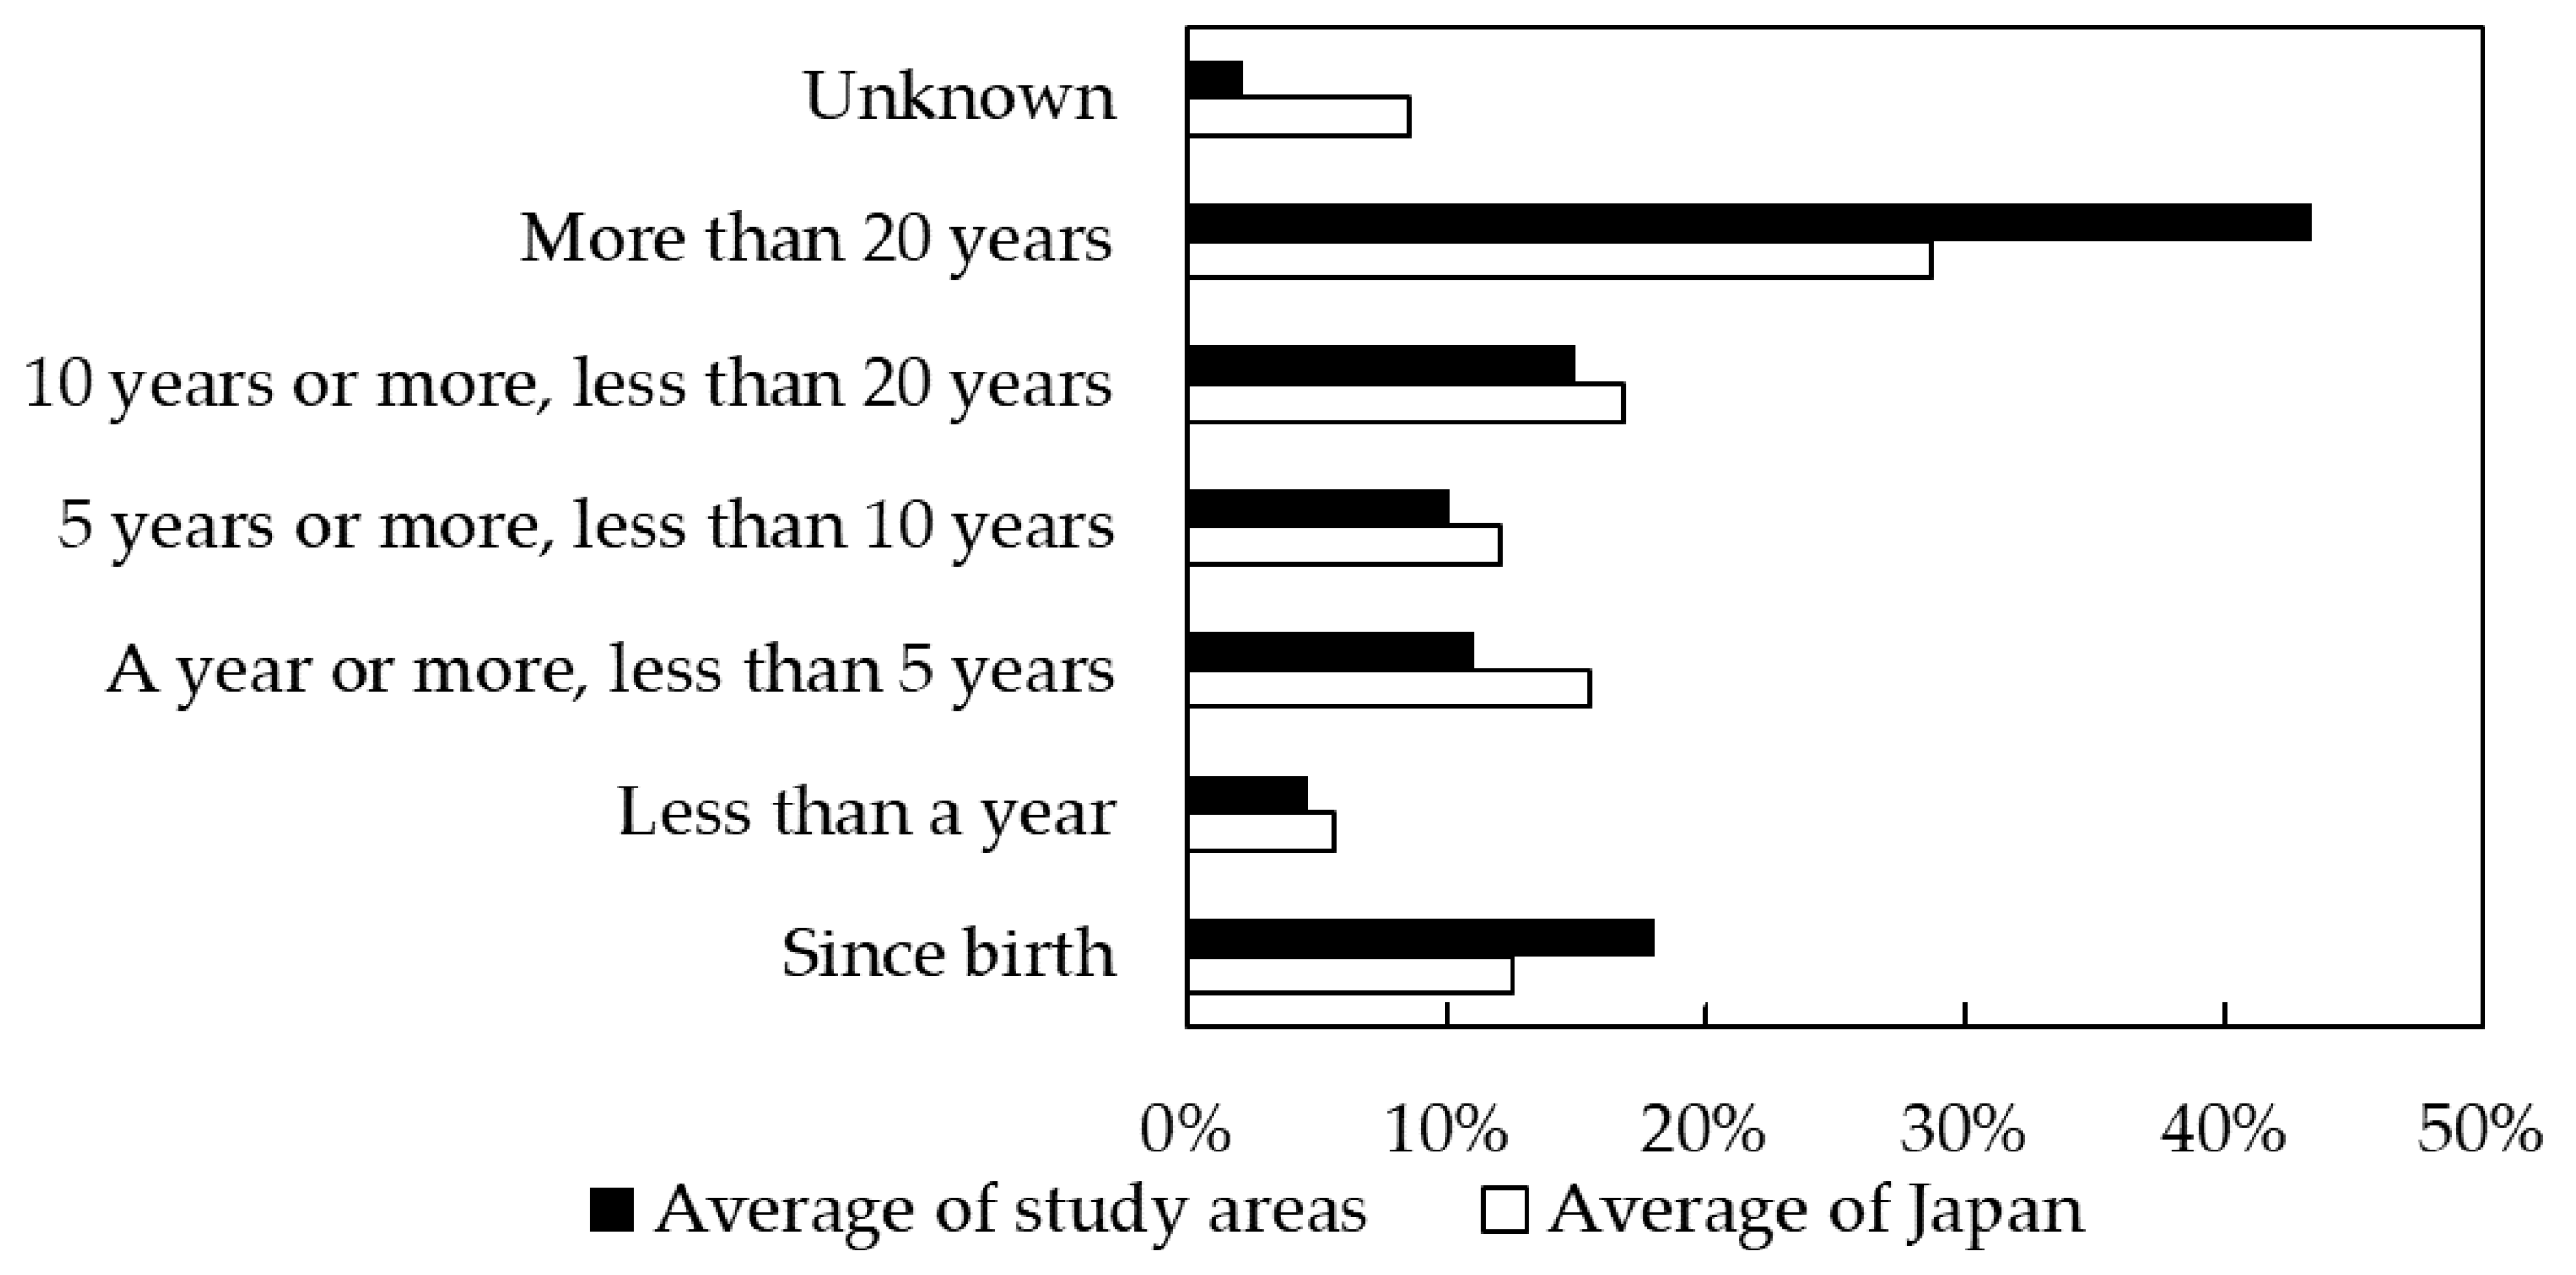
- Length of residence
We compared the average values of the study areas to those for Japan (Figure 6). The term “since birth” included people who had lived in an area for various lengths of time.
The percentages of the ‘since birth’ and ‘more than 20 years’ categories were higher in the study areas than in the whole of Japan. This suggests that disasters with large human losses have occurred in areas of low turnover of people. In addition, the proportion of women in the study areas was higher than the proportion of men in the ‘more than 20 years’ category and lower than the proportion of men in the ‘since birth’ category, compared to the national proportions. In many cases, there was minimal migration of people in the study areas. Many women presumably entered the study areas at marriage.
- Housing type
The proportion of households living in ‘owner-occupied’ housing as a percentage of the general number of households living in housing was analysed for each study area (we used sub-region units because of data limitations). Here, housing other than ‘owner-occupied’ homes included ‘public, the Urban Renaissance Agency, public corporation rented housing’, ‘private rented housing’, ‘salaried housing’, and ‘rented rooms’. The data were not disclosed because of confidentiality for one study area (Motomachi), and one sub-region included two study areas; thus, 26 sub-regions were covered. The results showed that the average proportion of households living in ‘owner-occupied housing’ was 83.2% of the total number of general households, which was higher than the national average of 62.3%. Disasters with high human casualty numbers occur in areas with high numbers of people in owner-occupied housing, who generally do not move as frequently.
4.5. Characteristics of Municipal Administration
The numbers of staff members and the financial statuses of 22 municipalities including the study areas were summarised.
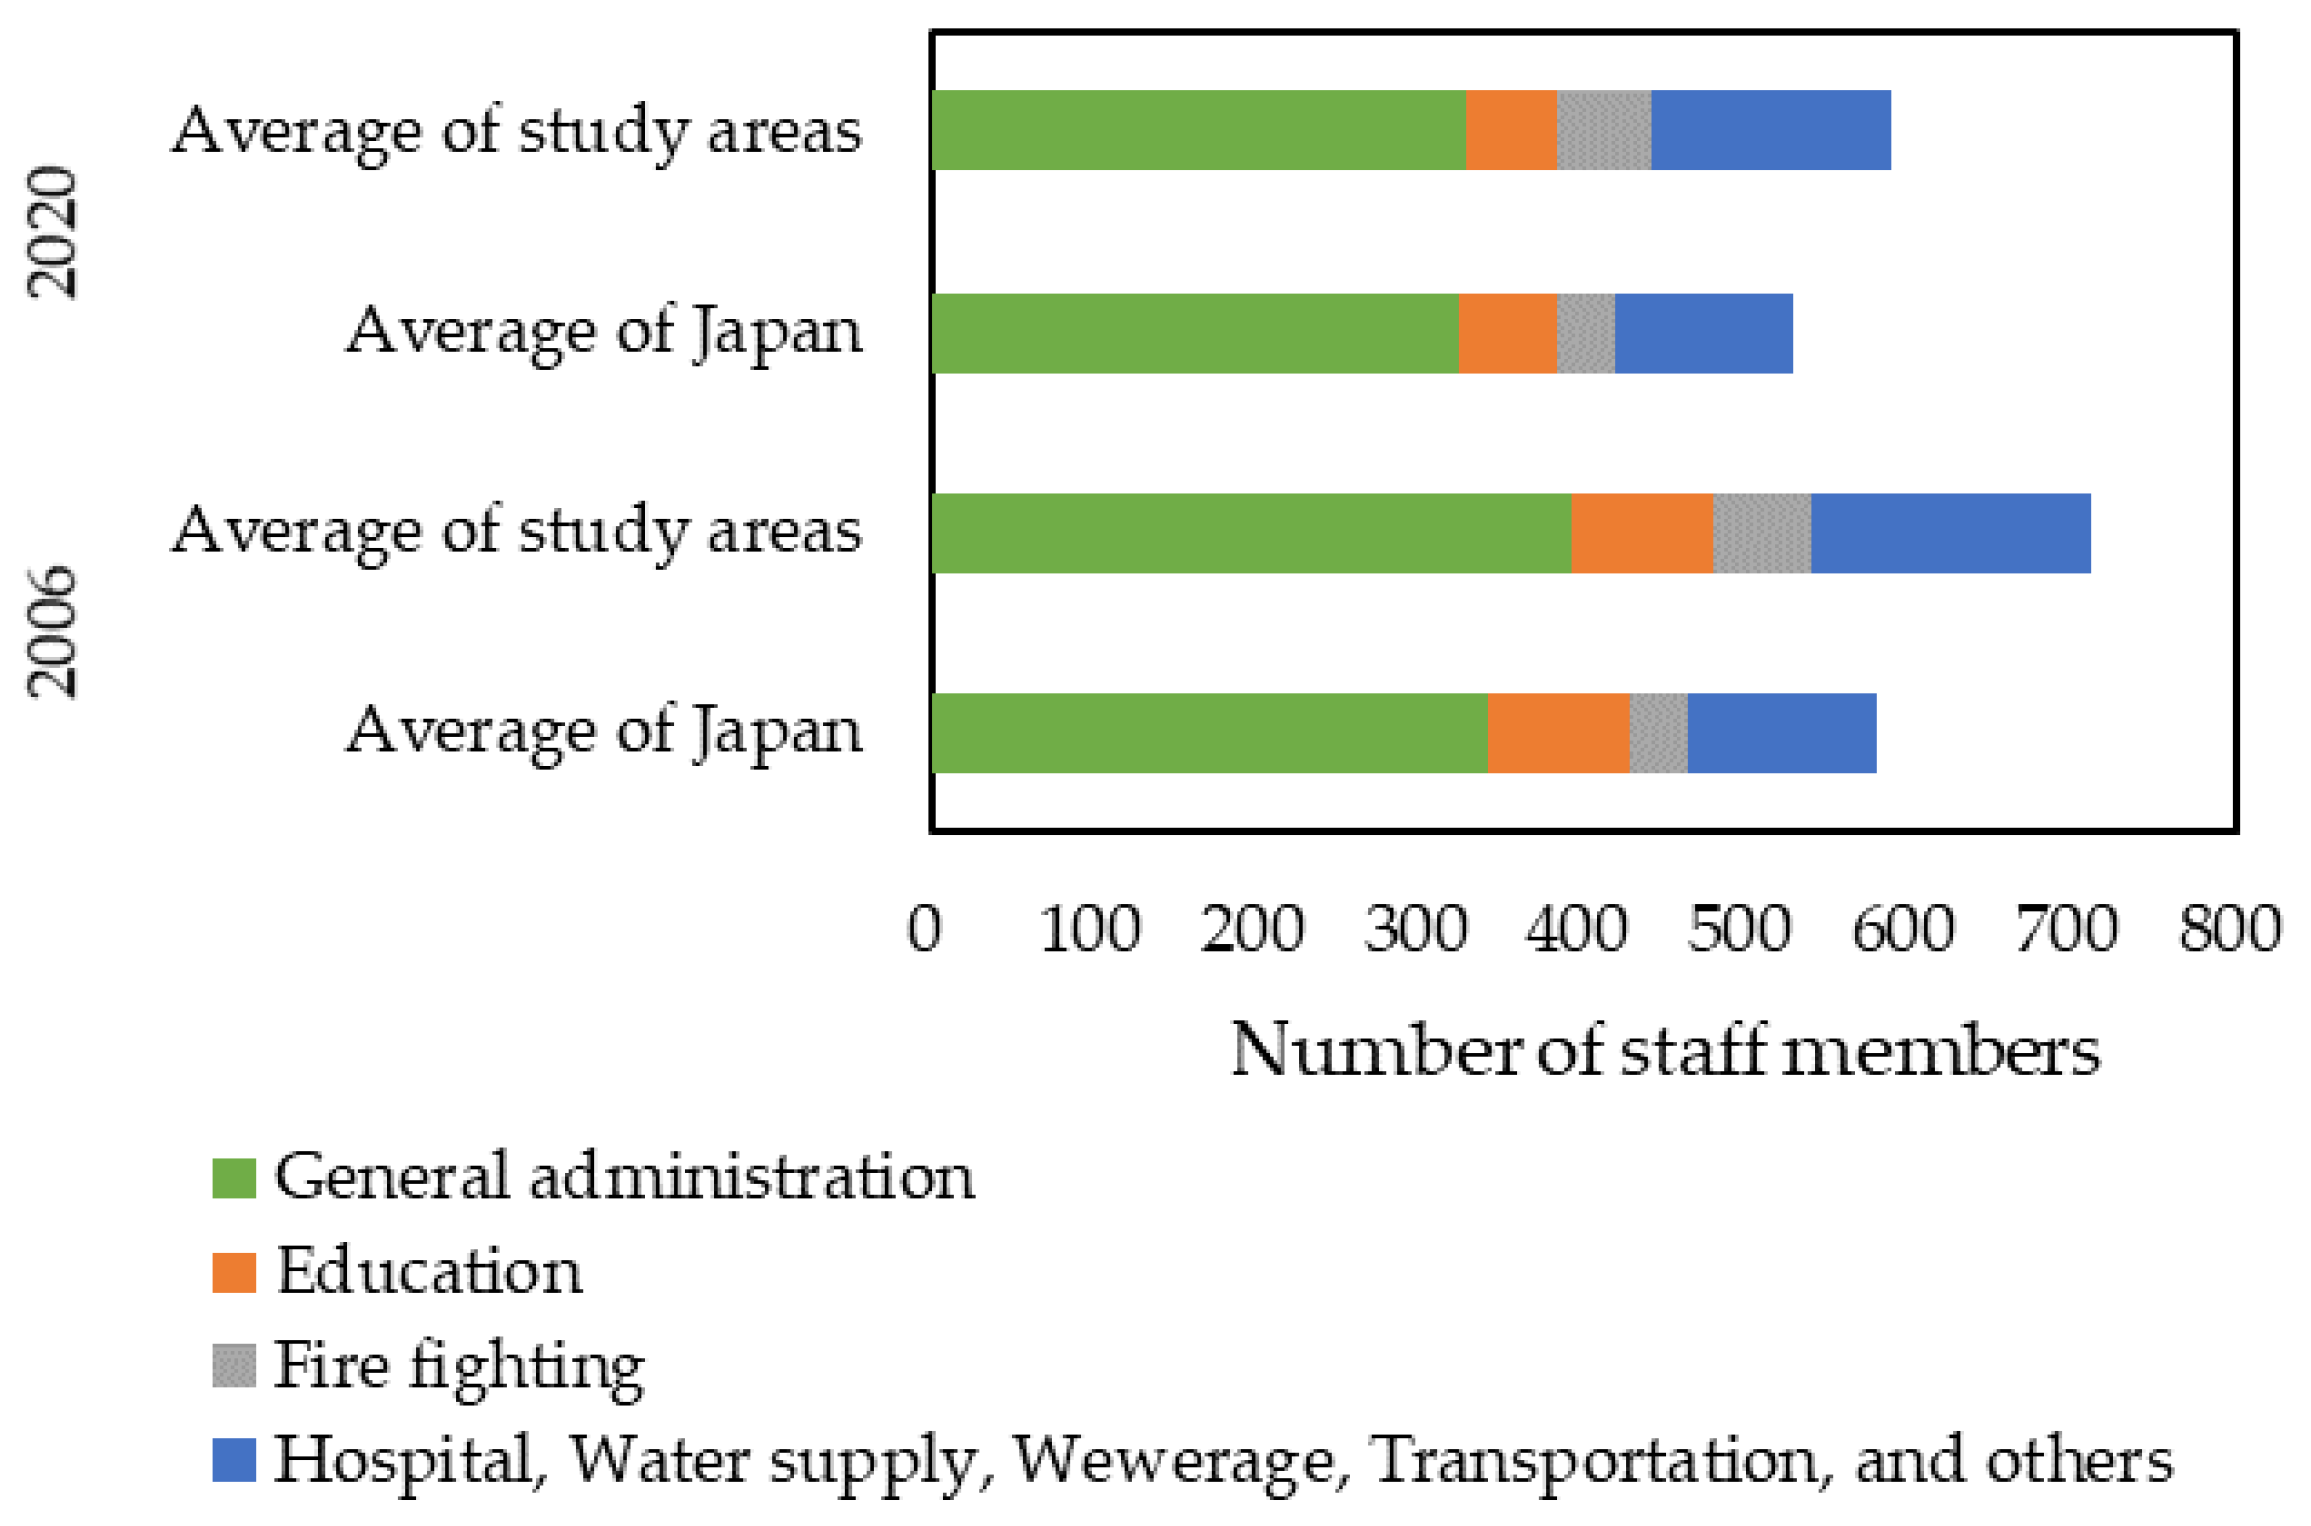
- Number of staff members in municipalities
The numbers of staff members were based on data (as of 15 July 2021; 2005–2020) published in the ‘Capacity Management of Local Public Organisations’ [34]. The data for 2006 and 2020 were used. We used the 2006 data to take into account the impact of the merger of many municipalities that took place in 2005 throughout the country. We excepted Hiroshima City from some analyses because it is a ‘designated city’ (only 20 such cities exist in Japan).
In the results, the trend in the average number of staff members was higher in the study areas than the average in Japan in each case, whether ‘designated cities’ or not. The gap between the study areas and Japan narrowed when ‘designated cities’ were not included, and the average number of staff members in the study areas between 2006 and 2020 decreased by >100 (Figure 7). However, the sediment-related hazard areas were designated inhabitable areas and a warning evacuation system would have been established by municipalities. Therefore, the amount of inhabitable area could have affected the workload of municipal staff. For this reason, we determined the number of staff members per inhabitable area (using 2020 data; however, the inhabitable area used here is for 2019 [35]); this value was 10.1 persons/km2 in Japan overall and 12.5 persons/km2 in the study areas. Furthermore, when ‘designated cities’ were excluded, this value was 7.7 persons/km2 in Japan (excluding the ‘designated cities’) and 6.6 persons/km2 in the study areas (excluding Hiroshima City).
These results indicate that the target municipalities had slightly more staff members than the nationwide average in Japan. However, the number of staff members was 1.1 persons/km2 lower in the study areas than in Japan overall, considering the greater proportion of ‘designated cities’ in the study areas and the numbers of staff members per inhabitable area including sediment-related-disaster hazard warning areas. Disasters with high human casualties occur in municipalities where the number of staff is small in relation to the size of the area.
- Financial status of municipalities
The standard fiscal scale was collected from the ‘Municipal Accounts Card’ [36] and the ‘List of Major Financial Indicators of Local Public Organisations’ [37], and the financial indicators of the study areas were compared with the financial indicators of Japan. With the exception of one municipality (Miyagawa Village; merged with Odai Town in 2006), which includes data from Takiya from FY2005, the earliest year for which data were available for all target municipalities, and FY2019, the most recent year, were used. Since Miyagawa Village was not listed in FY2005 or FY2019, we used the 2004 values for Miyagawa Village and the 2019 values for Odai Town.
The results are shown in Table 5. A comparative analysis between the study areas and Japan showed that the ‘fiscal capacity index’, which indicates the affordability of financial resources, remained almost identical. Although the differences were limited, the following indicator values were larger in the study areas than in the nation as a whole: ‘current account balance ratio’, which indicates the ratio of fixed expenditures; the ‘real bond cost ratio’, which indicates the degree of cash flow; and the ‘future burden ratio’, which indicates the possibility of future financial pressures. In addition, the ‘Laspeyres Index’, which indicates salary, was smaller. These results imply that disasters with large human casualties occur in municipalities that have financial difficulties.
5. Discussion
There is no obvious bias in the natural conditions (altitude, slope, geology, precipitation) of the areas where human-casualty disasters have occurred, but social conditions, as opposed to natural conditions, are likely to have an influence. Disasters with large human losses have occurred in areas where there have been land-use changes, such as the expansion of settlements, areas where people have lived for a relatively long period of time, areas where many people live in owner-occupied housing, and municipalities with a continuously high rate of population decline and difficulties in terms of staff number and finances. However, no effects of total population, sex ratio, and population aged 65 and over were identified.
These results imply the following relationships between socio-economic factors and large human losses in sediment-related disasters.
- The study showed that development activities in hazard areas can have an impact even after a considerable number of years of development. On the other hand, sediment-related disasters with significant human losses have also occurred in areas that have been afforested. The main reason for not evacuating is the lack of anticipation of landslides (see, for example, [38]). Forests may lead people to believe that the threat of landslides is low and that there is no need to evacuate.
- The total population, sex ratio, and population over 65 years of age in the units examined in this study were not relevant. This is inconsistent with previous reports, e.g., [39], which have concluded that older people are more likely to be victims. The combined effect of total population and sex ratio, such as the presence or absence of people to support the elderly, may have influenced the results.
- The fact that more landslides occur in areas where more people live in owner-occupied houses is consistent with reports [6] that people living in rented houses, who probably do not plan to live there for a long time, are less likely to make individual household emergency plans. It may be that people who do not plan to remain in their residence for a long time perceive the need to be prepared less strongly than those who intend to stay in their residence for an extended period of time. However, disasters with significant human suffering have occurred in areas where people have lived for relatively long periods of time. A report concluded that memory of floods depends on living witnesses, and that it diminishes within two generations [7]. Given the frequency of sediment-related disasters, which may occur only once every few hundred years, the relatively long residence period of more than 20 years may still have been too short for people to have experienced a disaster, which would explain the result that a long period of residence did not result in a reduction in human losses.
- The positive relationship between the number of disasters in a municipality and high rates of population decline and small staff and financial resources relative to the area is consistent with examples of existing disasters in which inadequate disaster management systems led to damage [40]. Differences in municipal disaster management systems may affect the number of human casualties.
These discussions indicate the importance of sediment-related-disaster countermeasures. The study areas were located in municipalities where the populations have long been declining and are expected to continue to decline in the future. The most serious casualties occurred both in areas with generally flat land, where the population density was the main cause, and in areas with mountainous terrain and small populations. In areas with generally flat land, although development regulations under the Sediment-related Disaster Prevention Act would have reduced the population density in hazard areas, considerable damage still occurred, implying the existence of pre-regulation development. In areas with mountainous terrain and small populations, it was difficult to implement building restrictions because such restrictions could have led to a further population decline. In addition, although many of the study areas had few people moving in or out, many did not acquire the knowledge and experience related to disasters that would have been gained by a person living in the area for a long time. Furthermore, for households residing in owner-occupied housing, it would have been effective to encourage them to relocate to a safer location, such as at the time of rebuilding in response to the ageing of residents; unlike households residing in housing complexes, these households did not have to go through the trouble of confirming the intentions of many residents. However, the study areas had more staff-related and financial difficulties than other parts of Japan, and therefore efforts and subsidies may not have been sufficiently implemented.
Therefore, although development regulations need to be continued, emphasis should be placed on hard and soft measures in areas that had already been developed before the regulations and are inhabited by a large number of people. On the other hand, in mountainous areas, where the population density and the number of human casualties in this study was small, disasters occur in large numbers and account for a very high proportion of the number of inhabitants. Because of the low number of residents in these areas, it is not realistic to spend a lot of money on hard measures, so it is suggested that detailed soft measures be implemented in each district. Non-structural measures include the accumulation and utilisation of empirical knowledge, as well as teaching and discussion opportunities to encourage relocation. However, support from the national and prefectural governments is necessary in municipalities that do not have sufficient staff or financial resources. To realise these measures, a classification method focusing on the social conditions of each district in addition to the threat of landslides should be considered and measures should be implemented accordingly.
6. Conclusions
In this study in Japan, natural and socio-economic conditions at the community level were determined at the sites of recent sediment-related disasters that resulted in significant human suffering. The results indicate that sediment-related disasters associated with extensive damage occurred under various natural conditions; the extensive human suffering caused by sediment-related disasters was not limited to specific natural conditions. In addition, although sediment-related disasters occur more frequently in populated areas, they also occur in less populated areas. In areas where it is difficult to justify large expenditures on sediment-related disaster countermeasures, non-structural measures that require lower costs than structural measures may be more important for reducing human suffering.
We attempted to understand the characteristics of each area using published data; however, the results should be confirmed by more detailed surveys in each area to determine whether the characteristics identified from the data are indicative of the characteristics that are influenced by a sediment-related disaster in each area. Furthermore, the limited number of cases in this study does not allow verification of its generalisability. The relationship between disaster cases and social factors should also be investigated under different conditions, such as different periods and countries with very different social conditions. Furthermore, alternative data items and complementary methods should be considered for items and areas for which no data have been obtained. Additionally, deepening our knowledge of the relationships between a wider range of socio-economic factors and the number of human casualties is also an important issue.
Author Contributions
Conceptualisation, M.C.; methodology, M.C., K.H. and S.S.; Investigation, M.C.; data curation, M.C.; writing—original draft preparation, M.C.; writing—review and editing, K.H., S.S. and H.F.; visualisation, M.C.; supervision, H.F. All authors have read and agreed to the published version of the manuscript.
Funding
This research received no external funding.
Institutional Review Board Statement
Not applicable.
Informed Consent Statement
Not applicable.
Data Availability Statement
The data presented in this study are available on request from the corresponding author.
Acknowledgments
I am grateful to the member who attend the seminar of Forest Research laboratory Department of Forest Science, Graduate School of Agriculture and Life Sciences, The University of Tokyo, for their insightful comments.
Conflicts of Interest
The authors declare no conflict of interest.
References
- Ministry of Land, Infrastructure, Transport and Tourism, Japan. Development of Warning and Evacuation System against Sediment Disasters in Developing Countries. Available online: https://www.mlit.go.jp/sogoseisaku/inter/keizai/gijyutu/pdf/sediment_e.pdf (accessed on 17 July 2022).
- Annual Report on Forest and Forestry in Japan (Fiscal Year 2020). Available online: https://www.rinya.maff.go.jp/j/kikaku/hakusyo/R2hakusyo/ (accessed on 22 April 2022). (In Japanese)
- Karasaki, T. Research on Communication in Community making Activities. Bull. Natl. Inst. Rural. Eng. Japan. 2012, 51, 195–257. (In Japanese) [Google Scholar] [CrossRef]
- Kamai, T. Disaster Mitigation Studies of Residential Lots-Urban and Slope Modern and Contemporary, 1st ed.; Kyoto University Press: Kyoto, Japan, 2020; 326p. (In Japanese) [Google Scholar]
- William, P.; Joseph, W. Human Vulnerability to Landslides. GeoHealth 2020, 4, e2020GH000287. [Google Scholar] [CrossRef]
- Jason, D.R. The likelihood of having a household emergency plan: Understanding factors in the US context. Nat. Hazards 2020, 104, 1331–1343. [Google Scholar] [CrossRef]
- Václav, F.; Miroslav, Š.; Petr, S. How long do floods throughout the millennium remain in the collective memory? Nat. Commun. 2019, 10, 1105. [Google Scholar] [CrossRef]
- Ministry of Land, Infrastructure, Transport and Tourism, Japan. Draft of Policy Review on Landslide Prevention Law (2012). Available online: https://www.mlit.go.jp/river/sabo/dosyahou_review/03/120130_shiryo3.pdf (accessed on 4 April 2022). (In Japanese)
- Aging Population and Increasing Number of “Marginalized Communities” Preventing “Mutual Aid”, Nails of the Torrential Rains in Western Japan—Kyoto Newspaper. Available online: https://www.kyoto-np.co.jp/politics/article/20190711000077 (accessed on 12 July 2019). (In Japanese).
- Ministry of Land, Infrastructure, Transport and Tourism, Japan. Sediment-related Disaster Warning Evacuation Guidelines Study Committee (First Meeting) Explanatory Material (Ref-1, January 15, 2007). Available online: https://www.mlit.go.jp/common/001024528.pdf (accessed on 3 November 2021). (In Japanese)
- Information on Erosion Control-Related Budgets, etc., National Flood Control and Erosion Control Association. Available online: http://www.sabo.or.jp/seimei-zaisan.htm (accessed on 15 June 2022). (In Japanese).
- Board of Audit of Japan. Report to the Diet and the Cabinet on the Project Cost for Sediment-Related Disaster Countermeasures and the Implementation Status of Projects for the Countermeasures (Pursuant to Article 30-2 of the Act on the Board of Audit, September 2015). Available online: https://report.jbaudit.go.jp/org/h26/ZUIJI2/2014-h26-Z2000-0.htm (accessed on 29 October 2021). (In Japanese)
- Mizuyama, T. Evacuation from sediment-related disasters. J. Jpn. Soc. Eros. Control. Eng. 2015, 68, 61. (In Japanese) [Google Scholar] [CrossRef]
- Ministry of Land, Infrastructure, Transport and Tourism, Japan. Past Disaster Response (2004–2021). Available online: https://www.mlit.go.jp/river/sabo/saigai_sokuhou.html (accessed on 22 April 2021). (In Japanese)
- Japan Meteorological Agency. List of Weather, Earthquake, and Volcanic Phenomena Named by the Japan Meteorological Agency. Available online: https://www.jma.go.jp/jma/kishou/know/meishou/meishou_ichiran.html (accessed on 3 November 2021). (In Japanese)
- Ministry of Agriculture, Forestry and Fisheries, Japan. 2015 Agricultural Community Boundary Data. Available online: https://www.maff.go.jp/j/tokei/census/shuraku_data/2015/ma/index.html (accessed on 3 November 2021). (In Japanese)
- Ministry of Agriculture, Forestry and Fisheries, Japan. The Concept of an Agricultural Community, Report on the Survey of Agricultural and Rural Areas, 2015 Census of Agriculture and Forestry. Available online: https://www.e-stat.go.jp/stat-search/files?page=1&layout=datalist&toukei=00500209&tstat=000001032920&cycle=7&year=20150&month=0&tclass1=000001077437&tclass2=000001077396&tclass3=000001085316 (accessed on 3 February 2021). (In Japanese)
- Ministry of Internal Affairs and Communications, Japan. Boundary Data by Town, Street, etc. from the 2015 National Census, General Contact for Government Statistics (e-Stat). Available online: https://www.e-stat.go.jp/gis/statmap-search?page=1&type=2&aggregateUnitForBoundary=A&toukeiCode=00200521&toukeiYear=2015&serveyId=A002005212015&datum=2000 (accessed on 3 November 2021). (In Japanese)
- Geospatial Information Authority of Japan. White Map of Japan. Available online: https://maps.gsi.go.jp/#6/38.004820/140.119629/&base=blank&ls=blank&disp=1&vs=c0g1j0h0k0l0u0t0z0r0s0m0f0&d=m (accessed on 17 June 2022).
- Ministry of Agriculture, Forestry and Fisheries, Japan. Average Elevation of Central Land and Average Slope of Central Land, National Land Numerical Information (Legal Area Designation, etc.), DB to See, Know, and Make Use of Local Agriculture. Available online: https://www.maff.go.jp/j/tokei/census/shuraku_data/2015/ka/index.html (accessed on 3 November 2021). (In Japanese)
- National Institute of Advanced Industrial Science and Technology. 1:200,000 Seamless Geological Map of Japan. Available online: https://maps.gsi.go.jp/ (accessed on 3 November 2021). (In Japanese)
- Japan Meteorological Agency. Details (Precipitation), Annual and Monthly Normal Value, Historical Weather Data Search. Available online: https://www.data.jma.go.jp/obd/stats/etrn/index.php?prec_no=21&block_no=0124&year=&month=&day=&view=a1 (accessed on 3 November 2021). (In Japanese)
- Nishiyama, K.; Tsuyoshi, W. Frequency of Slope Failure and Debris Flow Caused by Heavy Rainfall on Mountain Slopes in Japan. J. Jpn. Soc. Eng. Geol. 2015, 55, 325–333. (In Japanese) [Google Scholar] [CrossRef]
- Ministry of Land, Infrastructure, Transport and Tourism, Japan. Flood Control Measures (Chapter 3-3-1 Flood-prone Land). Available online: https://www.mlit.go.jp/river/pamphlet_jirei/bousai/saigai/kiroku/suigai/suigai_3-1-1.html (accessed on 3 November 2021). (In Japanese)
- Ministry of Agriculture, Forestry and Fisheries, Japan. Agricultural Region Typology, Regional Indicators, DB to See, Know, and Make Use of Local Agriculture. Available online: https://www.maff.go.jp/j/tokei/census/shuraku_data/2020/ia/index.html (accessed on 3 November 2021). (In Japanese)
- Ministry of Land, Infrastructure, Transport and Tourism, Japan. Land Use Tertiary Mesh Data, National Land Information—Agriculture and Rural Areas in Japan. Available online: https://nlftp.mlit.go.jp/ksj/gml/datalist/KsjTmplt-L03-a.html (accessed on 14 July 2021). (In Japanese)
- Ministry of Agriculture, Forestry and Fisheries, Japan. About Agricultural Area Types. Available online: https://www.maff.go.jp/j/tokei/chiiki_ruikei/setsumei.html (accessed on 6 May 2021). (In Japanese)
- Ministry of Agriculture, Forestry and Fisheries, Japan. Current Situation and Future Projections for Rural Areas and Villages, Section 1: Current Situation of Rural Areas and Movement of Rural Development, FY2019 Summary of the Annual Report on Food-Agriculture and Rural Areas in Japan. Available online: https://www.maff.go.jp/j/wpaper/w_maff/r1/r1_h/trend/part1/pdf/c3_1_00.pdf (accessed on 29 April 2022). (In Japanese)
- Ministry of Land, Infrastructure, Transport and Tourism, Japan. National Land Plan: Area of National Land by Use Category—Agriculture and Rural Areas in Japan. Available online: https://www.mlit.go.jp/kokudoseisaku/kokudoseisaku_fr3_000033.html (accessed on 3 November 2021). (In Japanese)
- Ministry of Agriculture, Forestry and Fisheries, Japan. Population by Sex and Age (Census of 2015, 2010, 2005), Census, DB to See, Know, and Use Local Agriculture. Available online: https://www.maff.go.jp/j/tokei/census/shuraku_data/2020/sb/index.html (accessed on 3 December 2021). (In Japanese)
- Ministry of Internal Affairs and Communications, Japan. Population Change Rate (FY1985-FY2015, Every 5 Years), Population, Households, Indicator Data, Prefectural and Municipal Statistics (Social and Demographic Statistics System), General Contact for Government Statistics (e-Stat). Available online: https://www.e-stat.go.jp/regional-statistics/ssdsview (accessed on 3 November 2021). (In Japanese)
- Ministry of Internal Affairs and Communications, Japan. Population by Period of Residence (6 Categories), Sex, Town, Street, Character, etc., Tabulation Related to Sex, Age, etc. Tabulation of Migratory Population, 2015 Census. Available online: https://www.e-stat.go.jp/stat-search/files?page=1&query=%E5%B9%B3%E6%88%9027%E5%B9%B4%E5%9B%BD%E5%8B%A2%E8%AA%BF%E6%9F%BB%E3%80%80%E5%B0%8F%E5%9C%B0%E5%9F%9F%E9%9B%86%E8%A8%88%E3%80%80%E5%B1%85%E4%BD%8F%E6%9C%9F%E9%96%93&layout=dataset&metadata=1&data=1 (accessed on 3 November 2021). (In Japanese)
- Ministry of Internal Affairs and Communications, Japan. Number of General Households and Number of Persons in General Households and Persons per Household by Type of Dwelling and Relationship of Ownership of Dwelling (6 Categories), Town, Street, etc., Tabulations Related to Population and Other Basic Tabulations, Census 2015. Available online: https://www.e-stat.go.jp/stat-search/files?page=1&query=%E5%B9%B3%E6%88%9027%E5%B9%B4%E5%9B%BD%E5%8B%A2%E8%AA%BF%E6%9F%BB%E3%80%80%E5%B0%8F%E5%9C%B0%E5%9F%9F%E3%80%80%E4%BD%8F%E5%B1%85%E3%81%AE%E7%A8%AE%E9%A1%9E&layout=dataset&metadata=1&data=1 (accessed on 3 November 2021). (In Japanese)
- Ministry of Internal Affairs and Communications, Japan. List of Staff by Department, Designated City Data and Municipalities (Excluding Designated Cities) Data, Local Government Capacity Management Related. Available online: https://www.soumu.go.jp/main_sosiki/jichi_gyousei/c-gyousei/teiin/ (accessed on 3 November 2021). (In Japanese)
- Ministry of Internal Affairs and Communications, Japan. Area of Inhabitable Land, Natural Environment, Basic Data, Statistics on Municipalities, 2021 Social and Demographic Statistics System, e-Stat (e-Stat). Available online: https://www.e-stat.go.jp/stat-search/files?page=1&query=%E5%8F%AF%E4%BD%8F%E5%9C%B0%E9%9D%A2%E7%A9%8D&layout=dataset&stat_infid=000032093332 (accessed on 11 November 2021). (In Japanese)
- Ministry of Internal Affairs and Communications, Japan. Municipal Balance Sheet, Materials Related to Local Financial Condition Surveys. Available online: https://www.soumu.go.jp/iken/zaisei/card.html (accessed on 3 December 2021). (In Japanese)
- Ministry of Internal Affairs and Communications, Japan. List of Major Financial Indicators for Local Governments. Available online: https://www.soumu.go.jp/iken/shihyo_ichiran.html (accessed on 4 December 2021). (In Japanese)
- Chiba, M.; Kono, Y.; Fujimoto, O. Effects of non-structural measures on regional warning and evacuation during sediment-related disasters. J. Jpn. Soc. Eros. Control Eng. 2022, 74, 14–25. [Google Scholar]
- Ushiyama, M.; Honma, M.; Yokomaku, S.; Sugimura, K. Characteristics of human suffering due to the heavy rainfall disaster of 30 July 2008. J. Jpn. Soc. Nat. Disaster Sci. 2019, 38, 29–54. [Google Scholar] [CrossRef]
- Chiba, M. Warning and evacuation in response to sediment-related disasters. Nat. Hazards 2011, 56, 499–507. [Google Scholar] [CrossRef]
Figure 1.
Location of study areas. (Partially edited from [19]).
Figure 1.
Location of study areas. (Partially edited from [19]).

Figure 2.
Proportions of the numbers of study areas and nationwide areas stratified according to agricultural area type. (Date sources: [25,28]).

Figure 3.
Proportion of casualties among the study areas and proportion of nationwide population, stratified according to agricultural area type. (Date sources: [14,25,28]).

Figure 4.
Changes in Land Use Classification in Japan; the baseline value of 1963 was set as 1 (Date source: [29]).
Figure 4.
Changes in Land Use Classification in Japan; the baseline value of 1963 was set as 1 (Date source: [29]).

Figure 5.
Population growth rate in the municipalities including the study areas. (Date sources: [31]).
Figure 5.
Population growth rate in the municipalities including the study areas. (Date sources: [31]).

Figure 6.
Length of residence. (Date sources: [32]).
Figure 6.
Length of residence. (Date sources: [32]).

Figure 7.
Average number of staff members per municipality (excluding designated cities) (Date sources: [34]).
Figure 7.
Average number of staff members per municipality (excluding designated cities) (Date sources: [34]).


Table 1.
Study areas where losses occurred between 2004 and 2011.
| Years | Natural Phenomena | Prefecture | Agricultural Community (Study Area) |
|---|---|---|---|
| 2004 | TY Meari (0421) | Mie | Takiya |
| TY Tokage (0423) | Okayama | Uno | |
| 2006 | Heavy rain of July 2006 | Nagano | Hanaoka |
| 2008 | The Iwate-Miyagi Nairiku Earthquake in 2008 | Miyagi | Koei |
| 2009 | Heavy rain in Chugoku-Kyushu of July 2009 | Yamaguchi | Nango |
| 2011 | The 2011 off the Pacific coast of Tohoku Earthquake | Fukushima | Iizawa |
| STS Talas (1112) | Wakayama | Ichinono | |
| Iseki-1 | |||
| Nagano-6 | |||
| Nara | Ui | ||
| Nojiri | |||
| 2012 | Heavy rain in Kyushu of July 2012 | Kumamoto | Fukuoka |
| 2013 | Heavy rain of August 2013 | Akita | Sendatsu |
| TY WIPHA (1326) | Tokyo | Motomachi | |
| 2014 | Heavy rain of August 2014 | Hiroshima | Yashiki |
| Kobara | |||
| Kamirakuchi | |||
| Muroya | |||
| 2016 | The 2016 Kumamoto Earthquake | Kumamoto | Kurokawa |
| 2017 | Heavy rain in Kyushu of July 2017 | Fukuoka | Ishizume |
| Tachi | |||
| 2018 | – | Ooita | Kajigaharu-yukihiro |
| Heavy rain of July, 2018 | Hiroshima | Kawasumi | |
| Tenjin | |||
| Oonishi | |||
| Koyaura | |||
| Hokkaido Eastern Iburi Earthquake, 2018 | Hokkaido | Yoshino | |
| 2021 | Heavy rain of July 2021 | Shizuoka | Kidani |
Table 2.
Topography, geology, and rainfall conditions of the study areas.
| Study Area | Elevation (m) | Slope (°) | Geology | Annual Precipitation (mm) |
|---|---|---|---|---|
| Yoshino | 33.4 | 3.6 | Sedimentary rock | 1028.4 |
| Koei | 578.5 | 7.4 | Igneous rock | 2124.9 |
| Sendatsu | 266.8 | 2.5 | 2354.1 | |
| Iizawa | 366.1 | 4.5 | 1456.7 | |
| Motomachi | 54.9 | 4.0 | 2858.9 | |
| Hanaoka | 798.7 | 12.5 | 1301.5 | |
| Kidani | 193.8 | 13.6 | 2012.7 | |
| Takiya | 183.8 | 10.5 | Accretionary wedge | 3369.0 |
| Ui | 418.4 | 5.8 | Sedimentary rock, Accretionary wedge | 2538.2 |
| Nojiri | 329.0 | 27.1 | Accretionary wedge | 2538.2 |
| Nagano-6 | 219.6 | 7.8 | Aedimentary rock, Accretionary wedge | 2581.3 |
| Ichinono | 72.6 | 8.8 | Sedimentary rock | 3784.7 |
| Iseki-1 | 30.8 | 5.2 | 3332.9 | |
| Uno | 11.1 | 4.4 | Igneous rock | 1038.5 |
| Muroya | 48.3 | 10.6 | 1678.3 | |
| Kamirakuchi | 17.2 | 2.2 | 1678.3 | |
| Kobara | 32.4 | 8.2 | 1678.3 | |
| Yashiki | 14.0 | 3.1 | 1572.2 | |
| Tenjin | 80.7 | 8.7 | 1572.2 | |
| Oonishi | 27.9 | 6.6 | 1417.2 | |
| Kawasumi | 227.4 | 1.4 | 1417.2 | |
| Koyaura | 19.3 | 3.6 | 1417.2 | |
| Nango | 44.9 | 3.5 | 1653.7 | |
| Tachi | 103.6 | 8.0 | 1876.3 | |
| Ishidume | 195.2 | 8.6 | 1876.3 | |
| Fukuoka | 605.8 | 13.5 | 3009.6 | |
| Kurokawa | 449.3 | 3.8 | 3009.6 | |
| Kajigaharu-yukihiro | 217.0 | 11.3 | 1944.9 | |
| Average | 201.4 | 7.5 | ― | 2075.8 |
Table 3.
Changes in land use (average of the study areas).
| Land Use | Change of Study Area (m2) |
|---|---|
| Building sites | 44,555.6 |
| Forests | 19,666.5 |
| Saltwater areas | 16,740.4 |
| Other sites (including golf courses) | 2299.1 |
| Land for transportation | 1457.8 |
| River and lakes | 1082.0 |
| Beaches | −300.8 |
| Other agricultural land | −7669.5 |
| Wastelands | −27,168.8 |
| Rice paddies | −30,706.3 |
Note: Date source: [26].
Table 4.
Comparison of 2005 and 2015 populations in the study areas.
| 2005 | 2015 | |||||
|---|---|---|---|---|---|---|
| Population | Ratio of Female to Male | Ratio of Aged 65 and Over | Population | Ratio of Female to Male | Ratio of Aged 65 and Over | |
| Yoshino | 54 | 1.35 | 0.37 | 32 | 0.78 | 0.47 |
| Koei | 126 | 0.77 | 0.47 | 64 | 0.64 | 0.45 |
| Sendatsu | 145 | 1.13 | 0.35 | 117 | 1.17 | 0.48 |
| Iizawa | 1098 | 1.03 | 0.18 | 979 | 1.05 | 0.31 |
| Motomachi | 2789 | 1.04 | 0.26 | 2461 | 0.97 | 0.32 |
| Hanaoka | 1551 | 1.09 | 0.28 | 1304 | 1.05 | 0.36 |
| Kidani | 1024 | 1.15 | 0.27 | 898 | 1.12 | 0.40 |
| Takiya | 64 | 1.29 | 0.42 | 30 | 1.14 | 0.47 |
| Ui | 108 | 1.16 | 0.30 | 26 | 1.00 | 0.58 |
| Nojiri | 40 | 0.90 | 0.20 | 18 | 1.25 | 0.44 |
| Nagano-6 | 177 | 1.16 | 0.34 | 115 | 1.21 | 0.45 |
| Ichinono | 775 | 1.25 | 0.28 | 632 | 1.32 | 0.40 |
| Iseki-1 | 664 | 1.14 | 0.31 | 467 | 1.22 | 0.41 |
| Uno | 5472 | 1.12 | 0.29 | 4771 | 1.04 | 0.38 |
| Muroya | 1093 | 0.81 | 0.17 | 1231 | 0.88 | 0.19 |
| Kamirakuchi | 1540 | 1.06 | 0.17 | 1168 | 1.02 | 0.25 |
| Kobara | 1137 | 1.08 | 0.17 | 832 | 1.04 | 0.25 |
| Yashiki | 2355 | 1.08 | 0.16 | 2330 | 1.13 | 0.20 |
| Tenjin | 1598 | 1.07 | 0.20 | 1396 | 1.09 | 0.38 |
| Oonishi | 535 | 1.25 | 0.24 | 486 | 1.20 | 0.38 |
| Kawasumi | 4556 | 1.12 | 0.15 | 4465 | 1.09 | 0.24 |
| Koyaura | 2333 | 1.12 | 0.26 | 1871 | 1.09 | 0.39 |
| Nango | 173 | 1.54 | 0.61 | 83 | 1.02 | 0.42 |
| Tachi | 102 | 1.17 | 0.19 | 80 | 1.29 | 0.26 |
| Ishidume | 77 | 1.41 | 0.29 | 57 | 1.85 | 0.33 |
| Fukuoka | 40 | 1.11 | 0.28 | 35 | 1.19 | 0.37 |
| Kurokawa | 1222 | 0.89 | 0.23 | 1149 | 0.89 | 0.28 |
| Kajigaharu-Yukihiro | 78 | 1.05 | 0.33 | 59 | 1.03 | 0.42 |
| Average | 1104.5 | 1.12 | 0.28 | 969.9 | 1.10 | 0.37 |
Note: Date sources: [30].
Table 5.
Fiscal indicators according to municipality.
| Fiscal Capacity Index | Current Account Balance Ratio | Real Bond Cost Ratio | Future Burden Ratio | Laspeyres Index | ||
|---|---|---|---|---|---|---|
| FY2005 | Average of Japan | 0.52 | 90.2 | 14.8 | 11.4 * | 98.0 |
| Average of Study areas | 0.52 | 93.0 | 15.2 | 12.5 * | 95.2 | |
| FY2019 | Average of Japan | 0.51 | 93.6 | 5.8 | 27.4 | 99.1 |
| Average of Study areas | 0.50 | 94.1 | 8.4 | 62.7 | 97.4 | |
Publisher’s Note: MDPI stays neutral with regard to jurisdictional claims in published maps and institutional affiliations. |
© 2022 by the authors. Licensee MDPI, Basel, Switzerland. This article is an open access article distributed under the terms and conditions of the Creative Commons Attribution (CC BY) license (https://creativecommons.org/licenses/by/4.0/).
Share and Cite
MDPI and ACS Style
Chiba, M.; Furuido, H.; Shibasaki, S.; Haga, K. Analysis of Socio-Economic Factors That Influence Loss of Life in Sediment-Related Disasters. Water 2022, 14, 2408. https://doi.org/10.3390/w14152408
AMA Style
Chiba M, Furuido H, Shibasaki S, Haga K. Analysis of Socio-Economic Factors That Influence Loss of Life in Sediment-Related Disasters. Water. 2022; 14(15):2408. https://doi.org/10.3390/w14152408
Chicago/Turabian StyleChiba, Miki, Hiromichi Furuido, Shigemitsu Shibasaki, and Kazuki Haga. 2022. "Analysis of Socio-Economic Factors That Influence Loss of Life in Sediment-Related Disasters" Water 14, no. 15: 2408. https://doi.org/10.3390/w14152408
Note that from the first issue of 2016, this journal uses article numbers instead of page numbers. See further details here.