
Mechanism of Biofilm Formation on Installation Materials and Its Impact on the Quality of Tap Water
by
 , , , , and
Dorota Papciak
1 ,
,
Andżelika Domoń
1,*,
Monika Zdeb
1,
Barbara Tchórzewska-Cieślak
2,
Janusz Konkol
3 and
Eleonora Sočo
4 1
Department of Water Purification and Protection, Faculty of Civil, Environmental Engineering and Architecture, Rzeszow University of Technology, 35-959 Rzeszow, Poland
2
Department of Water Supply and Sewerage Systems, Faculty of Civil, Environmental Engineering and Architecture, Rzeszow University of Technology, 35-959 Rzeszow, Poland
3
Department of Materials Engineering and Technology of Building, Rzeszow University of Technology, 35-959 Rzeszow, Poland
4
Department of Inorganic and Analytical Chemistry, Faculty of Chemistry, Rzeszow University of Technology, 35-959 Rzeszow, Poland
*
Author to whom correspondence should be addressed.
Water 2022, 14(15), 2401; https://doi.org/10.3390/w14152401
Submission received: 8 July 2022
/
Revised: 29 July 2022
/
Accepted: 30 July 2022
/
Published: 2 August 2022
(This article belongs to the Special Issue Drinking Water Pipe Network and Water Quality Safety)
Abstract
:In the conducted study, an attempt was made to verify and evaluate the impact of the biofilm formed on the surfaces of the installation material on the quality and sanitary safety of tap water reaching the consumer. For biofilm studies, fractal analysis and quantitative bacteriological analysis were used. The quality of tap water flowing through the experimental installation (semi-technical scale) was determined using physicochemical and microbiological parameters. The quantitative analysis of the biofilm showed that an increase in the number of microorganisms was observed in the initial phase of biofilm formation (reached 1.4 × 10⁴ CFU/mL/cm2 on day 14). During this period, there was a chaotic build-up of bacterial cells, as evidenced by an increase in the roughness of the profile lines. Unstable elevations of the biofilm formed in this way could be easily detached from the structure of the material, which resulted in deterioration of the bacteriological quality of the water leaving the installation. The obtained results indicate that the biofilm completely and permanently covered the surface of the tested material after 25 days of testing (the surface roughness described by the fractal dimension decreased). Moreover, the favorable temperature (22.6 °C) and the recorded decrease in the content of inorganic nitrogen (by 15%), phosphorus (by 14%), and dissolved oxygen (by 15%) confirm the activity of microorganisms. The favorable environmental conditions in the installation (the presence of nutrients, low chlorine concentration, and high temperature) contributed to the secondary development of microorganisms, including pathogenic organisms in the tested waters.
1. Introduction
The drinking water distribution system (DWDS) is one of the most important infrastructures that collect, treat, store, and distribute water from its source to the point of use [1]. However, before the water reaches the tap, it must often flow through kilometers of water pipes, which may change its parameters [2,3,4]. An inherent element of the DWDS are microorganisms that can occur directly in the water column and the form of biofilm located on the inner surfaces of pipes [5,6]. The results of the research by Liu et al. suggest that most of the bacteria in the distribution system come from treatment plants, while bacterial cells detached from biofilm constitute only a few percent [7]. On the other hand, the research by Maurice et al. suggests that as much as 58% of the bacteria in the distributed water came from the biofilm. The water treatment technology had a great impact on the results obtained [8]. The presence of biofilm is not only a reservoir of pathogens but also affects the aesthetics of the water and promotes the corrosion of pipes [9].
The number and type of microorganisms determined in tap water flowing through the DWDS may vary depending on: (1) the type of treated water, (2) the method of its treatment, (3) the construction and operation of the distribution system (e.g., pressure and velocity of water flow in the network, type of installation material, disinfectant residues), and (4) seasons [10,11,12,13,14,15]. The size of the DWDS also dictates the time it takes for the water to flow through the system. Therefore, extensive and highly looped systems will be characterized by water, the parameters of which, due to the lower chlorine content, may support the growth of microorganisms and the formation of biofilm [16]. The long residence time of the water in the distribution system also favors the degradation of residual chlorine and the formation of disinfection by-products, such as trihalomethanes (THM) [12]. It should be emphasized that domestic drinking water systems, which include the plumbing between the water meter and the tap, are the most vulnerable place where water quality can deteriorate. Plumbing in buildings faces additional challenges, including: (1) increased water stagnation, (2) increased water temperature, and (3) small pipe diameters [17,18]. The long residence time of water in the system, combined with the temperature above 15 °C (caused by the installation in heated rooms or near heat sources), favors the intensification of microbial multiplication [19,20,21,22,23,24]. Microbial secondary development is also enhanced by interaction with hydraulic materials such as plastic tubing and rubber fittings, which have significant potential to promote microbial growth [25]. Smaller pipe diameters result in increased contact between microorganisms and the pipes, leading to the increased interaction of the pipe material, including biofilm formation and lower residual disinfectant concentrations [19].
The formation of biofilm is a multi-stage process consisting of the natural ability of microorganisms to adhesion, multiply, and settle in a gelatinous matrix consisting of extracellular polymeric substances (EPS) [9]. During biofilm formation, four basic stages can be mentioned: (1) reversible adhesion—the initial movement of bacterial cells towards the inhabited surface. Reversible adhesion does not ensure the stability of the biofilm and can therefore be easily removed at this stage by physical and chemical means; (2) irreversible adhesion—starts when the cells are less than 1.5 nm from the surface of the material. Extracellular polymers (EPS) play a key role in this process, thanks to which it is possible to adhere bacterial cells to the surface of materials. Irreversible adhesion enables the formation of microcolonies; (III) biofilm maturation—in this phase, the multiplication of microorganisms and their gradual differentiation takes place. In bacterial cells, the expression of certain genes is activated or inhibited, which results in giving them the appropriate phenotypic features; (IV) dispersion of microorganisms from biofilm—biofilm after reaching the so-called critical thickness gradually ceases to maintain the existing form, the consequence of which is detachment of bacterial cells and colonization of new surfaces [9,26].
Due to its nutritional and protective properties, biofilm enables the development of various microorganisms such as: bacteria (e.g., Escherichia coli, Campylobacter spp., Legionella spp., Pseudomonas spp., Listeria sp., Salmonella spp.), intestinal viruses (e.g., rotaviruses, adenoviruses, noroviruses), fungi (e.g., Aspergillus, Penicillium, Cladosporium), and parasitic protozoa (e.g., Cryptosporidium parvum). Consumption of chemically or biologically contaminated water can cause many hygiene problems in humans, especially in the most sensitive (newborns, children, the elderly, or people with immunosuppression) [14,22]. Examples of infections caused by microorganisms present in tap water include urinary tract infection, inflammation of the upper respiratory tract, typhoid, and diarrhea) [9].
Despite the enormous improvement in the quality and safety of tap water, it continues to be contaminated with pathogens, and water-borne diseases are still reported. The water industry is constantly looking for new ways to make the water safe, but let us be aware that the water we drink will never be sterile. The entire water distribution system—every reservoir, every well, every pipe, and every faucet—is home to hundreds or thousands of species of bacteria, algae, invertebrates, and viruses, most of which are completely harmless to humans [27].
Every year there is a growing awareness that the microorganisms present in the biofilm play a large role in shaping the quality of tap water. Therefore, knowledge and understanding of the dynamics of the microbial community present in DWDS biofilms is essential for the safe delivery of quality water to consumers [4].
In the conducted study, an attempt was made to verify and evaluate the influence of the biofilm formed on the installation materials on the quality and sanitary safety of tap water reaching the consumer.
2. Materials and Methods
2.1. Experimental Installation
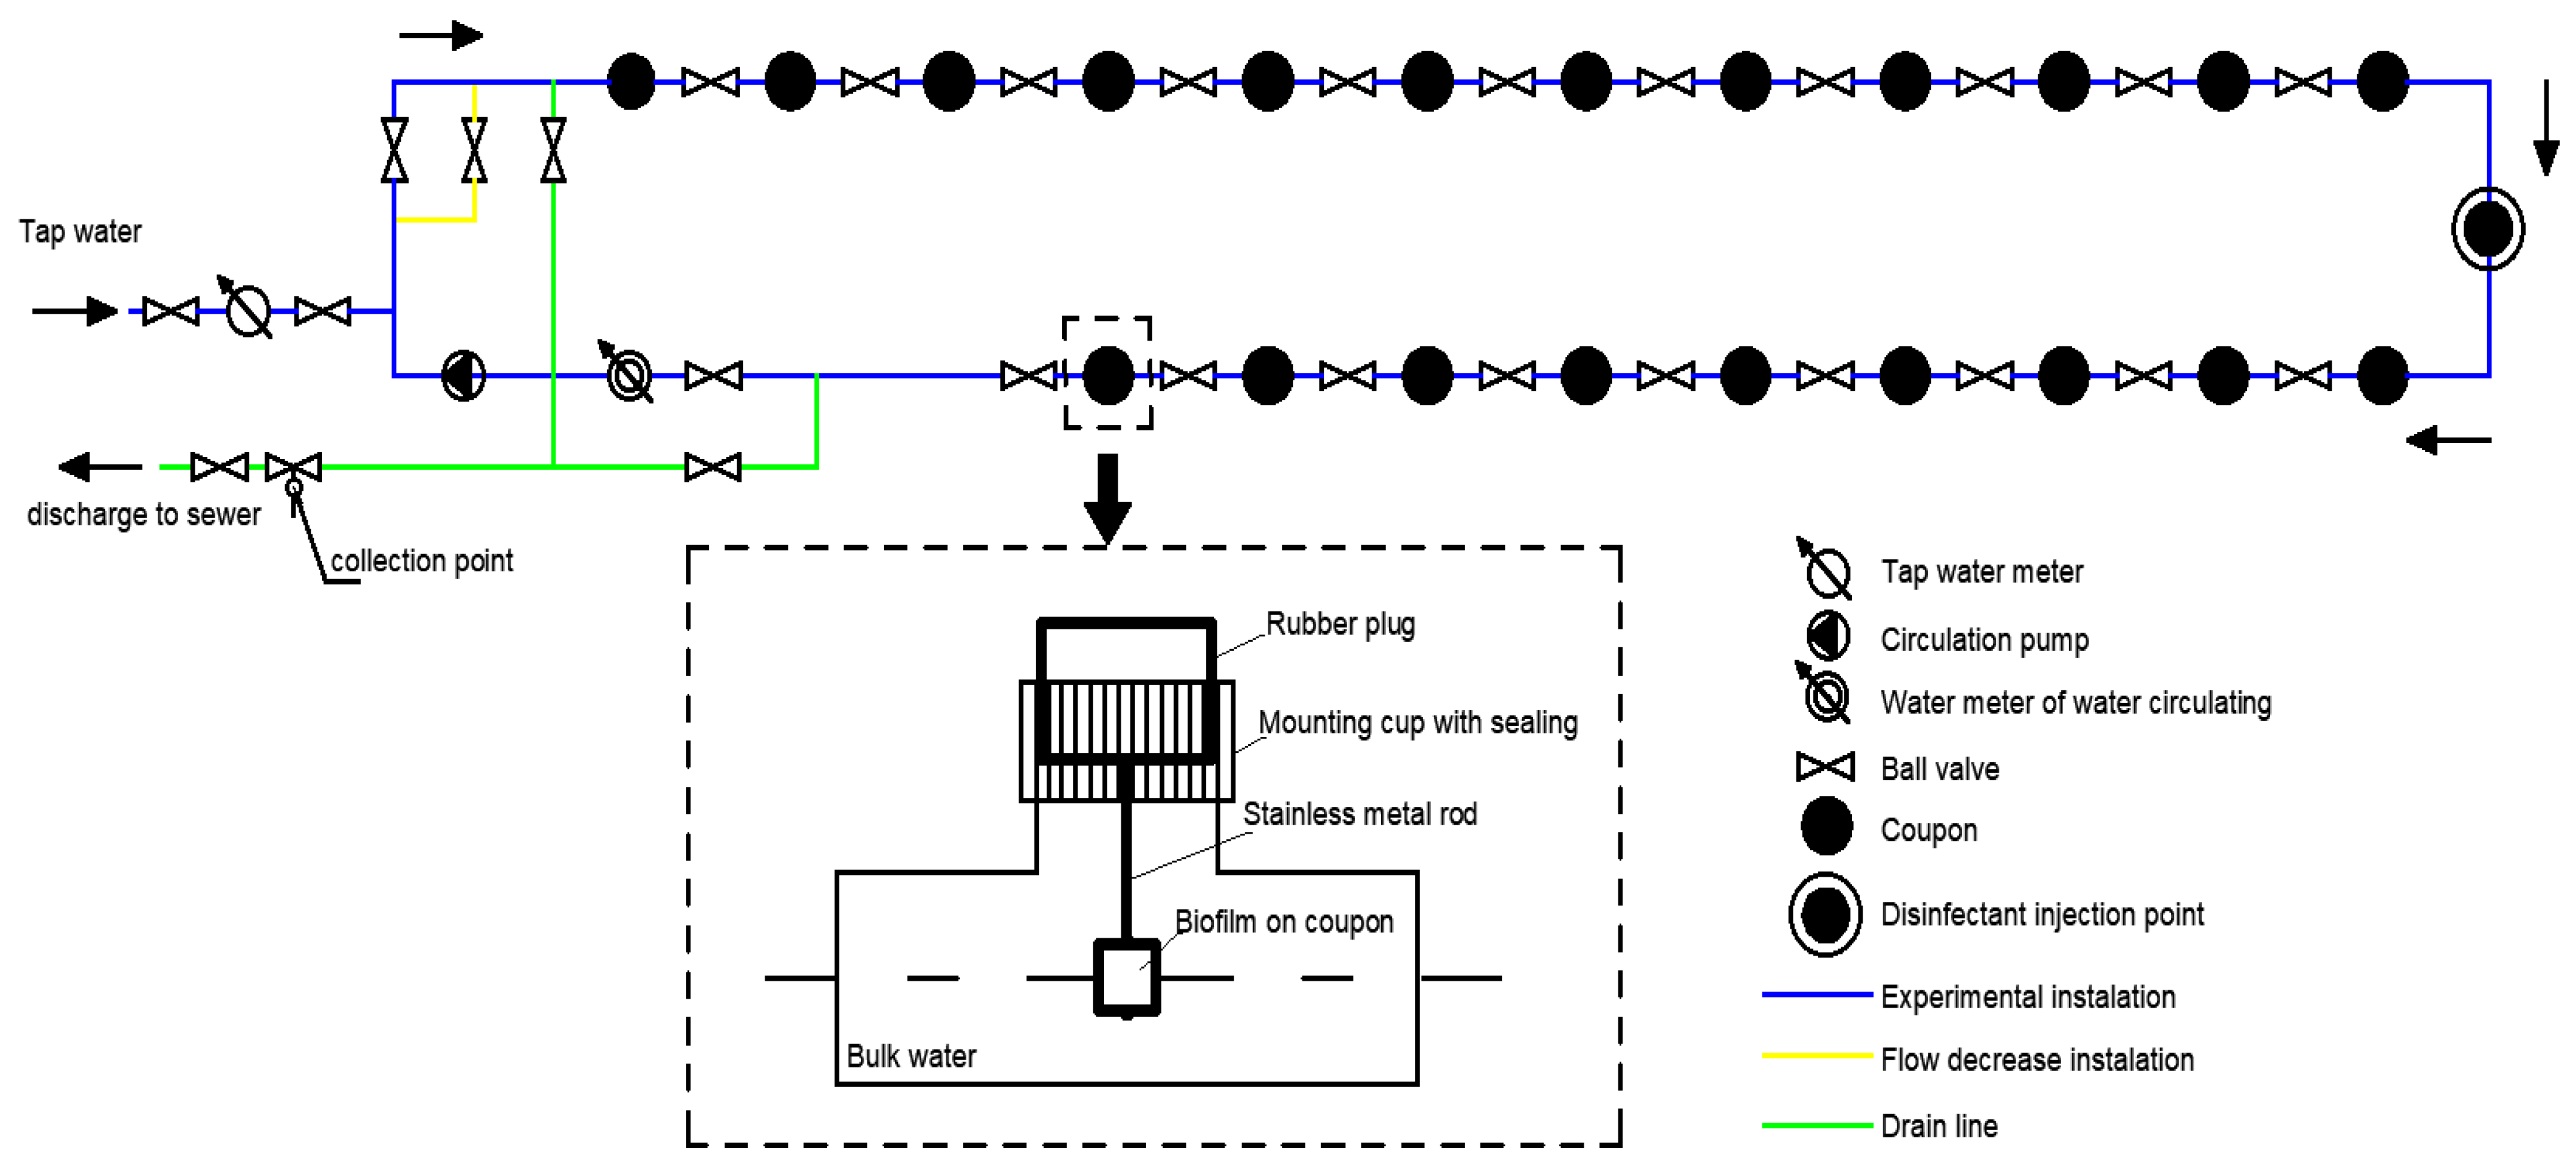
The studies of biofilm formation and changes in the quality of tap water were carried out under specific laboratory conditions. To determine the number of microorganisms forming a biofilm on the inner surface of the water pipes, an experimental installation was built (Figure 1). The experimental system was supplied, with surface water treated at a water treatment plant located 5 km from the research site (49°99′ N, 21°96′ E). The technological scheme of water purification consisted of the following processes: initial ozonation, coagulation, sedimentation, fast filtration, intermediate ozonation, sorption on activated carbon, and disinfection. Fresh tap water was introduced into the installation once a day, and then the water circulated in a closed circuit in the installation for 24 h (water circulation was ensured by the installed pump). The water flow velocity in the experimental system was 0.3 m/h. The installation is made of DN32 PVC pipes.
Prepared PVC plates (1 cm × 1 cm) were used to test the adhesion of bacterial cells, which were placed inside the experimental installation. The tested material was attached with a stainless metal rod to the PVC plugs together with a rubber gasket. Plates were mounted on modified tees separated by ball valves (Figure 1). There were 21 plates in the installation, which were pulled out successively during the tests (in the 1st, 4, 6, 7, 8, 11, 12, 13, 14, 15, 20, 27, 34, 41, 55 days). Before starting the tests, the installation and the plates were disinfected with 15% sodium hypochlorite.
The work includes: (1) quantitative analysis of biofilm, (2) measurement of structural changes in the surface of water pipes, and (3) assessment of the quality of water flowing in and out of the installation. The water was collected using a tap with a valve installed on the conduit supplying and discharging water from the experimental system to the sewage system (Figure 1).
2.2. Detachment the Biofilm from the Surface of the Material
The biofilm was detached from the surface of the plate using a sterile cotton swab. Next, the swab with detached materials was transferred to 50 mL sterile glass beakers containing 30 mL of sodium chloride buffered solution. Filled beakers were placed in an ice bath to prevent excessive temperature rise during sonication (which has a direct impact on the activity of bacteria) and exposed to ultrasounds for 60 s using a Vibra-CellTH ultrasonic processor (28 W) (Sonics, Labo-Plus, Poland).
2.3. Quantitative Analysis of Biofilm Microorganisms on the Surface of the Plates
The quantitative determination of microorganisms in the biofilm was carried out using: (1) The heterotrophic plate count (HPC) method at 22 °C and 37 °C using R2A Agar (CM0906) manufactured by Oxoid Thermo Scientific (UK) (incubation 7 days), by PN-EN ISO 6222. (2) ATP analysis was performed with the LuminUltra Photonmaster Luminometer (BacTiter-Glo Microbial Cell Enviability Assay, Promega), according to Promega Corporation protocols.
2.4. Fractal Analysis of Biofilm Formation on the Surface of the Plates
The surface roughness analysis of the samples was carried out using a Talysur CLI 1000 laser profilometer (Taylor Hobson) with the TalyMap analytical software and the FRAKTAL_W dim2D software. The fractal dimension was adopted as the parameter describing the roughness of the surface and the profile line separated from this surface. Fractal analysis was performed using the box method. It is a universal method that can be used both for the analysis of the profile line and the entire surface of the material. It consists in covering the 2D/3D structure with boxes with the size of the side of the box changing at each step. The concept of fractal dimension was defined according to the formula:
where: N—the number of parts making up the initial fractal figure,
D = log (N)/log(1/s)
s—the degree of reduction of the elements forming the fractal at subsequent stages of its construction (scaling factor) [28].
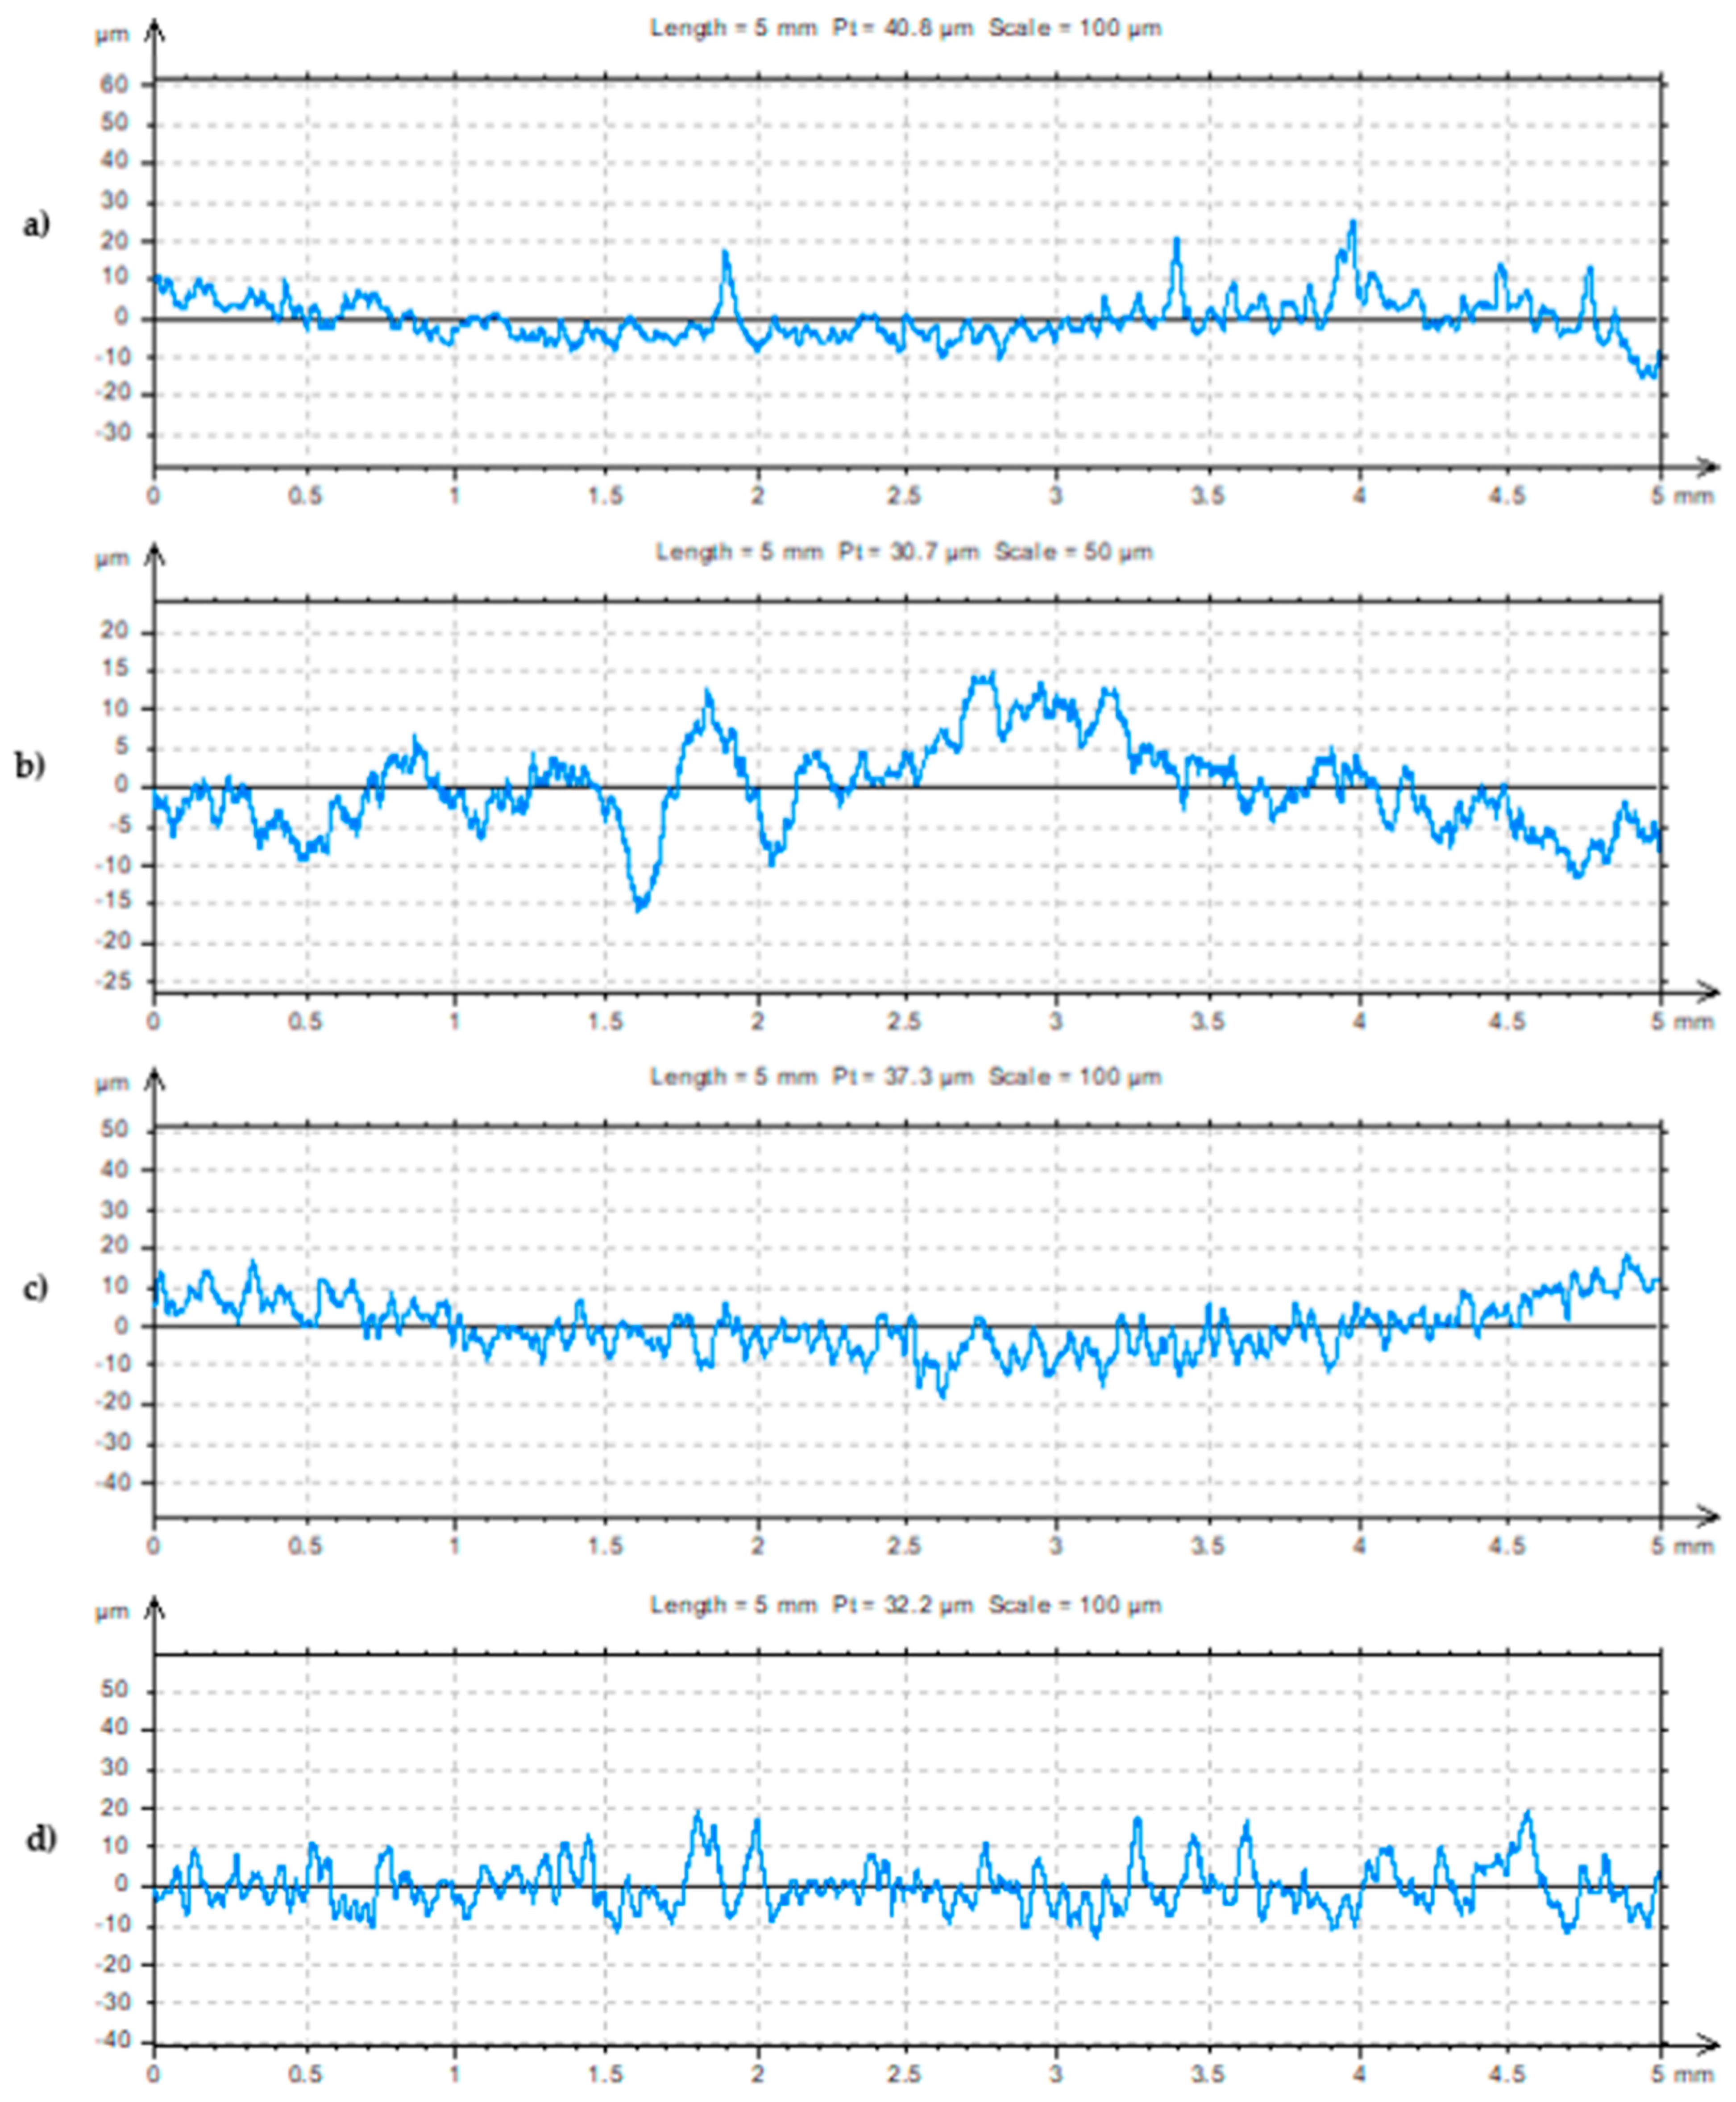
In the case of the applied method, the determination of the fractal dimension D consists in calculating the tangent of the angle of the slope of the line describing the dependence of the bilogarithmic number of boxes calculated for a given box size (log(N(εi))) on the side length (log(εi)). Fractal analysis was performed on 5 mm long profile lines separated from the surface. From each tested surface, 15 profile lines were separated. As shown in [29], it is a sufficient number to estimate the fractal dimension. The shape of the profile lines obtained in the scanning process, with the use of a laser profilometer, was described by a set of 10,001 points. The number of points describing the shape of the profile line resulted from the adopted discretization step of 0.5 µm. Due to the shape of the samples used for the test (cylinder side surface), the fractal analysis was carried out in the direction of the cylinder forming after prior leveling of the profile line. The total height of the roughness profile Pt was assumed as an additional fractographic parameter used to describe the roughness of the profile lines.
2.5. Analysis of Tap Water
Selected parameters of water supplying and leaving the experimental system were estimated by the applicable test procedures and the manufacturer’s recommendations, see Table 1.
3. Results
3.1. The Process of Biofilm Formation
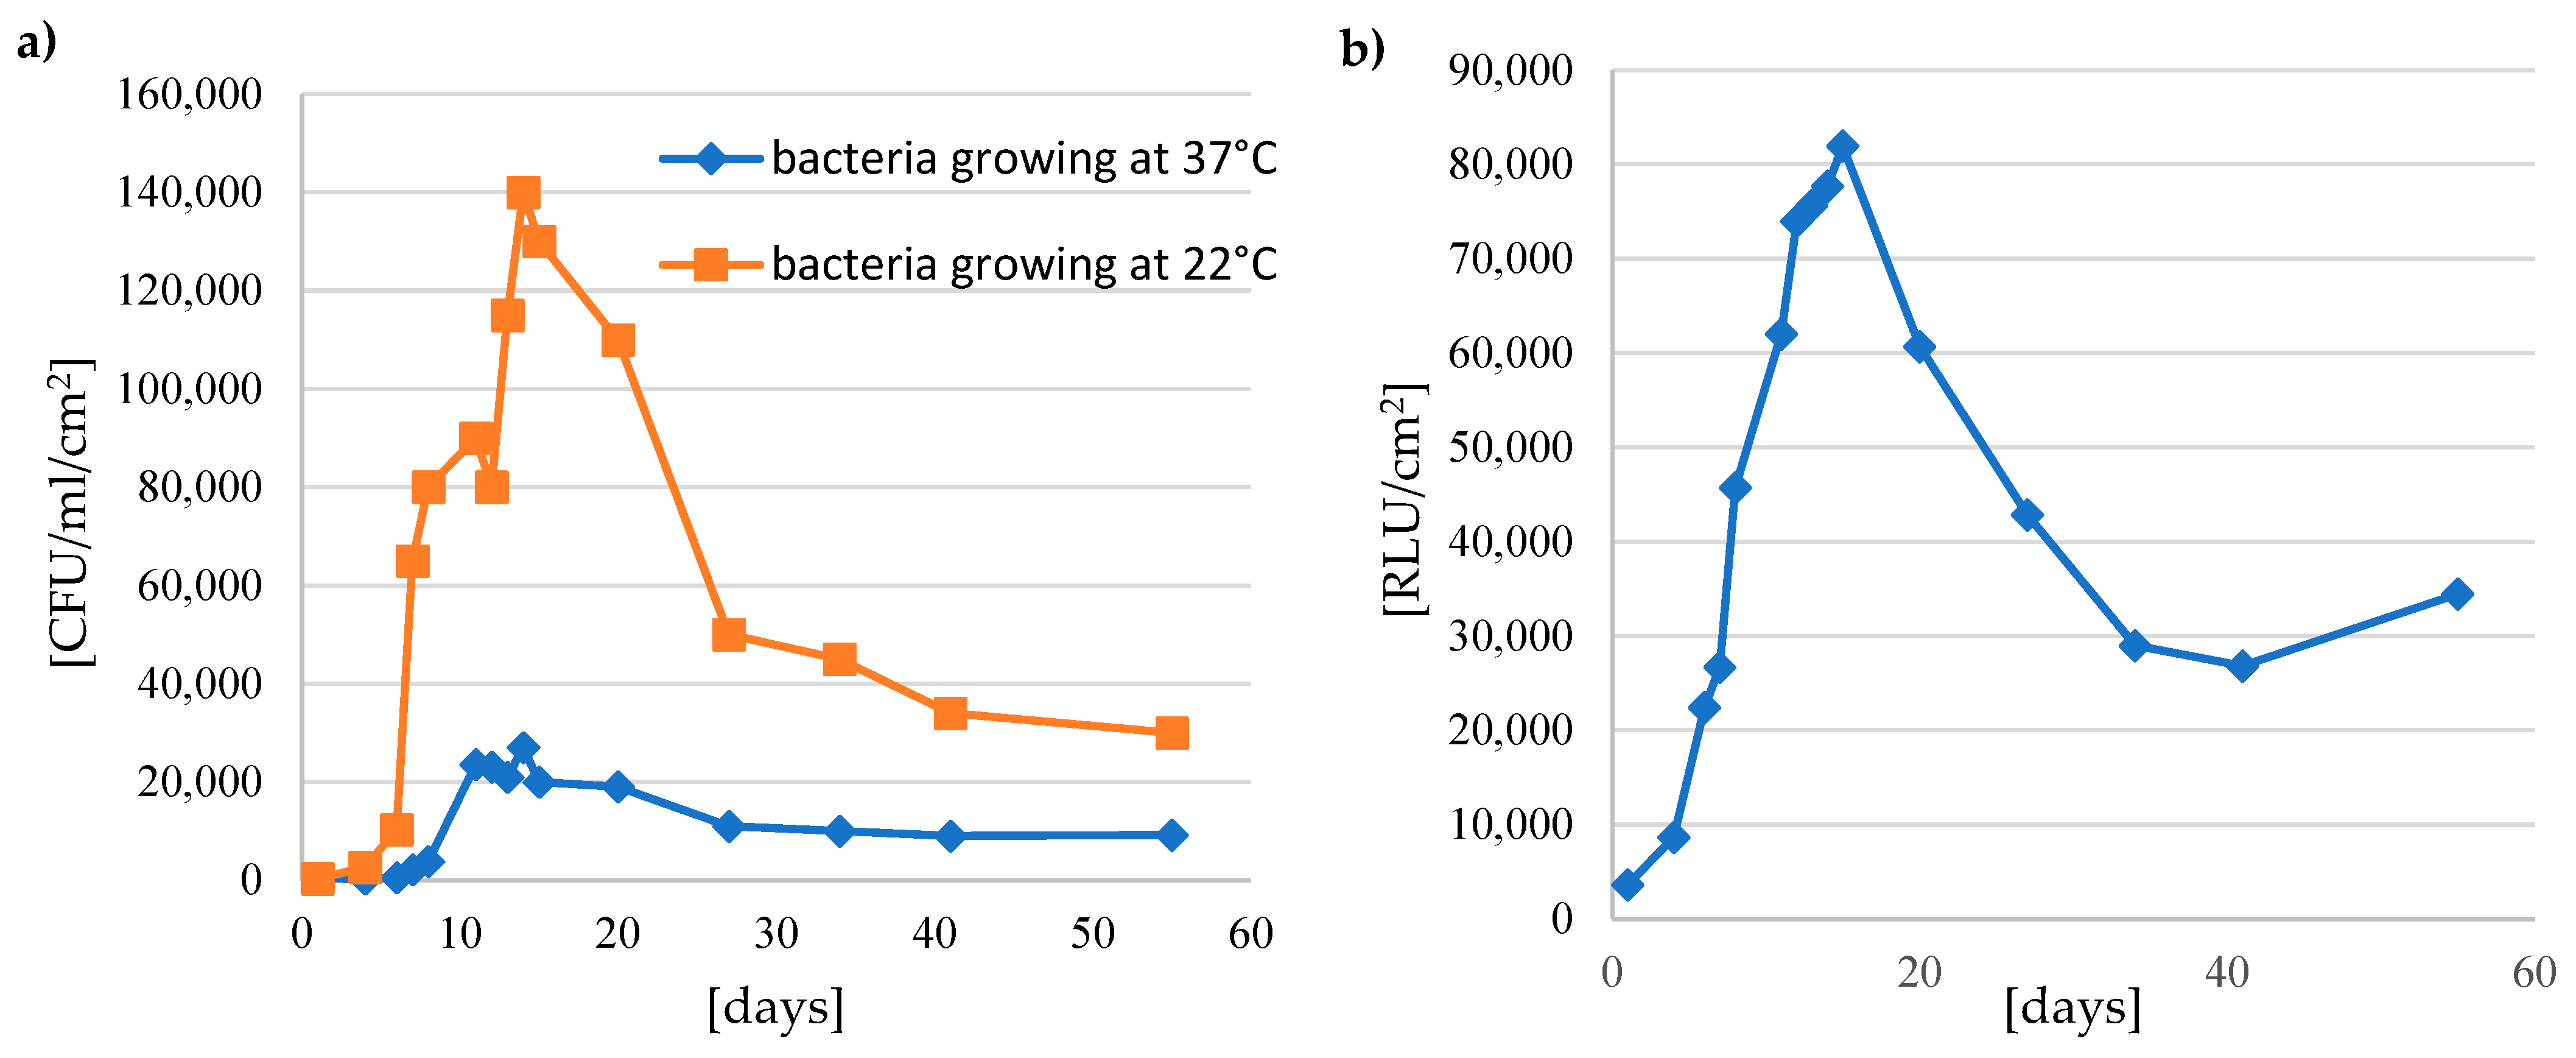
Based on the obtained test results, it was found that the number of bacterial cells taken from the installation material initially increased, reaching the maximum value on the 14th day (number of bacteria growing at 37 °C—2.7 × 10⁴ CFU/mL/cm2 and bacteria growing at 22 °C—1.4 × 10⁵ CFU/mL/cm2) (Figure 2). After the 14th day, a decrease in the number of bacteria was observed, and from the 27th day, the HPC at 37 °C values fluctuated at the level of 1.0 × 10³ CFU/mL/cm2, and the HPC at 22 °C was below 5.0 × 10⁴ CFU/mL/cm2 (Figure 2). The number of HPC bacteria at 22 °C and 37 °C were correlated with each other (Pearson’s correlation was 0.84) (Table 2). A similar relationship was observed when assessing the surface of installation materials using the ATP bioluminescence test. The ATP values during the research were in the range of 3630–81974 RLU (Figure 2). A very high correlation has been demonstrated between ATP analysis and HPC culture methods. The Pearson coefficient for the ATP method and the HPC method at 37 °C—0.90, and the ATP value and HPC value at 22 °C—0.93 (Table 2). The ATP method is a quick method of assessing the quality and bacteriological safety of the water. The bioluminescence test can be an alternative to HPC methods.
3.2. Water Quality in DWDS
The quality of the water supplied to and exiting the experimental installation was also analyzed. The conducted research showed a difference in the quality of both waters. The values of dissolved oxygen in the water flowing out of the installation were on average 15% lower than in the flowing water, and their values were 10 mg O2/L and 8.5 mg O2/L, respectively. The temperature of the water flowing into the experimental installation was 22 °C, and at the outflow, it was 22.6 °C. The differences in the total organic carbon (TOC) content were at the level of 9.51%, i.e., 2 mg C/L—inflow and 2.21 mg C/L—outflow. The values of individual forms of nitrogen at the inflow and outflow were respectively: ammonium nitrogen 0 mg NH4+/L and 0.02 mg NH4+/L, nitrite nitrogen 0.00045 mg NO2−/L and 0.002 mg NO2−/L, and nitrate nitrogen 0.88 mg NO3−/L and 0.70 mg NO3−/L. Meanwhile, the mean content of phosphates decreased by 14% from the value of 0.04 mg PO43−/L to 0.03 mg PO43−/L (Table 4 and Table 5).
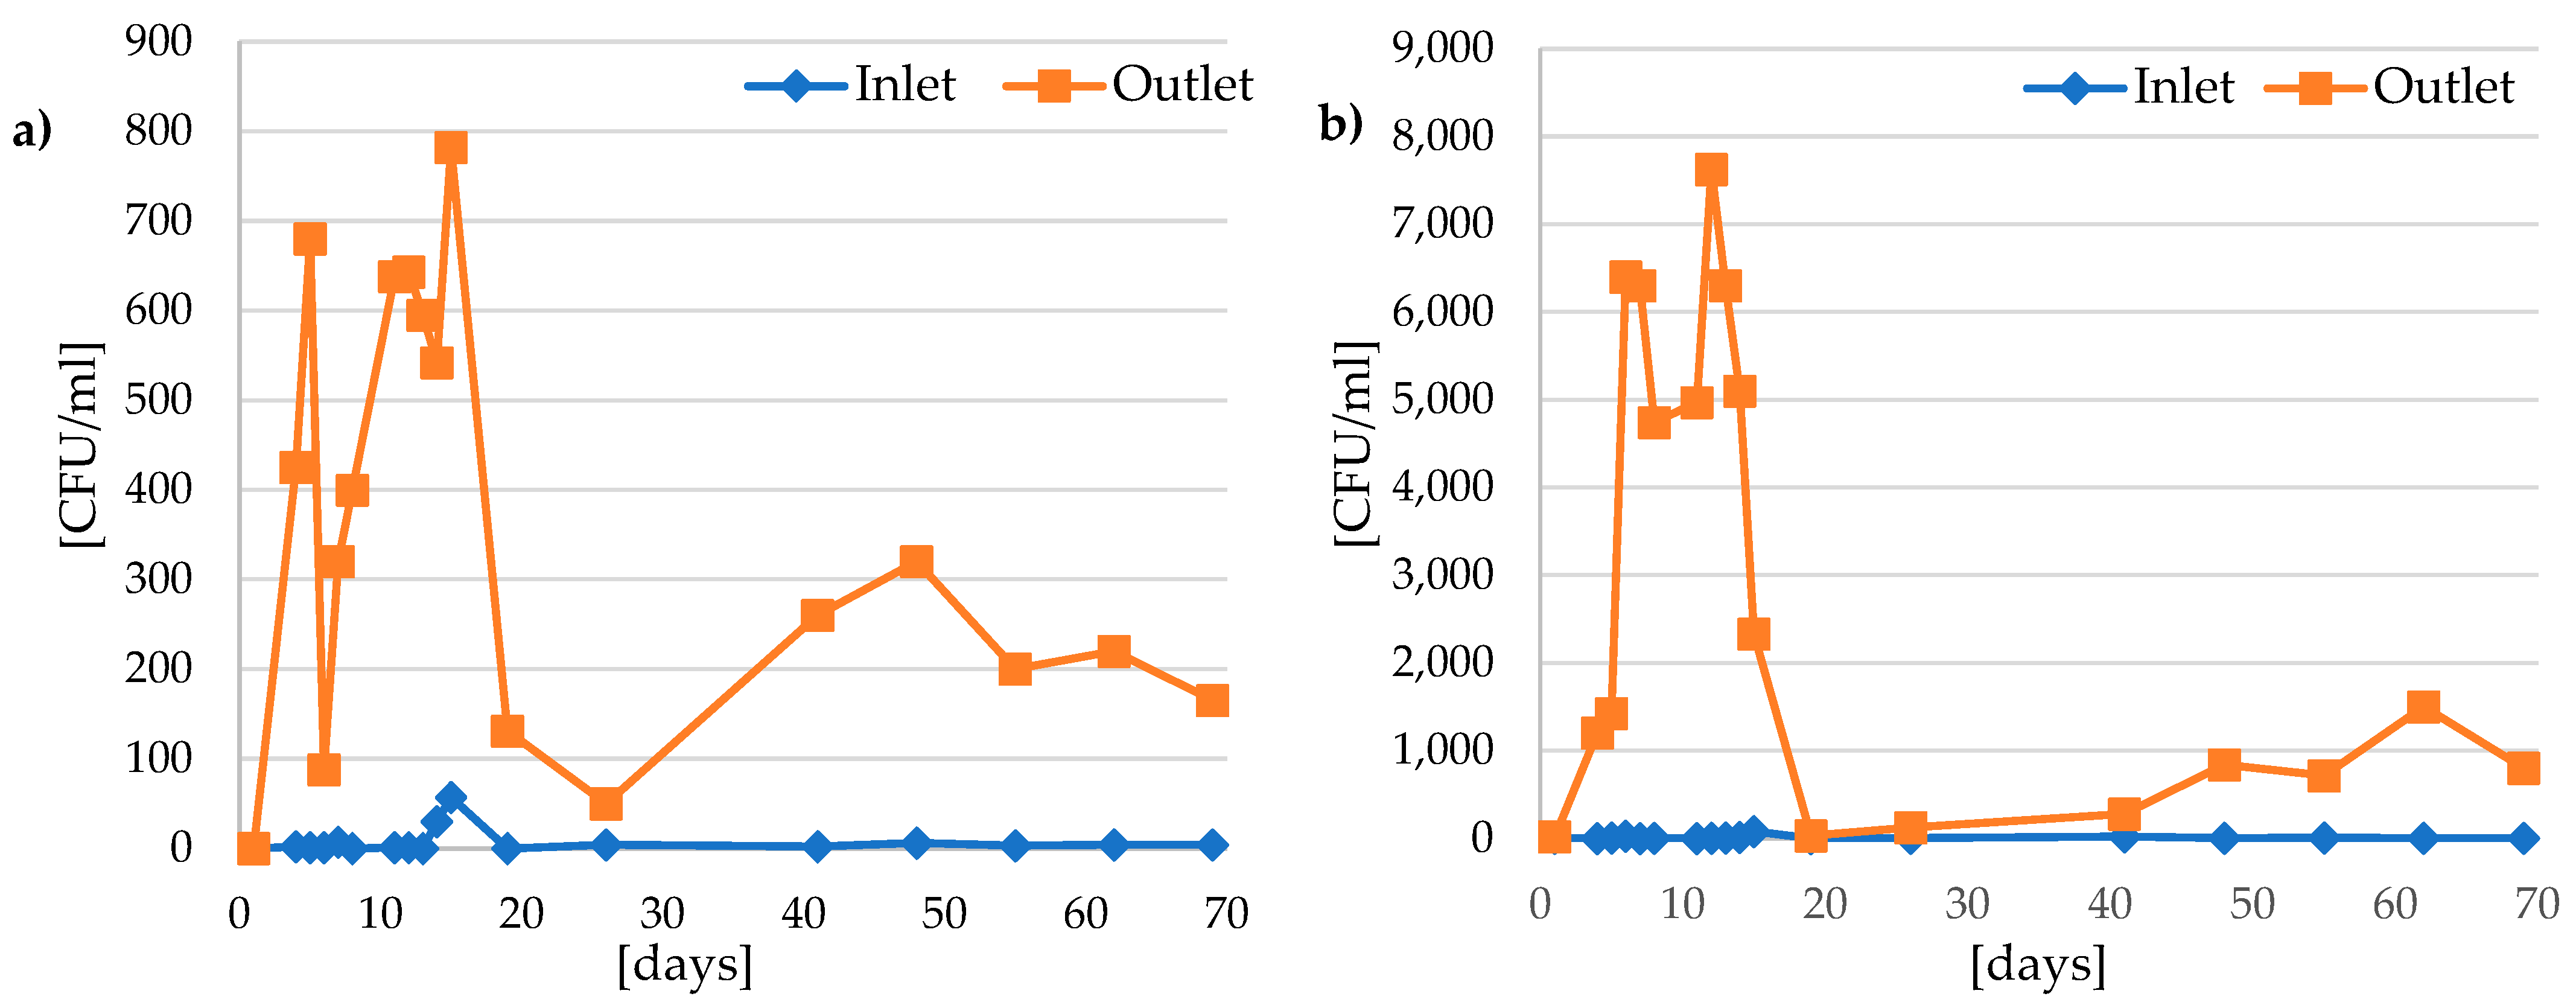
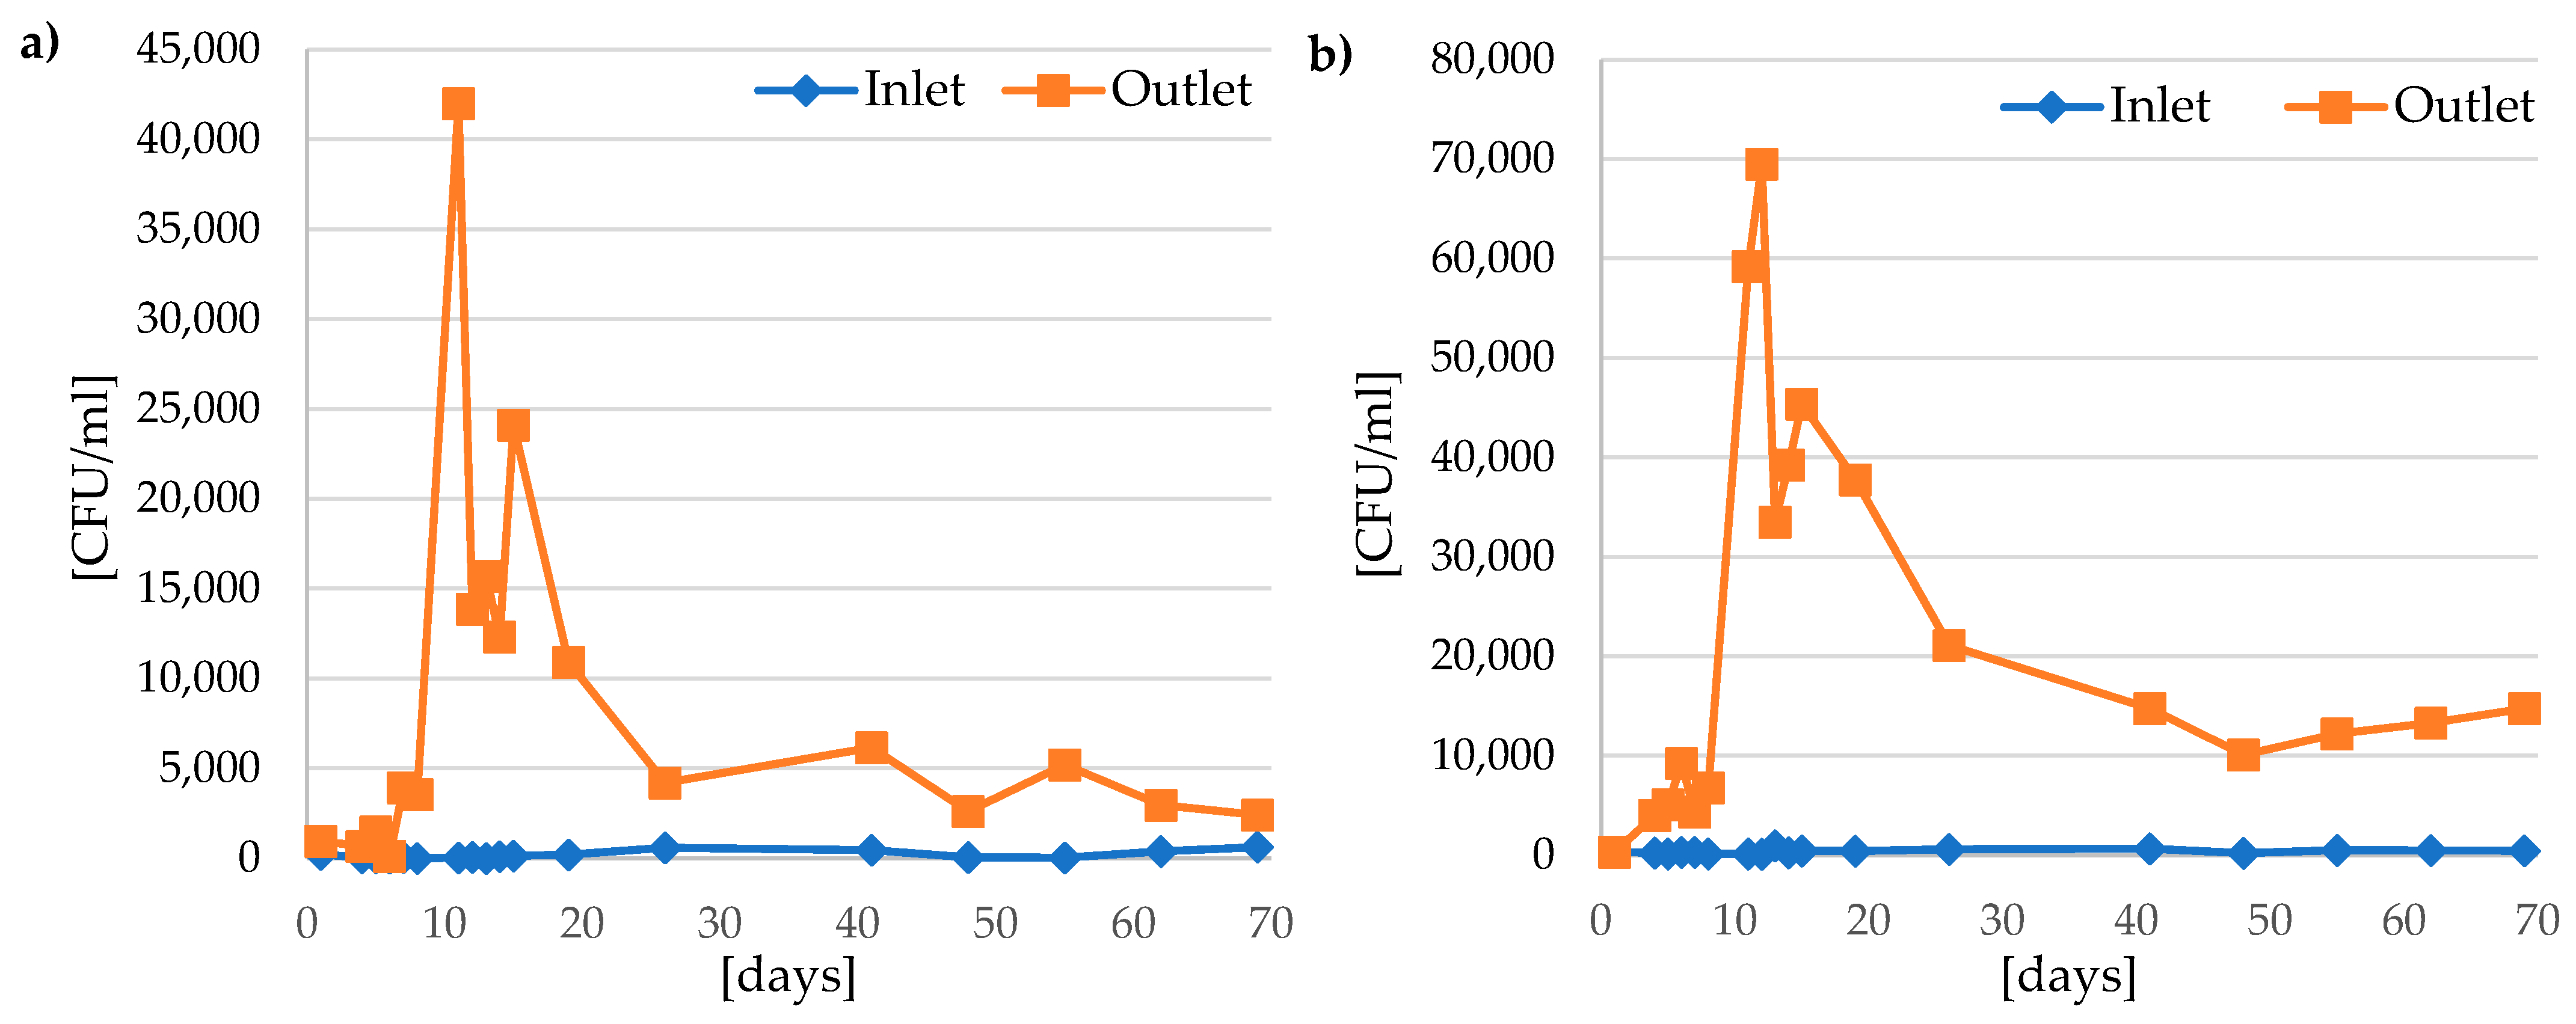
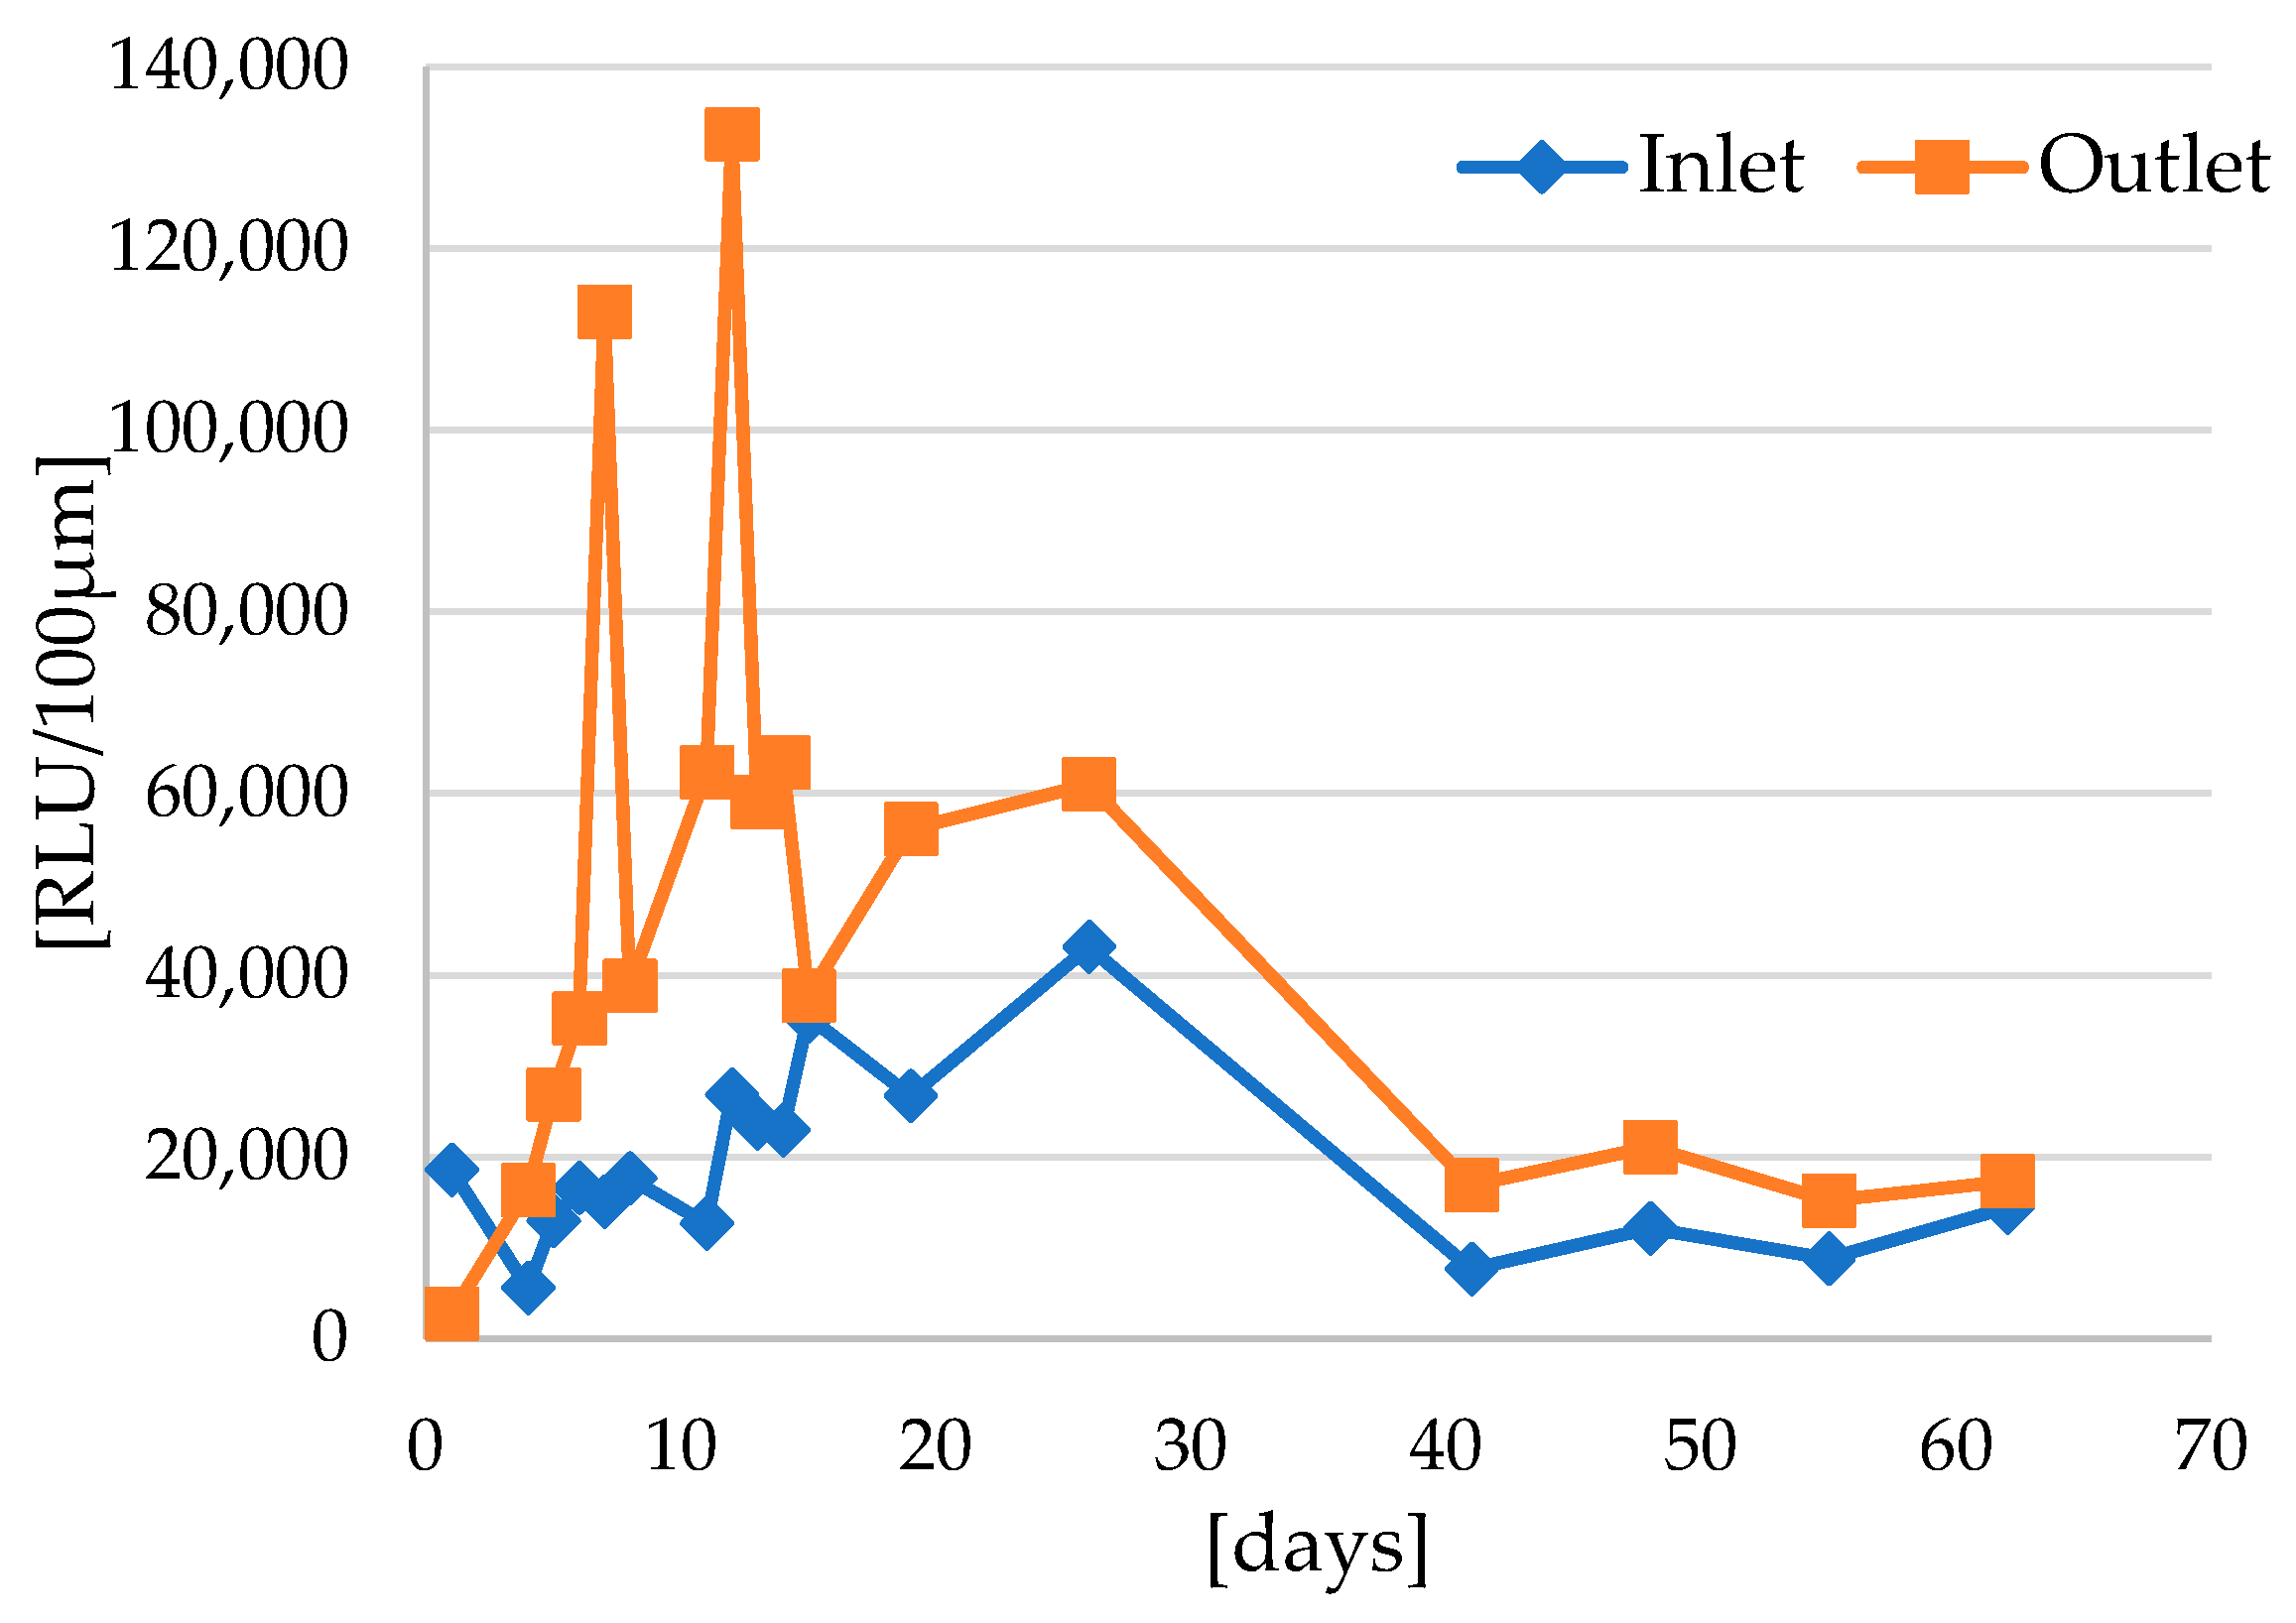
In the flowing water to the experimental installation, the number of controlled bacteria grown on A agar did not exceed 79 CFU/mL. In the case of the outflowing water, an increase in the number of bacteria was noted (the highest value was 7.6∙103 CFU/mL) (Figure 5). The number of microorganisms determined with the use of R2A agar reached 10 times higher values compared to A agar (the low nutrients in the medium give higher counts than the highly nutritious medium) (Figure 6). The use of the adenosine triphosphate (ATP) test allowed for quick measurements of the total content of microorganisms. Average values at the inflow and outflow from the experimental installation were 18,866 RLU/100 µL and 46,627 RLU/100 µL, respectively (Figure 7).
The study also monitored the presence of E. coli bacteria, which are the basic indicators of the sanitary quality of water. In the flowing water, the presence of Escherichia coli was recorded in one sample (1 CFU/100 mL), while in the outflow in four analyzed water samples (1–5 CFU/100 mL) (Table 4 and Table 5). The presence of Pseudomonas aeruginosa bacteria was also determined. The presence of these pathogens in the water flowing out of the installation was found in four analyzed samples (1–6 CFU/100 mL) (Table 4 and Table 5).
It should be noted that after the 21st day of observation, the water quality in the experimental installation was relatively stabilized over the time of the formation of a permanent biofilm. This may indicate that microorganisms are being trapped from the circulating water during the formation of the biofilm structure.
4. Discussion and Analysis of the Results
4.1. Mechanism of Biofilm Formation
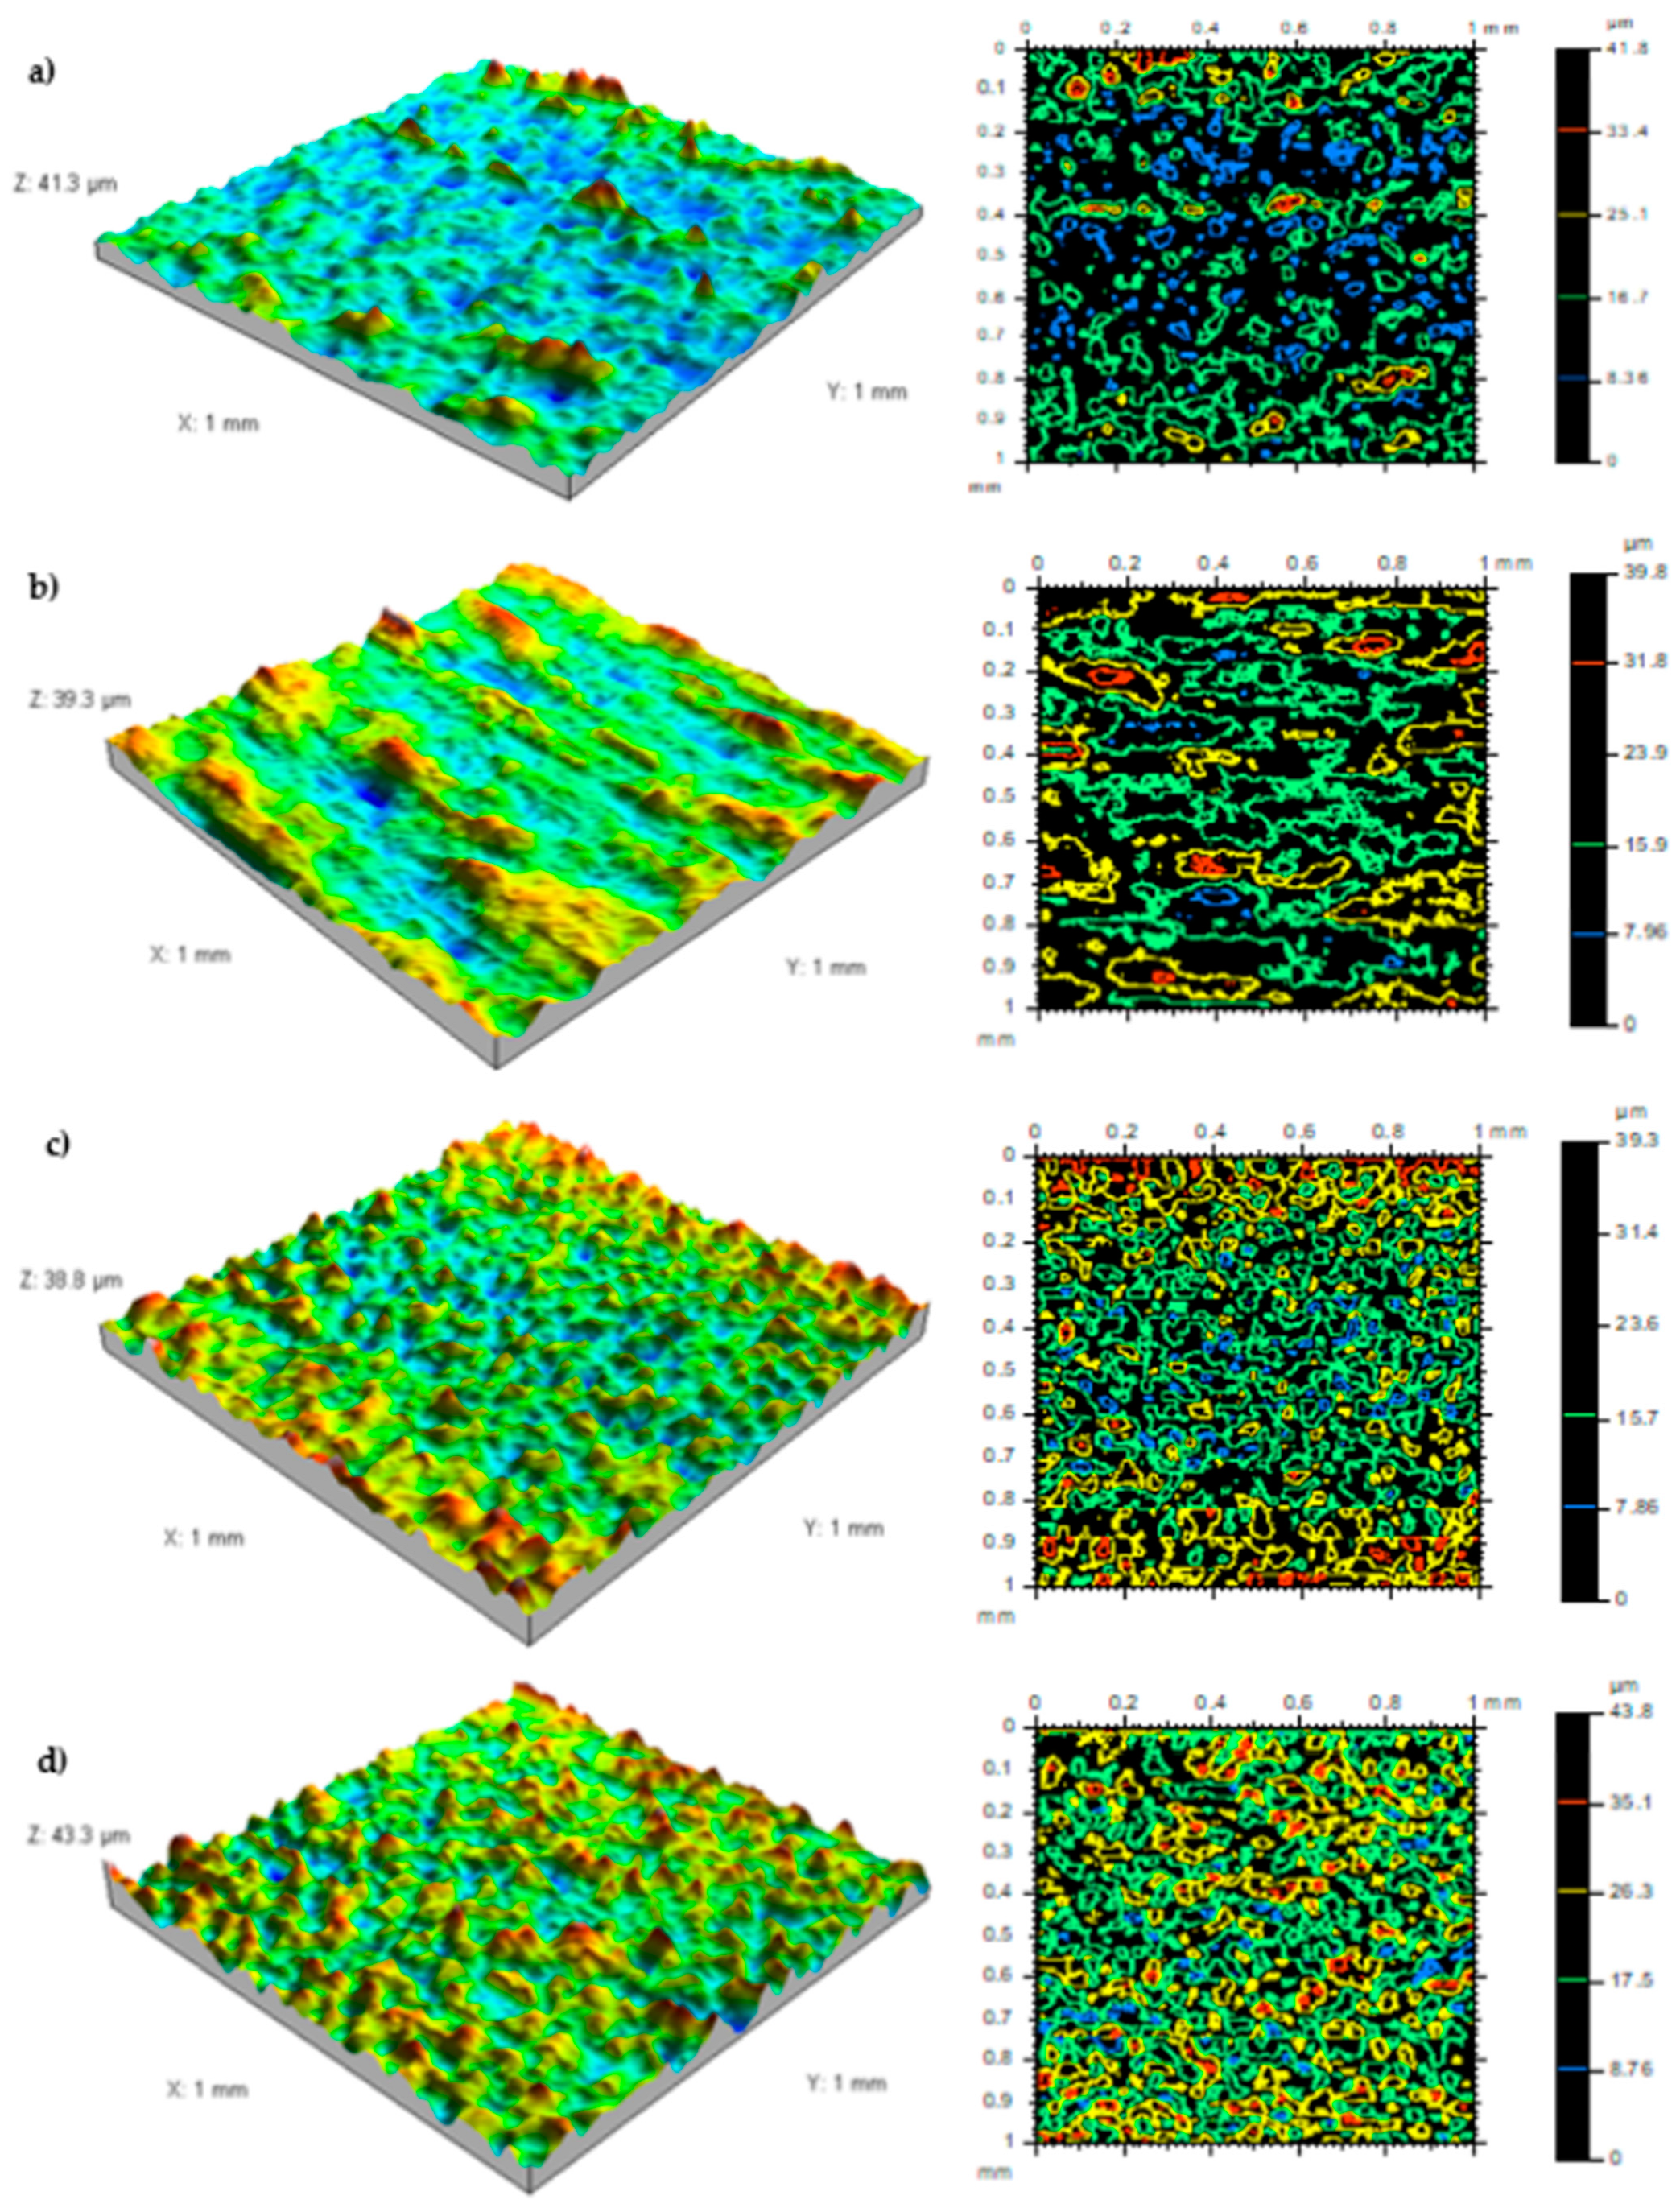
Based on the fractal analysis and microbiological determinations, it was found that biofilm was formed on the inner surfaces of the pipes of the experimental installation and on the installed plates. The fractal analysis showed an initial increase in the fractal dimension (D = 1.45) and then a decrease in its value (D = 1.24) (Table 3). Increasing the fractal dimension is a symptom of an increase in the roughness of the profile line, and thus the roughness of the material surface. Initially, possibly due to the variation in the reference material, a relatively small number of higher peaks were visible on the surface of the material (Figure 3a and Figure 4a). After the first exposure period (after 15 days), changes in both the material surface (Figure 3b) and the profile line (Figure 4b) are visible due to the deposition of biofilm on the surface. The biofilm formed in a very diverse (chaotic) manner, both on high elevations and in plate depressions. The uneven coverage of the plate with biofilm is evidenced by the large dispersion of the results of the total height of the roughness profile Pt (Table 3) (greater than in other cases). Some valleys have been filled with biofilm, and in some cases, biofilm has created new elevations. In the subsequent stages of the material exposure (30–45 test days), it may be suspected that the material surface has been completely covered with biofilm. There was a reduction in the roughness of this surface described by the fractal dimension with slight (statistically insignificant) changes in the total height of the roughness profile Pt parameter (Table 3). By analyzing only the first two series, it can be stated that there is no homogeneity of variance in both the fractal dimension D and the total height of the roughness profile Pt. Such behavior proves the influence of an external factor deciding about the smaller/larger scatters of the results. Thus, the influence of the formed biofilm on the structure of the tested material is visible.
Bacteriological analysis of biological material collected from plates confirmed the pattern of biofilm development obtained using fractal analysis. In the initial phase of the research, intensive development of microorganisms was found, both in the water and on the surfaces of the plates (the water in the installation was biologically unstable, which created appropriate conditions for the development of bacteria). Moreover, the reduction in the content of inorganic nitrogen (by 15%), phosphorus (by 14%), and dissolved oxygen (by 15%) in the water leaving the installation confirms the activity of microorganisms. On the 27th day of the experiment, the number of microorganisms stabilized and reached the values of 1.0 × 10⁴ CFU/mL/cm2—HPC at 37 °C and 4.0 × 10⁴ CFU/mL/cm2—HPC at 22 °C (Figure 2). The obtained results of microbiological analyses of the biofilm were also confirmed by the structural analysis of the plate surface. A comparison of the surface view of the reference material and the biofilm-coated material after 15, 30, and 45 days of exposure are shown in Figure 3. Initial observation of the surface of the reference material and the material after 15 days of exposure shows the difference in surface roughness. The differences are especially visible in the first period of exposure. In the period from 30 to 45 days of exposure, no differences in the structure of materials were found (Figure 3). Similar results were obtained in [15], the biofilm obtained a stable structure within 4–8 weeks of exposure.
The research presented in [18] shows that different biofilm compositions can exist within one DDWS, which is influenced by the environmental conditions inside the installation, the microclimate in the house, and the frequency of water consumption. In the studies carried out by Candida, a higher number of biofilm microorganisms was obtained, their number was on average 1.0 × 10⁷ bacteria/cm2 (the plateau was reached on days 2–3) [32]. Whereas Zlatanovic et al. showed that after 14 months of operation, biofilms collected from the kitchen tap and shower were only 6 and 3 CFU/cm2 (the proportion of bacteria grown in the biofilm is 0.01% of all bacteria) [10]. A study by [33] showed that the number of culturable bacteria (HPC) in two-year-old biofilms was higher than that of one-year biofilms. After one year of culturing, the number of HPC in the four tested pipelines was in the order of 105 CFU/cm2 (in the range 1.04 × 10⁵ ÷ 8.76 × 10⁵ CFU/cm2). The number of bacteria in the biofilm ranged from 1.68 × 10⁵ CFU/cm2 to 4.15 × 10⁶ CFU/cm2. The disinfection by-product content was also 50% higher for the two-year-old biofilms [33]. The sequencing analyses performed show that the most dominant group of bacteria, both in water and biofilm samples, is Proteobacteria (ranging from 61% to 80%) [34,35,36,37]. Another important group of microorganisms present in DWDS are iron-oxidizing and iron-reducing bacteria, which are responsible for intensifying the corrosion processes of pipes and deteriorating the color, taste, and mineral composition of water. In the study [4], several iron-transforming genera were detected in the pipelines (e.g., Sediminibacterium, Gallionella, Leptothrix, Geobacter, Geothrix. The differences in the number of microorganisms may result not only from the conditions of biofilm formation but also from the method of removing it from the surface of plates [38]. In the initial stages, removing biofilm from the plates with a cotton swab was effective (the biofilm structure was not yet compacted). After about 20 days, a decrease in the number of bacteria removed with a cotton swab from plates was noted. This may be due to the strengthening of the biofilm structure and the ineffectiveness of its removal by the swab method or the use of insufficient ultrasound intensity (verification in the next stage of the research).
In the water circulating in the installation, there was a secondary development of microorganisms (a higher total number of bacteria and the presence of Escherichia coli and Pseudomonas aeruginosa at the outflow were found) (Table 4 and Table 5). The detection of these bacteria in the water excludes the possibility of using these waters for drinking or hygienic purposes. In most cases, coli bacteria are not harmful to humans, and their presence usually indicates the presence of other pathogenic bacteria. E. coli bacteria can cause urinary tract infections and meningeal infections [39,40]. In turn, Pseudomonas aeruginosa mainly colonizes damaged areas of the skin and mucous membranes, e.g., postoperative wounds or the respiratory tract of people with respiratory diseases. Primarily susceptible to colonization by P. aeruginosa are patients with cystic fibrosis (in whom it may lead to severe progressive pneumonia) [39]. Research [41,42] also showed the presence of these bacteria in internal installations. Hydraulic materials (e.g., flexible hoses) are susceptible to microbial colonization (P. aeruginosa number was 7.0 × 10⁶ CFU/mL). These bacteria are common in humid environments with limited nutrients and can colonize taps, sinks, drains, toilets, and showers [41,42,43].
4.2. Influence of the Quality of Water Supplying the Installation on the Development of Biofilm—The Role of Water Biostability
4.2.1. Nutrients Content
The water supplied to the installation was biologically unstable and could have conditioned the increased growth of microorganisms. Water is biostable when the following conditions are met: N < 0.2 mg Nnorg/L, P < 0.03 mg PO43−/L, and BRWO < 0.25 mg C/L [44]. During the conducted research, only the content of the BRWO fraction did not exceed the limit value (values ranged between 0.11–0.14 g C/L) (Table 4). However, in the case of N and P, in 60% of the samples, values above 0.2 mg Nnorg/L and 0.03 mg PO43−/L were obtained. Failure to meet two out of three conditions means that there is a risk of secondary water contamination in the network. Nutrients in distribution systems intensify the growth of microorganisms and influence the consumption of disinfectants [17]. Liu et al. confirmed that changes in the concentrations of N, P, and C and increased turbidity of water contribute to changes in the DWDS environment, causing the growth of microorganisms [45]. To achieve the biological stability of water, waterworks should strive to minimize the concentration of nutrients supporting the growth of bacteria in the water [44,45,46,47]. This is especially important for water utilities that add nutrients to their distribution systems, e.g., chloramination (ammonia) or corrosion control (phosphorus) [48,49].
4.2.2. Free Chlorine Concentration
A reduction in the residual disinfectant concentration or an increase in water turbidity in DWDS indicates reduced biostability of the water [50]. A minimum concentration of free chlorine of 0.5 g Cl2/L is recommended in distribution systems to ensure biologically safe water [39]. According to WHO recommendations, residual chlorine should be maintained throughout the distribution system, and the free chlorine concentration at the water intake point should be 0.2 mg Cl2/L [39]. The observed deterioration of the bacteriological quality of water was associated with a 70.8% decrease in total chlorine concentration. The water supplied to the installation contained on average 0.11 mg Cl2/L of total chlorine, and after leaving the installation, the values were only 0.03 mg Cl2/L. The value of free chlorine on the inflow was 0.01 mg Cl2/L. The stability conditions were not met, which is also confirmed by a 79% increase in water turbidity (Table 4 and Table 5). In the work [14], it was shown that the change of the water chlorination dose in the range of 0.05–0.42 mg/L of free chlorine had a greater impact on the HPC density of the biofilms than the water flow velocity in the range of 0.3 m/s–1.0 m/s.
4.2.3. Temperature
Water temperature is another factor determining biological processes—biological activity increases twice when the temperature increases by 10 °C [51]. The temperature of the water supplying the experimental installation was on average 22 °C. Obtaining such a high temperature is the result of the thermal equilibrium between the water filling the installation and the air in the laboratory. The rate of increasing the tap water temperature to room temperature may be about 0.1 °C/minute [18,52]. According to the existing standards, the air temperature in rooms should be 22 °C in winter and 24.5 °C in summer [53]. The difference between the water temperature in installations with cold water and the temperature of water in distribution networks in winter can be up to 20 °C. The increase in temperature may result in the intensification of biological activity [51].
The deterioration of the microbiological quality of water is correlated with the water temperature, the type and concentration of the disinfectant used, and the residence time in the system [10,19,54]. A useful indicator of changes in water quality is the color of water, which may be associated with the release of biofilm fragments or metals from the surface of pipes (copper, galvanized steel) [55,56]. In addition, tap water may remain in internal installations for hours, days, or even weeks before it is consumed by consumers. The prolonged time of water stagnation adversely affects the physicochemical and microbiological parameters of water. The practice of rinsing the taps for 1 to 5 min before use may reduce the risk of water intake with an increased number of bacteria (a procedure recommended in inactive areas for extended periods) [19]. Biofilm samples collected in situ from the network had a greater number of bacteria in the summer months (1.1 ÷ 2.3 × 10⁴ CFU/cm2) than in the winter months (3.6 × 101 ÷ 2.0 × 10³ CFU/cm2) [57].
5. Conclusions
Biofilm analysis is a key element in understanding water quality changes in the distribution system. These structures increase the possibility of water contamination and are vectors for many diseases, so they pose a risk to the health of consumers. Although the plate methods have their limitations, they are very promising as they allow the surface roughness of installation materials to be analyzed and thus the biofilm visualization without having to interfere with the structure of the distribution pipes.
The quantitative analysis of the biofilm showed that in the initial phase of biofilm formation, an increasing number of microorganisms was noted (1.4 × 10⁵ CFU/mL/cm2 was reached on day 14). During this period, the settling of bacterial cells chaotically took place, as evidenced by an increase in the roughness of the profile line. The resulting unstable biofilm elevations could be easily detached from the structure of the material, which resulted in deterioration of the bacteriological quality of the water leaving the installation. The obtained results indicate that the biofilm completely and permanently covered the surface of the tested material after 25 days of research. Further exposure did not affect the structural appearance of the biofilm (fractal dimension was D = 1.23 ÷ 1.24) and the number of microorganisms (HPC values at 37 °C and 22 °C were 1.0 × 10³ CFU/mL/cm2 and 4.0 × 10⁴ CFU/mL/cm2, respectively). To determine the number of biofilm microorganisms in a DDWS installation, the method of its effective removal from the surface of pipes should be improved. The swab method seems to be sufficient only in the initial stages of biofilm formation.
The leaching of nutrients from the pipes and the instability of the water supplying the installation intensified the growth of bacteria inside the installation. Moreover, the favorable temperature (22.6 °C) and the recorded decrease in the content of inorganic nitrogen (by 15%), phosphorus (by 14%), and dissolved oxygen (by 15%) confirm the activity of microorganisms. The favorable environmental conditions in the installation (the presence of nutrients, low chlorine concentration, and high temperature) contributed to the secondary development of microorganisms, including pathogenic organisms, in the tested water. On the outflow, the HPC number at 37 °C and 22 °C obtained two and three orders of magnitude higher values about the inflow water.
To analyze the biofilm on the installation materials, an experimental installation was used, in which biofilm is formed under simulated conditions. These reactors significantly help to understand potential changes in biofilm but cannot fully replicate the conditions of real drinking water distribution systems. Consequently, further research should focus on the analysis of biofilms in situ (i.e., in the actual distribution system).
Author Contributions
Conceptualization, A.D. and D.P.; methodology, A.D., D.P. and J.K.; software, J.K.; formal analysis, D.P., A.D. and M.Z.; investigation, A.D., M.Z. and J.K.; writing—original draft preparation, D.P., A.D. and J.K.; writing—review and editing, M.Z., B.T.-C. and E.S.; visualization, A.D. and J.K.; supervision, D.P., B.T.-C. and E.S.; funding acquisition, D.P. All authors have read and agreed to the published version of the manuscript.
Funding
This research was funded under the UPB contract: PB29.B0.22.001.
Data Availability Statement
Not applicable.
Conflicts of Interest
The authors declare no conflict of interest.
References
- Agudelo-Vera, C.; Avvedimento, S.; Boxall, J.; Creaco, E.; de Kater, H.; Di Nardo, A.; Djukic, A.; Douterelo, I.; Fish, K.E.; Iglesias Rey, P.L.; et al. Drinking Water Temperature around the Globe: Understanding, Policies, Challenges and Opportunities. Water 2020, 12, 1049. [Google Scholar] [CrossRef] [Green Version]
- Gomes, I.B.; Simões, M.; Simões, L.C. An Overview on the Reactors to Study Drinking Water Biofilms. Water Res. 2014, 62, 63–87. [Google Scholar] [CrossRef] [PubMed] [Green Version]
- Waller, S.A.; Packman, A.I.; Hausner, M. Comparison of Biofilm Cell Quantification Methods for Drinking Water Distribution Systems. J. Microbiol. Methods 2018, 144, 8–21. [Google Scholar] [CrossRef] [PubMed]
- Goraj, W.; Pytlak, A.; Kowalska, B.; Kowalski, D.; Grządziel, J.; Szafranek-Nakonieczna, A.; Gałązka, A.; Stępniewska, Z.; Stępniewski, W. Influence of Pipe Material on Biofilm Microbial Communities Found in Drinking Water Supply System. Environ. Res. 2021, 196, 110433. [Google Scholar] [CrossRef]
- Chan, S.; Pullerits, K.; Keucken, A.; Persson, K.M.; Paul, C.J.; Rådström, P. Bacterial Release from Pipe Biofilm in a Full-Scale Drinking Water Distribution System. NPJ Biofilms Microbiomes 2019, 5, 9. [Google Scholar] [CrossRef] [PubMed]
- Ibekwe, A.M.; Murinda, S.E. Linking Microbial Community Composition in Treated Wastewater with Water Quality in Distribution Systems and Subsequent Health Effects. Microorganisms 2019, 7, 660. [Google Scholar] [CrossRef] [PubMed] [Green Version]
- Liu, G.; Zhang, Y.; van der Mark, E.; Magic-Knezev, A.; Pinto, A.; van den Bogert, B.; Liu, W.; van der Meer, W.; Medema, G. Assessing the Origin of Bacteria in Tap Water and Distribution System in an Unchlorinated Drinking Water System by SourceTracker Using Microbial Community Fingerprints. Water Res. 2018, 138, 86–96. [Google Scholar] [CrossRef] [PubMed]
- Maurice, P. (Ed.) Encyclopedia of Water: Science, Technology, and Society, 1st ed.; Wiley: Hoboken, NJ, USA, 2019; ISBN 978-1-119-30075-5. [Google Scholar]
- Muhammad, M.H.; Idris, A.L.; Fan, X.; Guo, Y.; Yu, Y.; Jin, X.; Qiu, J.; Guan, X.; Huang, T. Beyond Risk: Bacterial Biofilms and Their Regulating Approaches. Front. Microbiol. 2020, 11, 928. [Google Scholar] [CrossRef] [PubMed]
- Zlatanović, L.; van der Hoek, J.P.; Vreeburg, J.H.G. An Experimental Study on the Influence of Water Stagnation and Temperature Change on Water Quality in a Full-Scale Domestic Drinking Water System. Water Res. 2017, 123, 761–772. [Google Scholar] [CrossRef] [PubMed]
- Miao, X.; Bai, X. Characterization of the Synergistic Relationships between Nitrification and Microbial Regrowth in the Chloraminated Drinking Water Supply System. Environ. Res. 2021, 199, 111252. [Google Scholar] [CrossRef] [PubMed]
- Blokker, M.; Vreeburg, J.; Speight, V. Residual Chlorine in the Extremities of the Drinking Water Distribution System: The Influence of Stochastic Water Demands. Procedia Eng. 2014, 70, 172–180. [Google Scholar] [CrossRef] [Green Version]
- Fish, K.E.; Boxall, J.B. Biofilm Microbiome (Re)Growth Dynamics in Drinking Water Distribution Systems Are Impacted by Chlorine Concentration. Front. Microbiol. 2018, 9, 2519. [Google Scholar] [CrossRef] [PubMed]
- Tsvetanova, Z. Quantification of the Bacterial Community of Drinking Water-Associated Biofilms under Different Flow Velocities and Changing Chlorination Regimes. Appl. Water Sci. 2020, 10, 3. [Google Scholar] [CrossRef] [Green Version]
- Learbuch, K.L.G.; Smidt, H.; van der Wielen, P.W.J.J. Influence of Pipe Materials on the Microbial Community in Unchlorinated Drinking Water and Biofilm. Water Res. 2021, 194, 116922. [Google Scholar] [CrossRef]
- US Environmental Protection Agency. Effects of Water Age on Distribution System Water Quality; Office of Water (4601M) Office of Ground Water and Drinking Water Distribution System Issue Paper; US Environmental Protection Agency: Washington, DC, USA, 2002; pp. 1–17.
- Guidance on Monitoring the Biological Stability of Drinking Water in Distribution Systems. Available online: https://www.canada.ca/en/health-canada/programs/consultation-guidance-biological-stability-water-distribution-systems/document.html (accessed on 30 April 2020).
- Zlatanovic, L.; Moerman, A.; van der Hoek, J.P.; Vreeburg, J.; Blokker, M. Development and Validation of a Drinking Water Temperature Model in Domestic Drinking Water Supply Systems. Urban Water J. 2017, 14, 1031–1037. [Google Scholar] [CrossRef] [Green Version]
- Bédard, E.; Laferrière, C.; Déziel, E.; Prévost, M. Impact of Stagnation and Sampling Volume on Water Microbial Quality Monitoring in Large Buildings. PLoS ONE 2018, 13, e0199429. [Google Scholar] [CrossRef] [PubMed] [Green Version]
- Serrano-Suárez, A.; Dellundé, J.; Salvadó, H.; Cervero-Aragó, S.; Méndez, J.; Canals, O.; Blanco, S.; Arcas, A.; Araujo, R. Microbial and Physicochemical Parameters Associated with Legionella Contamination in Hot Water Recirculation Systems. Environ. Sci. Pollut. Res. 2013, 20, 5534–5544. [Google Scholar] [CrossRef]
- Prest, E.I.; Hammes, F.; Kötzsch, S.; van Loosdrecht, M.C.M.; Vrouwenvelder, J.S. Monitoring Microbiological Changes in Drinking Water Systems Using a Fast and Reproducible Flow Cytometric Method. Water Res. 2013, 47, 7131–7142. [Google Scholar] [CrossRef] [PubMed]
- Prest, E.I.; Hammes, F.; van Loosdrecht, M.C.M.; Vrouwenvelder, J.S. Biological Stability of Drinking Water: Controlling Factors, Methods, and Challenges. Front. Microbiol. 2016, 7, 45. [Google Scholar] [CrossRef] [PubMed]
- Preciado, C.C.; Boxall, J.; Soria-Carrasco, V.; Douterelo, I. Effect of Temperature Increase in Bacterial and Fungal Communities of Chlorinated Drinking Water Distribution Systems. Access Microbiol. 2019, 1, 74–85. [Google Scholar] [CrossRef]
- Lipphaus, P.; Hammes, F.; Kötzsch, S.; Green, J.; Gillespie, S.; Nocker, A. Microbiological Tap Water Profile of a Medium-Sized Building and Effect of Water Stagnation. Environ. Technol. 2014, 35, 620–628. [Google Scholar] [CrossRef] [PubMed]
- Bucheli-Witschel, M.; Kötzsch, S.; Darr, S.; Widler, R.; Egli, T. A New Method to Assess the Influence of Migration from Polymeric Materials on the Biostability of Drinking Water. Water Res. 2012, 46, 4246–4260. [Google Scholar] [CrossRef] [PubMed]
- Hemdan, B.A.; El-Taweel, G.E.; Goswami, P.; Pant, D.; Sevda, S. The Role of Biofilm in the Development and Dissemination of Ubiquitous Pathogens in Drinking Water Distribution Systems: An Overview of Surveillance, Outbreaks, and Prevention. World J. Microbiol. Biotechnol. 2021, 37, 36. [Google Scholar] [CrossRef] [PubMed]
- Ingerson-Mahar, M.; Reid, A. Microbes in Pipes (MIP): The Microbiology of the Water Distribution System; American Society for Microbiology: Washington, DC, USA, 2012. [Google Scholar]
- Mandelbrot, B.B. Fractals. Form, Chance and Dimension; W. H. Freeman and Company: San Francisco, CA, USA, 1977. [Google Scholar] [CrossRef]
- Konkol, J.; Prokopski, G. The Necessary Number of Profile Lines for the Analysis of Concrete Fracture Surfaces. Struct. Eng. Mech. 2007, 25, 565–576. [Google Scholar] [CrossRef]
- Mukaka, M.M. Statistics Corner: A Guide to Appropriate Use of Correlation Coefficient in Medical Research. Malawi Med. J. 2012, 24, 69–71. [Google Scholar] [PubMed]
- Regulation of the Minister of Health of 7 December 2017 on the Quality of Water Intended for Human Consumption [Dz.U. 2017 Poz. 2294]. Available online: https://isap.sejm.gov.pl/isap.nsf/download.xsp/WDU20170002294/O/D20172294.pdf (accessed on 30 April 2020).
- Manuel, C.M.; Nunes, O.C.; Melo, L.F. Dynamics of Drinking Water Biofilm in Flow/Non-Flow Conditions. Water Res. 2007, 41, 551–562. [Google Scholar] [CrossRef] [Green Version]
- Chen, H.; Wei, Z.; Sun, G.; Su, H.; Liu, J.; Hu, B.; Zhou, X.; Lou, L. Formation of Biofilms from New Pipelines at Both Ends of the Drinking Water Distribution System and Comparison of Disinfection By-Products Formation Potential. Environ. Res. 2020, 182, 109150. [Google Scholar] [CrossRef]
- Eichler, S.; Christen, R.; Höltje, C.; Westphal, P.; Bötel, J.; Brettar, I.; Mehling, A.; Höfle, M.G. Composition and Dynamics of Bacterial Communities of a Drinking Water Supply System as Assessed by RNA- and DNA-Based 16S RRNA Gene Fingerprinting. Appl. Environ. Microbiol. 2006, 72, 1858–1872. [Google Scholar] [CrossRef] [PubMed] [Green Version]
- Liu, G.; Van der Mark, E.J.; Verberk, J.Q.J.C.; Van Dijk, J.C. Flow Cytometry Total Cell Counts: A Field Study Assessing Microbiological Water Quality and Growth in Unchlorinated Drinking Water Distribution Systems. BioMed Res. Int. 2013, 2013, 595872. [Google Scholar] [CrossRef]
- Lührig, K.; Canbäck, B.; Paul, C.J.; Johansson, T.; Persson, K.M.; Rådström, P. Bacterial Community Analysis of Drinking Water Biofilms in Southern Sweden. Microbes Environ. 2015, 30, 99–107. [Google Scholar] [CrossRef] [Green Version]
- Prest, E.I. Biological Stability in Drinking Water Distribution Systems: A Novel Approach for Systematic Microbial Water Quality Monitoring. Appl. Sci. 2015. [Google Scholar] [CrossRef]
- Papciak, D.; Domoń, A.; Zdeb, M.; Skwarczyńska-Wojsa, A.; Konkol, J. Optimization of Quantitative Analysis of Biofilm Cell from Pipe Materials. Coatings 2021, 11, 1286. [Google Scholar] [CrossRef]
- World Health Organization. Guidelines for Drinking Water Quality: Fourth Edition Incorporating the First and Second Addenda; World Health Organization: Geneva, Switzerland, 2022. [Google Scholar]
- Uprety, S.; Dangol, B.; Nakarmi, P.; Dhakal, I.; Sherchan, S.P.; Shisler, J.L.; Jutla, A.; Amarasiri, M.; Sano, D.; Nguyen, T.H. Assessment of Microbial Risks by Characterization of Escherichia Coli Presence to Analyze the Public Health Risks from Poor Water Quality in Nepal. Int. J. Hyg. Environ. Health 2020, 226, 113484. [Google Scholar] [CrossRef] [PubMed]
- Walker, J.T.; Jhutty, A.; Parks, S.; Willis, C.; Copley, V.; Turton, J.F.; Hoffman, P.N.; Bennett, A.M. Investigation of Healthcare-Acquired Infections Associated with Pseudomonas Aeruginosa Biofilms in Taps in Neonatal Units in Northern Ireland. J. Hosp. Infect. 2014, 86, 16–23. [Google Scholar] [CrossRef] [PubMed]
- Proctor, C.R.; Reimann, M.; Vriens, B.; Hammes, F. Biofilms in Shower Hoses. Water Res. 2018, 131, 274–286. [Google Scholar] [CrossRef] [PubMed]
- Aumeran, C.; Paillard, C.; Robin, F.; Kanold, J.; Baud, O.; Bonnet, R.; Souweine, B.; Traore, O. Pseudomonas Aeruginosa and Pseudomonas Putida Outbreak Associated with Contaminated Water Outlets in an Oncohaematology Paediatric Unit. J. Hosp. Infect. 2007, 65, 47–53. [Google Scholar] [CrossRef] [PubMed]
- Papciak, D.; Tchórzewska-Cieslak, B.; Pietrucha-Urbanik, K.; Pietrzyk, A. Analysis of the Biological Stability of Tap Water on the Basis of Risk Analysis and Parameters Limiting the Secondary Growth of Microorganisms in Water Distribution Systems. Desalin. Water Treat 2018, 117, 1–8. [Google Scholar] [CrossRef]
- Liu, L.; Liu, Y.; Lu, Q.; Chen, G.; Wang, G. Assessing Comprehensive Performance of Biofilm Formation and Water Quality in Drinking Water Distribution Systems. Water Supply 2017, 17, 267–278. [Google Scholar] [CrossRef]
- Lautenschlager, K.; Hwang, C.; Liu, W.-T.; Boon, N.; Köster, O.; Vrouwenvelder, H.; Egli, T.; Hammes, F. A Microbiology-Based Multi-Parametric Approach towards Assessing Biological Stability in Drinking Water Distribution Networks. Water Res. 2013, 47, 3015–3025. [Google Scholar] [CrossRef] [Green Version]
- Tchórzewska-Cieślak, B.; Papciak, D.; Pietrucha-Urbanik, K.; Pietrzyk, A. Safety analysis of tap water biostability. Archit. Civ. Eng. Environ. 2018, 11, 149–154. [Google Scholar] [CrossRef] [Green Version]
- Payne, S.J.; Piorkowski, G.S.; Hansen, L.T.; Gagnon, G.A. Impact of Zinc Orthophosphate on Simulated Drinking Water Biofilms Influenced by Lead and Copper. J. Environ. Eng. 2016, 142, 04015067. [Google Scholar] [CrossRef]
- Jang, H.-J.; Choi, Y.-J.; Ro, H.-M.; Ka, J.-O. Effects of Phosphate Addition on Biofilm Bacterial Communities and Water Quality in Annular Reactors Equipped with Stainless Steel and Ductile Cast Iron Pipes. J. Microbiol. 2012, 50, 17–28. [Google Scholar] [CrossRef] [PubMed]
- Nescerecka, A.; Rubulis, J.; Vital, M.; Juhna, T.; Hammes, F. Biological Instability in a Chlorinated Drinking Water Distribution Network. PLoS ONE 2014, 9, e96354. [Google Scholar] [CrossRef] [PubMed] [Green Version]
- Van der Kooij, D. Managing Regrowth in Drinking Water Distribution Systems. Heterotrophic Plate Counts and Drinking-Water Safety; IWA Publishing: London, UK, 2003; pp. 199–232. [Google Scholar]
- Moerman, A.; Blokker, M.; Vreeburg, J.; van der Hoek, J.P. Drinking Water Temperature Modelling in Domestic Systems. Procedia Eng. 2014, 89, 143–150. [Google Scholar] [CrossRef] [Green Version]
- PN-EN ISO 7730:2006; Thermal Environment Ergonomics—Analytical Determination and Interpretation of Thermal Comfort with the Application of Calculation of PMV and PPD Indexes and Local Thermal Comfort Criteria. Available online: https://sklep.pkn.pl/pn-en-iso-7730-2006p.html (accessed on 30 April 2020).
- Zamorska, J. Biological Stability of Water after the Biofiltration Process. J. Ecol. Eng. 2018, 19, 234–239. [Google Scholar] [CrossRef]
- Husband, S.; Boxall, J.B. Field Studies of Discoloration in Water Distribution Systems: Model Verification and Practical Implications. J. Environ. Eng. 2010, 136, 86–94. [Google Scholar] [CrossRef]
- Douterelo, I.; Husband, S.; Boxall, J.B. The Bacteriological Composition of Biomass Recovered by Flushing an Operational Drinking Water Distribution System. Water Res. 2014, 54, 100–114. [Google Scholar] [CrossRef] [Green Version]
- Kelly, J.J.; Minalt, N.; Culotti, A.; Pryor, M.; Packman, A. Temporal Variations in the Abundance and Composition of Biofilm Communities Colonizing Drinking Water Distribution Pipes. PLoS ONE 2014, 9, e98542. [Google Scholar] [CrossRef] [PubMed] [Green Version]
Figure 1.
The scheme of an experimental installation.

Figure 2.
Microbiological analysis of biofilm taken from plates: (a) HPC method (R2A agar), (b) ATP analysis.
Figure 2.
Microbiological analysis of biofilm taken from plates: (a) HPC method (R2A agar), (b) ATP analysis.

Figure 3.
The surface of (a) the reference material and the material covered with biofilm after (b) 15 days, (c) 30 days, and (d) 45 days.
Figure 3.
The surface of (a) the reference material and the material covered with biofilm after (b) 15 days, (c) 30 days, and (d) 45 days.

Figure 4.
Profile line representative for a given series (a) reference material D = 1.39, (b) D = 1.45, (c) D = 1.27, and (d) D = 1.22.
Figure 4.
Profile line representative for a given series (a) reference material D = 1.39, (b) D = 1.45, (c) D = 1.27, and (d) D = 1.22.

Figure 5.
Microbiological quality of water in the inflow and outflow of the system: (a) bacteria growing at 37 °C, (b) bacteria growing at 22 °C (A agar).
Figure 5.
Microbiological quality of water in the inflow and outflow of the system: (a) bacteria growing at 37 °C, (b) bacteria growing at 22 °C (A agar).

Figure 6.
Microbiological quality of water in the inflow and outflow of the system: (a) bacteria growing at 37 °C, (b) bacteria growing at 22 °C (R2A agar).
Figure 6.
Microbiological quality of water in the inflow and outflow of the system: (a) bacteria growing at 37 °C, (b) bacteria growing at 22 °C (R2A agar).

Figure 7.
The results of the ATP analysis in the inflow and outflow of the system.


Table 1.
Summary of analytical methods for laboratory experiments.
| Parameter | Analytical Method/Standard | Range |
|---|---|---|
| Dissolved oxygen | Electrochemical method using a Hach–Lange oxygen probe (Germany) | 0.00–20.00 mg O2/L |
| Temperature | Multifunction meter CX-505 (Elmetron, Poland) | −50–199.9 °C |
| Turbidity | 2100P ISO turbidimeter (Hach, Germany) | 0–1000 NTU |
| Total organic carbon (TOC) | TOC analyzer Sievers 5310 C (SUEZ, Boulder, CO, USA) | 0.004–50 mg C/L |
| Biodegradable organic carbon (BDOC) | DOC (dissolved organic carbon) = 88% TOC; BDOC = 7% DOC [24] | - |
| Ammonium nitrogen | Spectrophotometric method 8155 (sachet tests—ammonia salicylate (1) and cyanurate (2)) using Hach-Lange DR 500 spectrophotometer (Germany) | 0.01–0.50 mg NH3–N/L |
| Nitrite nitrogen | Colorimetric method by Nitrite Test Merck 1.14408 (Germany) | 0.0015–0.03 mg N-NO2−/L |
| Nitrate nitrogen | Spectrophotometric method 8039 (sachet tests—NitraVer5) using Hach–Lange DR 500 spectrophotometer (Germany) | 0.3–30.0 mg N-NO3−/L |
| Phosphates | Spectrophotometric method 8048 (sachet tests—PhosVer3) using Hach–Lange DR 500 spectrophotometer (Germany) | 0.02–2.50 mg PO43−/L |
| Total and free chlorine | Spectrophotometric methods 8167 and 8021 (sachet tests—DPD reagent) using Hach-Lange DR 500 spectrophotometer (Germany) | 0.02–2.00 mg Cl2/L |
| The heterotrophic plate count (HPC) method at 22 °C and 37 °C | HPC method at 22 °C and 37 °C using R2A Agar (CM0906) manufactured by Oxoid Thermo Scientific (UK) (incubation 7 days) and A Agar (P-0231) manufactured by Department of Enzymes and Peptons (Poland) (HPC at 22 °C (3 days) and 37 °C (2 days); According to the PN-EN ISO 6222: 2004 standard. | The methods allow to determine the number of viable and capable development microorganisms in the tested water volume. |
| Escherichia coli | Membrane filtration procedure using Endo agar WG ISO 9308-1 (BTL, Poland); According to the PN-EN ISO 9308-1:2014-12 standard. | |
| Pseudomonas aeruginosa | Membrane filtration procedure using King agar WG ISO 9308-1 (BTL, Poland); According to the PN-EN ISO 16266:2009 standard. | |
| ATP analysis | LuminUltra Photonmaster Luminometer (BacTiter-Glo Microbial Cell Enviability Assay, Promega) | 0–106 RLU |
Table 2.
Pearson’s correlation coefficient between the examined microbiological parameters.
| Parameters | Bacteria Growing at 37 °C | Bacteria Growing at 22 °C | ATP Analysis | Sum of Bacteria Grown at 22 and 37 °C |
|---|---|---|---|---|
| Bacteria growing at 37 °C | 1.00 | 0.84 | 0.92 | 0.89 |
| Bacteria growing at 22 °C | 1.00 | 0.93 | 1.00 | |
| ATP analysis | 1.00 | 0.95 | ||
| Sum of bacteria grown at 22 and 37 °C | 1.00 |
Note: 0–0.3—negligible correlation; 0.3–0.5—low correlation; 0.5–0.7—moderate correlation; 0.7–0.9—high correlation; 0.9–1.0—very high correlation [30].
Table 3.
Summary of the results of the fractographic examination of profile lines.
| Series * | Fractographic Parameter | |||||
|---|---|---|---|---|---|---|
| Fractal Dimension D | ±Standard Deviation | ±Standard Error of the Mean | Total Height of the Roughness Profile Pt | ±Standard Deviation | ±Standard Error of the Mean | |
| A | 1.41 | 0.096 | 0.025 | 37.1 | 4.4 | 1.13 |
| B | 1.45 | 0.040 | 0.010 | 35.8 | 13.5 | 3.48 |
| C | 1.24 | 0.023 | 0.006 | 35.6 | 3.3 | 0.85 |
| D | 1.23 | 0.026 | 0.007 | 35.0 | 4.8 | 1.23 |
Note: * A: the reference material, B: material covered with biofilm after 15 days; C: after 30 days, D: after 45 days.
Table 4.
The quality of the water flowing into the experimental installation (n = 18).
| Parameter | Unit | Min | Max | Mean | Median | Standard Deviation | Guidelines for Drinking Water According to [31] |
|---|---|---|---|---|---|---|---|
| Dissolved oxygen | mg O2/L | 9.03 | 10.67 | 10.00 | 10.02 | 0.52 | - |
| Temperature | °C | 21.20 | 23.60 | 22.01 | 21.80 | 0.77 | - |
| Turbidity | NTU | 0.35 | 5.04 | 1.01 | 0.65 | 1.35 | <1 |
| TOC | mg C/L | 1.79 | 2.28 | 2.00 | 1.96 | 0.17 | - |
| BDOC | mg C/L | 0.11 | 0.14 | 0.12 | 0.12 | 0.01 | - |
| Ammonium nitrogen | mg N-NH3+/L | 0.00 | 0.00 | 0.00 | 0.00 | 0.00 | 0.5 |
| Nitrite nitrogen | mg N-NO2−/L | 0.000 | 0.001 | 0.0005 | 0.001 | 0.0004 | 0.5 |
| Nitrate nitrogen | mg N-NO3−/L | 0.60 | 1.30 | 0.88 | 0.90 | 0.20 | 50 |
| Phosphates | mg PO43−/L | 0.02 | 0.06 | 0.04 | 0.04 | 0.01 | - |
| Bakteria growing at 37 °C (A agar) | CFU/mL | 0.00 | 57.00 | 6.83 | 2.00 | 14.27 | - |
| Bacteria growing at 22 °C (A agar) | CFU/mL | 0.00 | 79.00 | 10.00 | 4.00 | 18.64 | <200 |
| Bacteria growing at 37 °C (R2A agar) | CFU/mL | 2.00 | 630.00 | 163.94 | 57.00 | 204.77 | - |
| Bacteria growing at 32 °C (R2A agar) | CFU/mL | 100.00 | 971.00 | 368.11 | 311.50 | 221.68 | - |
| E. coli | CFU/100 mL | 0.00 | 1.00 | 0.06 | 0.00 | 0.24 | 0 |
| Pseudomonas | CFU/100 mL | 0.00 | 0.00 | 0.00 | 0.00 | 0.00 | 0 |
| ATP | RLU/100 µL | 5579 | 43,140 | 18,876 | 16,614 | 9978 | - |
| Total chlorine | mg Cl2/L | 0.02 | 0.5 | 0.11 | 0.08 | 0.14 | - |
| Free chlorine | mg Cl2/L | 0.00 | 0.04 | 0.01 | 0.01 | 0.01 | 0.3 |
Table 5.
The quality of the water flowing out of the experimental installation (n = 18).
| Parameter | Value | Min | Max | Mean | Median | Standard Deviation | Guidelines for Drinking Water According to [31] |
|---|---|---|---|---|---|---|---|
| Dissolved oxygen | mg O2/L | 7.58 | 8.89 | 8.48 | 8.54 | 0.38 | - |
| Temperature | °C | 21.50 | 23.60 | 22.59 | 22.50 | 0.61 | - |
| Turbidity | NTU | 0.95 | 5.15 | 2.75 | 2.45 | 1.60 | <1 |
| TOC | mg C/L | 1.87 | 4.06 | 2.21 | 2.03 | 0.66 | - |
| BDOC | 0.12 | 0.25 | 0.14 | 0.12 | 0.04 | - | |
| Ammonium nitrogen | mg N-NH3+/L | 0.00 | 0.09 | 0.02 | 0.02 | 0.03 | 0.5 |
| Nitrite nitrogen | mg N-NO2−/L | 0.00 | 0.01 | 0.0020 | 0.00 | 0.00 | 0.5 |
| Nitrate nitrogen | mg N-NO3−/L | 0.40 | 1.10 | 0.70 | 0.70 | 0.24 | 50 |
| Phosphates | mg PO43−/L | 0.02 | 0.05 | 0.03 | 0.03 | 0.01 | - |
| Bakteria growing at 37 °C (A agar) | CFU/mL | 0.00 | 782.00 | 358.83 | 320.00 | 240.17 | - |
| Bacteria growing at 22 °C (A agar) | CFU/mL | 20.00 | 7625.00 | 2816.67 | 1462.50 | 2678.41 | <200 |
| Bacteria growing at 37 °C (R2A agar) | CFU/mL | 120.00 | 42,000.00 | 8503.56 | 4063.50 | 10,539.56 | - |
| Bacteria growing at 32 °C (R2A agar) | CFU/mL | 330.00 | 69,500.00 | 22,253.78 | 14,025.00 | 20,390.17 | - |
| E. coli | CFU/100 mL | 0.00 | 5.00 | 0.59 | 0.00 | 1.37 | 0 |
| Pseudomonas | CFU/100 mL | 0.00 | 6.00 | 0.59 | 0.00 | 1.50 | 0 |
| ATP | RLU/100 µL | 2765 | 132,590 | 45,627 | 37,739 | 35,042 | - |
| Total chlorine | mg Cl2/L | 0.02 | 0.06 | 0.03 | 0.03 | 0.01 | - |
| Free chlorine | mg Cl2/L | 0.00 | 0.02 | 0.01 | 0.01 | 0.01 | 0.3 |
Publisher’s Note: MDPI stays neutral with regard to jurisdictional claims in published maps and institutional affiliations. |
© 2022 by the authors. Licensee MDPI, Basel, Switzerland. This article is an open access article distributed under the terms and conditions of the Creative Commons Attribution (CC BY) license (https://creativecommons.org/licenses/by/4.0/).
Share and Cite
MDPI and ACS Style
Papciak, D.; Domoń, A.; Zdeb, M.; Tchórzewska-Cieślak, B.; Konkol, J.; Sočo, E. Mechanism of Biofilm Formation on Installation Materials and Its Impact on the Quality of Tap Water. Water 2022, 14, 2401. https://doi.org/10.3390/w14152401
AMA Style
Papciak D, Domoń A, Zdeb M, Tchórzewska-Cieślak B, Konkol J, Sočo E. Mechanism of Biofilm Formation on Installation Materials and Its Impact on the Quality of Tap Water. Water. 2022; 14(15):2401. https://doi.org/10.3390/w14152401
Chicago/Turabian StylePapciak, Dorota, Andżelika Domoń, Monika Zdeb, Barbara Tchórzewska-Cieślak, Janusz Konkol, and Eleonora Sočo. 2022. "Mechanism of Biofilm Formation on Installation Materials and Its Impact on the Quality of Tap Water" Water 14, no. 15: 2401. https://doi.org/10.3390/w14152401
Note that from the first issue of 2016, this journal uses article numbers instead of page numbers. See further details here.