Article

Experimental Design of Nature-Based-Solution Considering the Interactions between Submerged Vegetation and Pile Group on the Structure of the River Flow on Sand Beds

by
Nazanin Mohammadzade Miyab
1,
Ramin Fazloula
1,*,
Manouchehr Heidarpour
2,
Ataollah Kavian
1 and
Jesús Rodrigo-Comino
3,*
1
Water Engineering Department, Sari Agricultural Sciences and Natural Resources University, Sari 4818168984, Iran
2
Water Engineering Department, Isfahan University of Technology, Isfahan 8415683111, Iran
3
Departamento de Análisis Geográfico Regional y Geografía Física, Facultad de Filosofía y Letras, Campus Universitario de Cartuja, Universidad de Granada, 18071 Granada, Spain
*
Authors to whom correspondence should be addressed.
Water 2022, 14(15), 2382; https://doi.org/10.3390/w14152382
Submission received: 4 July 2022 / Revised: 26 July 2022 / Accepted: 29 July 2022 / Published: 1 August 2022
(This article belongs to the Special Issue Feature Papers of Water-Energy Nexus)

Abstract

:
Designing correct engineering infrastructures to reduce land degradation processes and considering natural elements to achieve this goal are key to correctly managing potential natural hazards affecting human activities and natural ecosystems. This research investigated the scour depth and velocity vectors around bridge piles with and without upstream vegetation protection. A Doppler velocity meter was used to measure velocity components in a channel 90 cm wide, 16 m long, and 60 cm high. Variable parameters were the number of bridge piles, the height, density, and width of vegetation upstream, as well as the distance between bridge piles. Using a triple pile group with a distance between piles of 10 cm and overall vegetation across the channel, the depth of the scour hole upstream of the first pile decreased by 40% compared to the single pile with no vegetation. This result shows the significant impact of using vegetation and pile groups to reduce scour around piles. Lower vertical velocity gradients, more consistent velocity vectors, reducing the downstream flow range, and restraining horseshoe vortexes and wake vortices were observed in utilizing vegetation. We confirmed that vegetation is an essential factor in changing the flow, transportation of sediment, and conserving ecological services in rivers.

1. Introduction

During floods, bridge damage and their consequent destruction can cause financial losses and disrupt aid to flooded areas due to the wreckage of transportation roads [1,2]. The registered social consequences generated after such extreme events can be irreparable if control measures were not previously and efficiently installed [3,4]. Moreover, sediment transport has other environmental disadvantages, such as pollution mobilization, with a negative impact on aquatic life or agriculture fields [5,6]. Today, these hazards have attracted high attention due to the importance of transportation [7,8,9,10]. Many studies have focused on scour depth prediction in the last three decades, and several equations have been proposed to predict the scour depth [11]. The local scour of bridge piles due to shear stress from water flow is defined as the loss of mass and soil particles around the foundation of the bridge pile. Shahriar et al. (2021) reviewed new methods for determining scouring depth. They affirmed that current solutions for predicting bridge scour depth are deterministic models. They suggested that these methods are imprecise since the effect of particle-scattering has not been considered in such statistical methods [12]. In addition, according to the results of the novel studies, the flow pattern around a bridge pile is so complex that a simple equation cannot be used to calculate the scour depth around it [13,14,15]. Previous studies show that a correct understanding of turbulent flow structure and sediment transport mechanism is necessary to accurately predict scouring around bridge piles.
As shown in Figure 1, the water flow structure changes into several parts. Some of these are changes in the direction as the down flow of the bed faces the bridge pile. The other part, internal of the bed, produces vortexes called horseshoe vortex that causes scouring around the pile. Also, the flow separation caused by the high-velocity gradient creates vortices, which can be known as wake vortices. These are transferred from both sides of the pile to the downstream and cause local scouring [16,17].
Two different approaches are proposed to inhibit the bridge piles’ scouring. The first is to strengthen the bed, and the second is to alter the flow pattern to lessen the strength of the vortexes created around the pile. In the present study, vegetation and group piles will be examined. Thus, this research evaluated the second method, which involves changing the flow structure to reduce the horseshoe vortex.
The use of vegetation as a nature-based solution (NBS) is a method with many capabilities in protecting rivers, inhibiting erosion, and controlling and trapping sediment [18,19]. Albert et al. stated that NBS [20] is understood as actions that use ecosystem processes to address societal needs and should support key inputs to future-proof river landscape development for humankind and nature, but there is a lack of studies on how NBS can be planned and implemented at landscape scales in rivers. Vegetation as NBS in rivers is pivotal in flow-dependent systems, sediment transport, and river geomorphology [21]. However, accelerating urbanism and industrial development, especially in developing countries, is leading to a decline in water quality in rivers and wetlands with clear gaps in management plans [22]. Restoring such degraded or damaged ecosystems and enhancing the water quality is becoming a crucial topic for research with significant social significance [23,24,25]. Aquatic vegetation inherently protects the ecosystem by purifying water through microbial absorption and metabolism [26]. Planting vegetation due to its simplicity and cost-effectiveness, environmental friendliness, increased aquatic life, and increasing bed resistance as an unstudied method is a valuable and reliable solution. Therefore, the main aim of this research is to investigate the scour depth and velocity vectors around bridge piles with and without upstream vegetation protection. The velocity components were measured by an Acoustic Doppler velocimeter (ADV) in a channel of 90 cm in width, 16 m in length, and 60 cm in height. The number of bridge piles, the width of upstream vegetation, and the distance between bridge piles were considered variable parameters. We hypothesize that this research can serve as an example of land management strategies to protect river areas by reducing costs and using native species, which perfectly fits within the scope of NBSs.

2. Material and Methods

A comprehensive understanding of flow characteristics and scouring rates near bridge piles enhances the accuracy of scour depth prediction. In this study, the efficacious variables on the local scouring of the bridge piles include time, the existence of vegetation, the proportion of vegetation width to flow width, the height of vegetation, and the density of vegetation. In the scouring experiment for the pile group, the distance between the piles is also included as a variable. To increase the accuracy of our research, vegetation effect for all experiments, flow condition, angle at which the flow encounters the pile, the diameter of the pile, and shape of the pile remained constant.

2.1. Dimensional Analysis

According to Table 1, dimensional analysis was used to ascertain the effective parameters of the scouring phenomenon by the Buckingham Pi theorem [27].
The presented dimensionless parameters were achieved as follows in Equation (1):
d s D = f   F r ,   R e ,   B D ,   G D ,   d 50 D ,   ϴ ,   m ,   n ,   K , c d ,   σ ,   t , h v H , d v ,   l p
Here, t, D, B, d50, ρ, ρs, ϑ, ϴ, Kϕ, m, n, and Cd parameters defined in Table 1 were constant throughout the experiment. The Reynolds number (Re = 4 ρ uA/νP) in all experiments was more than 2000 as the flow regime was turbulent, so the Reynolds number effect was not considered [28]. Froud number (Fr) was obtained using [u/√(4gA/P)]. Thus, in this study, the dimensionless parameters of the variable were regarded as follows in Equation (2):
d s D = f   F r , G D ,   l p ,   d v , h v

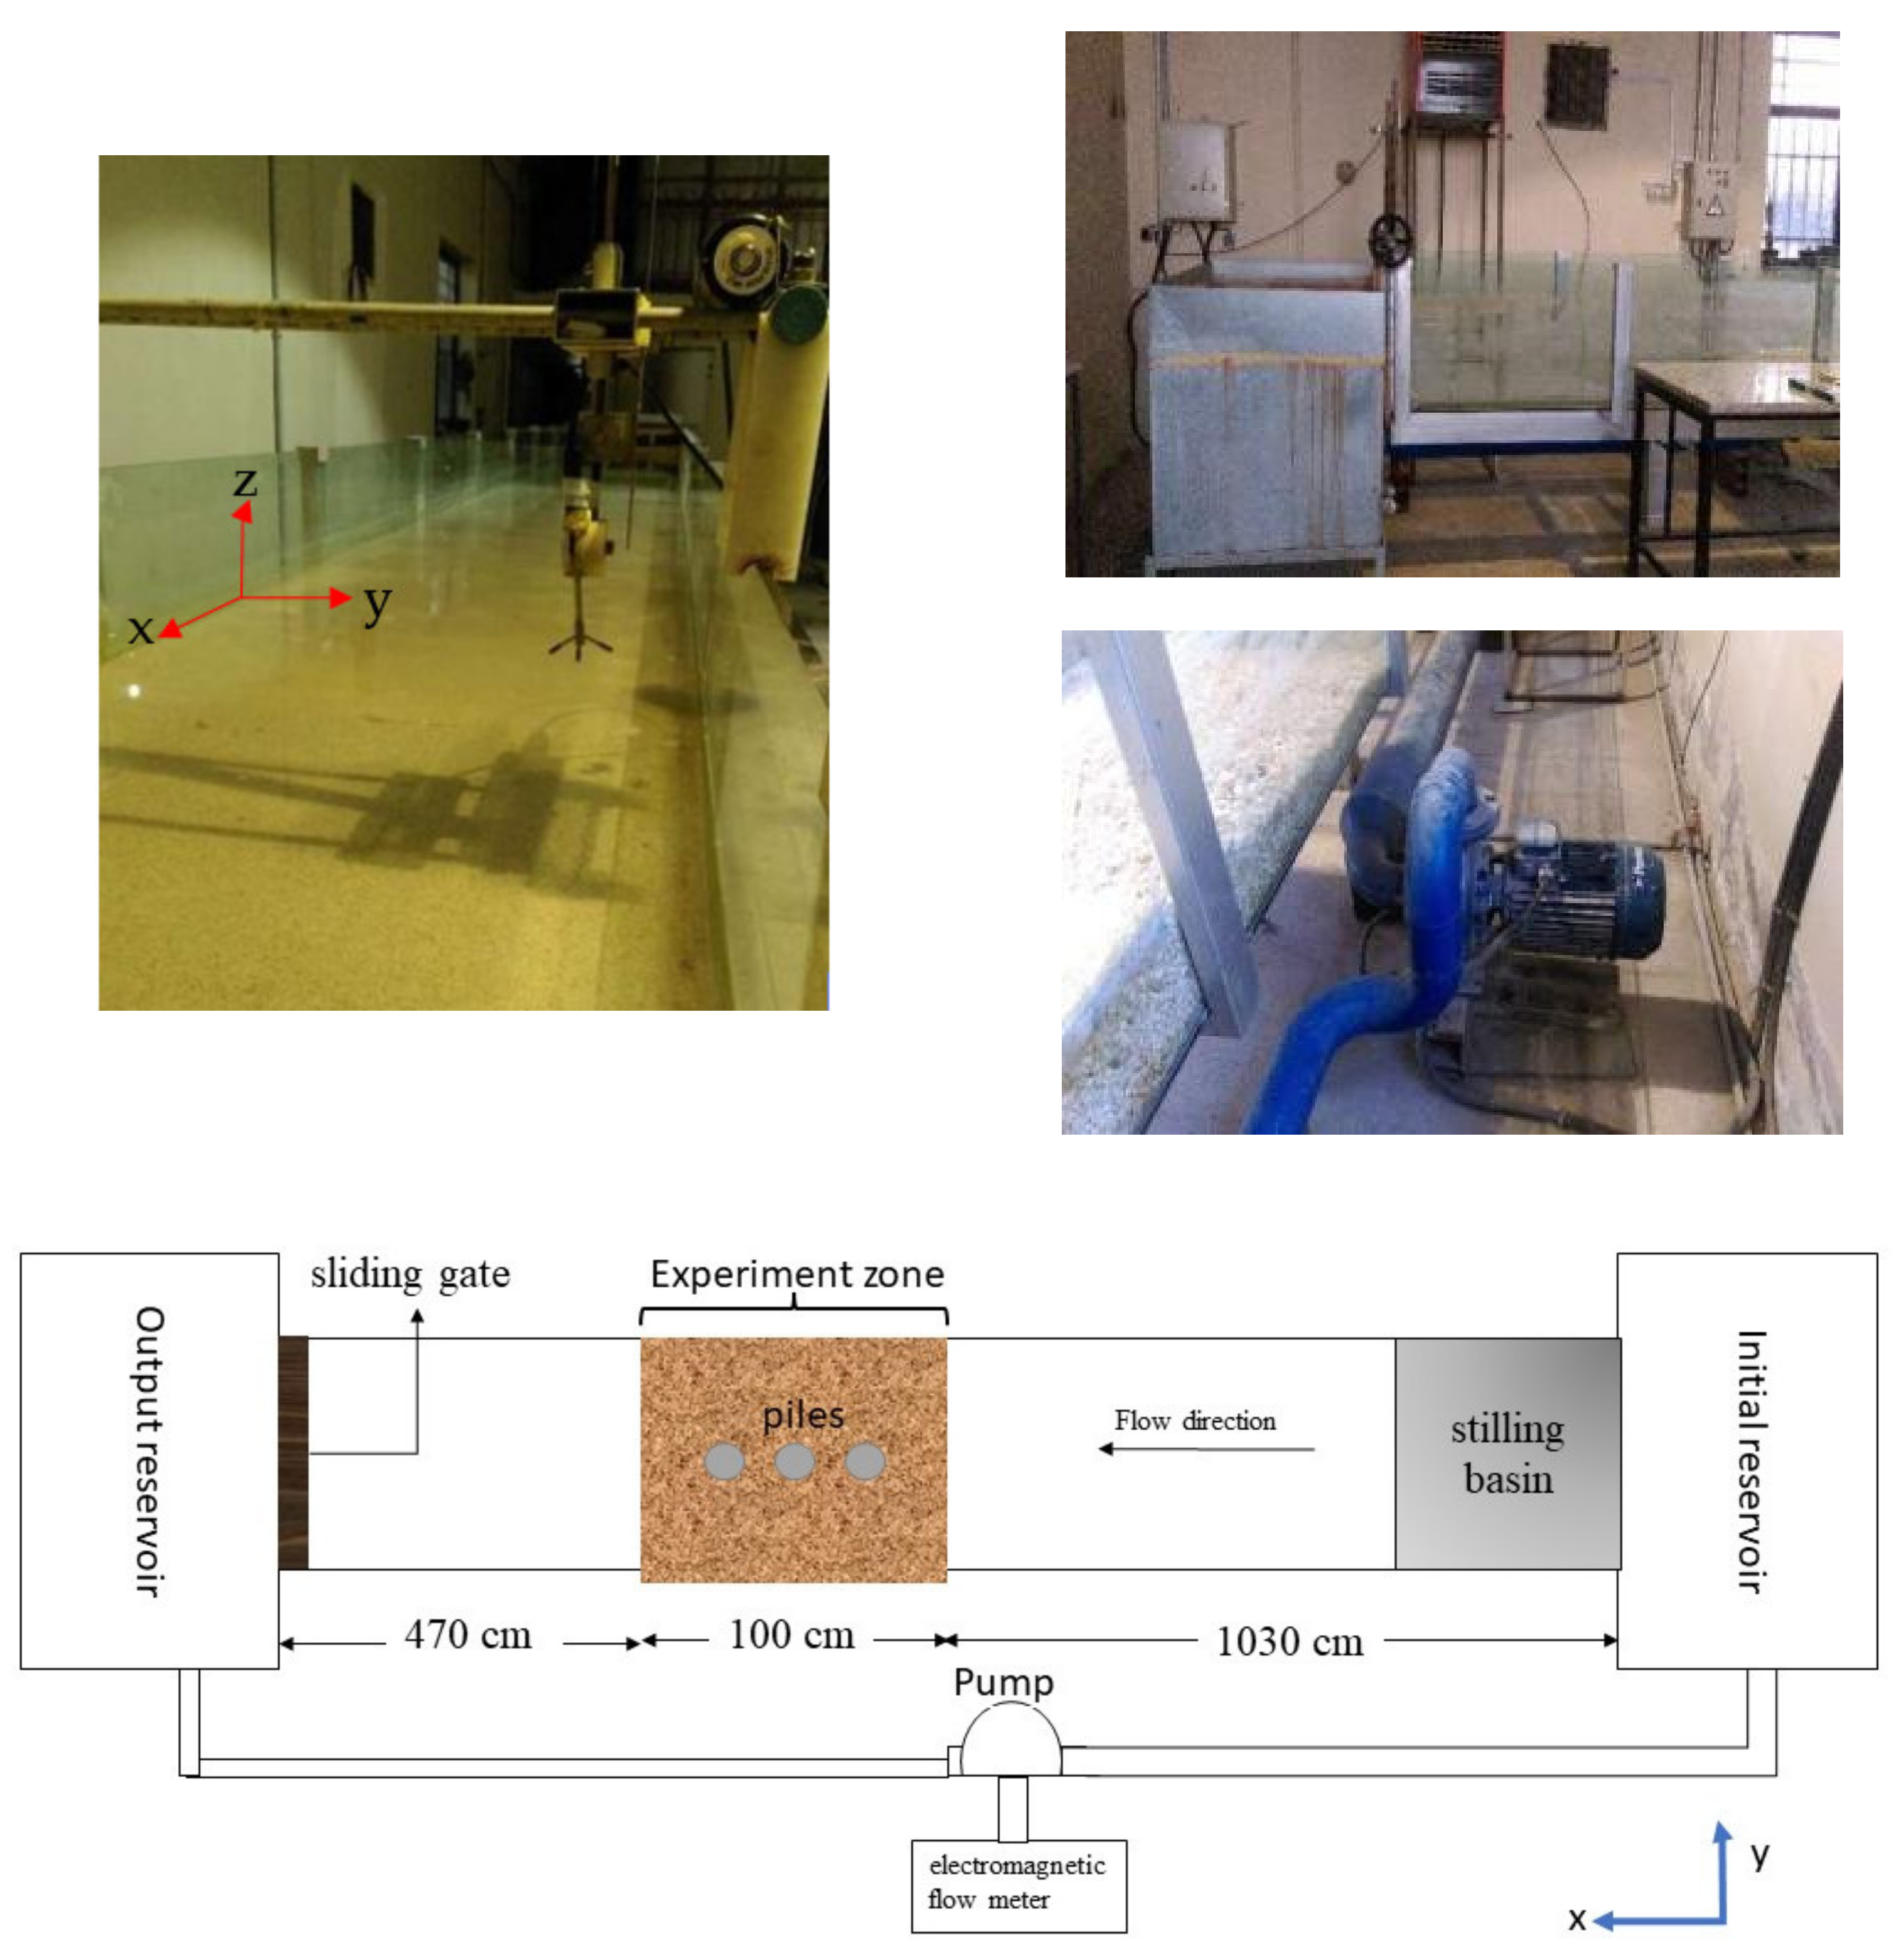
2.2. Channels and Tools Used

This study was carried out in a 16 m long, 90 cm wide, and 60 cm high flume in the hydraulic laboratory of Isfahan University of Technology (IUT). Glass floor and walls, zero bed slope, rectangular cross-section, sliding gate located downstream of the flume for water level adjustment, stilling basin at the inlet of the channel to reduce turbulence of the inlet current, and electromagnetic flow meter to measure inlet flow rate were other specifications of this flume. Figure 2 shows the experimental setup and a schematic plan of the flume at IUT.
Piles were placed at 1059 cm away from the start of the channel. Figure 3 indicates the velocity profiles at several locations in the channel to determine in what range the stream has been developed. Therefore, viscosity and boundary layer do not affect the velocity profiles, and hence the flow in x = 1049 cm is fully developed [29]. The z parameter is the distance from the bed to the location of velocity measured at any point. A dimensionless vertical axis was created considering the flow depth (H). Furthermore, u represents the point velocity at distance z from the bed, which is dimensionless with average velocity (U).

2.3. Hydraulic and Geometric Features

To develop the conditions in which the maximum scouring depth occurs in clear water, the choice of parameters such as flow depth and bed particle size should be such that they do not affect the scour depth. Also, the flow velocity should be as close as possible to the acute extent of the sediment particle motion threshold. To eliminate the effect of canal walls on local scouring around the pile, the pile diameter should not exceed 10% of the channel width [28]. According to Raudkivi and Ettema (1983), the distance between the pile axis and the channel wall should be greater than 6.25 cm [30]. A pile with a diameter of 0.05 m fits the requirements in this experiment since the distance from the wall to the channel’s central axis is 45 cm. The distances between the piles were selected as follows: 2D, 3D, and 4D. The piles were placed perpendicular to the bed. Figure 4a shows the arrangement of the piles schematically. It is essential to estimate the maximum scour depth using to determine the bed particle thickness (Equation (3)).
  d s m = 1.05 d 0.75
where dsm is the maximum scouring depth and d0.75 represents the particle size for which 75% of the sediment mixture is finer [31]. Thus, using the above equation and the selected 0.05 m diameter for the piles, the maximum scour depth was 11 cm. The bed thickness was assumed to be 20 cm to make sure the scour did not cover the entire thickness of the bed. Also, a grading aggregate test was performed using standard sieve analysis [32] to determine the sand characteristics used in this research and particle size characteristics. Table 2 shows the geometric properties of the sand sampled in this study. Where d50 represents the median sediment size, the uniformity coefficient is obtained from the ratio d60/d10, Dg is the geometric mean size, δg represents the standard geometry deviation, Gr means the coefficient of gradation, and Cu is uniformity coefficient. According to the uniformity coefficient, Cu = 1.133 and d50 = 0.00077 m, the type of bed material was sandy and uniform [32].
Regarding scouring, the size of sediment particles in the bed must ensure that no ripples will form in the bed. According to Chiu and Melvin (1978) and Rudkivi and Ettema (1983), the particle size of the selected sand in this study is suitable for investigating the scour depth [28,30]. Also, Ettema (1980) reported that in shallow currents, scour depth decreases due to the rotation of eddies created at the water surface in the opposite direction of flow [33]. If the flow depth is three times the pile diameter, its effect on scour depth can be neglected. The flow depth was set at 20 cm.

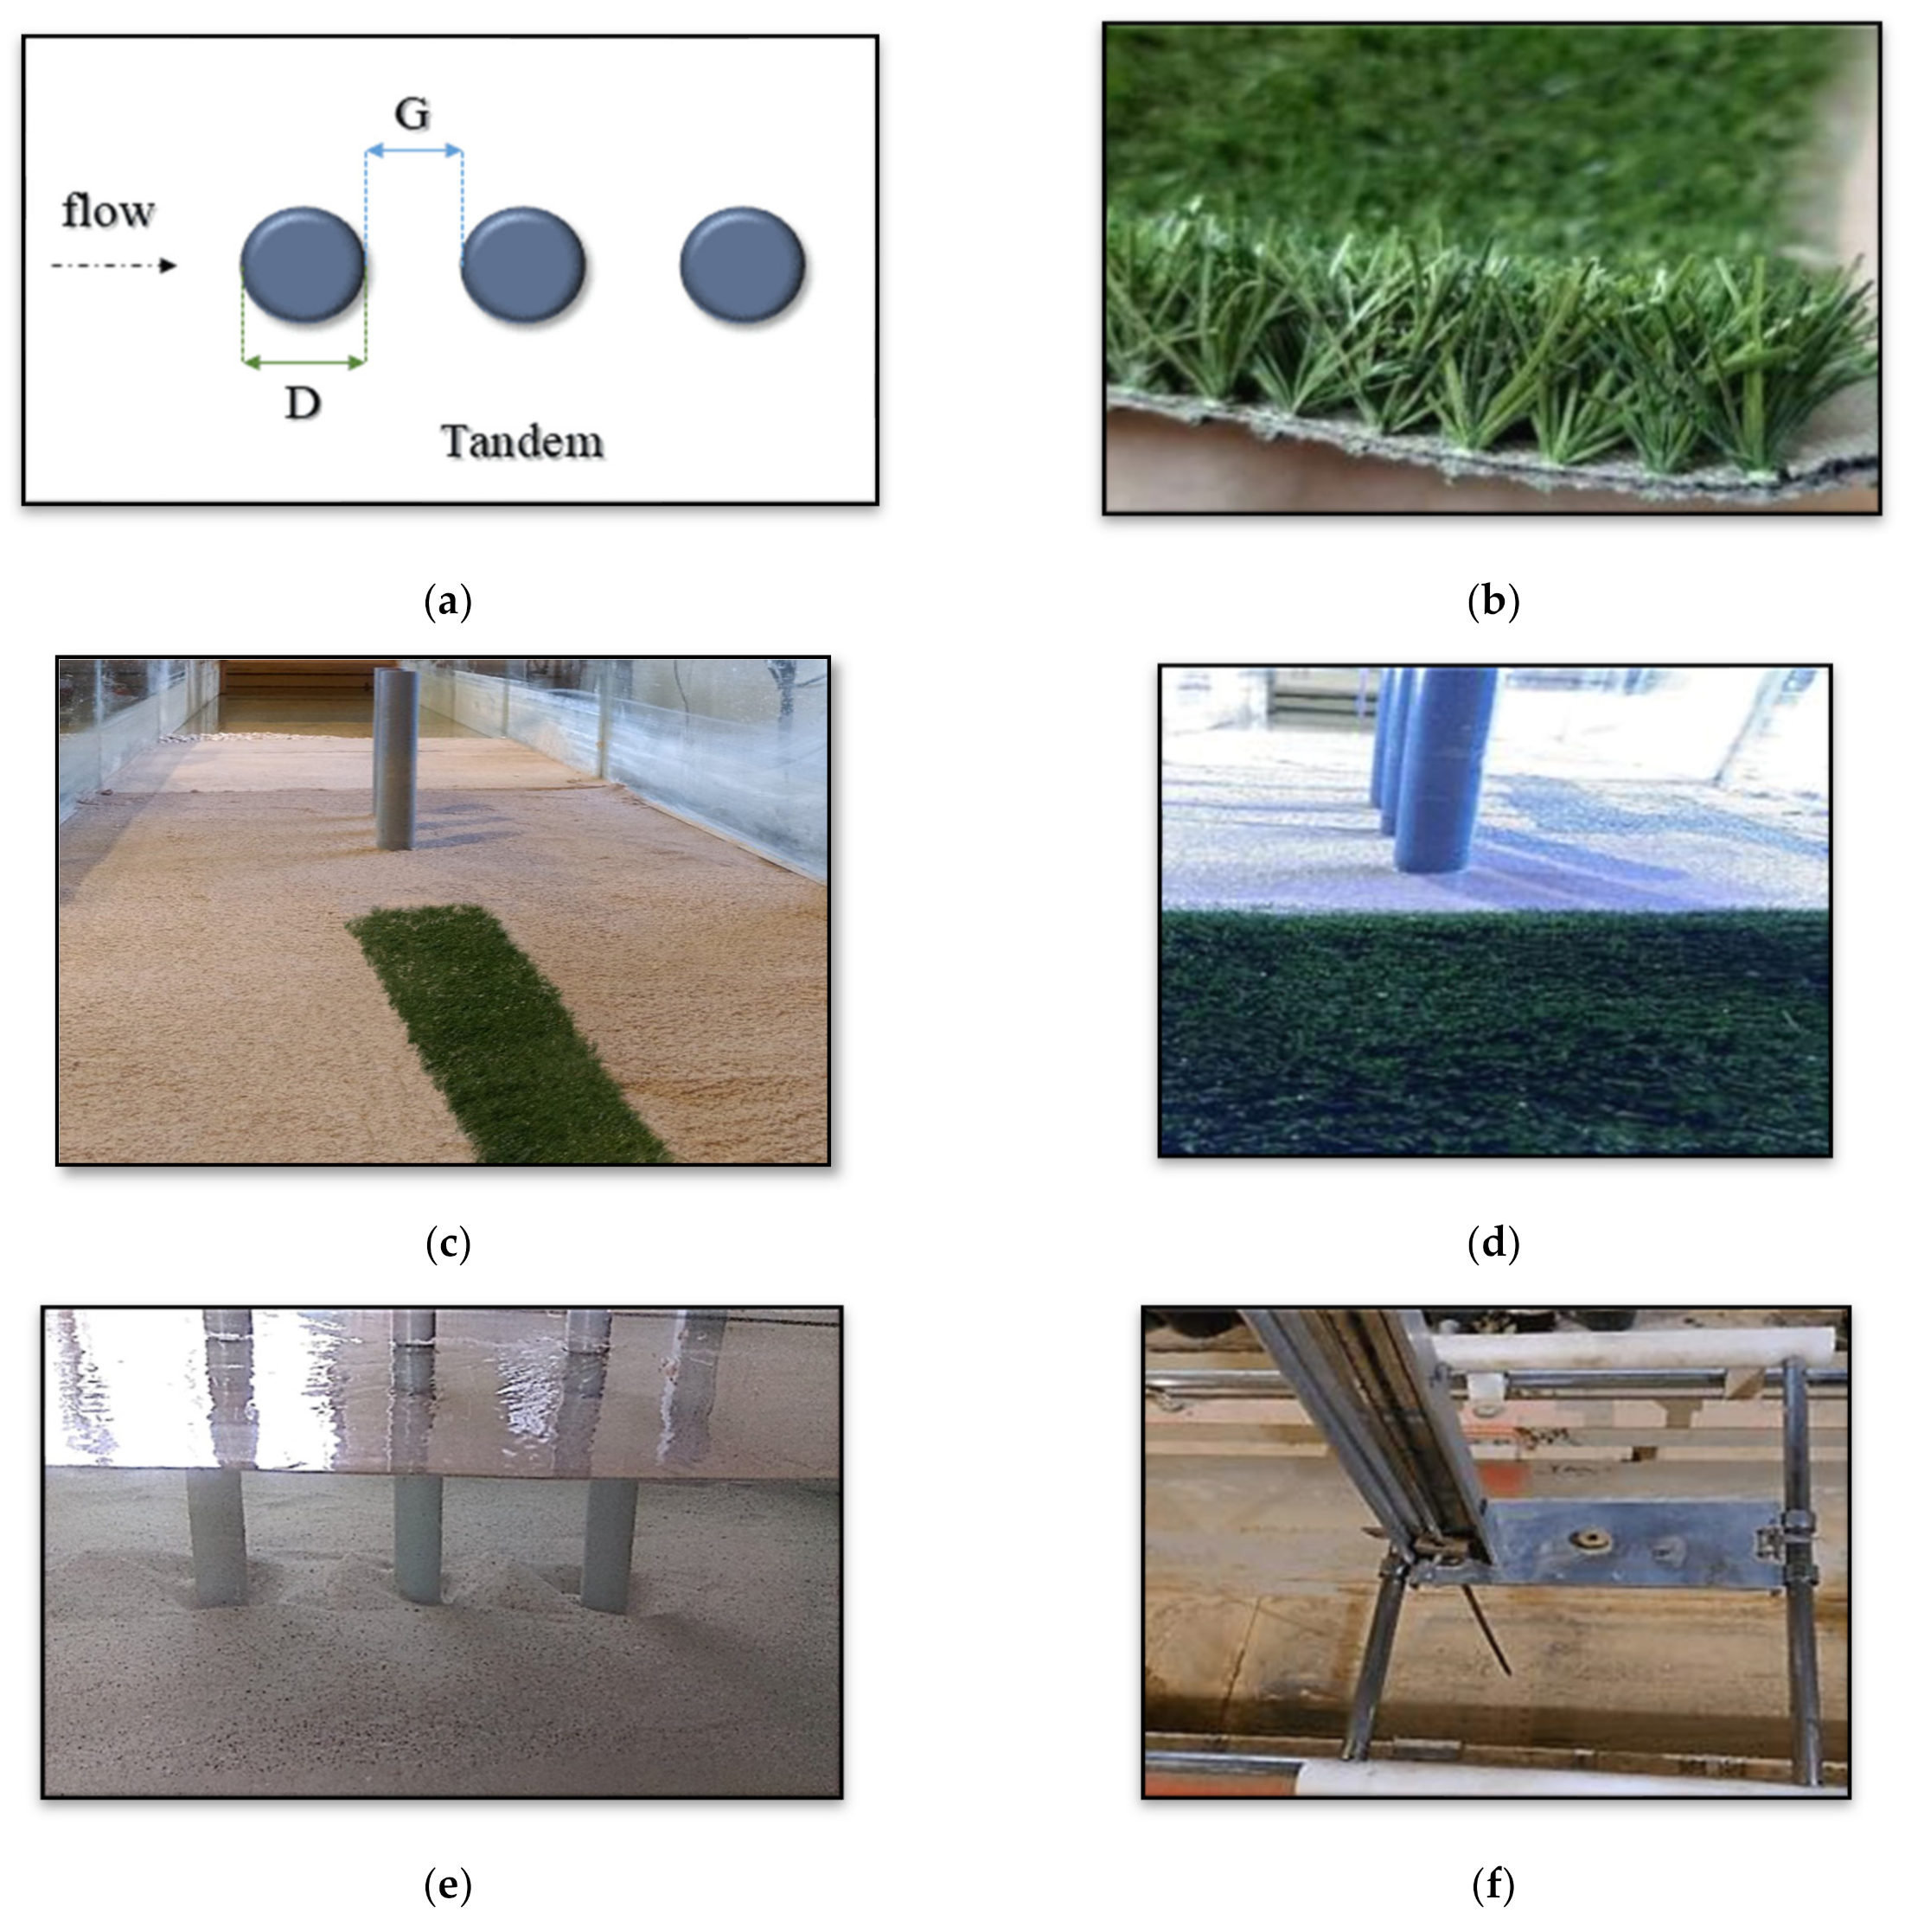
2.4. Vegetation Used to Assess the Efficiency as a Nature-Based Solution

A 1 m long by 2 cm high carpet of flexible artificial grass vegetation was positioned 30 cm upstream from the first bridge pile in the canal center to prevent scouring. This length distance was chosen to ensure that a scour hole had enough space to form. Two different plant widths were tested in this study. B is the canal width, and b is the width of the vegetation carpet. Firstly, there is the overall vegetation covering the canal width, and secondly, there is patchy vegetation with a 10 cm width situated in the center. The Vo symbol was utilized for overall vegetation, the Vp symbol was used for patched vegetation, and the phrase free was used for vegetation-free experiments. From Figure 4b–d, it can be observed the location of the vegetation and the type of plant used. Two different vegetation heights of 2 cm and 0.5 cm were used. Also, vegetation density varied in two values of 100% and 50%.

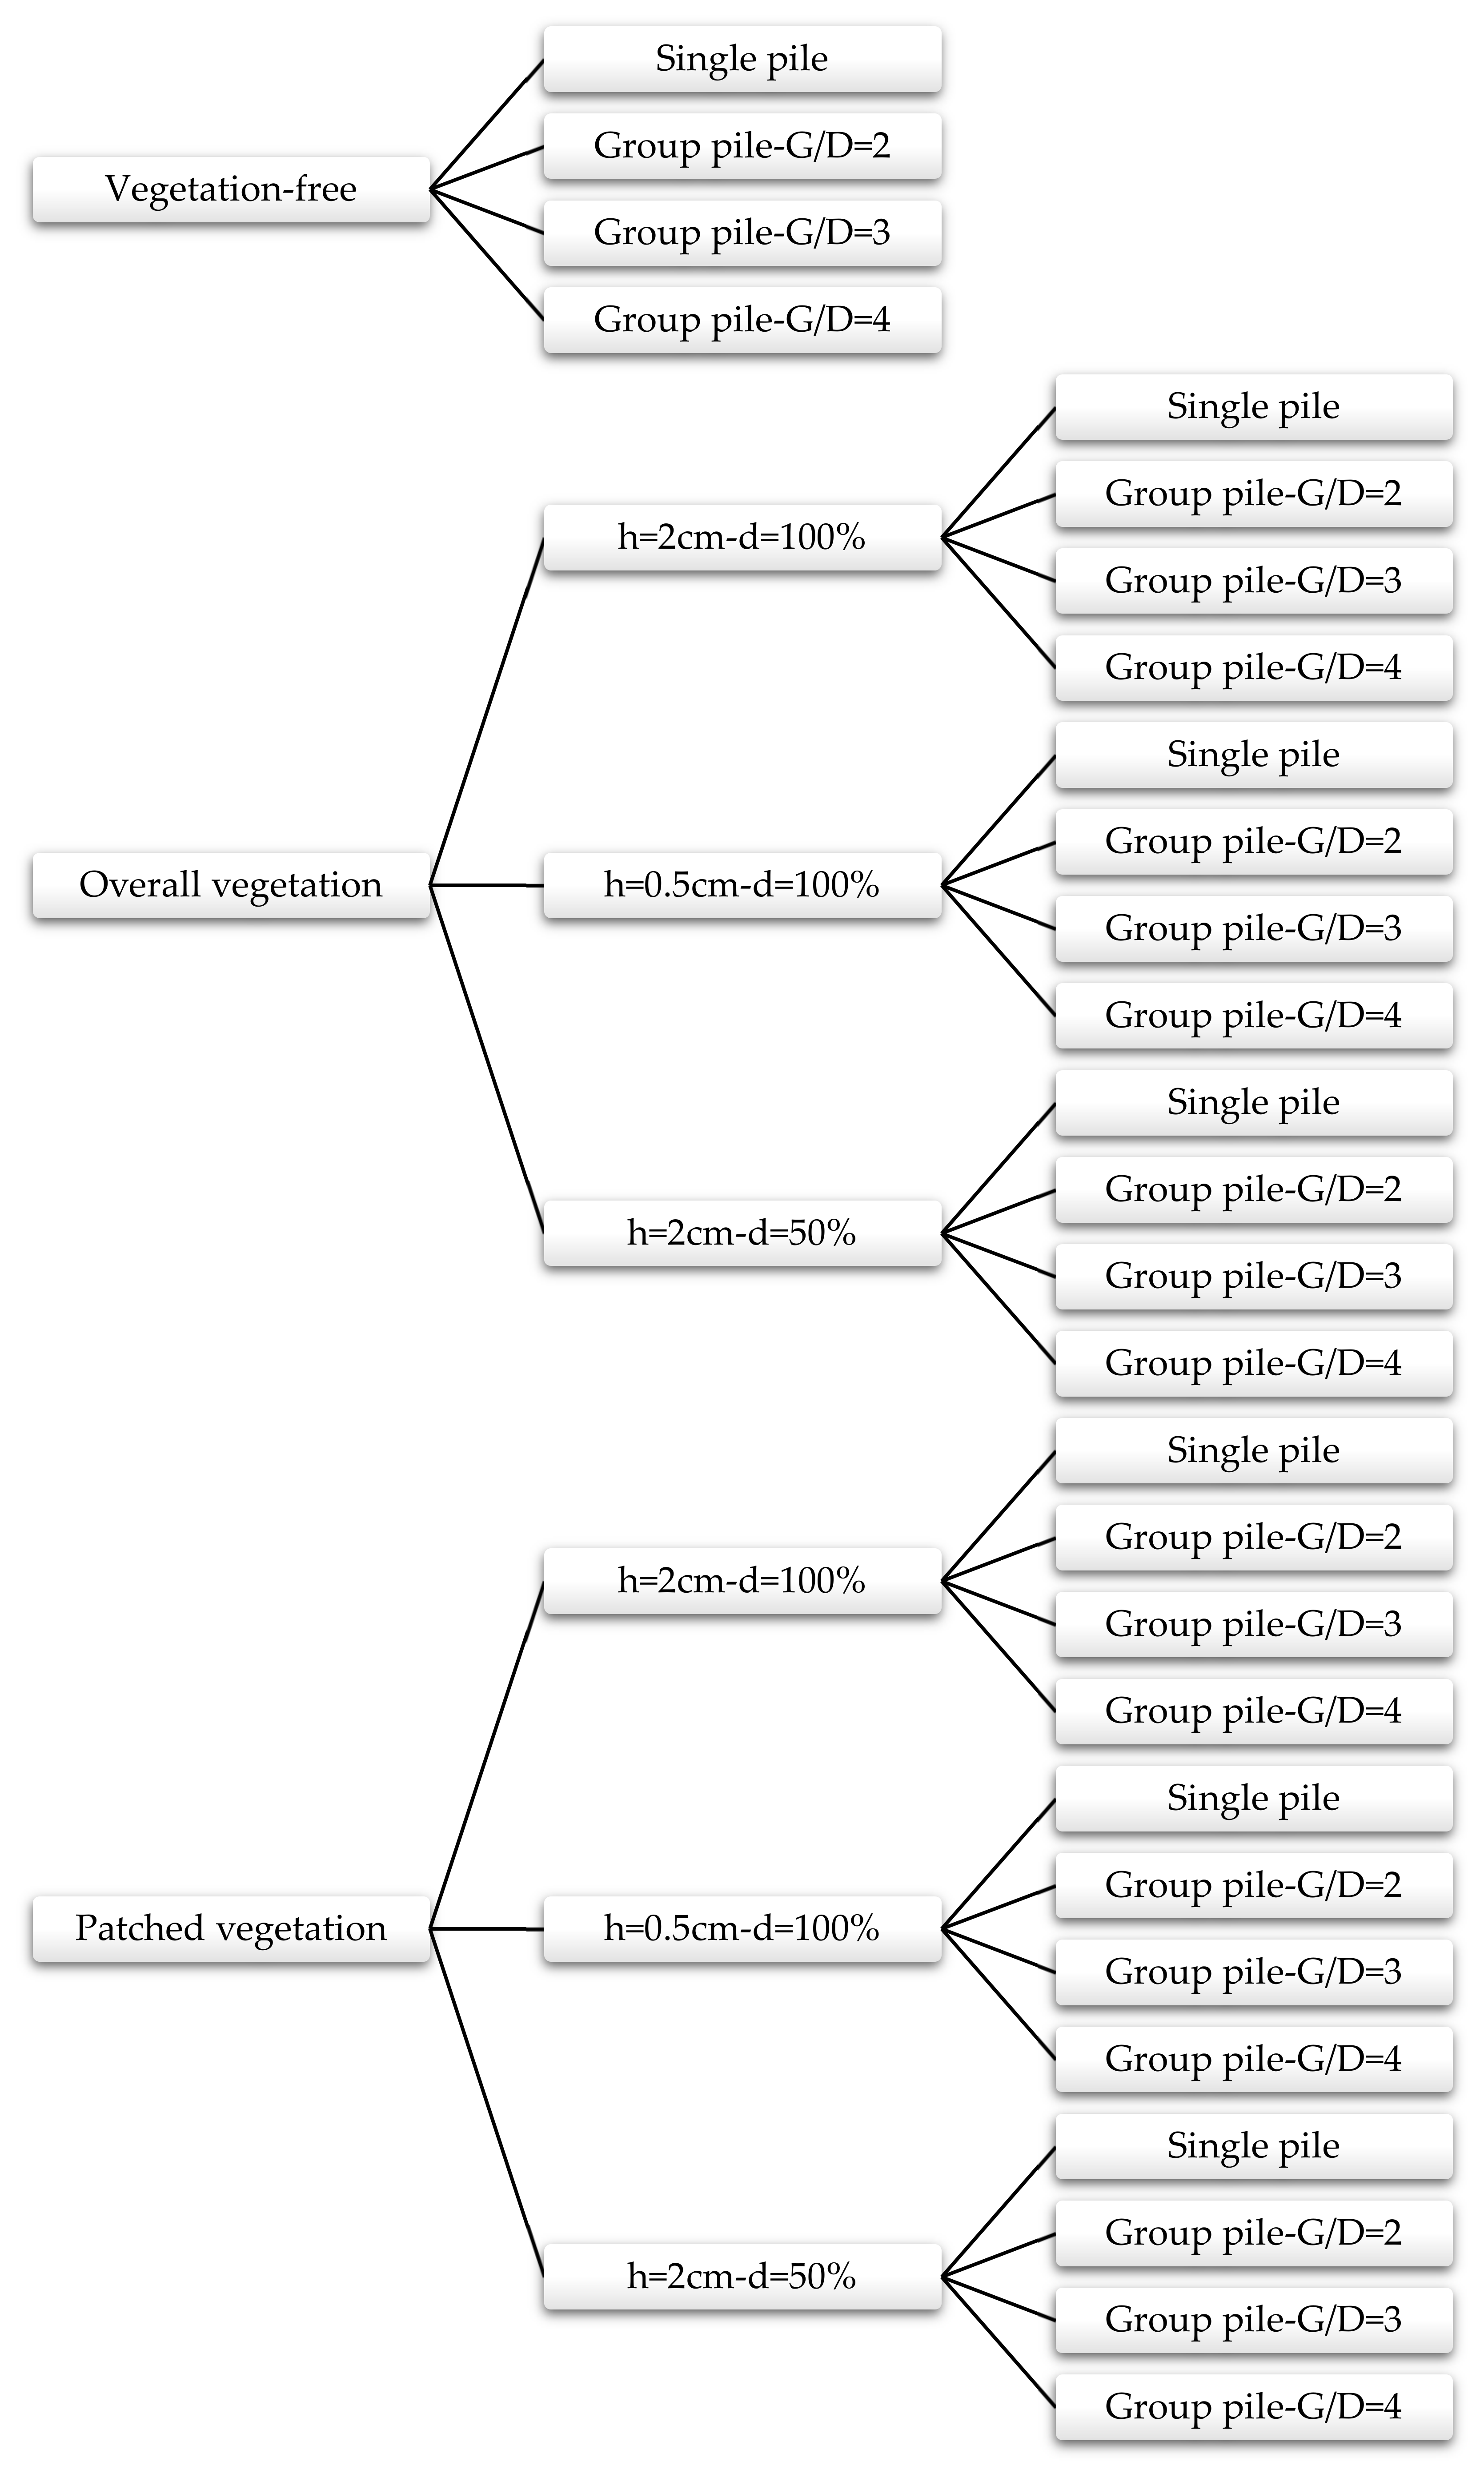
2.5. Experiment Design

Local scouring under clear water conditions occurs when u/u* < 1. It means that bed materials upstream are constant in their place and u/u* < 1. However, when it is u/u* > 1, the water contains sediment particles. As the purpose of this study was to determine the maximum scour depth in clear water conditions, the hydraulic conditions of the stream determined were close to the threshold of particle motion. The shields diagram was used to determine the starting point of the bed particle motion [34]. An appropriate hydraulic condition was achieved with a maximum flow depth of 20 cm and a discharge rate of 36 L per second. The experiments were performed according to Figure 5. To ensure the accuracy of the data collection process and minimize measurement error, the first experiment (vegetation-free for triple pile group with 3D distance) was repeated twice, and the results of both experiments were consistent.
Three phases of data were collected for each experimental series. First, the temporal changes in scour depth were measured upstream of each pile (at two-second intervals at the beginning of the experiment and two-hour intervals at the end of the experiment), and second, the scour hole dimensions and scouring balance depth were measured at the end of each experiment. Third, the flow velocity was measured at several points upstream and behind the piles along the central axis of the channel.
An Acoustic Doppler Velocimeters (ADV), developed by NORTEK (Rud, Norway), was used to measure the instantaneous three-dimensional velocity components. A sampling frequency of 200 Hz was used to keep the Doppler noise energy level of the signal as low as possible. In addition, it was carried out in a sampling volume of 5.5 mm3. Each measurement point was measured for 120 s, resulting in 24,000 instantaneous velocity measurements. Ideally, ADV measurements should be made in 70–100% correlation. The signal-to-noise ratio (SNR) indicates the strength of the signal received compared to the noise received by the receiver. The amount of correlation indicates the presence of fine particles in the water that scatter sound. The device cannot measure velocity if the water is very clear and smooth, as the signal returned to the receivers is weaker than the noise. Also, the minimum SNR should be 5 or 15 decibels. WinADV software (NORTEK, Rud, Norway) is used to filter the data measured by ADV.
A limnimeter with an accuracy of 1 mm was used to measure the scour hole profile. This limnimeter was placed on a frame with four support points on the upper edge of the channel. Its longitudinal movement was provided by moving the frame on two parallel rails above the canal walls. Two parallel bars were attached to the frame body for its transverse movement. In this way, the limnimeter could move in two directions perpendicular to each other and easily measure the scour profile.

3. Results and Discussion
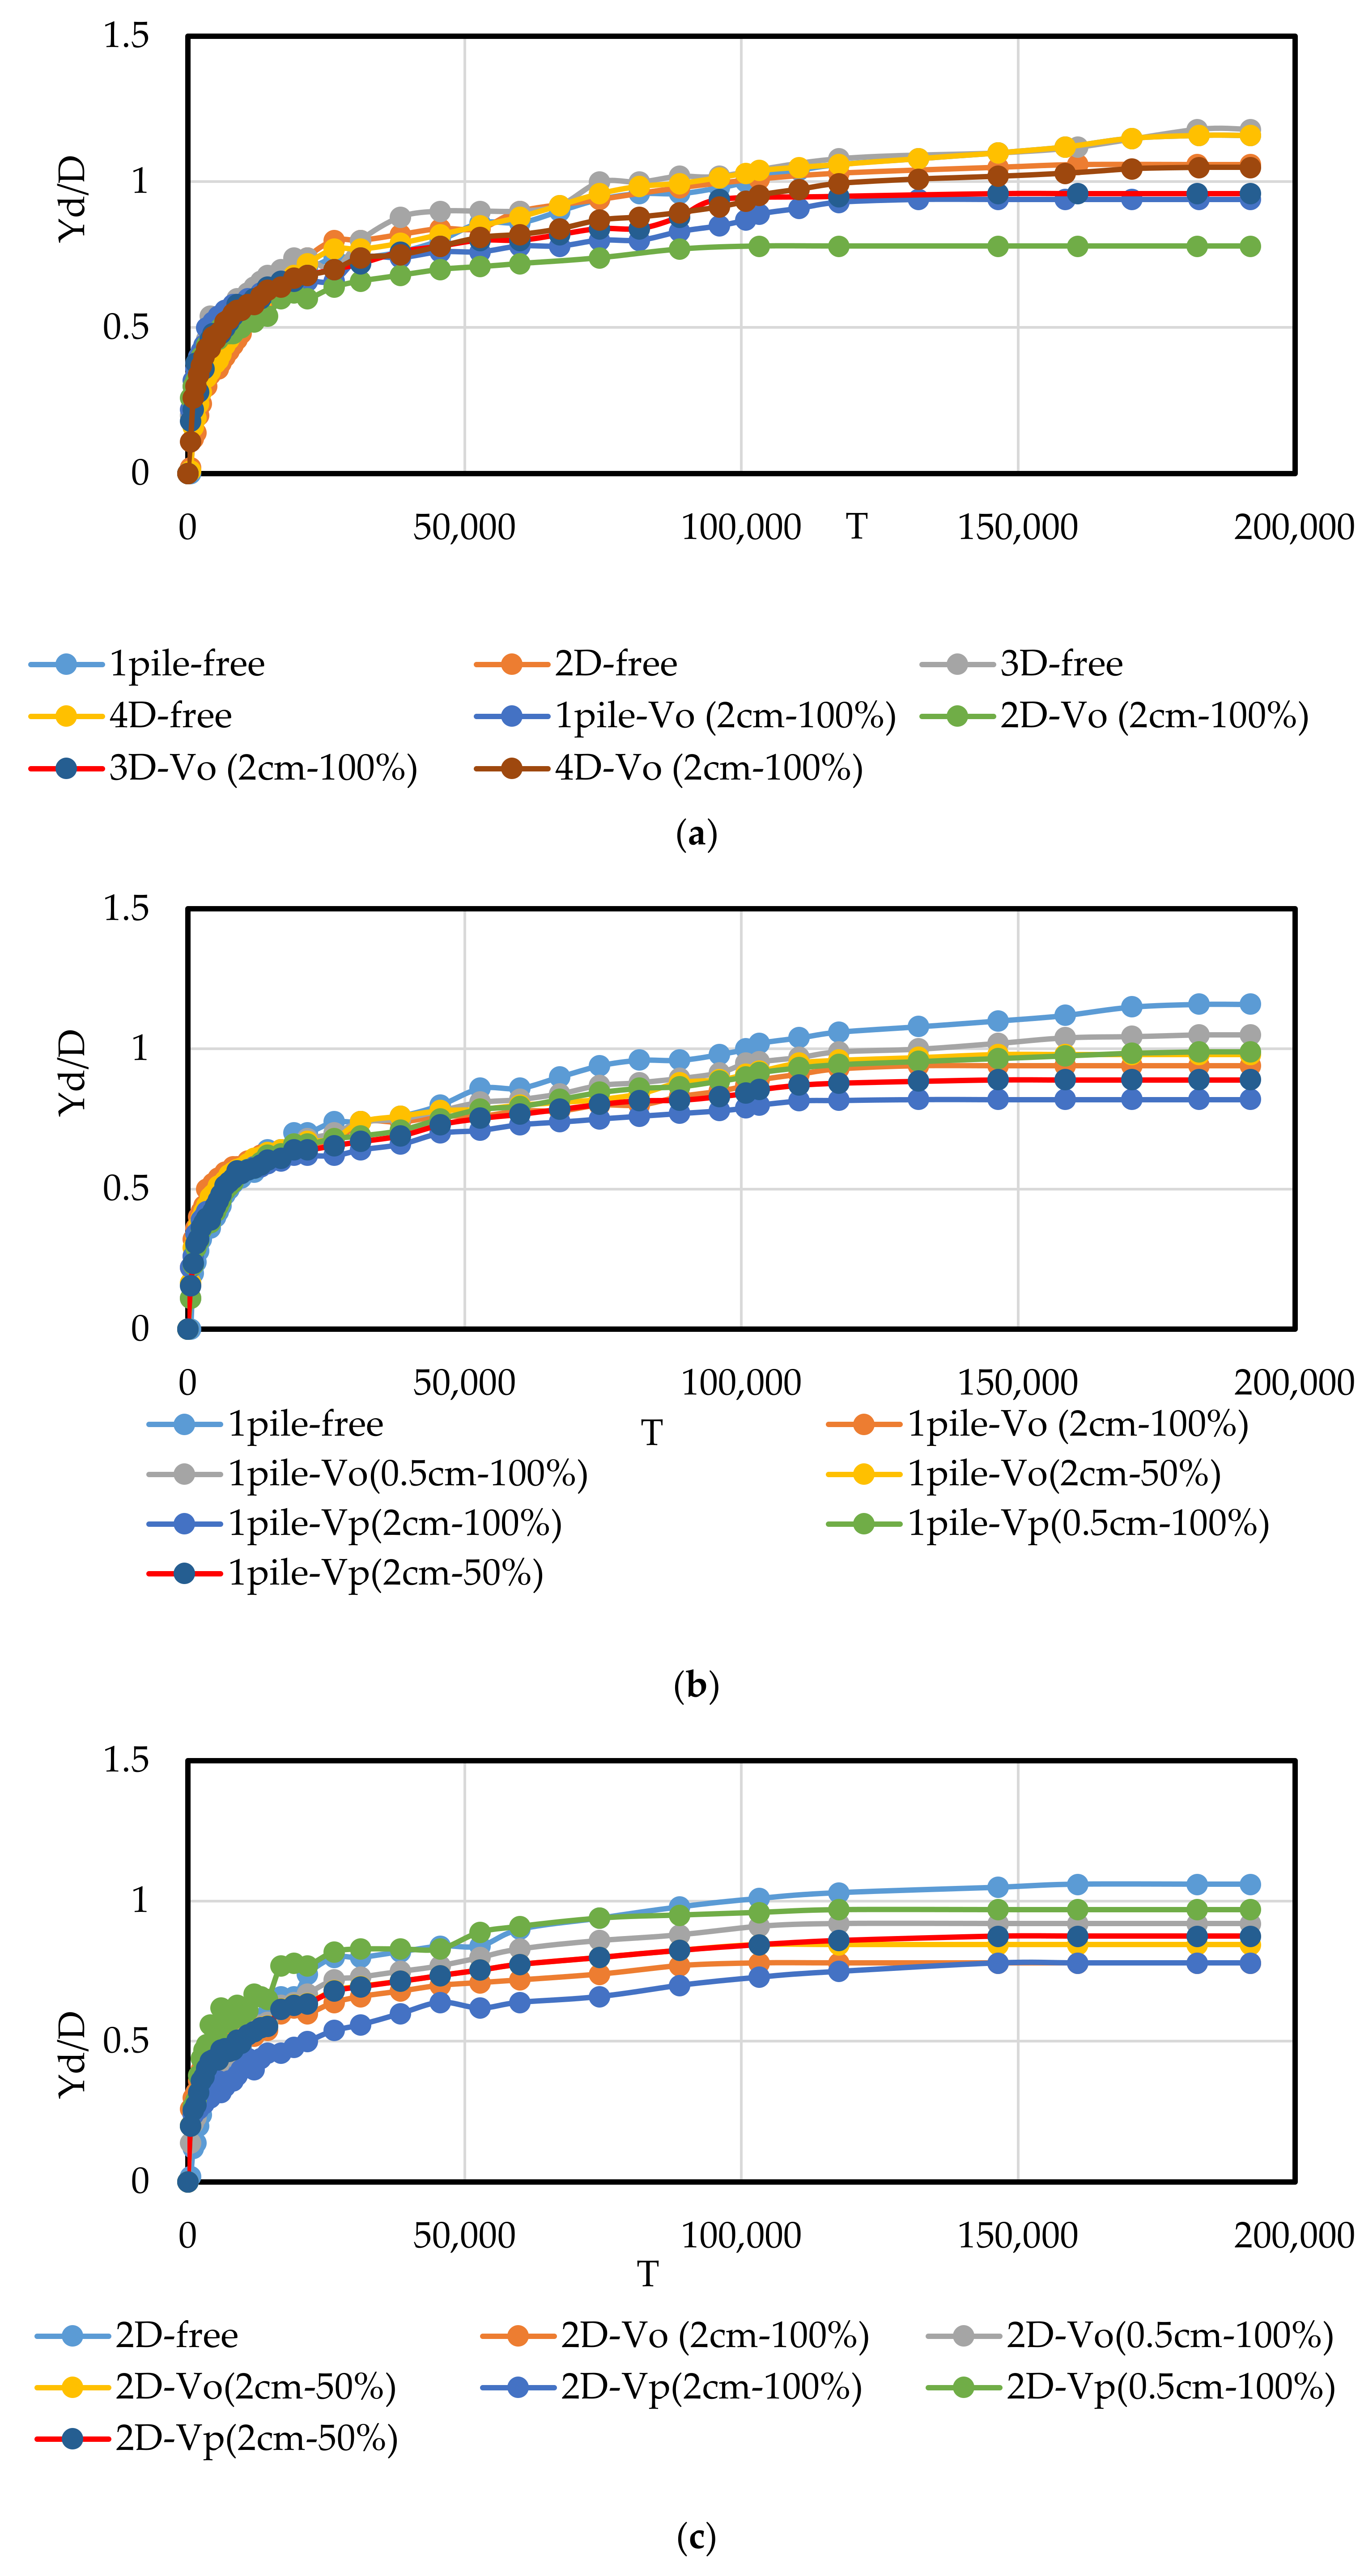
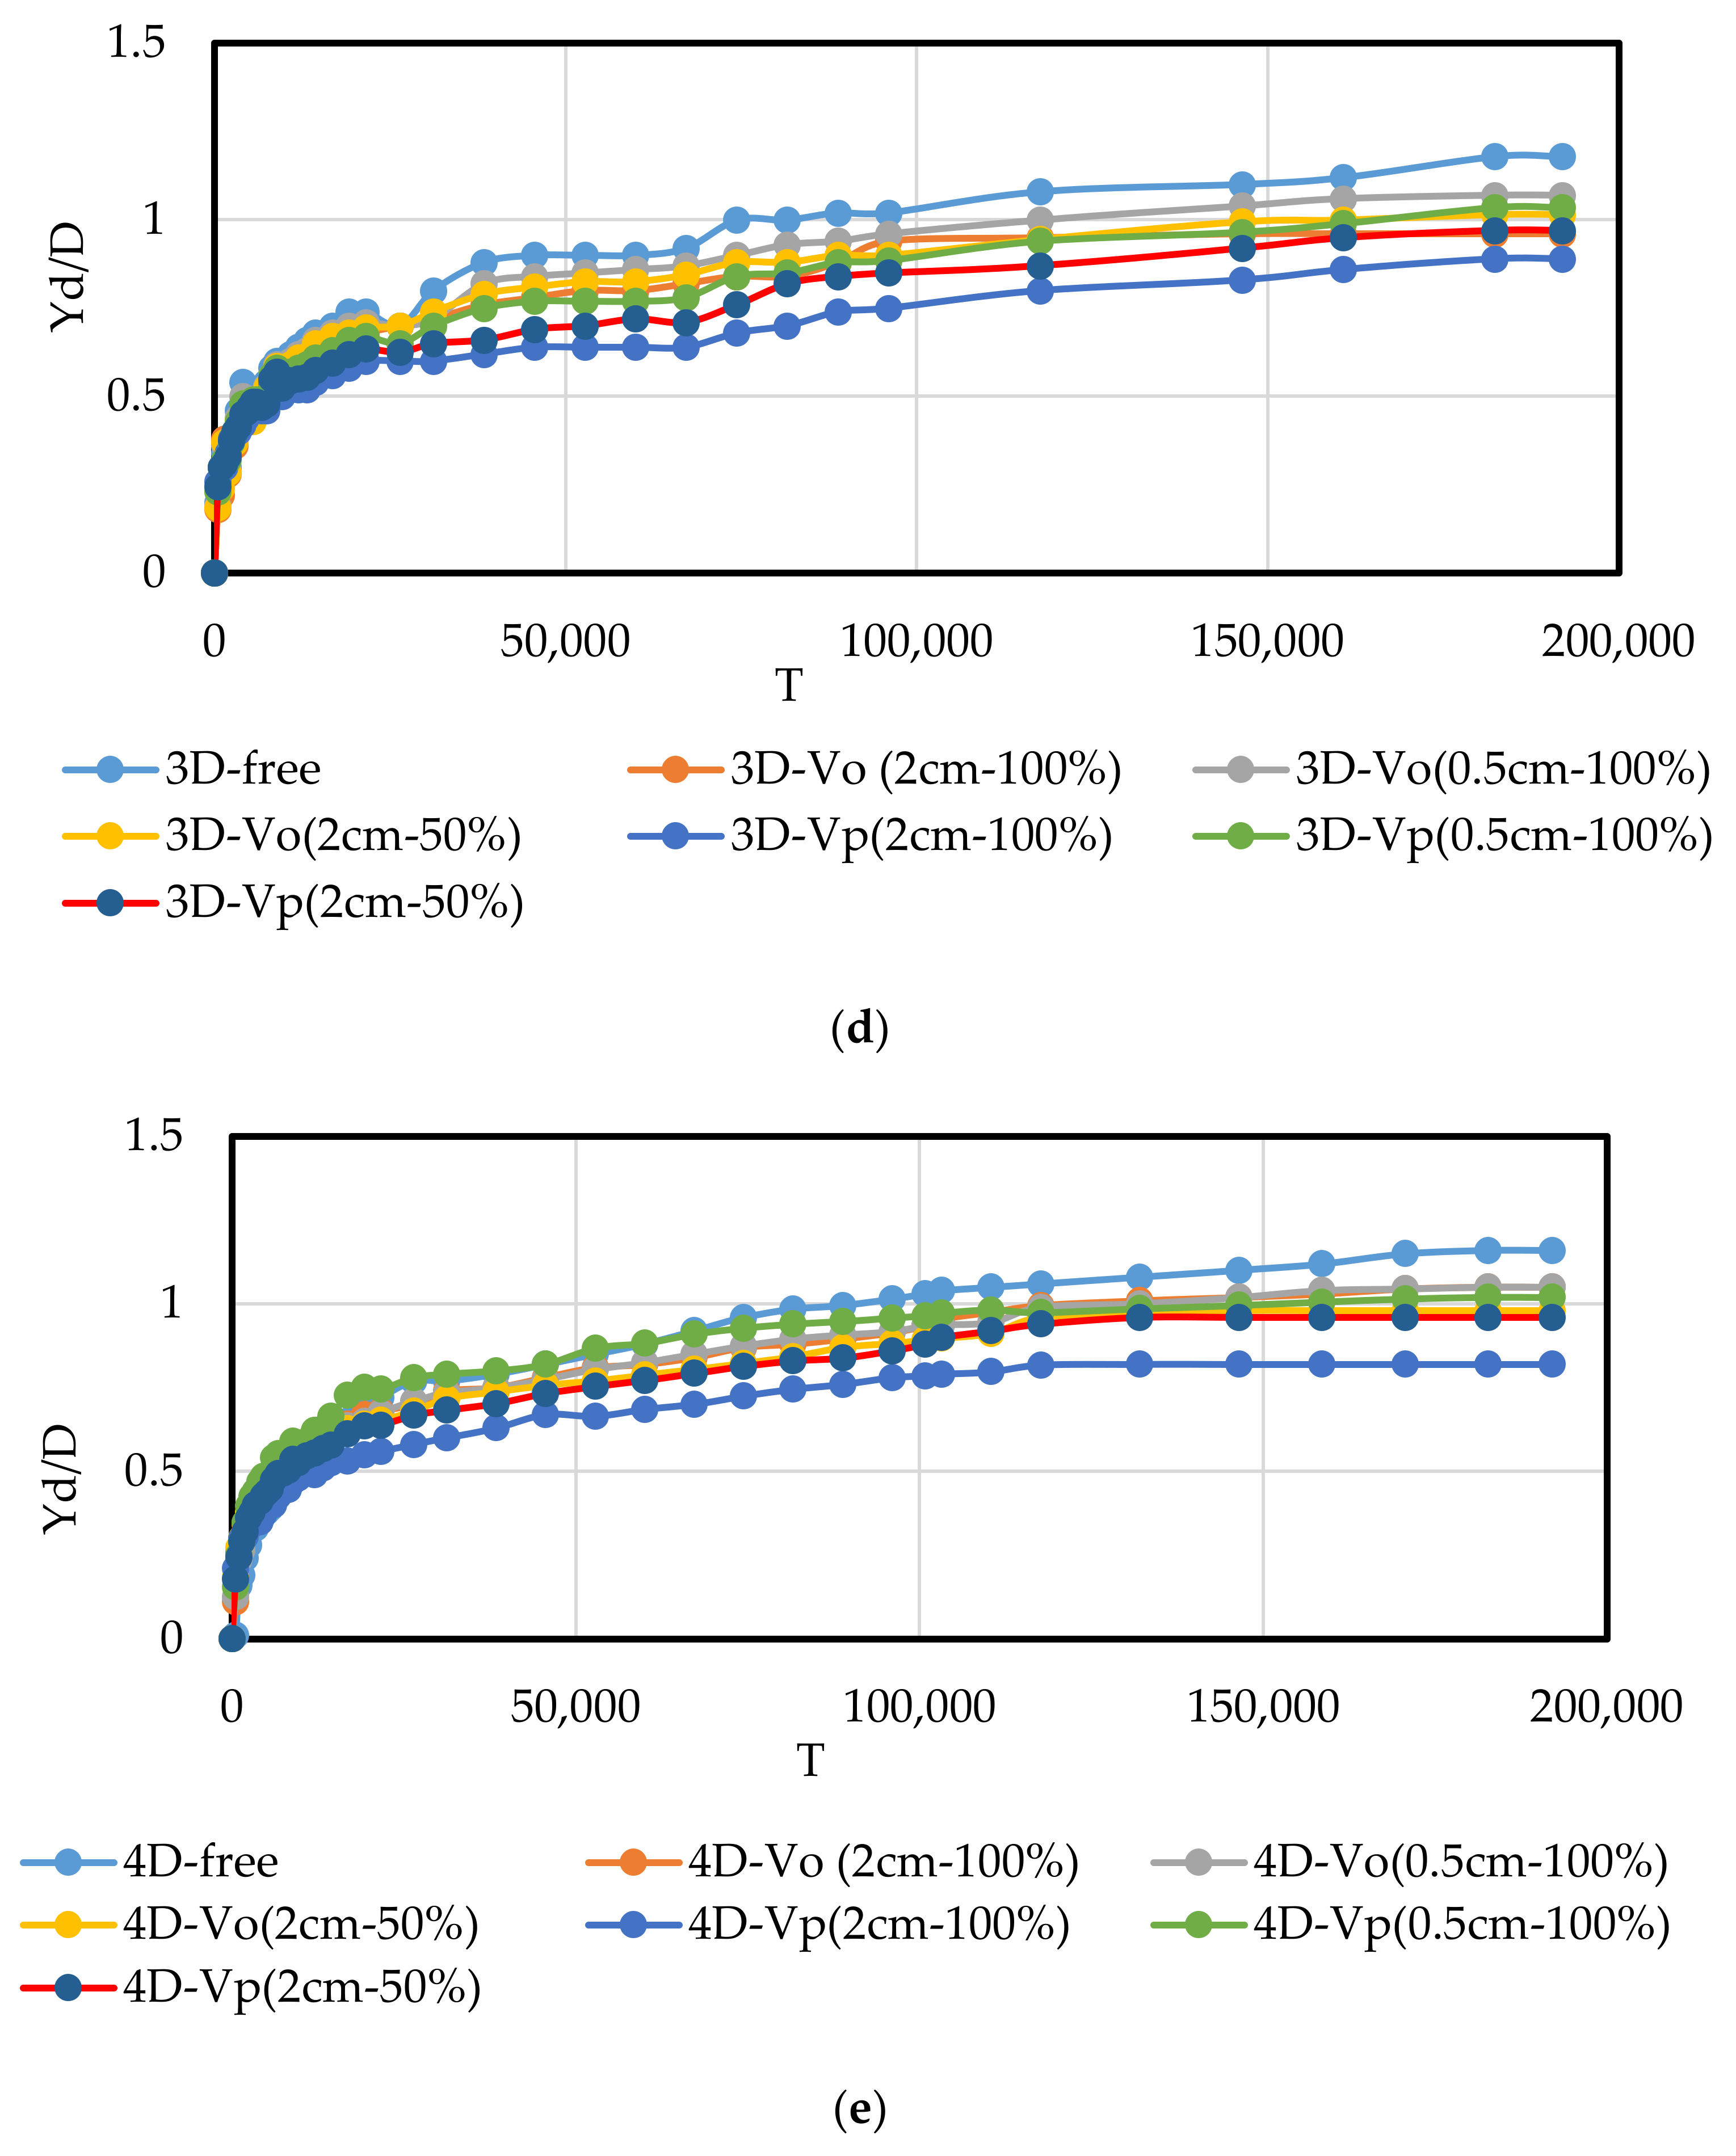
3.1. Scour Depth

While numerous studies have been conducted on scouring reduction strategies, no study has been performed on the use of vegetation upstream of bridge pile groups to reduce the scour depth in the available resources. This study utilized vegetation upstream of single and multiple piles to reduce scour at the bridge. Analysis of the experimental results of this study revealed that the vegetation upstream of the bridge pile is an influential factor in reducing scour.
After preparing the bed and setting up appropriate hydraulic conditions, the amount of scour was measured every 2 s at the beginning and every 1.5 h after the end of the experiment. The measured points were closest to the upstream of the single pile and each pile in the triple pile group. Figure 6 shows the temporal evolution of the scour hole. This figure illustrates Yd as the scour depth upstream of the first pile at moment t, D as the pile diameter, and T as the dimensionless time. T is determined by following the relationship of Pagliara and Carnacina [35] in Equation (4).
T = h U t h D  
where U (m/s) and h (m) are the velocity and depth of the water upstream of the bridge pile. The units of t are “s” and the D is “m”.
The fastest temporal development and the lowest scour depth were observed in the case of a triple pile group with a distance between the piles of 10 cm (G/D = 2) in the presence of overall vegetation. Then, in the presence of overall vegetation, the single pile, G/D = 3 and G/D = 4, respectively, are in the next velocity ranks at the time of scouring hole development. In single pile and group piles, 90% of the scouring depth occurred in 250 to 280 s in vegetation-free conditions, 110 to 130 s for patches of vegetation with 2 cm height and 100% density, and 160 to 200 s if the overall vegetation with 2 cm height and 100% density was used. Therefore, the presence of vegetation in the flow path helps accelerate the scour hole’s temporal development.
Increasing the height of vegetation from 0.5 cm to 2 cm had a significant effect on accelerating the balance of the hole and reducing the amount of scouring. Also, the overall and patched vegetation diagrams with 50% density are closer to the vegetation diagrams with 100% density. Therefore, increasing the height of vegetation is more effective than raising the density in reducing the scour rate and accelerating the parameter scouring balance as other authors considered at the hillslope scale in other natural areas Liu et al., Zhang et al., and Kateb et al. [36,37,38] According to Kumar’s criteria, the equilibrium time was specified when the scour depth modifications were less than 1 mm over three consecutive hours [16]. Table 3 indicates the equilibrium time (te) and depth (Ye) for each experimental case. Over time te, the scour hole reaches balance. This stage is the equilibrium stage, in which particles can only move inside the scouring hole so that particles with a rolling motion cannot escape from the scouring hole. The movement of particles may cease at this stage, depending on the flow conditions. In the absence of vegetation, the equilibrium time was 800 min for a single pile and 760 min for the pile group in all three distances studied. Due to the presence of vegetation in the flow path, equilibrium time was reduced in all cases. The highest decrease in equilibrium time was in the case of G/D = 2, where it decreased by about 2.5 times.
In the vegetation-free case, the single bridge pile had the highest scouring rate (most critical condition). However, the triple pile group (G/D = 2) had the most significant reduction in scouring compared to the critical condition, with 22.6%. The cases of G/D = 3 and G/D = 4 showed a decrease of 9.3 and 4.6%, respectively, compared to the most critical case. As compared to the most critical state (1 pile, vegetation-free), scouring for a single-pile case and triple-pile cases with 2D, 3D, and 4D intervals with overall vegetation type 1 (2 cm-100%) decreased by 28, 40, 26, and 20%, and for patched vegetation type 1 (2 cm-100%), decreased by 37, 40, 31, and 23%. The scour depth was reduced by using vegetation with various heights, densities, and widths in the flow path.
Comparing the single pile with no vegetation, there was a 28 and 37% reduction in scour rate for overall and patched vegetation, respectively. For the triple pile group with G/D = 2, overall and patched vegetation decreased respectively by 27 and 27%, 19 and 24 for G/D = 3, and 15 and 19% for G/D = 4.
The results show that increasing the height and density of vegetation causes a further decrease in scour depth. In addition, higher vegetation was more effective than denser vegetation. This is also the consequence of using plants with longer roots and consolidated soils after years of growth as other authors also found in young plantations under natural conditions [39]. According to the results of the scour depth section, it was found that the highest scoring rate for each of the single-pile and pile group conditions occurred in the vegetation-free cases, and the lowest scour rate occurred at the highest altitude and highest density studied in this study. Therefore, the flow structure was analyzed for the most and least scour conditions.

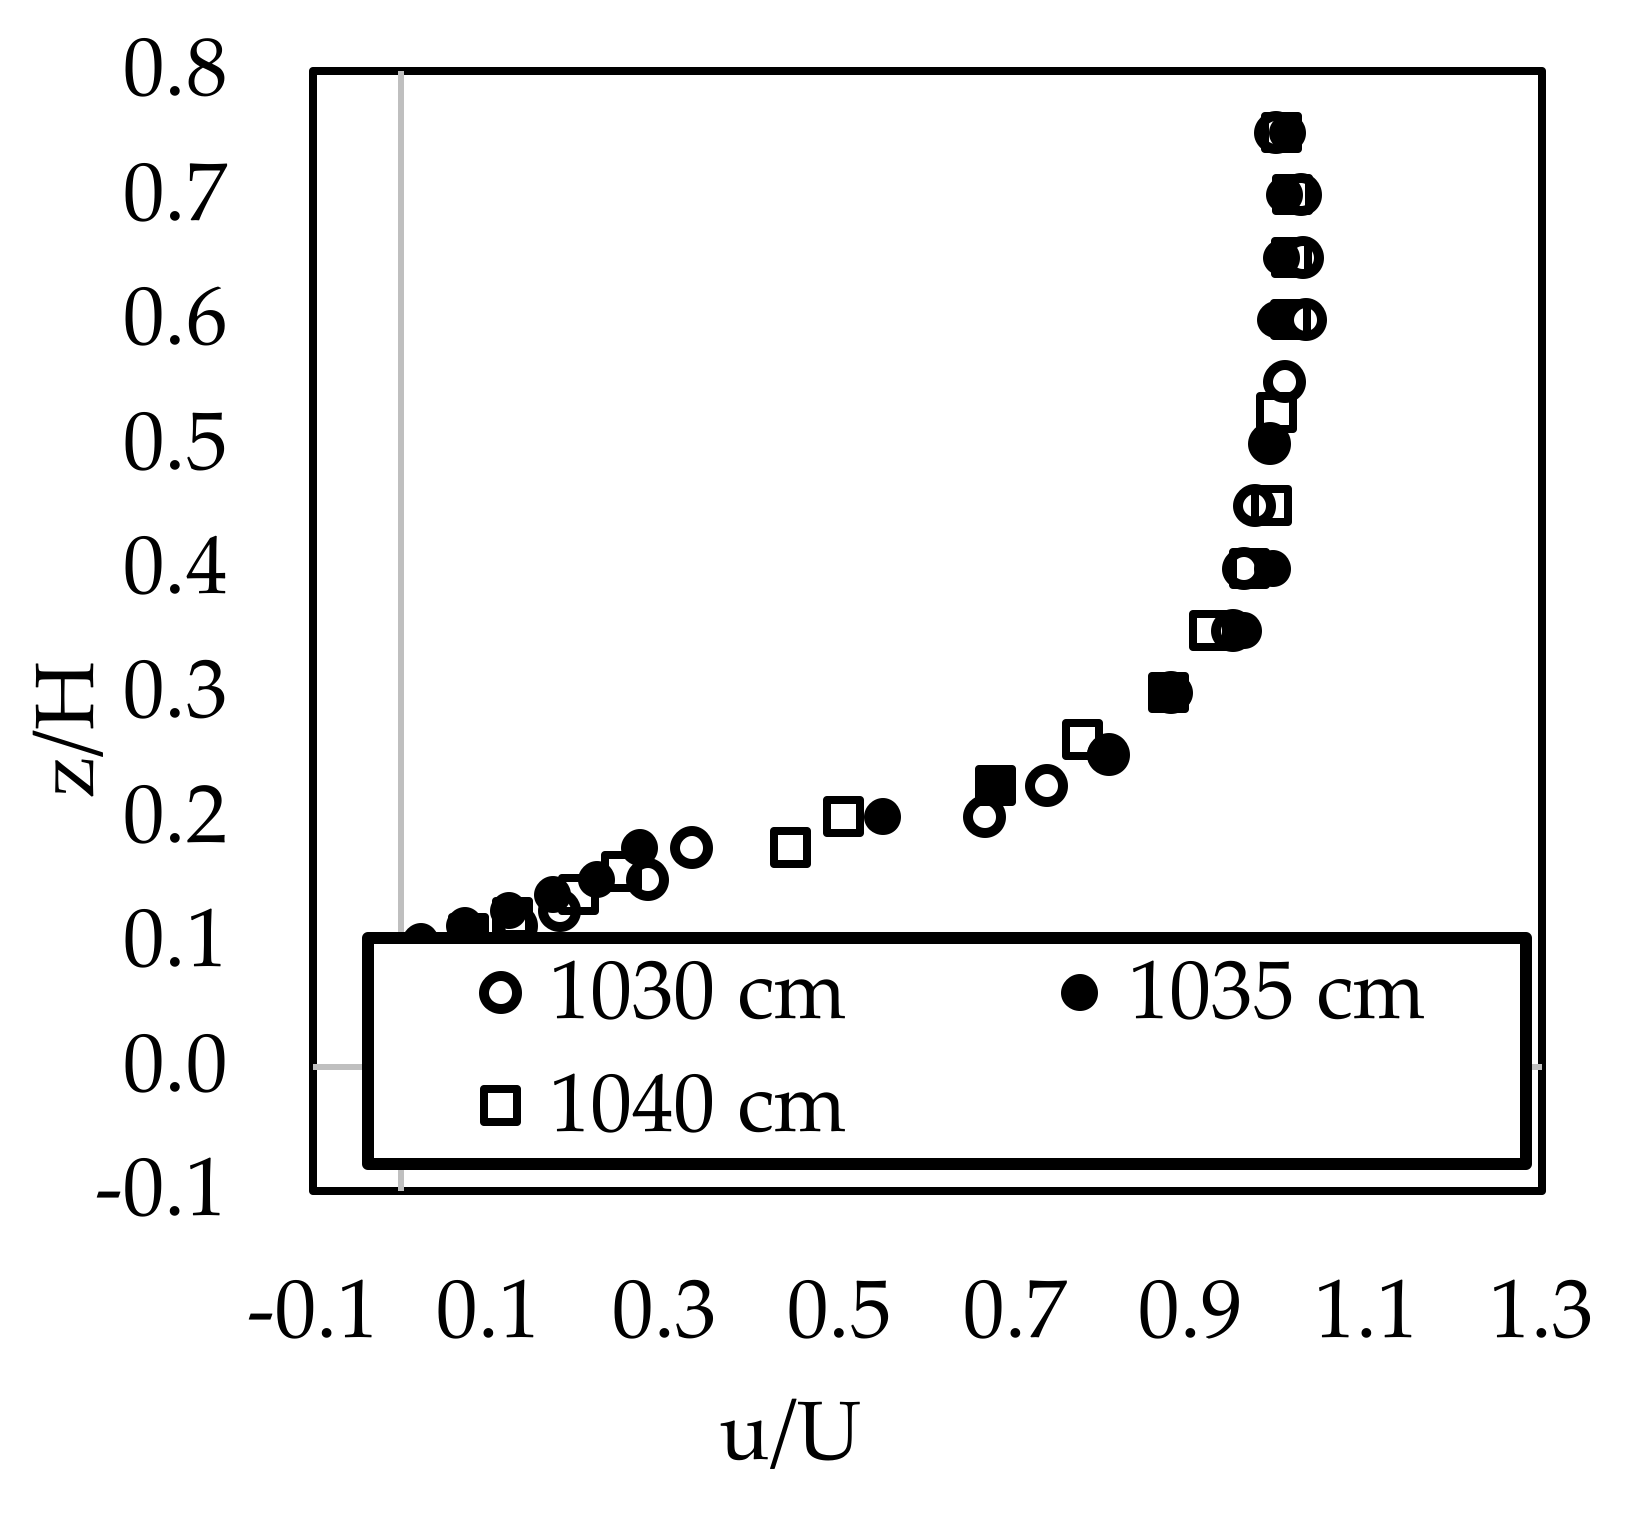
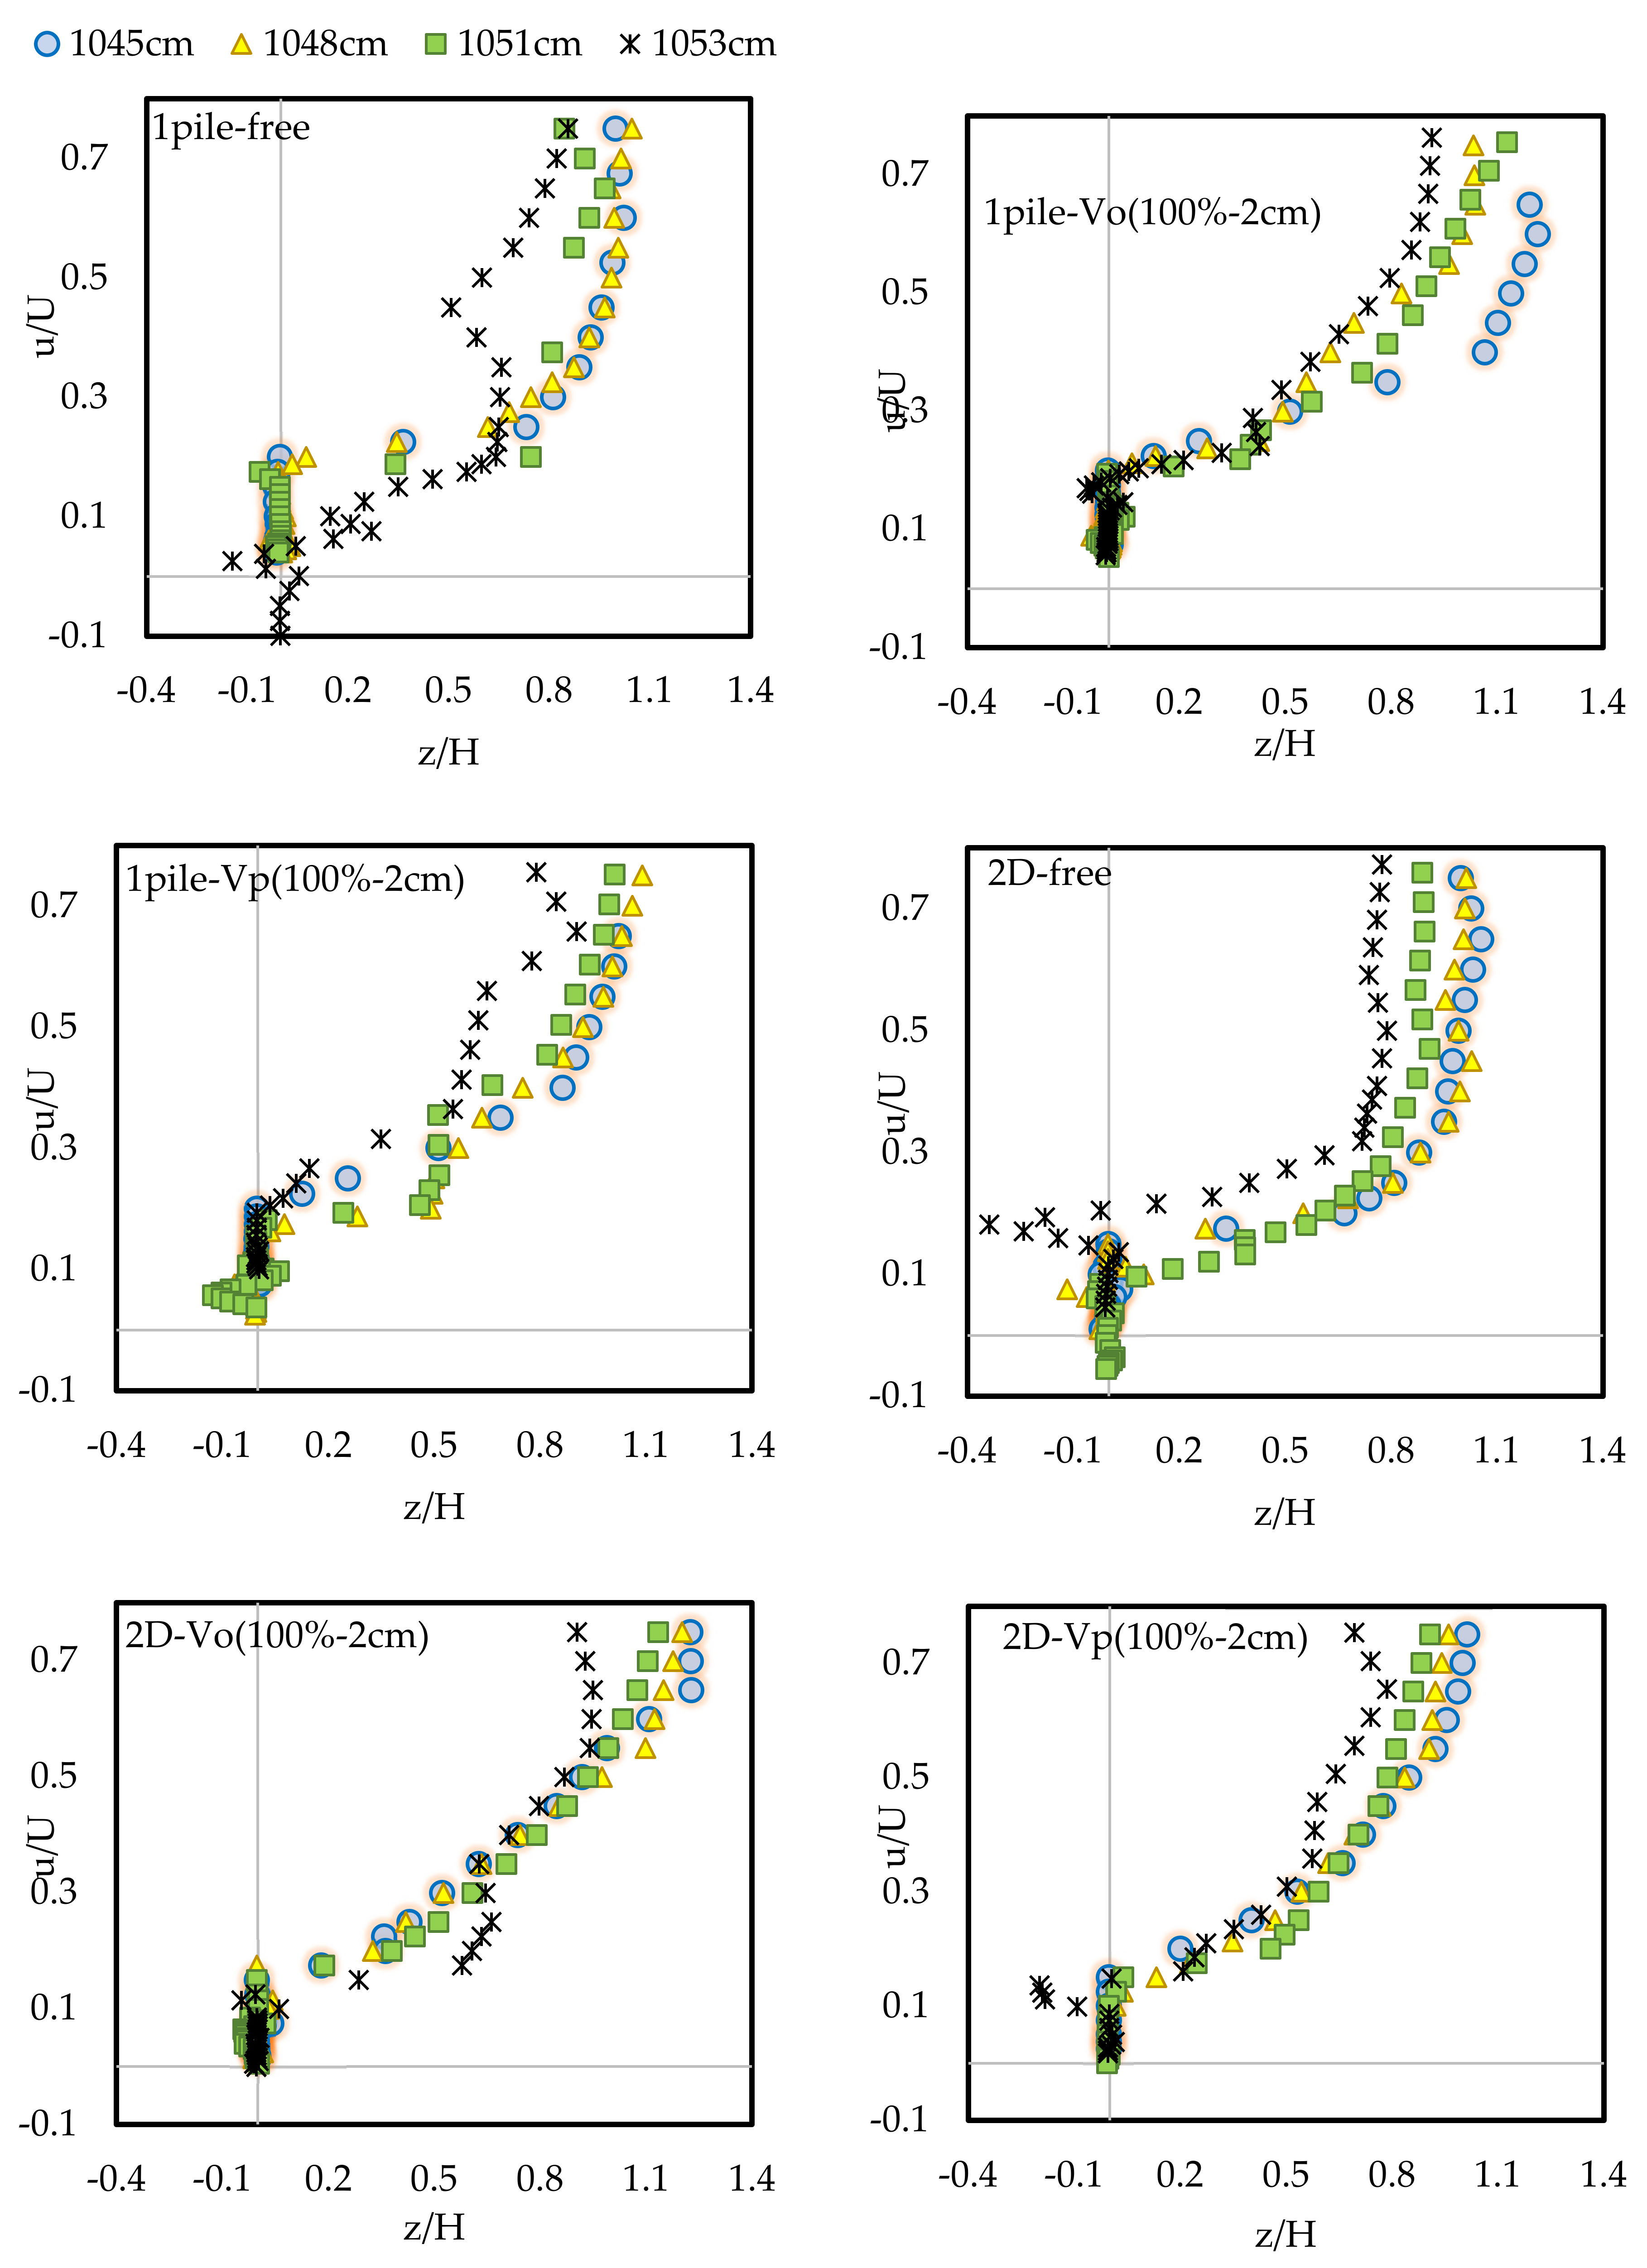
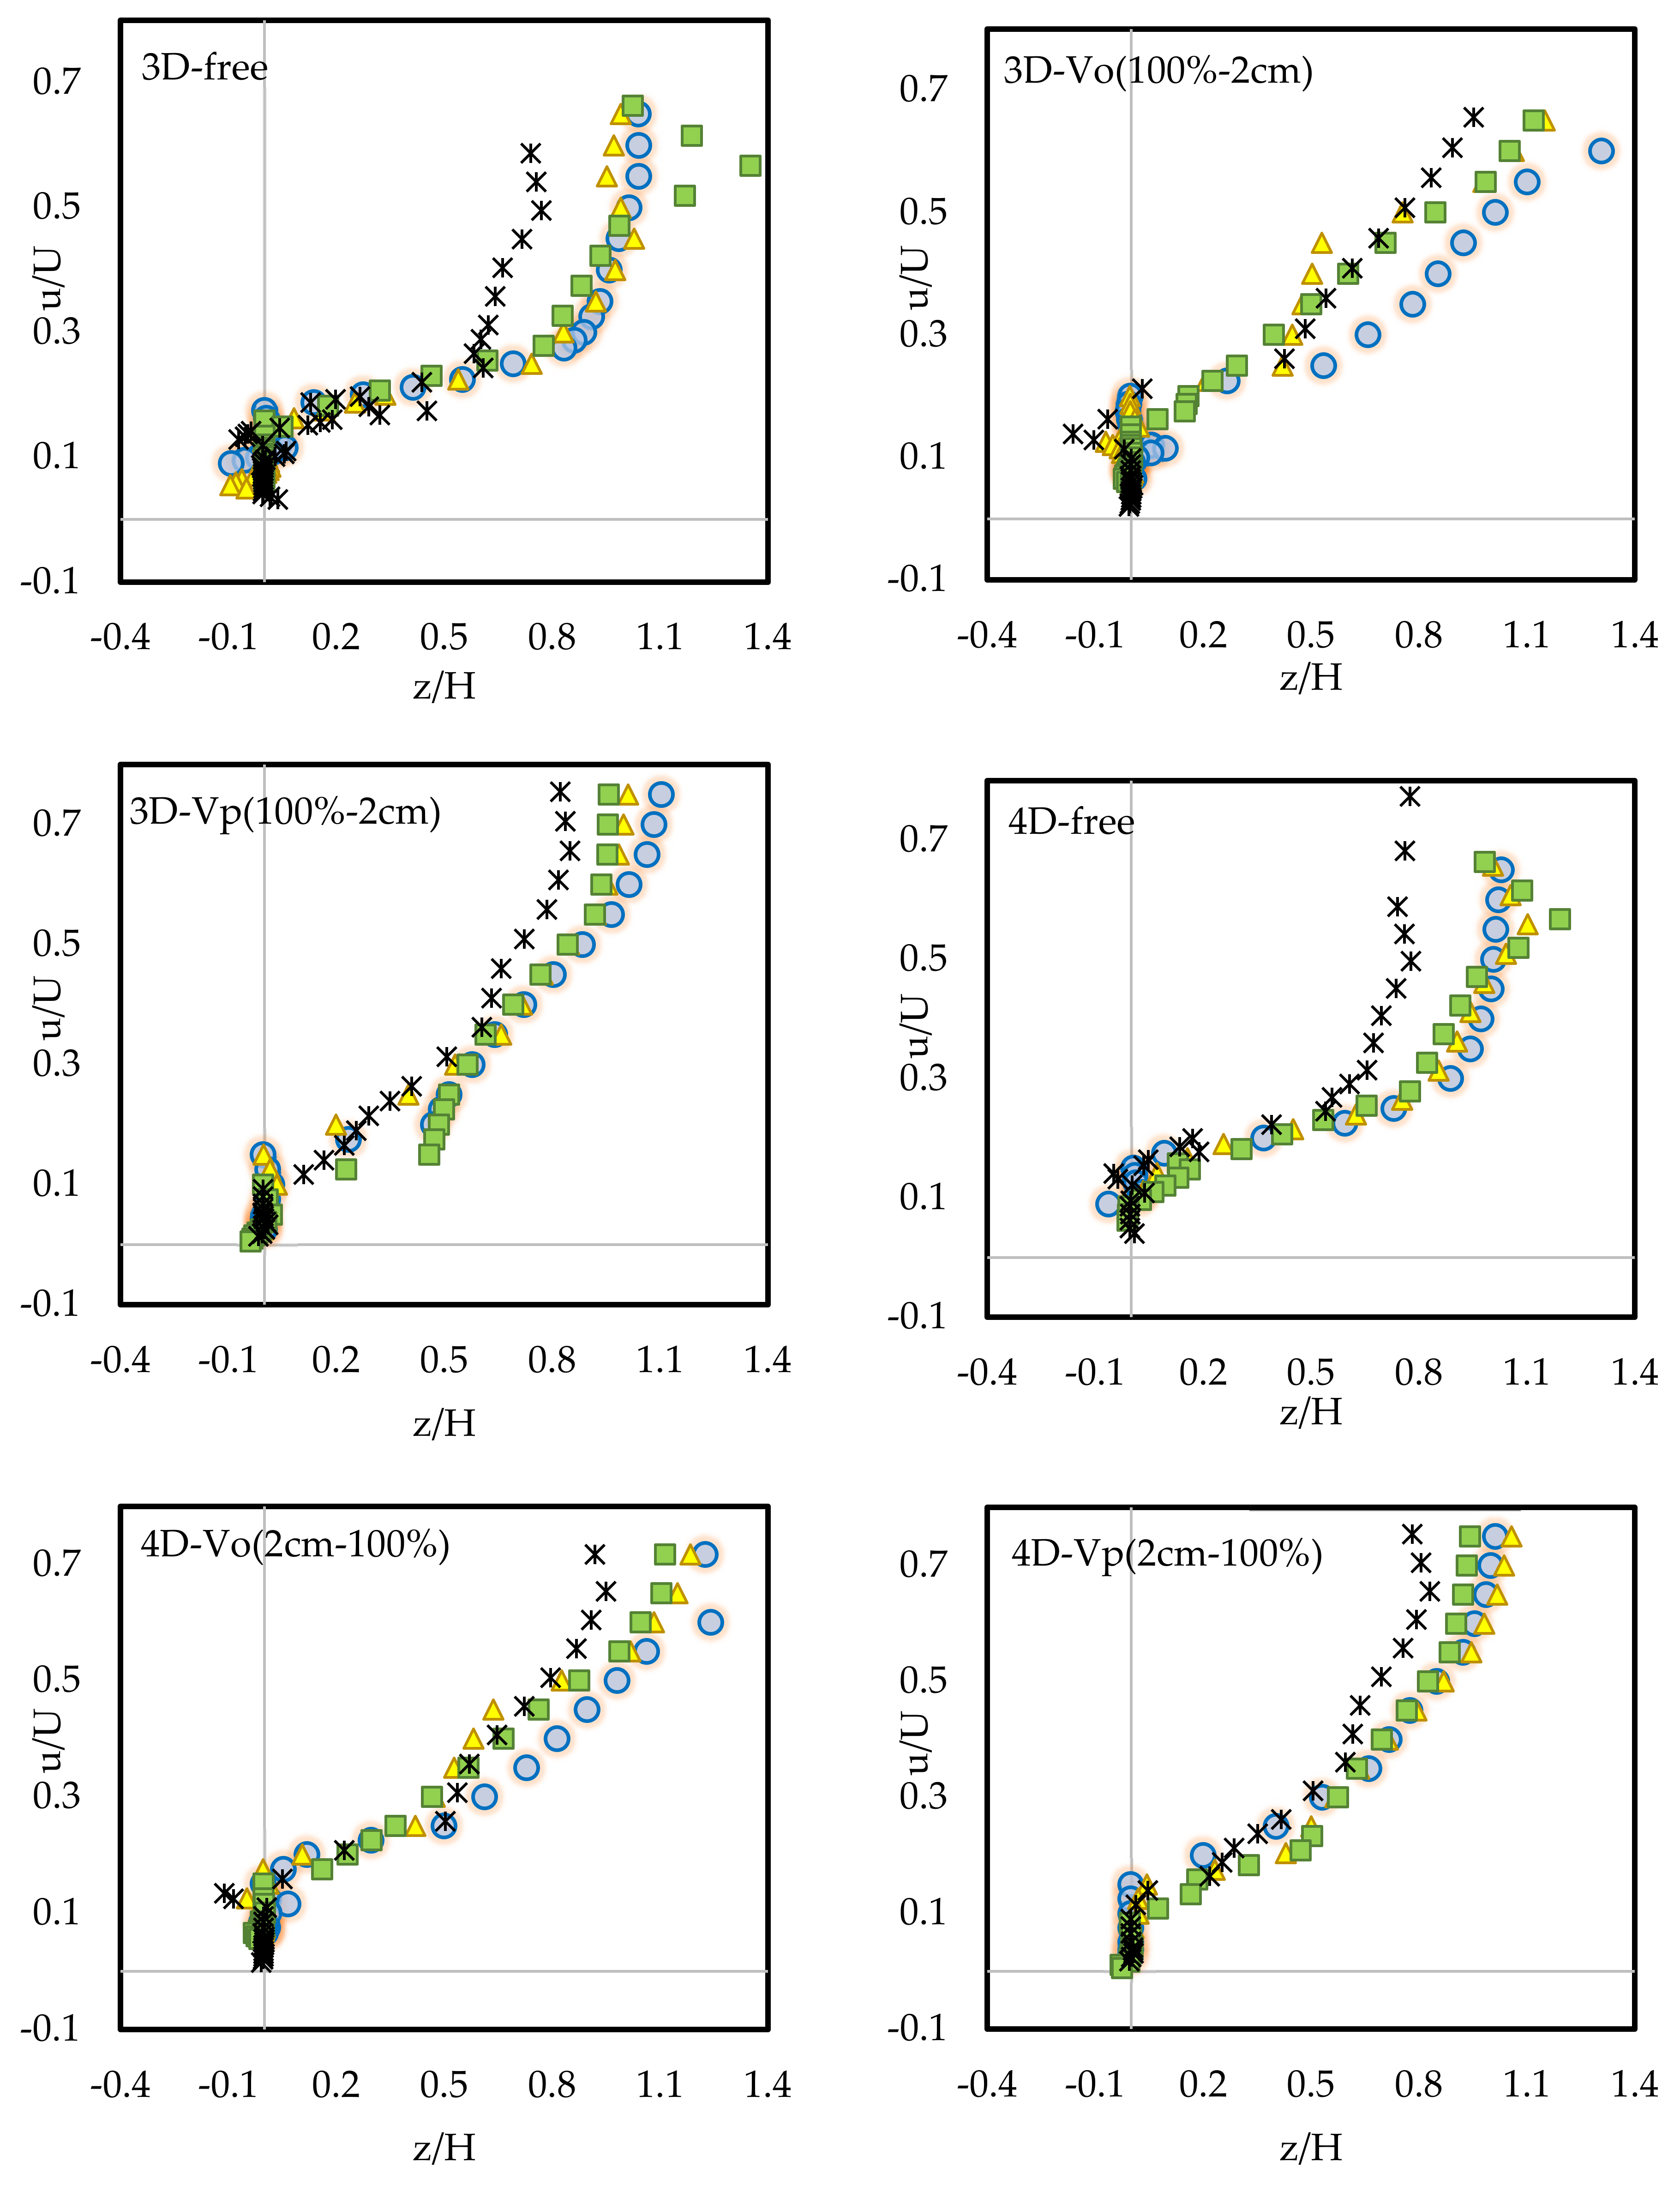
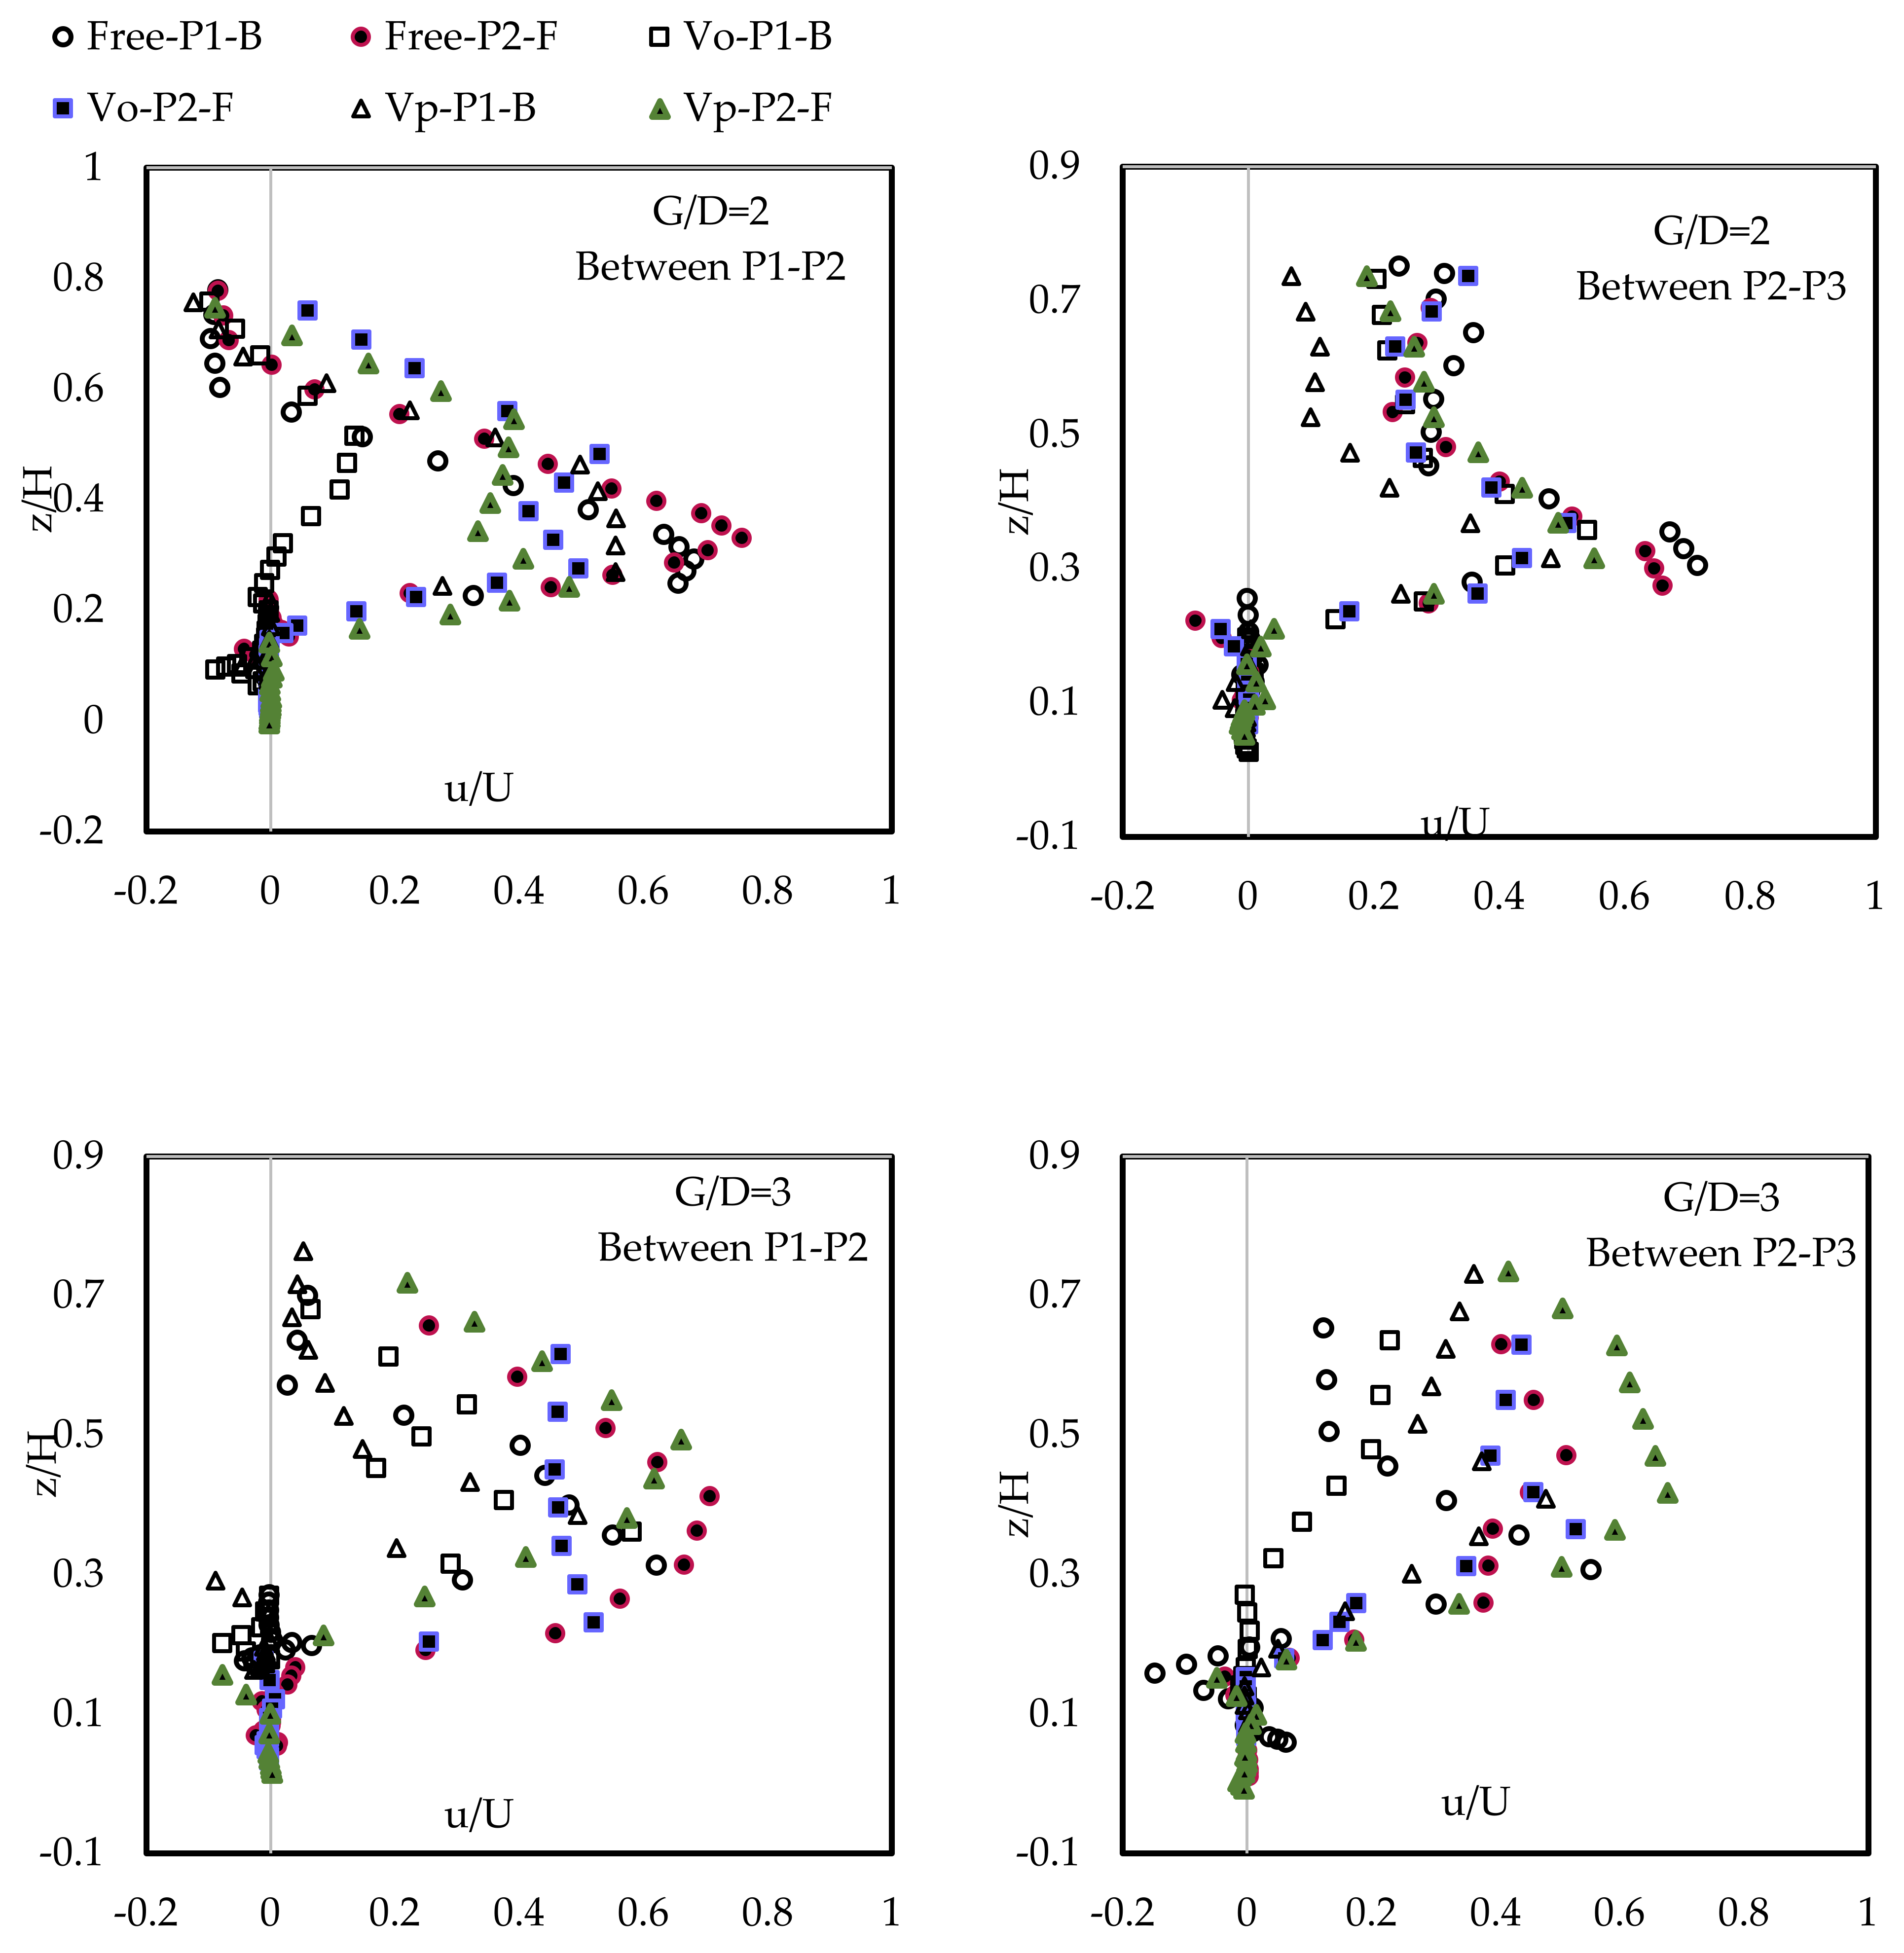
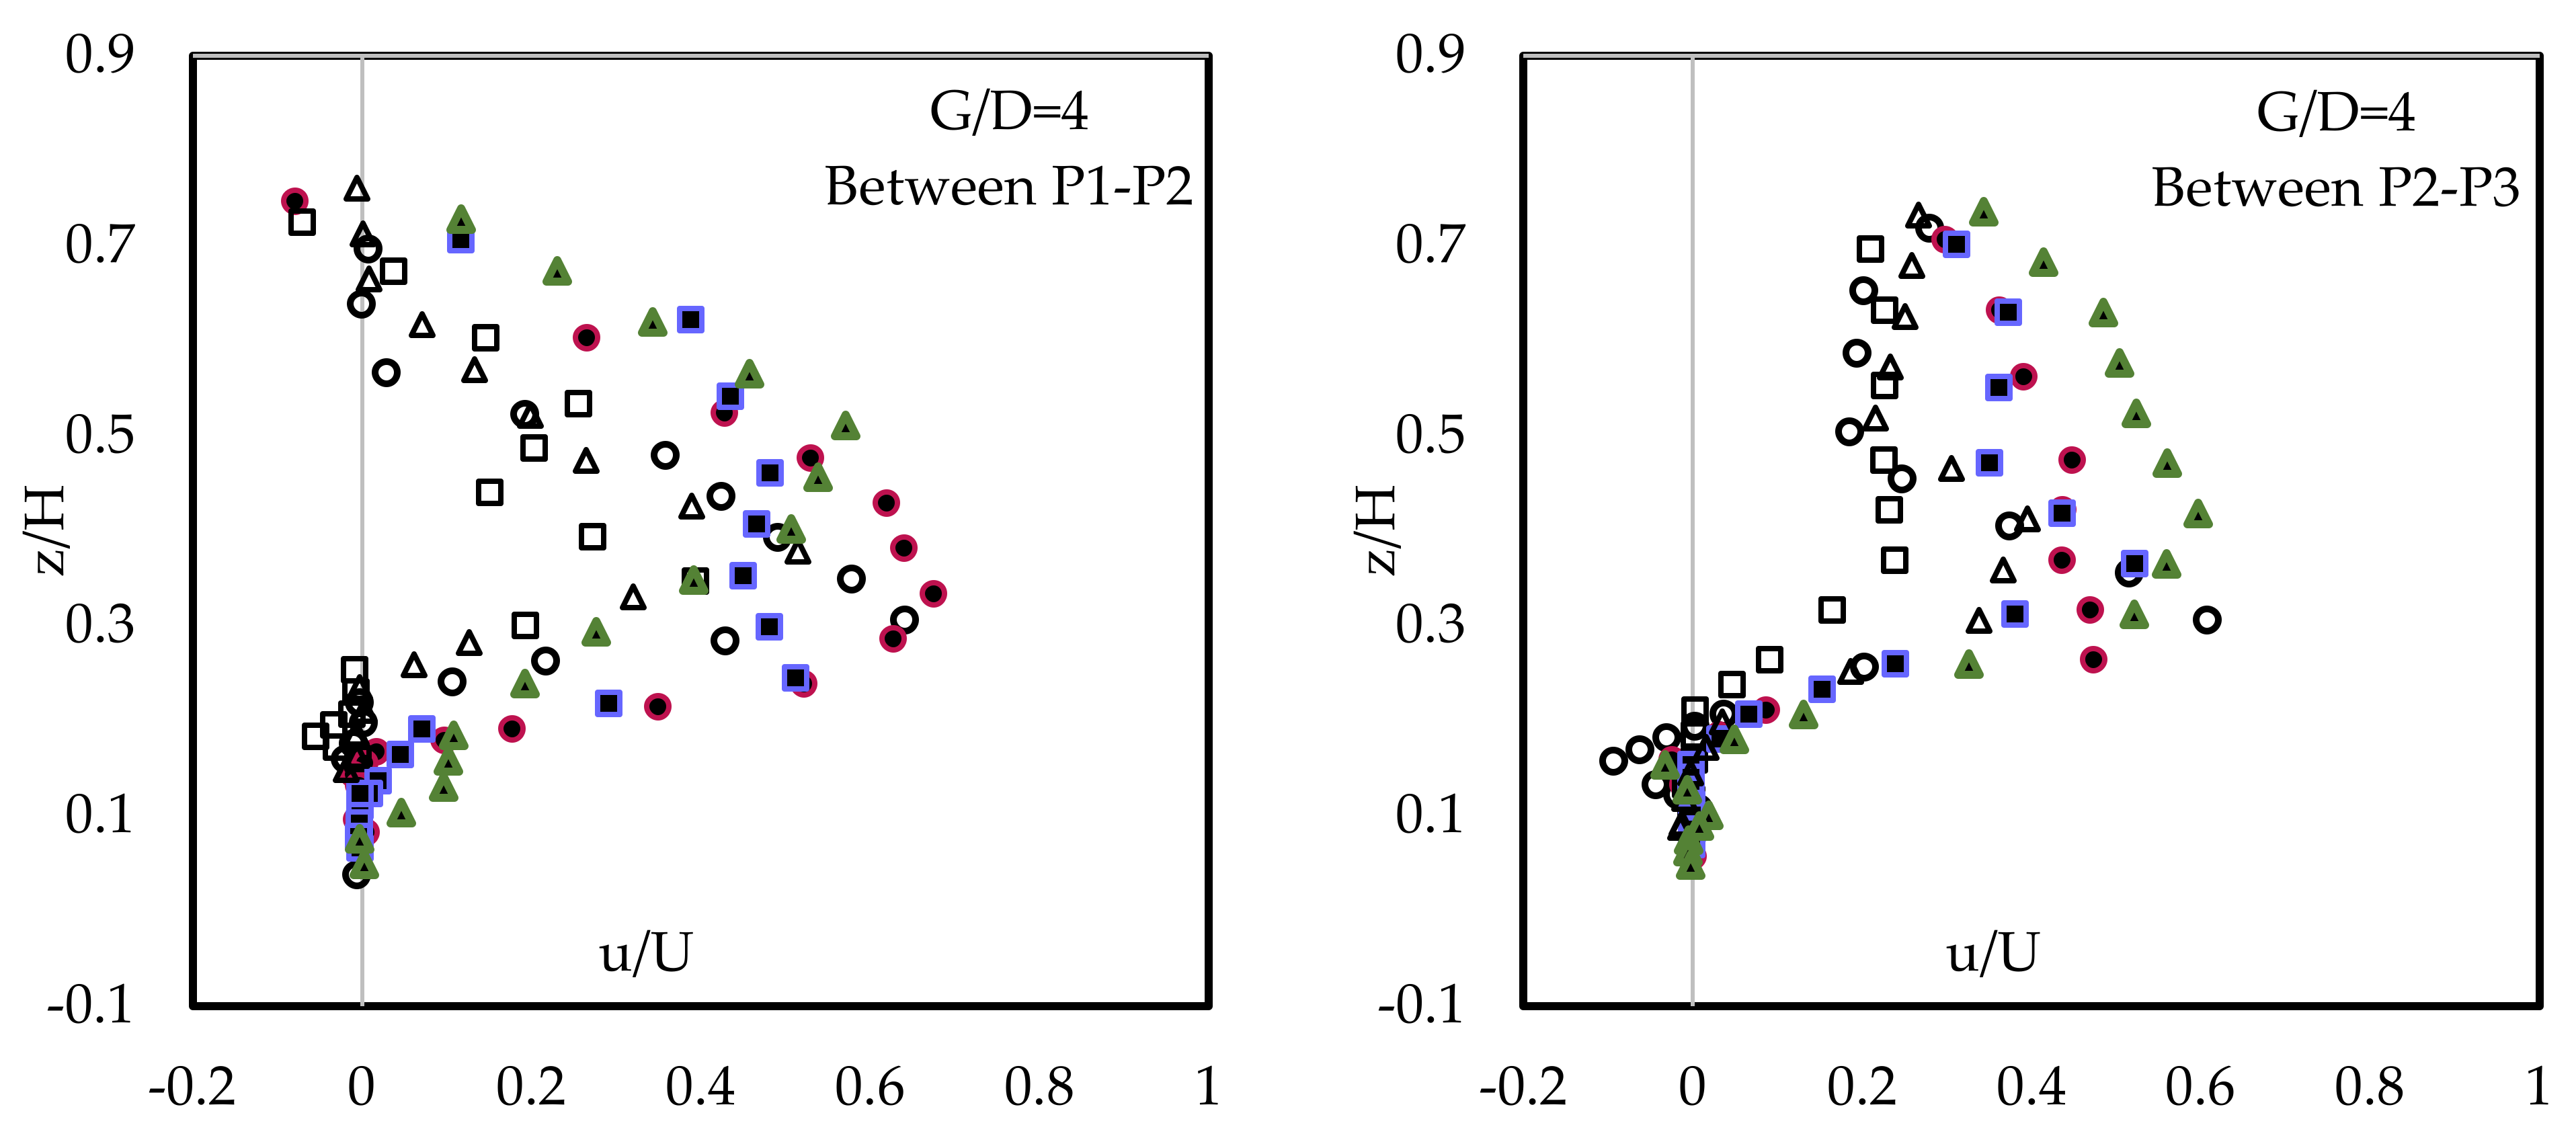
3.2. Longitudinal Velocity Profiles

Figure 7 shows the values of longitudinal velocity profiles upstream of the first pile. The velocity in each measured point was normalized by averaged velocity in the channel under similar hydraulic conditions without a bridge pile and vegetation. In this diagram, the horizontal axis shows u/U, while the vertical axis shows z/H.
The velocity profiles became skewed as the flow approached the bridge pile, and this skewness increased for velocity profiles after the first pile. These results are like those of Dey and Barbhuiya [40]; according to their research, these aberrations can mean the presence of pressure gradients and consequently strong vortices that cause eddy currents and spirals around the piles.
The velocity profile can be divided into two parts in vegetation-free conditions for a single pile: z/H > 0.2 toward the water surface when the velocity is increased and z/H < 0.2 toward the bed surface when the velocity is negative. When moving away from the piles, the velocity decreases. The most negative velocity value is observed in the profile closest to the pile, especially in the scour hole. As the maximum velocity for pile groups occurred below the water’s surface, their profiles are divided into three parts. The velocity decreases in the first part, from the water’s surface toward the place of maximum velocity, followed by the velocity increase toward z/H > 0.15 in the second part. The velocity value is negative in the third part, from z/H < 0.15 toward the bed surface. In scouring holes, negative values can be observed due to the separation of flow and eddy systems, as shown by Day et al., Ahmed et al., and Kumar and Kothyari [40,41,42].
According to the results, vegetation upstream of the piles caused a significant increase in velocity from z/H < 1.5–2 to the bed surface. The velocity values are close to zero even inside the scour hole. The rate of velocity enhancement increases due to approaching vegetation by increasing the distance from the pile. It can be deduced from the reduction of negative velocity values in the presence of vegetation that vegetation has been able to produce enough kinetic energy in the boundary layer around the pile to control to some extent the flow separation near the bed z. The dip parameter is the ratio of the depth below the water level from the bed floor (z) where the maximum velocity occurs (δ) to the depth of the stream (H) and is proposed in 1984 by Lakshiminarayana et al. [43] in Equation (5).
Dip = H δ H
The value of B/H in this research is equal to 4.5, which indicates the three-dimensional flow mode in the channel. According to velocity profiles, the amount of Dip is lowest for single bridge piles without vegetation compared to other experiments. In the experiments, it was observed that the Dip parameter increased by converting the single pile to the pile group at all G/D distances. The Dip parameter tended to increase with decreasing distance between the piles, and in all cases, more of the Dip parameter was observed in the third pile than in the second pile.
As in all cases in this experiment, the Dip parameter value is greater at the downstream of the pile because the current is deflected from the central axis towards the wall, which reduces the average velocity. Vegetation on the single pile case resulted in the maximum velocity below the water level. The amount of Dip parameter for all three G/D decreased in the presence of vegetation, and this decrease indicates a complex interaction between the pile group and vegetation on the secondary currents. As a result, vegetation reduces the diversion of the stream from the central axis to the walls. The results of this study corresponded with the results of Afzalimehr and Dey and Fazel [44,45].
Figure 8 shows the closest velocity profiles measured between the piles. The symbols P1, P2, and P3 refer to the first, second, and third piles. Furthermore, the filled signs and the letter F indicate the pile upstream, and the hollow characters and the letter B indicate the downstream. The velocity profiles downstream of the piles show a different trend than the pile upstream. The x-axis indicates u/U and the y-axis indicates z/H.
The velocity decreases from the water level to about z/H = 0.35 and then increases to the bed level. In most cases, velocity values near the bed are negative or close to zero, which indicates the effect of eddy systems and flow separation. The velocity values near the water surface are small and negative downstream of the first pile, indicating return flow to the water surface. Upstream of the third pile, there is a greater velocity value and a smaller skew compared to the second pile. The presence of vegetation has reduced the velocity values and the velocity gradient behind the first pile. Also, increasing the distance between the piles has reduced the skewness of the profiles.

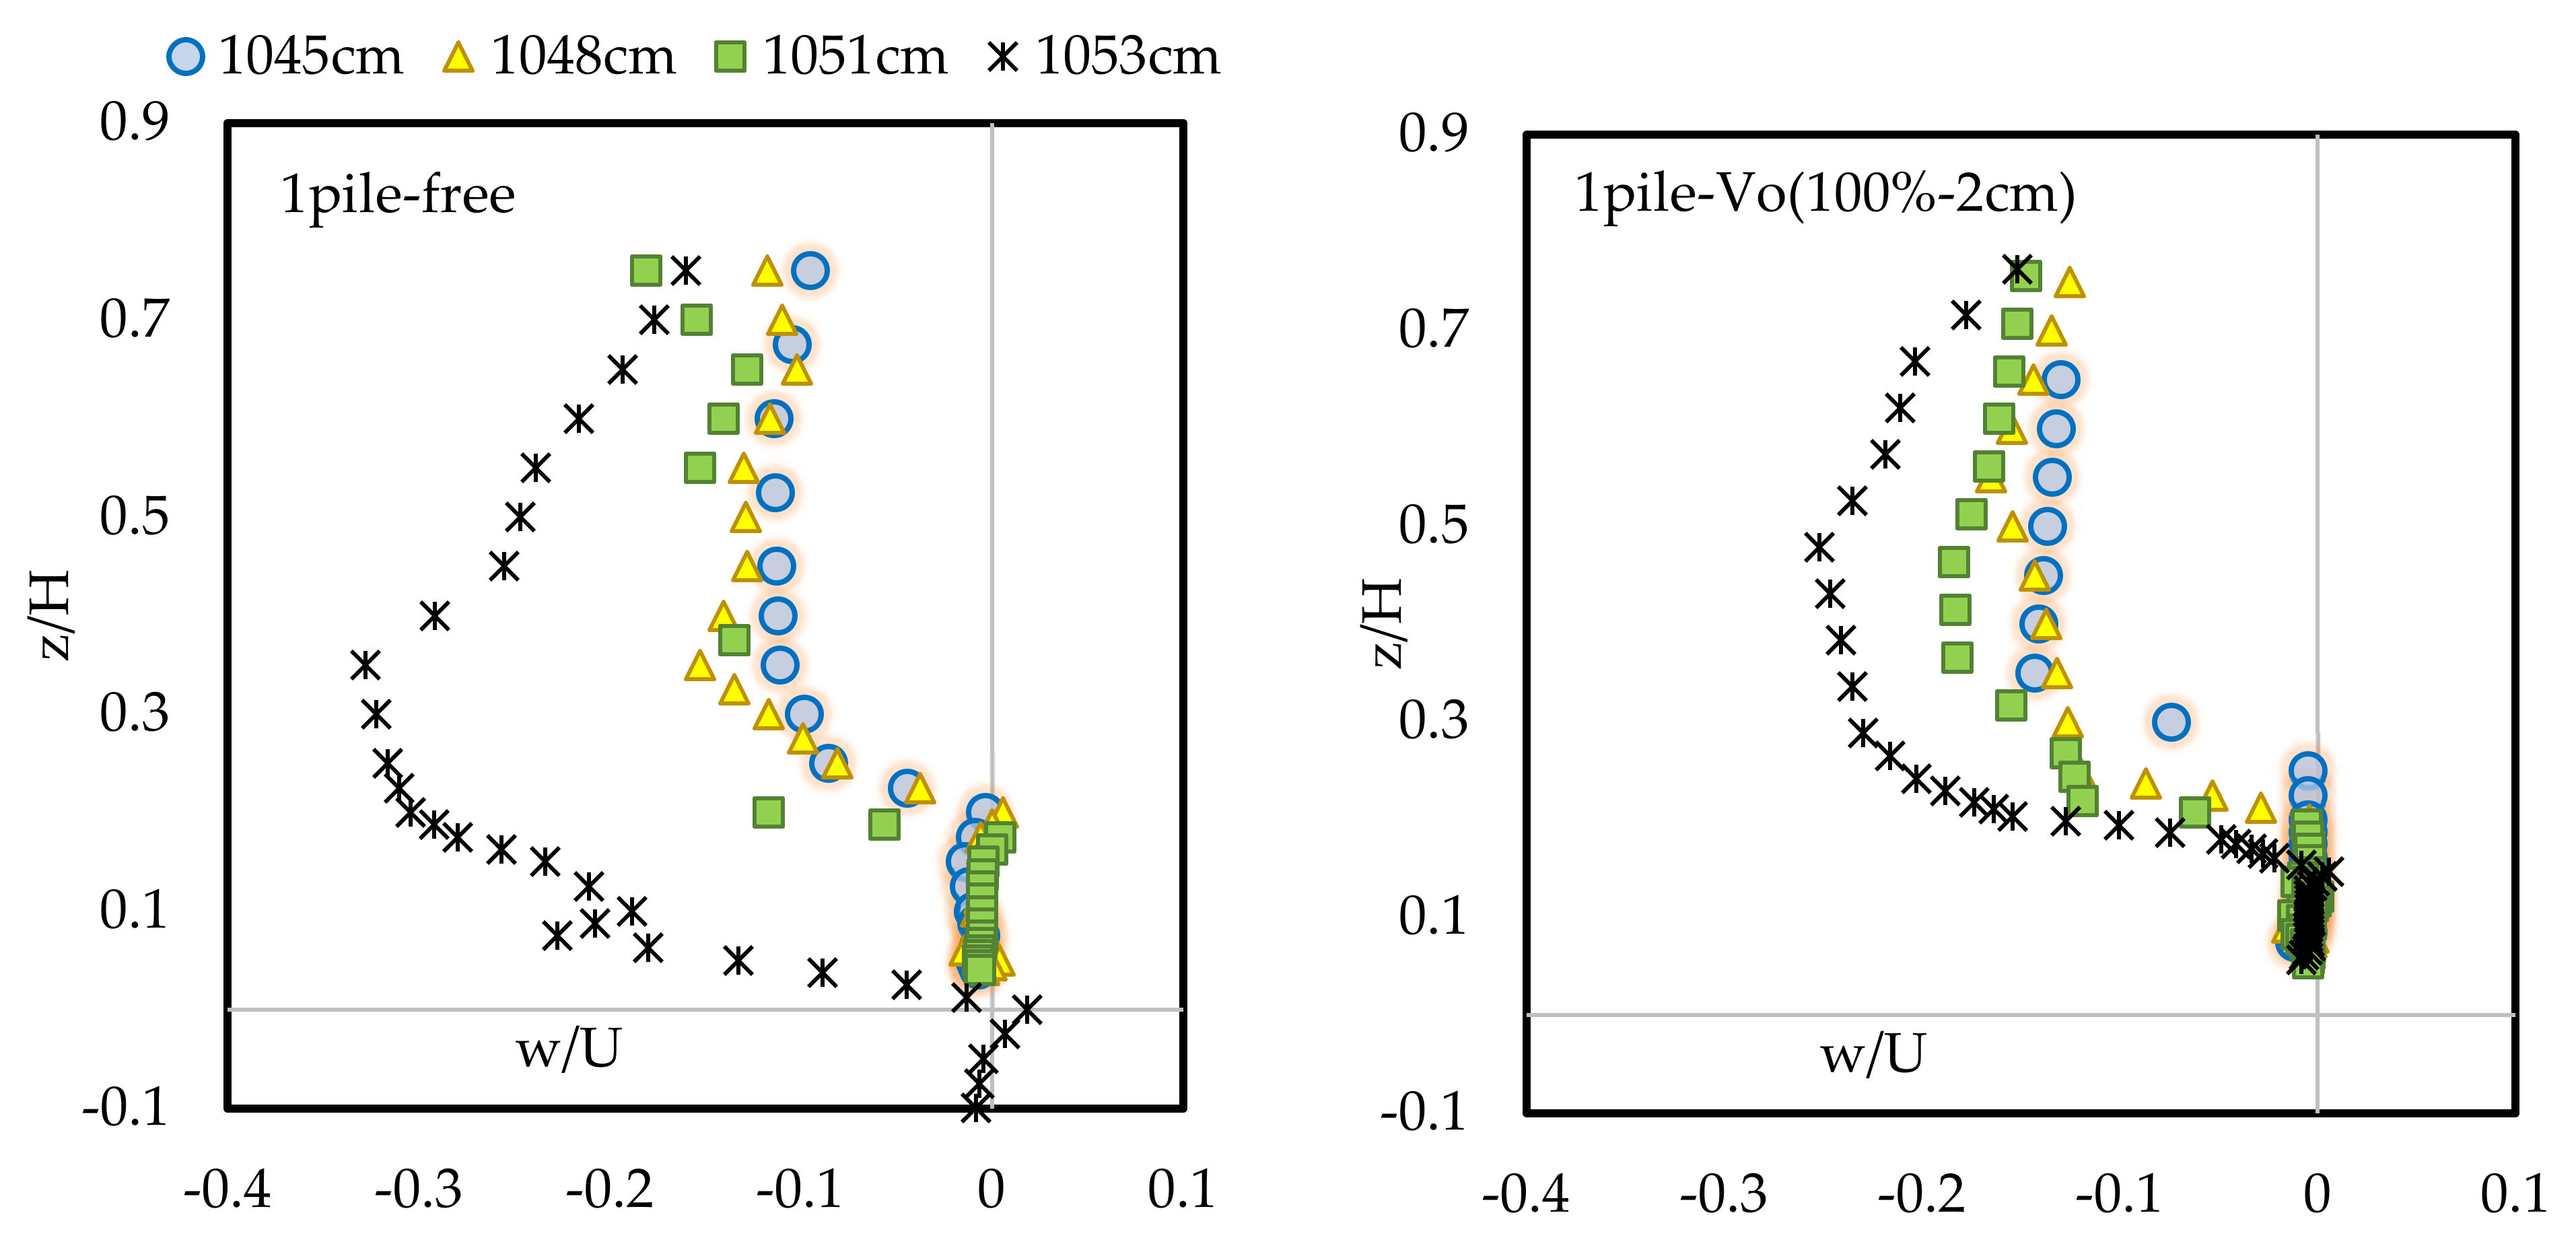
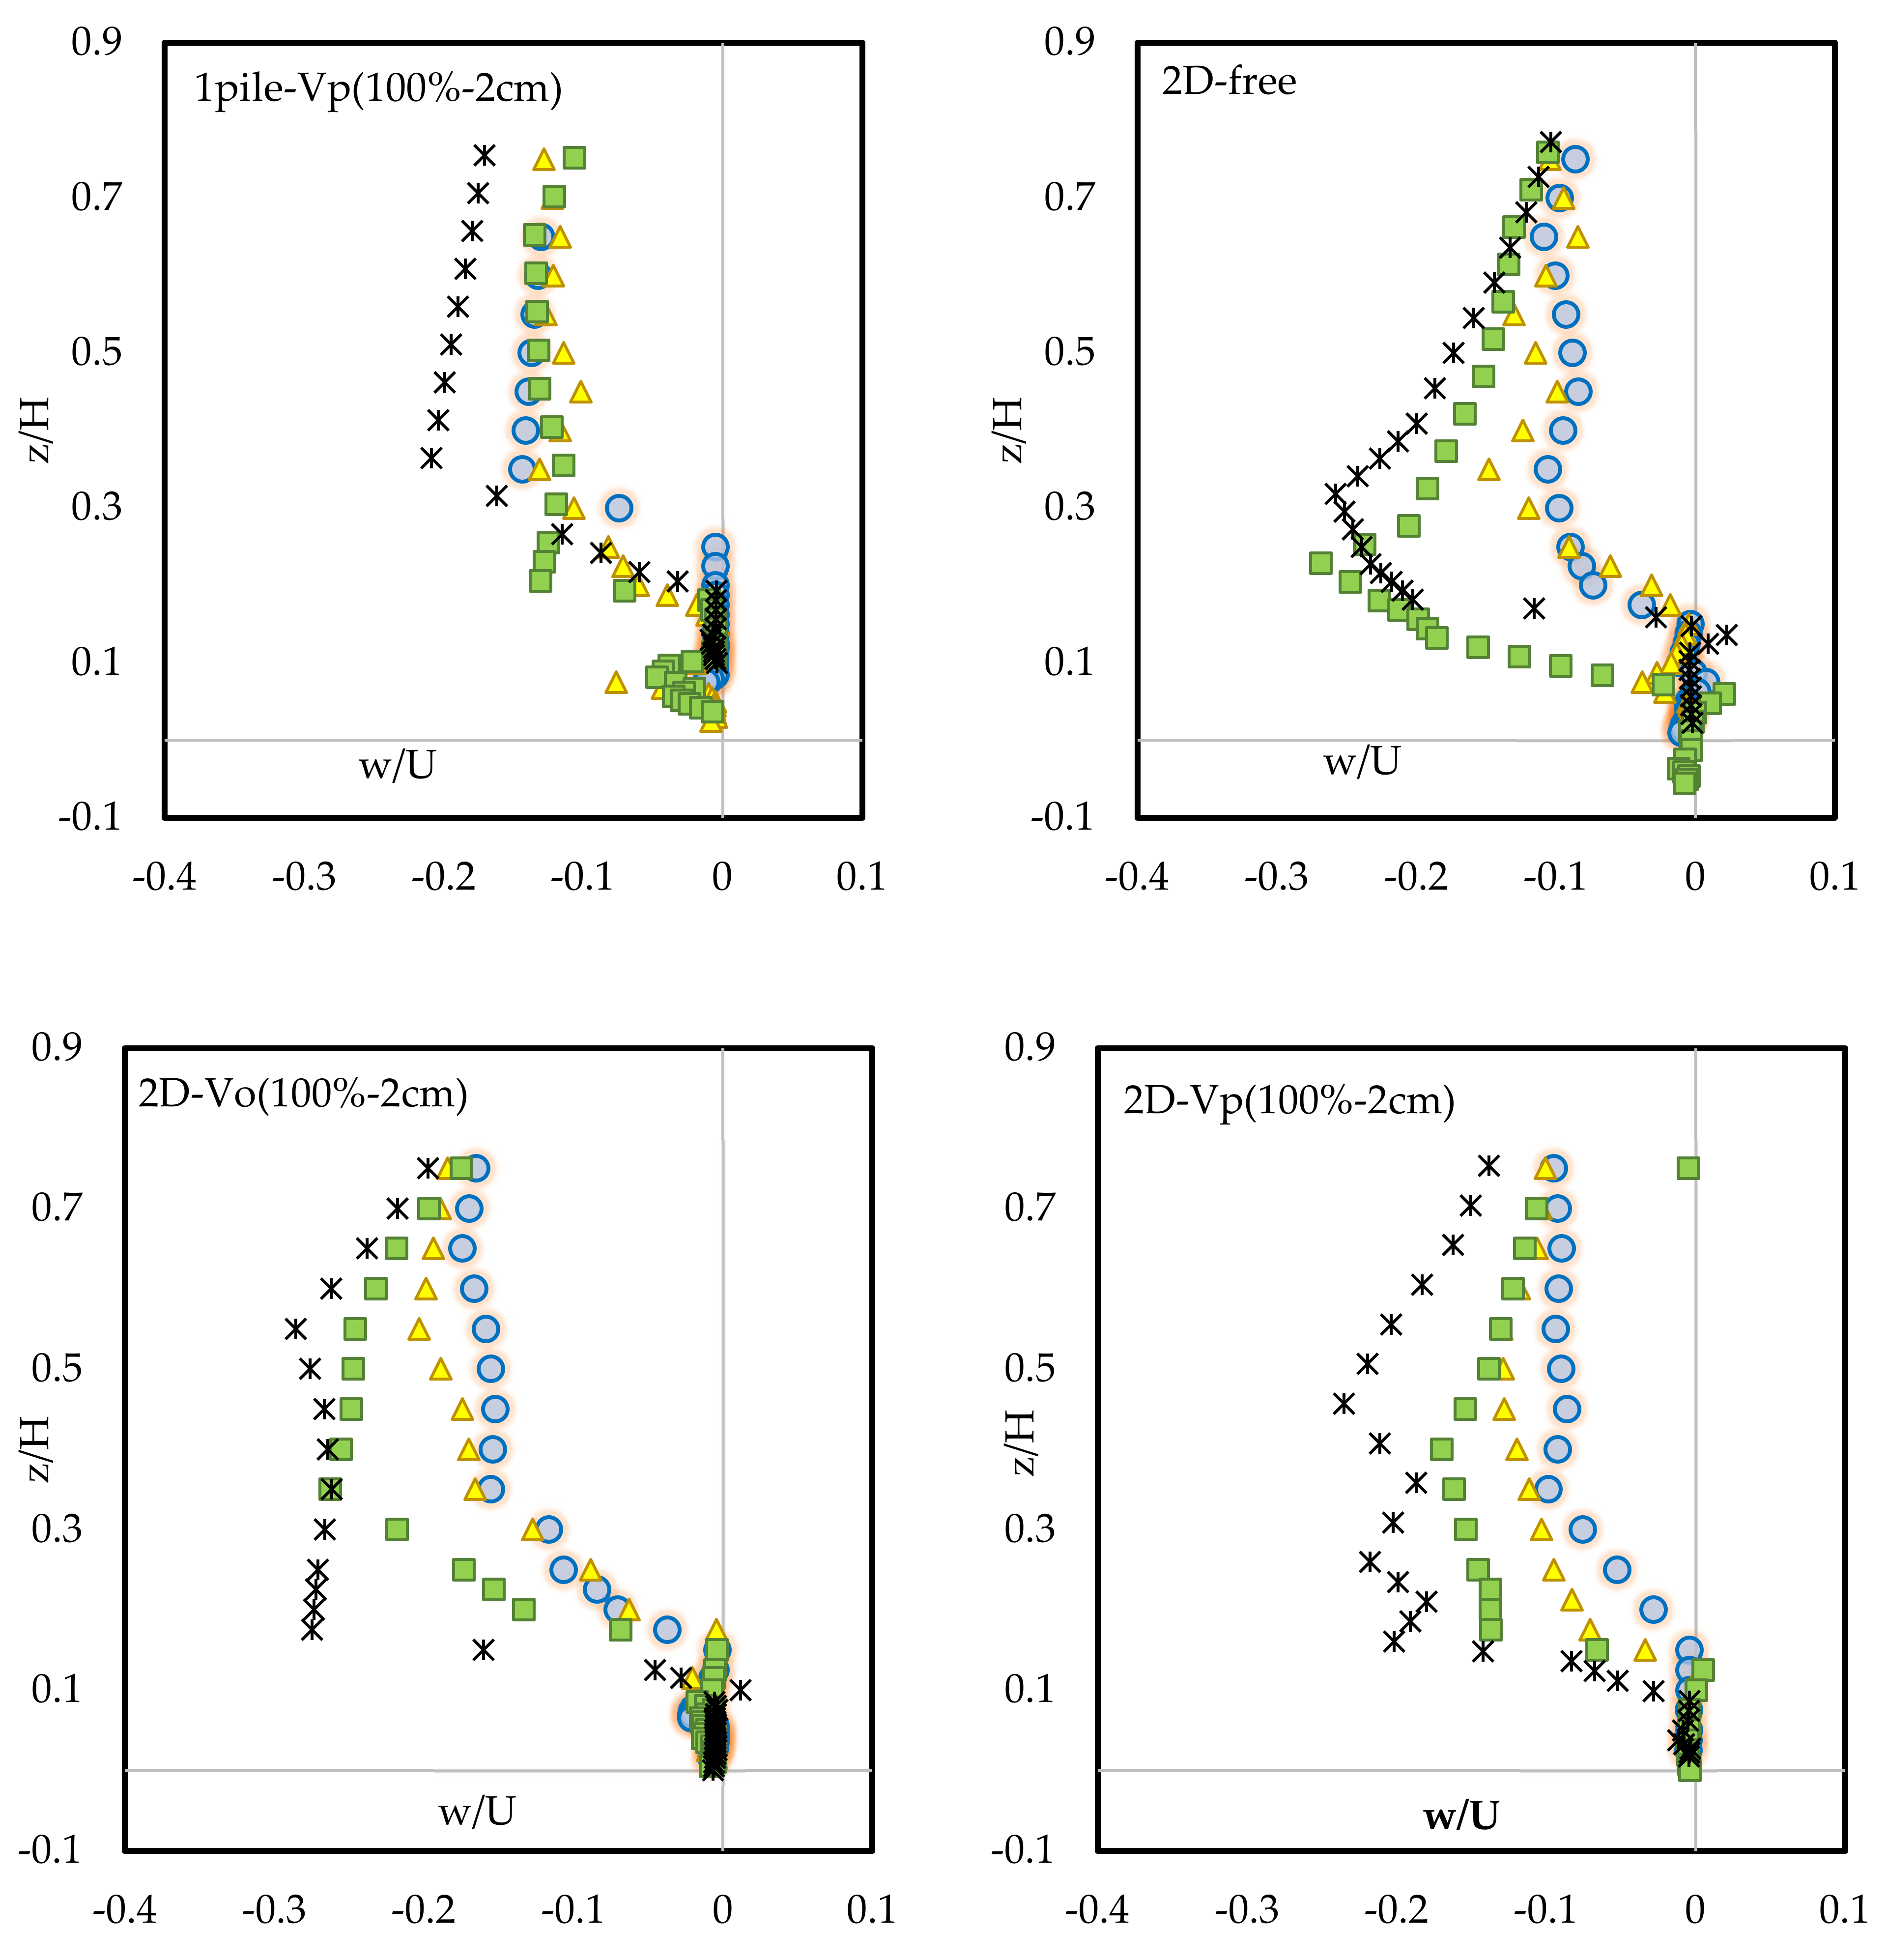
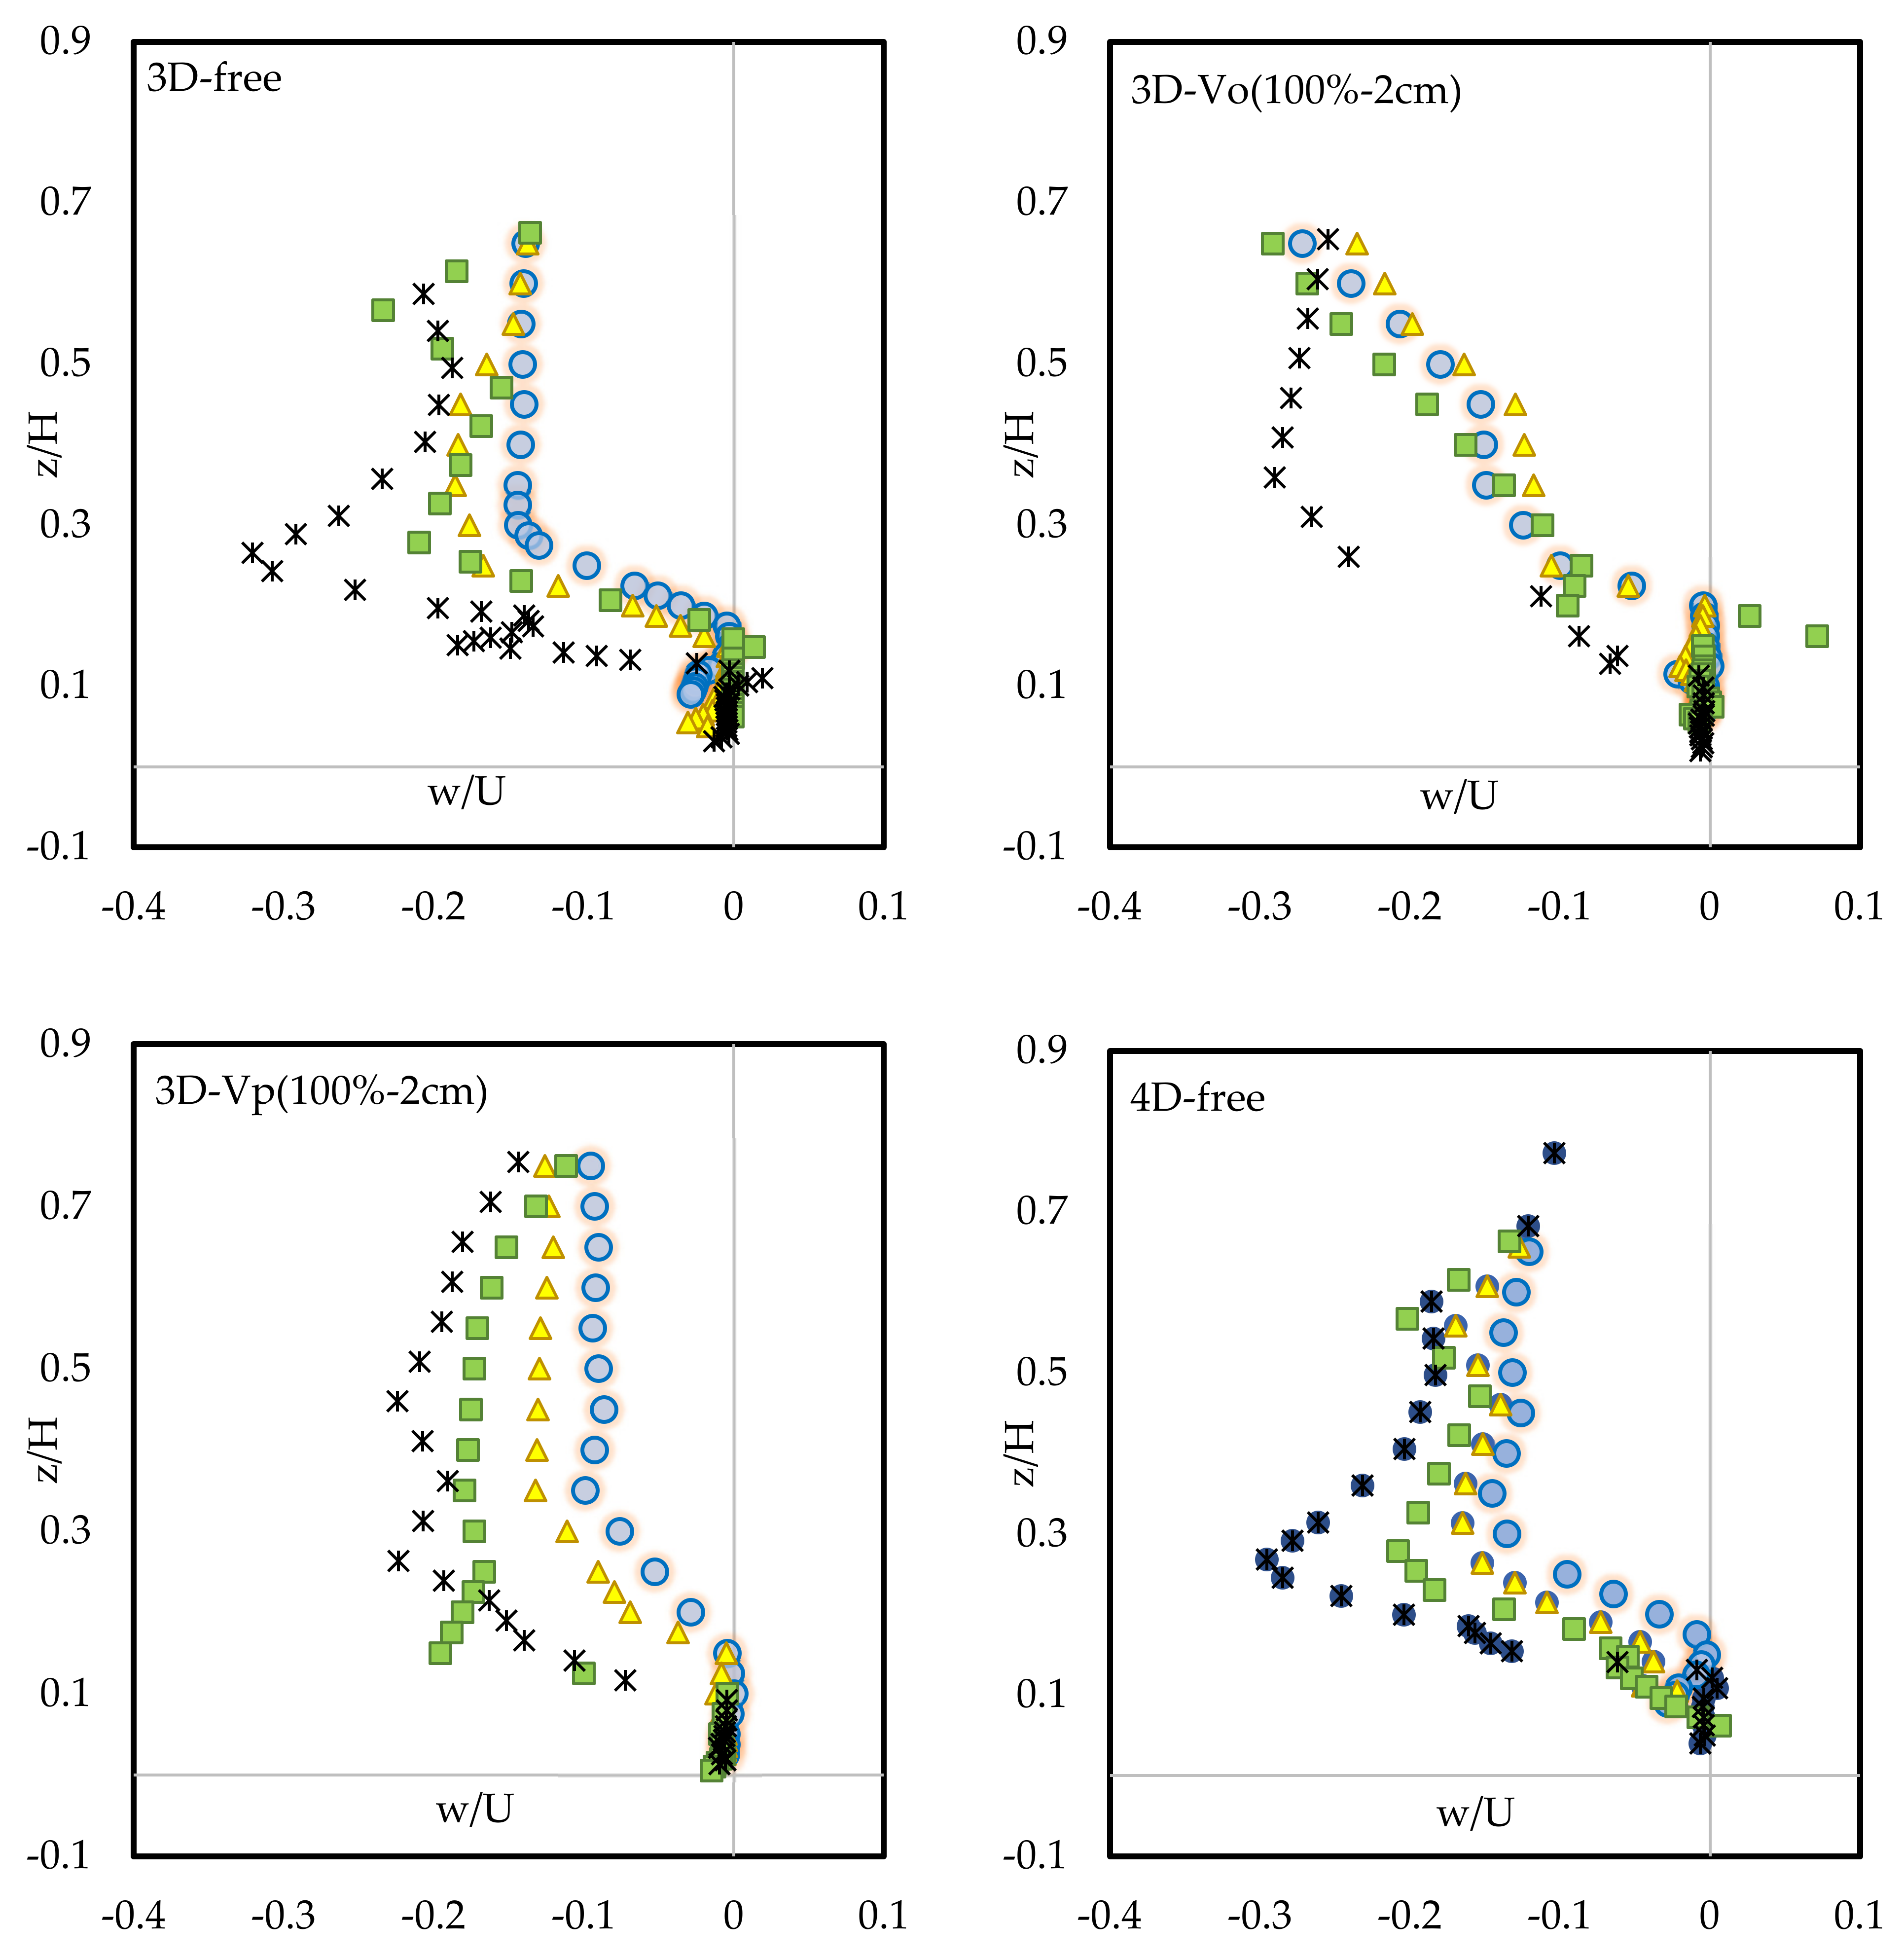
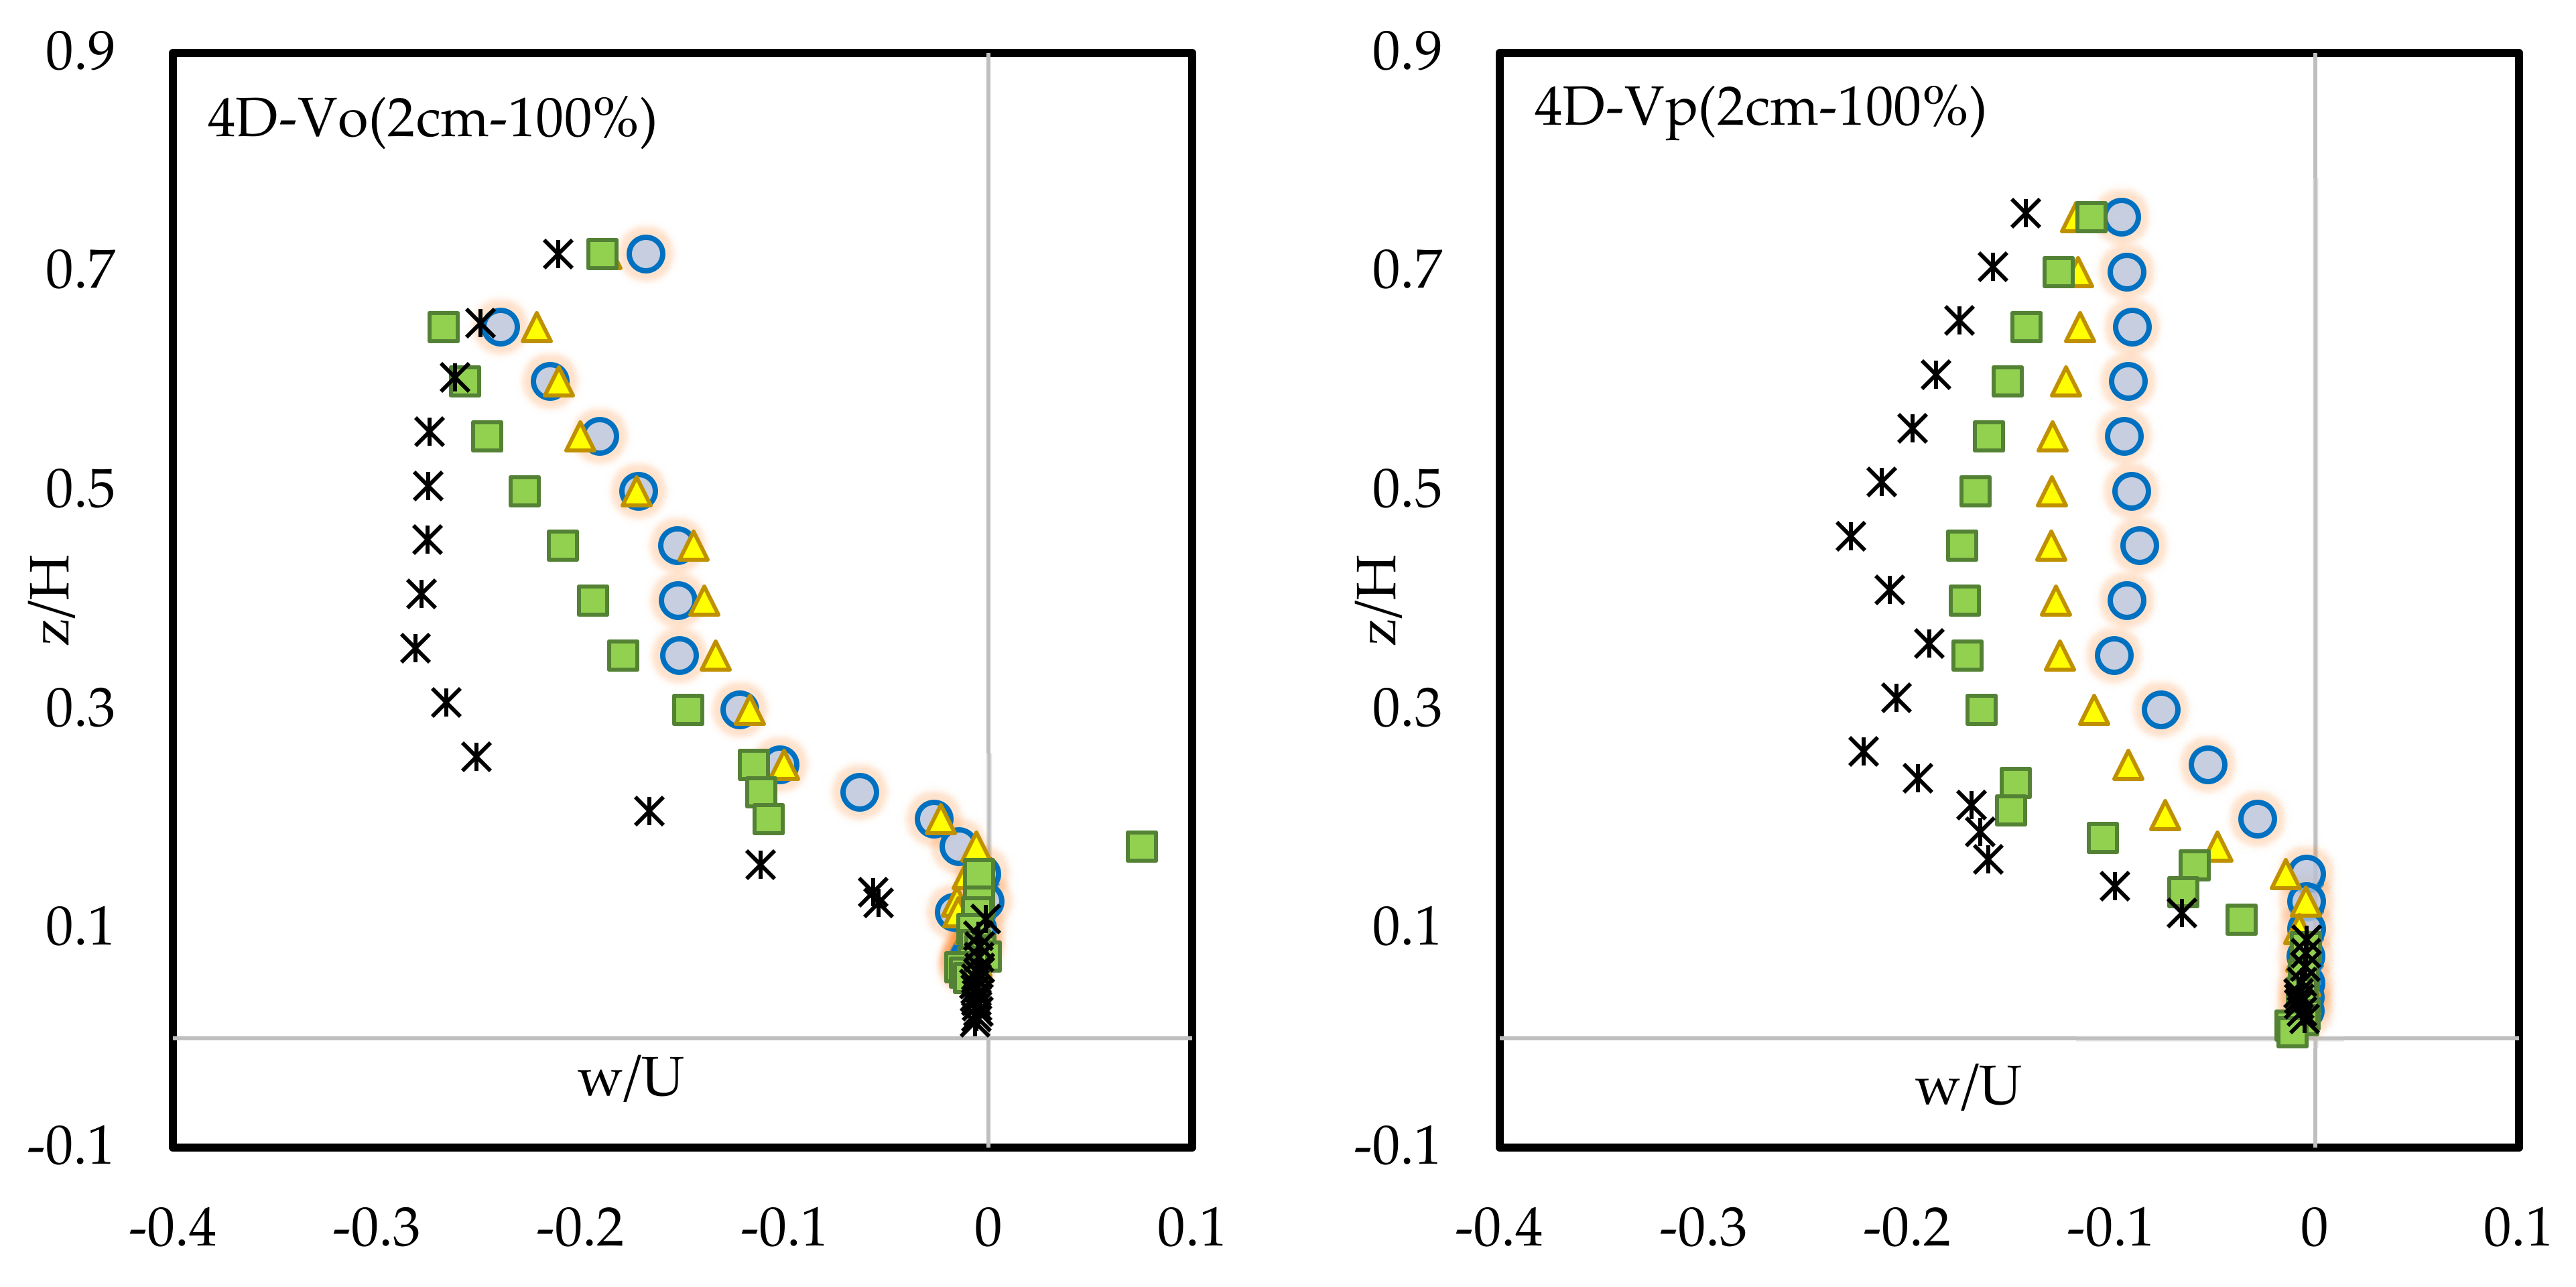
3.3. Vertical Velocity Profiles

Figure 9 shows the vertical flow velocity distribution upstream of the first pile. The values of negative vertical velocity increase with approaching the pile, which indicates the strength of the downward flow and its effect on the formation of scour hole. In all vegetation-free experimental cases, the most negative velocity values belong to the profile closest to the pile. As the distance between the pile increases, the scatter value of the vertical velocity also increases. In the presence of vegetation, vertical velocities decrease, indicating a decrease in downstream flow. The x-axis represents w/U and the y-axis represents z/H.

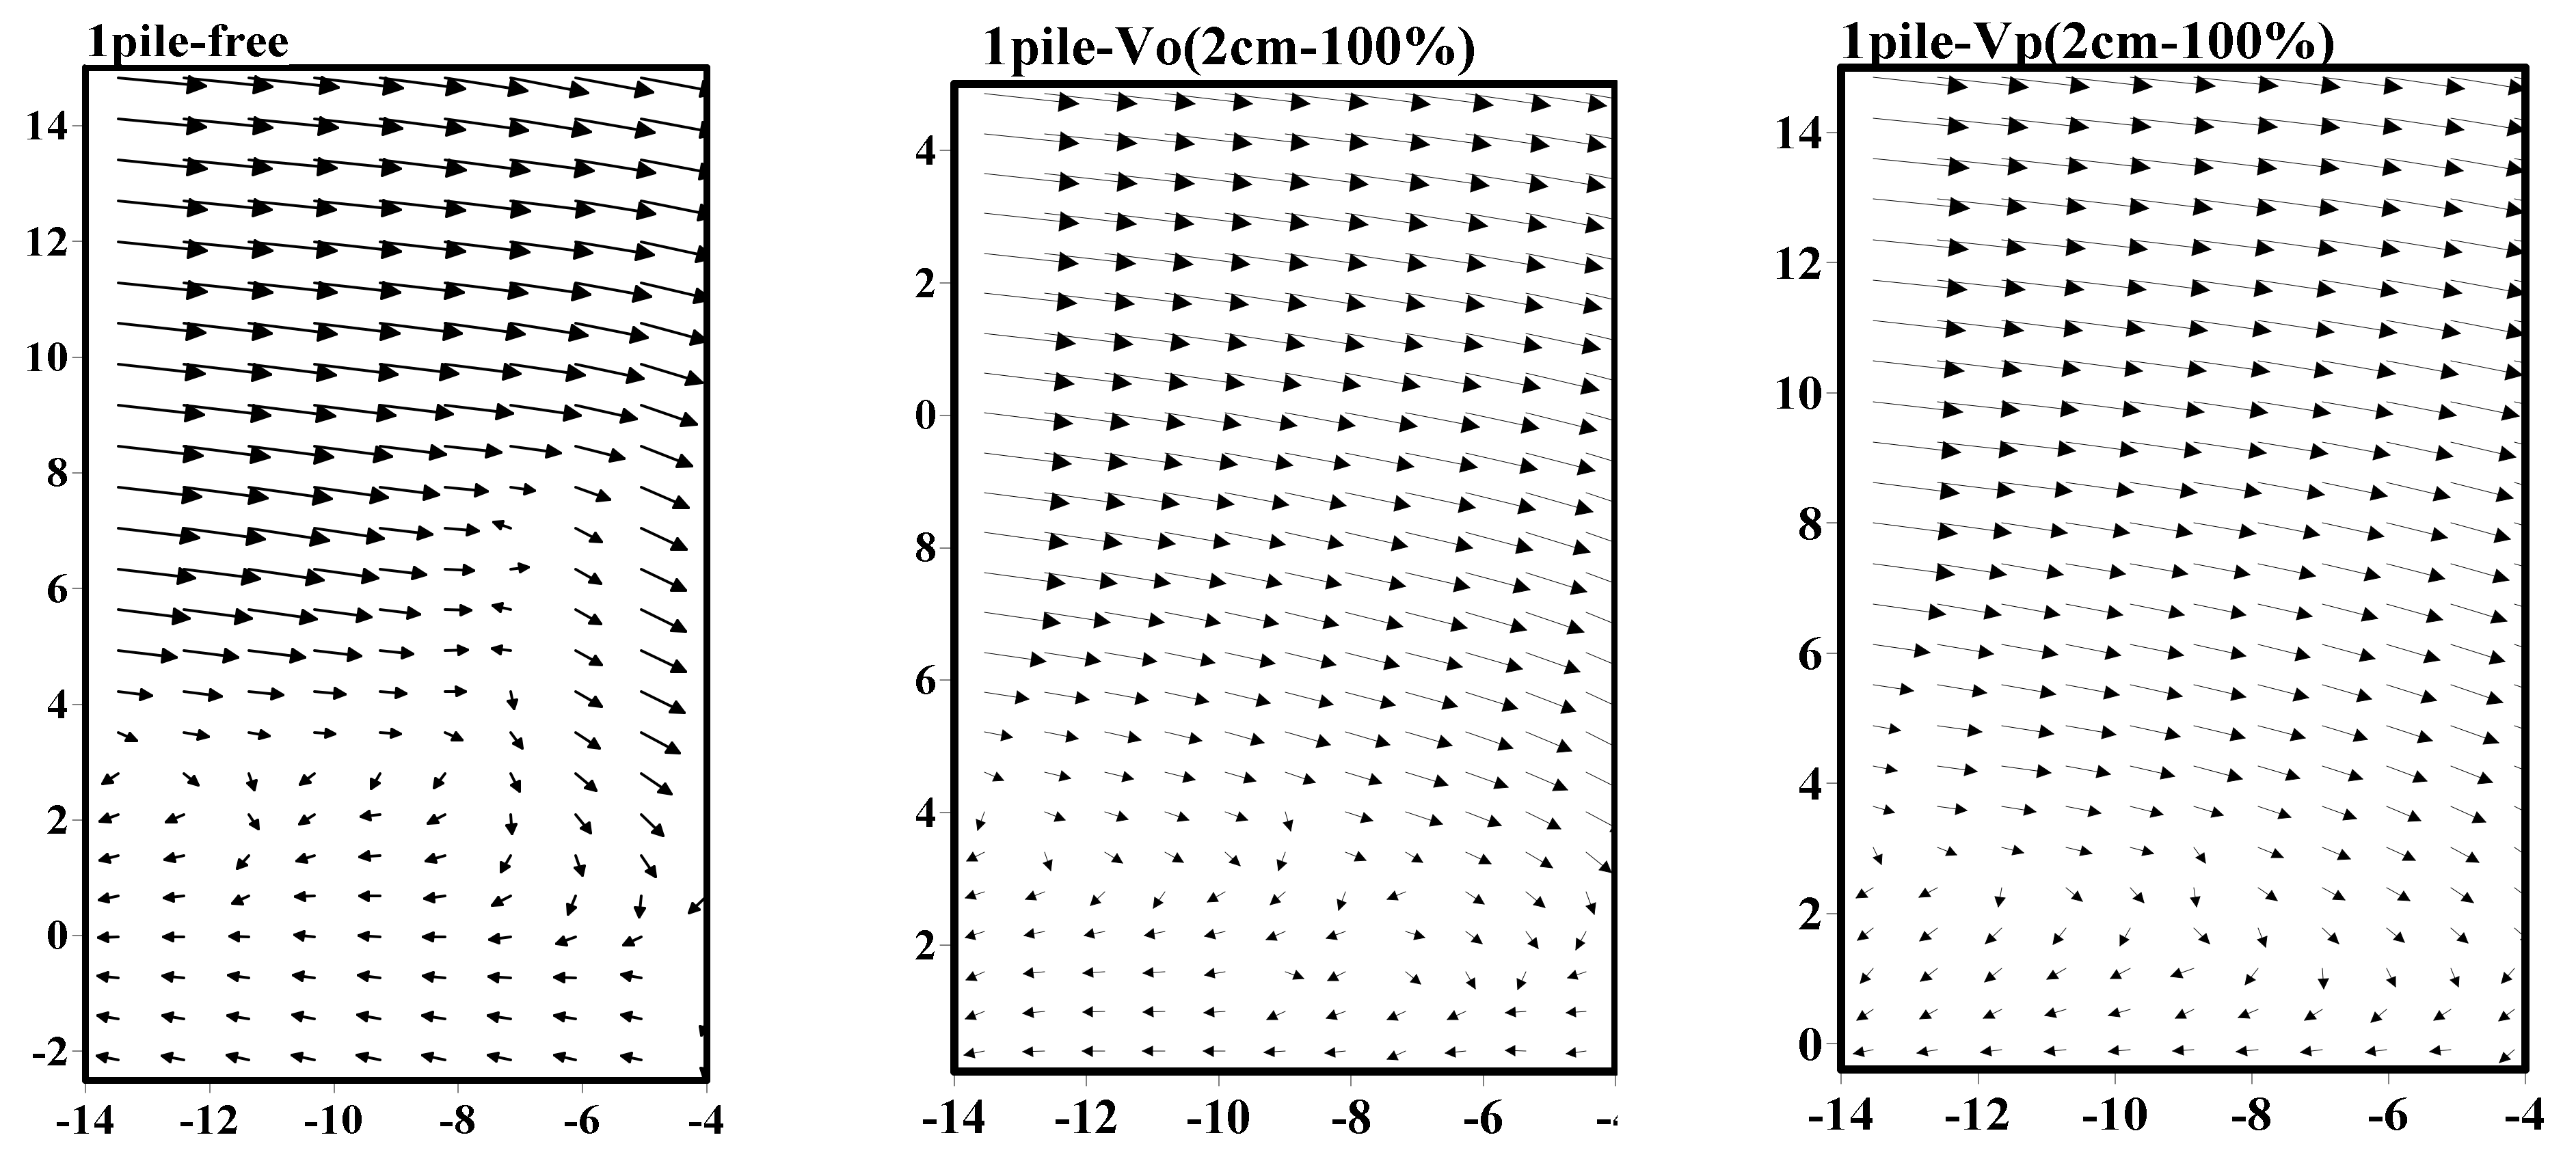
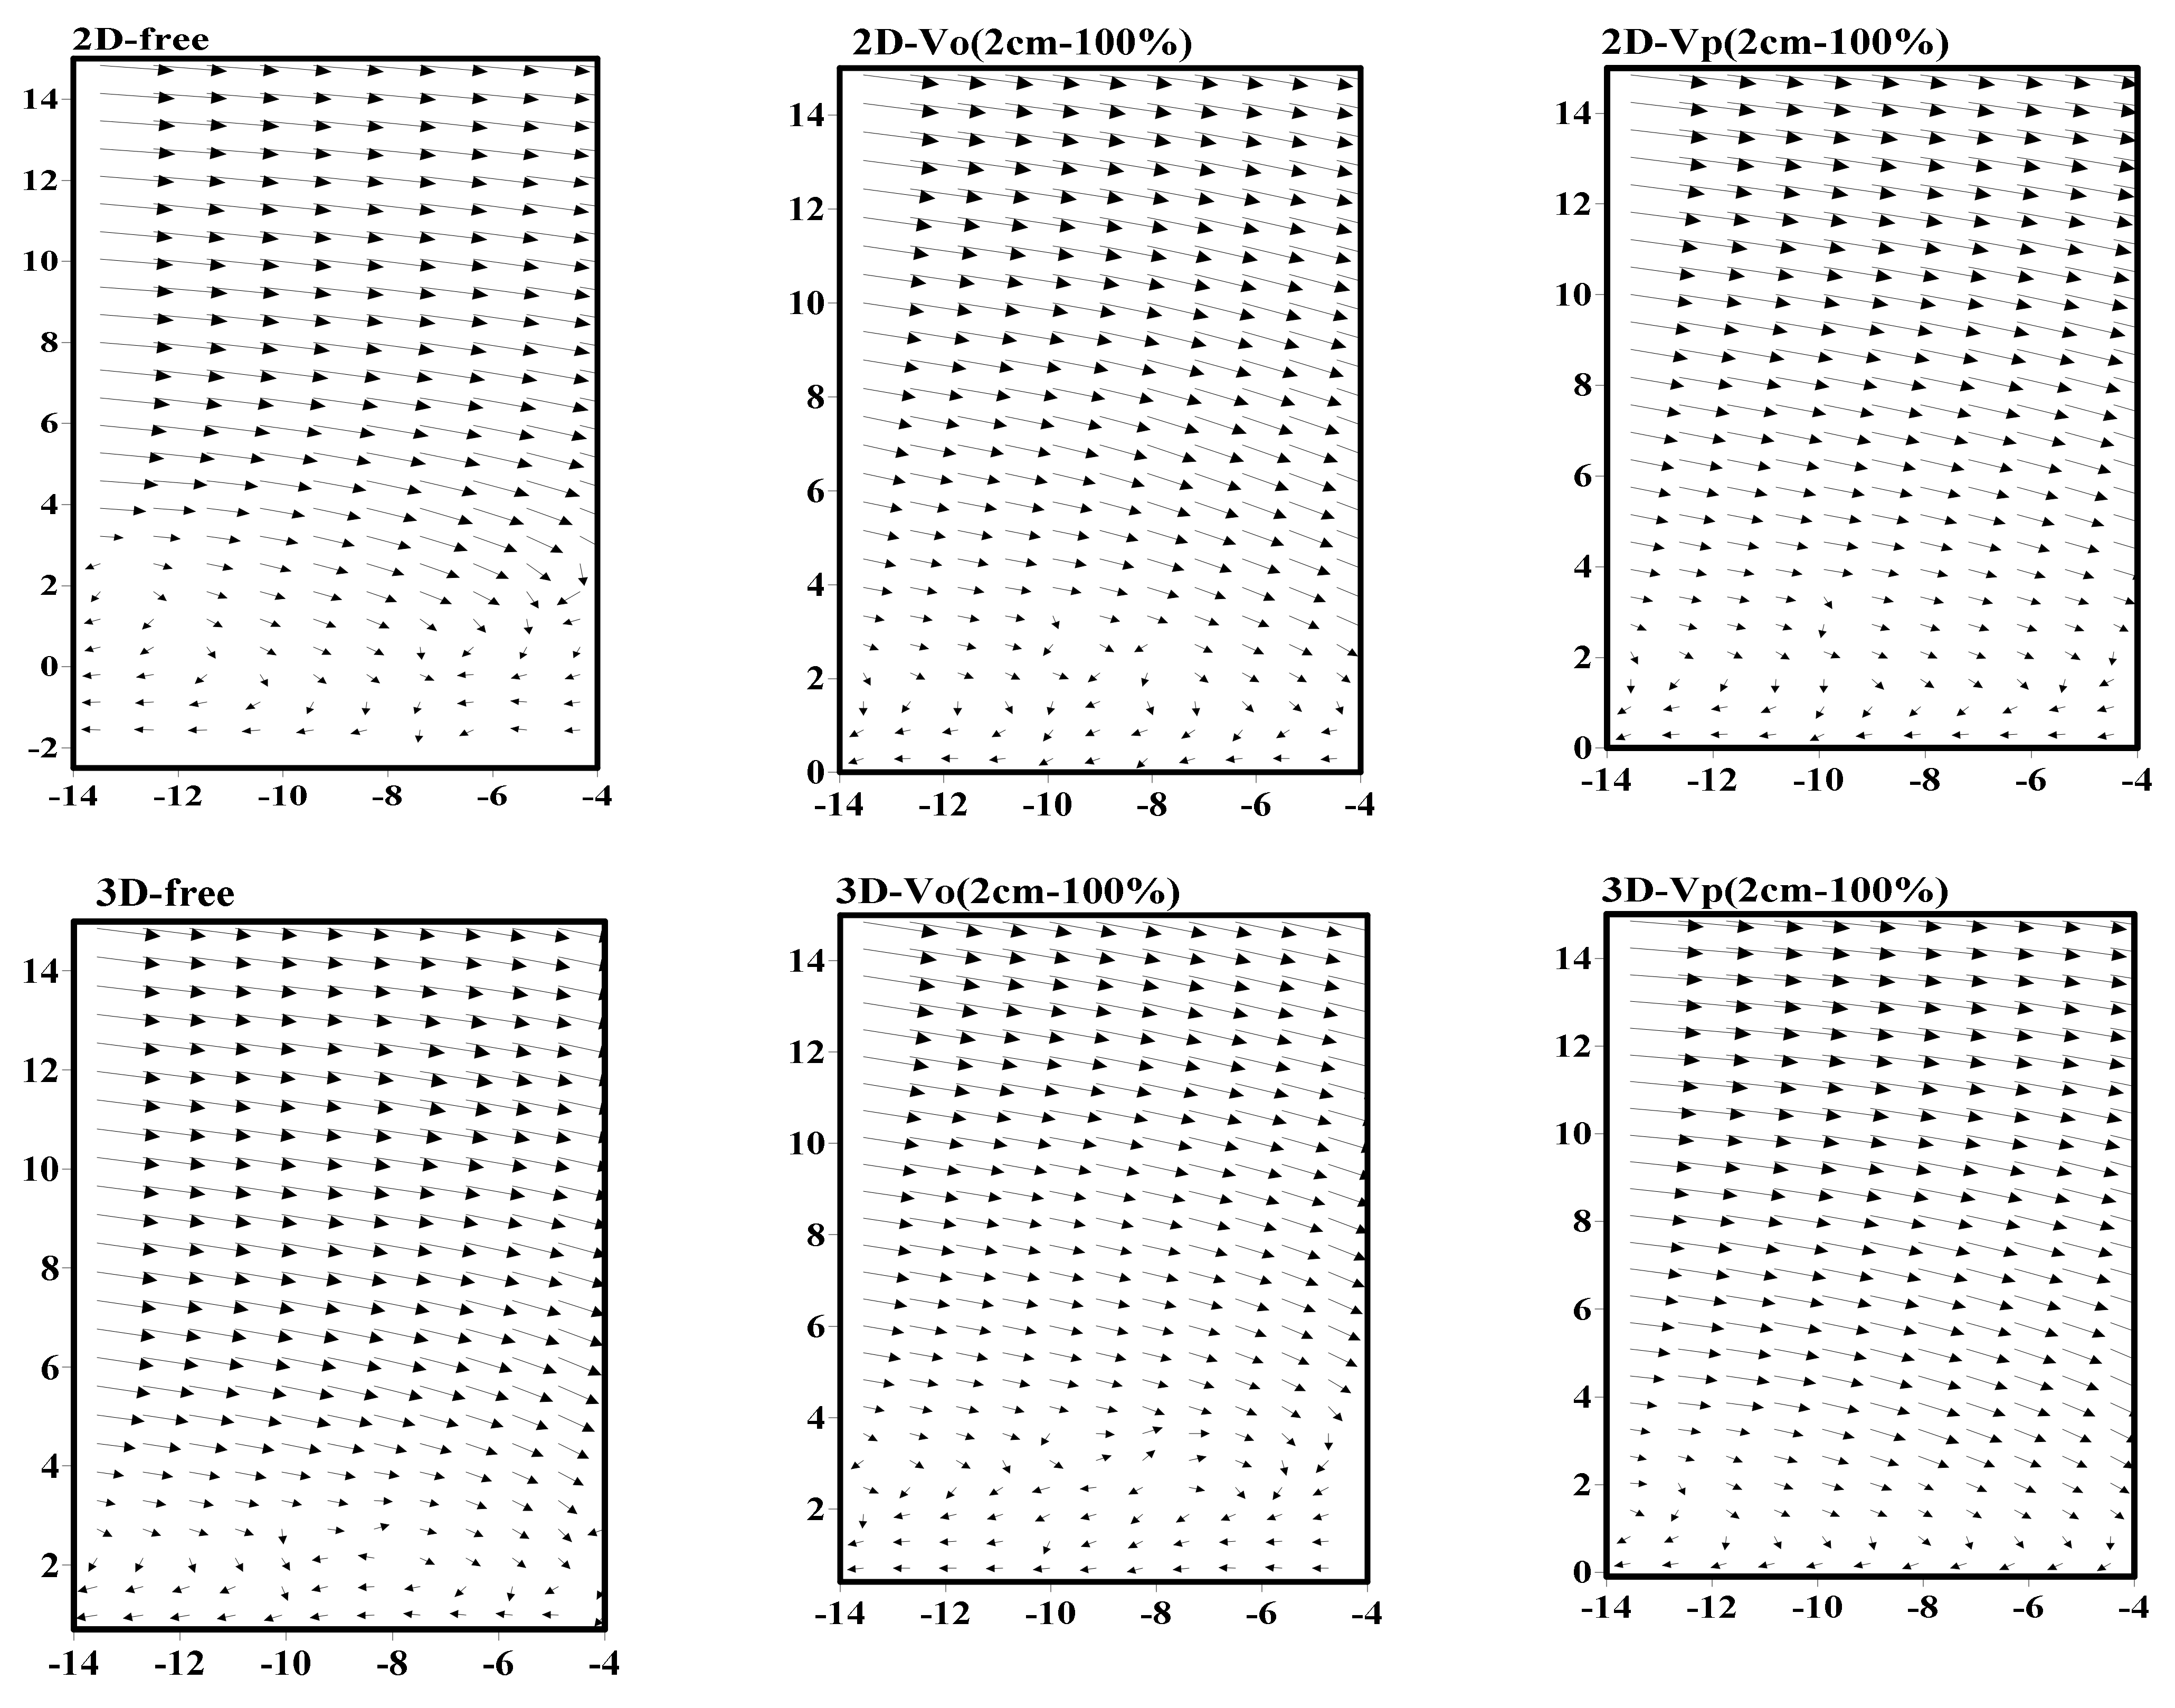
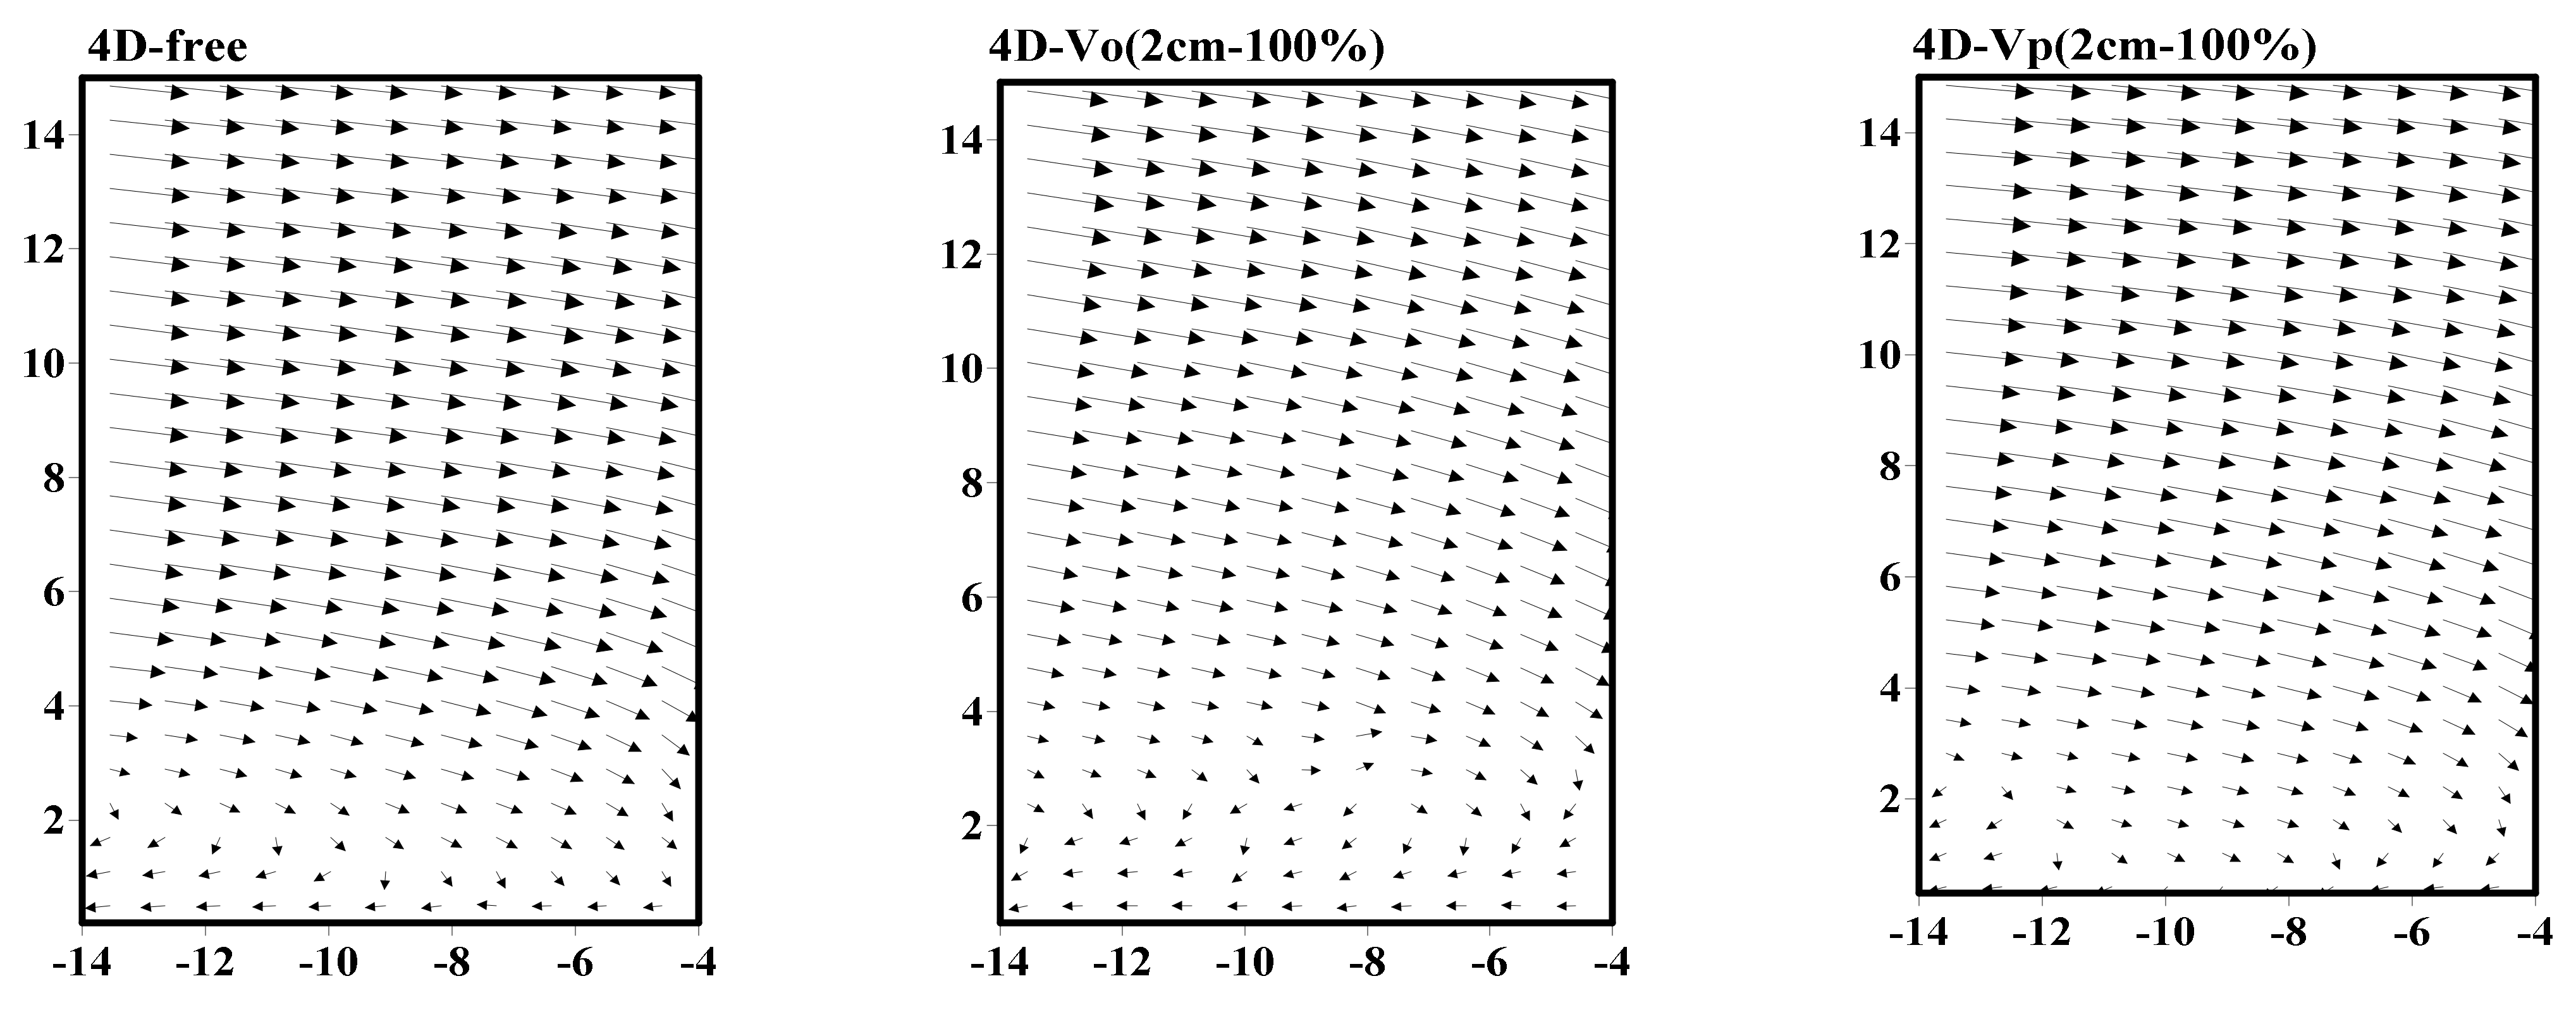
3.4. Resultant Velocity Vector

Figure 10 shows the X–Z resultant velocity vector on the center axis of the channel upstream of the first pile in the single pile case. The diagrams were drawn using the 2-Grid vector feature in Surfer software. The vertical and horizontal axes display the height from the bed surface and the distance from the first pile in centimeters, respectively. This diagram shows downstream flow, which leads to scouring holes and horseshoe vortices.
In the case of a single pile without vegetation, the values of the velocity result have a more significant and more variable gradient, especially when approaching the pile. These changes are observed from the water level to the bed surface in the longitudinal direction. In comparison, vegetation helps to have a more uniform velocity from the surface up to z = 4 and has a much lower gradient. The downstream location is at z = 8, while vegetation reduces this area to z = 4. Further, the horseshoe vortex flow is more intense when vegetation is absent and extends upstream. However, when vegetation is present, this boundary is restricted to the upstream of the pile, i.e., 10.5 m from the channel’s beginning. In summary, the presence of vegetation inhibits the strength of the horseshoe vortex and affects the location of the downstream flow, thereby reducing the expansion of the scour hole.
Figure 11 shows the X–Z resultant velocity vector on the center axis of the channel upstream of the first pile in the pile group case. Compared with the single-pile case, the triple pile case shows a more regular vector path, and the gradient has a lower velocity, suggesting that the pile group helps reduce turbulence. The result is like the single-pile case for the pile group case when vegetation is present. Fewer velocity gradients, more regular velocity vectors, reduction of downstream flow amplitude, and inhibition of horseshoe vortices were some of the advantages of using vegetation in this study. The results show that increasing the distance between the pile has no significant effect on the formation of the horseshoe vortex upstream of the first pile. Vegetation reduces the velocity around the bridge pile.

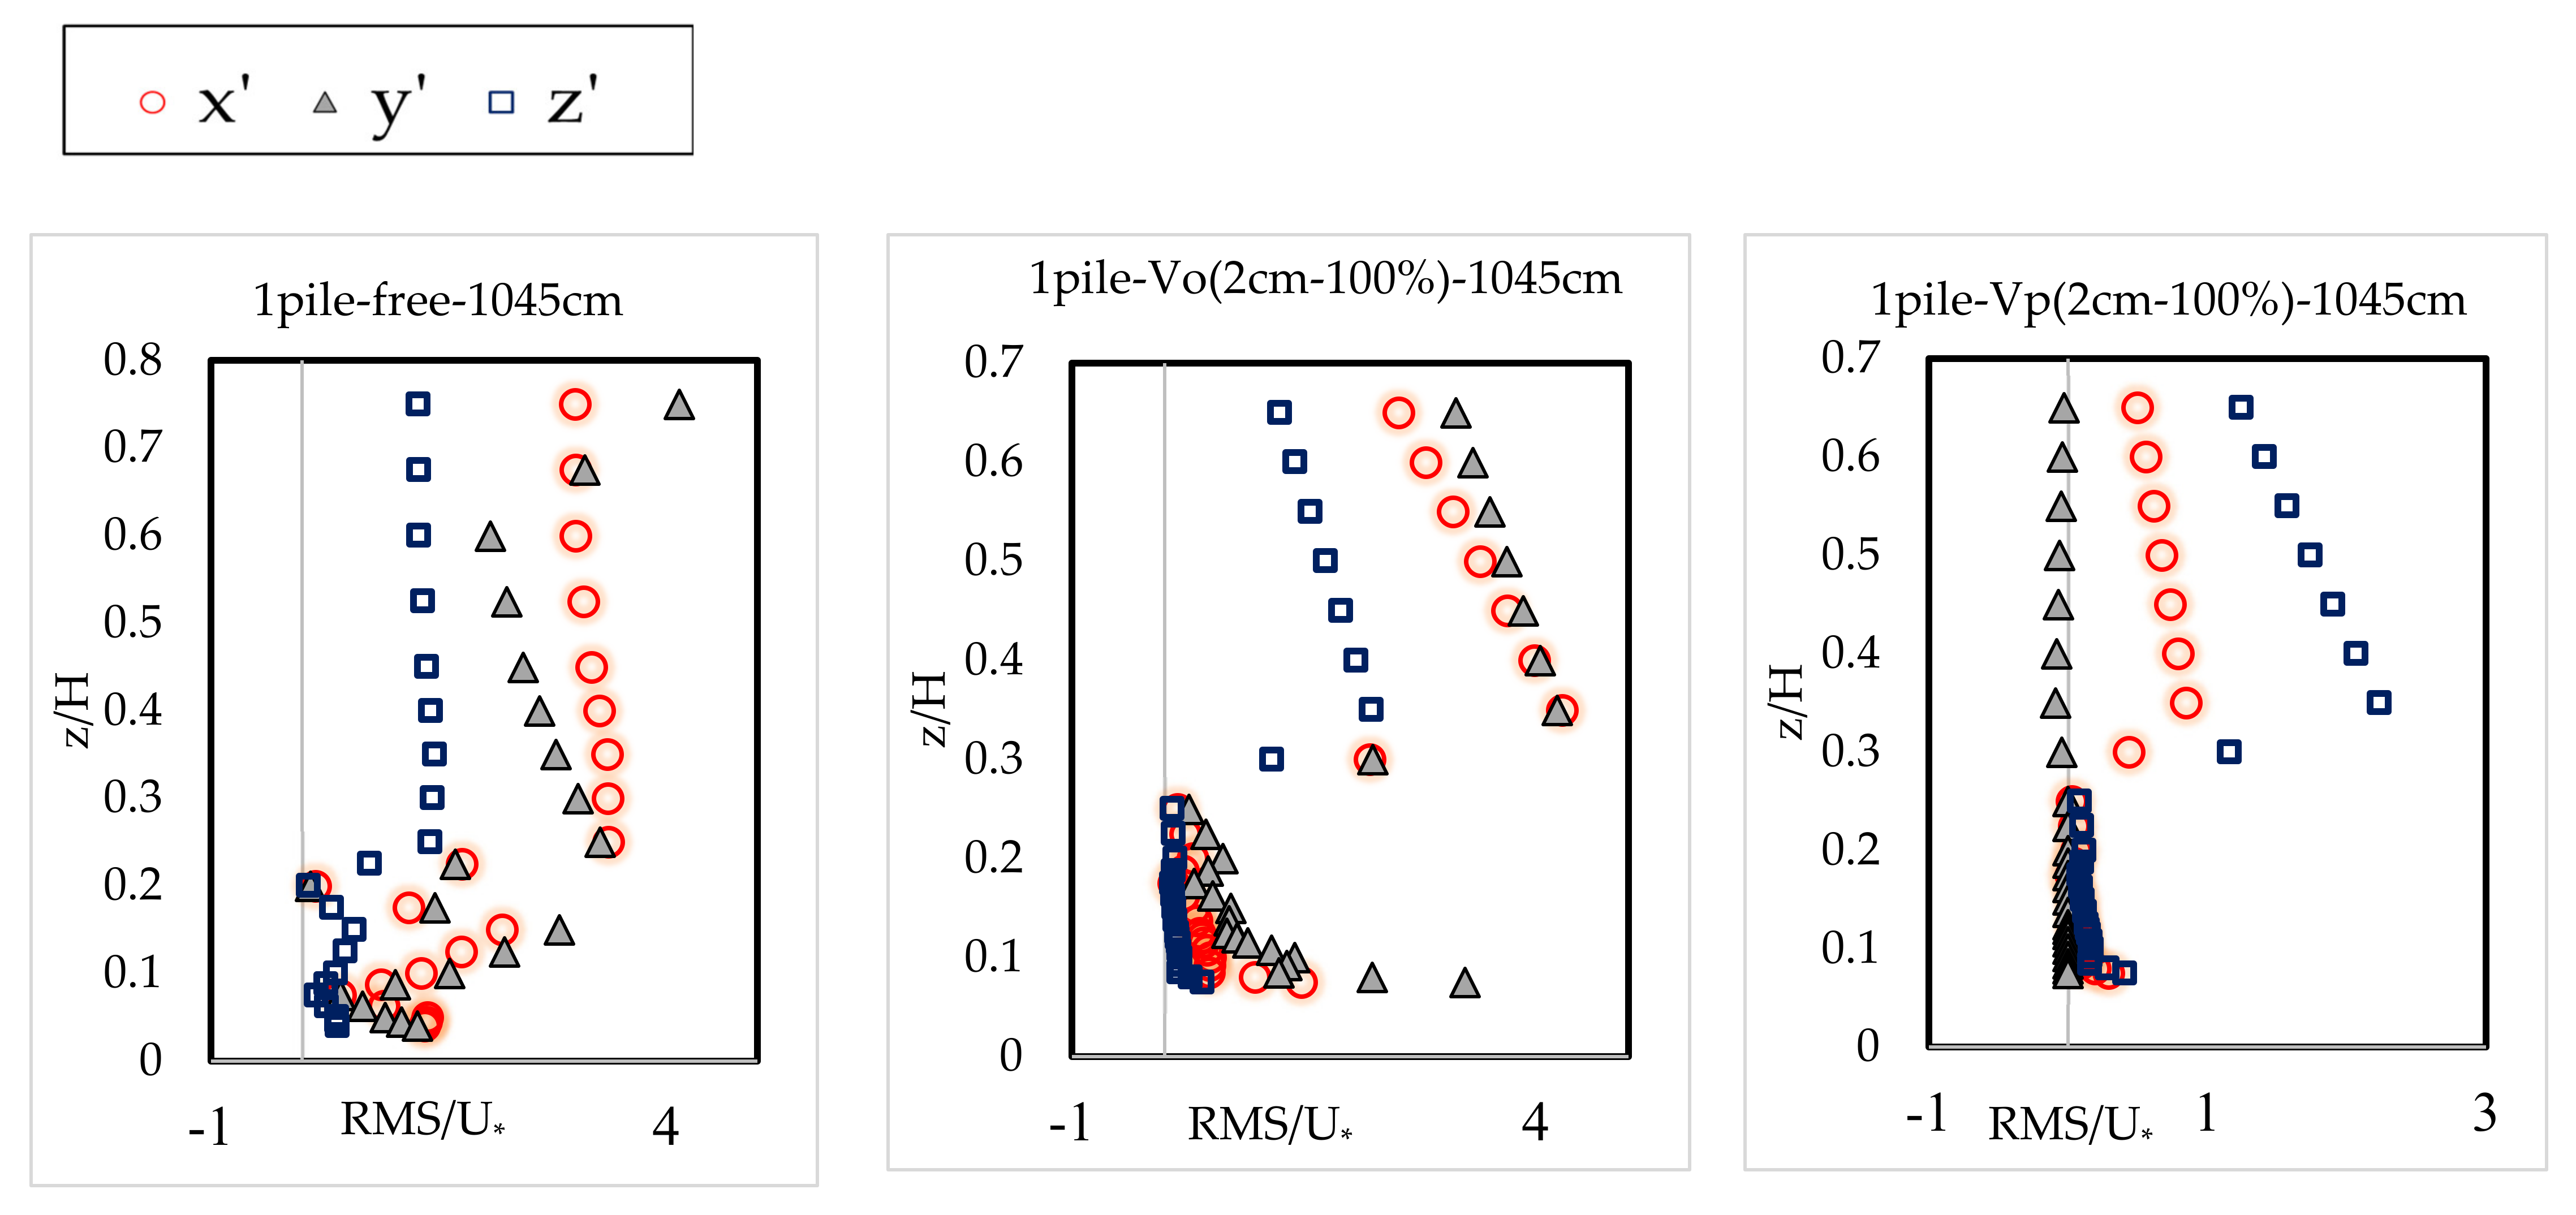
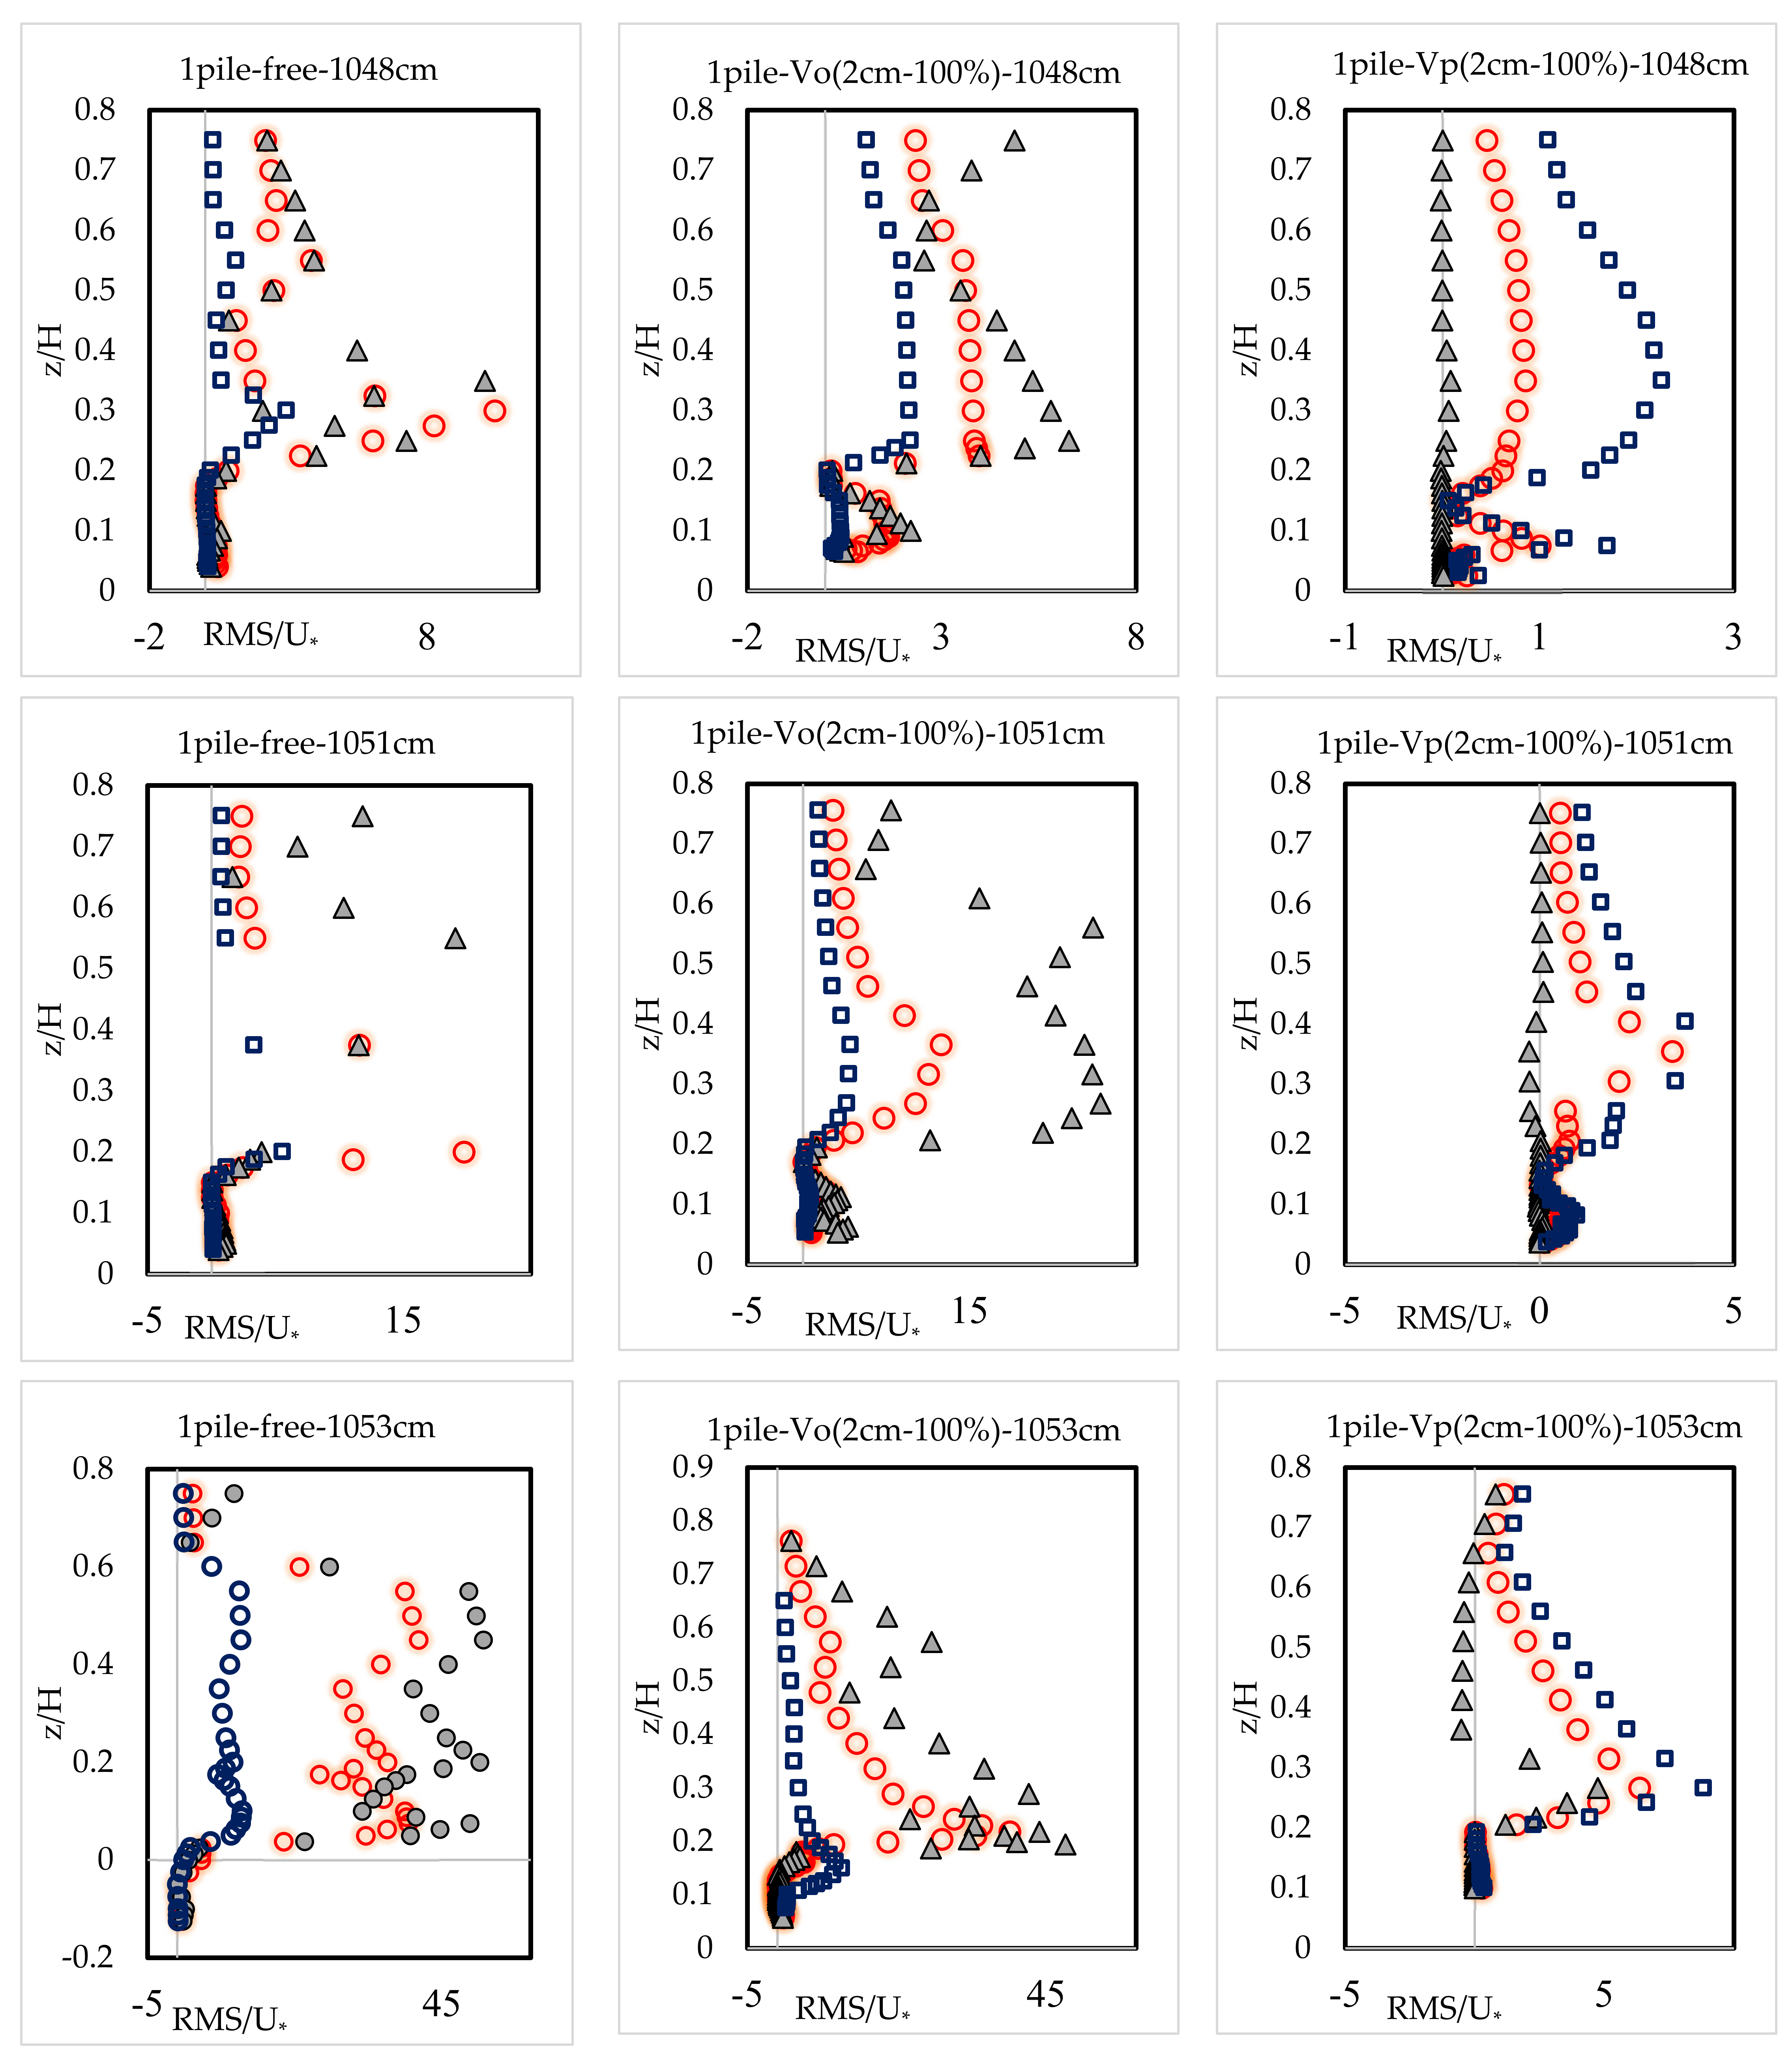
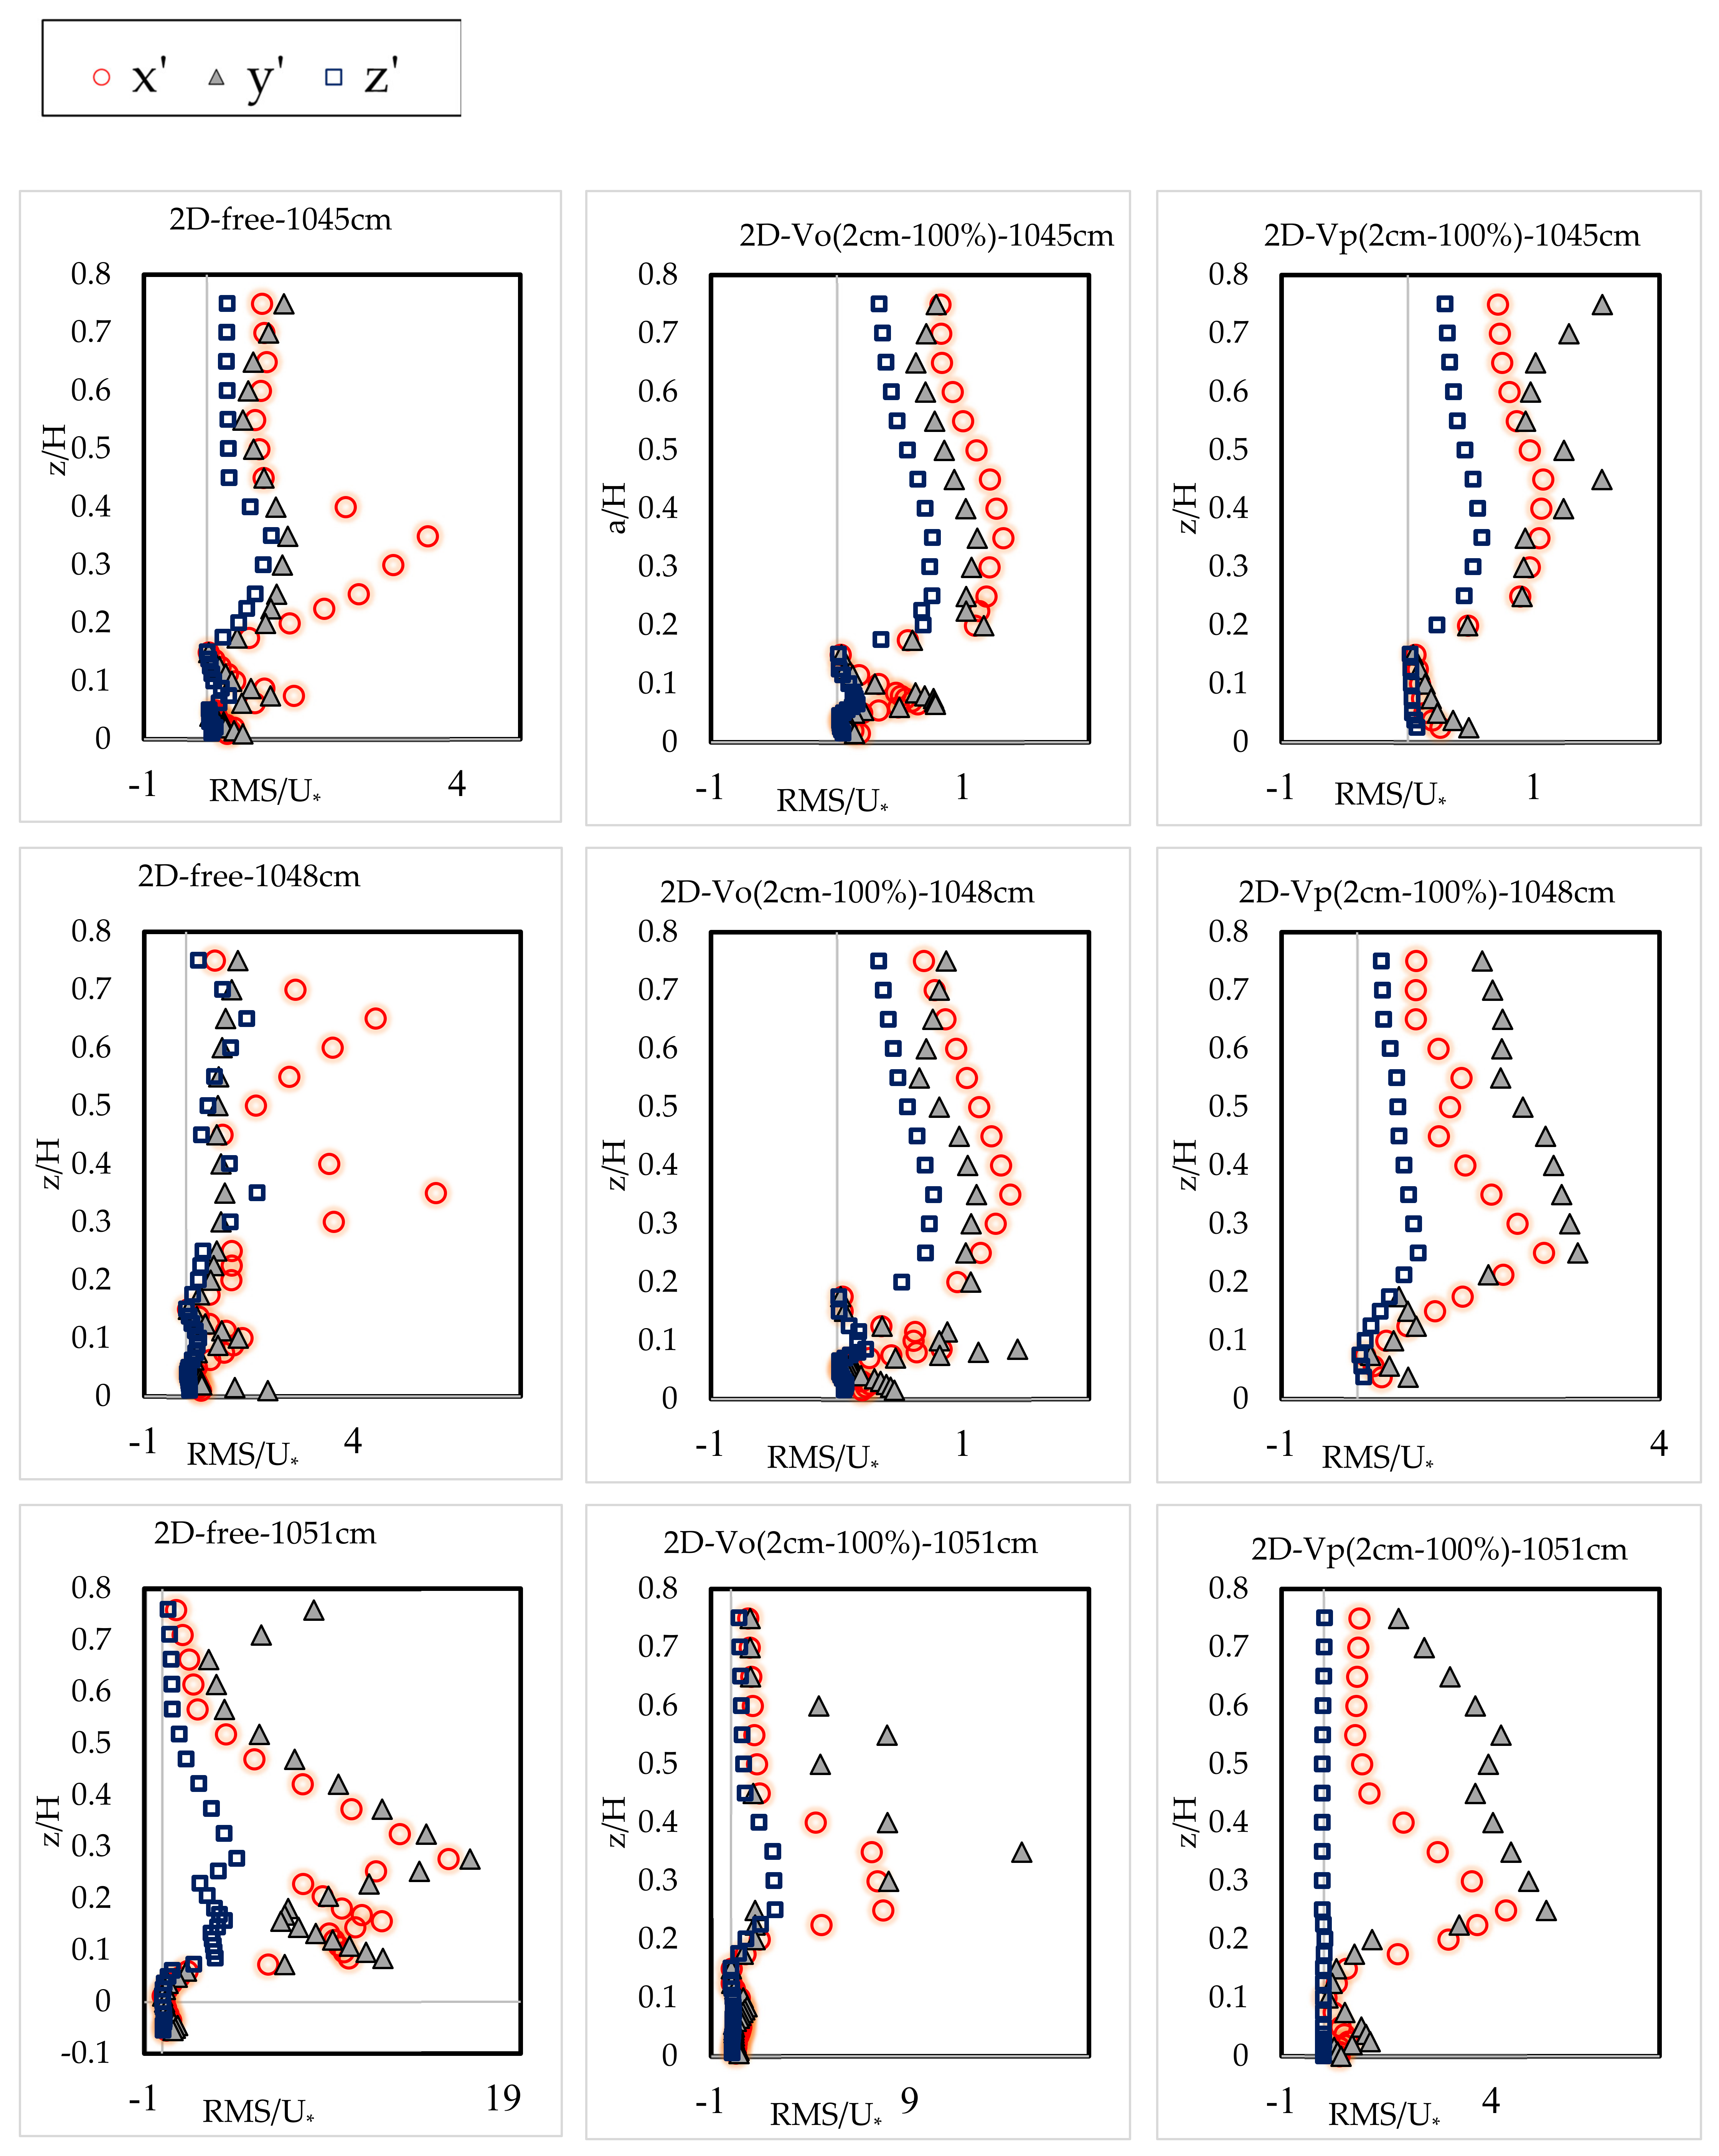
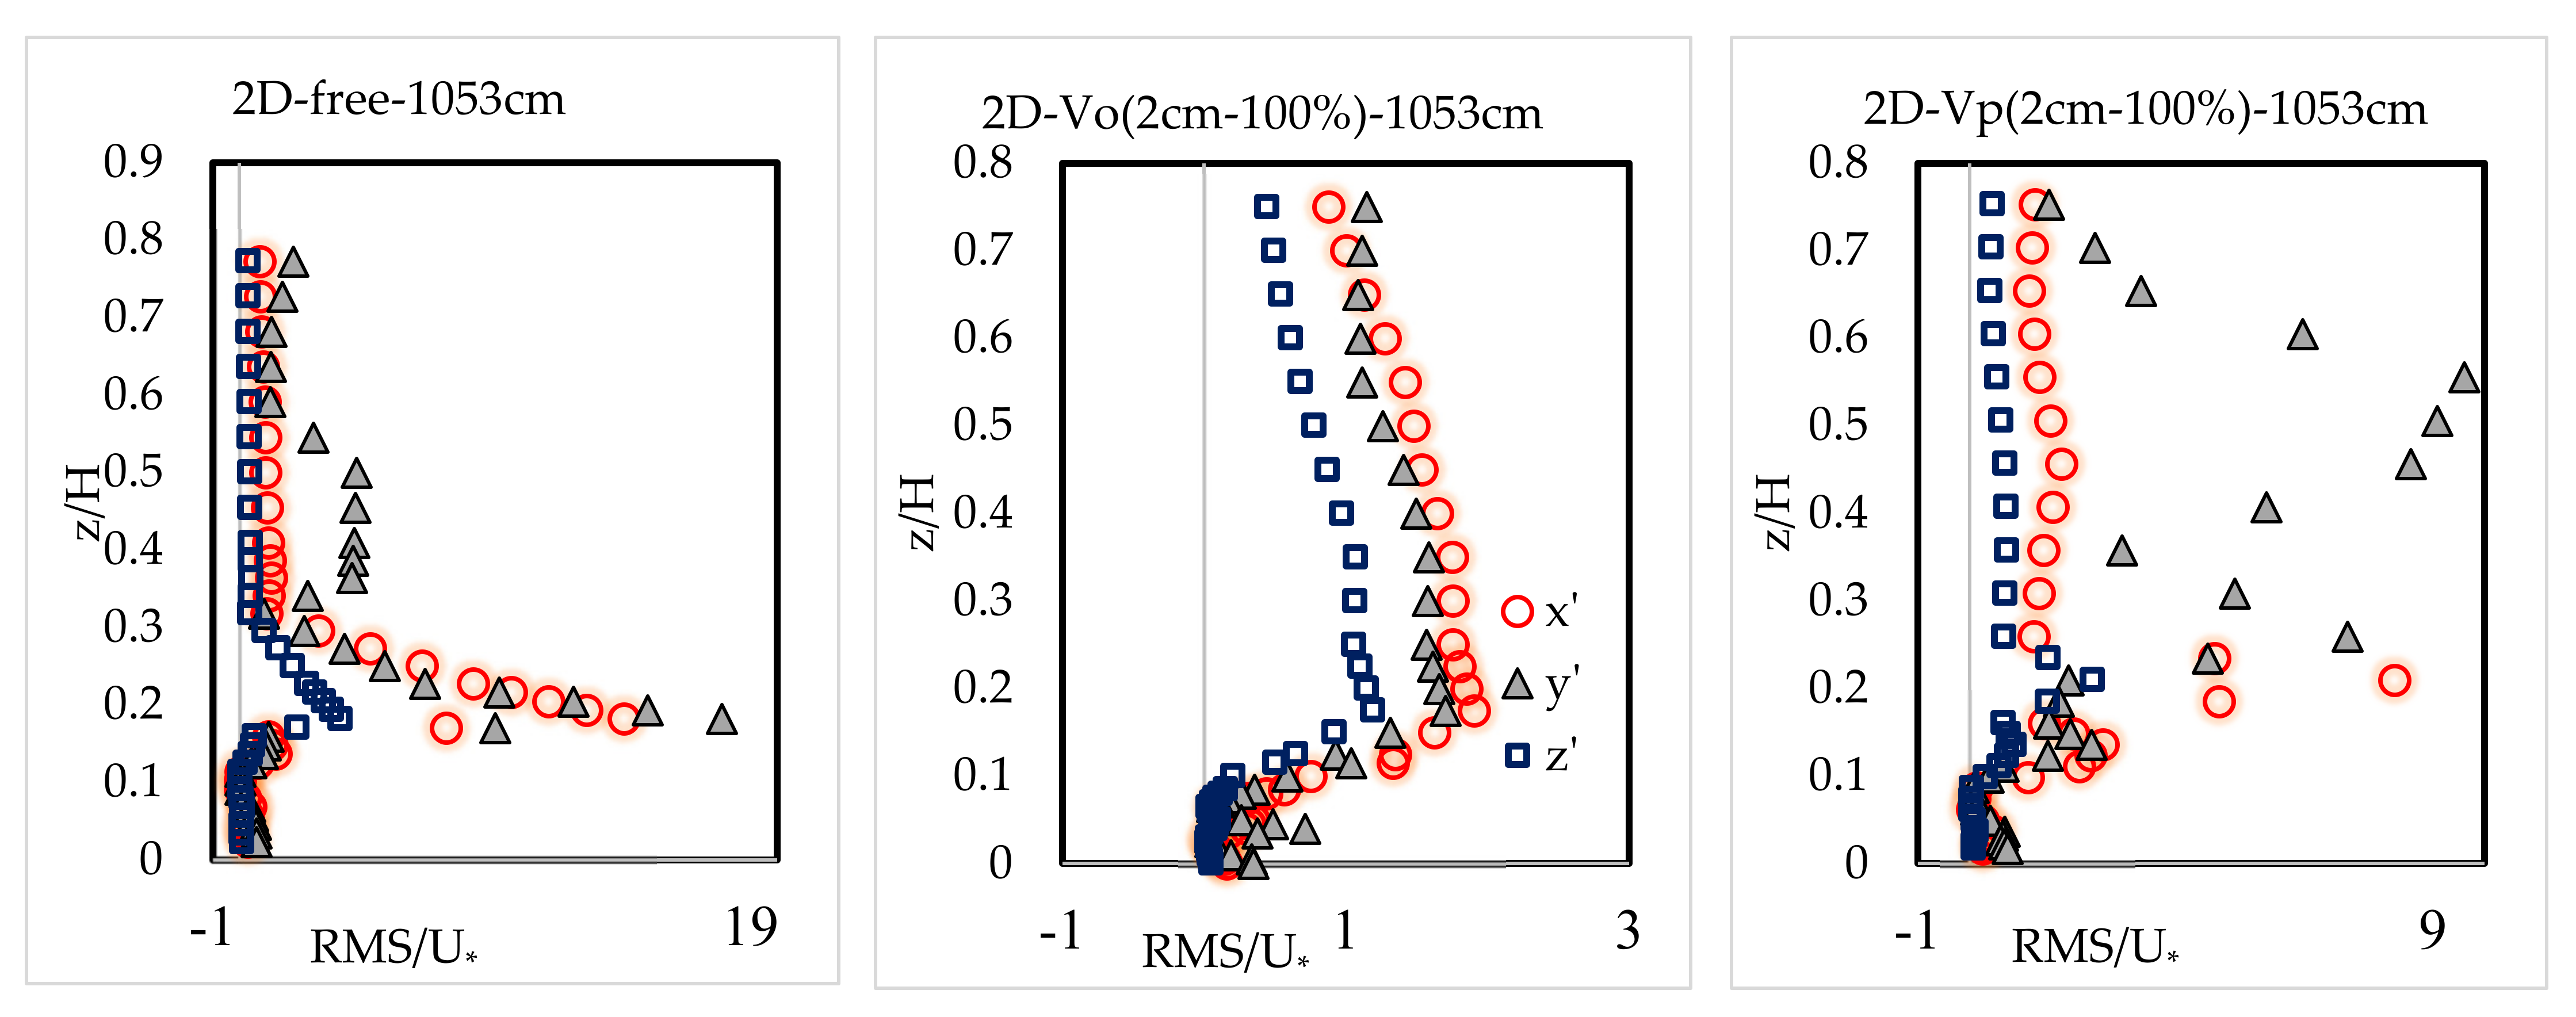
3.5. Turbulence Intensity

In the case of a single pile at all distances from the pile, vegetation reduces the turbulence intensity, especially in the areas near the bed. Also, patched vegetation has effectively reduced the disturbance intensity in the horizontal direction. It was observed that vegetation in the overall and patched types reduced the turbulence intensity in the triple pile group with G/D = 2. Similar results were observed for the triple pile group with G/D = 3 and G/D = 4. In this experiment, vegetation reduced the intensity of horizontal and vertical turbulence, resulting in a weaker horseshoe vortex and wake vorticity.
Figure 12 shows the vertical distributions of the longitudinal, latitudinal, and vertical turbulent intensity components normalized by shear stress (U*) in a single pile case. Also, the vertical distributions of the longitudinal, latitudinal, and vertical turbulent intensity components normalized by shear stress in a triple pile group with G/D = 2 was shown in Figure 13 (as an example of the triple group pile).

4. Conclusions

In this research, the combination of vegetation and triple piles were employed as an unstudied method to reduce scour with the flow angle facing the pile of 0 degrees. The results show that using the pile group with G/D = 2 and overall vegetation, a 40% reduction in the scouring rate was observed compared to the single pile without vegetation. Increases in vegetation height and density result in further decreases in scour depth. Increasing the height of vegetation was more effective in reducing scouring than increasing the density. According to the hypothesis expressed in this study, the use of vegetation throughout the flow structure can decrease scouring substantially. The presence of secondary currents, current deviation from the central axis, and movement towards the walls reduced the average velocity, especially behind the piles. As a result, the Dip parameter increased behind the piles. Application of pile groups instead of single piles, increasing the distance between the piles, and the presence of vegetation led to an increase in the amount of dip and a decrease in velocity fluctuations, resulting in turbulence.
Strong rotational currents around the pile have drastically reduced the longitudinal velocity values near the bed and inside the scour hole. As in many cases, the velocity has been negated near the bed. Negative values, indicating current separation and the presence of eddy systems, decreased as they moved away from the pile. The presence of vegetation reduced the velocity gradient, which decreased the flow turbulence. The single pile case observed the most significant effect of vegetation in reducing scour and regularity of velocities. As a result of using the vegetation upstream of the pile, the down-flow was reduced upstream of the first pile, velocity gradients were lower, velocity vectors had regularity, and they were parallel to the water flow. They also reduced the down-flow amplitude and inhibited horseshoe vortices. Examination of velocity vectors behind the piles shows that vegetation effectively decreases velocity, lowers the upward flow strength behind the piles, and lessens the wake vortex strength. Patched vegetation has a minimal effect on the velocity gradient upstream of the third pile. The highest reduction rate in velocity belonged to the pile group case, with the distance between piles equal to 2D, which had the lowest scouring value in the present study as well.
According to this study’s findings, it was recommended to utilize vegetation across the flume. Therefore, using vegetation upstream of the bridge foundation can be a valuable, effective, inexpensive, and environmentally friendly solution. Engineers can curb the effects of scouring the bridge pile by growing aquatic vegetation on the shores and in the waterway bed. Using this method is very valuable for several reasons. First, vegetation is environmentally friendly. Second, the root system of the plant is complex and robust. They sink into the soil and stabilize themselves against the water flow. Also, this method is suitable and practical for previously built bridges, for which it is no longer possible to apply other methods of reducing scour such as collars and gaps.
Using aquatic vegetation in the riverbed is a valuable solution in biotechnical engineering. Vegetation is considered a solution for bridge pile scouring control in a long-term and gradual timespan.
In the low-flow condition in sandy beds, fine-grained sediments can be deposited between the sands and provide the riverbed for the growth of vegetation and their roots stabilization. Also, upstream of the bridge pile, where the flow velocity decreases due to collision with the bridge pile, provides a suitable place for vegetation growth.
It is possible to use artificial methods of placing vegetation in the riverbed to avoid the limitation of aquatic plants growing in sandy beds that are subject to the most scouring. This research solution to stabilize the vegetation on the riverbed is to use a fence screen with fine meshes in which the vegetation roots can be fixed. The fence can be placed at the bed river in low flow conditions by diverting the flow path. The use of these fence screens can be investigated in future research. This research found that, like overall vegetation, patched vegetation effectively reduces scouring in bridge piles. The patched vegetation does not increase flood risk as much as the overall vegetation due to its lower resistance to flow.
This topic has much research potential. Future researchers could investigate how effective a combination of scouring control conventional methods and vegetation can be. Also, future research can change the characteristics of the bed material and investigate its effect on scouring in the presence of vegetation.

Author Contributions

Conceptualization, N.M.M. and R.F.; methodology, N.M.M. and M.H.; software, N.M.M.; validation, N.M.M. and R.F.; formal analysis, N.M.M.; investigation, N.M.M. and M.H.; resources, N.M.M.; writing—original draft preparation, N.M.M.; writing—review and editing, R.F., A.K. and J.R.-C.; supervision, R.F.; All authors have read and agreed to the published version of the manuscript.

Funding

This research received no external funding.

Data Availability Statement

The data presented in this study are available in the article.

Conflicts of Interest

The authors declare no conflict of interest.

References

  1. Angillieri, M.Y.E.; Perucca, L.; Vargas, N. Catastrophic flash flood triggered by an extreme rainfall event in El Rodeo village, January 2014. Northwestern Pampean Ranges of Argentina. Geogr. Ann. Ser. A Phys. Geogr. 2016, 99, 72–84. [Google Scholar] [CrossRef]
  2. Camarasa-Belmonte, A.M. Flash floods in Mediterranean ephemeral streams in Valencia Region (Spain). J. Hydrol. 2016, 541, 99–115. [Google Scholar] [CrossRef]
  3. Carisi, F.; Domeneghetti, A.; Gaeta, M.G.; Castellarin, A. Is anthropogenic land subsidence a possible driver of riverine flood-hazard dynamics? A case study in Ravenna, Italy. Hydrol. Sci. J. 2017, 62, 2440–2455. [Google Scholar] [CrossRef] [Green Version]
  4. Chang, S.E.; Yip, J.Z.K.; Conger, T.; Oulahen, G.; Gray, E.; Marteleira, M. Explaining communities’ adaptation strategies for coastal flood risk: Vulnerability and institutional factors. J. Flood Risk Manag. 2020, 13, e12646. [Google Scholar] [CrossRef]
  5. Alyazichi, Y.M.; Jones, B.G.; McLean, E. Spatial distribution of sediment particles and trace element pollution within Gunnamatta Bay, Port Hacking, NSW, Australia. Reg. Stud. Mar. Sci. 2015, 2, 124–131. [Google Scholar] [CrossRef] [Green Version]
  6. Wu, L.; Qiao, S.; Peng, M.; Ma, X. Coupling loss characteristics of runoff-sediment-adsorbed and dissolved nitrogen and phosphorus on bare loess slope. Environ. Sci. Pollut. Res. 2018, 25, 14018–14031. [Google Scholar] [CrossRef]
  7. Zaid, M.; Yazdanfar, Z.; Chowdhury, H.; Alam, F. A review on the methods used to reduce the scouring effect of bridge pier. Energy Procedia 2019, 160, 45–50. [Google Scholar] [CrossRef]
  8. Pandey, M.; Sharma, P.K.; Ahmad, Z.; Karna, N. Maximum scour depth around bridge pier in gravel bed streams. Nat. Hazards 2017, 91, 819–836. [Google Scholar] [CrossRef]
  9. Choufu, L.; Abbasi, S.; Pourshahbaz, H.; Taghvaei, P.; Tfwala, S. Investigation of Flow, Erosion, and Sedimentation Pattern around Varied Groynes under Different Hydraulic and Geometric Conditions: A Numerical Study. Water 2019, 11, 235. [Google Scholar] [CrossRef] [Green Version]
  10. Ghaderi, A.; Abbasi, S. CFD simulation of local scouring around airfoil-shaped bridge piers with and without collar. Sādhanā 2019, 44, 216. [Google Scholar] [CrossRef] [Green Version]
  11. Guan, D.; Chiew, Y.-M.; Wei, M.; Hsieh, S.-C. Characterization of horseshoe vortex in a developing scour hole at a cylindrical bridge pier. Int. J. Sediment Res. 2018, 34, 118–124. [Google Scholar] [CrossRef]
  12. Shahriar, A.R.; Montoya, B.M.; Ortiz, A.C.; Gabr, M.A. Quantifying probability of deceedance estimates of clear water local scour around bridge piers. J. Hydrol. 2021, 597, 126177. [Google Scholar] [CrossRef]
  13. Azamathulla, H.M.; Yusoff, M.; Hasan, Z. Scour below submerged skewed pipeline. J. Hydrol. 2014, 509, 615–620. [Google Scholar] [CrossRef]
  14. Qi, W.-G.; Gao, F.-P. Physical modeling of local scour development around a large-diameter monopile in combined waves and current. Coast. Eng. 2014, 83, 72–81. [Google Scholar] [CrossRef] [Green Version]
  15. Qi, M.; Li, J.; Chen, Q. Comparison of existing equations for local scour at bridge piers: Parameter influence and validation. Nat. Hazards 2016, 82, 2089–2105. [Google Scholar] [CrossRef]
  16. Bestawy, A.; Eltahawy, T.; Alsaluli, A.; Almaliki, A.; AlQurashi, M. Reduction of local scour around a bridge pier by using different shapes of pier slots and collars. Water Supply 2020, 20, 1006–1015. [Google Scholar] [CrossRef]
  17. Tafarojnoruz, A.; Gaudio, R.; Dey, S. Flow-altering countermeasures against scour at bridge piers: A review. J. Hydraul. Res. 2010, 48, 441–452. [Google Scholar] [CrossRef]
  18. Borja, M.E.L.; Zema, D.A.; Guzman, M.D.H.; Yang, Y.; Hernández, A.C.; Xiangzhou, X.; Carrà, B.G.; Nichols, M.; Cerdá, A. Exploring the influence of vegetation cover, sediment storage capacity and channel dimensions on stone check dam conditions and effectiveness in a large regulated river in México. Ecol. Eng. 2018, 122, 39–47. [Google Scholar] [CrossRef] [Green Version]
  19. Rossi, M.J.; Ares, J.O.; Jobbágy, E.G.; Vivoni, E.R.; Vervoort, R.W.; Schreiner-McGraw, A.P.; Saco, P.M. Vegetation and terrain drivers of infiltration depth along a semiarid hillslope. Sci. Total Environ. 2018, 644, 1399–1408. [Google Scholar] [CrossRef]
  20. Albert, C.; Hack, J.; Schmidt, S.; Schröter, B. Planning and governing nature-based solutions in river landscapes: Concepts, cases, and insights. Ambio 2021, 50, 1405–1413. [Google Scholar] [CrossRef] [PubMed]
  21. Hoyek, A.; Arias-Rodriguez, L.F.; Perosa, F. Holistic Approach for Estimating Water Quality Ecosystem Services of Danube Floodplains: Field Measures, Remote Sensing, and Machine Learning. Hydrobiology 2022, 1, 211–231. [Google Scholar] [CrossRef]
  22. Tickner, D.; Parker, H.; Moncrieff, C.R.; Oates, N.E.M.; Ludi, E.; Acreman, M. Managing Rivers for Multiple Benefits–A Coherent Approach to Research, Policy and Planning. Front. Environ. Sci. 2017, 5, 4. [Google Scholar] [CrossRef] [Green Version]
  23. Richardson, D.M.; Holmes, P.M.; Esler, K.J.; Galatowitsch, S.M.; Stromberg, J.C.; Kirkman, S.P.; Pyšek, P.; Hobbs, R.J. Riparian vegetation: Degradation, alien plant invasions, and restoration prospects. Divers. Distrib. 2007, 13, 126–139. [Google Scholar] [CrossRef]
  24. Huang, W.; Yano, S.; Lin, L.; Zhang, J. Using Functional Indicators to Assess the River Health Under Partial Flow Restoration. In Proceedings of the International Symposium on Water Resource and Environmental Protection, Xi’an, China, 20–22 May 2011; pp. 501–504. [Google Scholar]
  25. Huai, W.-X.; Zhang, J.; Katul, G.G.; Cheng, Y.-G.; Tang, X.; Wang, W.-J. The structure of turbulent flow through submerged flexible vegetation. J. Hydrodyn. 2019, 31, 274–292. [Google Scholar] [CrossRef]
  26. Zhang, H.B.; Meng, H.J.; Liu, X.D.; Zhao, W.J.; Wang, X.P. Vegetation characteristics and ecological restoration technology of typical degradation wetlands in the middle of heihe river basin, zhangye city of gansu province. Wetl. Sci. 2012, 10, 194–199. [Google Scholar]
  27. Evans, J.H. Dimensional Analysis and the Buckingham Pi Theorem. Am. J. Phys. 1972, 40, 1815–1822. [Google Scholar] [CrossRef]
  28. Chiew, Y.M.; Melville, B.W. Local Scour Around Bridge Piles. J. Hydraul. Res. 1987, 25, 15–26. [Google Scholar] [CrossRef]
  29. Afzalimehr, H.; Singh, V.P.; Najafabadi, E.F. Determination of Form Friction Factor. J. Hydrol. Eng. 2010, 15, 237–243. [Google Scholar] [CrossRef]
  30. Raudkivi, A.J.; Ettema, R. Clear-Water Scour at Cylindrical Piers. J. Hydraul. Eng. 1983, 109, 338–350. [Google Scholar] [CrossRef]
  31. Laursen, E.M. An Analysis of Relief Bridge Scour. J. Hydraul. Div. 1963, 89, 93–118. [Google Scholar] [CrossRef]
  32. McGlinchey, D. Characterisation of Bulk Solids; John Wiley & Sons: Hoboken, NJ, USA, 2009. [Google Scholar]
  33. Ettema, R. Scour at Bridge Piers: A Report Submitted to the National Roads Board. Ph.D. Thesis, The University of Auckland, Auckland, New Zealand, 1980. [Google Scholar]
  34. Cao, Z.; Pender, G.; Meng, J. Explicit Formulation of the Shields Diagram for Incipient Motion of Sediment. J. Hydraul. Eng. 2006, 132, 1097–1099. [Google Scholar] [CrossRef]
  35. Pagliara, S.; Carnacina, I. Temporal scour evolution at bridge piers: Effect of wood debris roughness and porosity. J. Hydraul. Res. 2010, 48, 3–13. [Google Scholar] [CrossRef]
  36. Liu, J.; Gao, G.; Wang, S.; Jiao, L.; Wu, X.; Fu, B. The effects of vegetation on runoff and soil loss: Multidimensional structure analysis and scale characteristics. J. Geogr. Sci. 2018, 28, 59–78. [Google Scholar] [CrossRef] [Green Version]
  37. Zhang, X.; Yu, G.Q.; Bin Li, Z.; Li, P. Experimental Study on Slope Runoff, Erosion and Sediment under Different Vegetation Types. Water Resour. Manag. 2014, 28, 2415–2433. [Google Scholar] [CrossRef]
  38. El Kateb, H.; Zhang, H.; Zhang, P.; Mosandl, R. Soil erosion and surface runoff on different vegetation covers and slope gradients: A field experiment in Southern Shaanxi Province, China. CATENA 2013, 105, 1–10. [Google Scholar] [CrossRef]
  39. Yu, Y.; Zhu, R.; Ma, D.; Liu, D.; Liu, Y.; Gao, Z.; Rodrigo-Comino, J. Multiple surface runoff and soil loss responses by sandstone morphologies to land-use and precipitation regimes changes in the Loess Plateau, China. CATENA 2022, 217, 106477. [Google Scholar] [CrossRef]
  40. Dey, S.; Barbhuiya, A.K. Turbulent flow field in a scour hole at a semicircular abutment. Can. J. Civ. Eng. 2005, 32, 213–232. [Google Scholar] [CrossRef]
  41. Ahmed, F.; Rajaratnam, N. Observations on Flow around Bridge Abutment. J. Eng. Mech. 2000, 126, 51–59. [Google Scholar] [CrossRef]
  42. Kumar, A.; Kothyari, U.C. Three-Dimensional Flow Characteristics within the Scour Hole around Circular Uniform and Compound Piers. J. Hydraul. Eng. 2012, 138, 420–429. [Google Scholar] [CrossRef]
  43. Lashminarayana, P.; Sarma, N.; Rao, N.S.L. Dip in Vertical Velocity Profiles and Fow in Rectangular Open Channel Flow. In Proceedings of the 21st IAHR Congress, Melbourne, VIC, Australia, 13–18 August 1984. [Google Scholar]
  44. Afzalimehr, H.; Dey, S. Influence of bank vegetation and gravel bed on velocity and Reynolds stress distributions. Int. J. Sediment Res. 2009, 24, 236–246. [Google Scholar] [CrossRef]
  45. Fazel Najafabadi, E. Experimental Investigation of the Effect of Vegetation on the Wall and Non-Stick Sediments in the Floor of a Flume on Turbulent Flow Components under Optimal Pressure Gradients. Master’s Thesis, Faculty of Agriculture, Isfahan University of Technology, Daneshgah e Sanati Hwy, Iran, 2010. [Google Scholar]
Figure 1. Schematic diagram of water flow and scour around the single pile.
Water 14 02382 g001
Figure 2. Experimental setup and a scheme of the flume at IUT.
Water 14 02382 g002
Figure 3. Investigation of flow development in the measurement’s places.
Water 14 02382 g003
Figure 4. Experiment design. (a) The arrangement of the piles, (b) vegetation used (2 cm height), (c) patched vegetation, (d) overall vegetation, (e) scouring hole, (f) limnimeter.
Water 14 02382 g004
Figure 5. Series of experiments flowchart.
Water 14 02382 g005
Figure 6. Scouring temporal development for (a) all cases free and with vegetation type 1, (b) single pile, (c) triple pile group with 2D distance, (d) triple pile group with 3D distance, and (e) triple pile group with 4D distance.
Water 14 02382 g006aWater 14 02382 g006b
Figure 7. The values of longitudinal velocity profiles upstream of the first pile (horizontal and vertical axis are dimensionless.).
Water 14 02382 g007aWater 14 02382 g007b
Figure 8. The closest velocity profiles measured between the piles.
Water 14 02382 g008aWater 14 02382 g008b
Figure 9. The vertical flow velocity distribution upstream of the first pile.
Water 14 02382 g009aWater 14 02382 g009bWater 14 02382 g009cWater 14 02382 g009d
Figure 10. The X–Z resultant velocity vector on the center axis of the channel upstream of the first pile in a single pile case.
Water 14 02382 g010
Figure 11. The X–Z resultant velocity vector on the center axis of the channel upstream of the first pile in the pile group case.
Water 14 02382 g011aWater 14 02382 g011b
Figure 12. The vertical distributions of the longitudinal, latitudinal, and vertical turbulent intensity components normalized by shear stress in single pile case.
Water 14 02382 g012aWater 14 02382 g012b
Figure 13. The vertical distributions of the Longitudinal, latitudinal, and vertical turbulent intensity components normalized by shear stress in the triple pile group with G/D = 2.
Water 14 02382 g013aWater 14 02382 g013b
Table 1. Parameters affecting the scouring phenomenon.
ParameterSymbolUnit
Timets
Pile angle to the horizonϴ-
The angle of water and pile contactKϕ-
Number of pilesm-
Number of group pilesn-
Piles shape coefficientCd-
Critical deviation of sediment particlesσ-
Bed particle diameterd50m
VelocityUm/s
Mass of unit water volumeρkg/m3
Cinematic viscosityϑm2/s
Vegetation heighthvm
Vegetation densitydv%
Vegetation width to flow widthlp-
Scour depthds-
Depth of flowHm
Channel widthBm
Bridge pile diameterDm
Distance of two adjacent pilesGm
Gravity accelerationgm/s2
Mass of unit sedimentρskg/m3
Channel cross-sectional areaAm2
Channel wetted perimeterPm
Table 2. Geometric characteristics of sediment particles.
ParametersMedian Sediment SizeUniformity CoefficientGeometric Mean SizeStandard Geometry DeviationGradation Coefficient
Symbolsd50CuDgδgGr
Dimensionmeterdimensionlessdimensionlessdimensionlessdimensionless
Value0.000771.1330.7631.0751.075
Table 3. The equilibrium time and depth for each experimental case.
Pile TypeVegetation TypeVegetation-FreeType 1
(2 cm-100%)
Type 2
(0.5 cm-100%)
Type 3
(2 cm-50%)
Ye (cm)te (min)Ye (cm)te (min)Ye (cm)te (min)Ye (cm)te (min)
SingleFree6.5800------
Overall--4.75505.37114.6610
Patched--4.15504.97114.5550
Triple
G/D = 2
Free5.3670------
Overall--3.94304.64904.9440
Patched--3.96104.96904.3610
Triple
G/D = 3
Free5.9760------
Overall--4.86105.37605.1760
Patched--4.57605.27604.9760
Triple
G/D = 4
Free6.2760------
Overall--5.34905.37605490
Patched--54905.17115550
Publisher’s Note: MDPI stays neutral with regard to jurisdictional claims in published maps and institutional affiliations.

