Article

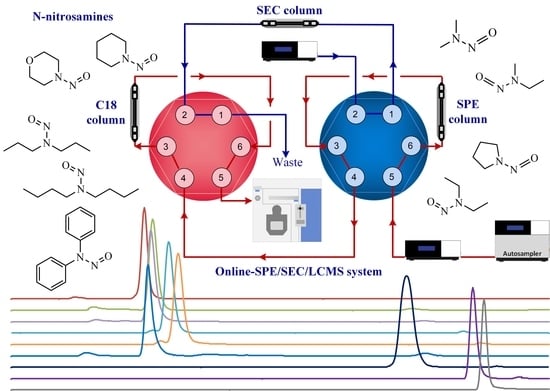
An Online-SPE/SEC/LCMS Method for the Detection of N-Nitrosamine Disinfection Byproducts in Wastewater Plant Tailwater

1
School of Environmental & Safety Engineering, Changzhou University, Changzhou 213164, China
2
School of Life Sciences, The University of Liverpool, Liverpool L69 3BX, UK
3
Changzhou Drainage Administration, Changzhou 213162, China
*
Author to whom correspondence should be addressed.
Water 2022, 14(15), 2371; https://doi.org/10.3390/w14152371
Submission received: 24 June 2022 / Revised: 28 July 2022 / Accepted: 28 July 2022 / Published: 31 July 2022
(This article belongs to the Section Water and One Health)

Abstract

:
N-nitrosamines have recently attracted attention as a class of disinfection byproducts and are also a hot spot in environmental studies. Current N-nitrosamine analytical methods typically involve manual solid phase extraction (SPE) of samples followed by quantitative analysis using liquid chromatography-mass spectrometry (LCMS), which is time-consuming and may also fail to eliminate complex matrix effects. Size exclusion chromatography (SEC) is a technique that can separate compounds according to their molecular size. For the first time, this study developed an Online-SPE/SEC/LCMS quantitative analysis method to detect and analyze nine common N-nitrosamine disinfection byproducts in wastewater plant tailwater, including N-dimethylnitrosamine (NDMA) and N-nitrosodiethylamine (NDEA), etc. The samples of 1.0 mL can be directly injected after the simple 0.22 μm membrane filtration. This method reports the combination of SPE, SEC, and RP C18 columns to achieve several functions in a processing time of 20 min, including online enrichment, desalination, and matrix separation for the first time. The method provides good linearity (R2 > 0.999), recoveries ranging from 91.67% to 105.88%, relative standard deviation (RSD) lower than 4.17%, and the limits of detection (LOD) are 0.12–6.60 ng/L. This method alleviates tedious human labor and can effectively overcome the matrix effect (ME < 20%). This method allows for the accurate quantitative analysis of N-nitrosamines with high compatibility in wastewater plant tailwater, rivers, and lakes with a high background matrix. Interested researchers can also use this method as a reference in the online analysis of other specific pollutants after necessary optimization. It can also be utilized for non-targeted screening and targeted analysis of contaminants in water with a wide range of applications, giving valuable information for environmental monitoring.

Graphical Abstract

1. Introduction

N-nitrosamines, including N-nitrosodimethylamine (NDMA) and N-nitrosodiethylamine (NDEA), are a new class of disinfection byproducts [1,2]. They are typically formed in the chlorination and ozonation units of the water treatment process [3,4]. N-nitrosamines possess more significant toxicity and carcinogenicity than trihalomethanes and haloacetic acids [5,6,7]. The carcinogenic risk value for NDMA at a concentration above 0.7 ng/L in drinking water is 10−6 [8,9], which may lead to potential human health problems [10]. The high detection rate of N-nitrosamines in the aqueous environment has caused widespread concern due to their high toxicity and water solubility [11,12,13]. The average concentration of NDMA in tap water in China’s Yangtze River Delta region was 28.5 ng/L [14]. The maximum NDMA concentration detected in a drinking water plant in Spain was 20 ng/L [15]. In the United States, the median concentration of N-nitrosamines in drinking water systems is 4 ng/L [16]. NDMA has also been detected in wastewater, surface water, and groundwater [17,18,19], with the highest concentration of 537 ng/L in ozone-treated wastewater [20].
N-nitrosamines are frequently present in the environment at the ppt (ng/L) level [21], posing a challenge for accurate quantitative analysis. Therefore, it is necessary to develop an accurate and sensitive analytical detection method. Gas chromatography, liquid chromatography, and combined methods with mass spectrometry are currently used to detect N-nitrosamines [22,23,24]. Among them, liquid chromatography–mass spectrometry (LCMS) has been extensively used to detect the N-nitrosamines in water with high sensitivity [25]. For example, Malihi et al. [26] successfully developed an HPLC/MS/MS analytical method to determine N-nitrosamines with NDMA detection and quantification limits of 20 ng/L and 60 ng/L, respectively. Electrospray ionization, often known as ESI, is a “soft” ionization method that is utilized frequently in LCMS for the purpose of analyzing analytes [27]. N-nitrosamines can be ionized in positive and negative ion modes, but ionization behavior is better in positive ion modes. The presence of isolated electrons in the nitrogen atom of the N-nitrosamine structure forms protonated [M + H]+ ions [28].
The pretreatment technique prior to analyzing samples is significant for lowering the target detection limit and extending the service life of the instrument and column [29]. Solid-phase extraction (SPE) is a popular pretreatment strategy for sample concentration and purification [30,31]. Qian et al. [32] demonstrated that the sensitivity of N-nitrosamine analysis was significantly improved after SPE enrichment, with detection limits as low as 0.01–2.7 ng/L.
Traditional SPE methods entail time-consuming manual operations that not only prolong the analysis time but are also prone to analytical errors and cross-contamination [33,34]. With the advances in instrumental analysis technology, the online-SPE technique enables automatic enrichment of target substances on the SPE column through automatic column switching, simplifying the pretreatment procedure, further improving detection efficiency, and reducing errors caused by manual operation [35,36]. The combination of online SPE and mass spectrometry has been successfully utilized to detect pharmaceutical and perfluorinated pollutants in water, with typical analysis times ranging from 15 to 30 min [37,38]. However, during LCMS analysis, background matter in water can affect the ionization efficiency in the ESI source of the mass spectrometer, resulting in significant enhancement or weakening of the target’s mass spectral signal, known as the matrix effects [39]. When analyzing samples with high background matrix concentrations, SPE usually fails to eliminate matrix effects that can cause analytical errors. For example, Amelin et al. [38] investigated N-nitrosamines in foods. They discovered that even through SPE pretreatment, the analysis of several N-nitrosamines was still inhibited by background matter with a matrix effect value of over 20%.
Size exclusion chromatography (SEC), as a branch of chromatographic technique, separates compounds in solution according to their molecular size or weight. [40,41,42]. Separation occurs when molecules of different sizes enter the pore space [41,43]. The smaller the molecule, the easier it is to diffuse into the pores and be retained. However, the background matter, which is typically composed of large molecules, is unable to enter the pores and is instead eluted along with the mobile phase [44]. Therefore, the SEC technique can separate the target compounds from the background matrix and reduce matrix effects on detection. Currently, the combination of SEC and mass spectrometry has been proven to be an effective method for sample purification, biomolecule separation, and compound determination and has evolved into a rapid and high-throughput technical strategy for proteomics and metabolomics analysis [45,46,47].
This study overcomes the shortage of current analysis methods by developing an Online-SPE/SEC/LCMS quantitative method for large volume samples that can detect nine common N-nitrosamine disinfection byproducts in wastewater plants’ tailwater. Before the analysis, the samples need to be pretreated with a 0.22 µm filter membrane to remove particles from the water. Enrichment, desalination, and matrix separation were accomplished online using SPE, SEC, and conventional columns to implement four-stage separation and purification and were then sent to a triple quadrupole (QQQ) mass spectrometer for quantitative analysis. This method has the advantages of simple pretreatment and a highly automated analysis process. It can perform accurate quantitative analysis on samples with a high background matrix, such as wastewater plant tailwater and contaminated water bodies, while also providing technical support for the online detection of N-nitrosamine disinfection byproducts.

2. Materials and Methods

2.1. Apparatus

The Online-SPE/SEC/LCMS system was developed for sample enrichment, chromatographic separation, and mass spectrometry analysis. The system consists of three modules: an Ultimate 3000 dual ternary HPLC, an autosampler WPS3000TSL with a 2.5 mL large volume injection kit, and a TSQ Quantum Access Max mass spectrometer (Thermo Fisher, Waltham, MA, USA). The data were analyzed using Xcalibur 4.6 software.

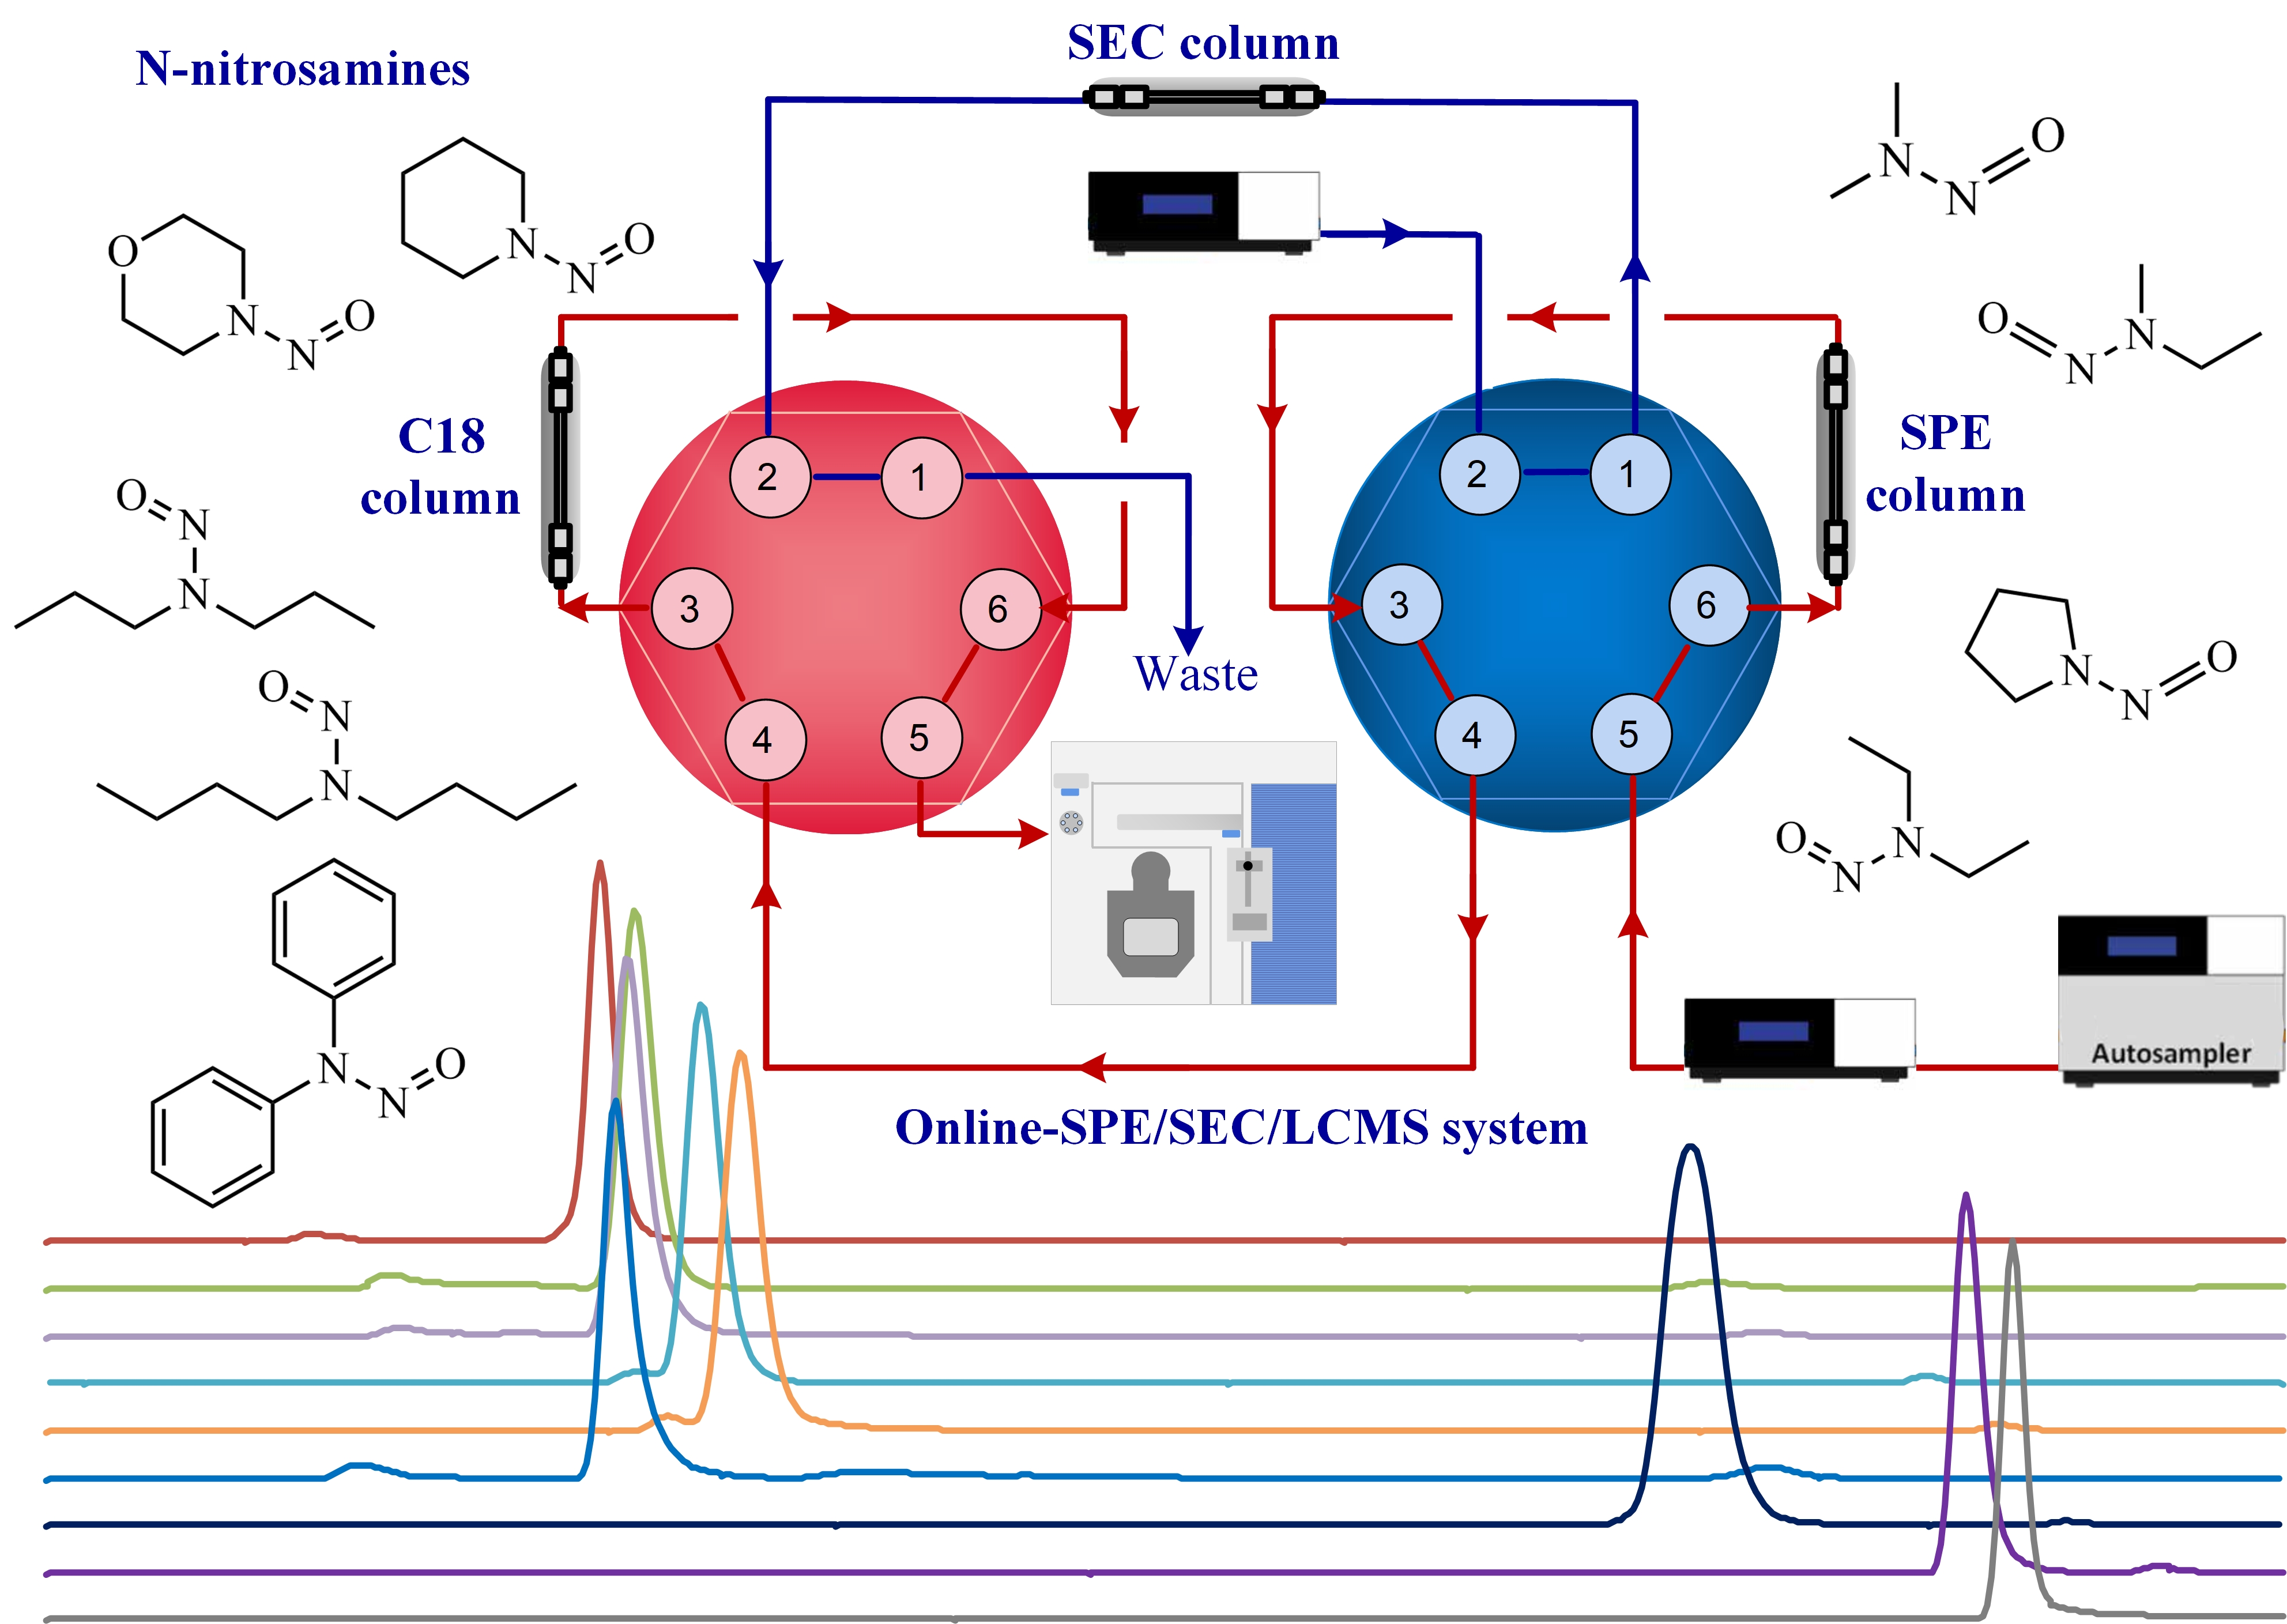
2.2. Setup of the Online-SPE/SEC/LCMS System

The SPE, SEC, and RP (Reversed-phase) C18 columns were selectively connected via two six-port valves to implement enrichment, purification, and separation functions in the Online-SPE/SEC/LCMS system. The schematic diagram of the system (Figure 1) depicts four stages during the whole analytical process. Stage 1: The SPE and RP C18 columns were connected in series. Water samples (1.0 mL) were injected by an autosampler into the SPE column for sample enrichment and removal of inorganic salts. Stage 2: The SPE column and the SEC column were connected in series. The target compounds were transferred from the SPE column to the SEC column for separation with the background matrix. Stage 3: The SEC column and the RP C18 column were linked together. The target compounds were transferred to the RP C18 column. Stage 4: The system was reset to its original settings. The target compounds were sent into the mass spectrometer for quantitative analysis.

2.3. Chemical Reagents and Standard Solution Preparation

Nine N-nitrosamine mixed standards were purchased from Alta Scientific (Tianjin, China), including N-nitrosodimethylamine (NDMA), N-nitrosoethylmethylamine (NEMA), N-nitrosopyrrolidine (NPyr), N-nitrosopiperidine (NPip), N-nitrosomorpholine (NMor), N-nitrosodiethylamine (NDEA), N-nitrosodinpropylamine (NDPA), N-nitrosodibutylamine (NDBA), and N-nitrosodiphenylamine (NDPhA). Methanol and acetonitrile (LC grade) were bought from Sigma Aldrich Chemicals (St. Louis, MO, USA). Formic acid and ammonia (MS grade) were purchased from Aladdin (Shanghai, China). PTFE membrane filters (0.22 μm) were purchased from Anpel Laboratory (Shanghai, China). Ultrapure water was prepared by a UPR-II-10T ultrapure water machine (Ulupure, Sichuan, China).
The mixed standards were diluted with methanol into a 100 mg/L stock solution and kept refrigerated at −18 °C. The stock solution was further diluted into standard solutions with concentrations ranging from 0.100 to 200 ng/L using ultrapure water, and the standard solutions were prepared on-site.

2.4. Standard Addition Method for Calibration

The standard addition method, as a robust strategy for correcting interference from the matrix effect, was used to aid in the quantitative analysis. This method does not require the addition of a costly internal standard and eliminates matrix interference by aligning the standard solution with the sample solution’s matrix [48,49]. Standard solutions at various concentration levels were added to the samples to form spiked samples of 10, 20, and 50 ng/L.

2.5. Chromatography Conditions Optimization

Selection of the chromatographic column: Five columns, including Waters T3, Thermo PFP, Thermo RSLC, Waters Oasis Wax, and Waters Oasis HLB columns, were chosen to evaluate their retention performance for N-nitrosamines to choose the appropriate SPE column. The retention ability of the column for the target is reflected by the capacity factor, which means a higher capacity factor indicates a longer retention time [50,51].
Determination of mobile phase: The system has two ternary pumps (left and right), which can use five mobile phases by switching valves. Water/methanol and water/acetonitrile were selected to evaluate the mobile phases. Chromatography parameters were further optimized to improve ionization efficiency by adding organic acids or buffers to the mobile phases. The effects of ammonium formate, formic acid, and ammonia on the signal intensity and peak shape were also compared.

2.6. Mass Spectrometry Conditions Optimization

The mass spectrometer was operated in an ESI positive mode, and the ions were detected by a multiple reaction-monitoring (MRM) scan. Other MS parameters included ion spray voltage of 3.5 kV, heater temperature of 300 °C, nitrogen collision gas, sheath gas pressure of 40 arb, and auxiliary gas pressure of 15 arb. Parameters such as parent/product ions, collision energy, and lens shift for the nine N-nitrosamines were manually optimized.

2.7. Method Validation

The method’s validation parameters were evaluated, including linearity, accuracy, precision, limits of detection (LOD), and limits of quantification (LOQ). Each test was performed three times and the results were averaged. Standard solutions were prepared in the concentration range of 0.100–200 ng/L. Standard curves were plotted by linear fitting the target substances’ peak areas to their mass concentrations. The accuracy and precision of the method were validated using the recovery (r, %) and relative standard deviation (RSD, %). Concentration levels with S/N of 3 and 10 were chosen as the method’s LOD and LOQ. The impacts of matrix effects on target substance analysis were expressed using matrix effect values (ME, %) as follows [52]:
M E   ( % ) = ( k 2 / k 1 1 ) × 100
k1 and k2 are the slopes of the standard curve of nine N-nitrosamines in pure water and the sample matrix, respectively.

2.8. Usability of the Method

Nine N-nitrosamines were determined in a wastewater plant’s tailwater to verify the method’s practicality. The tailwater of the wastewater plant is discharged after the biochemical treatment in the wastewater plant. Before discharge, wastewater plant tailwater is typically disinfected using chlorine-containing disinfectants. These disinfectants could react with the nitrogenous organic matter in the tailwater to produce N-nitrosamine disinfection byproducts. The actual water samples were taken from the tailwater of a municipal wastewater plant in Changzhou city. The collected water samples were filtered through a 0.22 μm PTFE filter membrane and refrigerated at 4 °C in the dark for subsequent analysis.

3. Results and Discussion

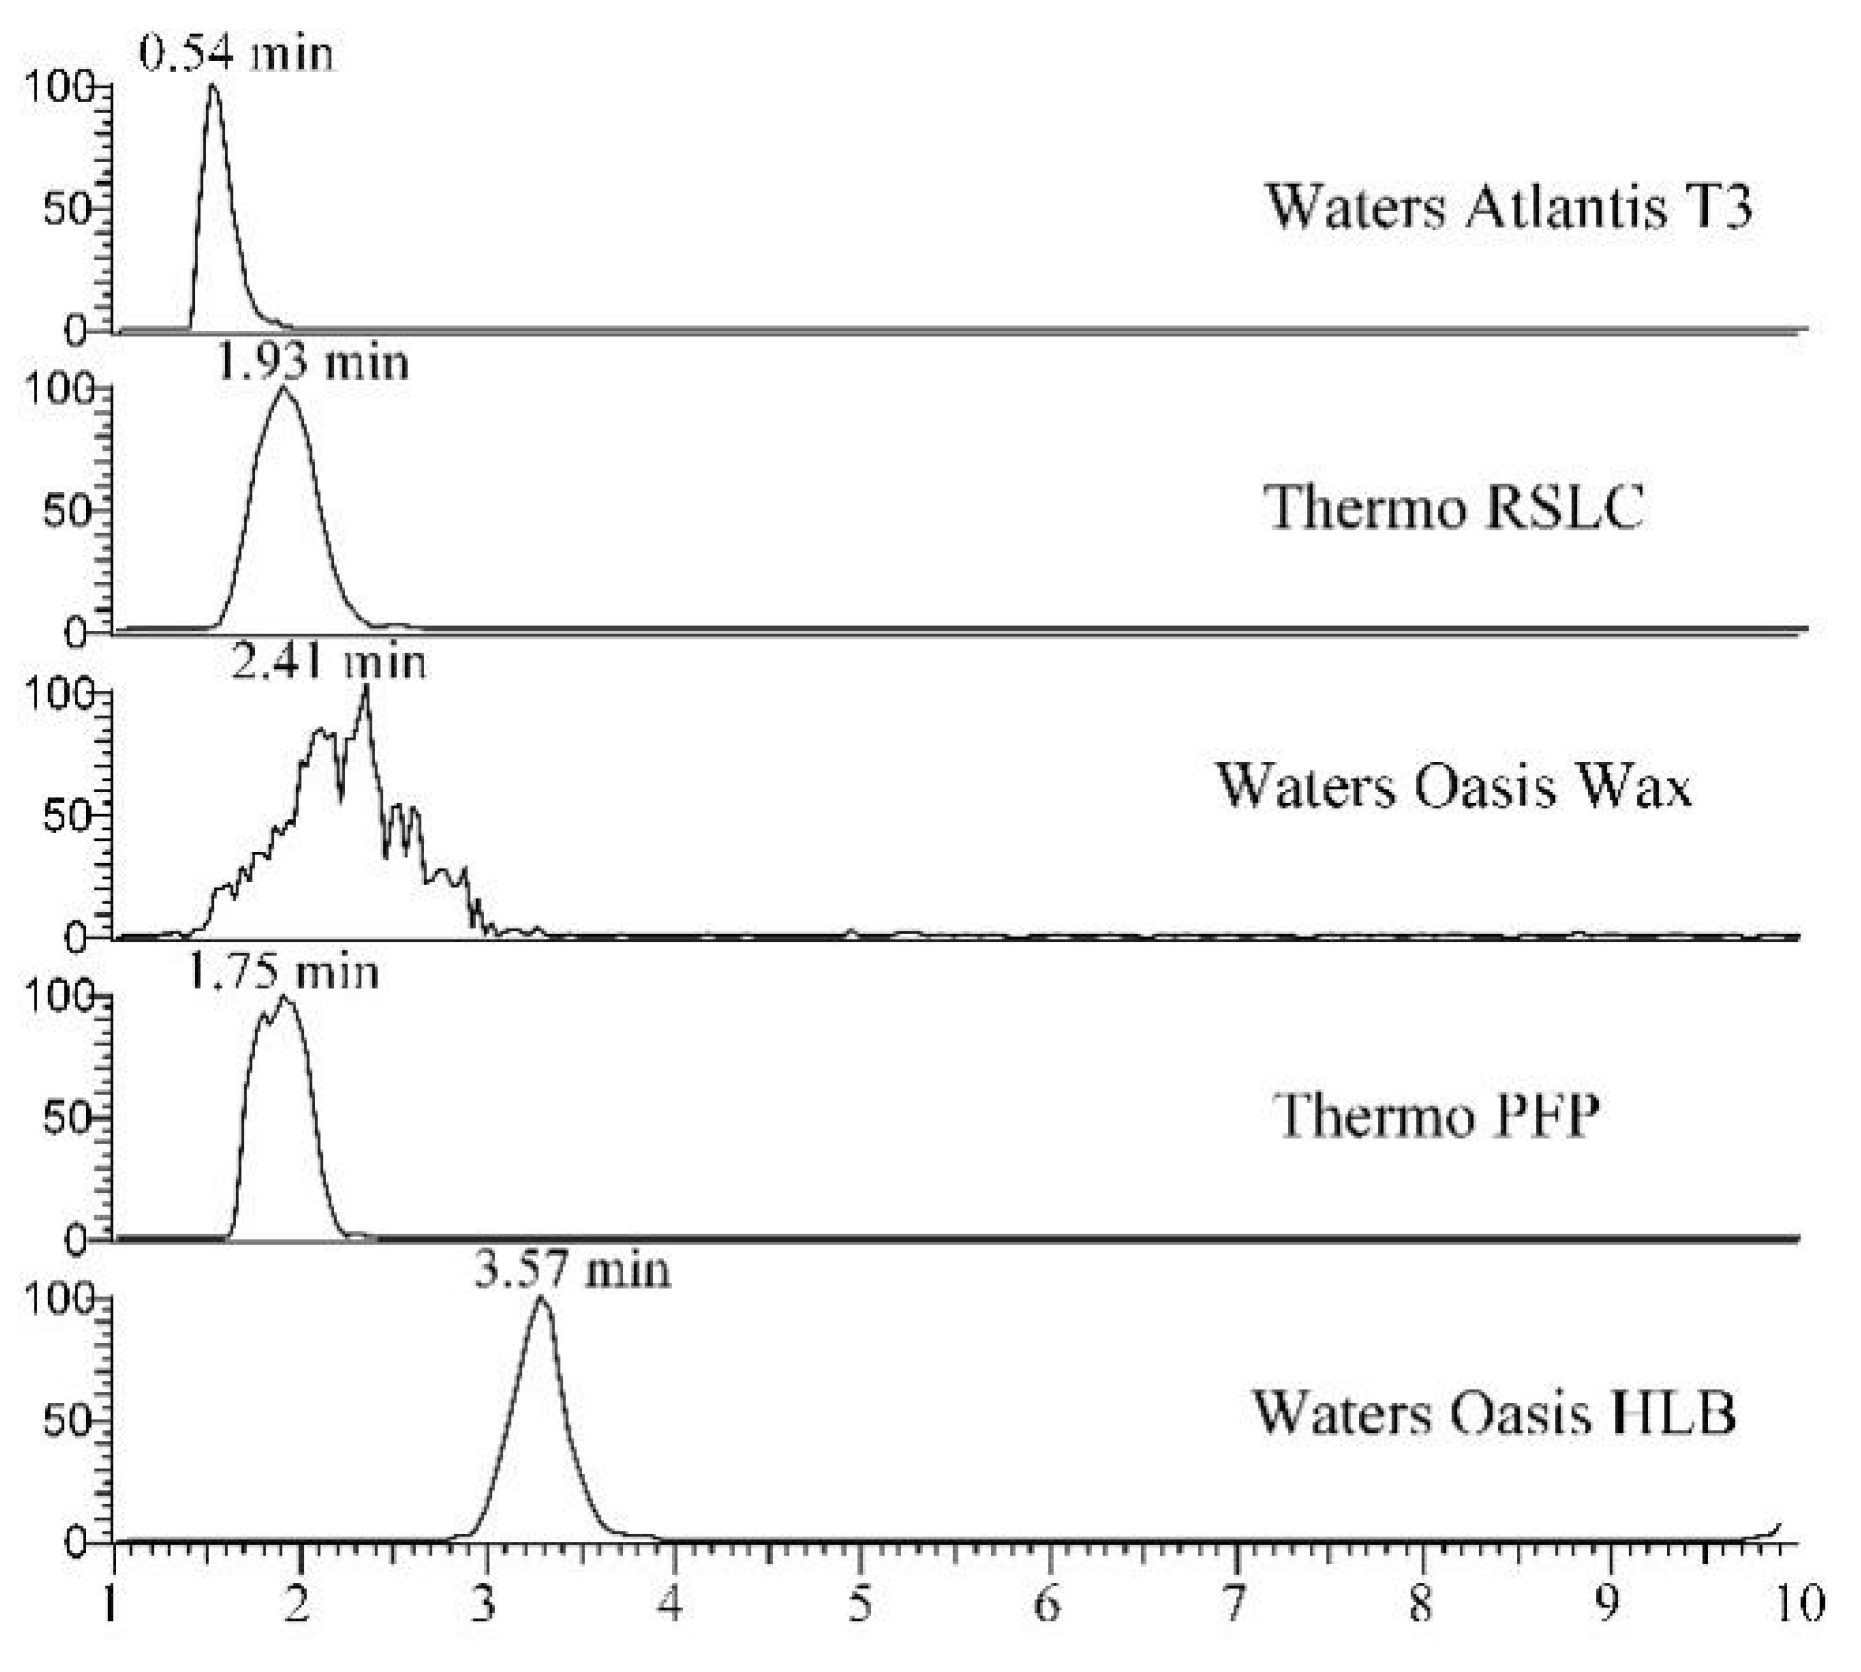
3.1. Selection of Chromatographic Column

The retention capacity of five columns was tested in 100% pure aqueous phase with isocratic elution conditions. NDMA polarity was the strongest among the nine N-nitrosamines. Therefore, the retention behavior of the five columns on NDMA was compared based on the capacity factor and signal intensity, as shown in Table 1 and Figure A1. A Waters T3 column was generally regarded to have high retention and loading for neutral, weakly polar, and polar compounds. However, in this test, the Waters T3 column has poor retention for NDMA, with a capacity factor of only 0.3. The Waters Oasis HLB column had the highest capacity factor of 6.0 among the five columns, indicating that the HLB column had the best retention for NDMA. As a result, the Waters Oasis HLB column was chosen as the SPE column to enrich the target compounds. Remarkably, the limited number of injections of the Waters Oasis HLB column was only 200, which is significantly less than that of a common column. In addition, a Waters BEH SEC column (4.6 mm × 30 mm × 1.7 μm) was selected for SEC separation of N-nitrosamines with the background matrix. The RP C18 column in stage 4 was a TOSOH C18 column (2.0 mm × 20 mm × 5 μm).

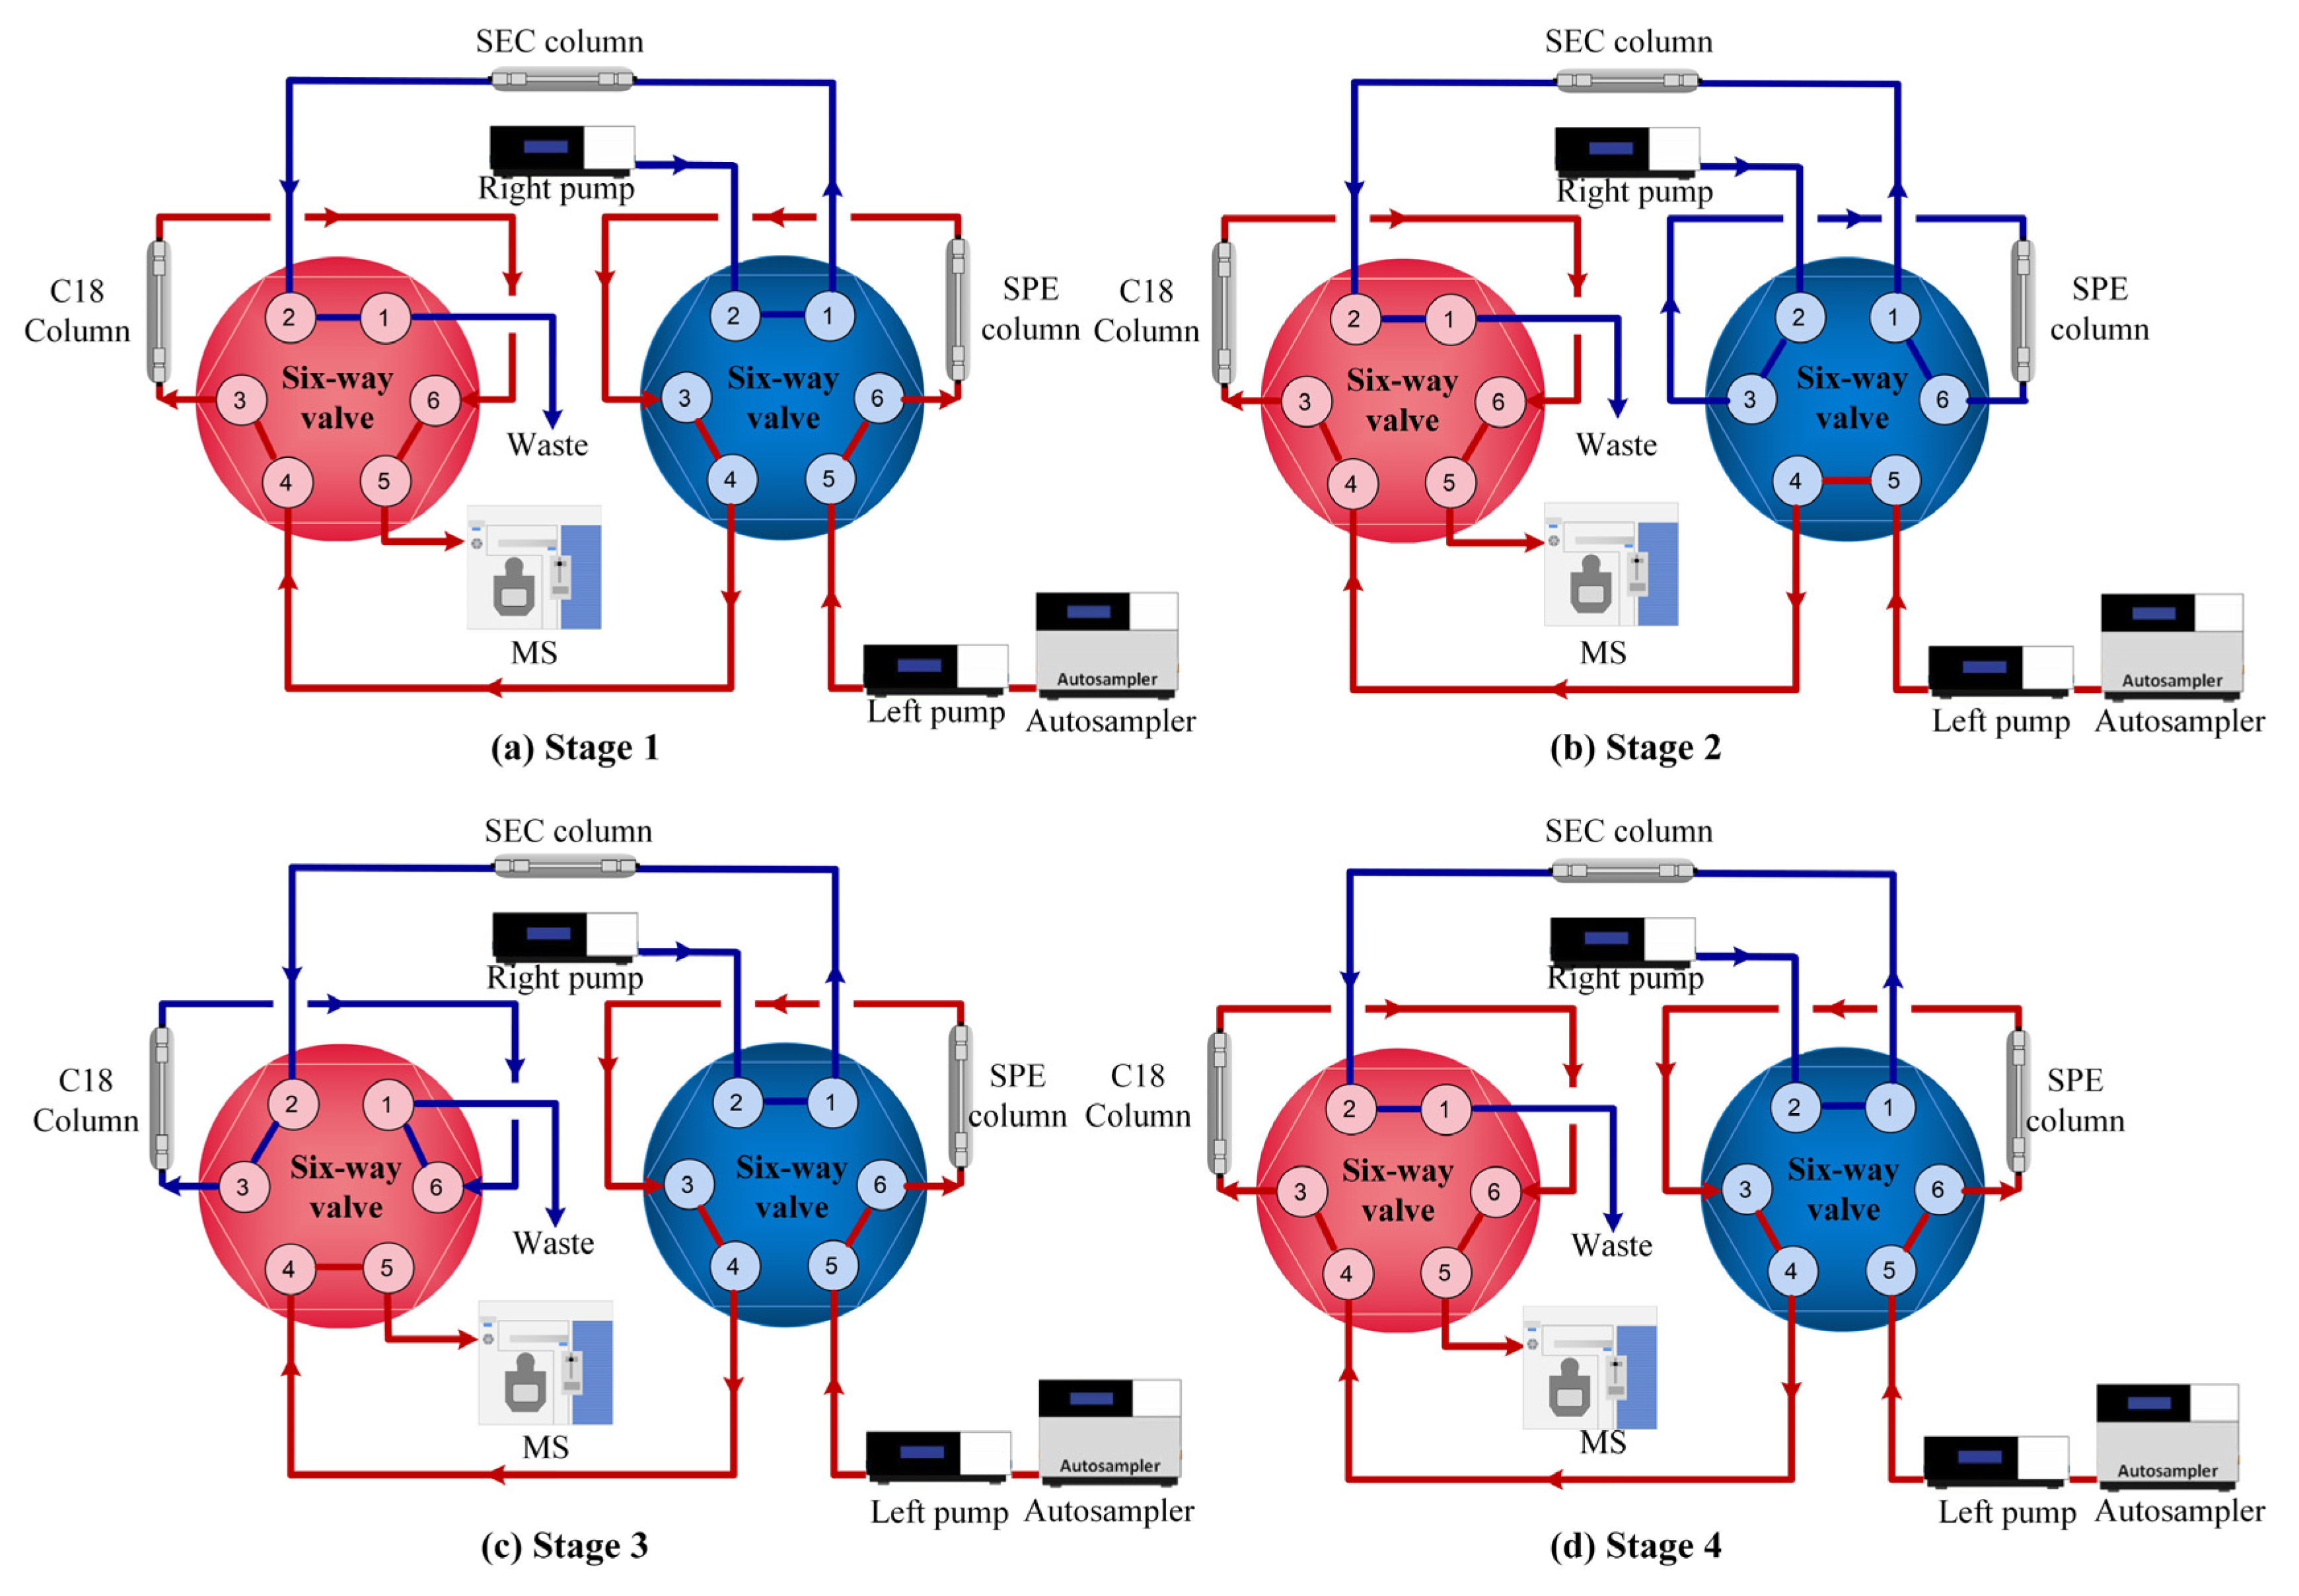
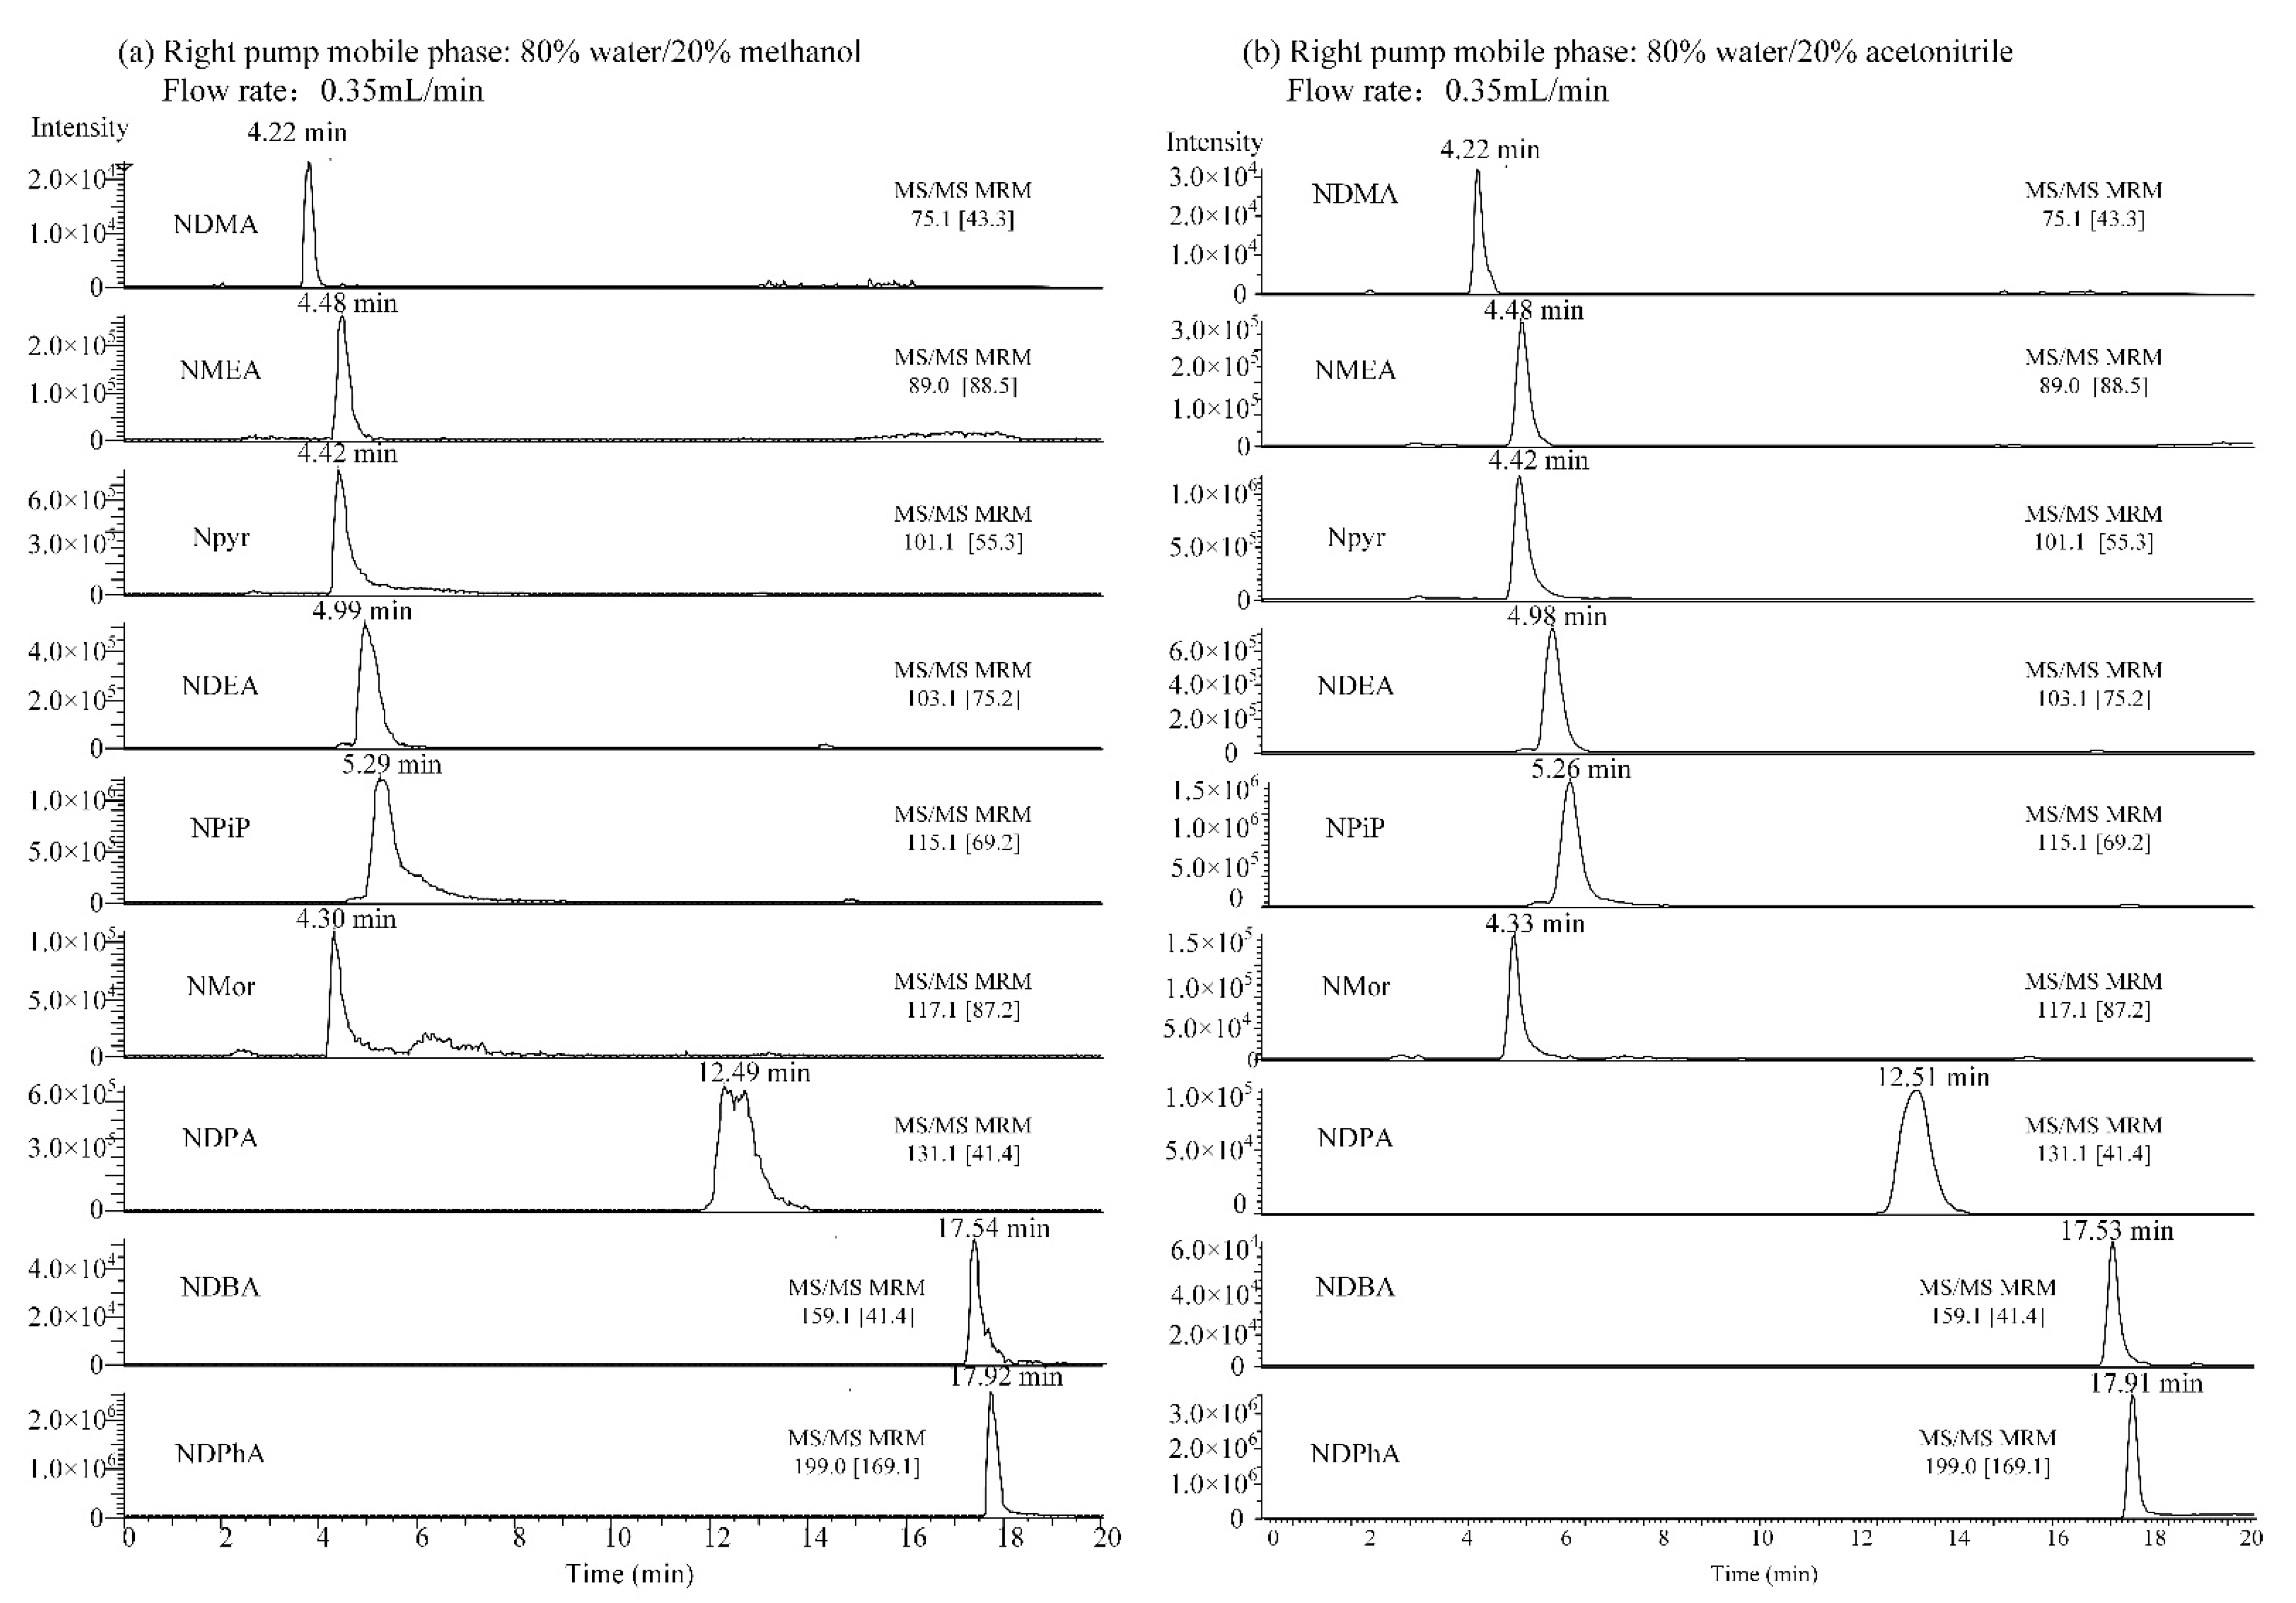
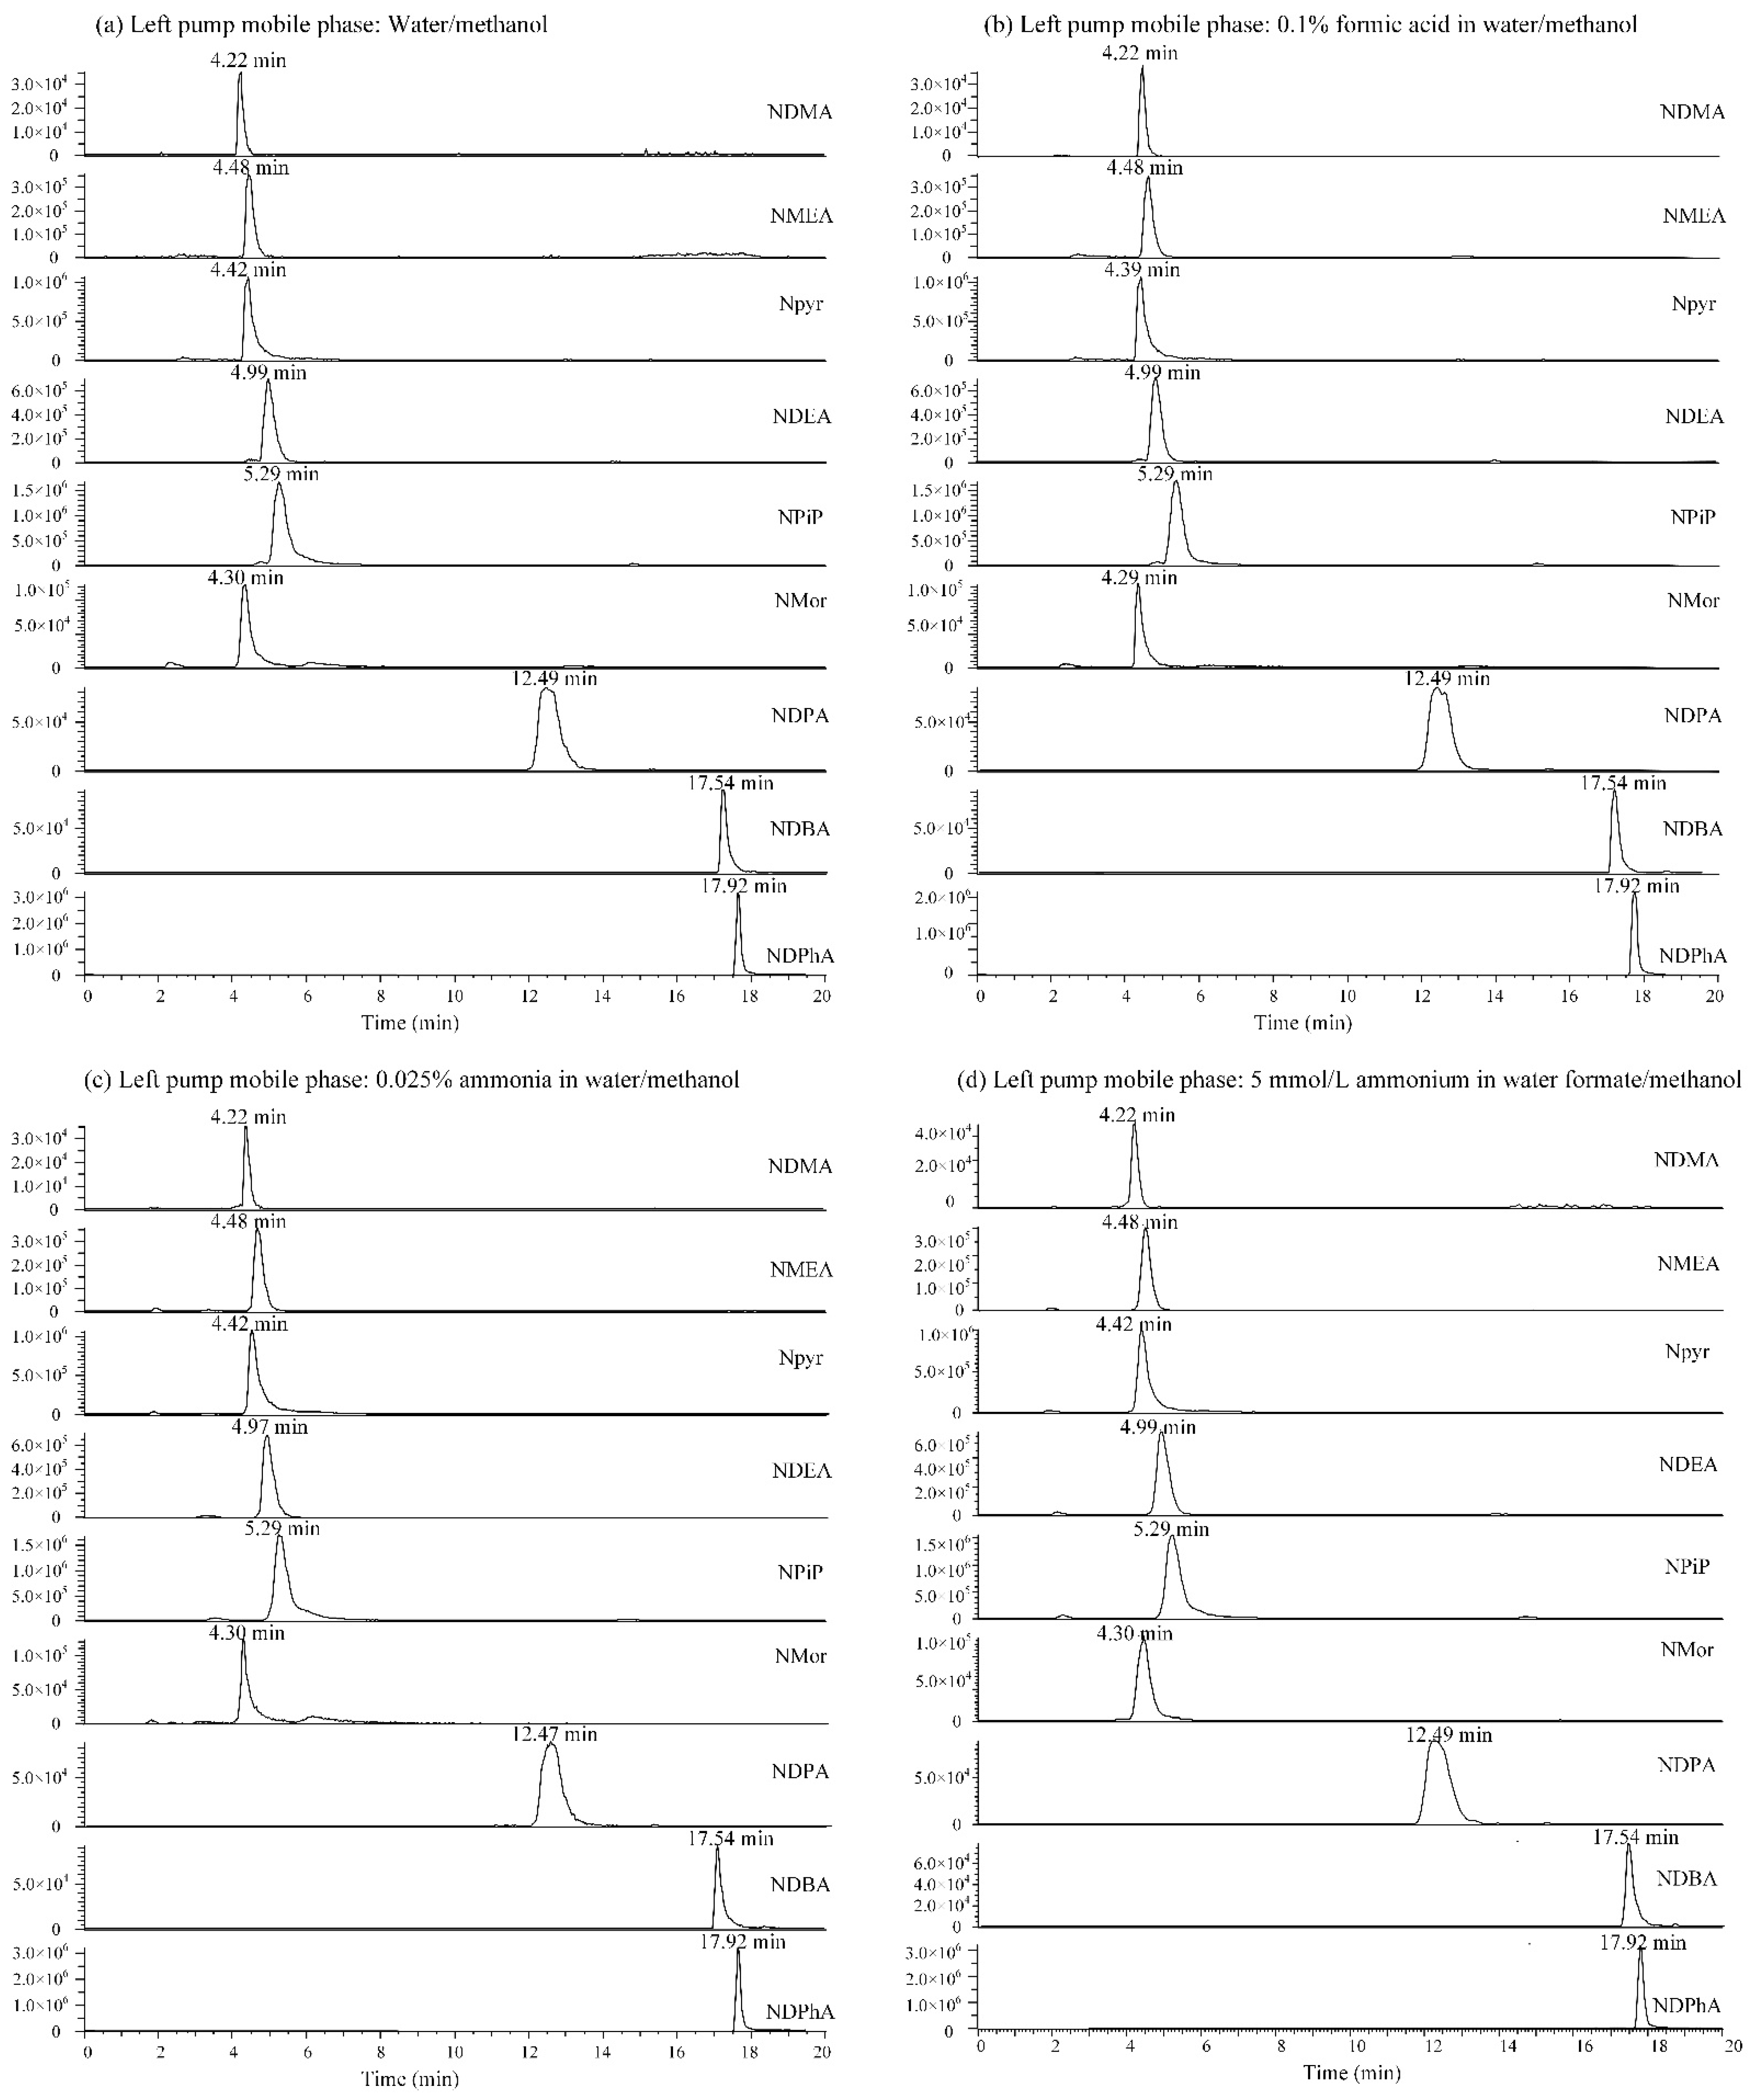
3.2. Selection of Mobile Phase

This system has two ternary pumps, the left and right pumps. The left pump is primarily used for sample enrichment and target analysis. Water/methanol and water/acetonitrile mobile phases were chosen and compared. The peak shapes and intensities of N-nitrosamines were essentially similar. Thus, water/methanol was selected as the left pump mobile phase since methanol is more economical and less toxic than acetonitrile. The chromatographic conditions were further improved by adding organic acids or buffer salts. The signal intensities of nine substances increased by more than 10% when 5 mmol/L ammonium formate was added (Figure A2). The water/methanol system with 5 mmol/L ammonium formate was finally selected as the left pump mobile phase.
The right pump was primarily used to separate the target from the background matrix. Two mobile phases, water/methanol (80%:20%) and water/acetonitrile (80%:20%), were chosen and compared. In the water/acetonitrile system, the peaks of all nine N-nitrosamines showed great shapes without bifurcation or trailing, and the peak intensity was increased by 25% (Figure 2). Therefore, water/acetonitrile was selected as the mobile phase for the right pump. In this system, the final mobile phases were A: 5 mmol/L ammonium formate in aqueous solution, B: methanol, C: pure water, and D: acetonitrile. Table 2 shows the optimized chromatographic conditions in detail.

3.3. Mass Spectrometry Parameter Optimization

The analysis was performed in ESI+ mode. The [M + H]+ ion is taken as the precursor ion, and the two highest-intensity product ions are the quantitative and qualitative ions. The optimized mass spectrometry conditions are shown in Table 3.

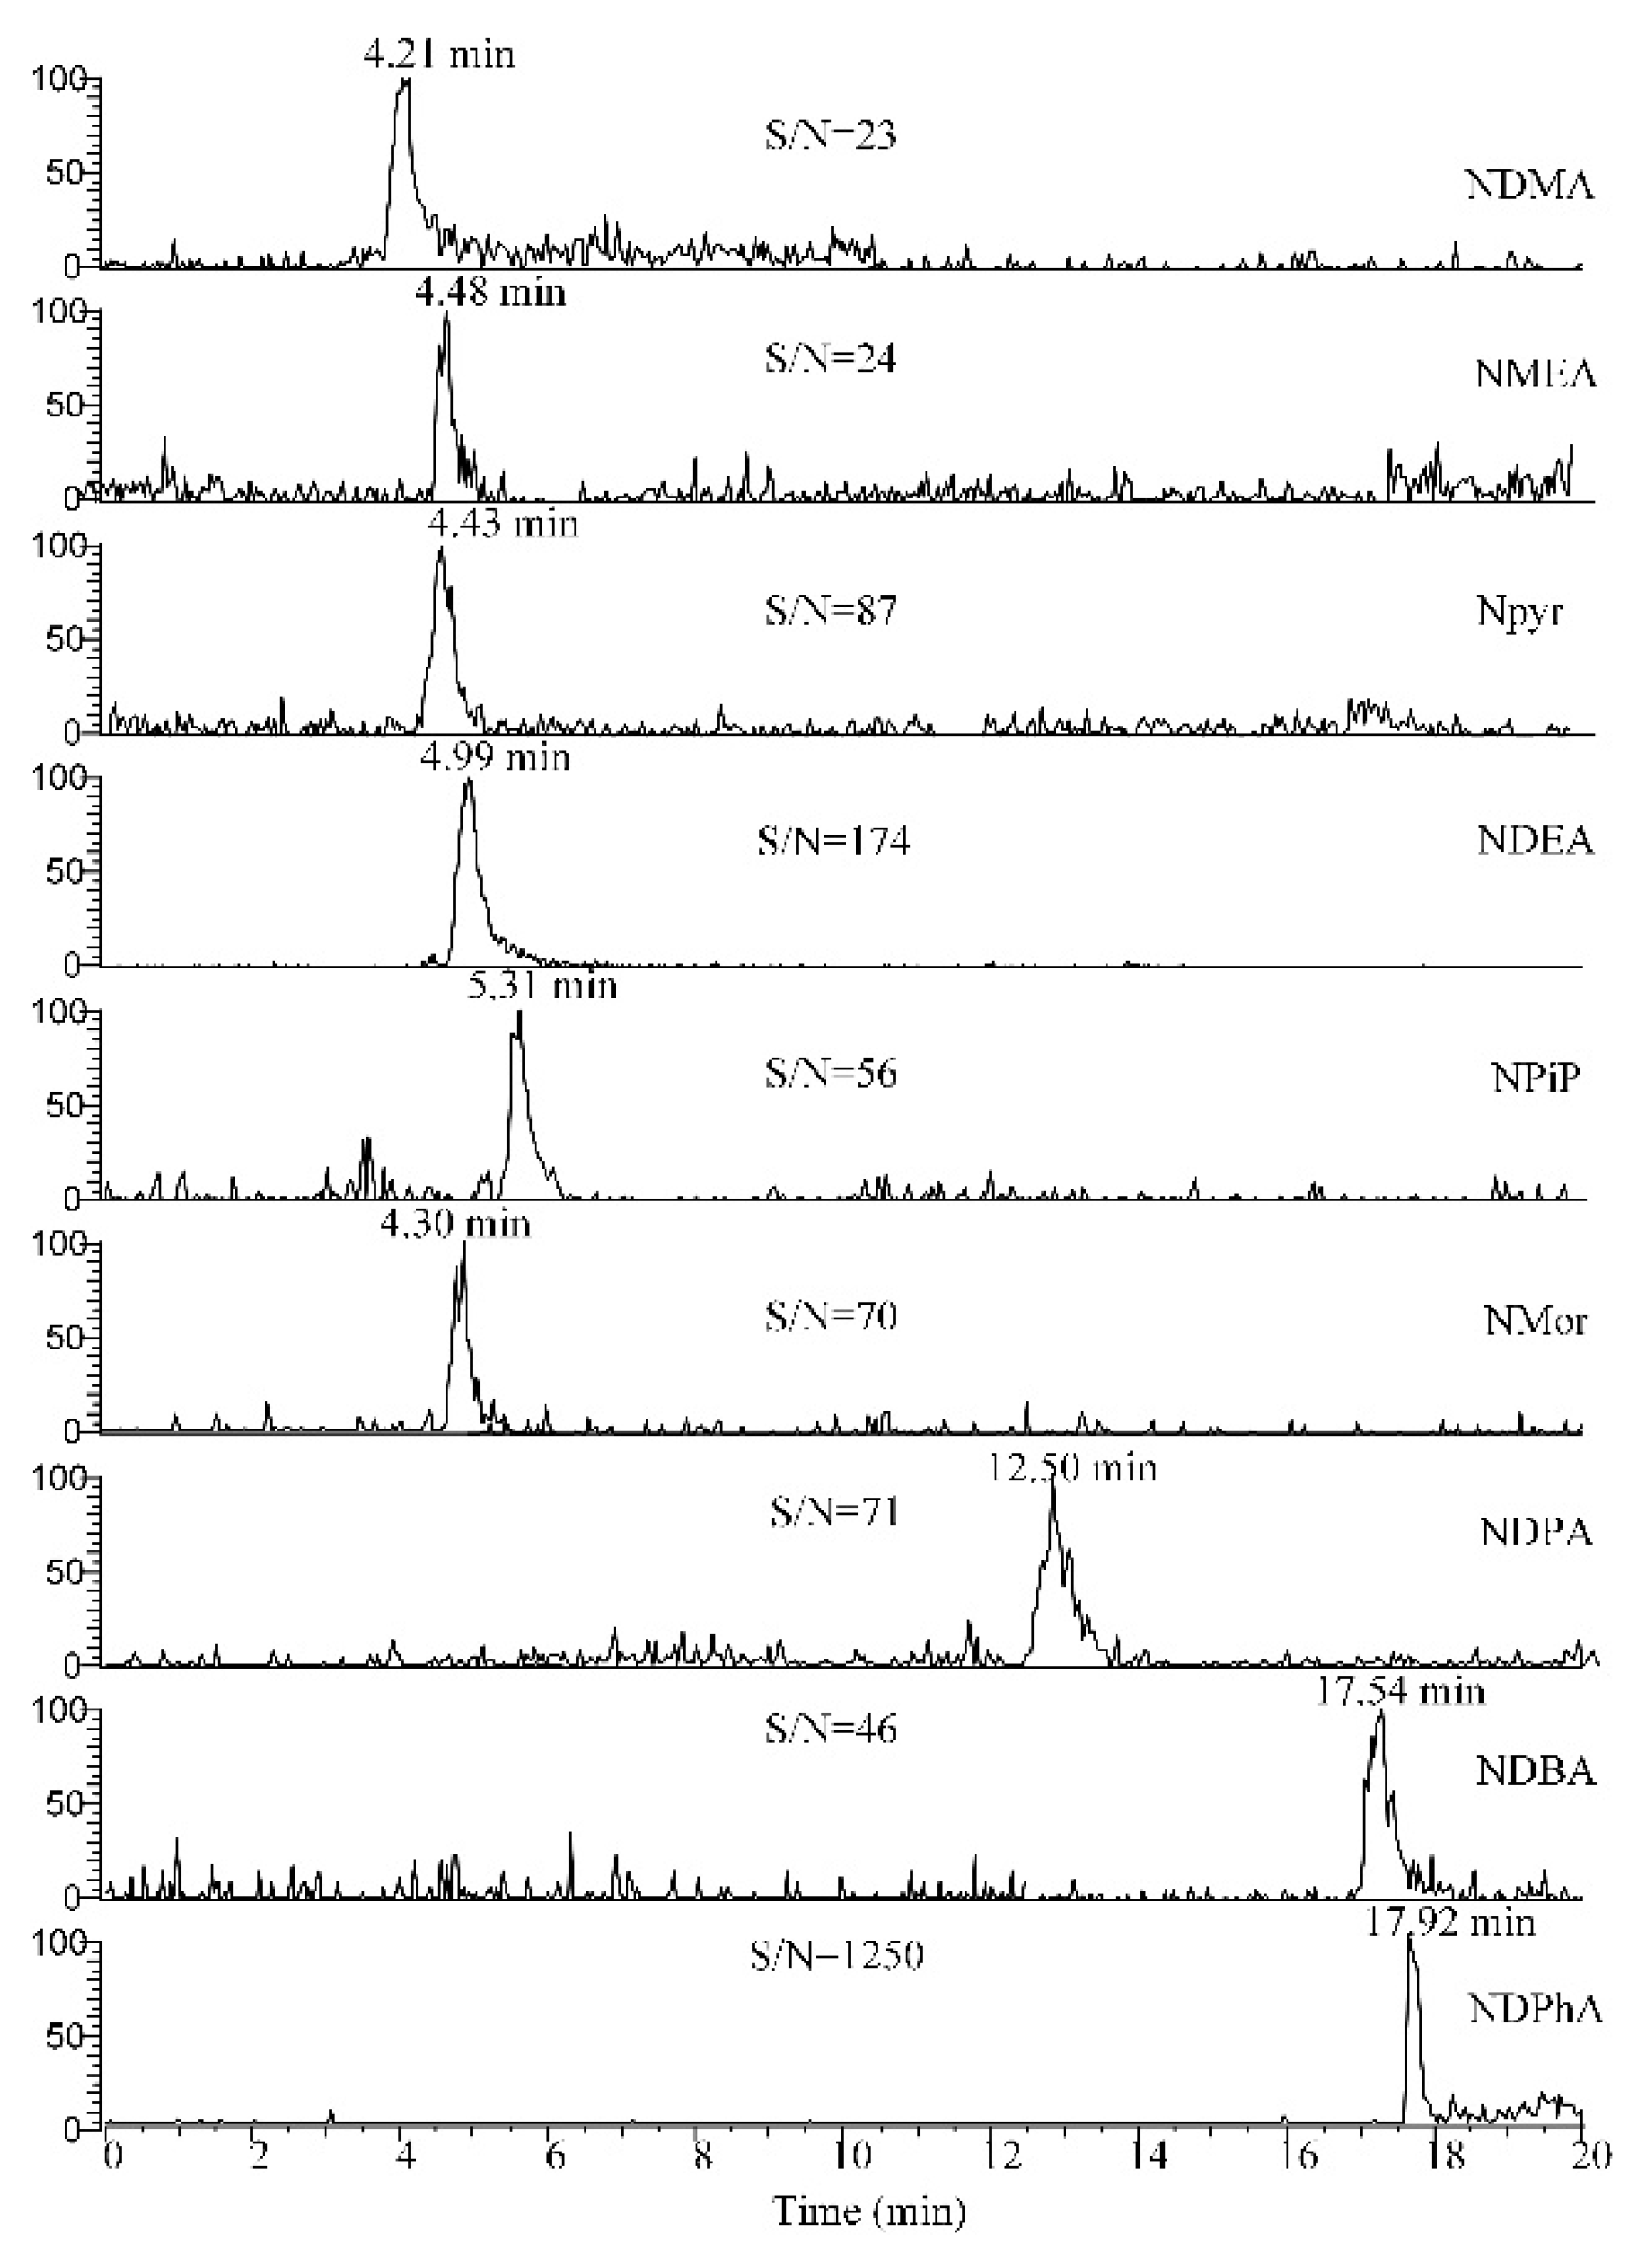
3.4. Method Validation

The linear regression equations for the nine N-nitrosamines were further calculated and summarized in Table 4. QC samples, prepared at three levels (10, 50, and 10 ng/mL), were analyzed for six replicates. The results of precision and accuracy were also listed in Table 4.
The results revealed that the method has good linearity over a range of concentrations, with correlation coefficients (R2) greater than 0.9993. The accuracy (RSD) was within 4.17% for all the QC concentration levels. The present method obtained good recovery, ranging between 91.67% and 105.88%, while RSDs were 0.68–3.06%. The LOD and LOQ for the nine N-nitrosamines ranged from 0.12 ng/L to 6.60 ng/L and from 0.40 ng/L to 21.99 ng/L, respectively. The current SPE column for this method has a limited volume of 0.15 mL with an injection of 1.0 mL. An SPE column with a higher volume could be used in the future to increase the injection volume and reduce the LOD and LOQ.
The newly developed method was compared to other methods that had already been published for the determination of N-nitrosamines. Malihi et al. [26] set up an LCMS method for determining N-nitrosamines with an injection volume of 25 μL and a LOD of 20–60 ng/L. The present method significantly reduced the detection limit with a large injection of samples (1.0 mL). Ngongang et al. [25] analyzed N-nitrosamines based on HRMS (Orbitrap) with a lower LOD of 0.4–9.1 ng/L, comparable to the present method based on a QQQ mass spectrometer. Furthermore, the method is much more automated and easy to operate due to the incorporation of the online-SPE technique. Till now, no reports have been published on N-nitrosamine analysis using the combination of online-SPE, SEC, and RP C18 separation.

3.5. Matrix Effect Evaluation

The background matrix in the sample could compete with the target compound for ionization in the ESI source of the mass spectrometer, which significantly affects the ionization efficiency and the accuracy of the target compound [53]. Ultrapure water and tailwater were used as background matrix for direct-injection mass spectrometry to evaluate the background matrix’s influence. The results demonstrated that the signal intensity of N-nitrosamines in samples containing the background matrix in tailwater was only 4.2–9.8% of that in pure water, indicating that the tailwater matrix significantly interfered with the accurate quantitative analysis of N-nitrosamines.
To assess the matrix effect, the Online-SPE/SEC/LCMS method was used to determine and compare the response signal in pure water and tailwater. The results show that the ME values for the nine N-nitrosamines were −13.99% (NDMA), −0.18% % (NMEA), 8.59% (NPyr), 17.39% (NDEA), −7.21% (NPip), 12.32% (NMor), −2.73% (NDPA), −4.54% (NDBA), and 0.65% (NDPhA). When ME values are less than 20%, it is generally assumed that matrix effects can be ignored [53]. The ME values of the nine N-nitrosamines in this method were all less than 20%, demonstrating that this method can effectively overcome matrix effects.
SEC columns are commonly used for sample cleanup in application practice. The porous gel in the SEC column effectively separates the matrix and the target compounds based on their molecular sizes. Therefore, the SEC technique has a significant advantage in removing the interference of proteins, phospholipids, and humus [54].
Inorganic ions and dissolved organic matter (DOM) are the two types of matrix background. Inorganic ions are removed directly in the enrichment stage (stage 1) due to their inability to be retained by the SPE column. However, due to their similar physicochemical properties, DOM is concentrated as well as the target contaminants. Thereby, DOM could strongly affect the ionization of the target contaminants (mainly by inhibition) when co-flowing into the mass spectrometer.
Current reports indicate that most DOM in the tailwater and environmental samples are large molecules with an average molecular weight of 1000–3000 D [55,56,57]. Protein and other substances in DOM typically have molecular weights greater than 10 kD. Since the molecular weights of N-nitrosamines are less than 500 D, this provides a theoretical basis for separating target contaminants and matrix using the SEC column.
So far, the combination of SEC and RP for separating complex samples, commonly known as two-dimensional liquid chromatography (2D-LC), has been a trend. By accessing SEC in the first dimension and RP in the second dimension, researchers have successfully analyzed the protein aggregates [58], monoclonal antibodies [59], and pharmaceutical drug oligomers [60]. The separation mechanism of SEC is mainly based on molecular size, while RP is based on hydrophobicity. Therefore, the combination of SEC and RP gives strong orthogonality with a 300% increase in separation efficiency [61]. The ME values in this study ranged from −13.99% to 17.39%, all of which were less than 20%, indicating that incorporation of the SEC technique into the Online-SPE/SEC/LCMS system effectively separated the enriched target contaminants from DOM. This study further demonstrates the success and application potential of a multidimensional separation of the Online-SPE/SEC/LCMS system.
In addition, this study used the standard addition to correct the matrix effects. Both the internal standard calibration and the standard addition method are commonly accepted techniques in LCMS analysis. Reports illustrate that the optimized standard addition method yields more accurate results than the internal standard calibration using stable isotope labeled analogues [48,62]. The following analytical methods can further be optimized using the internal standard calibration based on the setup of Online-SPE/SEC/LCMS.

3.6. Method Application

The developed method was used to determine the occurrence of nine N-nitrosamines in the wastewater plant’s tailwater. The analysis was performed three times, and the results were averaged. The results indicated the presence of NMEA, NDPhA, and NPyr at concentrations of 10.46, 2.66, and 2.08 ng/L, respectively. Other compounds have not been detected as of yet. It has been discovered that NDMA is present in drinking water on a widespread scale, where an average concentration is 11 ng/L in 33% of 156 water samples from the drinking water plant in China [63]. The largest concentration of NDMA was a high of 320 ng/L in tailwater for water reuse from five wastewater treatment plants in the USA [64], which has exceeded the limit of 100 ng/L of NDMA set by the World Health Organization [65]. The risks associated with high NDMA concentrations from tailwater discharge cannot be ignored. Therefore, the regular monitoring for N-nitrosamine in tailwater must be strengthened in the daily management of wastewater plants.

4. Conclusions

N-nitrosamine disinfection byproducts are widely present in tailwater discharged from wastewater treatment plants after chlorination. Tailwater entering a drinking water source poses a potential threat to water quality safety. Therefore, regular monitoring for N-nitrosamine in the tailwater and receiving water downstream is critical.
The developed Online-SPE/SEC/LCMS method can detect and analyze nine N-nitrosamines in wastewater plant tailwater. The method has the advantages of simple pretreatment, high sensitivity, and good selectivity. The sample can be directly injected in a large volume (1.0 mL) after filtration by a 0.22 μm PTFE membrane, significantly improving the analysis efficiency. The method’s validation parameters were also satisfactory, with good linearity (R2 > 0.999), accuracy (recovery between 91.67% and 105.88%), and precision (RSD < 4.17%). The LOD and LOQ values were 0.12–6.60 ng/L and 0.40–21.99 ng/L.
This method reports the combination of SPE, SEC, and RP C18 columns to achieve several functions, such as online enrichment, desalination, and matrix separation, for the first time. This method incorporates SEC technique, effectively reducing matrix effects, and is beneficial for analyzing water samples with complex background matrix, such as tailwater, river, lake, and ocean samples, etc. The practical utility of this approach is high, allowing for the accurate quantitative analysis of N-nitrosamines with high compatibility.
Matrix effects are a dark cloud that hovers over LCMS analysis. The co-flux of target substances and background matrix inhibits the detection of target substances. Together with Online-SPE and SEC, target contaminant enrichment and matrix separation were achieved. The combination of multiple separation methods, such as SEC, RP C18, and HILIC, to form multi-dimensional chromatography (2DLC or 3DLC) with strong orthogonality will be the future of chromatographic separation techniques. Multi-dimensional chromatography followed by mass spectrometry (QQQ, Orbitrap, Q-TOF, FTICRMS) could significantly improve the detection of known and unknown pollutants in the aqueous samples. This concept is expected to become the optional procedure for non-targeted screening and targeted quantitative analysis of pollutants in the future.

Author Contributions

E.D., L.Z., Z.L. (Ziru Li) and M.P., conceived the experiments; H.T., X.J., Z.L. (Zhen Lyu) and Y.X., performed the experiments; H.T., wrote the original draft; H.C., discussed the results and polished the manuscript; E.D. reviewed and revised the original draft. All authors have read and agreed to the published version of the manuscript.

Funding

This research was funded by Science and Technology Program of Changzhou City (CE20225069); Carbon peak and carbon neutral technology innovation special project of Jiangsu Province (BE2022426); Research and Practice Innovation Program for Graduate Students in Jiangsu Province (KYCX21_2849; SJCX22_1369; SJCX22_1373; KYCX22_3083).

Institutional Review Board Statement

Not applicable.

Informed Consent Statement

Not applicable.

Data Availability Statement

The data presented in this study are original and available on request from the corresponding author on reasonable request.

Acknowledgments

The authors would like to thank the anonymous reviewers for their valuable comments.

Conflicts of Interest

The authors declare no conflict of interest.

Appendix A

Figure A1. The retention time of NDMA on five columns in 100% pure water.
Water 14 02371 g0a1
Figure A2. Chromatograms of nine N-nitrosamines in in four type of flow phase flow phase of (a) water/methanol, (b) 0.1% formic acid in water/acetonitrile, (c) 0.025% ammonia in water/methanol, and (d) 5 mmol/L ammonium formate in water/methanol.
Water 14 02371 g0a2
Figure A3. Chromatograms of nine N-nitrosamines at a concentration of 50 ng/L and the corresponding signal-to-noise ratios.
Water 14 02371 g0a3

References

  1. Ding, S.; Chu, W. Recent advances in the analysis of nitrogenous disinfection by-products. Trends Environ. Anal. Chem. 2017, 14, 19–27. [Google Scholar] [CrossRef]
  2. Piazzoli, A.; Breider, F.; Aquillon, C.G.; Antonelli, M.; von Gunten, U. Specific and total N-nitrosamines formation potentials of nitrogenous micropollutants during chloramination. Water Res. 2018, 135, 311–321. [Google Scholar] [CrossRef] [PubMed] [Green Version]
  3. He, Y.; Cheng, H. Degradation of N-nitrosodimethylamine (NDMA) and its precursor dimethylamine (DMA) in mineral micropores induced by microwave irradiation. Water Res. 2016, 94, 305–314. [Google Scholar] [CrossRef] [PubMed]
  4. Chuang, Y.-H.; Mitch, W.A. Effect of Ozonation and Biological Activated Carbon Treatment of Wastewater Effluents on Formation of N-nitrosamines and Halogenated Disinfection Byproducts. Environ. Sci. Technol. 2017, 51, 2329–2338. [Google Scholar] [CrossRef] [PubMed]
  5. Qian, Y.; Chen, Y.; Hu, Y.; Hanigan, D.; Westerhoff, P.; An, D. Formation and control of C- and N-DBPs during disinfection of filter backwash and sedimentation sludge water in drinking water treatment. Water Res. 2021, 194, 116964. [Google Scholar] [CrossRef] [PubMed]
  6. Lei, X.; Lei, Y.; Zhang, X.; Yang, X. Treating disinfection byproducts with UV or solar irradiation and in UV advanced oxidation processes: A review. J. Hazard. Mater. 2021, 408, 124435. [Google Scholar] [CrossRef] [PubMed]
  7. Maqbool, T.; Zhang, J.; Li, Q.; Qin, Y.; Chen, L.; Zhang, Z. Occurrence and fate of N-nitrosamines in three full-scale drinking water treatment systems with different treatment trains. Sci. Total Environ. 2021, 783, 146982. [Google Scholar] [CrossRef] [PubMed]
  8. Chen, Z.; Yang, L.; Huang, Y.; Spencer, P.; Zheng, W.; Zhou, Y.; Jiang, S.; Ye, W.; Zheng, Y.; Qu, W. Carcinogenic risk of N-Nitrosamines in Shanghai Drinking Water: Indications for the Use of Ozone Pretreatment. Environ. Sci. Technol. 2019, 53, 7007–7018. [Google Scholar] [CrossRef]
  9. Zhang, Z.; Zhao, Q.; Song, H.; Zhang, J.; Wang, L.; Qi, J.; Liu, Y.; Ma, J. Comparative study about oxidation of trace N-nitrosamines by seven oxidation processes with a sensitivity improved determination method. Sep. Purif. Technol. 2020, 236, 116009. [Google Scholar] [CrossRef]
  10. Zhao, C.; Zhou, J.; Gu, Y.; Pan, E.; Sun, Z.; Zhang, H.; Lu, Q.; Zhang, Y.; Yu, X.; Liu, R.; et al. Urinary exposure of N-nitrosamines and associated risk of esophageal cancer in a high incidence area in China. Sci. Total Environ. 2020, 738, 139713. [Google Scholar] [CrossRef]
  11. Chen, W.; Chen, Y.; Huang, H.; Lu, Y.; Khorram, M.S.; Zhao, W.; Wang, D.; Qi, S.; Jin, B.; Zhang, G. Occurrence of N-Nitrosamines in the Pearl River delta of China: Characterization and evaluation of different sources. Water Res. 2019, 164, 114896. [Google Scholar] [CrossRef] [PubMed]
  12. Liew, D.; Linge, K.L.; Joll, C.A. Formation of nitrogenous disinfection by-products in 10 chlorinated and chloraminated drinking water supply systems. Environ. Monit. Assess. 2016, 188, 518. [Google Scholar] [CrossRef]
  13. Lashgari, M.; Yamini, Y.; Basheer, C.; Lee, H.K. Ordered mesoporous carbon as sorbent for the extraction of N-nitrosamines in wastewater and swimming pool water. J. Chromatogr. A 2017, 1513, 35–41. [Google Scholar] [CrossRef] [PubMed]
  14. Qiu, Y.; Bei, E.; Wang, Y.; Wang, J.; Zhang, X.; Chen, C. One representative water supply system in China with nitrosamine concern: Challenges and treatment strategies. J. Environ. Sci. 2020, 88, 12–20. [Google Scholar] [CrossRef] [PubMed]
  15. Farré, M.J.; Insa, S.; Lamb, A.; Cojocariu, C.; Gernjak, W. Occurrence of N-nitrosamines and their precursors in Spanish drinking water treatment plants and distribution systems. Environ. Sci. Water Res. Technol. 2020, 6, 210–220. [Google Scholar] [CrossRef]
  16. Sgroi, M.; Vagliasindi, F.G.A.; Snyder, S.A.; Roccaro, P. N-Nitrosodimethylamine (NDMA) and its precursors in water and wastewater: A review on formation and removal. Chemosphere 2018, 191, 685–703. [Google Scholar] [CrossRef]
  17. Chen, W.; Li, X.; Huang, H.; Zhu, X.; Jiang, X.; Zhang, Y.; Cen, K.; Zhao, L.; Liu, X.; Qi, S. Comparison of gas chromatography-mass spectrometry and gas chromatography-tandem mass spectrometry with electron ionization for determination of N-nitrosamines in environmental water. Chemosphere 2017, 168, 1400–1410. [Google Scholar] [CrossRef] [PubMed]
  18. Wang, X.; Liu, Z.; Wang, C.; Ying, Z.; Fan, W.; Yang, W. Occurrence and formation potential of nitrosamines in river water and ground water along the Songhua River, China. J. Environ. Sci. 2016, 50, 65–71. [Google Scholar] [CrossRef] [PubMed]
  19. Amayreh, M. Determination of N-nitrosamines in Water by Automated Headspace Solid-Phase Microextraction. Arab. J. Sci. Eng. 2019, 44, 269–278. [Google Scholar] [CrossRef]
  20. Sgroi, M.; Roccaro, P.; Oelker, G.; Snyder, S.A. N-nitrosodimethylamine (NDMA) formation during ozonation of wastewater and water treatment polymers. Chemosphere 2016, 144, 1618–1623. [Google Scholar] [CrossRef]
  21. Gushgari, A.J.; Halden, R.U. Critical review of major sources of human exposure to N-nitrosamines. Chemosphere 2018, 210, 1124–1136. [Google Scholar] [CrossRef] [PubMed]
  22. Li, R.; Liu, Y.; Wang, Z.; Zhang, Q.; Bai, H.; Lv, Q. High resolution GC–Orbitrap MS for nitrosamines analysis: Method performance, exploration of solid phase extraction regularity, and screening of children’s products. Microchem. J. 2021, 162, 105878. [Google Scholar] [CrossRef]
  23. Kühne, F.; Kappenstein, O.; Straβgütl, S.; Weese, F.; Weyer, J.; Pfaff, K.; Luch, A. N-nitrosamines migrating from food contact materials into food simulants: Analysis and quantification by means of HPLC-APCI-MS/MS. Food Addit. Contam. Part A Chem. Anal. Control Expo. Risk Assess. 2018, 35, 792–805. [Google Scholar] [CrossRef] [PubMed]
  24. Miralles, P.; Chisvert, A.; Salvador, A. Determination of N-nitrosamines in cosmetic products by vortex-assisted reversed-phase dispersive liquid-liquid microextraction and liquid chromatography with mass spectrometry. J. Sep. Sci. 2018, 41, 3143–3151. [Google Scholar] [CrossRef] [PubMed]
  25. Ngongang, A.D.; Duy, S.V.; Sauvé, S. Analysis of nine N-nitrosamines using liquid chromatography-accurate mass high resolution-mass spectrometry on a Q-Exactive instrument. Anal. Methods 2015, 7, 5748–5759. [Google Scholar] [CrossRef]
  26. Malihi, F.; Wang, T. An improved analytical method for quantitation of nitrosamine impurities in ophthalmic solutions using liquid chromatography with tandem mass spectrometry. J. Chromatogr. Open 2022, 2, 100037. [Google Scholar] [CrossRef]
  27. Luo, Q.; Wang, D.; Wang, B.; Wang, Z.; Wang, Z. Rapid and sensitive method for simultaneous determination of nine N-nitrosamines in drinking water by UPLC-MS/MS. Sci. Sin.-Chim. 2011, 41, 82–90. [Google Scholar] [CrossRef]
  28. Sluggett, G.W.; Zelesky, T.; Hetrick, E.M.; Babayan, Y.; Baertschi, S.W. Artifactual degradation of secondary amine-containing drugs during accelerated stability testing when saturated sodium nitrite solutions are used for humidity control. J. Pharm. Biomed. Anal. 2018, 149, 206–213. [Google Scholar] [CrossRef]
  29. Alexandrou, L.D.; Bowen, C.; Jones, O.A.H. Fast analysis of multiple haloacetic acids and nitrosamines in recycled and environmental waters using liquid chromatography-mass spectrometry with positive–negative switching and multiple reaction monitoring. Anal. Methods 2019, 11, 3793–3799. [Google Scholar] [CrossRef]
  30. Kürzl, C.; Wohlschläger, H.; Schiffer, S.; Kulozik, U. Concentration, purification and quantification of milk protein residues following cleaning processes using a combination of SPE and RP-HPLC. MethodsX 2022, 9, 101695. [Google Scholar] [CrossRef]
  31. Rach, O.; Hadeen, X.; Sachse, D. An automated solid phase extraction procedure for lipid biomarker purification and stable isotope analysis. Org. Geochem. 2020, 142, 103995. [Google Scholar] [CrossRef]
  32. Qian, Y.; Wu, M.; Wang, W.; Chen, B.; Zheng, H.; Krasner, S.W.; Hrudey, S.E.; Li, X.-F. Determination of 14 nitrosamines at nanogram per liter levels in drinking water. Anal. Chem. 2015, 87, 1330–1336. [Google Scholar] [CrossRef]
  33. Liang, Y.; Liu, J.; Zhong, Q.; Yu, D.; Yao, J.; Huang, T.; Zhu, M.; Zhou, T. A fully automatic cross used solid-phase extraction online coupled with ultra-high performance liquid chromatography-tandem mass spectrometry system for the trace analysis of multi-class pharmaceuticals in water samples. J. Pharm. Biomed. Anal. 2019, 174, 330–339. [Google Scholar] [CrossRef] [PubMed]
  34. Hama, J.R.; Strobel, B.W. Pyrrolizidine alkaloids quantified in soil and water using UPLC-MS/MS. RSC Adv. 2019, 9, 30350–30357. [Google Scholar] [CrossRef] [PubMed] [Green Version]
  35. Maciel, E.V.S.; de Toffoli, A.L.; Lanças, F.M. Current status and future trends on automated multidimensional separation techniques employing sorbent-based extraction columns. J. Sep. Sci. 2019, 42, 258–272. [Google Scholar] [CrossRef] [PubMed] [Green Version]
  36. Gusmaroli, L.; Insa, S.; Petrovic, M. Development of an online SPE-UHPLC-MS/MS method for the multiresidue analysis of the 17 compounds from the EU “Watch list”. Anal. Bioanal. Chem. 2018, 410, 4165–4176. [Google Scholar] [CrossRef]
  37. Marasco Júnior, C.A.; Sartore, D.M.; Lamarca, R.S.; Da Silva, B.F.; Santos-Neto, Á.J.; de Lima Gomes, P.C.F. On-line solid-phase extraction of pharmaceutical compounds from wastewater treatment plant samples using restricted access media in column-switching liquid chromatography-tandem mass spectrometry. J. Chromatogr. B Analyt. Technol. Biomed. Life Sci. 2021, 1180, 122896. [Google Scholar] [CrossRef]
  38. Amelin, V.G.; Bol’shakov, D.S. Rapid Identification and Determination of N-Nitrosamines in Food Products by Ultra-High-Performance Liquid Chromatography–High Resolution Quadrupole-Time-of-Flight Mass Spectrometry by Exact Masses of Protonated Molecules. J. Anal. Chem. 2019, 74, 39–46. [Google Scholar] [CrossRef]
  39. Taylor, P.J. Matrix effects: The Achilles heel of quantitative high-performance liquid chromatography-electrospray-tandem mass spectrometry. Clin. Biochem. 2005, 38, 328–334. [Google Scholar] [CrossRef]
  40. Dubuis, A.; Le Masle, A.; Chahen, L.; Destandau, E.; Charon, N. Off-line comprehensive size exclusion chromatography × reversed-phase liquid chromatography coupled to high resolution mass spectrometry for the analysis of lignocellulosic biomass products. J. Chromatogr. A 2020, 1609, 460505. [Google Scholar] [CrossRef] [PubMed]
  41. Fekete, S.; Beck, A.; Veuthey, J.-L.; Guillarme, D. Theory and practice of size exclusion chromatography for the analysis of protein aggregates. J. Pharm. Biomed. Anal. 2014, 101, 161–173. [Google Scholar] [CrossRef]
  42. Huang, T.-Y.; Chi, L.-M.; Chien, K.-Y. Size-exclusion chromatography using reverse-phase columns for protein separation. J. Chromatogr. A 2018, 1571, 201–212. [Google Scholar] [CrossRef] [PubMed]
  43. Mathur, S.; Park, J.D.; Kim, D.H.; Hartmann, R.W. A method for screening enzyme inhibitors using size exclusion chromatography and ESI-LC-MS/MS. J. Biomol. Screen. 2005, 10, 30–35. [Google Scholar] [CrossRef] [PubMed] [Green Version]
  44. Brusotti, G.; Calleri, E.; Colombo, R.; Massolini, G.; Rinaldi, F.; Temporini, C. Advances on Size Exclusion Chromatography and Applications on the Analysis of Protein Biopharmaceuticals and Protein Aggregates: A Mini Review. Chromatographia 2018, 81, 3–23. [Google Scholar] [CrossRef]
  45. Saraswat, M.; Garapati, K.; Mun, D.-G.; Pandey, A. Extensive heterogeneity of glycopeptides in plasma revealed by deep glycoproteomic analysis using size-exclusion chromatography. Mol. Omics 2021, 17, 939–947. [Google Scholar] [CrossRef] [PubMed]
  46. Goyon, A.; Kim, M.; Dai, L.; Cornell, C.; Jacobson, F.; Guillarme, D.; Stella, C. Streamlined Characterization of an Antibody-Drug Conjugate by Two-Dimensional and Four-Dimensional Liquid Chromatography/Mass Spectrometry. Anal. Chem. 2019, 91, 14896–14903. [Google Scholar] [CrossRef]
  47. Chilakala, S.; Mehtab, V.; Tallapally, M.; Vemula, M.; Shaikh, A.S.; Chenna, S.; Upadhyayula, V. SEC-MS/MS determination of amino acids from mango fruits and application of the method for studying amino acid perturbations due to post harvest ripening. LWT 2021, 138, 110680. [Google Scholar] [CrossRef]
  48. Hewavitharana, A.K.; Abu Kassim, N.S.; Shaw, P.N. Standard addition with internal standardisation as an alternative to using stable isotope labelled internal standards to correct for matrix effects-Comparison and validation using liquid chromatography-tandem mass spectrometric assay of vitamin D. J. Chromatogr. A 2018, 1553, 101–107. [Google Scholar] [CrossRef] [PubMed]
  49. Sloop, J.T.; Gonçalves, D.A.; O’Brien, L.M.; Carter, J.A.; Jones, B.T.; Donati, G.L. Evaluation of different approaches to applying the standard additions calibration method. Anal. Bioanal. Chem. 2021, 413, 1293–1302. [Google Scholar] [CrossRef]
  50. Syed, H.K.; Liew, K.B.; Loh, G.O.K.; Peh, K.K. Stability indicating HPLC-UV method for detection of curcumin in Curcuma longa extract and emulsion formulation. Food Chem. 2015, 170, 321–326. [Google Scholar] [CrossRef]
  51. Patil, M.P.N. HPLC Method Development-A Review. J. Pharm. Res. Educ. 2017, 1, 243–260. [Google Scholar]
  52. Ćirić, A.; Prosen, H.; Jelikić-Stankov, M.; Đurđević, P. Evaluation of matrix effect in determination of some bioflavonoids in food samples by LC-MS/MS method. Talanta 2012, 99, 780–790. [Google Scholar] [CrossRef] [PubMed]
  53. Du, L.; White, R.L. Reducing glycerophosphocholine lipid matrix interference effects in biological fluid assays by using high-turbulence liquid chromatography. Rapid Commun. Mass Spectrom. 2008, 22, 3362–3370. [Google Scholar] [CrossRef] [PubMed]
  54. Zhou, X.; Chen, W.-Q.; Ding, Y.-Q.; Zhu, B.-Q.; Fan, Z.-Y.; Luo, J.-W. Rapid determination of sulfonamides in chicken using two-dimensional online cleanup mode with three columns coupled to liquid chromatography-tandem mass spectrometry. J. Chromatogr. B Analyt. Technol. Biomed. Life Sci. 2019, 1114–1115, 110–118. [Google Scholar] [CrossRef]
  55. Komatsu, K.; Onodera, T.; Kohzu, A.; Syutsubo, K.; Imai, A. Characterization of dissolved organic matter in wastewater during aerobic, anaerobic, and anoxic treatment processes by molecular size and fluorescence analyses. Water Res. 2020, 171, 115459. [Google Scholar] [CrossRef]
  56. McAdams, B.C.; Aiken, G.R.; McKnight, D.M.; Arnold, W.A.; Chin, Y.-P. High Pressure Size Exclusion Chromatography (HPSEC) Determination of Dissolved Organic Matter Molecular Weight Revisited: Accounting for Changes in Stationary Phases, Analytical Standards, and Isolation Methods. Environ. Sci. Technol. 2018, 52, 722–730. [Google Scholar] [CrossRef] [PubMed]
  57. Lin, H.; Guo, L. Variations in Colloidal DOM Composition with Molecular Weight within Individual Water Samples as Characterized by Flow Field-Flow Fractionation and EEM-PARAFAC Analysis. Environ. Sci. Technol. 2020, 54, 1657–1667. [Google Scholar] [CrossRef] [PubMed]
  58. Rathore, A.S.; Auclair, J.; Bhattacharya, S.; Sarin, D. Two-Dimensional Liquid Chromatography (2D-LC): Analysis of Size-Based Heterogeneities in Monoclonal Antibody–Based Biotherapeutic Products. LCGC N. Am. 2022, 40, 27–31. [Google Scholar]
  59. Farsang, E.; Guillarme, D.; Veuthey, J.-L.; Beck, A.; Lauber, M.; Schmudlach, A.; Fekete, S. Coupling non-denaturing chromatography to mass spectrometry for the characterization of monoclonal antibodies and related products. J. Pharm. Biomed. Anal. 2020, 185, 113207. [Google Scholar] [CrossRef]
  60. Goyon, A.; Scott, B.; Crittenden, C.M.; Zhang, K. Analysis of pharmaceutical drug oligomers by selective comprehensive two-dimensional liquid chromatography-high resolution mass spectrometry. J. Pharm. Biomed. Anal. 2022, 208, 114466. [Google Scholar] [CrossRef]
  61. Ji, S.; Wang, S.; Xu, H.; Su, Z.; Tang, D.; Qiao, X.; Ye, M. The application of on-line two-dimensional liquid chromatography (2DLC) in the chemical analysis of herbal medicines. J. Pharm. Biomed. Anal. 2018, 160, 301–313. [Google Scholar] [CrossRef] [PubMed]
  62. Punt, A.M.; Langenhorst, J.B.; Egas, A.C.; Boelens, J.J.; van Kesteren, C.; van Maarseveen, E.M. Simultaneous quantification of busulfan, clofarabine and F-ARA-A using isotope labelled standards and standard addition in plasma by LC-MS/MS for exposure monitoring in hematopoietic cell transplantation conditioning. J. Chromatogr. B Analyt. Technol. Biomed. Life Sci. 2017, 1055–1056, 81–85. [Google Scholar] [CrossRef] [PubMed]
  63. Bei, E.; Shu, Y.; Li, S.; Liao, X.; Wang, J.; Zhang, X.; Chen, C.; Krasner, S. Occurrence of nitrosamines and their precursors in drinking water systems around mainland China. Water Res. 2016, 98, 168–175. [Google Scholar] [CrossRef]
  64. Zeng, T.; Plewa, M.J.; Mitch, W.A. N-Nitrosamines and halogenated disinfection byproducts in U.S. Full Advanced Treatment trains for potable reuse. Water Res. 2016, 101, 176–186. [Google Scholar] [CrossRef] [PubMed] [Green Version]
  65. White, C.M.; Hernandez, A.V. Ranitidine and Risk of N-Nitrosodimethylamine (NDMA) Formation. JAMA 2021, 326, 225–227. [Google Scholar] [CrossRef] [PubMed]
Figure 1. Scheme of the online SPE/SEC/LCMS system with four stages.
Water 14 02371 g001
Figure 2. Chromatograms of 9 N-nitrosamines in two types of flow phase (a) water/methanol and (b) water/acetonitrile.
Water 14 02371 g002
Table 1. Types and characteristics of five test columns for online SPE of N-nitrosamines.
TypeSpecificationsPore Size
(Å)
Surface Area
(m2/g)
pH RangeCapacity Factor a
Waters Atlantis T34.6 mm × 20 mm × 5.0 μm1003302.0–8.00.3
Thermo RSLC 3.0 mm × 33 mm × 3.0 μm1203001.5–10.00.4
Waters Oasis Wax3.9 mm × 20 mm × 30 μm801000–14.03.7
Thermo PFP3.0 mm × 30 mm × 2.5 μm1002302.0–8.01.7
Waters Oasis HLB3.9 mm × 20 mm × 5.0 μm807860–14.06.0
Note: a Capacity factor is the ratio of a component’s retention time in the stationary phase to its retention time in the mobile phase.
Table 2. Elution procedure for left and right pumps and six-way valve switching time.
Left PumpRight PumpValve Switch
Time
(min)
Flow Rate
(mL/min)
Methanol
(%)
Flow Rate
(mL/min)
Acetonitrile
(%)
Time
(min)
Left Valve PositionRight Valve Position
01.0000.352001–21–2
1.41.0001.41–26–1
1.51.00202.76–11–2
2.51.00203.61–21–2
5.00.3595
12.50.3595
13.00.3595
17.01.000
20.01.000
Table 3. Molecular structure and optimized MRM parameters for 9 N-nitrosamines.
CompoundsMolecular FormulaMolecular StructurePrecursor
m/z a
Quantifier
m/z
Qualifier
m/z
Collision Energy
(eV)
Lens Offset
NDMAC2H6N2O Water 14 02371 i00175.143.358.31657.6
NMEAC3H8N2O Water 14 02371 i00289.088.543.35125.1
NPyrC4H8N2O Water 14 02371 i003101.155.339.41660.1
NDEAC4H10N2O Water 14 02371 i004103.175.227.51157.6
NPipC5H10N2O Water 14 02371 i005115.169.241.41563.1
NMorC4H8N2O2 Water 14 02371 i006117.187.286.21358.1
NDPAC6H14N2O Water 14 02371 i007131.141.439.41950.3
NDBAC8H18N2O Water 14 02371 i008159.141.439.43758.3
NDPhAC12H10N2O Water 14 02371 i009199.0169.166.21056.1
Note: a m/z, mass-to-charge ratio.
Table 4. Performance characteristics and linearity equation for nine N-nitrosamines determination in pure water.
AnalyteLinearity EquationCorrelation coefficient (R2)QC1
(10 ng/mL)
QC2
(50 ng/mL)
QC3
(100 ng/mL)
LOD b
(ng/L)
LOQ c
(ng/L)
Recovery
(%)
RSD a(%)Recovery
(%)
RSD
(%)
Recovery
(%)
RSD
(%)
NDMAy = 7345 x + 13,1830.999991.674.1795.493.8999.373.066.6021.99
NMEAy = 108,885 x − 258,8000.999897.783.5598.021.93100.71.636.1420.46
NPyry = 393,491 x − 1,238,3080.9993104.900.99100.360.9798.540.741.725.74
NDEAy = 256,265 x + 437,7470.999893.482.67105.882.5096.361.870.862.87
NPipy = 732,010 x + 2,070,6030.999495.372.7996.543.85101.01.302.708.99
NMory = 46,808 x + 133,9100.999499.433.8098.072.99100.22.182.147.12
NDPAy = 74,461 x + 164,4450.9997103.790.87101.622.8799.380.972.117.04
NDBAy = 20,982 x + 36,6590.999896.851.24103.873.4898.732.683.2910.98
NDPhAy = 816,649 x + 2,207,0720.9995100.861.0199.450.7698.950.680.120.40
Note: a RSD, relative standard deviation. b LOD, limits of detection, the concentration level at S/N = 3. c LOQ, limits of quantification, the concentration level at S/N = 10.
Publisher’s Note: MDPI stays neutral with regard to jurisdictional claims in published maps and institutional affiliations.

