
Performance Assessment for Increasing Connection Rates of Private Water Supply Operators in Cambodia


Department of Urban Engineering, Graduate School of Engineering, The University of Tokyo, Bunkyo-ku, Tokyo 113-8654, Japan
*
Author to whom correspondence should be addressed.
Water 2022, 14(15), 2369; https://doi.org/10.3390/w14152369
Submission received: 17 June 2022
/
Revised: 27 July 2022
/
Accepted: 28 July 2022
/
Published: 31 July 2022
(This article belongs to the Section Urban Water Management)
Abstract
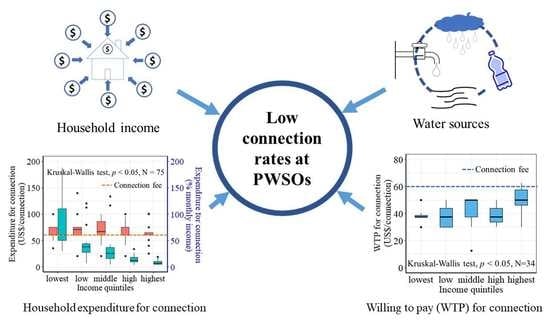
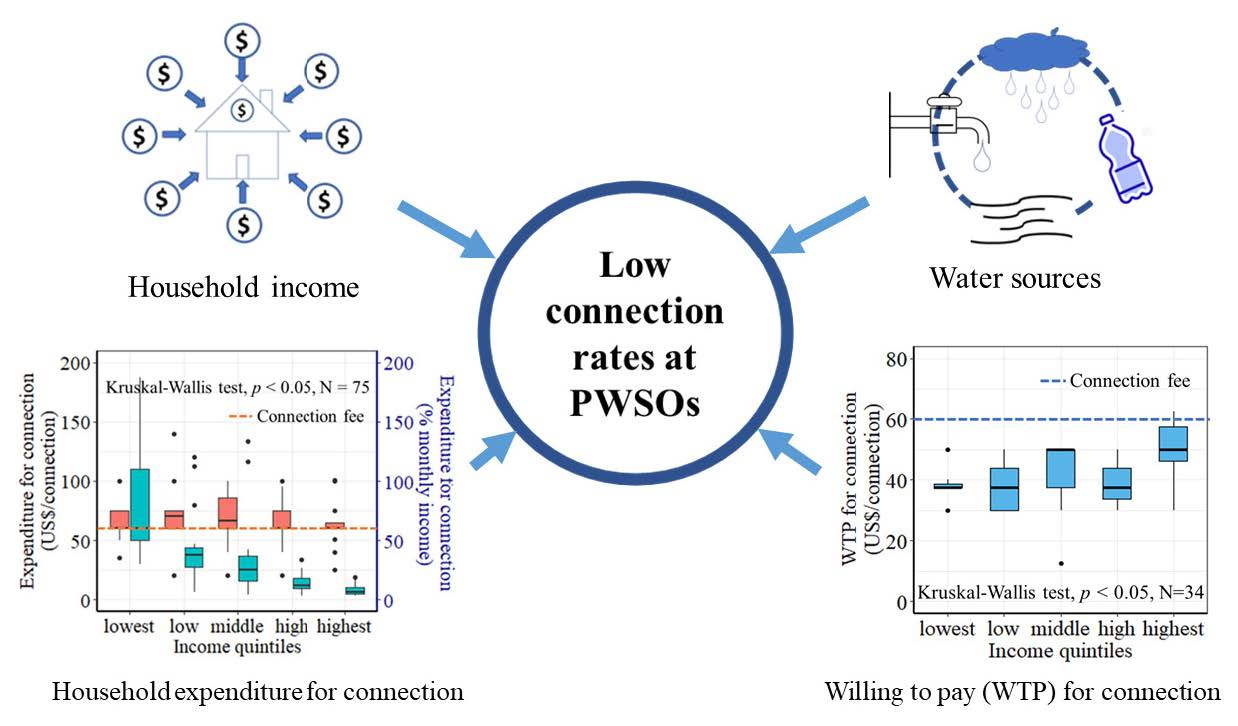
:Private water supply operators (PWSOs) play an important role in extending piped water services in small cities in Cambodia. However, the connection rates to PWSOs are highly varied. Therefore, this study aimed to find the reasons for the low connection rates of PWSOs and to propose ways to increase the connection rates. The three PWSOs selected for this study supply water continuously, with sufficiently high pressure and good water quality except for the low concentration of residual chlorine, while the per capita supply volume varies significantly. Households with alternative water sources, namely rainwater and well water, consume less piped water than those without alternative water sources. Scattered service areas far away from water treatment plants had coverage rates that were lower than in compact service areas. The present connection costs and water tariffs are higher than those that non-connected households are willing to pay, though they pay high costs for bottled water. Due to the high variation in household income, connection fees and water tariffs are a financial burden for low-income households. Because the operating rates of the PWSOs are 21–47%, it is advised that PWSOs reduce their connection fees and water tariffs to obtain more connected households in their service areas.
1. Introduction
Target 6.1 of the Sustainable Development Goals (SDGs) aims to achieve universal and equitable access to safe drinking water for all by 2030. However, in 2020, 26% of the world population, or approximately 2 billion people, were still unable to access safe drinking water [1]. Piped water supply services are the most important means to provide safe drinking water [2]; however, the piped water supply service coverage was only 58% worldwide in 2015 [3].
In many developing countries, piped water supply systems are facing challenges such as low coverage rates, aging infrastructure, financing difficulties, increasing water consumption, and poor service quality [4,5]. Even large countries, such as China and India, are facing major challenges in providing safe and sufficient clean water to their population due to water shortages and contamination [6]. The piped water coverage in Chennai, India, remains at only 65%; the rest of the population relies on private service providers, self-supply from wells, and other sources [7]. In some countries in Africa, the piped water coverage is even lower, e.g., 27% in Oyo State, Nigeria [8]. Therefore, to meet the SDG Target 6.1, the United Nations Children’s Fund (UNICEF) encourages governments to make more investments into piped water supplies [9,10]. However, shortages of government investments and increasing water demand have led to the emergence of alternative service providers, such as private water supply operators (PWSOs) [7]. This trend of private-sector participation in water supply is supported by the governments of many developing countries to address their financial and technical incapability to establish and operate publicly owned water suppliers [11].
Cambodia is one country encouraging private investment in the water supply sector and approved 16 Cambodia Provincial and Peri-Urban Water and Sanitation Projects (CPPUWSP, IDA Credit No. 3746-KH) in 2006 [12]. In Cambodia, the access rates to safe drinking water were estimated at 29.2% on average, of which 96.1% were in Phnom Penh, 56.6% were in other urban areas, and 16% were in rural areas in 2017 [13]. The low rates of access to safe drinking water in rural areas is due to the low access to piped water supply systems [14]. However, the Royal Government of Cambodia has set a goal that, by 2025, 100% of the urban population will have access to safe, quality, affordable, and sustainable water supplies, of which 90% will be piped water and 10% from other sources; and, in 2030, they are aiming for 100% access to safe drinking water for the whole population [15]. In Cambodia, there are 14 public water supplies, of which 12 are in provincial capitals and 2 are in peri-urban areas, and there are more than 328 registered PWSOs licensed by the Ministry of Industry, Science, Technology & Innovation (MISTI), which was formerly the Ministry of Industry and Handicraft (MIH) [16]. To meet the high demand for water supply services while overcoming the shortage of public investment funds, the private sector in Cambodia will be a key driver for increased access to piped water, especially in rural areas [17] and in urban and peri-urban areas where public water supplies are not accessible [18].
However, many PWSOs have reported that they cannot cover the whole service area mandated in their licenses due to financial shortages and a lack of capacity in operation and management, resulting in low connection rates [18]. PWSOs supply water with a small-scale water supply system, and they do not always comply with the national water quality standards and technical requirements, both in quantity and quality, for small-scale water supply in Cambodia [19,20]. However, a performance report of public water supplies and PWSOs in seven towns and one district in Cambodia revealed that the PWSOs provide better quality services than public water supplies, but their water tariff is several times higher than that of public water supplies [21]. These results imply that the lower connection rates to PWSOs compared to public water utilities are mainly due to high water tariffs, and not due to low quality of services; however, there is no information to verify such a hypothesis [22]. Adjustment of the connection fee and water tariff to within an affordable range, and yet high enough to keep the water supply business running, is an important but challenging issue for both governmental and nongovernmental decision makers [23]. Because 76.5% of Cambodian people live in rural areas, they use traditional water sources such as rainwater, river water, and/or well water. Encouraging them to connect to and use piped water is a difficult task, even though the piped water supplies are easily accessible [17,24].
To increase the connection rates to PWSOs, it is necessary to find the reasons for the low connection rates in some service areas of PWSOs in Cambodia. This study aimed to find the reasons for low connection rates of PWSOs in Cambodia and to propose way(s) to increase the connection rates of PWSOs. This study integrated multiple information to assess the service levels of the PWSOs, including installation and operation of the water distribution networks investigated in a field survey. The EPANET simulation was carried out to verify the service quality (water supply pressure and residual chlorine) of PWSOs and compare the survey results, and the chlorine dose required to meet the national water quality standards in Cambodia was estimated. Access to alternative water sources, connection fees, and water tariffs were analyzed in comparison with household income levels and willingness-to-pay (WTP) in order to find financial reasons for not connecting to piped water.
2. Materials and Methods
2.1. Water Supply in Cambodia
In Cambodia, urban water supplies are overseen by MISTI and its branches, whereas rural water supplies are supervised by the Ministry of Rural Development (MRD). There are two kinds of water supplies under MISTI: public water supplies and PWSOs (Table 1). As of 2022, there were 342 public and private water supply systems in Cambodia. There are 14 public water supplies; 2 in autonomous cities (Phnom Penh Water Supply Authority (PPWSA), and Siem Reap Water Supply Authority (SRWSA)); 10 in provincial capitals/city, and 2 in peri-urban or rural areas. There are 11 PWSOs in provincial capitals/city and 317 PWSOs in peri-urban or rural areas (Table 1). PWSOs serve the population in urban, peri-urban, or rural areas where public water supplies are not available. The licenses for PWSOs are valid for twenty years, and they have to get certificates of operation from the General Department of Potable Water (GDWAT), MISTI, before starting their operation, in order to verify that their water supply services meet the national requirements.
2.2. Study Areas (PWSOs)
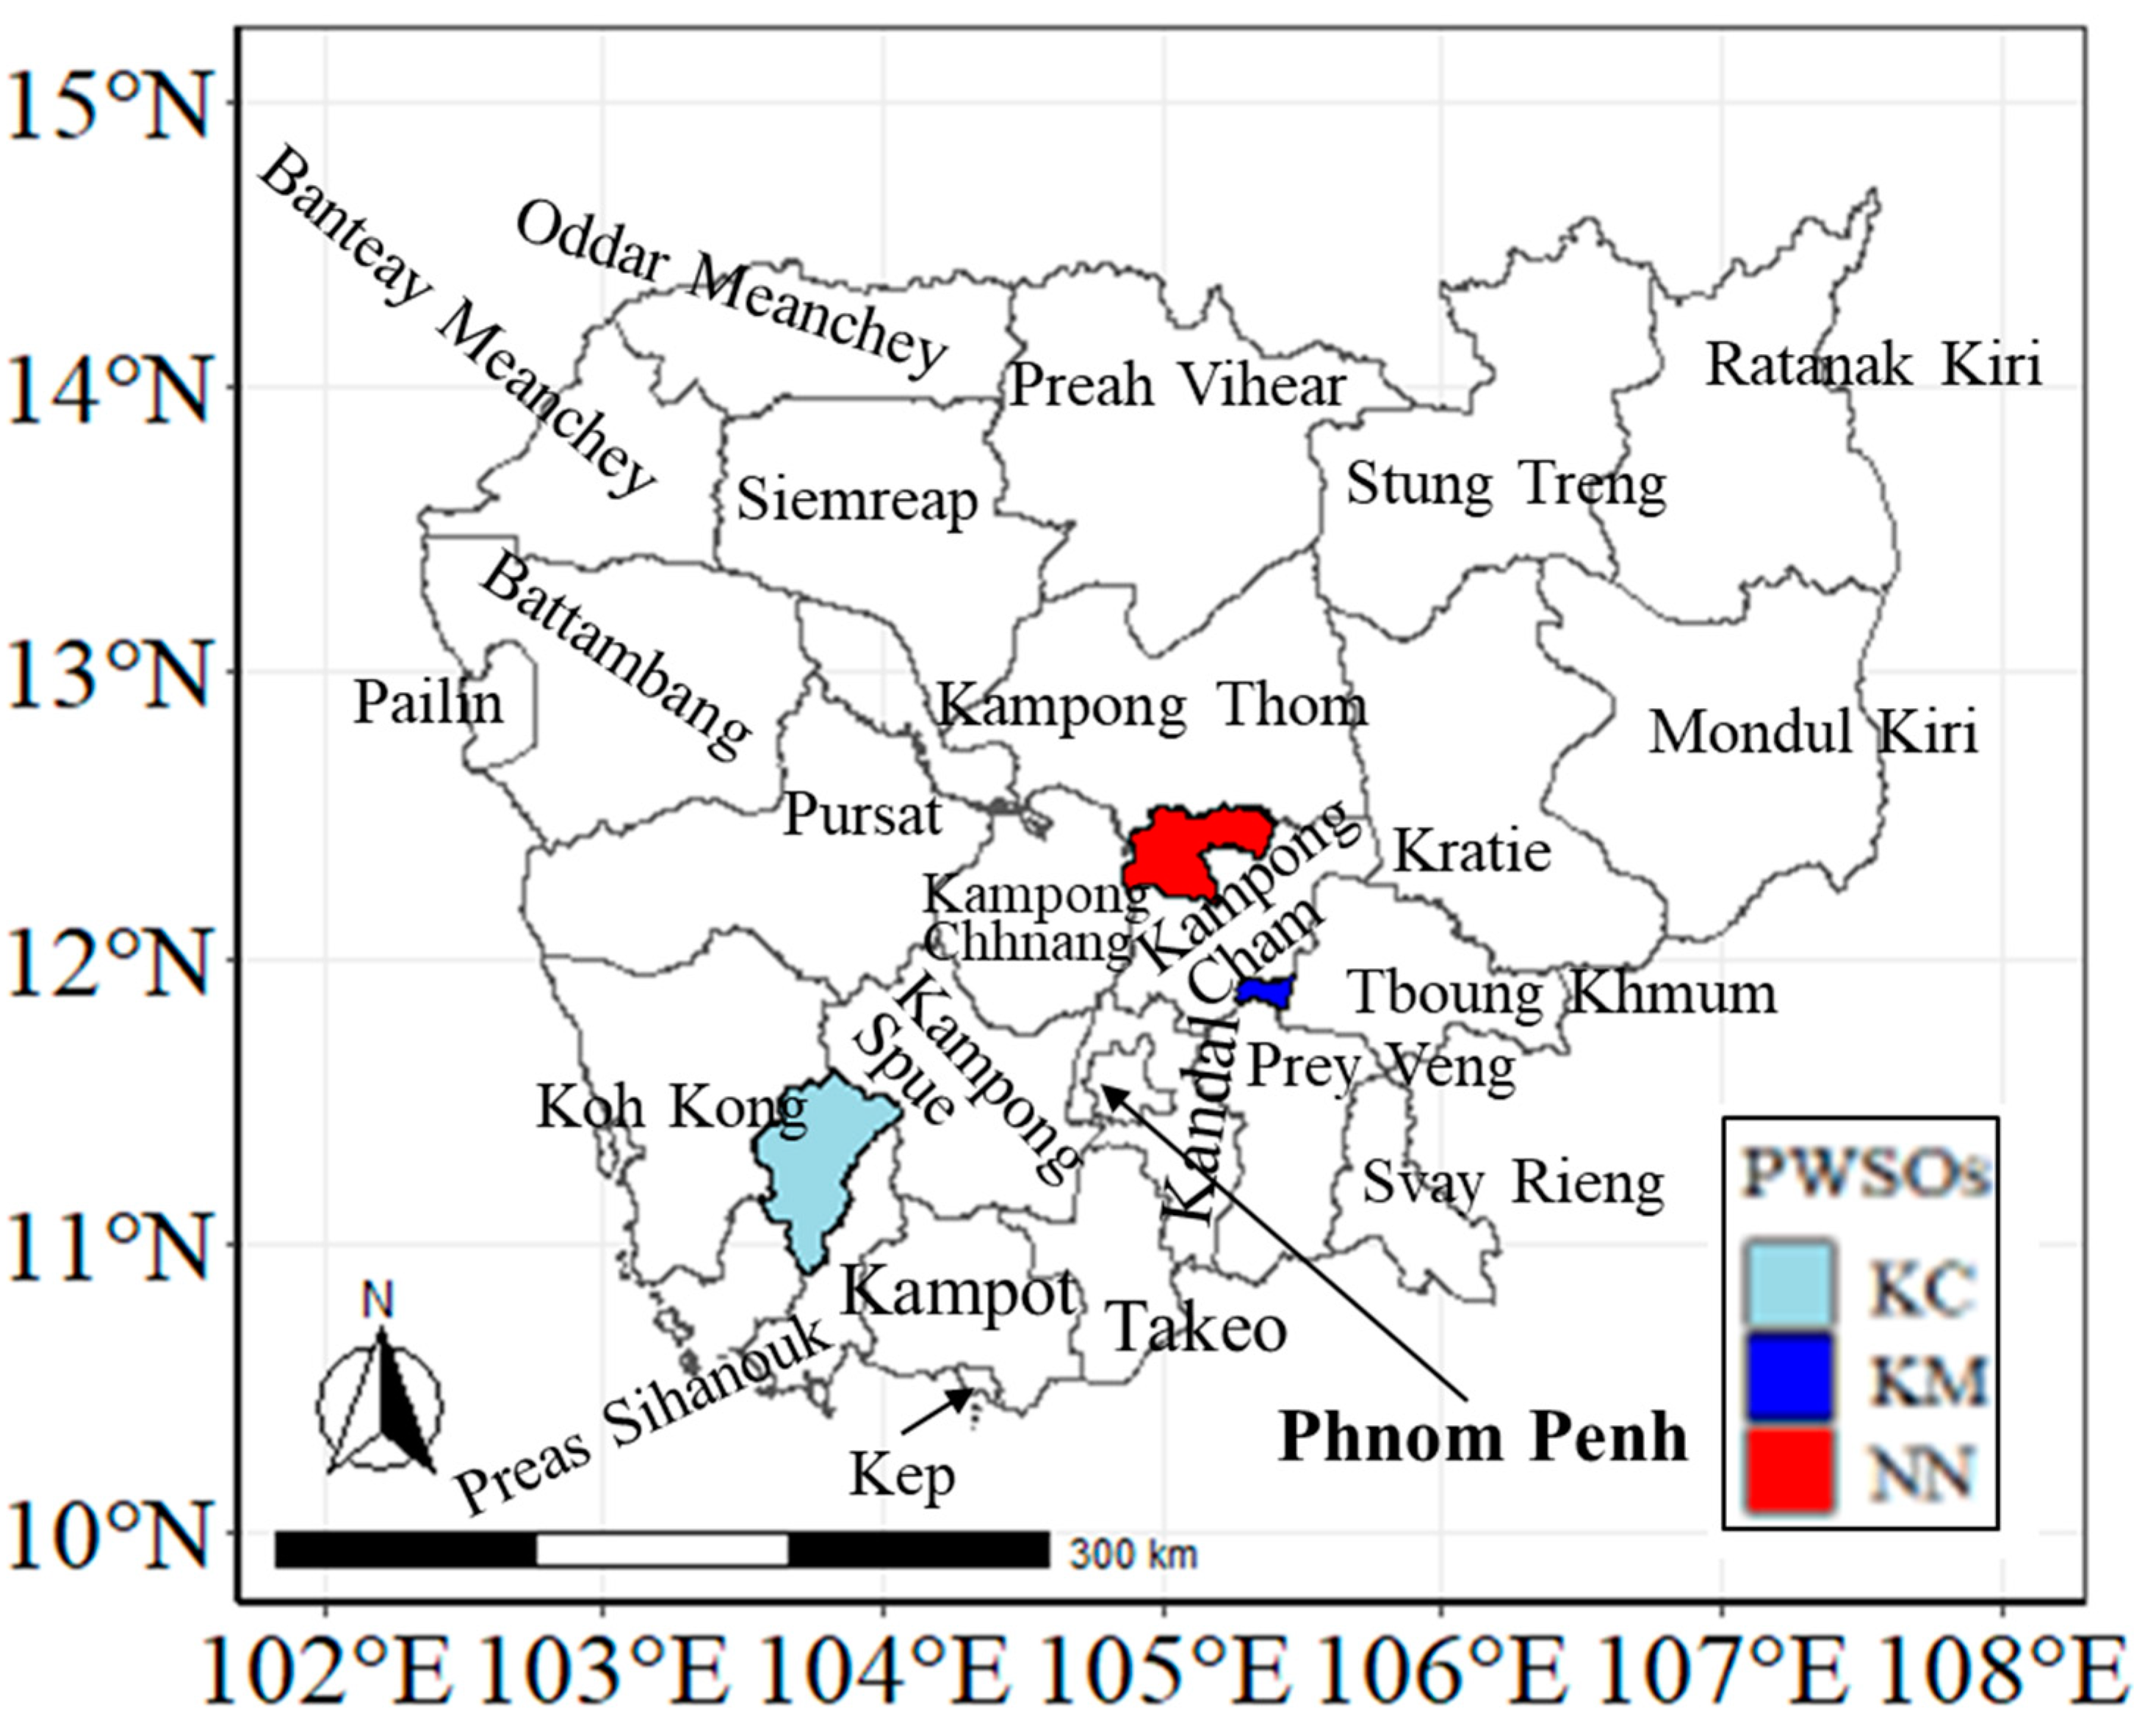
Three PWSOs were selected for this study based on differences in water supply service parameters, connection rates (service coverage), non-revenue water (NRW), location, service area, and topography (Table 2, Figure 1). These three PWSOs take surface water and supply water continually. Ket Construction Co., Ltd. (KC) and Norng Narath Water Supply (NN) supply water using pressure pumps with variable frequency drive (VFD) to control water pressure, while Khorn Menghong Water Supply (KM) supplies water by gravity flow from an elevated water tower.
2.3. Data Collection
The technical and service quality of PWSOs, namely the water quality, supply hours, supply volume, and pressure, were obtained from 31 reports of technical inspections on PWSOs carried out in 2019–2020, which were compiled prior to issuing certificates of operation. In addition, the production and business water supply reports submitted from the PWSOs to MISTI between 2016 and 2020 were used for calculating the coverage areas, connection rates, per capita piped water consumption, electricity consumption, NRW, and operation and maintenance expenditure.
The connection fees and water tariffs of the PWSOs were provided by MISTI. The water tariff committee of MISTI regulates the connection fees and water tariffs below 60 USD/connection (240,000 Cambodian Riel (KHR)/connection) and 0.57 USD/m3 (2300 KHR/m3) for PWSOs. Similar to the public water supply, block water tariffs based on monthly water consumption are applied to the customers of water supplied by PWSOs. In general, there are three blocks: 0–3 m3, 4–10 m3, and over 10 m3, with water tariffs at 0.45 USD/m3 (1800 KHR/m3), 0.50 USD/m3 (2000 KHR/m3), and 0.57 USD/m3 (2300 KHR/m3), respectively. However, the three PWSOs in this study do not have a block water tariff; they apply a flat rate water tariff at 0.50 USD/m3 (2000 KHR/m3), irrespective of the amount of water consumption.
2.4. Field Survey
A field survey was conducted in the service areas of two PWSOs, KM and NN, in August–September 2021, by the authors with the staff of MISTI. The field survey was not conducted in KC due to the restrictions caused by COVID-19. A total of 109 connected and non-connected homes (75 connected and 34 non-connected homes) in KM and NN were randomly selected for the questionnaire survey, which included general information, water sources and water consumption, drinking water, expenditure for connection, monthly income, water tariff, and electricity cost. In addition, the service quality of the PWSOs was evaluated by the customers. The purpose of the questionnaire was explained to the respondents prior to the survey following the Research Ethics Guidelines of the University of Tokyo, and only those who agreed returned their responses to the survey. The questionnaire responses were obtained anonymously by withholding the names of the respondents and processed by response identification numbers for the data analyses to protect the privacy of the respondents.
A questionnaire survey for PWSO owners was also conducted to evaluate the current practice of distribution network installation, domestic water meter installation, and operation and maintenance (O&M) of the water supply systems, and to identify factors influencing the connection rates. The history of the piped water supply, challenges, future plans, and the owners’ view on their water supply businesses were also reported.
2.5. Distribution Networks and Domestic Water Meter Observation
A survey on distribution networks and domestic water meters was conducted during the field survey. The distribution networks were inspected to find the pipe materials, the current practice of pipe installation, pressure testing of the pipes after installation, protection of pipes, and problems such as leakages and service pipe repairs. A total of 75 domestic water meters installed in the aforementioned randomly selected homes were inspected to find the frequency of water meter cleaning, movement of water meters above ground, replacement of water meters, protection of water meters, and the dates of water meter installation. The installation conditions of the distribution networks and domestic water meters were inspected to determine whether they met the technical minimum requirements for small-scale water supply systems in Cambodia by MISTI in 2019 (Figure A1 in Appendix A).
Turbidity, residual free chlorine, and water supply pressure were measured at the taps of 38 and 37 homes in KM and NN, respectively, and in the distribution networks using HACH 2100Q, (HACH Company, Loveland, CO USA), a DM 600 photometer (Lovibond®, Tintometer GmbH, Dortmund, Germany), and Data Logger System Model DLS-H21 (FUJI TECOM, Tokyo, Japan), respectively. The water quality and water supply pressure were measured to compare them with national water quality standards [25] (Table 3) and the minimum technical requirements for small-scale water supply systems in Cambodia from MISTI, 2019 [2]. Then, the performance of the PWSOs was evaluated based on their service quality, water quality, cost of O&M, and electricity consumption.
2.6. Income Quintiles
The household income was estimated using the questionnaire survey; then, the households were grouped into quintiles based on their income levels in a similar way to the income classification of the Ministry of Planning (MoP), Cambodia, namely: lowest-, low-, middle-, high-, and highest-income quintiles [13].
2.7. Estimation of Per Capita Piped Water Consumption
Water consumption in the previous month was obtained from the water bills. The average per capita piped water consumption per day (liters-per-capita-per-day, LPCD) was calculated using Equation (1), assuming only one household per connection.
where : per capita water consumption per day (LPCD); : billed piped water consumption for one month (m3/month); : number of days in the month (days/month); : number of family members per household (persons/household).
2.8. Monthly Expenditure for Piped and Bottled Water and Connection Expenditure
The household expenditures for piped and bottled water were estimated using the bills of the preceding month. The connection cost to the piped water supply was estimated to include all costs incurred, such as connection fees, purchasing cost of pipes, water meters, and other equipment. Thus, the cost of connecting to piped water depends on the diameter and the length of the service pipes, and the type of water meter. Then, the percentages of connection costs to the average monthly income were calculated for each household and compared across the income quintiles.
2.9. Multiple Linear Regression Model for Piped Water Consumption
Monthly piped water consumption was analyzed using the multiple linear regression (MLR) model shown in Equation (2).
where : monthly piped water consumption per connection (m3/connection); constant term; coefficient for age of household head (AHH); coefficient for number of household members (NHM); coefficient for household monthly income (HMI); age of household head (years); number of household members (persons); household monthly income (USD/month); residual.
2.10. EPANET 2.2 Simulation
The input parameters for EPANET 2.2 simulation were obtained and estimated by the following methods. The pipe diameter and length were obtained from the distribution network maps. The water demand at each node was estimated from the service population in each area covered by a node and the per capita piped water consumption (LPCD) obtained from the field survey (Table A1) [27]. The population in each service area was estimated by the number of households counted by Google Earth Pro, multiplied by persons per household, i.e., 4.7 persons/household, based on the provincial population density in 2019, assuming that each household has one connection. Then, the water demand of each node was calculated by population multiplied by the per-capita water consumption.
The roughness coefficient C was set at 100 for all pipes made of high-density polyethylene (HDPE). EPANET 2.2 requires two chlorine decay rate coefficients: the bulk decay rate coefficient () and the wall decay rate coefficient () [28], which are influenced by water temperature and the pipe material, age, roughness, inner coating material, and biofilm formation [29,30]. In this study, they were set at and , following a previous study in Yangon City [30]. The simulation was run at a steady state using the daily average water demand.
3. Results
3.1. Performance of PWSOs
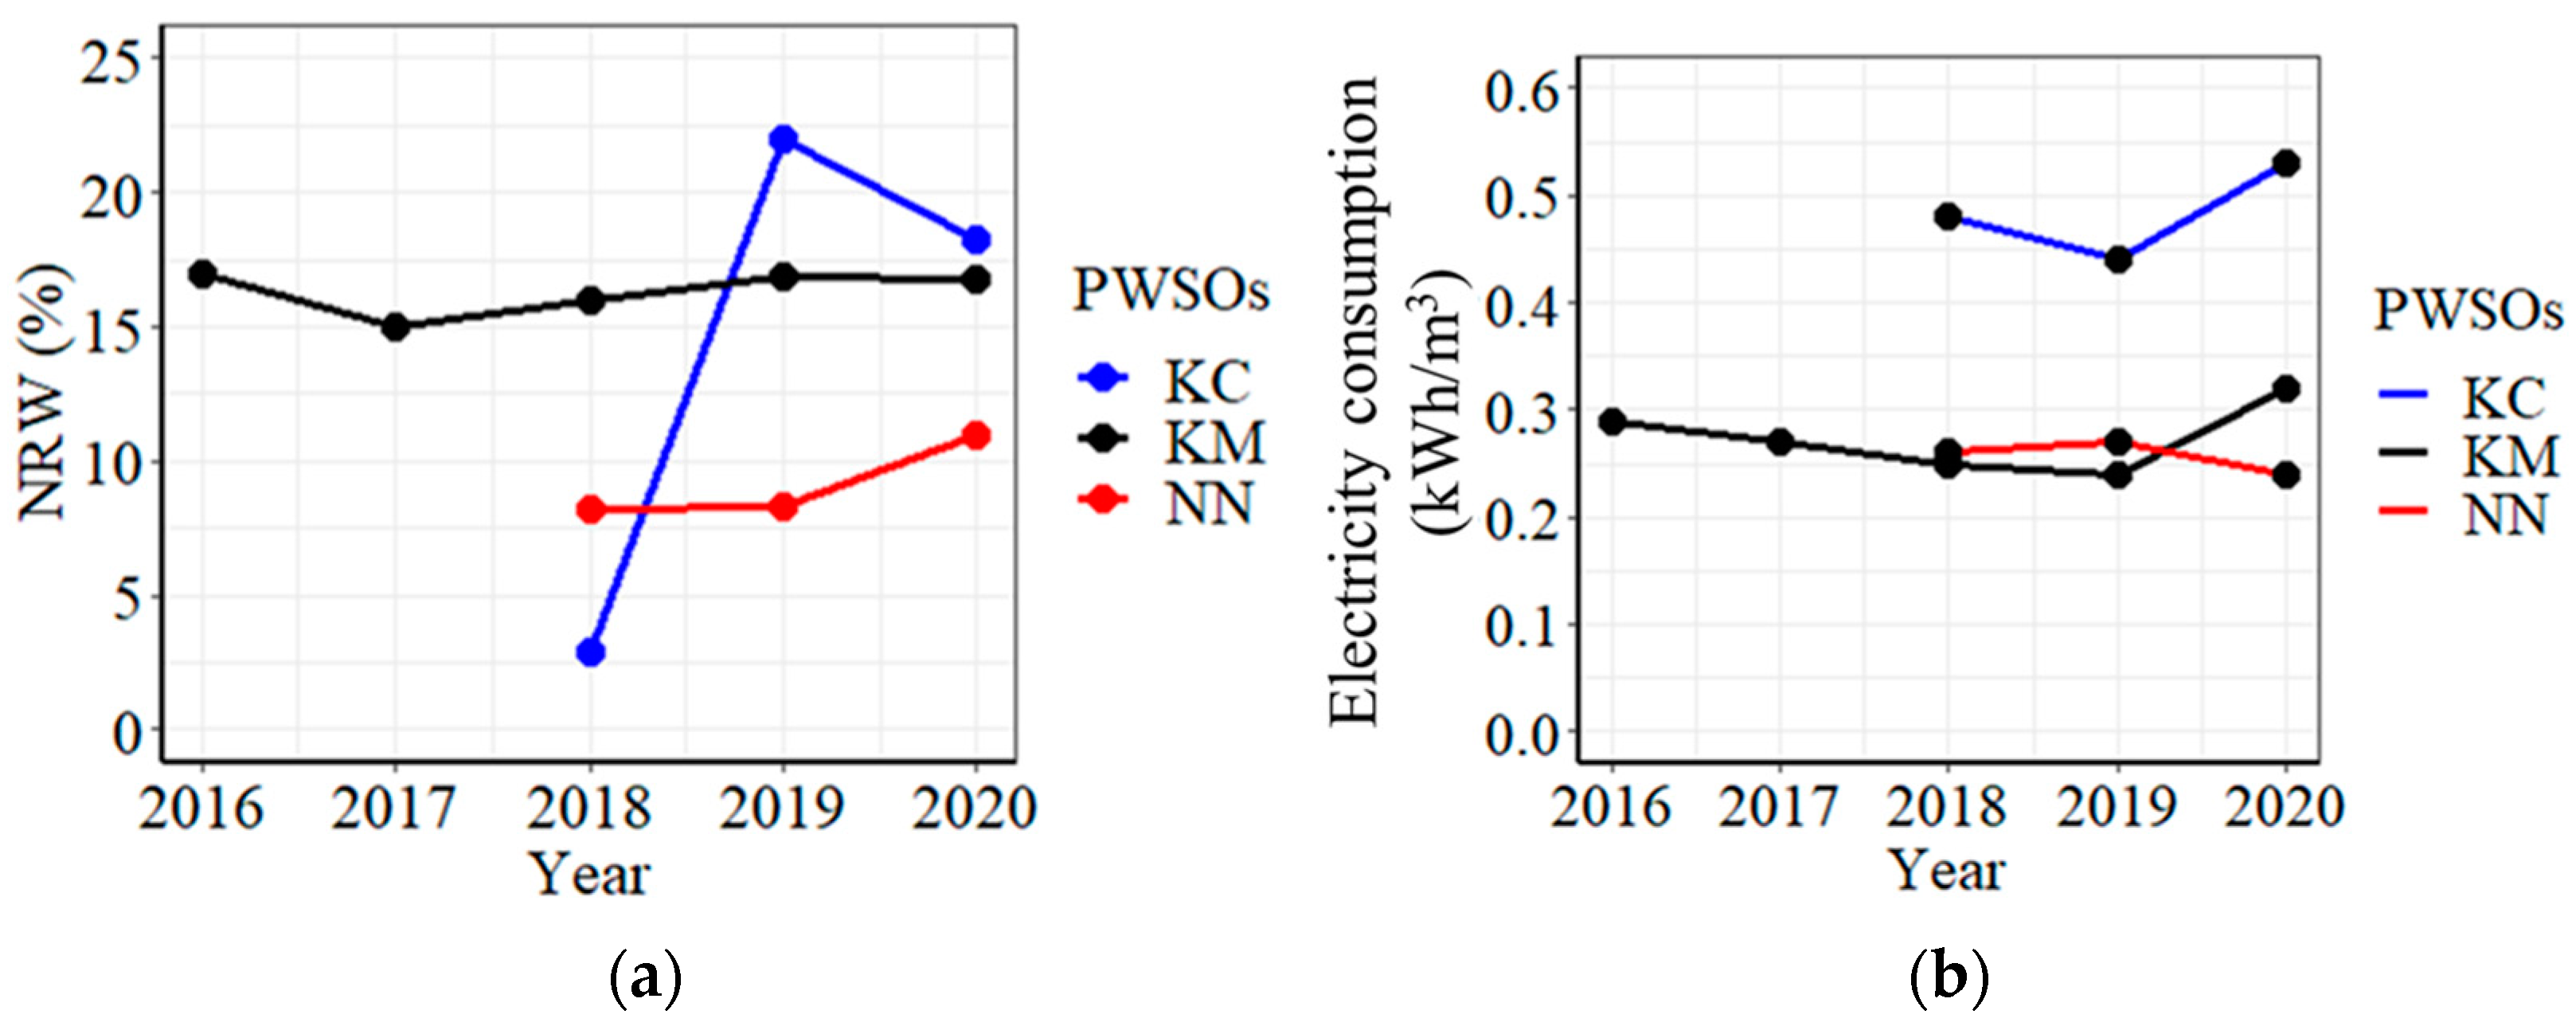
A high variation in water supply service levels was observed among the three PWSOs. The connection rate in 2020 was 77.8% for KM, followed by NN at 53.9% and KC at 10.6% (Table 2). The lowest connection rate for KC was due to the presence of many homes far away from the existing water supply networks. In contrast to the connection rates, the water production per capita was the highest for KC at 184.6 LPCD, followed by NN (117.3 LPCD) and KM (68.8 LPCD), which reflected the significant difference in the average per-capita water consumption: KC (150.8 LPCD), NN (104.5 LPCD), and KM (57.6 LPCD). The highest per-capita water consumption in KC was due to the lack of alternative water sources. In contrast, the per-capita piped water consumption was lower in NN than in KC due to easy access to well water; 62.3% of the respondents used well water because of easy access and good water quality. In KM, 83.3% of the respondents used rainwater, but only 20.8% used well water due to arsenic in the groundwater (Table 4). The NRW rates were the highest in KC (18.3%), followed by KM (16.7%) and NN (10.9%) (Table 2, Figure A2a). KC has the highest NRW rate because of high supply pressure at approximately 0.6 MPa, road construction, the long distance to the service areas from the distribution stations, improper pumps, and problems in distribution pipe installation, such as shallow depth and poor materials, as well as a high variation of elevations in the service area (Figure A3).
The electricity cost for small-scale industries, business, and administration in 2020 was 0.18 USD/kWh. The unit electricity consumption and costs for supplied water in KC, KM, and NN were 0.53 kWh/m3 and 0.09 USD/m3 (360 KHR/m3), 0.32 kWh/m3 and 0.05 USD/m3 (200 KHR/m3), and 0.24 kWh/m3 and 0.04 USD/m3 (160 KHR/m3), respectively, in 2020. The electricity consumption in KC was high because of failures in the design and installation of the water purification plant based on the raw water quality (Figure A2b, Figure A3b). In addition, operation and maintenance of pumps was difficult due to unstable voltage, high water supply pressure (0.6 MPa), and many leakages, which resulted in high electricity consumption.
The water production costs consist of personnel, electricity, fuel, chemicals, maintenance, depreciation, and administration costs (Table 5). Among these cost items, the personnel and electricity costs differed significantly among the PWSOs due to the number of staff employed, the topography and the scale of the service areas, as well as the distribution systems of either gravity flow or pumping. Chemical costs depended on raw water quality, and the maintenance cost depended on the condition of the pipe networks and water treatment plants. The depreciation cost was included only in NN, and thus, KC and KM might have a financial problem in the future replacement of the water supply system. The operating ratio, which is defined as the ratio of operating expenditure to revenue, was 46.8% for KC, 24.8% for KM, and 21.8% for NN (Table 5). It was found that the electricity cost is a determinant factor for the operating cost. Their incomes came only from the connection fee and bills for water consumption.
3.2. Maintenance of Water Distribution Networks
Table 6 shows the maintenance records of water distribution networks in 2020. These three PWSOs maintained the water distribution networks by cleaning water meters, relocating water meters, changing water meters, fixing distribution pipe leakages, and repairing service pipes. Most water meters are difficult to read and prone to water infiltration because they are not installed in meter boxes. Thus, the PWSOs have to clean the water meters regularly and/or relocate water meters to higher positions to avoid infiltration of water due to heavy rain and flooding.
The number of leakages was the highest in KC due to use of low-grade pipes supplied with high pressure, i.e., 0.6 MPa, which results in an increase in NRW (Table 2, Figure A2a). The larger altitude range of 27 m in the KC service area, and the long distance to the service areas from distribution station, make it difficult to control water pressure in KC, although VFD is used to control the water supply pressure.
At KM, the number of leakages is higher than NN because of road construction, shallow depth of pipe installation, and a lack of plastic warning tape above the pipes. Because the service area of KM is located along the Mekong River, soil in homes is lost by periodical erosion caused by heavy rain and flooding. Thus, soil must be added to recover the ground in homes, which buries water meters placed below the ground level. Thus, the KM PWSO has to relocate water meters more frequently than other PWSOs.
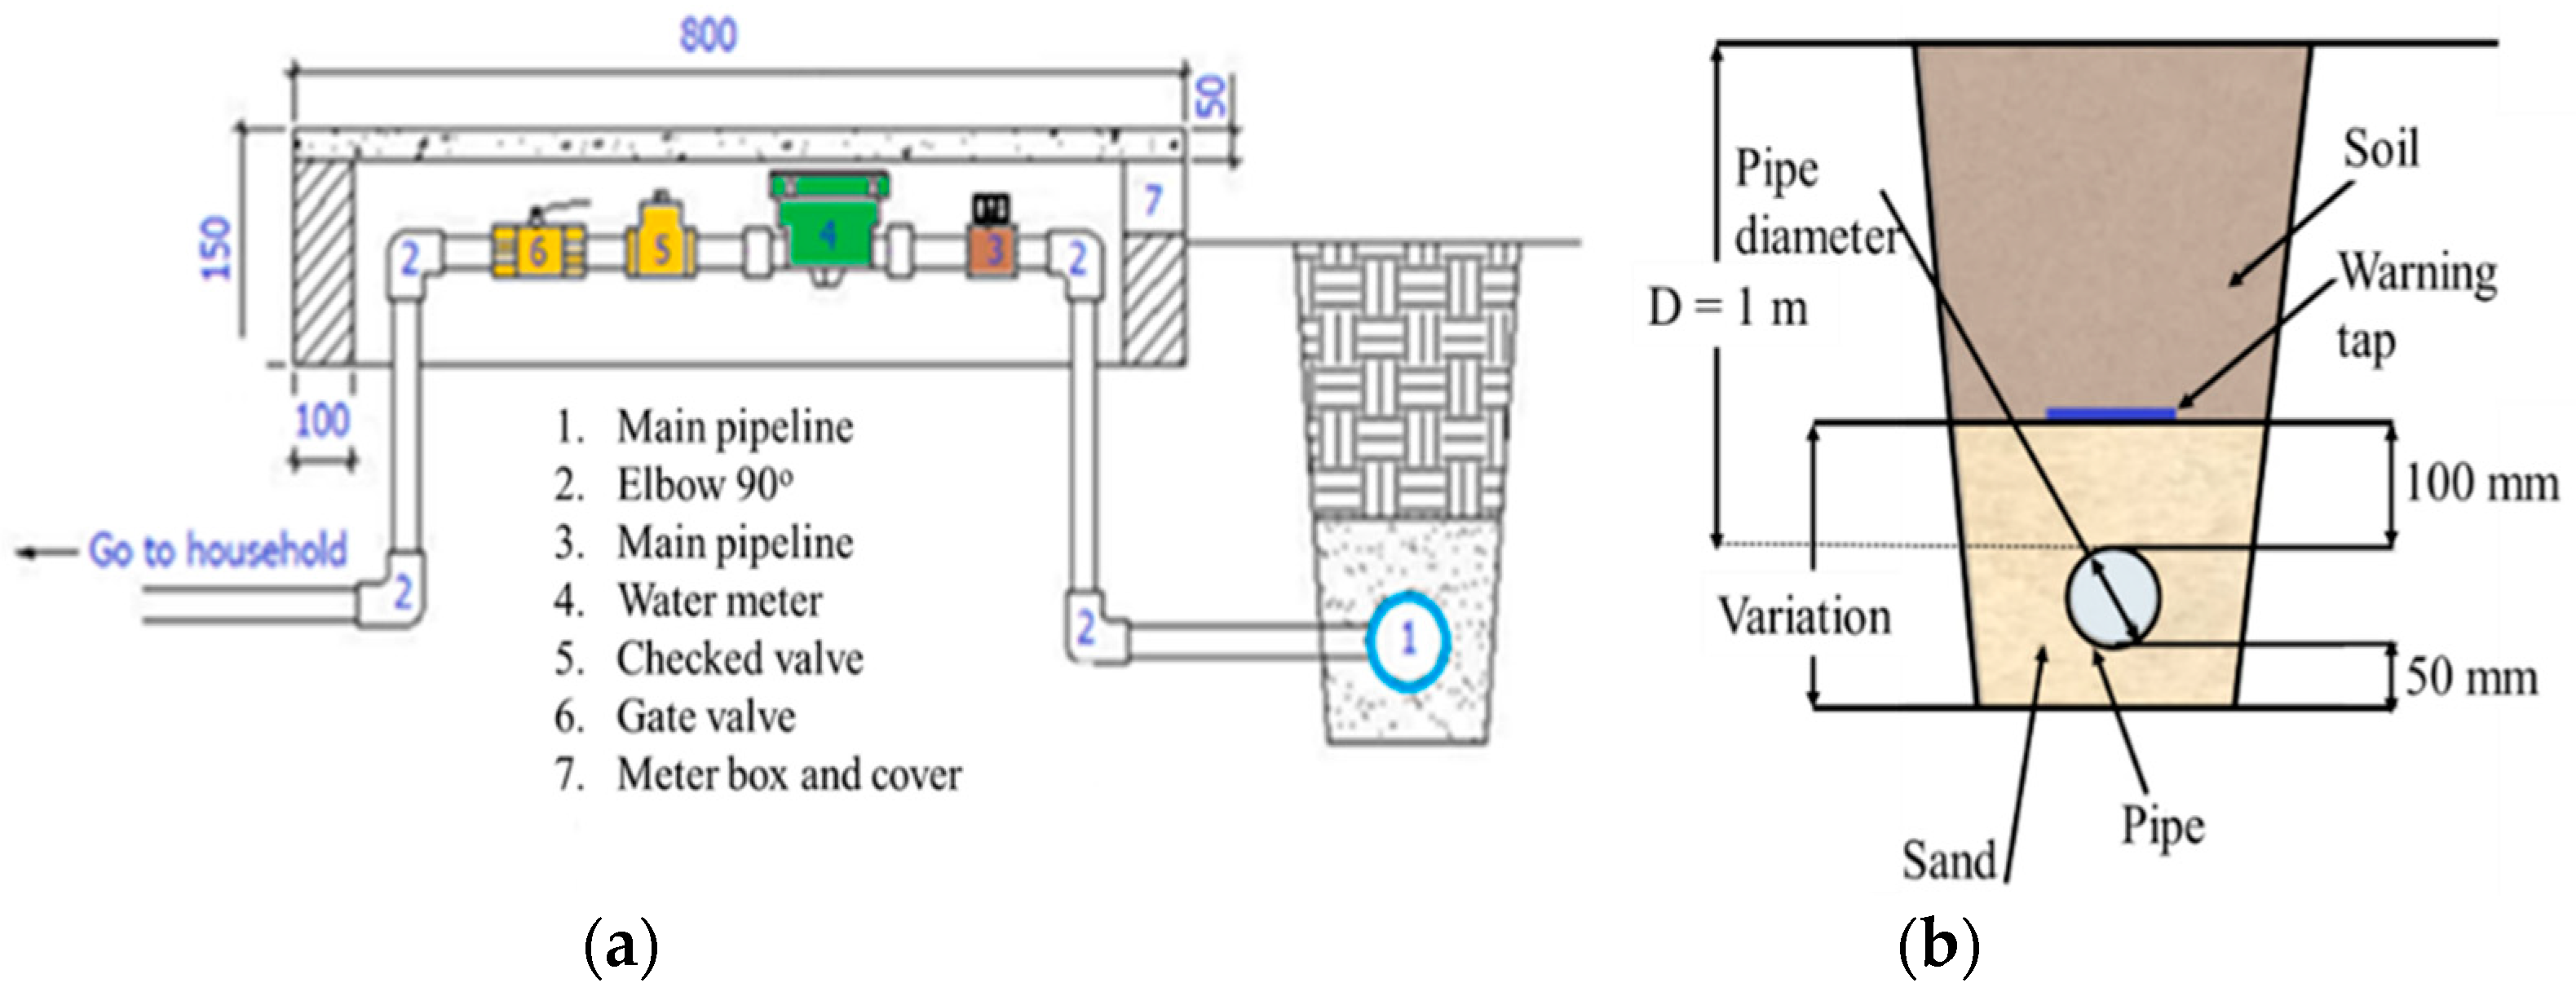
NN has operated for a long time, since 2003, so their distribution pipes, service pipes, and water meters are old. However, the NRW is the lowest among the three PWSOs (Table 2, Figure A2a) because of the high frequencies of cleaning and changing water meters and service pipe repairs, and thus the number of leakages and repair works of distribution were the lowest. NN used pipes with diameters to meet the water demand, while the other PWSOs failed to install pipes with large-enough diameters to meet the total water demand, including the future demand of non-connected homes. The pump capacity, i.e., head and flow capacity, was sufficient, and pumps were installed in accordance with the guidelines and operated with VFD to control the water supply pressure. However, the pipe depth was found to be shallower at 0.30–0.50 m than the guideline depth of 1 m for the water mains required by MISTI. They also did not test the leakage in accordance with the guidelines after connecting the pipes by a fusion welded machine.
3.3. Water Supply Pressure, Turbidity, and Residual Free Chlorine
The field survey revealed that the turbidity measured at the taps of the 38 homes in KM was 0.34–7.00 Nephelometric Turbidity Units (NTU). One was above the national water quality standard of 5 NTU [25], and thus this tap water is rarely used. The residual free chlorine was <0.02–0.37 mg/L, and 26 out of 38 taps were below the national water quality standard of 0.1 mg/L [25]. The water pressure of 38 tested taps was between 0.10 and 0.22 MPa, well above the MISTI guideline of 0.05 MPa [26].
The turbidity of 37 taps in NN was 0.67–3.09 NTU, all of which were below the national water quality standard [25]. In addition, the water supply pressure of the 37 taps was between 0.15 and 0.23 MPa, which met the MISTI guideline of 0.05 MPa [26]. These results suggested that poor water quality, i.e., turbidity, and low water pressure, may not be the reasons for not connecting to the piped water supply.
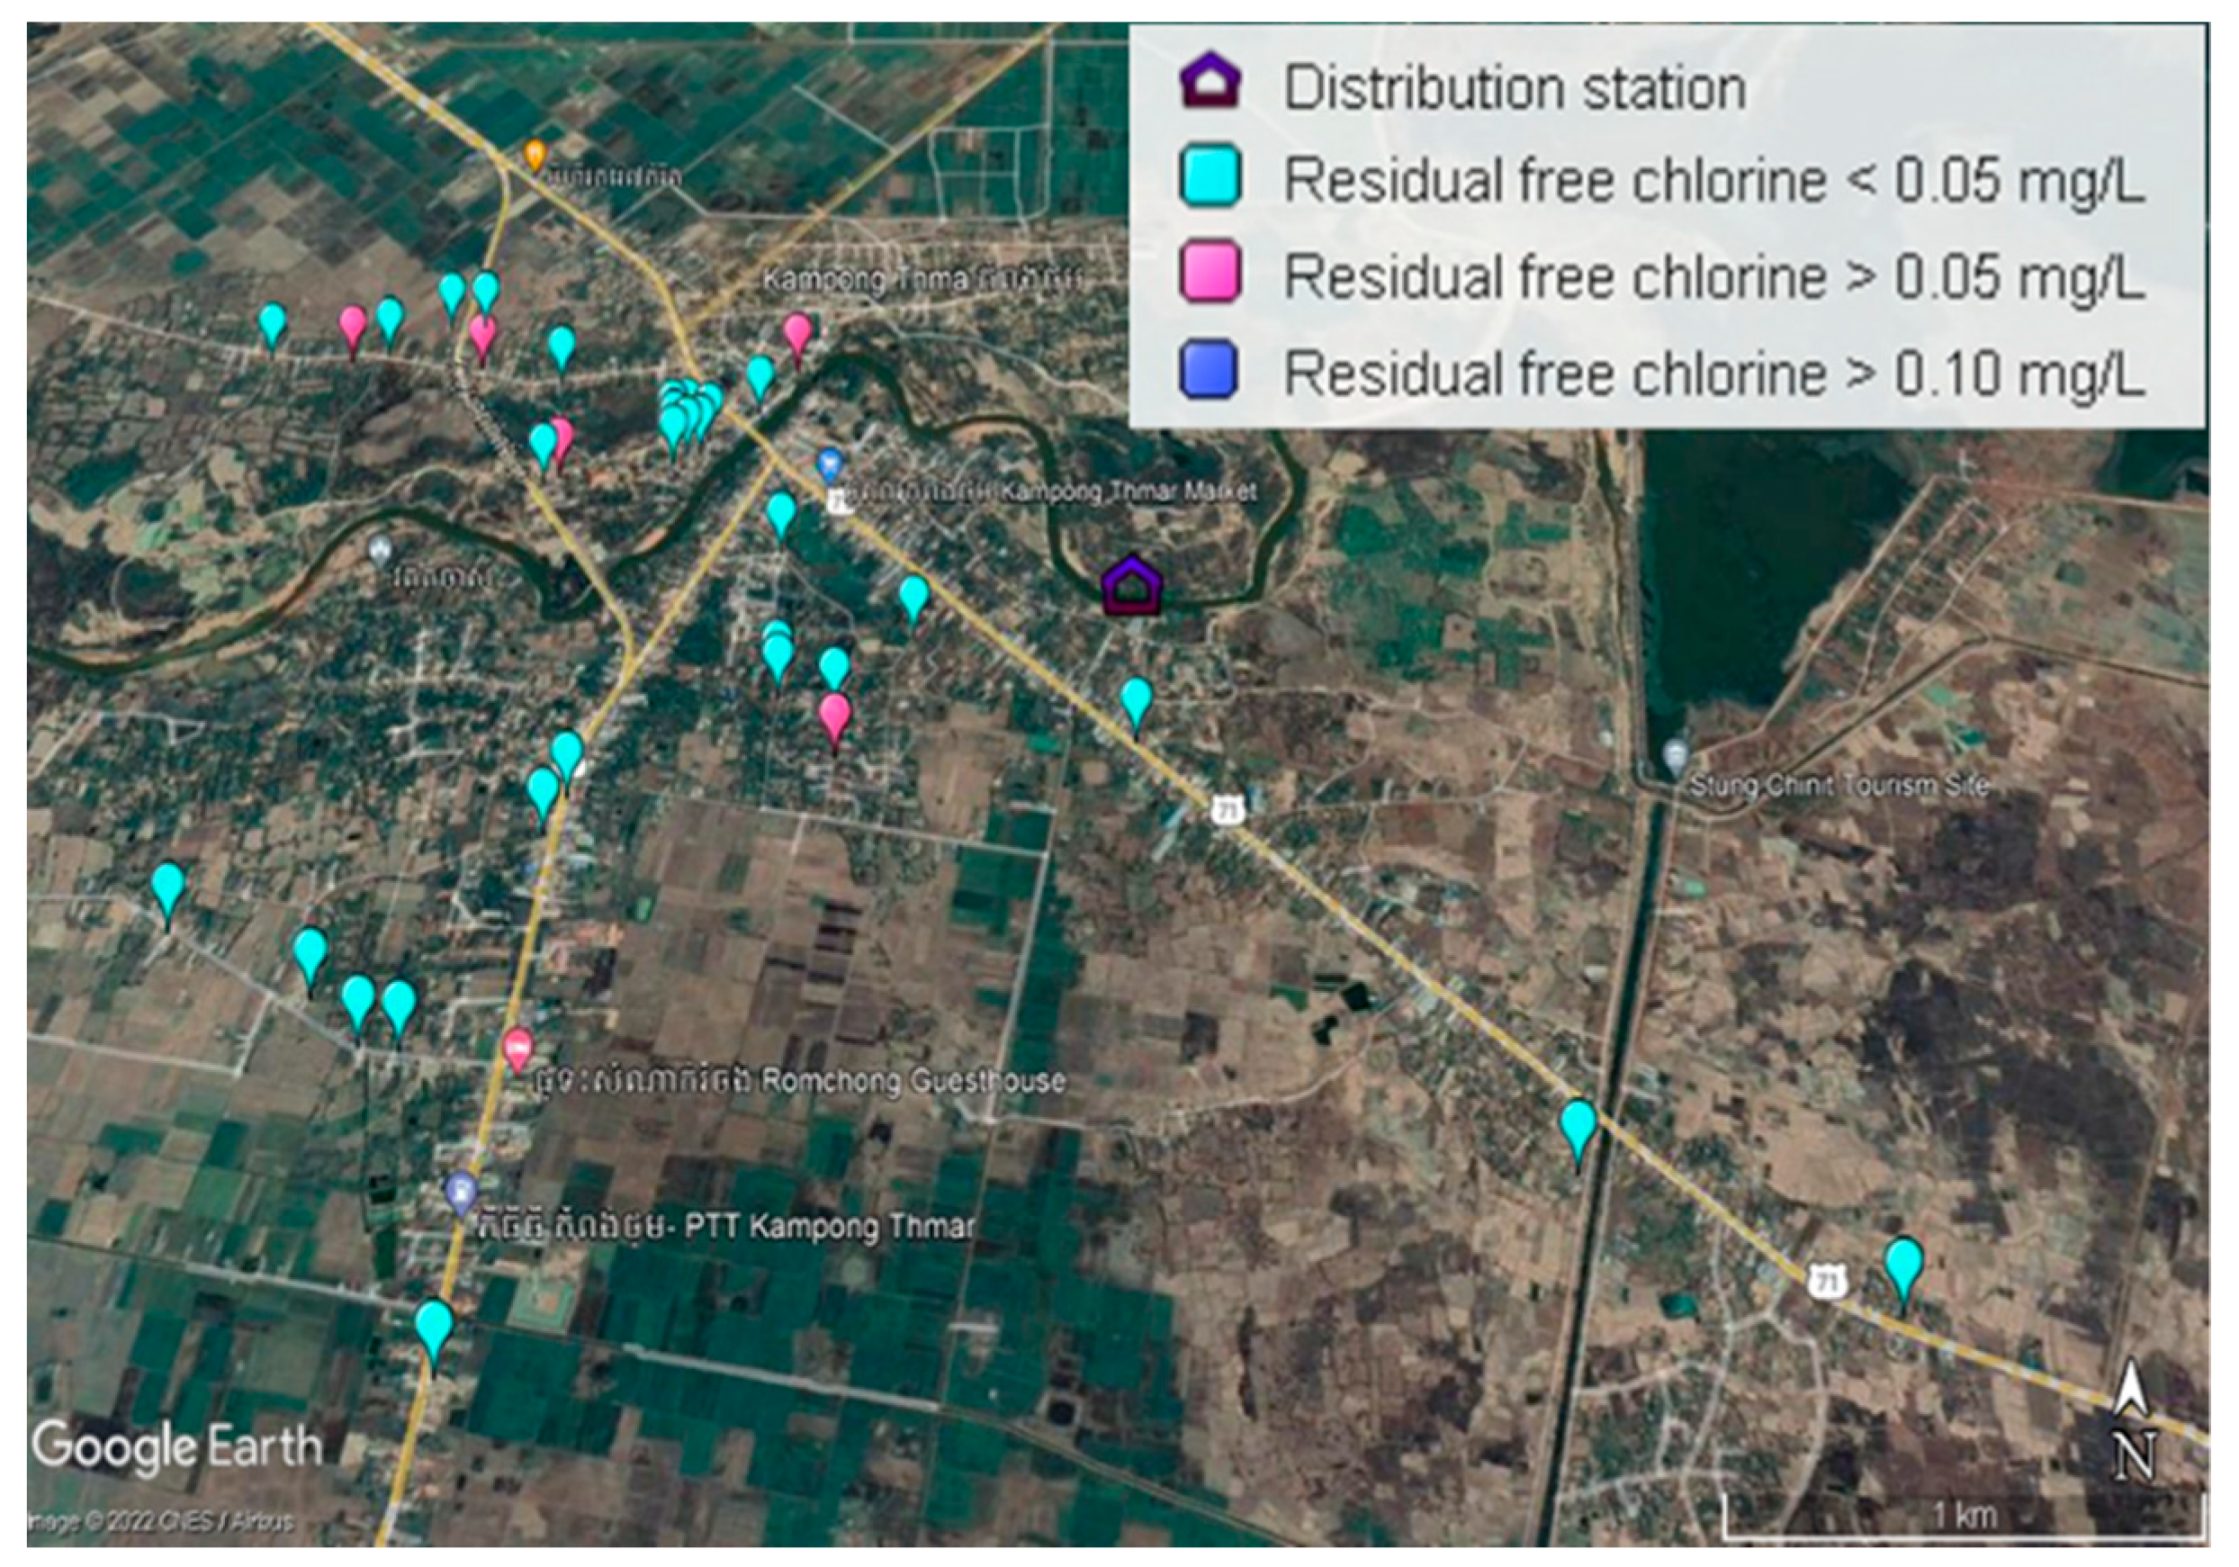
3.4. Residual Free Chlorine Simulation in NN by EPANET 2.2
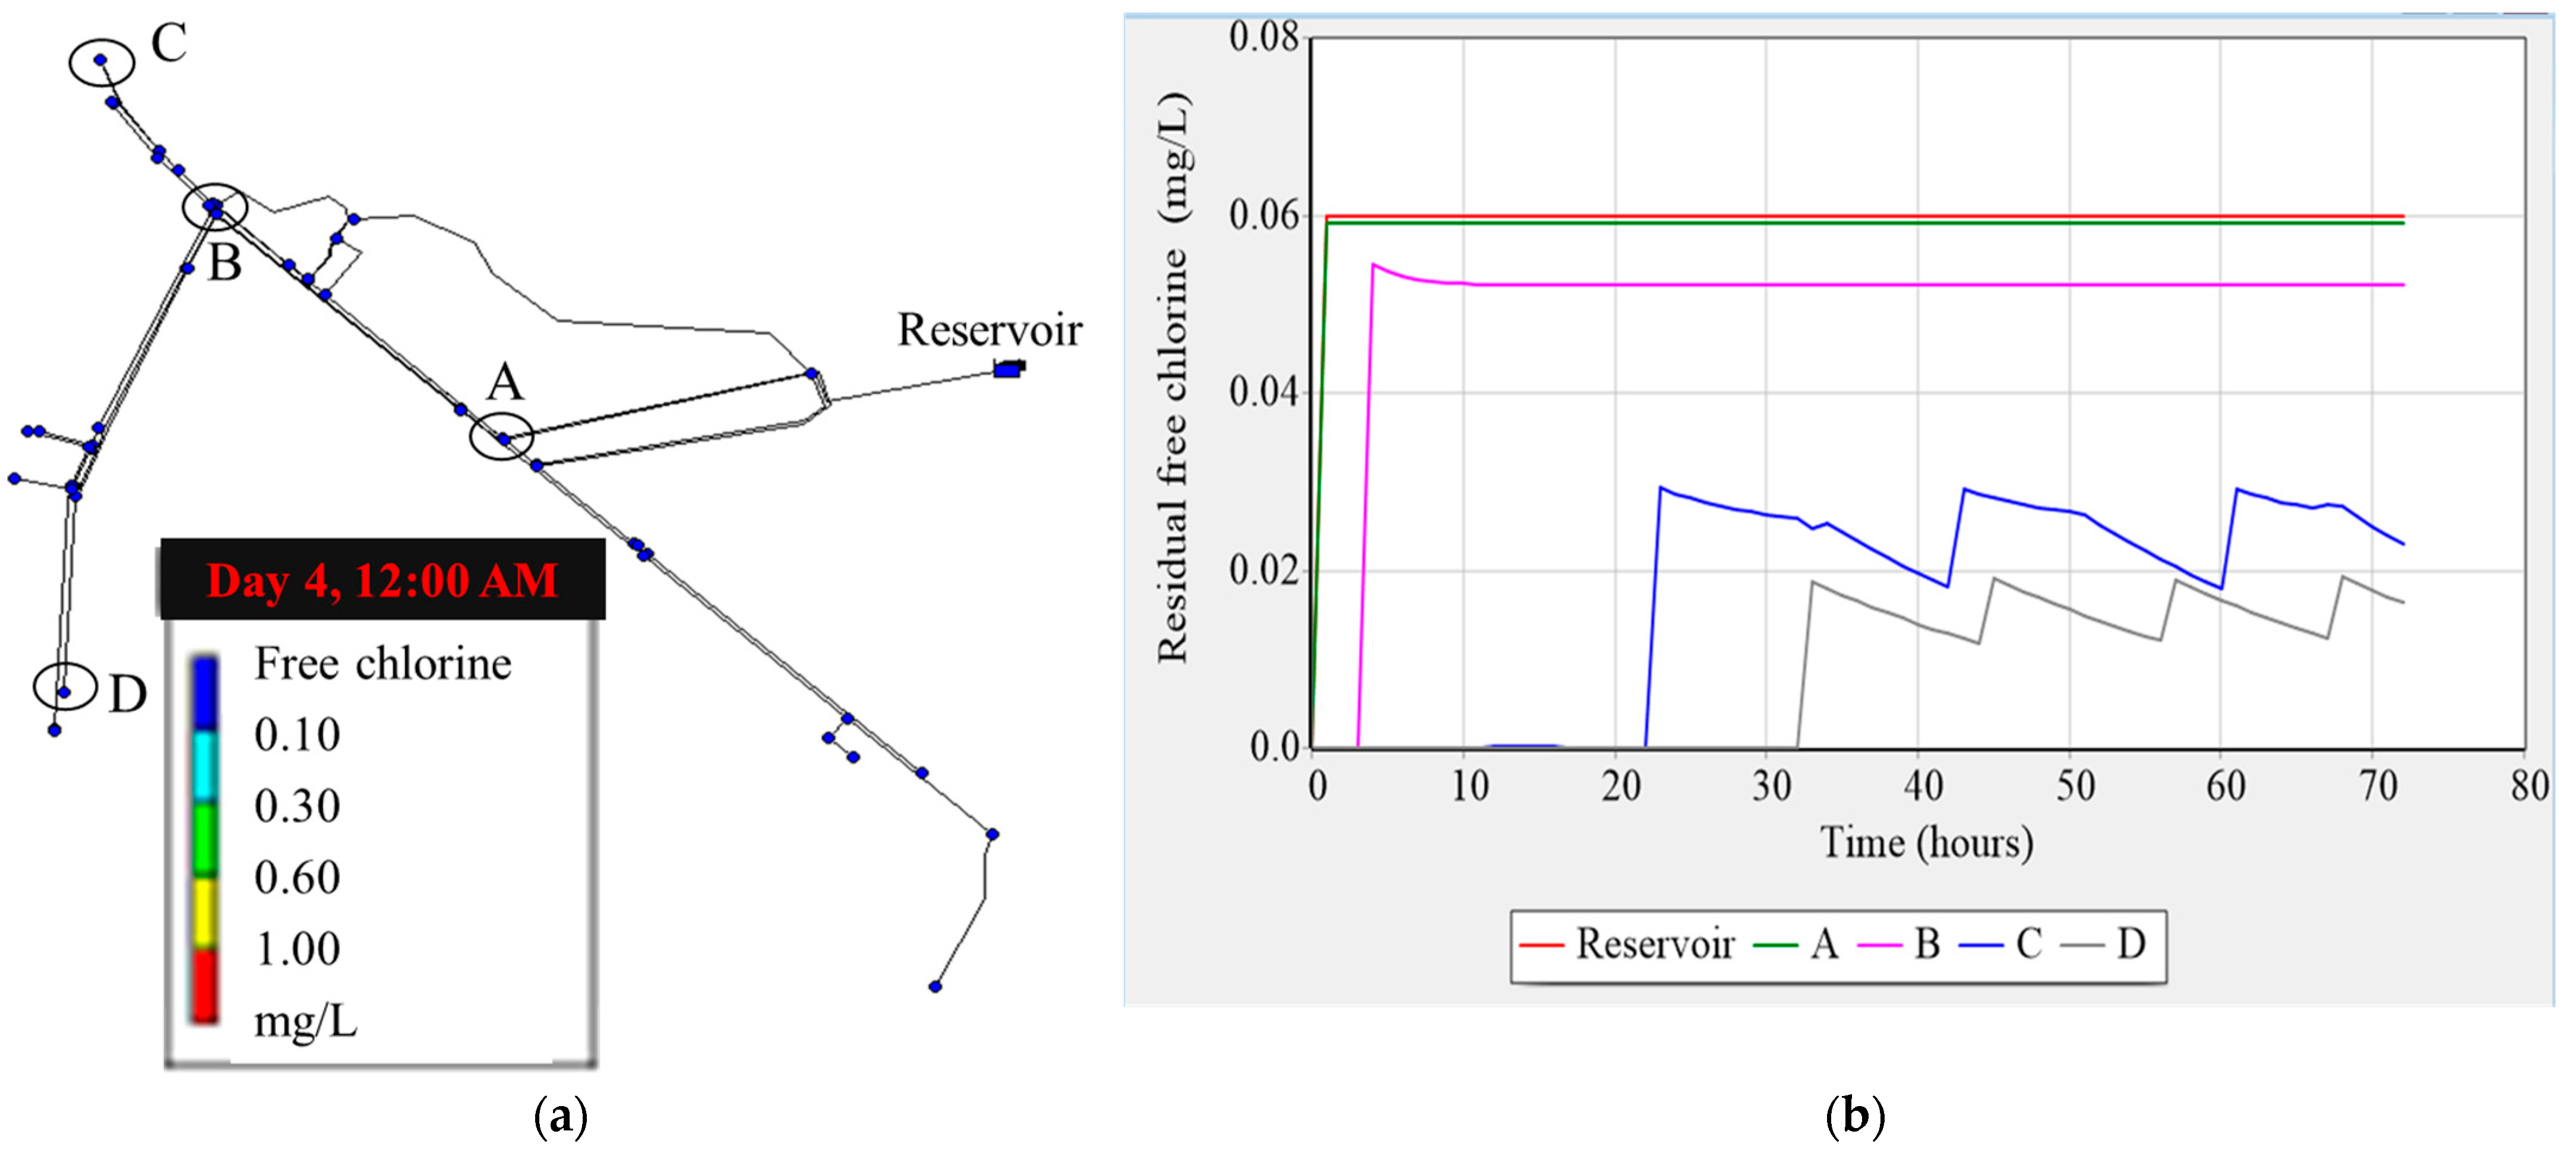
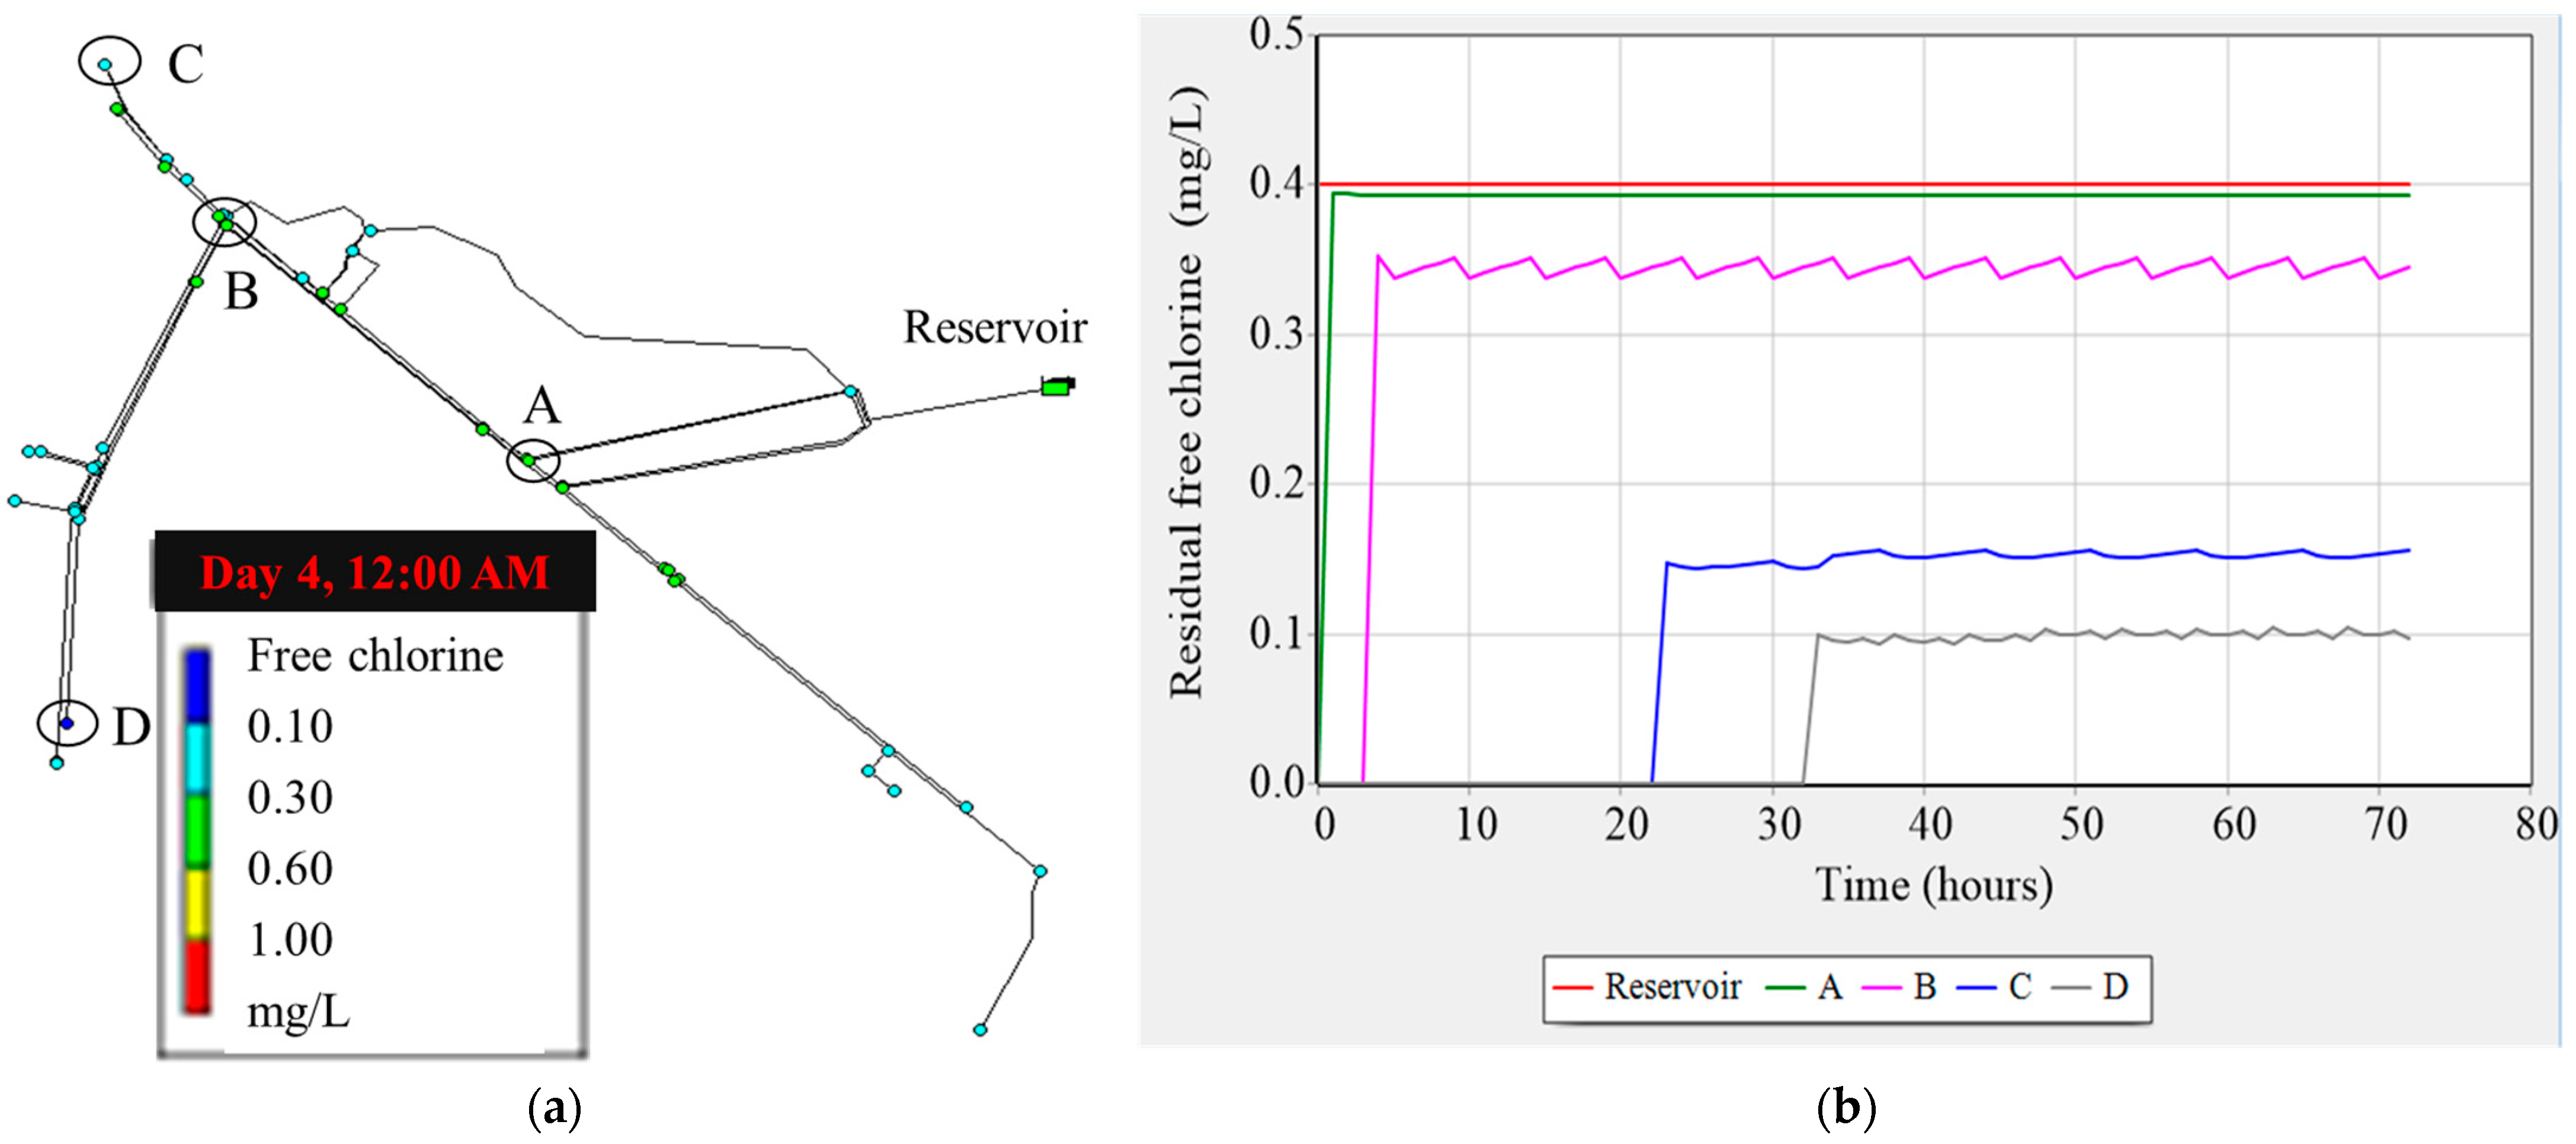
The field monitoring revealed that the residual free chlorine in the network of NN was <0.02–0.07 mg/L (Figure 2), which is lower than the national water quality standard of 0.1 mg/L [27]. Figure 3 shows the free chlorine concentration simulated by EPANET at 0.06 mg/L of chlorine dosage. The hydraulic residence time from A to the D was more than 30 h and the residual free chlorine concentration was 0.02–0.05 mg/L in most of the junctions, which is in agreement with the field monitoring results. Because the residual free chlorine concentration in the network was maintained at a low level to avoid customer complaints due to a chlorine smell, high residual free chlorine is not a reason for not connecting to the service networks of NN. However, to maintain the residual free chlorine in the network at a higher level than 0.1 mg/L, the chlorine dosage should be increased to 0.4 mg/L (Figure 4).
3.5. Piped Water Consumption
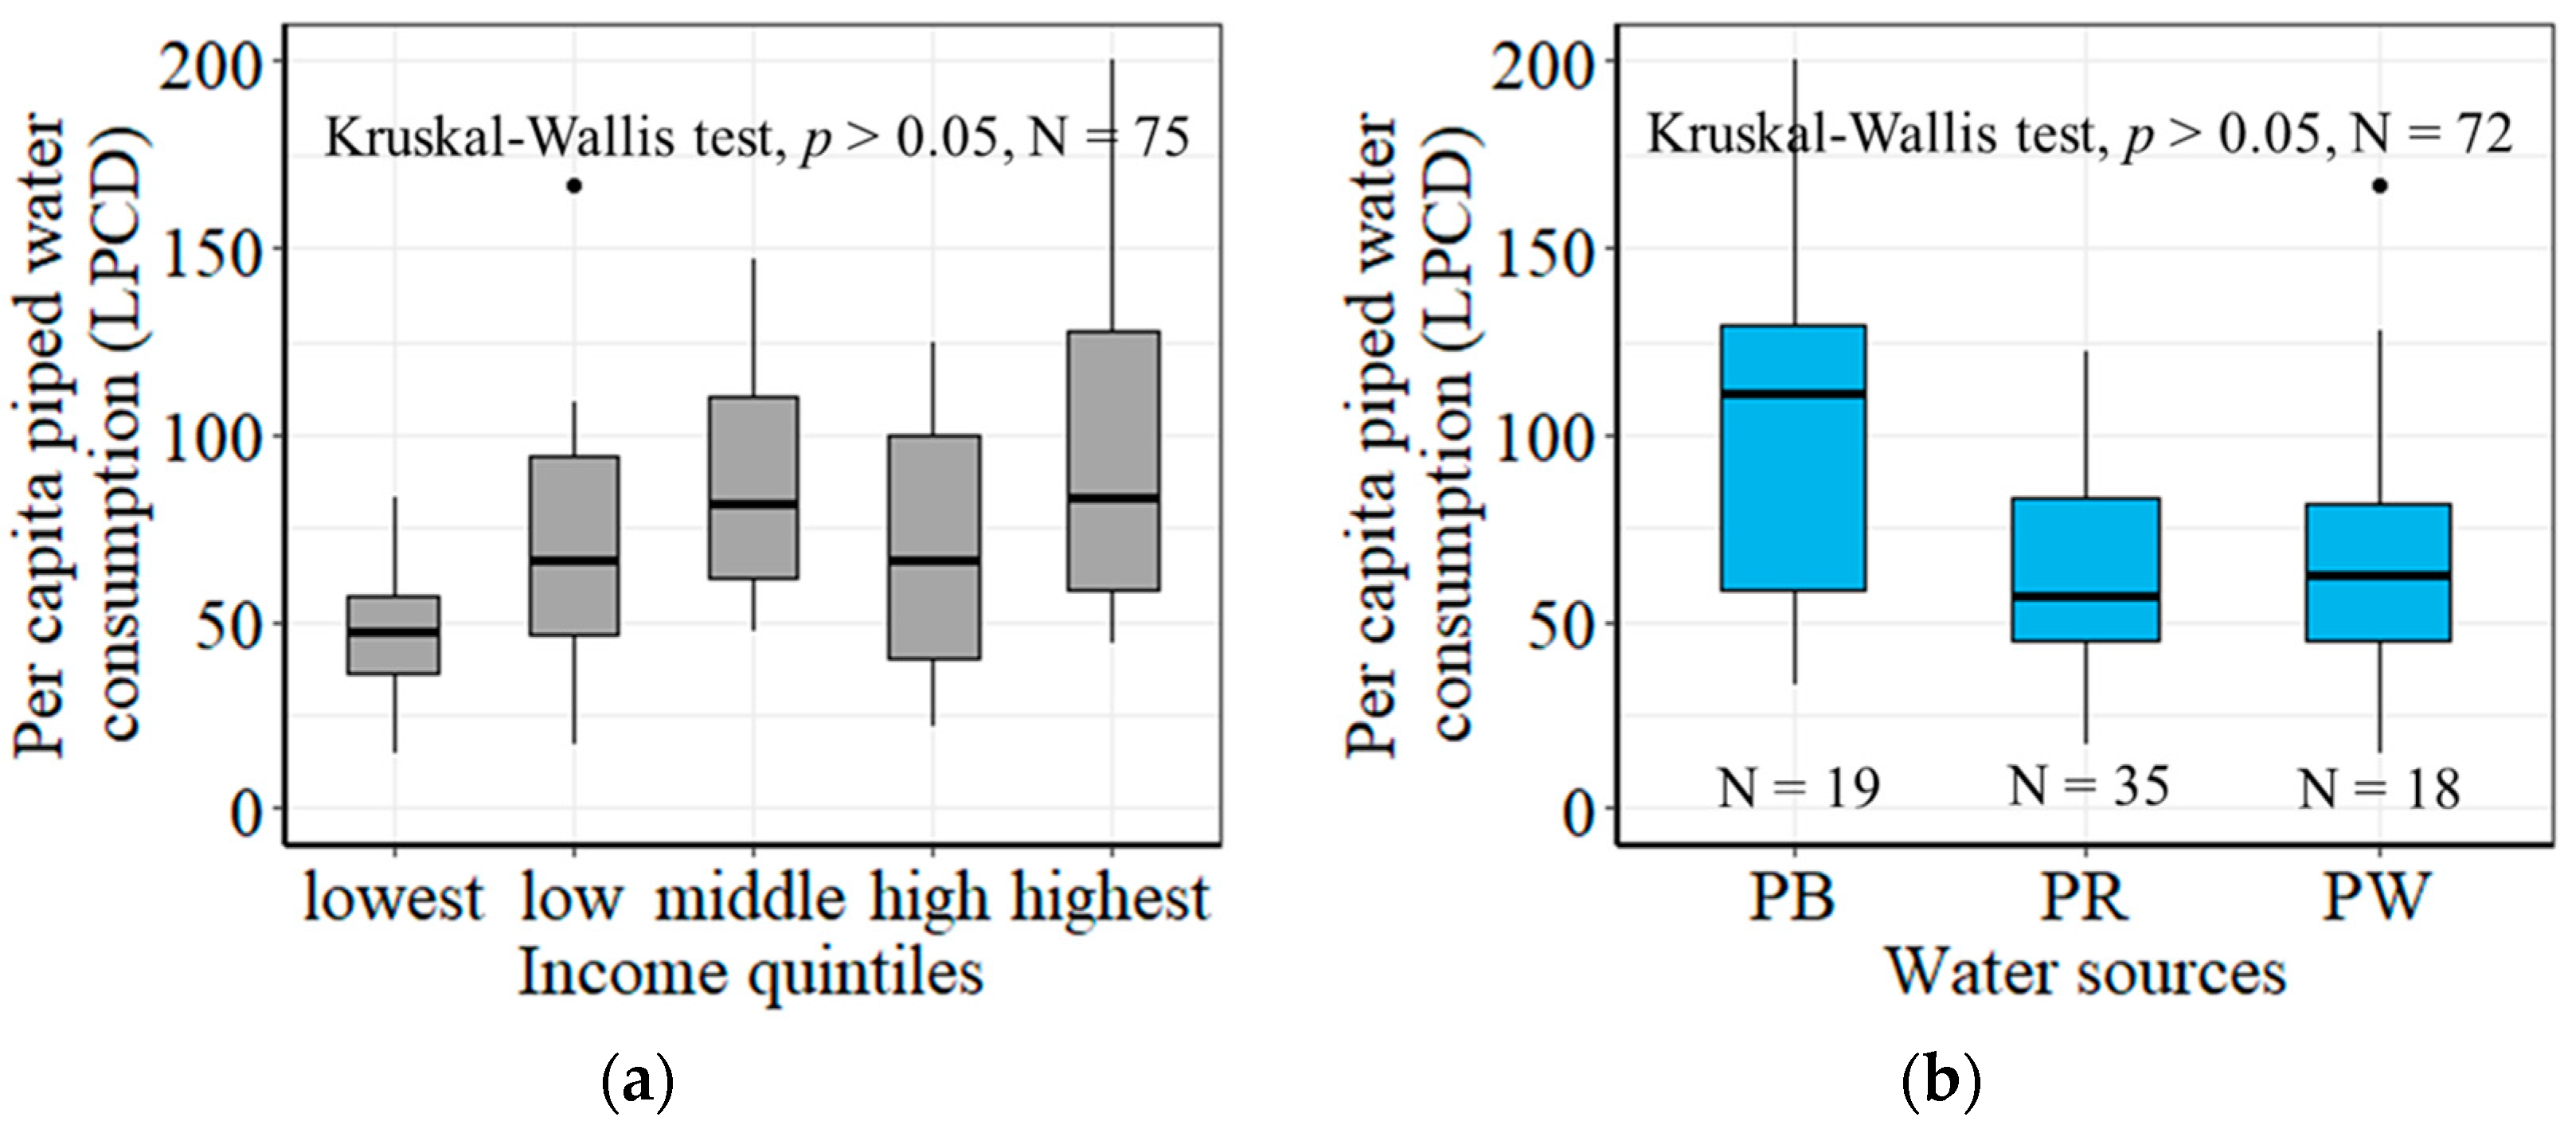
Figure 5a shows the per capita water consumption across the income quintiles. Although the difference in the mean values was not statistically significant (Kruskal–Wallis test, p > 0.05), the median values, as well as the variances, increased with the household income from 47.6 LPCD of the lowest income households to 83.7 LPCD of the highest income quintiles. In addition, 86.7% of the lowest income quintile consumed less than 60 LPCD, which was the minimum amount required by MISTI in the feasibility study. In contrast, the percentages of households consuming less than 60 LPCD were lower for the higher income quintiles than the lowest income quintile, namely 33.3%, 20.0%, 40.0%, and 30.8% for the low-, middle-, high-, and highest-income quintiles, respectively. A high percentage of households consuming less than 60 LPCD in the high-income quintile brought down the median LPCD to less than the middle-income group.
Figure 5b shows the per capita water consumption among the households using piped water and alternative water sources, namely bottled water (PB), rainwater (PR), and well water (PW). Although there was no significant difference in the mean values (Kruskal–Wallis test, p > 0.05), the median value of PB was apparently higher than those of PR and PW. This indicates that in areas where rainwater and/or well water is available, piped water consumption tends to be less than 60 LPCD in the median values. Therefore, the lower consumption of piped water below 60 LPCD, as required by MISTI, does not necessarily mean low amounts of water consumption due to water shortages or difficulty in tariff payments, but is the result of consumers’ preference for rainwater and well water over piped water.
Figure 6 shows a multiple log-linear regression model on household monthly piped water consumption per connection (HMWC) as a dependent variable, expressed by three independent variables, namely age of household head (AHH), household monthly income (HMI), and the number of household members (NHM) (Equation (3)), was applied to the field survey data, and the coefficients and their significance are listed below. The coefficient of AHH was significant (p < 0.05) and negative, which indicates that senior persons consume less water than younger people. On the other hand, the coefficients for HMI and NHM were significant (p < 0.01) and positive, which is quite reasonable.
where HMWC: household monthly water consumption, AHH: age of household head, −0.88 (p < 0.05), HMI: monthly income, 0.18 (p < 0.01), and NHM: number of household members, 0.48 (p < 0.01).
log10 (HMWC) = 1.65 − 0.88 log10 (AHH) + 0.18 log10 (HMI) + 0.48 log10 (NHM)
3.6. Household Monthly Expenditure on Piped or Bottled Water
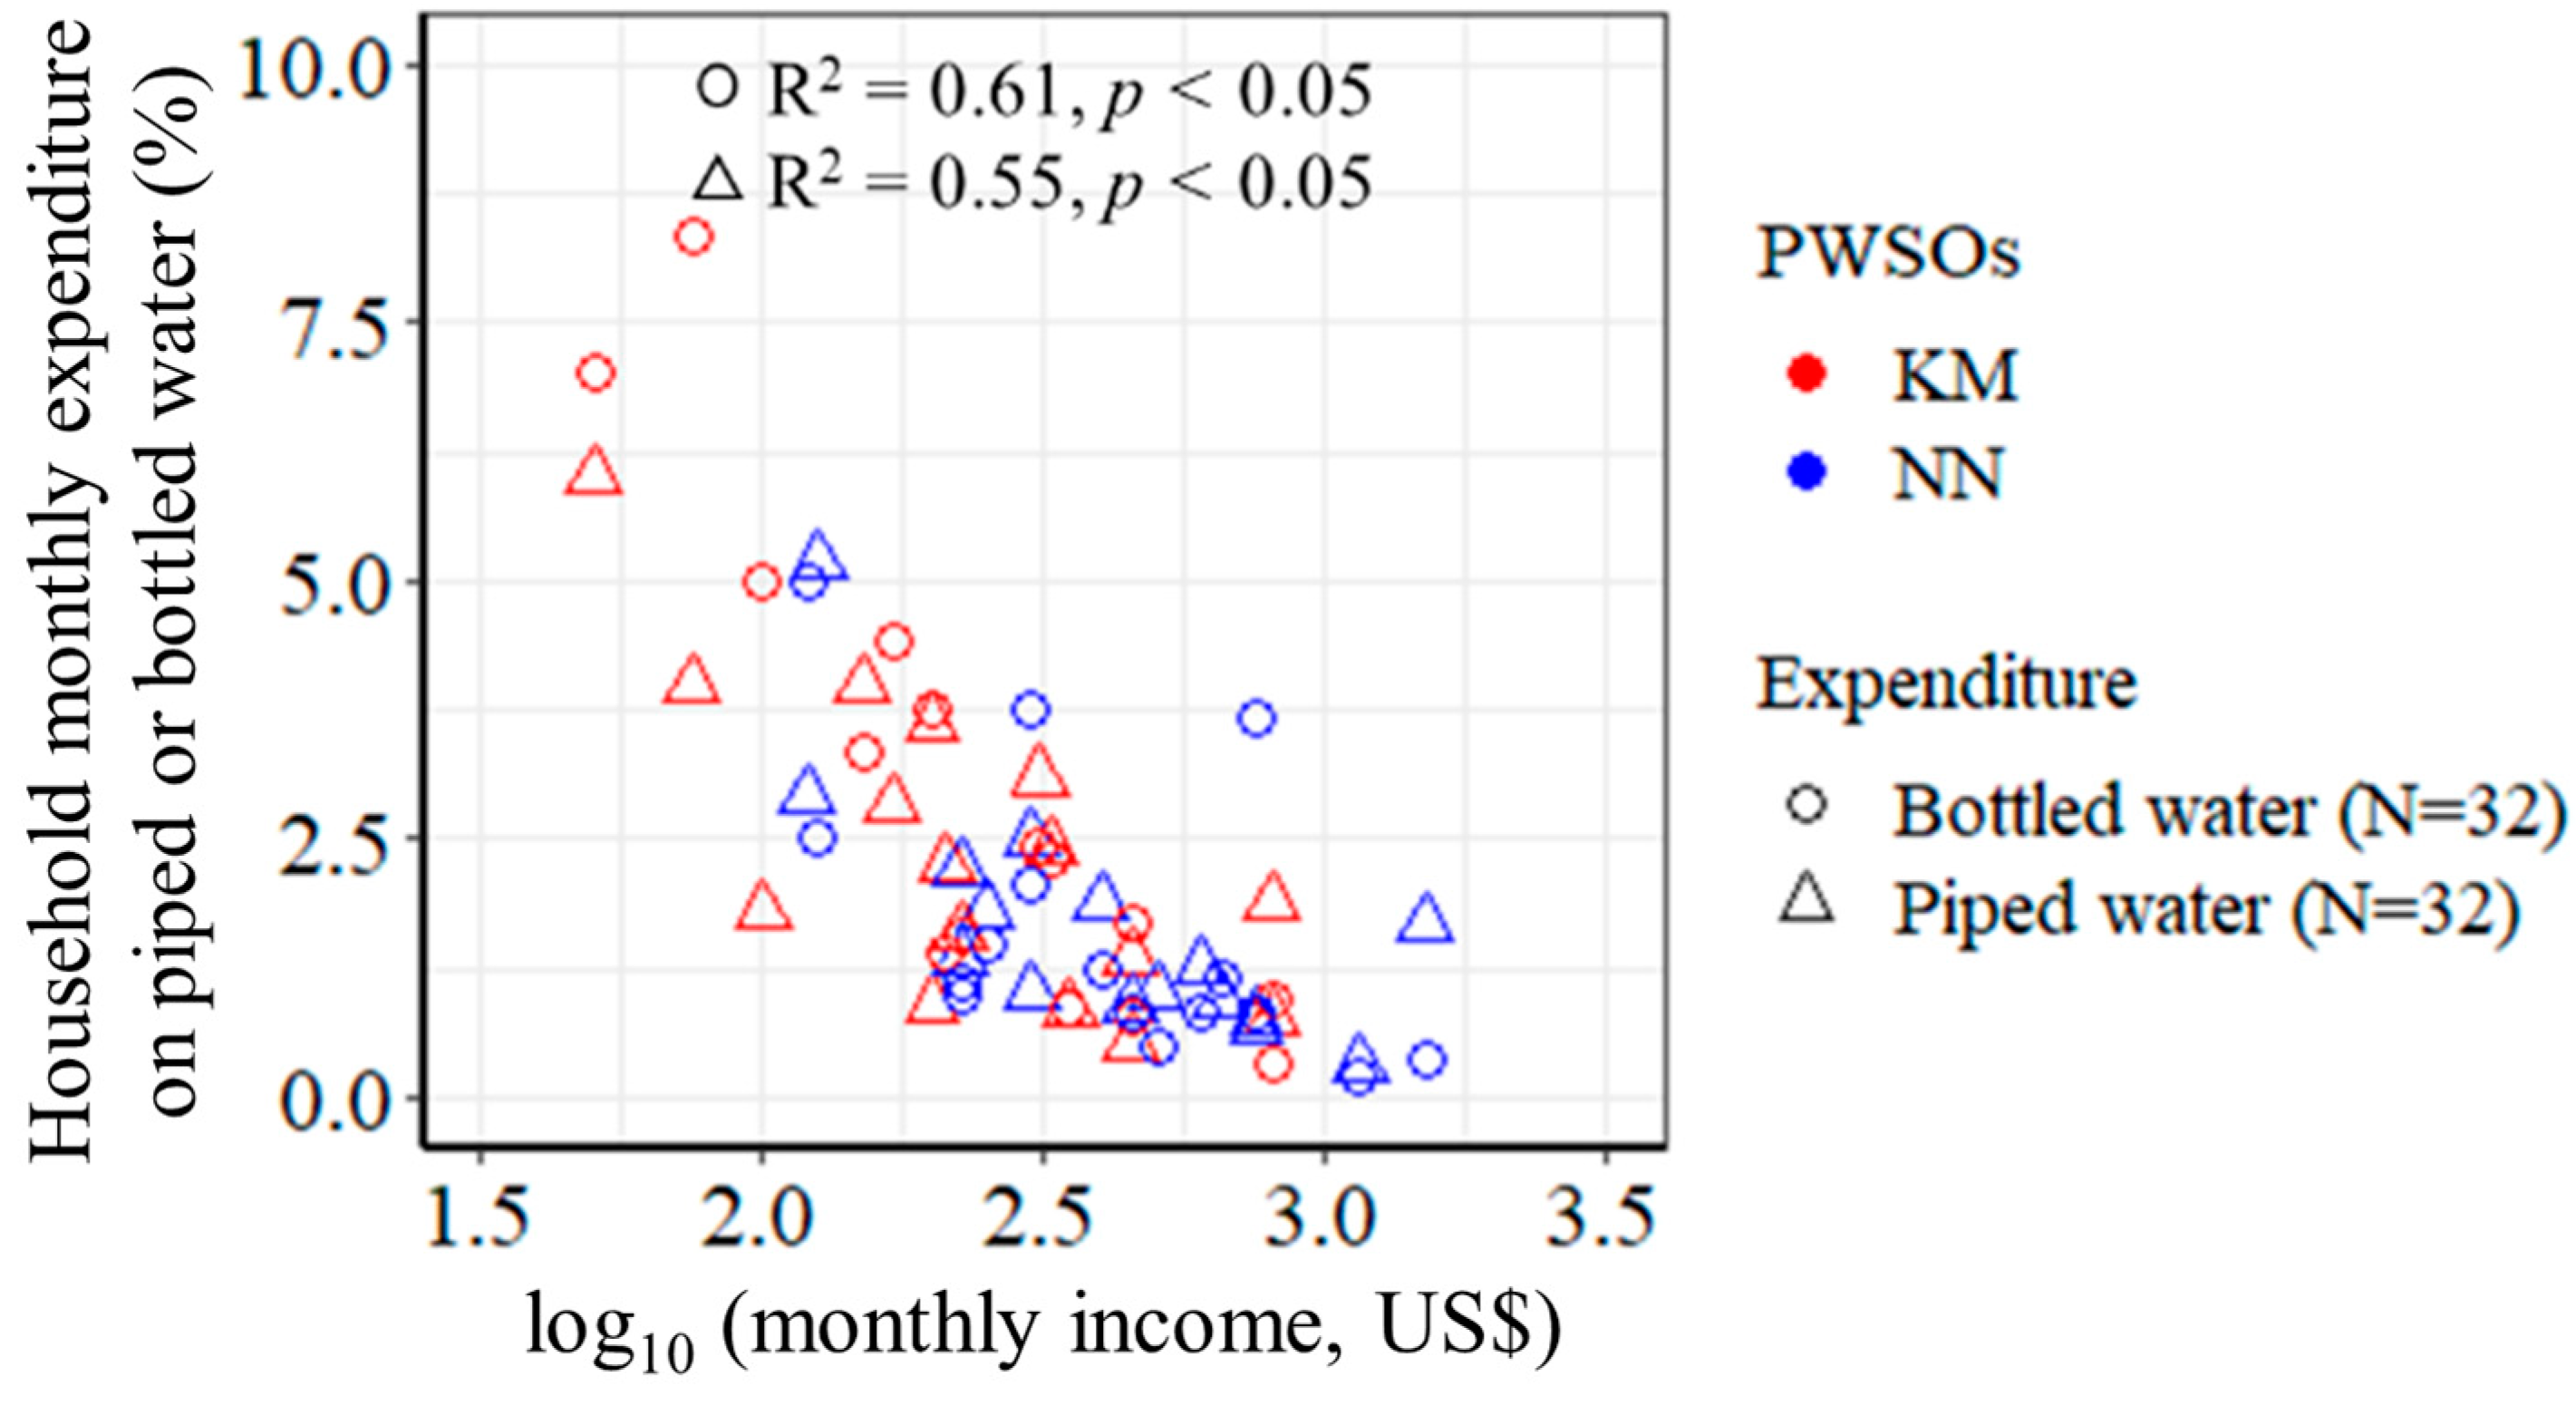
As shown in Figure 7, there are negative correlations between household monthly income and percent expenditure for piped or bottled water (p < 0.05). It is clearly shown that the percent expenditures for both piped water and bottled water increase as the household income decreases, which implies difficulty in paying for piped water and bottled water among the low- and lowest-income groups.
The averages of percent expenditures for piped water were 2.36% (7.19 USD or 28,760 KHR) and 1.64% (8.52 USD or 34,080 KHR) of the household monthly income in KM and NN, respectively. They spent 2.97% (9.09 USD or 36,360 KHR) and 1.63% (8.64 USD or 34,560 KHR) of their income on bottled water, respectively. These results indicate that the expenditure for bottled water is comparable to that for piped water, as these households need to consume bottled water for drinking. Therefore, the low- and lowest-income households might be not willing to connect to a piped water supply, because they would like to avoid paying for both piped and bottled water.
3.7. Connection Expenditure
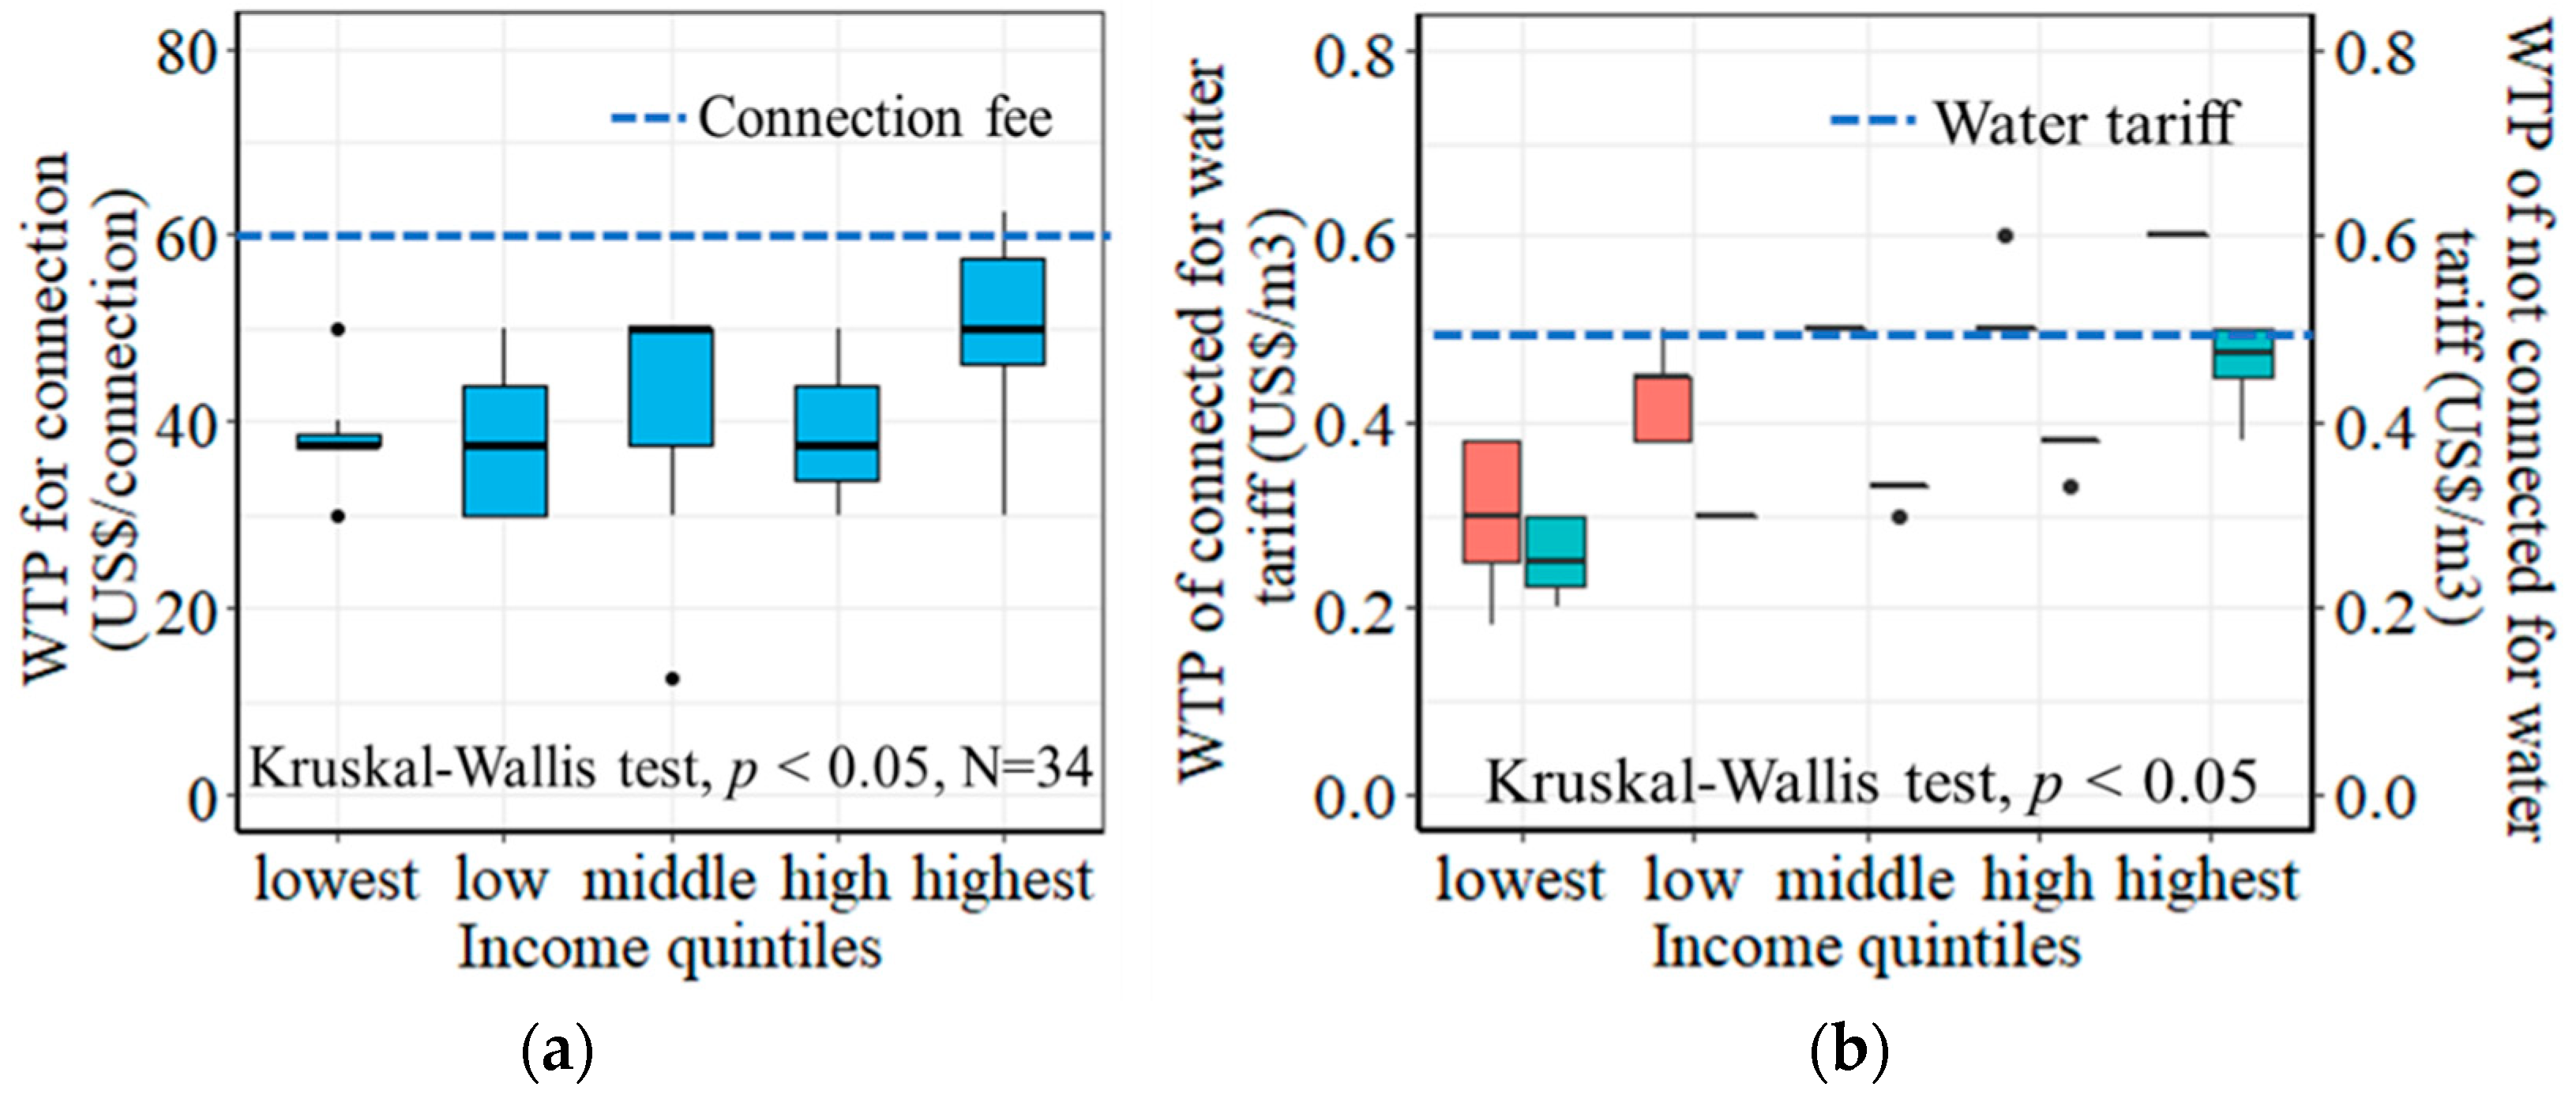
Figure 8 shows the estimated expenditure and percent expenditure for connection to piped water. The expenditure for connection was slightly higher than the connection fee (60 USD/connection or 240,000 KHR/connection) because of the need to pay extra for pipes and water meters. Although the expenditures were almost the same across income quintiles (Kruskal–Wallis test, p > 0.05), the percent expenditure reduced from about 60% for the lowest income quintile to 6.67% for the highest income quintiles. These results suggest that a high connection fee could be one of the reasons for not connecting to piped water supply among the low- and lowest-income quintiles.
3.8. WTP for Connection Fee and Water Tariff
Figure 9a shows the cost non-connected households reported being willing to pay for connection. Although there was no significant difference in the mean values for willing to pay across the income quintiles (Kruskal–Wallis test, p > 0.05), the median value for the connection fee was 37.5 USD/connection (150,000 KHR/connection) for the lowest quintile, compared to 50 USD/connection (200,000 KHR/connection) for the highest quintile (Figure 9a). All were less than the actual connection fee of 60 USD/connection (240,000 KHR/connection).
Figure 9b shows WTP for water tariffs by both connected (red boxes) and non-connected (green boxes) households. The connected households were willing to pay an average water tariff of 0.50 USD/m3 (2000 KHR/m3), while the average WTP water tariff of non-connected households was 0.32 USD/m3 (1280 KHR/m3). The middle-, high-, and highest-income quintiles of the connected homes were willing to pay the present water tariff of 0.50 USD/m3 (2000 KHR/m3), but the low- and lowest-income quintiles were not. Most of the non-connected households were not willing to pay the present water tariff of 0.50 USD/m3 (2000 KHR/m3), except for a few households in the highest income quintile. These results suggested that the WTP is strongly influenced by household income, and that a higher connection fee and water tariff than the non-connected households are willing to pay is one of the reasons for not connecting to the piped water supply across all income quintiles.
4. Discussion
4.1. Effects of Distribution Pipe Installation and Maintenance on Water Supply Management
Distribution pipe installation and management in NN was not in compliance with the guidelines from MISTI (Figure A1b). The depth of pipes is much shallower than required. They used a fusion welding machine to connect the pipes, and the strength of the pipe joints were not properly measured (Figure A3(a1–3)). Although many kinds of adverse effects of below-standard network design and pipe installation, such as low water supply pressure, leakage, and poor water quality, were anticipated, these problems were not found in NN in the field survey [31,32], possibly because of efforts to maintain and repair the distribution pipes (Table 5).
The typical ranges of NRWs for developed, middle-income, and developing countries are 5–24%, 15–24%, and 25–45%, respectively [33]. The NRWs of the three PWSOs investigated in this study, KC, KM, and NN, were 10.9–18.3% in 2020 (Table 2, Figure A2a), which was close to the MISTI guideline value of 15% and significantly lower than the abovementioned NRW range of water utilities in developing countries; however, they were higher than the 8.16% for the Phnom Penh Water Supply Authority (PPWSA) in 2019 [34]. The electricity consumption of KC, KM, and NN was 0.53, 0.32, and 0.24 kWh/m3 in 2020 (Figure A2b), which was slightly higher than the unit electricity consumption of PPWSA at 0.23 kWh/m3 in 2019 [34]. Although the PWSOs must pay for the maintenance of pipe networks, electricity consumption, chemicals, and personnel costs, their operating ratios were kept low at 21.8–46.8% in 2020 (Table 5). This implies that the PWSOs could lower the connection fee and water tariff to the levels non-connected homes are more willing to pay (Figure 9).
At NN, water supply pressure and turbidity along the distribution networks met the guideline values from MISTI of at least 0.05 MPa and less than 5 NTU, respectively [25,26]. Even so, the residual chlorine in the tap water was below the national water quality standard of 0.1 mg/L (Figure 2) [25] to save on chemical costs and to avoid chlorine smell complaints from customers. Thus, a chlorine smell due to a high chlorine concentration was excluded from the causes of non-connection to piped water. Increasing the chlorine dose from 0.06 mg/L to 0.4 mg/L would meet the guideline value of 0.1 mg/L in the networks (Figure 3 and Figure 4); however, a high chorine concentration may cause customer complaints, and thus increase the non-connection rates.
4.2. Factors Influencing Piped Water Consumption
The average per capita water consumption was found to be 66.7 LPCD, which is higher than the 50 LPCD reported for rural areas of developing countries [35] and per capita water consumption in Cambodia (51.4–52.2 LPCD) [36] and meets the piped water consumption standard (7 m3/connection/month or 60 LPCD) set by MISTI. In addition to piped water supplies, many households have alternative water sources, such as bottled water, rainwater, and well water (Table 4 and Figure A4); therefore, water consumption was less for the households with access to rainwater and/or well water than those without access (Figure 5b) [17]. Consumption of bottled water has little effect on piped water consumption because people consume bottled water only for drinking, but their expenditure for bottled water might influence their willingness to connect to piped water, especially the low- and lowest-income quintiles (Figure 7 and Figure 9a). Piped water consumption is influenced by the age of the household head, the household size, and the household income (Figure 5a and Equation (3)). The lower the household income, the less the piped water consumption, because the percent expenditure of the household income for piped water increases as the household income decreases (Figure 7); thus, the low- and lowest-income households tend to reduce piped water consumption to save on expenditure. The percent expenditure of household income for piped water was comparable for the high or the highest income quintiles to the 1% reported for developing countries [34,37], but it was significantly higher for the low- and lowest-income quintiles in this study, which was also reported in a previous study in Metro Manila [38]. Therefore, the current level of water tariffs causes access inequality for the low- and lowest-income households, compared to the middle- or higher-income households.
This is also true for the connection costs to piped water; although the costs for connection expenditure are almost equal at about USD 60 (KHR 240,000) per connection among all income quintiles (Figure 8), the percentage of the connection expenditure to the household income increases from 6.7% for the highest income quintile to 60.0% for the lowest. Therefore, a higher connection cost and water tariff than they are willing to pay could discourage the low- and lowest-income households from connecting to the piped water supply systems.
4.3. Factors Influencing Connection Rates
The service levels, namely water quality, residual chlorine levels, water supply pressure, and supply continuity, are not the reasons for non-connection. According to the survey results, 80% of the connected homes were satisfied with the service providers (Table A2). The supply volume, supply hours, and water supply pressure of the PWSOs were sufficient to meet the customers’ needs.
A large service area and a high range of altitude in KC has made it difficult to extend the water supply network to cover all customers (Table 2) and has caused increased electricity expenditure for pumping and the frequency of pipe leakages (Table 6). Therefore, it is important that service areas of PWSOs are not too large, such as is the case for KC, to increase the connection rates.
Although households in developing countries are reported to be willing to pay 1.8–8% of their monthly income for safe and reliable piped water or other water services [33,35,36], or even 9.6% for bottled water [39], the results of this study showed that high expenditures for connection to piped water and water tariffs are constraints for the connection to piped water. This is especially true for the low- and lowest-income quintiles, but some of the high and highest income quintiles also stated that they were only willing to pay less than the present connection fee and water tariff (Figure 9a,b). Facing difficulties in paying more for water, the low- and lowest-income households tend to save water consumption and/or seek alternative free-of-charge water sources (Figure 7), which are often contaminated [38]. Unlike city centers in Asian mega cities, the service areas of PWSOs are mostly located in suburban areas or rural areas, where it is easy to access alternative water sources, such as rainwater and well water; this may be another reason for low connection rates in the service areas of the PWSOs.
The PWSOs make profit from their low operating ratio of 21.8–46.8% (Table 5). This suggests that it might be possible to lower the connection fees and water tariffs by 20–30%, to the levels that non-connected homes are willing to pay (Figure 9a). Although such revisions will require careful consideration in terms of their future investment and business profitability, as well as government policies on the regulation of PWSOs, it could be a viable option for sustainable management of PWSOs and extending water supply services to all people in Cambodia. Scattered and distant service areas from the water supply stations, such as KC, are difficult to extend due to high investment and operational costs and high use of non-revenue water. Thus, the service areas should be carefully planned and examined when the license is issued to the PWSO.
5. Conclusions
The PWSOs investigated in this study complied with the national water quality and pressure guidelines but did not meet the guidelines for pipe installation. The high variation in the connection rates to the water supply networks was mainly due to the difference in the scales of the service areas; if the service areas are large and/or away from the water supply stations, the connection rates tend to be lower than in compact and high-density service areas. Therefore, it is important to examine the scale of service areas proposed by the PWSOs when licenses are issued by the MISTI.
The per capita consumption of piped water was lower for households with access to alternative water sources, such as rainwater and well water. The low- and lowest-income households consumed less piped water than higher income households due to difficulty paying the water tariff. Non-connected homes reported that they are willing to pay less than the present connection costs and water tariff. In order to increase the connection rates, it is suggested to lower the current connection fee and water tariff, given that the operating ratios of the PWSOs are low enough to make this possible, which will also help low-income households to consume more than 60 LPCD of piped water.
Author Contributions
Conceptualization, S.T., S.P. and S.K.; methodology, S.K. and S.T.; data analysis, S.P., S.K. and S.T.; investigation, S.P.; data curation, S.P.; writing—original draft preparation, S.P.; writing—review and editing, S.T. and S.K.; visualization, S.P.; supervision, S.T. and S.K.; project administration, S.K. and S.T.; funding acquisition, S.T. All authors have read and agreed to the published version of the manuscript.
Funding
This research was funded by the Japan International Cooperation Agency (JICA) through the collaborative program with the University of Tokyo and the scholarship provided to Sinat Phea for his graduate studies. This study was also supported by Grand-in-Aid for Scientific Research (No. 22H01621) provided by the Japan Society for the Promotion of Sciences (JSPS).
Data Availability Statement
Restrictions apply to the availability of these data. Data obtained from the Cambodian Government are available from the authors with the permission of the Cambodian Government. Other data used in this study are available from the authors upon request.
Acknowledgments
The authors would like to express their gratitude to the private water supply operators in NN, KM, and KC, and the General Department of Portable Water, MISTI, Cambodia.
Conflicts of Interest
The authors declare no conflict of interest.
Appendix A
Figure A1.
Requirements for (a) domestic water meter installation and (b) pipeline installation [26].
Figure A1.
Requirements for (a) domestic water meter installation and (b) pipeline installation [26].

Figure A2.
(a) NRW of each PWSO and (b) electricity consumption.

Figure A3.
(a-1 to a-3) Distribution pipe installation; (b-1 and b-2) water purification installation; (c-1 and c-2) water meter installation; and (d) water pressure meter.
Figure A3.
(a-1 to a-3) Distribution pipe installation; (b-1 and b-2) water purification installation; (c-1 and c-2) water meter installation; and (d) water pressure meter.

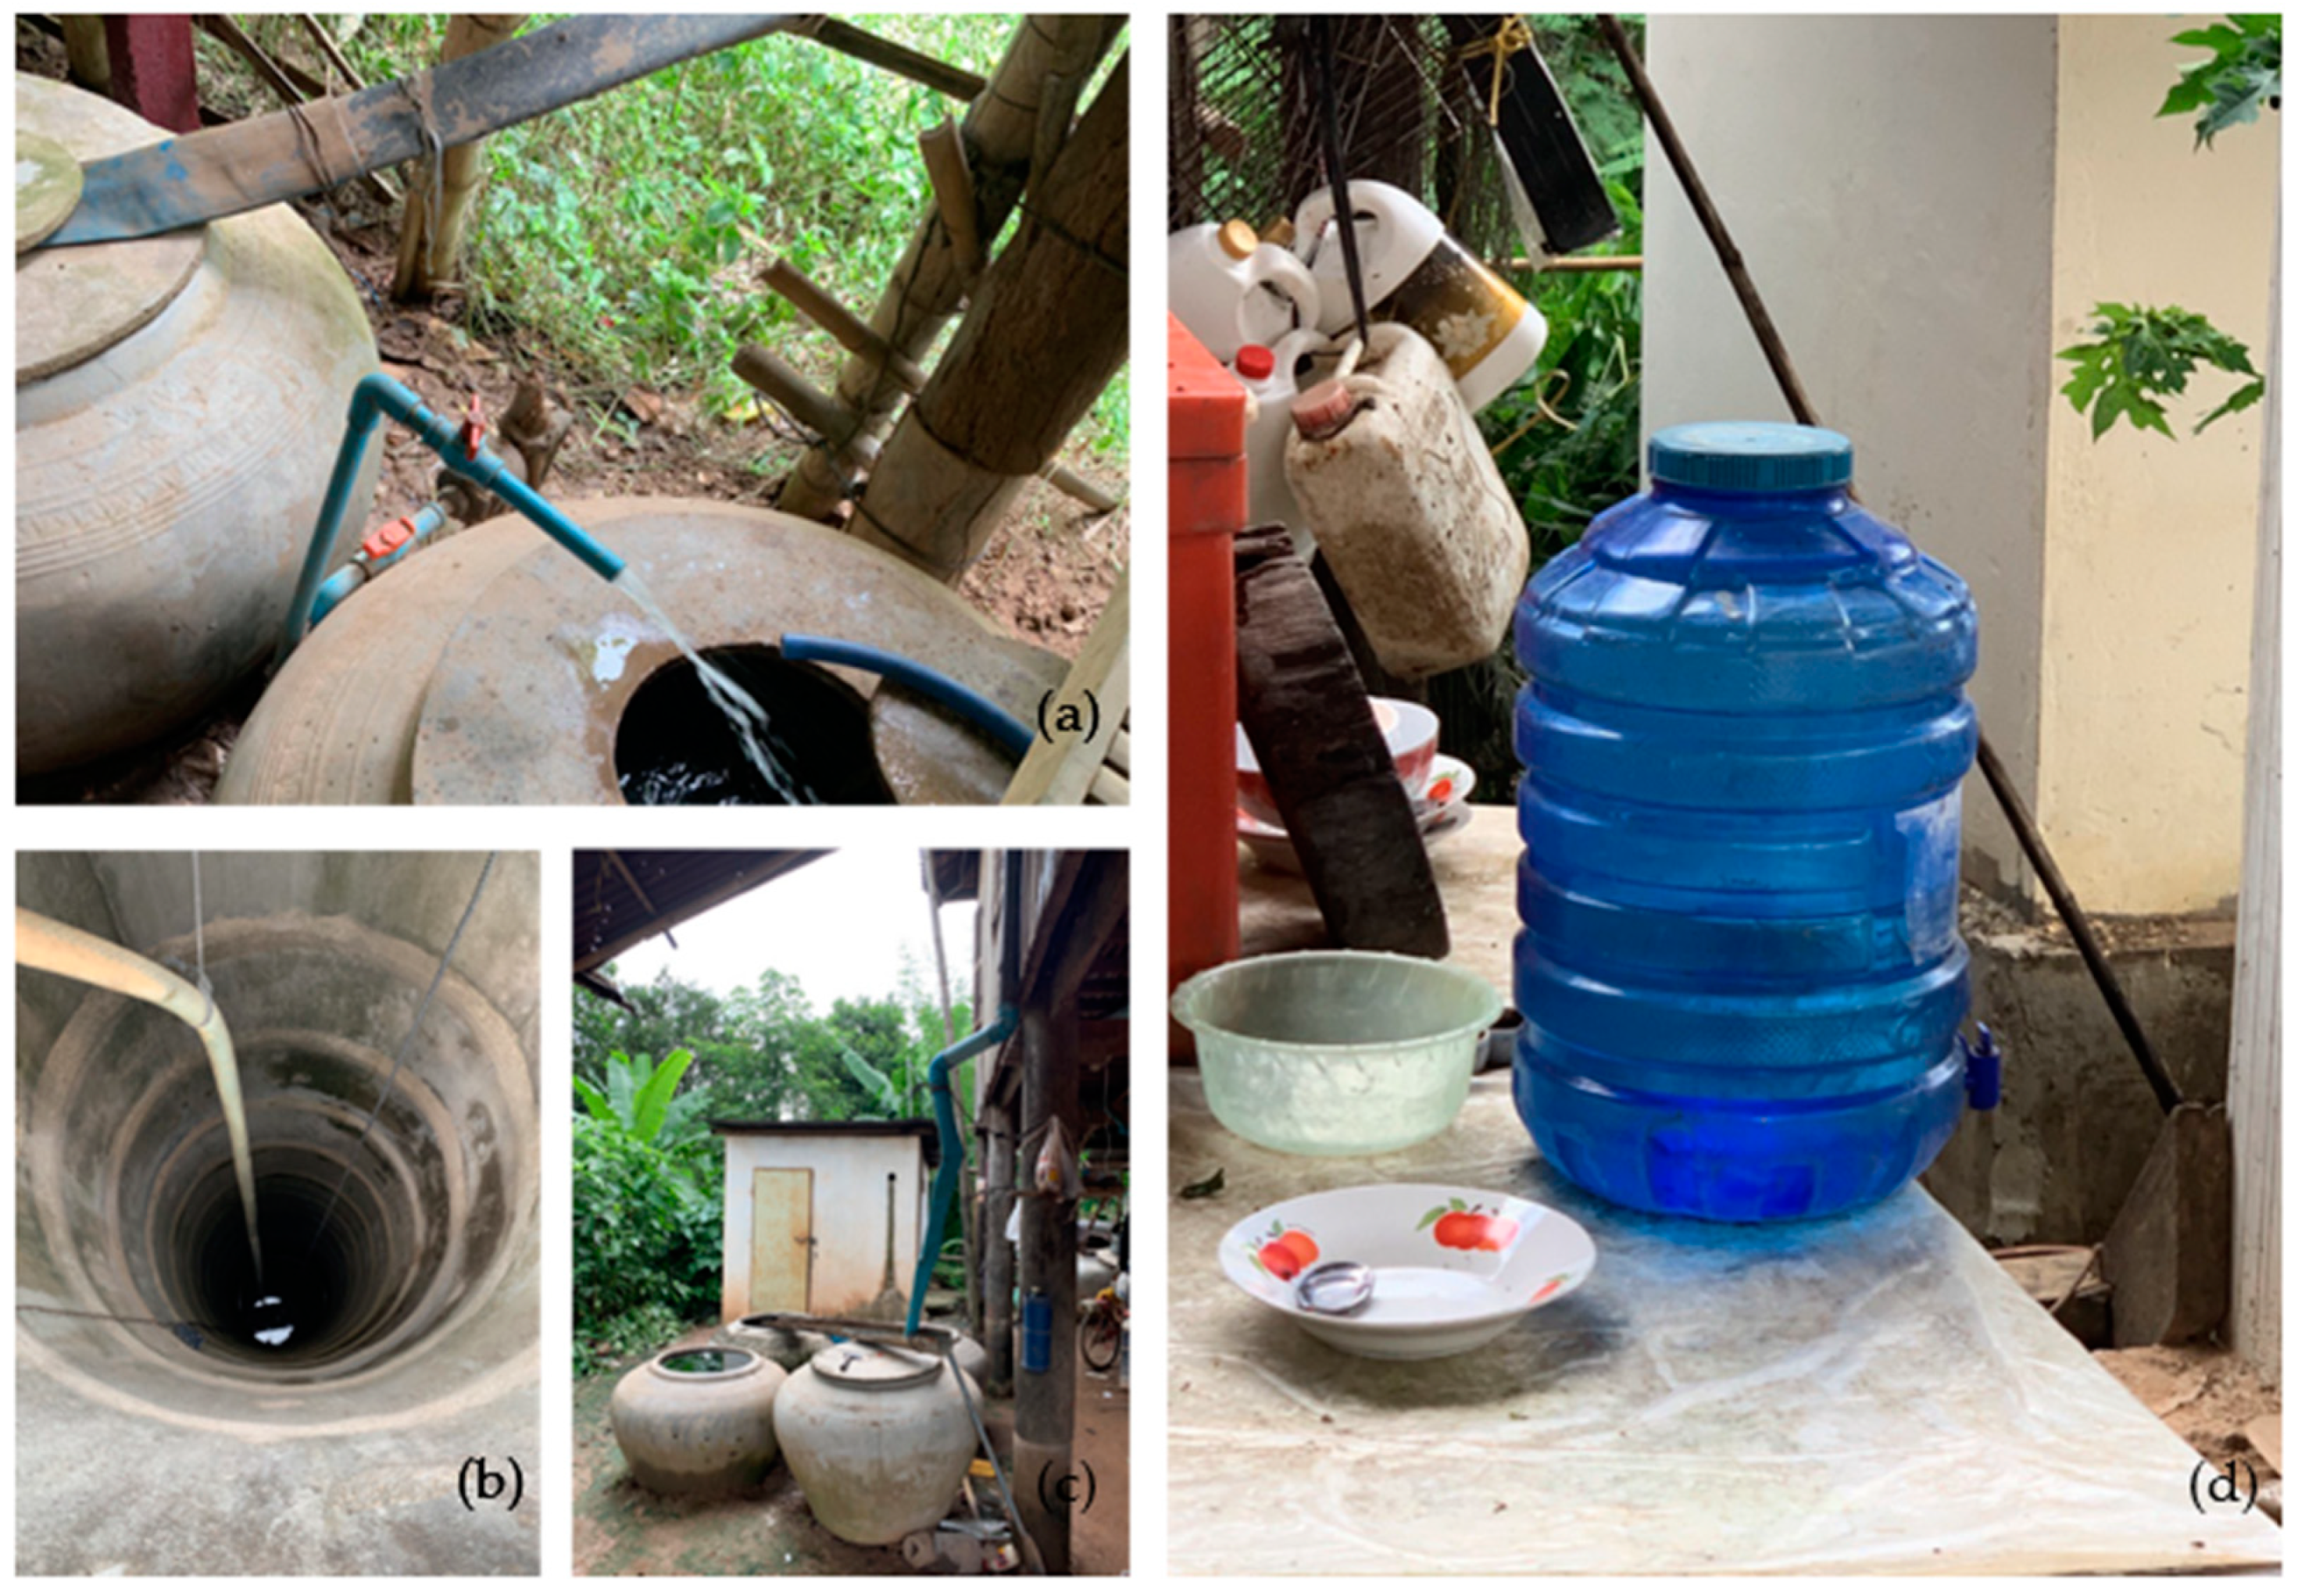
Figure A4.
Alternative drinking water sources in the study area: (a) piped water; (b) unprotected dug well; (c) rainwater; and (d) bottled water.
Figure A4.
Alternative drinking water sources in the study area: (a) piped water; (b) unprotected dug well; (c) rainwater; and (d) bottled water.


Table A1.
Demand calculations for EPANET analysis for the study areas [28].
Table A1.
Demand calculations for EPANET analysis for the study areas [28].
| Descriptions | KC | KM | NN |
|---|---|---|---|
| Service population | 11,299 | 13,090 | 11,797 |
| Total water demand (m3/d) | 1396.80 | 705.60 | 633.60 |
| Per-capita water demand (LPCD (actual)) | 124 | 55 | 54 |
| Number of junctions/nodes | 47 | 83 | 55 |
| Number of pipes/links | 51 | 83 | 66 |
| Water demand at each node (L/min) | 0–129.81 | 0.513–82.11 | 0–32.61 |
| Pipe diameter (HDPE pipe) (mm) | 63–225 | 63–200 | 63–200 |
| Total length of distribution network (m) | 23,255 | 20,451 | 18,969 |
Table A2.
Perception of customers on service provision of each PWSO.
| PWSOs | Perception of Customers (%) | ||
|---|---|---|---|
| Satisfied | Neutral | Not Satisfied | |
| KM | 73.7 | 15.8 | 10.5 |
| NN | 86.5 | 8.1 | 5.4 |
| Total | 80.0 | 12.0 | 8.0 |
References
- United Nations, Department of Economic and Social Affairs. Sustainable Development Goal 6.1. 2021. Available online: https://sustainabledevelopment.un.org/sdg6 (accessed on 21 April 2022).
- Galaitsi, S.E.; Russell, R.; Bishara, A.; Durant, J.L.; Bogle, J.; Huber-Lee, A. Intermittent domestic water supply: A critical review and analysis of causal consequential pathways. Water 2016, 8, 274. [Google Scholar] [CrossRef] [Green Version]
- Hutton, G.; Chase, C. The Knowledge Base for Achieving the Sustainable Development Goal Targets on Water Supply, Sanitation and Hygiene. Int. J. Environ. Res. Public Health 2016, 13, 536. [Google Scholar] [CrossRef] [PubMed] [Green Version]
- Texas Water Resource Institute. 10 Challenges of Water Utilities. 2019. Available online: https://twri.tamu.edu/publications/txh2o/2019/summer-2019/10-challenges-of-water-utilities/ (accessed on 22 April 2022).
- The World Bank. Water Supply. 2017. Available online: https://www.worldbank.org/en/topic/watersupply#1 (accessed on 22 April 2022).
- Bei, E.; Wu, X.; Qiu, Y.; Chen, C.; Zhang, X. A Tale of Two Water Supplies in China: Finding Practical Solutions to Urban and Rural Water Supply Problems. Acc. Chem. Res. 2019, 52, 867–875. [Google Scholar] [CrossRef] [PubMed]
- Venkatachalam, L. Informal water markets and willingness to pay for water: A case study of the urban poor in Chennai City, India. Int. J. Water Resour. Dev. 2015, 31, 134–145. [Google Scholar] [CrossRef] [Green Version]
- Solihu, H.; Bilewub, S.O. Availability, coverage, and access to the potable water supply in Oyo State Nigeria. Environ. Chall. 2021, 5, 100335. [Google Scholar] [CrossRef]
- UNICEF. Key Asks for 2020 SDG Voluntary National Reviews: SDG 6. Clean Water and Sanitation for Every Child. 2020. Available online: https://www.unicef.org/media/64331/file/sdg62pagerfinal.pdf (accessed on 21 April 2022).
- Olalekan, R.M.; Adedoyin, O.; Adedotun, A.T.; Emmanuel, O.O.; Anu, B. An Analysis of Bayelsa State Water Challenges on The Rise and Its Possible Solutions. Acta Sci. Agric. 2019, 3, 110–125. [Google Scholar] [CrossRef]
- Tariq, S.; Zhang, X.; Leung, R.H.M. An analytical review of failed water public–private partnerships in developing countries. Manag. Procure. Law 2019, 172, 60–69. [Google Scholar] [CrossRef]
- Royal Government of Cambodia, Ministry of Industry, Mines, and Energy. Cambodia Provincial and Peru-Urban Water and Sanitation (CPPUWSP, IDA Credit No. 3746-KH). 2006; (Contract agreement between the Government of Cambodia and the World Bank, available only in print). [Google Scholar]
- Royal Government of Cambodia. Cambodia Socio-Economic Survey (CSES) 2017; National Institute of Statistics, Ministry of Planning, Royal Government of Cambodia: Phnom Penh, Cambodia, 2018.
- Network on Technology in Asia and Pacific. Provincial Water Supply and Sanitation Project, Cambodia. 2019. Available online: http://www.jwrc-net.or.jp/aswin/en/newtap/report/NewTapIWP17.pdf (accessed on 24 April 2022).
- Royal Government of Cambodia. National Strategic Development Plan (NSDP) 2014–2018; Ministry of Planning, Royal Government of Cambodia: Phnom Penh, Cambodia, 2014.
- Royal Government of Cambodia. Water Supply Monitoring System (WSMS), Ministry of Industry, Science, Technology & Innovation (MISTI). 2020. Available online: https://wsms-gdwat.misti.gov.kh/ (accessed on 24 November 2020).
- World Bank Group. Strengthening Sustainable Water Supply Services through Domestic Private Sector Providers in Cambodia. 2018. Available online: https://openknowledge.worldbank.org/handle/10986/23769?show=full (accessed on 24 April 2022).
- Chan, V. The Enterprise Resource Management System for Water Service Providers in Cambodia. World Bank 2010, 1, 10466. [Google Scholar]
- Baker, J.L. Opportunities and Challenges for Small Scale Private Service Providers in Electricity and Water Supply: Evidence from Bangladesh, Cambodia, Kenya and the Philippines. Work. Pap. World Bank PPIAF. 2009. Available online: https://ppp.worldbank.org/public-private-partnership/sites/ppp.worldbank.org/files/2022-06/WB-Opportunities-Challenges-SPSP-Water-Electricity-2009.pdf (accessed on 10 January 2022).
- Grant, M.; Soeters, S.; Bunthoeun, I.; Willetts, J. Rural Piped-Water Enterprises in Cambodia: A Pathway to Women’s Empowerment? Water 2019, 11, 2541. [Google Scholar] [CrossRef] [Green Version]
- Garn, M.; Isham, J.; Kahkonen, S. Should We Bet on Private or Public Water Utilities in Cambodia? Evidence on Incentives and Performance from Seven Provincial Towns. Middlebury Coll. Econ. Discuss. Pap. 2002, 1, 2–19. [Google Scholar]
- William, F.; Squez, V.; Mozumder, P.; Arce, J.H.; Berrens, R.P. Willingness to pay for safe drinking water: Evidence from Parral, Mexico. J. Environ. Manag. 2009, 90, 3391–3400. [Google Scholar] [CrossRef]
- Basani, M.; Isham, J.; Reilly, B. The determinants of water connection and water consumption: Empirical Evidence from a Cambodian Household Survey. World Dev. 2008, 36, 953–968. [Google Scholar] [CrossRef]
- Horn, T. Welfare Effects of Access to Water Service in Cambodia. Econ. Bull. 2011, 3, 2075–2089. [Google Scholar]
- Royal Government of Cambodia. National Water Quality Standard (NWQS), Ministry of Industry & Handicraft (MIH), Cambodia; Royal Government of Cambodia: Phnom Penh, Cambodia, 2015.
- Royal Government of Cambodia. Technical Minimum Requirement Guideline for Small-Scale Private Water Supply Operators in Cambodia, Ministry of Industry and Handicraft (MISTI), Cambodia; Royal Government of Cambodia: Phnom Penh, Cambodia, 2018.
- Ramana, V.; Sudheer, G.; Prasad, L. Hydraulic Simulation of Existing Water Distribution System using EPANET at Dire Dawa City, Ethiopia. Indian J. Sci. Technol. 2016, 9, 974–6846. [Google Scholar] [CrossRef] [Green Version]
- Rossman, L.A. EPANET 2 User’s Manual. 2000. Available online: https://www.microimages.com/documentation/Tutorials/Epanet2UserManual.pdf (accessed on 6 November 2021).
- Sorlini, S.; Biasibetti, M.; Gialdini, F.; Muraca, A. Modeling and Analysis of Chlorine Dioxide, Chlorite, and Chlorate Propagation in a Drinking Water Distribution System. J. Water Supply Res. Technol. 2016, 65, 597–611. [Google Scholar] [CrossRef]
- Zin, N.N.; Kazama, S.; Takizawa, S. Network Model Analysis of Residual Chlorine to Reduce Disinfection Byproducts in Water Supply Systems in Yangon City, Myanmar. Water 2021, 13, 2921. [Google Scholar] [CrossRef]
- Rajani, B.; Kleiner, Y. Non-destructive inspection techniques to determine structural distress indicators in water mains. National Research Count Canada. In Proceedings of the Evaluation and Control of Water Loss in Urban Water Networks, Valencia, Spain, 21 June 2004. [Google Scholar]
- Ellen, J.L.; Schwab, K.J. Deficiencies in drinking water distribution systems in developing countries. J. Water Health 2005, 3, 109–127. [Google Scholar] [CrossRef] [Green Version]
- Jasser, A.A. Chlorine decay in drinking-water transmission and distribution systems: Pipe service age effect. Water Res. 2007, 41, 387–396. [Google Scholar] [CrossRef]
- Biswas, A.K.; Sachdeva, P.K.; Tortajada, C. Phnom Penh Water Story. In Remarkable Transformation of an Urban Water Utility; Springer: Berlin/Heidelberg, Germany, 2021. [Google Scholar]
- Keshavari, A.R.; Sharifzadehb, M.; Kamgar, H.A.A.; Amin, S.; Keshtkar, S. Rural Domestic water consumption behavior: A case study in Ramjerd area, fares province, I.R. Iran. Water Res. 2006, 40, 1173–8173. [Google Scholar] [CrossRef]
- Mahe, J.P. Building Water Utilities with Local Private Entrepreneurs: The Example of the Mirep Program in Cambodia. 2006. Available online: https://documents1.worldbank.org/curated/en/122891468229471916/pdf/800960WP0Cambo00Box379796B00PUBLIC0.pdf (accessed on 22 February 2022).
- Loh, M.; Coghlan, P. Domestic Water Use Study, in Perth, Western Australia 1998–2001, Water Corporation of Western Australia, Australia. 2003. Available online: https://nla.gov.au/nla.cat-vn3062596 (accessed on 20 April 2022).
- Alfonso, S.M.; Kazama, S.; Takizawa, S. Inequalities in access to and consumption of safely managed water due to socio-economic factors: Evidence from Quezon City, Philippines. Curr. Res. Environ. Sustain. 2022, 4, 100117. [Google Scholar] [CrossRef]
- Hussien, W.A.; Memon, F.A.; Savic, D.A. Assessing and Modelling the Influence of Household Characteristics on Per Capita Water Consumption. Water Resour. Manag. 2016, 30, 2931–2955. [Google Scholar] [CrossRef] [Green Version]
Figure 1.
The locations and service areas of three PWSOs.

Figure 2.
Field monitoring of residual chlorine in NN.

Figure 3.
Simulation of free chlorine with initial free chlorine 0.06 mg/L: (a) network model; (b) chlorine concentration at each node in the model.
Figure 3.
Simulation of free chlorine with initial free chlorine 0.06 mg/L: (a) network model; (b) chlorine concentration at each node in the model.

Figure 4.
Simulation of chlorine with a chlorine dosage of 0.4 mg/L: (a) network model; (b) free chlorine concentration at each node in the model.
Figure 4.
Simulation of chlorine with a chlorine dosage of 0.4 mg/L: (a) network model; (b) free chlorine concentration at each node in the model.

Figure 5.
(a) Per capita piped water consumption across income quintiles, and (b) per capita piped water consumption across consumers using different water sources (PB: piped and bottled water, PR: piped and rainwater, and PW: piped and well water).
Figure 5.
(a) Per capita piped water consumption across income quintiles, and (b) per capita piped water consumption across consumers using different water sources (PB: piped and bottled water, PR: piped and rainwater, and PW: piped and well water).

Figure 6.
Log correlation between piped water consumption per connection and monthly income of households (n = 75).
Figure 6.
Log correlation between piped water consumption per connection and monthly income of households (n = 75).

Figure 7.
Correlation between log monthly income and percentage of household expenditure on piped or bottled water.
Figure 7.
Correlation between log monthly income and percentage of household expenditure on piped or bottled water.

Figure 8.
Expenditure for connection and percentage expenditure for connection compared to monthly income across income quintiles. (Red box: connection fee, green box: percent expenditure).
Figure 8.
Expenditure for connection and percentage expenditure for connection compared to monthly income across income quintiles. (Red box: connection fee, green box: percent expenditure).

Figure 9.
(a) Non-connected households’ WTP for connection and (b) WTP of connected and not-connected households for water tariffs across income quintiles (red boxes: connected households (n = 75), green box: non-connected households (n = 34)).
Figure 9.
(a) Non-connected households’ WTP for connection and (b) WTP of connected and not-connected households for water tariffs across income quintiles (red boxes: connected households (n = 75), green box: non-connected households (n = 34)).

Table 1.
Water supply under MISTI (29 April 2022).
| Parameters | Water Supply under MISTI | ||||
|---|---|---|---|---|---|
| Site | Urban (Provincial Capitals/City) | Peri-Urban/Rural Areas | |||
| No. of system | 23 | 319 | |||
| Ownership | Public: 12 | PWSOs: 11 | Public: 2 | PWSOs (licensed): 317 | |
| Management | Autonomous: 2 | Province capitals/city: 10 | BOO (a), BOT (b) | BOO (a), BOT (b), OBA (c), and DBL (d) | |
Note: (a) BOO: Build, Own, and Operate; (b) BOT: Build, Operate, and Transfer; (c) OBA: Output Based Aid; (d) DBL: Design, Build, and Lease.
Table 2.
Description of the three PWSOs in this study.
| PWSOs | Location | Service Started in | NRW in 2020 | Altitude Range in Service Areas | Connection Rate in 2020 | Total Homes in Service Area | Population in Service Area | Service Areas |
|---|---|---|---|---|---|---|---|---|
| KC* | Srea Ambel District, Koh Kong Province | 2017 | 18.3% | 27 m | 10.6% | 9342 | 43,042 | 2266.1 km2 |
| KM* | Koh Sothin District, Kampong Cham Province | 2015 | 16.8% | 3 m | 77.8% | 3620 | 16,283 | 61.8 km2 |
| NN* | Son Thok District, Kampong Thom Province | 2003 | 10.9% | 9 m | 53.9% | 3864 | 25,732 | 96.5 km2 |
Note: KC*: Ket Construction Co., Ltd.; KM*: Mr. Khorn Menghong Water Supply; and NN*: Mr. Norng Narath Water Supply.
Table 3.
National water quality standards for selected parameters in Cambodia, 2015 [26].
Table 3.
National water quality standards for selected parameters in Cambodia, 2015 [26].
| Parameters | Standard Value | Minimum Detection Limit |
|---|---|---|
| Turbidity [25] | 5 NTU | 0.01 NTU |
| Residual free chlorine [25] | 0.10 mg/L | 0.02 mg/L |
| Water supply pressure [26] | 0.05 MPa | 0.005 MPa |
Table 4.
Water sources of households in the KM and MM service areas (multiple choice).
| PWSOs | Water Sources | ||||
|---|---|---|---|---|---|
| Piped Water | Bottled Water | Rainwater | Well Water | Surface Water | |
| KM | 79.2% | 47.9% | 83.3% | 20.8% | 0.0% |
| NN | 60.7% | 49.2% | 16.4% | 62.3% | 8.2% |
Table 5.
The ratio of operation and maintenance expenditure to revenue in 2020.
| PWSOs | Ratio of Operation and Maintenance Expenditure to Revenue (%) | |||||||
|---|---|---|---|---|---|---|---|---|
| Personnel | Electricity | Fuel | Chemicals | Maintenance | Depreciation | Administration | Operating Ratio | |
| KC | 9.7 | 29.2 | 2.4 | 1.1 | 2.9 | 0 | 1.5 | 46.8 |
| KM | 12.2 | 7.3 | 0.7 | 1.4 | 1.4 | 0 | 1.8 | 24.8 |
| NN | 6.4 | 0.5 | 0.4 | 2.5 | 1.6 | 9.6 | 0.8 | 21.8 |
Table 6.
Maintenance frequency of water distribution networks in 2020.
| PWSOs | Maintenance Frequency in 2020 | ||||
|---|---|---|---|---|---|
| Cleaning Water Meters | Relocating Water Meters | Changing Water Meter | Leakages | Repairing Service Pipes | |
| KC | 27 | 14 | 7 | 136 | 69 |
| KM | 0 | 131 | 34 | 67 | 24 |
| NN | 112 | 67 | 120 | 48 | 140 |
Publisher’s Note: MDPI stays neutral with regard to jurisdictional claims in published maps and institutional affiliations. |
© 2022 by the authors. Licensee MDPI, Basel, Switzerland. This article is an open access article distributed under the terms and conditions of the Creative Commons Attribution (CC BY) license (https://creativecommons.org/licenses/by/4.0/).
Share and Cite
MDPI and ACS Style
Phea, S.; Kazama, S.; Takizawa, S. Performance Assessment for Increasing Connection Rates of Private Water Supply Operators in Cambodia. Water 2022, 14, 2369. https://doi.org/10.3390/w14152369
AMA Style
Phea S, Kazama S, Takizawa S. Performance Assessment for Increasing Connection Rates of Private Water Supply Operators in Cambodia. Water. 2022; 14(15):2369. https://doi.org/10.3390/w14152369
Chicago/Turabian StylePhea, Sinat, Shinobu Kazama, and Satoshi Takizawa. 2022. "Performance Assessment for Increasing Connection Rates of Private Water Supply Operators in Cambodia" Water 14, no. 15: 2369. https://doi.org/10.3390/w14152369
Note that from the first issue of 2016, this journal uses article numbers instead of page numbers. See further details here.