Article

Analysis of Water Environment Quality Changes and Influencing Factors during the “Thirteenth Five-Year Plan” Period in Heilongjiang Province

1
Heilongjiang Ecological Environment Monitoring Center, Harbin 150056, China
2
China Association of Environmental Protection Industry, Beijing 100037, China
3
China National Environmental Monitoring Centre, Beijing 100012, China
*
Authors to whom correspondence should be addressed.
These authors contributed equally to this work and should be regarded as co-first authors.
Water 2022, 14(15), 2367; https://doi.org/10.3390/w14152367
Submission received: 24 April 2022 / Revised: 13 July 2022 / Accepted: 16 July 2022 / Published: 31 July 2022

Abstract

:
Heilongjiang Province is located in the northeastern part of China and is the province with the highest latitude in China. As Heilongjiang Province is the most important grain production base in China, the Chinese government attaches great importance to the quality of the ecological environment in Heilongjiang Province, especially the analysis of changes in the quality of the water environment and their driving factors. We studied the changes in the environmental quality of surface water in Heilongjiang Province during the “13th Five-Year Plan” period (2016–2020), and analyzed the surface water for four major pollutants including the permanganate index, chemical oxygen demand, ammonia nitrogen and total phosphorus, and the change trends of the proportion of the water quality of class I–III and the proportion of the water quality of inferior class V. The results show that the environmental quality of surface water in Heilongjiang Province has improved significantly during the “13th Five-Year Plan”. The analysis of the driving factors of the change of surface water environment quality shows that the population, the primary industry, the tertiary industry and forestry are the main factors affecting the change of water environment quality in Heilongjiang Province.

1. Introduction

Located in northeastern China, Heilongjiang Province is the northernmost, easternmost and highest latitude province in China. Its north and east are separated from Russia across Heilongjiang River, its west is adjacent to the Inner Mongolia Autonomous Region, and its south is bordered by Jilin Province. With a total land area of 473,000 Km2, Heilongjiang Province is the sixth largest province in China. The geographical location and water system of Heilongjiang Province are shown in Figure 1.
The period from 2016 to 2020 was the time when China implemented the Outline of the Thirteenth Five-Year Plan for National Economic and Social Development of the People’s Republic of China, hereinafter referred to as the “Thirteenth Five-Year Plan” period. During this period, the government of Heilongjiang Province focused on the improvement of the Songhua River Basin. All 44 black and odorous water bodies were treated, 72 industrial parks realized centralized sewage treatment, and 43 water source protection areas were all rectified for environmental problems. These results demonstrate the determination of Heilongjiang Province to improve the surface water environment.
At present, scholars’ research on the surface water environment mainly focuses on the investigation and monitoring of new pollutants. For example, the research of Meng Qiao et al. (2022) showed that OPAHs exist preferentially in the water environment and pose a non-negligible ecological risk to the surface water ecosystem [1]. Hai-Yan Zou et al. (2021) studied the characteristics of antibiotic resistance genes (ARGs) in surface water affected by mining, and the results show that heavy metals from mining activities have significant effects on ARGs in surface water to varying degrees [2]. Nina Henning et al. (2021) detected GBP-Lactam, NA-GBP and CCHA at levels up to 260 ng/L in the Rhine River and its tributaries, suggesting monitoring of these compounds in drinking water [3]. Silvia Galafassi et al. (2019) reported on microplastic emissions, listing all identified sources of microplastic waste to date and a quantitative assessment of environmental inputs to surface water [4]. G. Sammut et al. (2017) conducted an extensive survey of perfluoroalkyl substances (PFAS) in surface waters of the Maltese Islands and the results show that all surface water samples are contaminated with at least one PFAS, with PFOS and PFOA detected in surface water at 100% and 95%, respectively [5].
In addition to increased monitoring of new pollutants, researchers have proposed a number of methods in recent years that may improve surface water monitoring. For example, Koyel Sur et al. (2021) conducted a pilot study in northwestern India, and he used green and shortwave-infrared (SWIR) bands to modify the Modified Normalized Difference Water Index (MNDWI) method, using this method to monitor the environmental quality of surface water [6]. The monitoring data can be processed and displayed using the Google Earth Engine (GEE) platform. Sama Azadi et al. (2021) conducted continuous monitoring of surface water around a new highway in southern Norway; he used the Gamma Test theory (GTT) method to optimize the water quality monitoring network (WQMN) of the road so that WQMN can be suitable for projects with limited design and construction time and budget or projects lacking sufficient data [7]. With the development of science and technology, there are more and more types of new pollutants, and their impact on the water environment is becoming more and more complex. Monitoring and research on new pollutants is often necessary. The development of science and technology will also lead to innovations in monitoring technology, and research on the testing and application scope of new technologies is also necessary to improve the level of environmental monitoring.
However, for a region as large as Heilongjiang Province, the introduction of new pollutants or new monitoring techniques into surface water monitoring should be carefully considered. This is because we are still at the stage of “little knowledge” about the sources of new pollutants and their impact on the ecological environment. At the same time, compared with the existing four major pollutants (permanganate index, chemical oxygen demand, ammonia nitrogen and total phosphorus), the representation of new pollutants in water environmental quality monitoring is still low. In addition, the application of new measurement technology requires a lot of preliminary evaluation work to ensure the stability, practicability and data accuracy of the technology. The new approach needs also to be approved by other provinces in China. Therefore, it is still applicable to use four main pollutants (permanganate index, chemical oxygen demand, ammonia nitrogen and total phosphorus) to characterize the overall water environment in Heilongjiang Province at this stage.
In recent years, research on the influencing factors of regional water environment quality has become an emerging topic at home and abroad. In terms of research methods, principal component analysis was used to analyze the water environment quality of the basin [8,9,10,11], and this method can be combined with other methods; the selection of influencing factors also enriches its research perspective. From the perspective of the scale of the study area, a small-scale study was also carried out, usually for a certain city. For example, Shexia Zhan et al. (2021) discussed the impact of natural factors and human activities on the source water quality in Macao based on the obtained statistical results [12]. The change of the regional water environment is a complex process affected by the comprehensive action of natural social and economic factors, and is the result of the interaction of the three systems of society, economy and ecology [13,14,15]. Factors such as climate, population, economy, transportation, energy consumption, water resources, agriculture and forestry are the main drivers of changes in the water environment. In the analysis of the correlation between water environmental quality and the three major systems, it tends to be large in scale, time and space, and the analysis direction changes from single target to multi-target, and develops from single factor to multi-factor, from static to dynamic, from the natural environment system to a complex natural and social environment system.
To sum up, many researchers have used different theories and methods to evaluate the regional water environment, making contributions to ecological and environmental protection, and the research results have a certain utility. However, most of the existing studies are limited to the influence of a certain factor on a single indicator or pollutant, and less attention is paid to the provincial perspective. Finally, there is a lack of analysis of the relationship between different water quality indicators and natural factors, socio-economic changes, etc., and a lack of tracking of driving factors. Therefore, this study attempts to answer the following research questions: (1) How will the water environment quality change in Heilongjiang Province during the 13th Five-Year Plan? Compared with the “Twelfth Five-Year Plan”, is the water quality better or worse? (2) What factors drive the change of water environment quality in Heilongjiang Province? What factors dominate? Exploring the changes in water environment quality and its influencing factors in the development process of the “Thirteenth Five-Year Plan” is not only of great practical significance for realizing the high-quality development of Heilongjiang Province, but also has certain reference value for other developing countries.

2. Materials and Methods
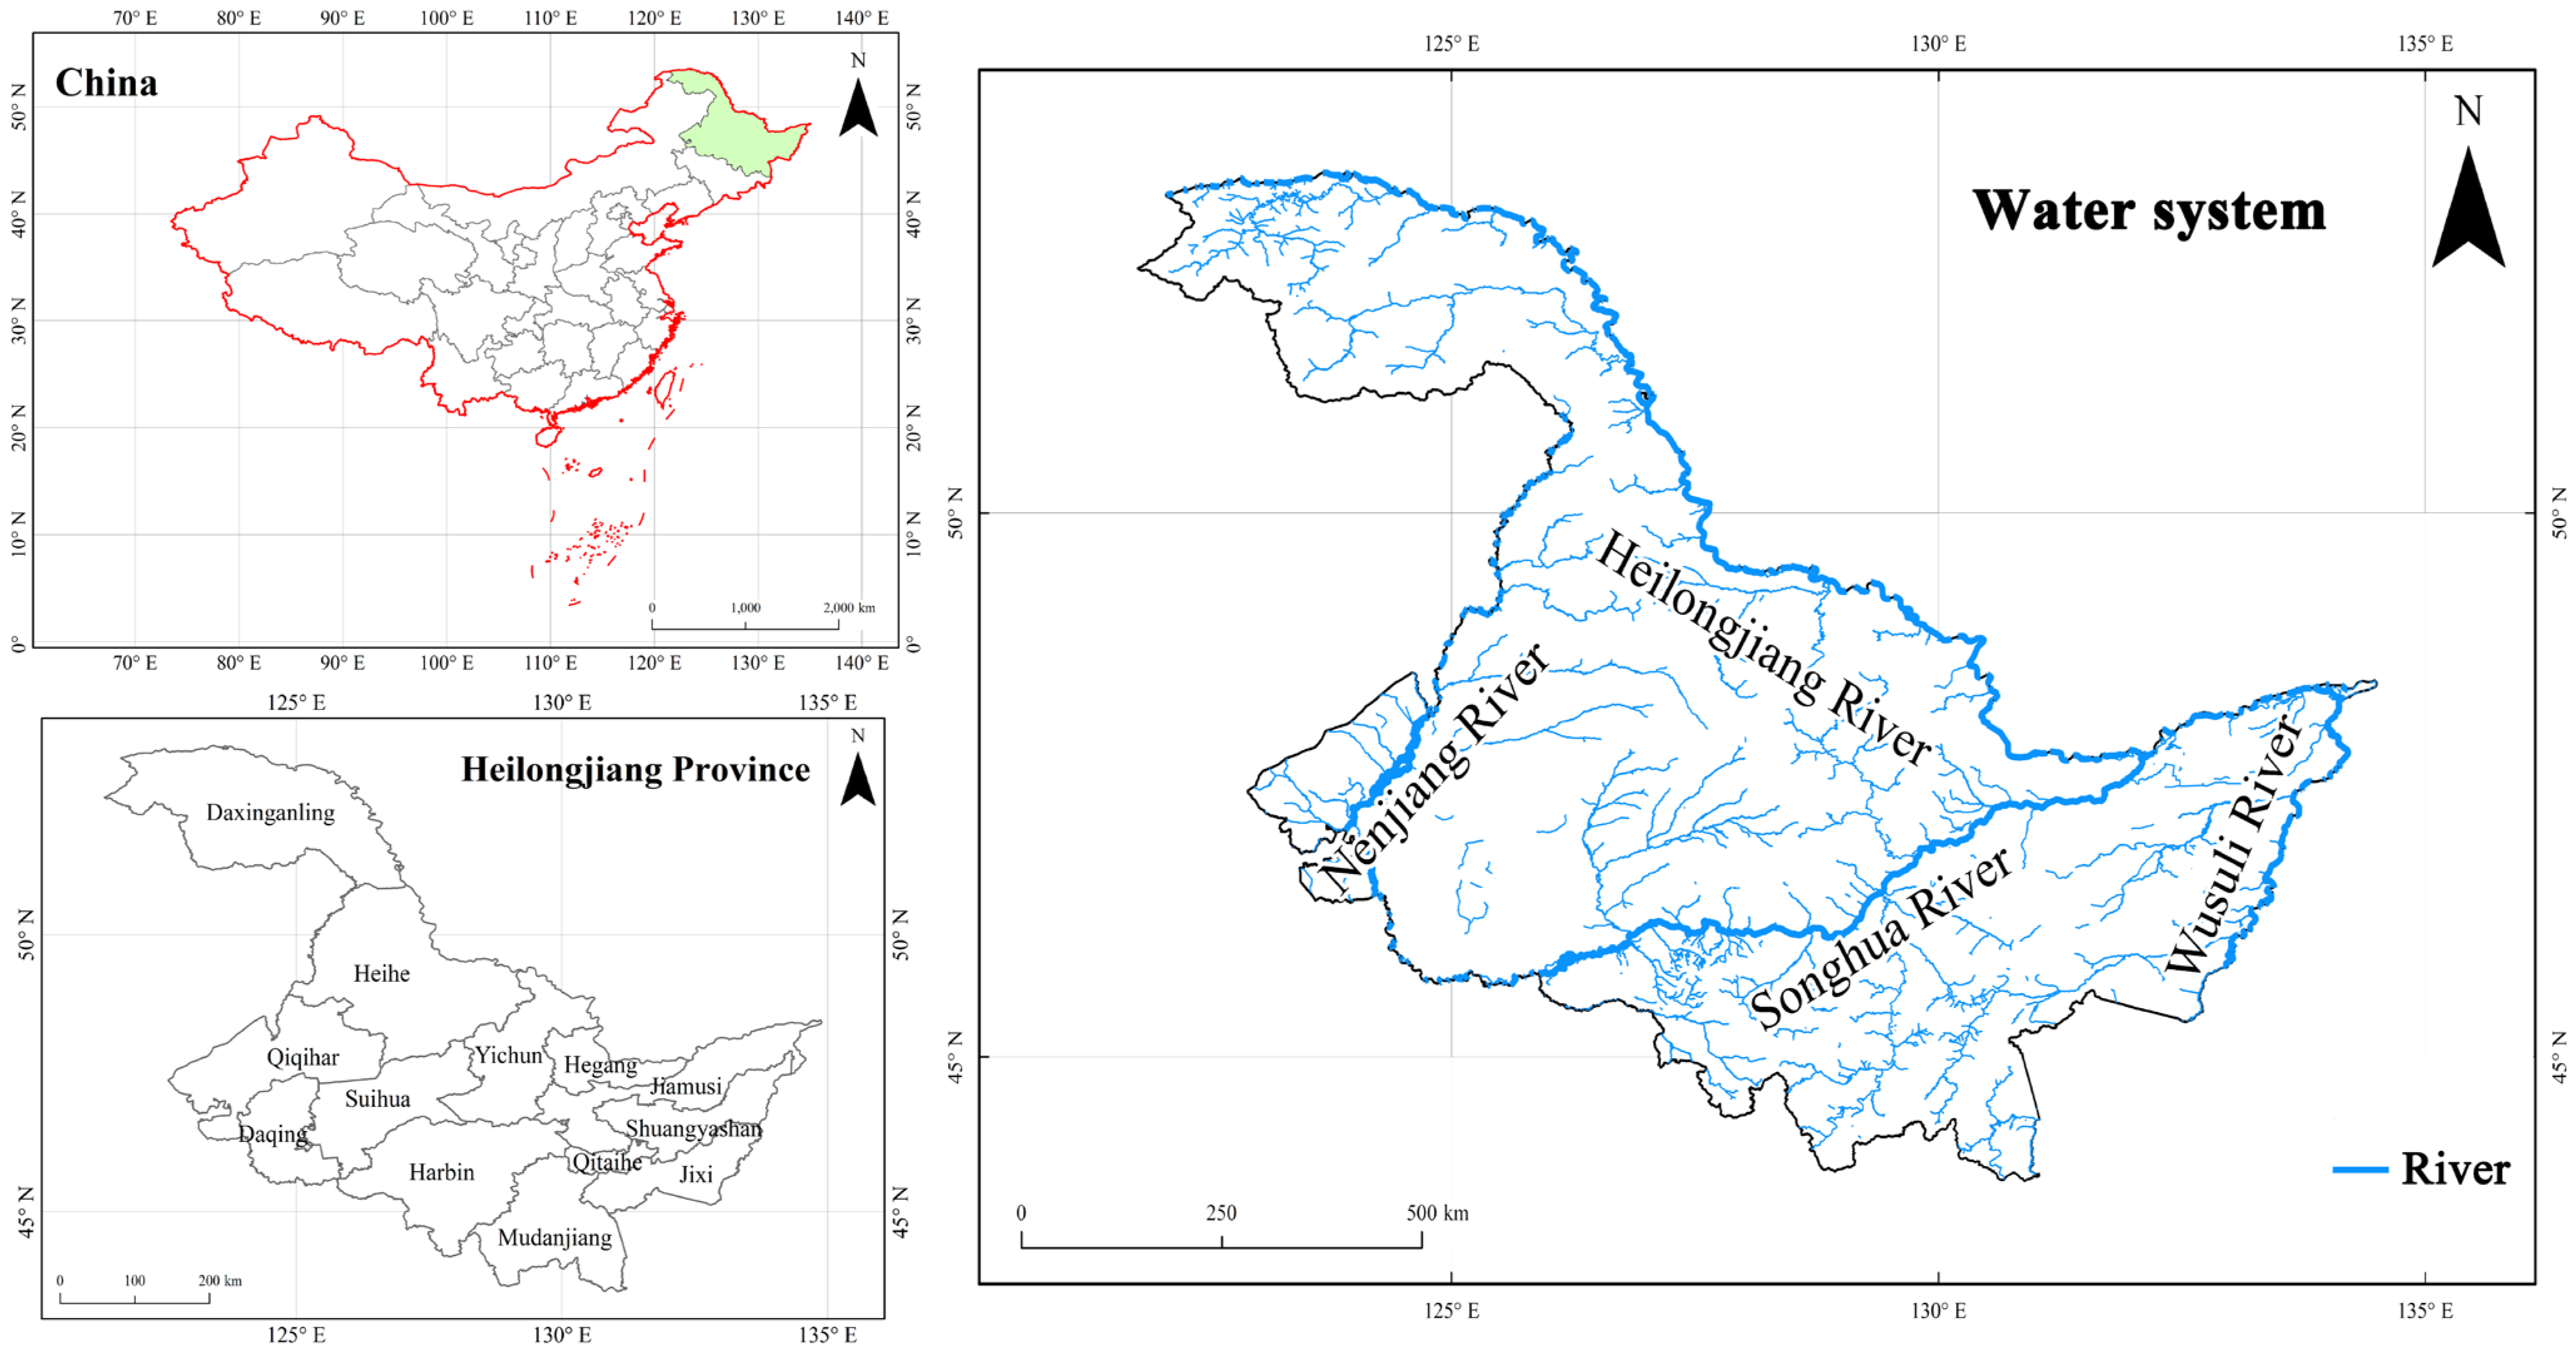
2.1. Study Area

The water system in Heilongjiang Province is well developed. There are four major river systems in Heilongjiang Province, which belong to the four major river systems of Heilongjiang, Songhua River, Ussuri River and Suifen River. Among them, Heilongjiang and Ussuri River are the international boundary rivers, Xingkai Lake is the international boundary lake, Suifen River directly enters the Sea of Japan, and Songhua River and Nen River run through Heilongjiang Province. Heilongjiang Province has 2881 rivers with a drainage area of more than 50.0 Km2, 93 rivers between 1000 and 10,000 Km2, and 18 rivers with an area of more than 10,000 Km2. There are 253 lakes with an annual water surface area of 1.0 Km2 and above, including 241 freshwater lakes and 12 saltwater lakes, with a total water surface area of 3037.0 Km2 (excluding the overseas area of transboundary lakes). The main lakes are Xingkai Lake, Jingbo Lake and Lianhuan Lake.

2.2. Research Methods and Data

The grey relational analysis belongs to the grey system theory, and it further studies the degree of correlation between the indicators through the similarity of the changes in the geometric shapes of the indicators [16]. The basic idea is to use the quantitative analysis of the dynamic process to calculate the correlation degree between the reference index and each comparison index in the system, and to determine the important factors that affect the reference index. It can describe the degree of correlation between variables despite incomplete information. The larger the correlation coefficient is, the closer is the relationship between the reference index and the comparison index, helping analysis of the positive factors that are conducive to the development of the system. Grey relational analysis is not limited by sample size and distribution, and is also applicable to data with short time span and irregularity. Since there is much unknown information about the mechanism of the impact of other factors on the quality of the ecological environment, it conforms to the characteristics of the grey system.
According to the characteristics of the data, it was divided into seven categories: climate, population, economy, energy, water resources, forestry, and agriculture. Among them, for the climate index we selected the average temperature, the average annual precipitation and the annual sunshine hours; for the population index we selected the population of Heilongjiang Province; for the economic index we selected the per capita GDP, primary industry, secondary industry, tertiary industry and local environmental protection expenditure; for the energy index we selected the elastic coefficient of energy consumption; for the water resources index we selected the surface water resources, the total surface water supply, the total groundwater supply, the total agricultural water use, the total ecological water consumption and the per capita water consumption; for the forestry index we selected the area of artificial afforestation in the current year; for the agricultural index we selected the pure amount of agricultural nitrogen fertilizer application, the pure amount of agricultural phosphorus fertilizer application, the pure amount of agricultural potassium fertilizer application and the amount of pesticide use; for the water environment index we selected permanganate index, chemical oxygen demand, ammonia nitrogen, total phosphorus and excellent water body proportion. The calculation method of grey relational analysis was adopted, and the details can be seen in Junli Li et al. (2020) research [17]. The data comes from the 2016–2020 “Eco-environmental Quality Status of Heilongjiang Province” [18,19,20,21,22], “Heilongjiang Province Eco-Environmental Quality Status Bulletin” [23,24,25,26,27], “Heilongjiang Ecological Environment Statistical Annual Report” [28,29,30], “China Statistical Yearbook 2020” [31]. The flow chart is shown in Figure 2. We can obtain the reference sequence and the comparison sequence, respectively:
Reference sequence: statistics related to climate, population, economy, energy, water resources, forestry and agriculture in Heilongjiang Province from 2006 to 2020.
Comparative sequence: the annual average values of permanganate index, chemical oxygen demand, ammonia nitrogen, total phosphorus and the proportion of excellent water bodies in Heilongjiang Province from 2006 to 2020.
In addition, in order to understand the impact of pollution discharge on water environment quality in Heilongjiang Province, the Spearman correlation analysis method was used to analyze the permanganate index, chemical oxygen demand, ammonia nitrogen and industrial source chemical oxygen demand discharge, industrial sources of ammonia nitrogen emissions, domestic sources of chemical oxygen demand emissions and domestic sources of ammonia nitrogen emissions in Heilongjiang Province from 2006 to 2019. The pollution emission data comes from the “2019 China Ecological Environment Statistical Yearbook” [32].

3. Results

3.1. Changes in the Environmental Quality of Surface Water during the “13th Five-Year Plan” Period

The proportions of water quality categories and changes in major pollutants in three different water stages of rivers in Heilongjiang Province From 2011 to 2020 can be seen in Table 1 and Table 2. Among them, during the “13th Five-Year Plan” period, the proportion of water quality of class I–III in the dry season is 52.0–74.0%, the proportion of water quality in class I–III in the normal water period is 62.6–69.2%, and the proportion of water quality in class I–III in the high water period is 26.4–64.5%. From 2016 to 2020, the change of the proportion of water quality of class I–III in each water period is in a trend of fluctuation, but from 2011 to 2020, except for the wet season, the change trend of the proportion of water quality of class I–III in other water periods is a significant increase. During the “Thirteenth Five-Year Plan” period, the proportion of water quality of inferior Class V in the dry season is 3.9–9.2%, the proportion of water quality of inferior Class V in the normal water season is 2.8–7.4%, and the proportion of water quality of inferior Class V in the wet season is 0.9–5.8%. From 2016 to 2020, the change trend of the dry season and the flat water season is a fluctuating one, and the proportion of water quality of inferior Class V in the wet season has dropped significantly. The proportion of water quality of inferior Class V during the dry season from 2011 to 2020 fluctuates, and the proportion of water quality of inferior Class V during the normal and wet seasons decreases significantly. The above results show that although the water quality in the dry, flat and wet periods does not improve significantly during the “13th Five-Year Plan” period, the number of water bodies with poor water quality in the wet period is significantly reduced. Compared with the “Twelfth Five-Year Plan” period (2011–2015), during the “Thirteenth Five-Year Plan” period, the water quality in the dry and flat water periods is significantly improved, and the number of water bodies with poor water quality in the flat and wet periods is significantly reduced.
The trend of major pollutants in rivers in Heilongjiang Province from 2011 to 2020 is shown in Table 3. During the “Thirteenth Five-Year Plan” period, the four major pollutants in Heilongjiang Province show a fluctuating trend. Compared with the end of the “Twelfth Five-Year Plan” (2015), the main pollution indicators of rivers in Heilongjiang Province, the permanganate index, chemical oxygen demand, ammonia nitrogen and total phosphorus pollution concentration decrease by 16.7%, 18.2%, 34.7% and 33.3% respectively, and the permanganate index, chemical oxygen demand, ammonia nitrogen and total phosphorus show a significant downward trend from 2011 to 2020. The above results show that the downward trend of the concentration of major pollutants during the “13th Five-Year Plan” period is not obvious, but compared with the “12th Five-Year Plan” period, the concentration of major pollutants has dropped significantly.

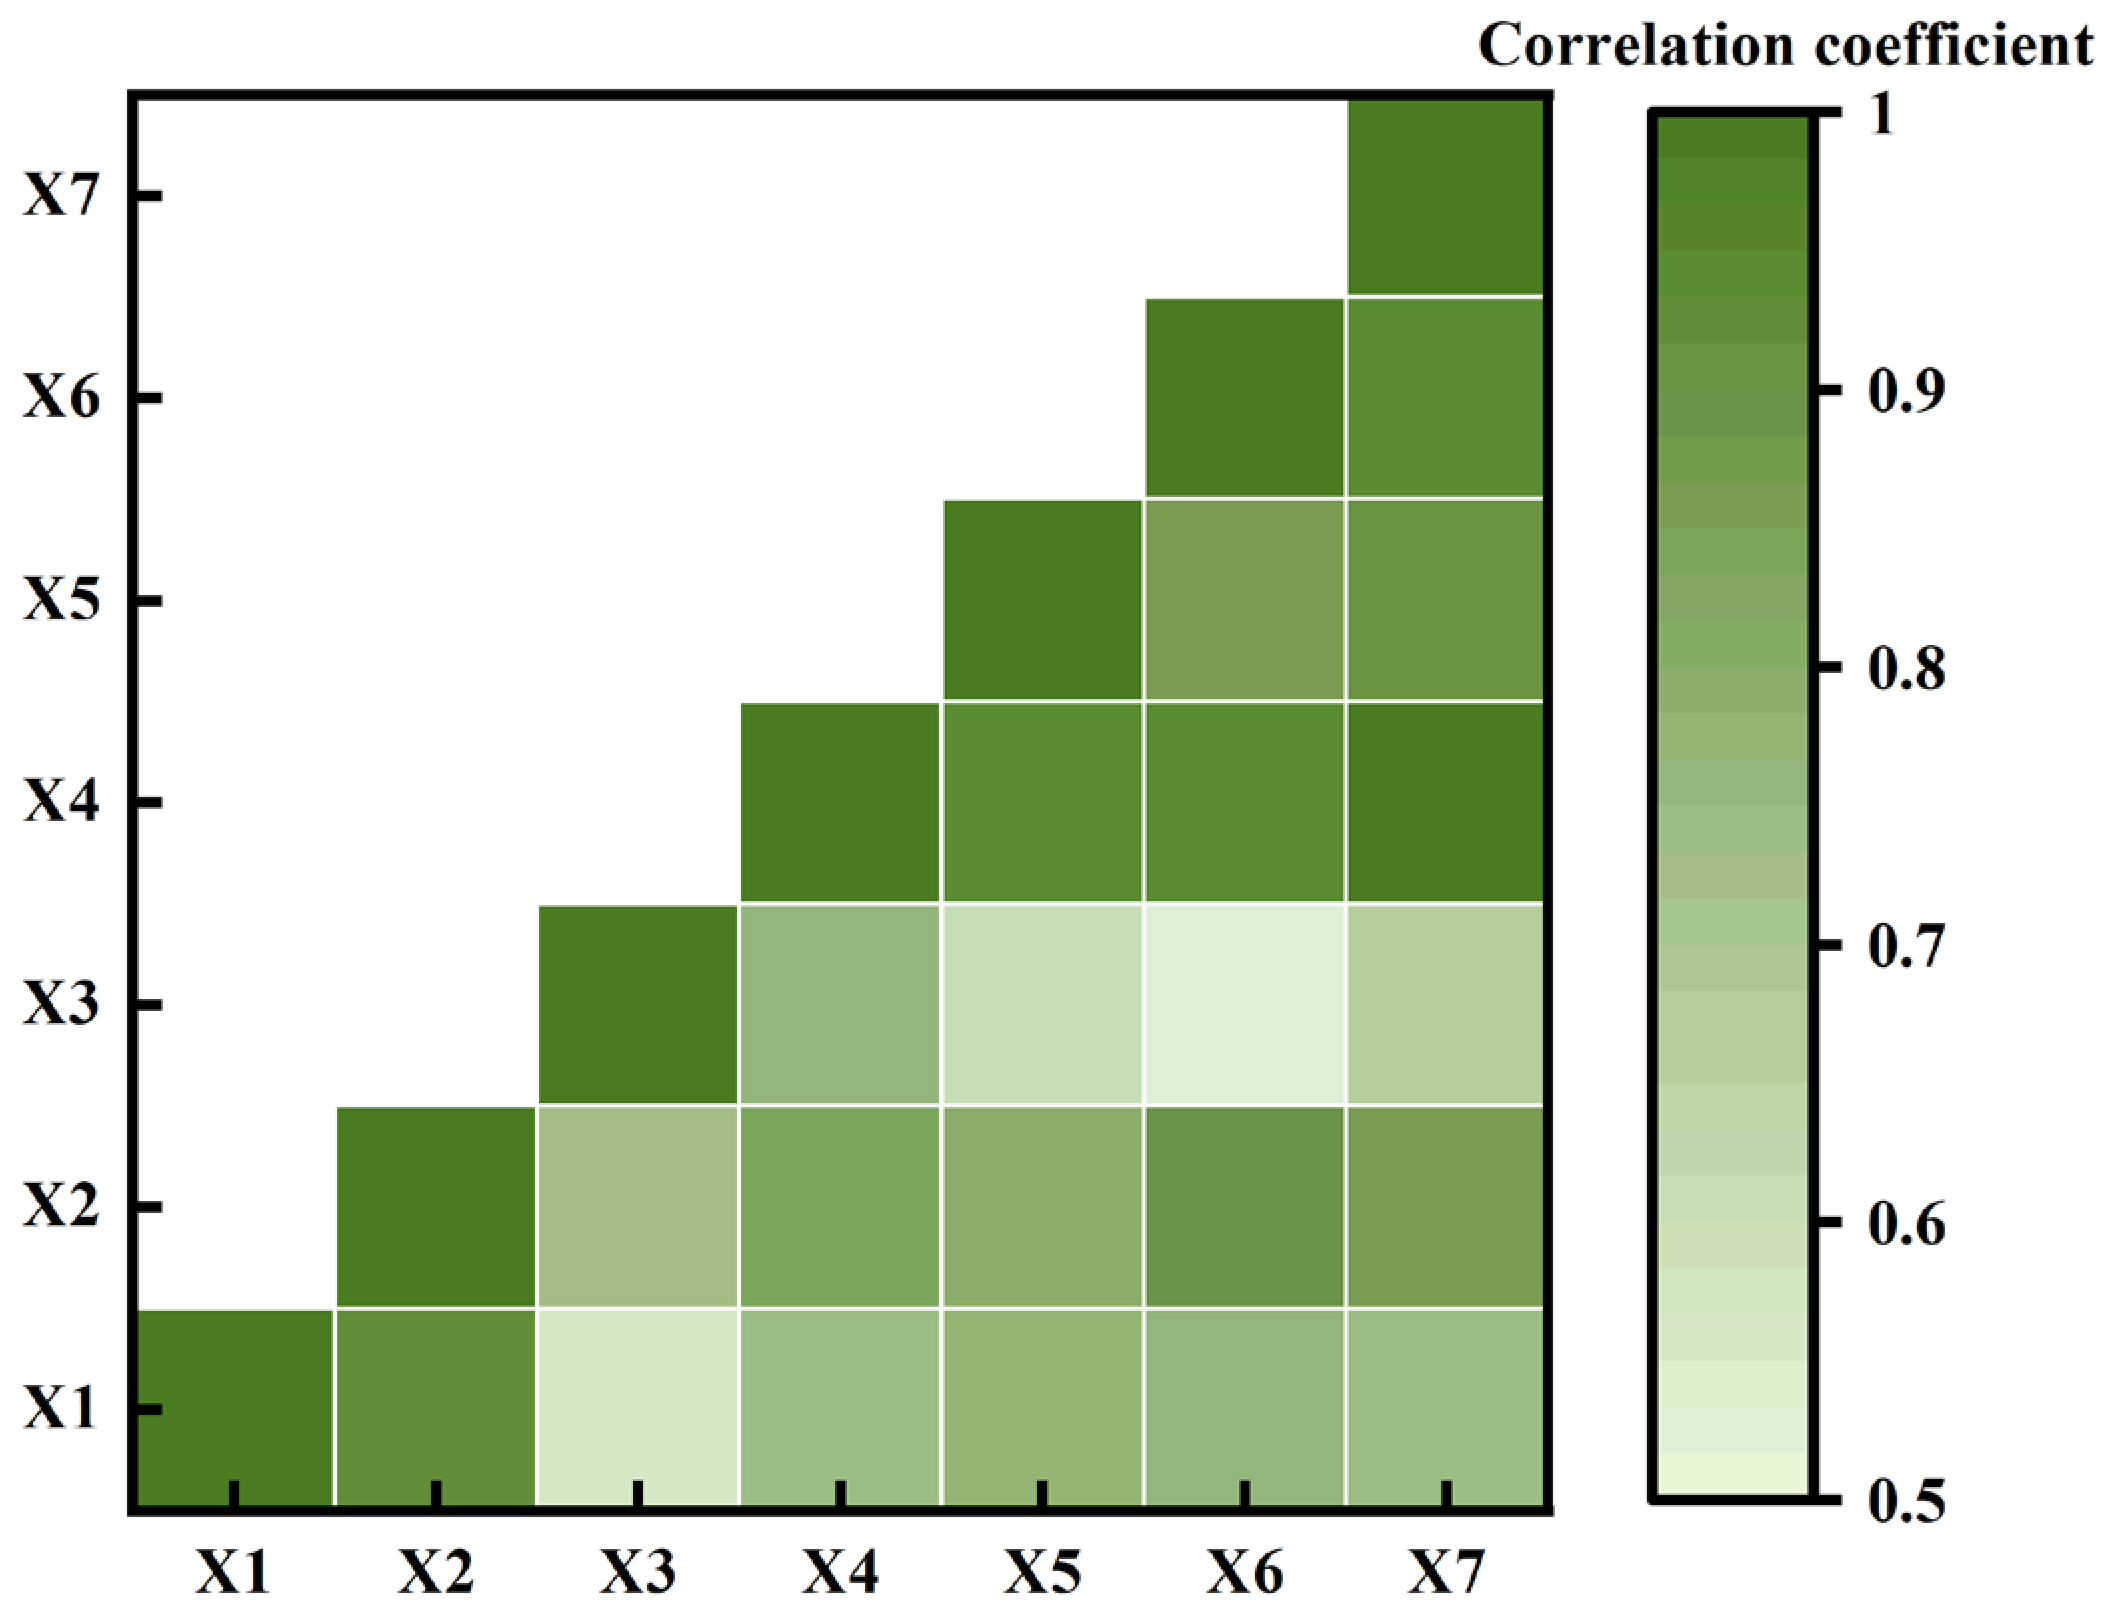
3.2. Correlation Analysis between Pollution Discharge and Surface Water Environmental Quality

The Spearman correlation coefficient was used to indicate the strength of the correlation between pollution discharge and major pollutants in the surface water environment, as shown in Figure 3. Among them, X1: surface water permanganate index, X2: surface water chemical oxygen demand, X3: surface water ammonia nitrogen, X4: industrial source chemical oxygen demand discharge, X5: industrial source ammonia nitrogen discharge, X6: living source chemical oxygen demand emissions, X7: ammonia nitrogen emissions from living sources. The results show that surface water permanganate index, chemical oxygen demand, ammonia nitrogen and industrial source chemical oxygen demand, ammonia nitrogen emission, living source chemical oxygen demand and ammonia nitrogen emission are all positively correlated. Among them, the permanganate index has a significant positive correlation with the chemical oxygen demand of industrial sources, chemical oxygen demand of living sources and ammonia nitrogen emissions from living sources, and has a very significant positive correlation with ammonia nitrogen emissions from industrial sources. The chemical oxygen demand of surface water has a very significant positive correlation with industrial source chemical oxygen demand, ammonia nitrogen, and living source chemical oxygen demand and ammonia nitrogen. There was a significant positive correlation between surface water ammonia nitrogen and chemical oxygen demand of industrial sources and ammonia nitrogen emissions from domestic sources.

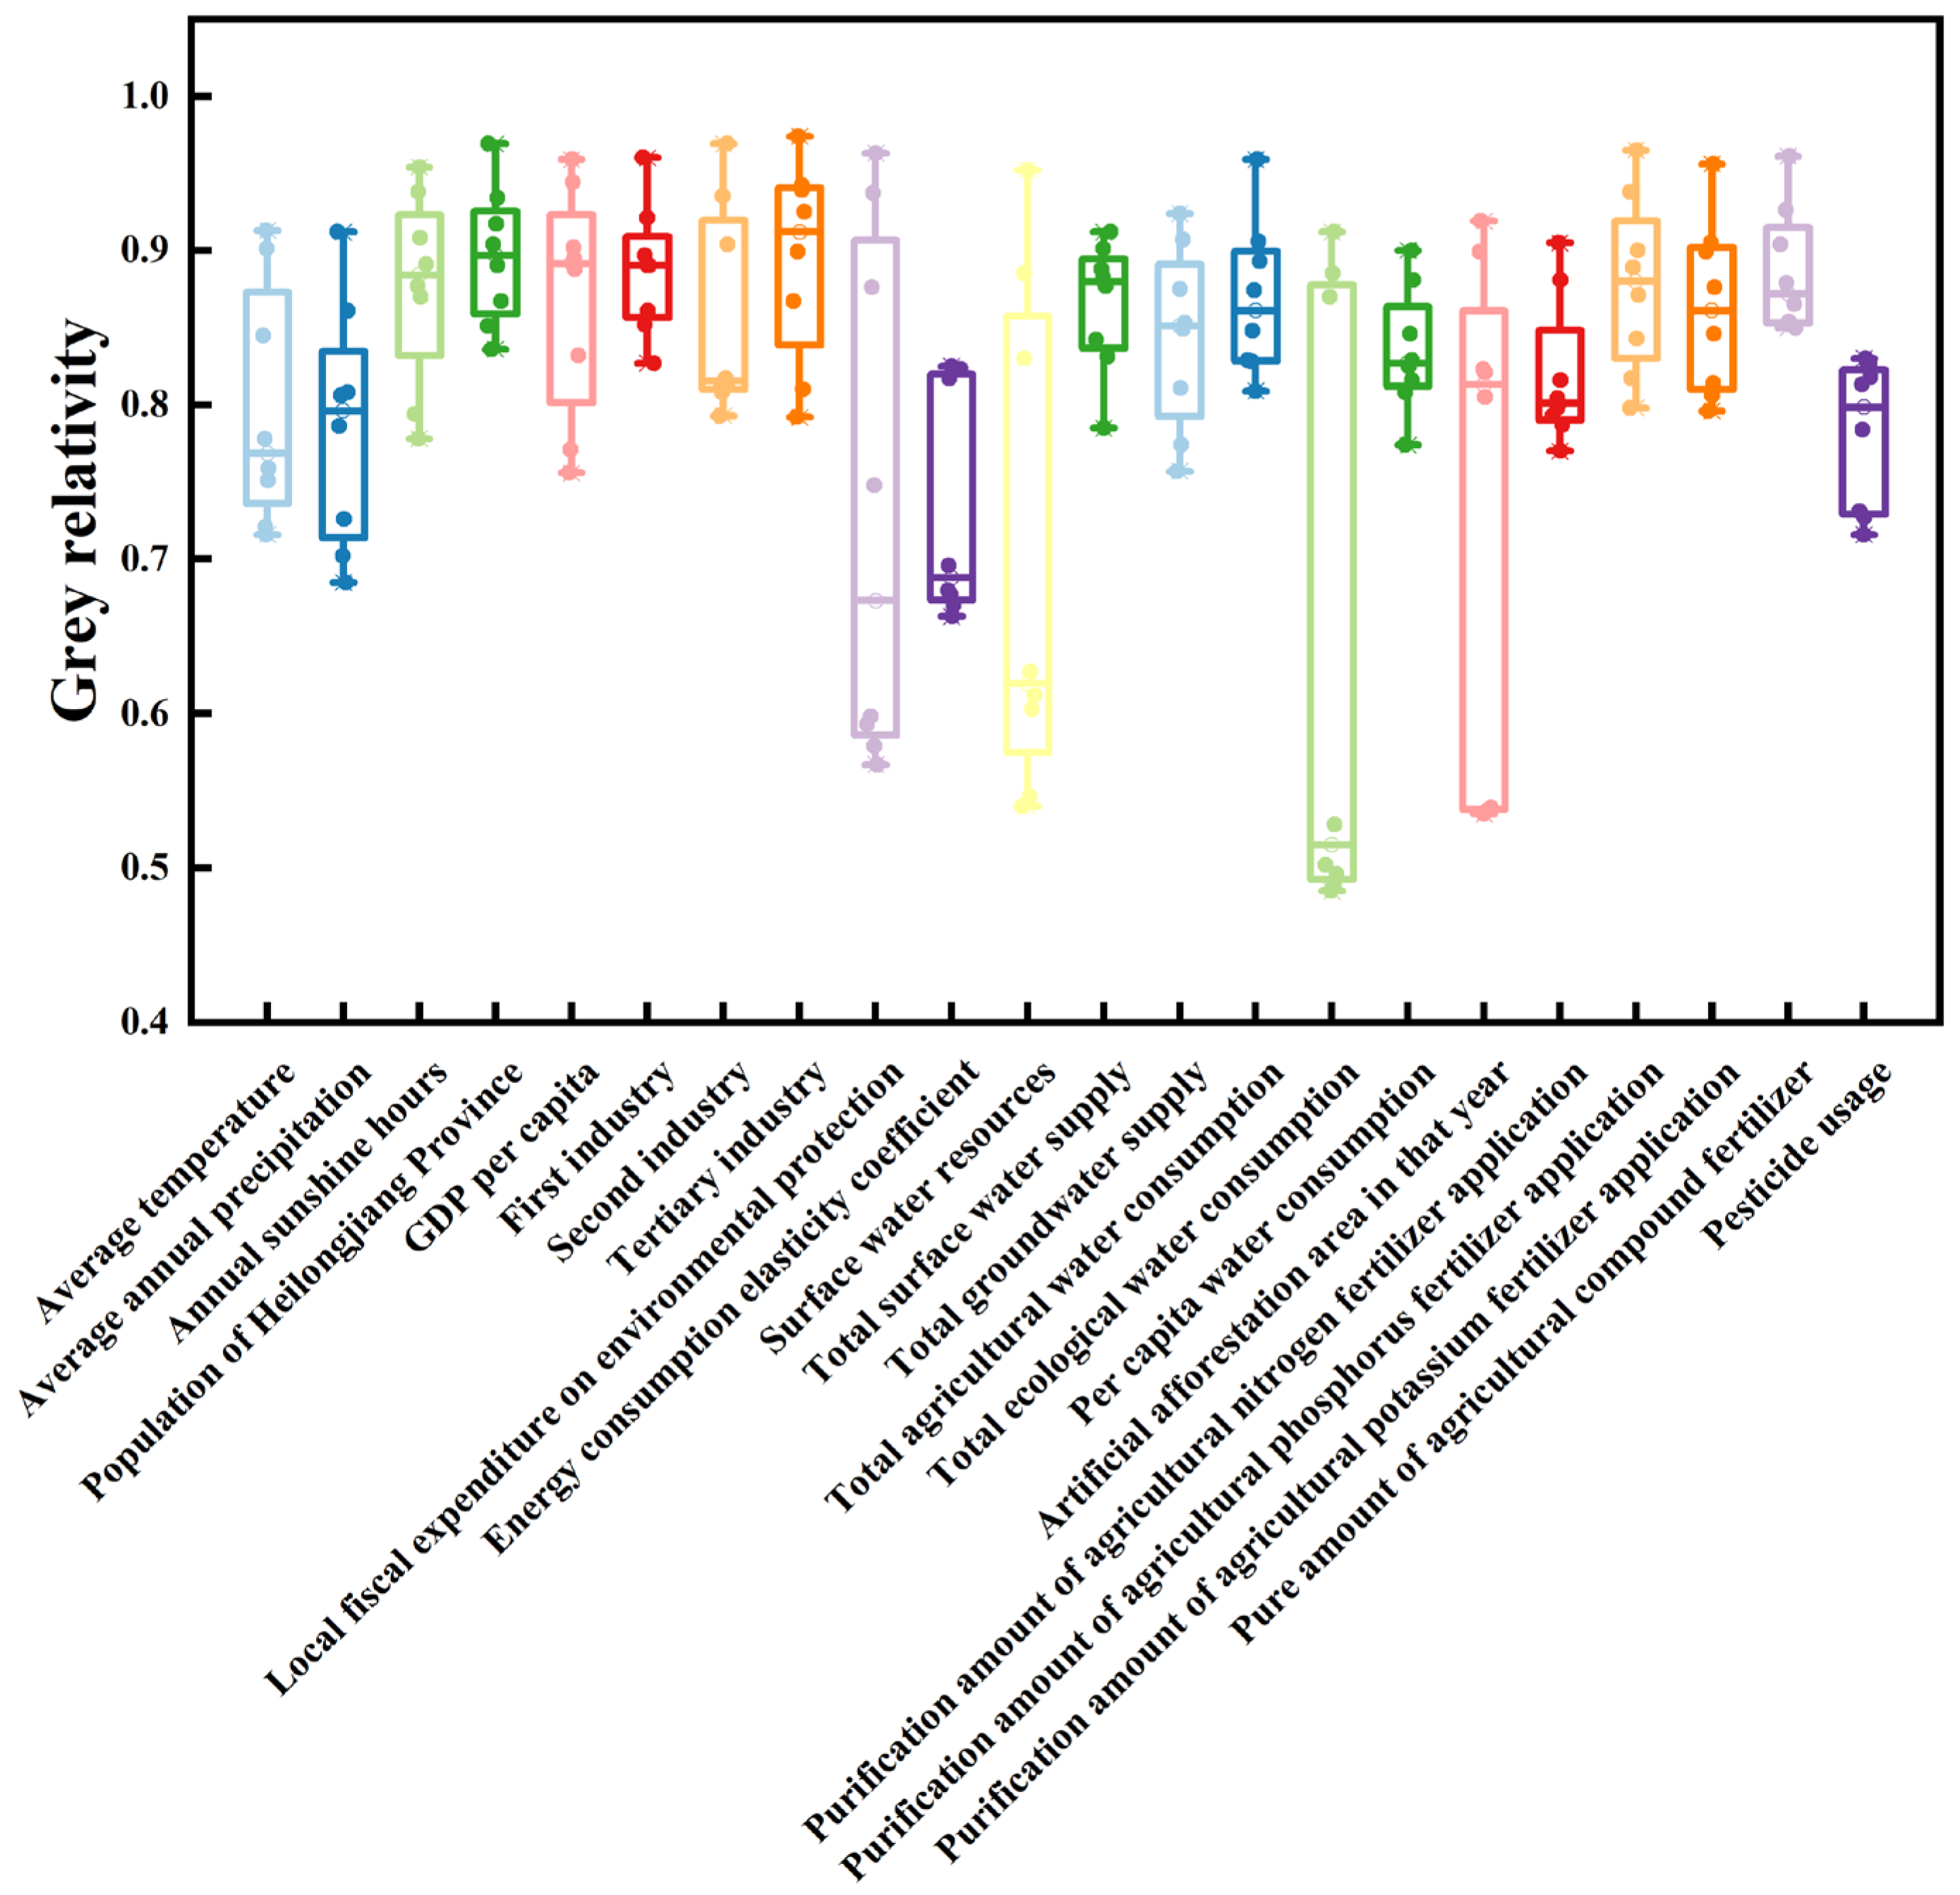
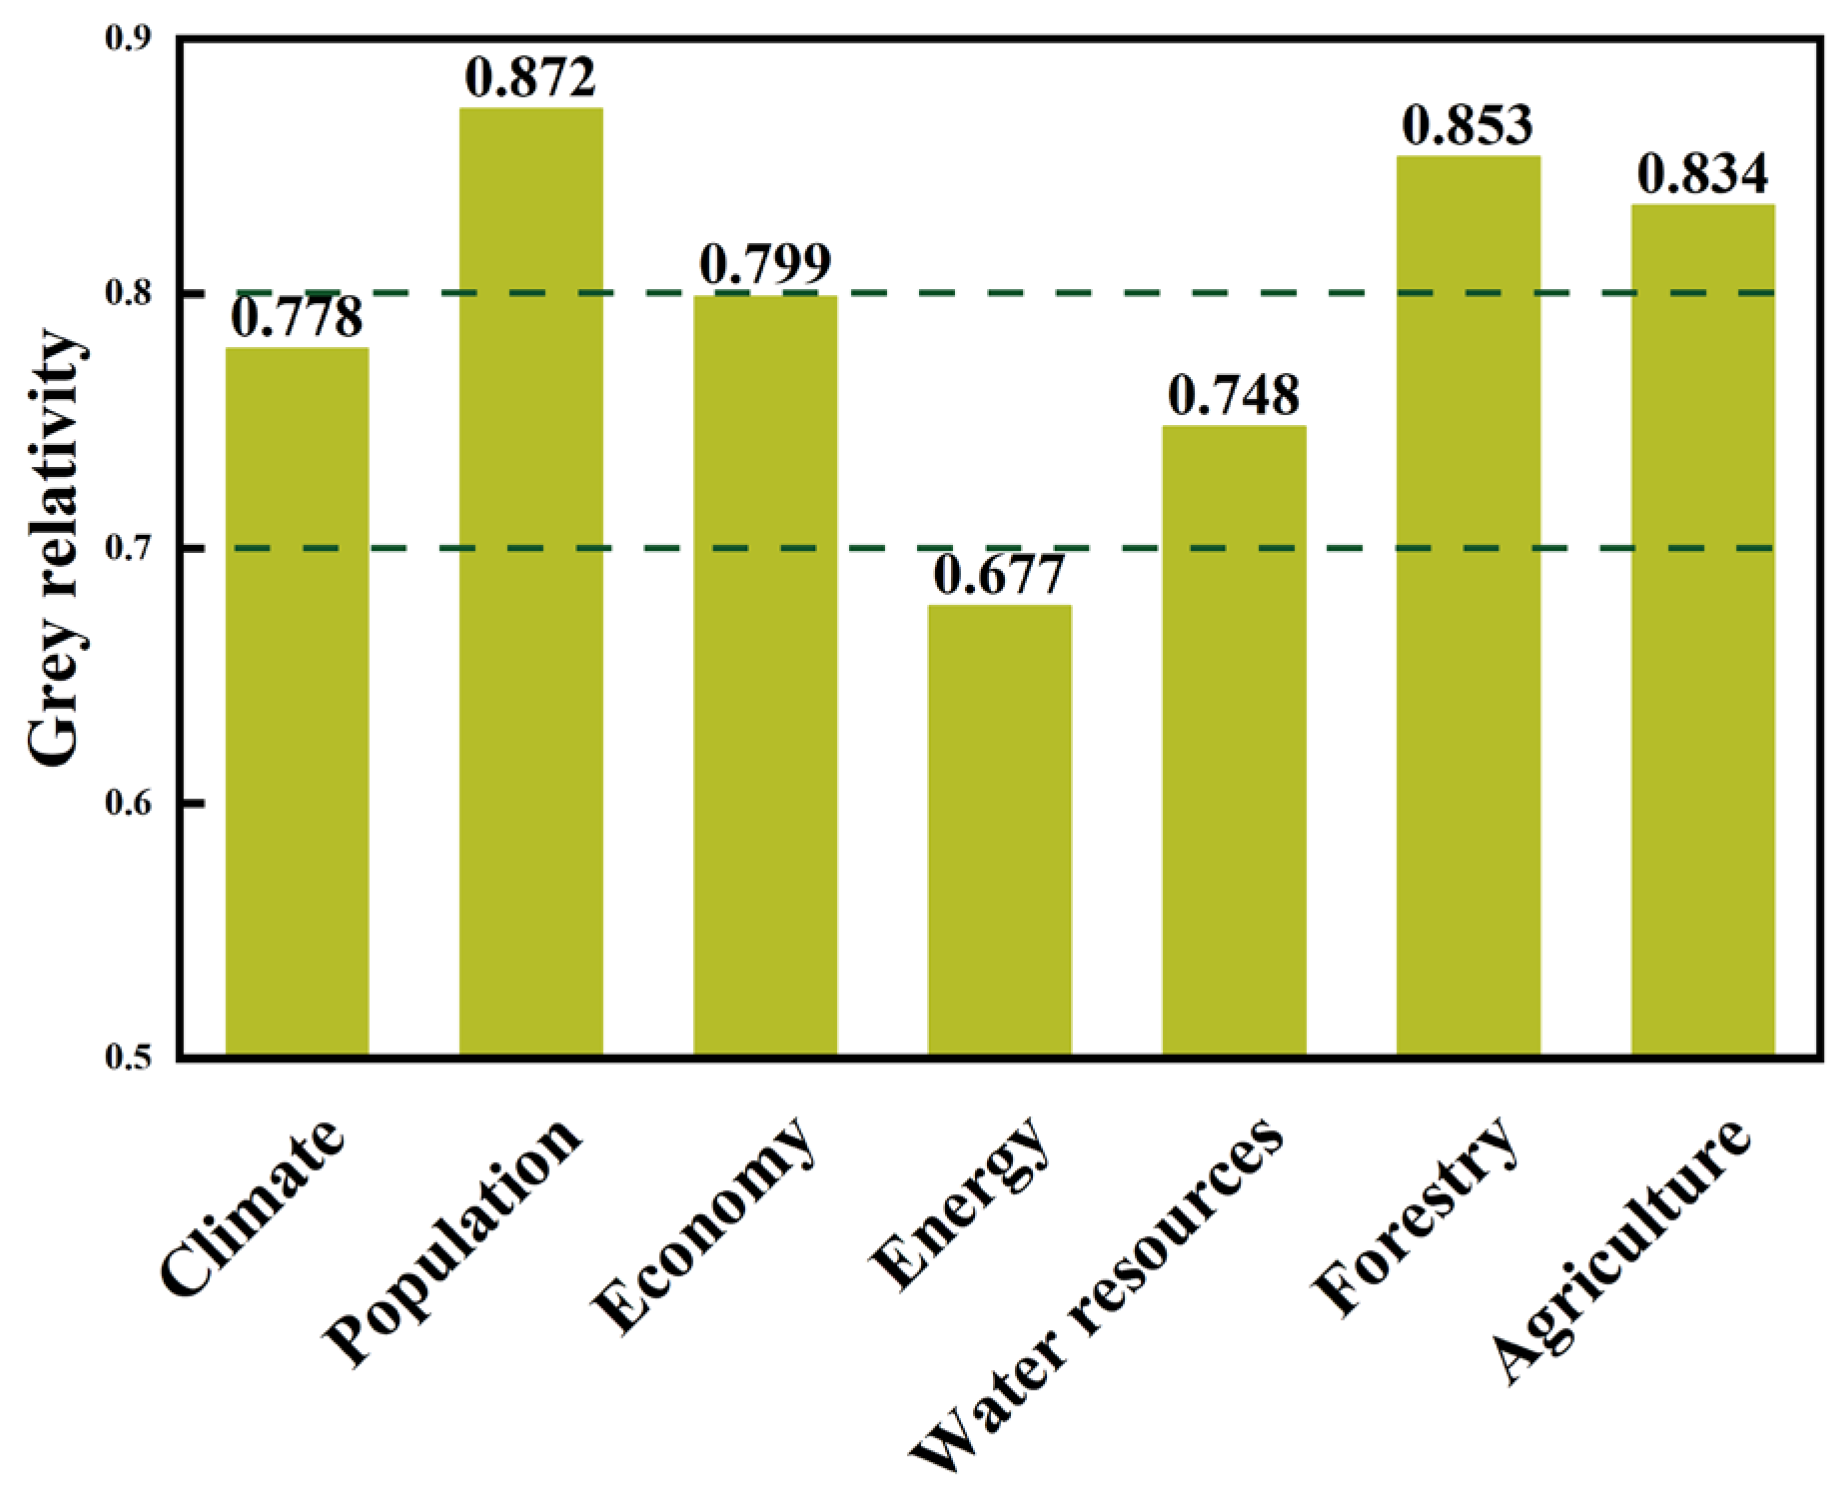
3.3. Correlation Analysis between Surface Water Environmental Quality and Other Factors

The grey correlation degree and its ranking of the surface water environmental quality comparison series are shown in Table S2 (Supporting Information). Specifically, the influencing factors with high correlation with the permanganate index are: the tertiary industry, the population of Heilongjiang Province, and net application amount of agricultural compound fertilizer. The influencing factors with a high degree of correlation with chemical oxygen demand are: tertiary industry, the area of artificial afforestation in the current year and the annual sunshine hours. The influencing factors with a high degree of correlation with ammonia nitrogen are: total surface water supply, pure amount of agricultural nitrogen fertilizer application, and per capita water consumption. The influencing factors with high correlation with total phosphorus are: total surface water supply, pure nitrogen fertilizer application and per capita water consumption. The influencing factors with high correlation with the proportion of excellent water quality are: primary industry, annual sunshine hours and tertiary industry.
In order to comprehensively evaluate the correlation between surface water environmental quality and various factors, the average method was used to evaluate the correlation index. There are 3 factors in the category of high correlation degree, which are population, forestry and agriculture in descending order of average degree of correlation, and 3 factors in the category of medium correlation degree, which are economy, meteorology and water resources in descending order of average degree of correlation. The factor in the category of low correlation degree is energy. The correlation statistics of each reference sequence are shown in Figure 4, and the average value is shown in Figure 5.
  • High correlation factor
The average grey correlation between population factors and water environment quality in Heilongjiang Province is 0.872, ranking first among the seven categories of factors, showing a very high correlation. Among the seven categories of factors, population has the greatest impact on water quality. The average grey correlation between forestry factors and water environment quality in Heilongjiang Province is 0.853, ranking second among the seven categories of factors, showing a very high correlation. The average grey correlation between agricultural factors and water environment quality in Heilongjiang Province is 0.834, ranking third among the seven categories of factors, showing a very high correlation.
  • Medium correlation factor
The average grey correlation degree between economic factors and water environment quality is 0.799, and the correlation degree is moderate. Among them, the primary industry, the tertiary industry, the per capita GDP, the secondary industry and the water environment quality are highly correlated, and the local financial environmental protection expenditure is low. The average grey correlation degree between climatic factors and water environment quality is 0.778, and the correlation degree is moderate. Among the climatic factors, the correlation degree of annual sunshine hours is greater than average temperature and precipitation, which is similar to ambient air quality. The average grey correlation degree between water resource factors and water environment quality is 0.748, and the correlation degree is medium. The average grey correlation degree of each factor in the water resources factor and the water environment quality is in descending order: total surface water supply, per capita water consumption, total agricultural water consumption, total groundwater water supply, surface water resources and total ecological water consumption quantity. Among them, the total surface water supply, per capita water consumption, total agricultural water supply and total groundwater supply are highly correlated with the environmental quality of surface water, while surface water resources and total ecological water are poorly correlated.
  • Low correlation factor
The average grey correlation between energy factors and water environment quality is 0.677, which is low. Among them, the energy consumption elasticity coefficient has a low correlation with the permanganate index, chemical oxygen demand, ammonia nitrogen, total phosphorus and the proportion of good water quality.

4. Discussion

During the “Thirteenth Five-Year Plan” period, the proportion of water quality of Class I–III increased, and the proportion of water quality of inferior Class V and the concentration of major pollutants decreased, indicating that the Heilongjiang Provincial Government’s continuous “clear water defense war” has achieved remarkable results, mainly including continuous encryption monitoring and special inspection of law enforcement to ensure that inferior water bodies such as Ash River, Waken River, and Indus River do not rebound. In addition, through inter-departmental linkages to carry out special actions and cross-monitoring of water quality, the treatment of 44 black and odorous water bodies has been completed [33].
The primary industry has the greatest impact on the proportion of good water quality, and the primary industry refers to farmers and agriculture, forestry, animal husbandry, fishery, etc. As a major agricultural province, Heilongjiang Province has four major water systems flowing through a large amount of farmland. The surface water near the farmland is greatly affected by agricultural activities, resulting in the pollution of downstream waters [34]. This is consistent with the research results that the application rate of agricultural chemical fertilizers has a great influence on the content of ammonia nitrogen and total phosphorus in surface water. Heilongjiang Province is located in the highest latitude area in China, with four distinct seasons of precipitation, and the precipitation in the wet season is much higher than that in other water seasons. Fluctuations in water quality of Class I–III during the wet season and industrial wastewater discharge have little effect on ammonia nitrogen concentration in surface water; domestic wastewater discharge and primary industry have a greater impact on surface water ammonia nitrogen concentration. These results show that the effluent from farmland water pollution caused by surface water runoff and pollution caused by domestic wastewater discharge are the main sources of ammonia nitrogen and total phosphorus pollution in surface water in Heilongjiang Province. Therefore, the surface water pollution caused by living sources and agricultural sources should be listed as the key work of the future surface water environment management in Heilongjiang Province [35].
The tertiary industry has a greater impact on the permanganate index, chemical oxygen demand and the ratio of good water quality. China’s tertiary industry is other than the primary and secondary industries, and includes water conservancy, environment and public facilities management, etc. [36]. Due to the increasing investment in environmental protection in Heilongjiang Province, this may be related to the increase in the number of sewage treatment plants [28,29,30], which means that the increase in sewage treatment capacity indirectly affects the quality of surface water in Heilongjiang Province [37]. This is consistent with the research results that local financial environmental protection expenditures have low correlations with permanganate index, chemical oxygen demand, ammonia nitrogen and total phosphorus, but are correlated with the proportion of good water quality. It shows that although the local financial environmental protection expenditure has little effect on the content of pollutants in surface water, it can affect the comprehensive situation of surface water quality in Heilongjiang Province.
Forestry factors are highly correlated with the environmental quality of surface water in Heilongjiang Province. The regulatory effect of forests on surface water is mainly due to the good water storage function and hydrological effect of the forest litter layer and soil layer. These effects will promote the improvement of water environment quality. Although there are certain differences between different forest lands, the regulatory effect of natural mixed forest is better than that of pure forest or artificial afforestation.
As further studies on the impact of land use patterns on surface water systems in recent years suggest that the contribution of forest drainage to surface water eutrophication may be greater than previously estimated [38,39], changes in forest surface runoff and the exposure of understory organic and inorganic layers can affect the concentrations of phosphorus, nitrogen, and dissolved organic carbon in surface waters [40]. The study by Lepistö et al. (2021) shows that the percentage of forest drainage is positively correlated with the total organic nitrogen in forest streams, which in turn is correlated with the total organic carbon concentration [41]. This shows that the impact of forests on the environmental quality of surface water is not only positive, but may have some negative effects, especially on chemical oxygen demand, which is consistent with our findings. In addition, some natural factors such as annual sunshine hours and total surface water supply also have a major impact on the surface water environment, which shows that in addition to human activities, the role of natural conditions cannot be ignored.

5. Conclusions

During the “Thirteenth Five-Year Plan” period, the annual average concentration of major pollutants in surface water in Heilongjiang Province has dropped significantly, the proportion of water quality of Class I–III has increased, the proportion of water quality inferior to Class V has decreased, and the overall environmental quality of surface water has improved. Research on the driving factors of water quality change shows that nitrogen and phosphorus pollutants in farmland surface water runoff and domestic sewage are the main sources leading to ammonia nitrogen and total phosphorus pollution in surface water in Heilongjiang Province. The increase of sewage treatment plants has a greater impact on the permanganate index, chemical oxygen demand and the proportion of good water quality, which indirectly affects the overall water quality of Heilongjiang Province. It is worth noting that the impact of forests on the environmental quality of surface water in Heilongjiang Province is complex and may lead to increased chemical oxygen demand in surface water. In addition, the influence of natural factors on the surface water environment, such as the total annual water supply and surface water supply in Rizhao City cannot be ignored.

Supplementary Materials

The following supporting information can be downloaded at: https://www.mdpi.com/article/10.3390/w14152367/s1, Table S1: Basic items of surface water environmental quality※ Standard limit. Table S2: Grey correlation degree and ranking of surface water environmental quality comparison series.

Author Contributions

Conceptualization, B.L. and W.C.; methodology, C.F.; software, C.F.; resources, W.C.; writing—original draft preparation, C.F.; writing—review and editing, Y.B. and M.Z.; visualization, C.F.; supervision, Y.B. All authors have read and agreed to the published version of the manuscript.

Funding

This research received no external funding.

Institutional Review Board Statement

Not applicable.

Informed Consent Statement

Not applicable.

Acknowledgments

We would like to thank the Heilongjiang Provincial Department of Ecology and Environment for providing data support for this study, and Fengying Zhang from China Environmental Monitoring Station for providing technical guidance for this paper.

Conflicts of Interest

The authors declare no conflict of interest.

References

  1. Qiao, M.; Qi, W.; Liu, H.; Qu, J. Oxygenated polycyclic aromatic hydrocarbons in the surface water environment: Occurrence, ecotoxicity, and sources. Environ. Int. 2022, 163, 107232. [Google Scholar] [CrossRef] [PubMed]
  2. Zou, H.-Y.; He, L.-Y.; Gao, F.-Z.; Zhang, M.; Chen, S.; Wu, D.; Liu, Y.; He, L.; Bai, H.; Ying, G. Antibiotic resistance genes in surface water and groundwater from mining affected environments. Sci. Total Environ. 2021, 772, 145516. [Google Scholar] [CrossRef] [PubMed]
  3. Henning, N.; Wick, A.; Ternes, T.A. Biotransformation of pregabalin in surface water matrices and the occurrence of transformation products in the aquatic environment—Comparison to the structurally related gabapentin. Water Res. 2021, 203, 117488. [Google Scholar] [CrossRef] [PubMed]
  4. Galafassi, S.; Nizzetto, L.; Volta, P. Plastic sources: A survey across scientific and grey literature for their inventory and relative contribution to microplastics pollution in natural environments, with an emphasis on surface water. Sci. Total Environ. 2019, 693, 133499. [Google Scholar] [CrossRef] [PubMed]
  5. Sammut, G.; Sinagra, E.; Helmus, R.; de Voogt, P. Perfluoroalkyl substances in the Maltese environment—(I) surface water and rain water. Sci. Total Environ. 2017, 589, 182–190. [Google Scholar] [CrossRef]
  6. Sur, K.; Verma, V.K.; Pateriya, B. Surface water estimation at regional scale using hybrid techniques in GEE environment—A case study on Punjab State of India. Remote Sens. Appl. Soc. Environ. 2021, 24, 100625. [Google Scholar] [CrossRef]
  7. Azadi, S.; Amiri, H.; Mooselu, M.G.; Liltved, H.; Castro-Muñoz, R.; Sun, X.; Boczkaj, G. Network design for surface water quality monitoring in a road construction project using Gamma Test theory. Water Resour. Ind. 2021, 26, 100162. [Google Scholar] [CrossRef]
  8. Haghnazar, H.; Johannesson, K.H.; González-Pinzón, R.; Pourakbar, M.; Aghayani, E.; Rajabi, A.; Hashemi, A.A. Groundwater geochemistry, quality, and pollution of the largest lake basin in the Middle East: Comparison of PMF and PCA-MLR receptor models and application of the source-oriented HHRA approach. Chemosphere 2022, 288, 132489. [Google Scholar] [CrossRef]
  9. Abdelaziz, S.; Gad, M.I.; el Tahan, A.H.M.H. Groundwater quality index based on PCA: Wadi El-Natrun, Egypt. J. Afr. Earth Sci. 2020, 172, 103964. [Google Scholar] [CrossRef]
  10. Abuzaid, A.S.; Jahin, H.S. Combinations of multivariate statistical analysis and analytical hierarchical process for indexing surface water quality under arid conditions. J. Contam. Hydrol. 2022, 248, 104005. [Google Scholar] [CrossRef]
  11. Elkorashey, R.M. Utilizing chemometric techniques to evaluate water quality spatial and temporal variation. A case study: Bahr El-Baqar drain—Egypt. Environ. Technol. Innov. 2022, 26, 102332. [Google Scholar] [CrossRef]
  12. Zhan, S.; Zhou, B.; Li, Z.; Li, Z.; Zhang, P. Evaluation of source water quality and the influencing factors: A case study of Macao. Phys. Chem. Earth Parts A/B/C 2021, 123, 103006. [Google Scholar] [CrossRef]
  13. Wang, S.; Fu, B.; Zhao, W.; Liu, Y.; Wei, F. Structure, function, and dynamic mechanisms of coupled human–natural systems. Curr. Opin. Environ. Sustain. 2018, 33, 87–91. [Google Scholar] [CrossRef]
  14. Ferro-Azcona, H.; Espinoza-Tenorio, A.; Calderón-Contreras, R.; Ramenzoni, V.C.; de las Mercedes Gómez País, M.; Mesa-Jurado, M.A. Adaptive capacity and social-ecological resilience of coastal areas: A systematic review. Ocean. Coast. Manag. 2019, 173, 36–51. [Google Scholar] [CrossRef]
  15. Griffin, M.T.; Montz, B.E.; Arrigo, J.S. Evaluating climate change induced water stress: A case study of the Lower Cape Fear basin, NC. Appl. Geogr. 2013, 40, 115–128. [Google Scholar] [CrossRef]
  16. Deng, J. Introduction to Grey System. J. Grey Syst. 1989, 1, 1–24. [Google Scholar]
  17. Li, J.; Song, H.; Sun, W.; Sun, P.; Hao, J. Measuring Performance and its influence factors of National Sustainable Development Pilot Zones in Shandong, China. J. Clean. Prod. 2020, 289, 125620. [Google Scholar] [CrossRef]
  18. Environmental Quality of Heilongjiang Province in 2016. Available online: http://sthj.hlj.gov.cn/hjzlbg/16863.jhtml (accessed on 1 April 2017).
  19. Environmental Quality Status of Heilongjiang Province in 2017. Available online: http://sthj.hlj.gov.cn/hjzlbg/16862.jhtml (accessed on 24 May 2018).
  20. Environmental Quality Status of Heilongjiang Province in 2018. Available online: http://sthj.hlj.gov.cn/hjzlbg/16876.jhtml (accessed on 1 February 2019).
  21. The Quality of Ecological Environment in Heilongjiang Province in 2019. Available online: http://sthj.hlj.gov.cn/hjzlbg/16875.jhtml (accessed on 10 February 2020).
  22. Eco-Environmental Quality Status of Heilongjiang Province in 2020. Available online: http://sthj.hlj.gov.cn/hjzlbg/18011.jhtml (accessed on 1 February 2021).
  23. 2016 Heilongjiang Province Environmental Status Bulletin. Available online: http://sthj.hlj.gov.cn/hjzlzkgb/19153.jhtml (accessed on 8 August 2017).
  24. 2017 Heilongjiang Province Environmental Status Bulletin. Available online: http://sthj.hlj.gov.cn/hjzlzkgb/19154.jhtml (accessed on 5 June 2018).
  25. 2018 Heilongjiang Province Ecological Environment Bulletin. Available online: http://sthj.hlj.gov.cn/hjzlzkgb/19155.jhtml (accessed on 4 June 2019).
  26. 2019 Heilongjiang Province Ecological Environment Bulletin. Available online: http://sthj.hlj.gov.cn/hjzlzkgb/19156.jhtml (accessed on 3 June 2020).
  27. 2020 Heilongjiang Province Ecological Environment Bulletin. Available online: http://sthj.hlj.gov.cn/hjzlzkgb/19492.jhtml (accessed on 4 June 2021).
  28. Heilongjiang Province Environmental Statistics Annual Report 2016. Available online: http://sthj.hlj.gov.cn/hjtj/12362.jhtml (accessed on 27 February 2018).
  29. Heilongjiang Province Environmental Statistics Annual Report 2017. Available online: http://sthj.hlj.gov.cn/hjtj/12364.jhtml (accessed on 18 March 2019).
  30. 2018 Annual Report of Ecological Environment Statistics of Heilongjiang Province. Available online: http://sthj.hlj.gov.cn/hjtj/12366.jhtml (accessed on 19 January 2020).
  31. National Bureau of Statistics. China Statistical Yearbook 2020; China Statistics Press: Beijing, China, 2021. [Google Scholar]
  32. National Bureau of Statistics, Ministry of Ecology and Environment. 2019 China Environmental Statistical Yearbook; China Statistics Press: Beijing, China, 2021. [Google Scholar]
  33. 2021 Government Work Report. Available online: https://www.hlj.gov.cn/n200/2021/0224/c68-11014966.html (accessed on 24 February 2021).
  34. Komariah, I.; Matsumoto, T. Application of Hydrological Method for Sustainable Water Management in the Upper-Middle Ciliwung (UMC) River Basin, Indonesia. J. Water Environ. Technol. 2019, 17, 203–217. [Google Scholar] [CrossRef] [Green Version]
  35. Mokarram, M.; Saber, A.; Sheykhi, V. Effects of heavy metal contamination on river water quality due to release of industrial effluents. J. Clean. Prod. 2020, 277, 123380. [Google Scholar] [CrossRef]
  36. Muhammad, S.; Pan, Y.; Agha, M.H.; Umar, M.; Chen, S. Industrial structure, energy intensity and environmental efficiency across developed and developing economies: The intermediary role of primary, secondary and tertiary industry. Energy 2022, 247, 123576. [Google Scholar] [CrossRef]
  37. Masuda, S.; Sato, T.; Mishima, I.; Maruo, C.; Yamazaki, H.; Nishimura, O. Impact of nitrogen compound variability of sewage treated water on N2O production in riverbeds. J. Environ. Manag. 2021, 290, 112621. [Google Scholar] [CrossRef]
  38. Nieminen, M.; Sallantaus, T.; Ukonmaanaho, L.; Nieminen, T.M.; Sarkkola, S. Nitrogen and phosphorus concentrations in discharge from drained peatland forests are increasing. Sci. Total Environ. 2017, 609, 974–981. [Google Scholar] [CrossRef]
  39. Leena, F.; Ahti, L.; Kristian, K.; Antti, R.; Laura, H.; Markus, H.; Samuli, J.; Pirkko, K.; Tuija, M.; Sirpa, P.; et al. Drainage for forestry increases N, P and TOC export to boreal surface waters. Sci. Total Environ. 2021, 762, 144098. [Google Scholar] [CrossRef]
  40. Menberu, M.W.; Marttila, H.; Tahvanainen, T.; Kotiaho, J.S.; Hokkanen, R.; Kløve, B.; Ronkanen, A. Changes in pore water quality after peatland restoration: Assessment of a large-scale, replicated before-after-control-impact study in Finland. Water Resour. Res. 2017, 53, 8327–8343. [Google Scholar] [CrossRef]
  41. Lepistö, A.; Räike, A.; Sallantaus, T.; Finér, L. Increases in organic carbon and nitrogen concentrations in boreal forested catchments—Changes driven by climate and deposition. Sci. Total Environ. 2021, 780, 146627. [Google Scholar] [CrossRef]
Figure 1. Geographical location and water system of Heilongjiang Province.
Water 14 02367 g001
Figure 2. The flow chart of this study.
Water 14 02367 g002
Figure 3. Spearman correlation coefficients between pollutant emissions and major pollutants in surface water.
Water 14 02367 g003
Figure 4. Statistical map of the correlation between each reference sequence and the environmental quality of surface water.
Water 14 02367 g004
Figure 5. The average value of the correlation between each reference series and the environmental quality of surface water.
Water 14 02367 g005
Table 1. 2011–2020 Proportion and change trend of water quality grades I–III in different water stages of rivers in Heilongjiang Province.
YearDry SeasonNormal Water SeasonHigh Water Season
201139.2%31.3%38.6%
201247.1%48.9%51.1%
201350.0%43.5%30.4%
201458.6%61.1%55.6%
201557.0%56.7%51.1%
201670.9%66.9%61.2%
201774.0%69.2%64.5%
201852.0%62.6%26.4%
201974.0%64.2%41.9%
202068.9%67.3%55.1%
2016–2020 rank correlation coefficient rs−0.350−0.100−0.500
Trendvolatilityvolatilityvolatility
2011–2020 rank correlation coefficient rs0.7700.8420.200
TrendSignificant increaseSignificant increaseSignificant increase
Table 2. The proportion and trend of water quality of inferior Class V in each water stage of Heilongjiang Province from 2011 to 2020.
YearDry SeasonNormal Water SeasonHigh Water Season
20117.6%7.2%8.4%
201213.8%6.7%6.7%
20136.8%7.6%7.6%
20143.4%5.6%5.6%
20155.8%5.6%5.6%
20165.5%7.4%5.8%
20175.0%2.8%3.7%
20189.2%5.6%2.8%
20197.0%3.8%1.9%
20203.9%2.8%0.9%
2016–2020 rank correlation coefficient rs−0.200−0.400−1.000
TrendvolatilityvolatilitySignificant decrease
2011–2020 rank correlation coefficient rs−0.333−0.648−0.939
TrendvolatilitySignificant decreaseSignificant decrease
Table 3. The major pollutants in rivers of Heilongjiang Province from 2011 to 2020.
YearPermanganate
Index
(mg/L)
Chemical Oxygen Demand
(mg/L)
Ammonia Nitrogen
(mg/L)
Total Phosphorus
(mg/L)
20116.7250.7460.16
20126.3230.7220.15
20136.6230.6830.15
20146.4220.5610.14
20156.6220.5750.15
20165.7200.5710.12
20175.4190.5930.12
20185.9210.6220.13
20195.8210.4950.10
20205.5180.4270.10
2016–2020 rank correlation coefficient rs0.1−0.2−0.6−0.6
Trendvolatilityvolatilityvolatilityvolatility
2011–2020 rank correlation coefficient rs−0.782−0.879−0.770−0.927
TrendSignificant decreaseSignificant decreaseSignificant decreaseSignificant decrease
Publisher’s Note: MDPI stays neutral with regard to jurisdictional claims in published maps and institutional affiliations.

