
Evaluation and Spatial Equilibrium Analysis of High-Quality Development Level in Mainland China Considering Water Constraints

Abstract
:1. Introduction
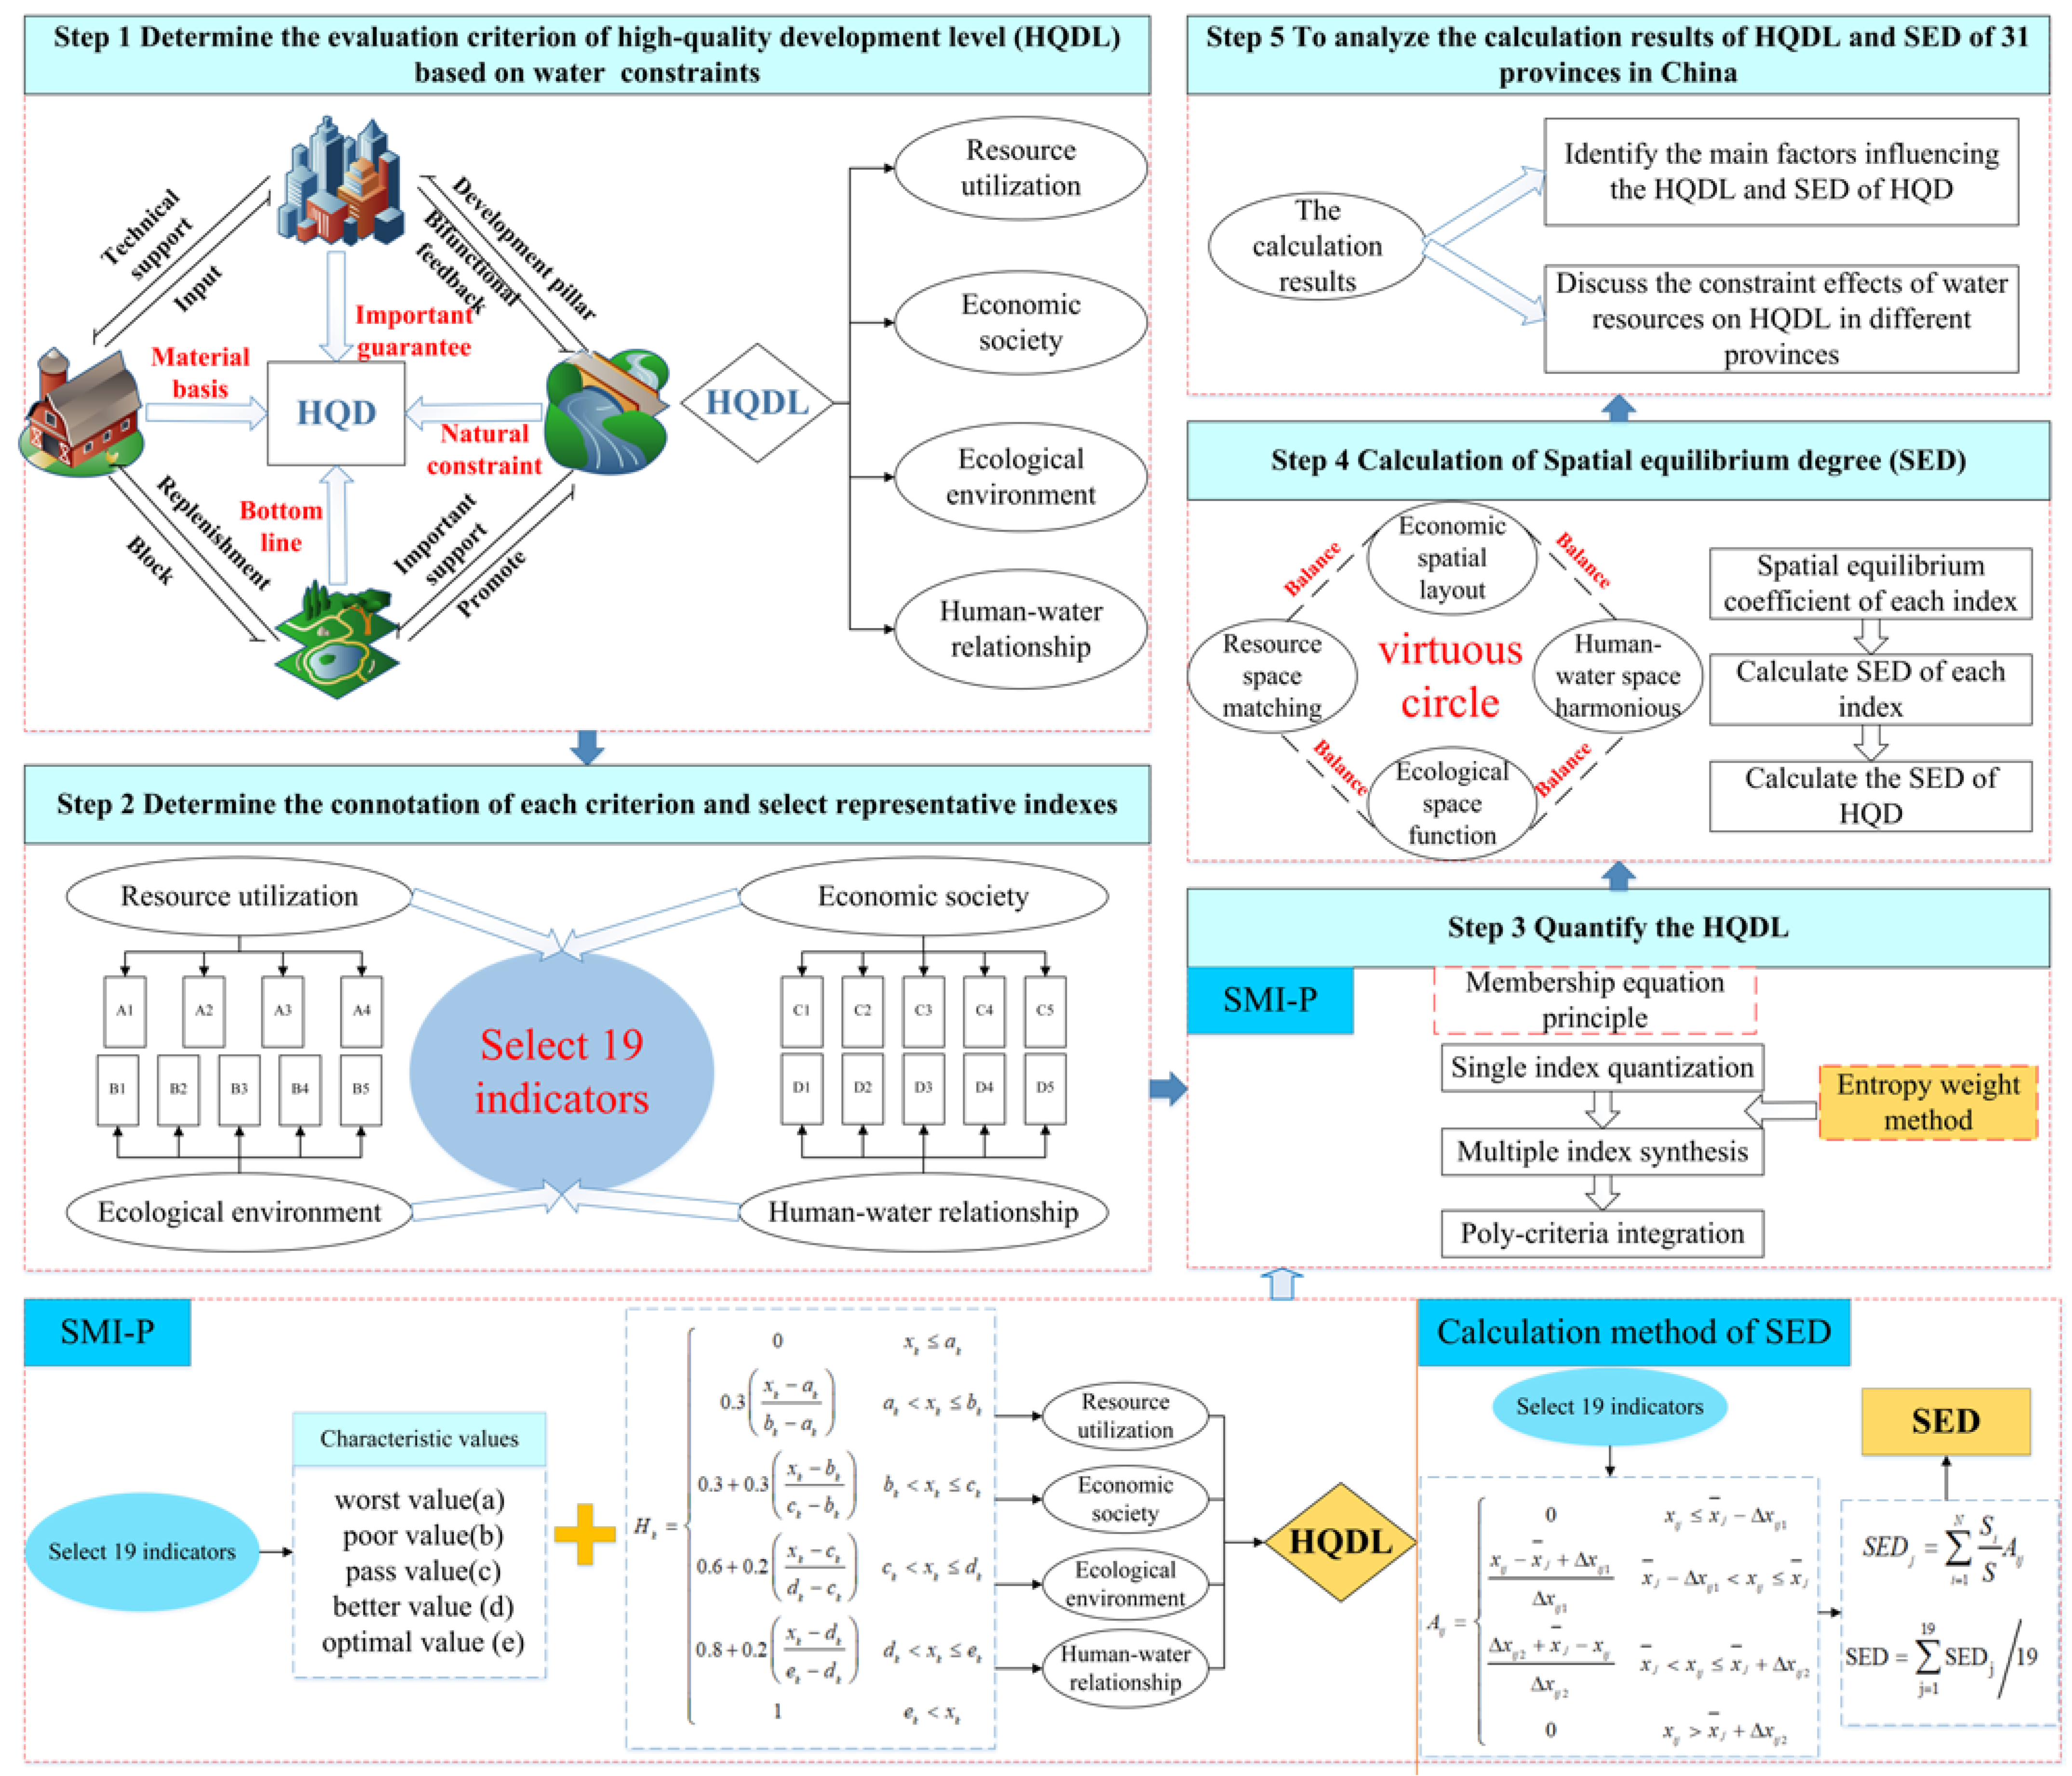
2. Methodology
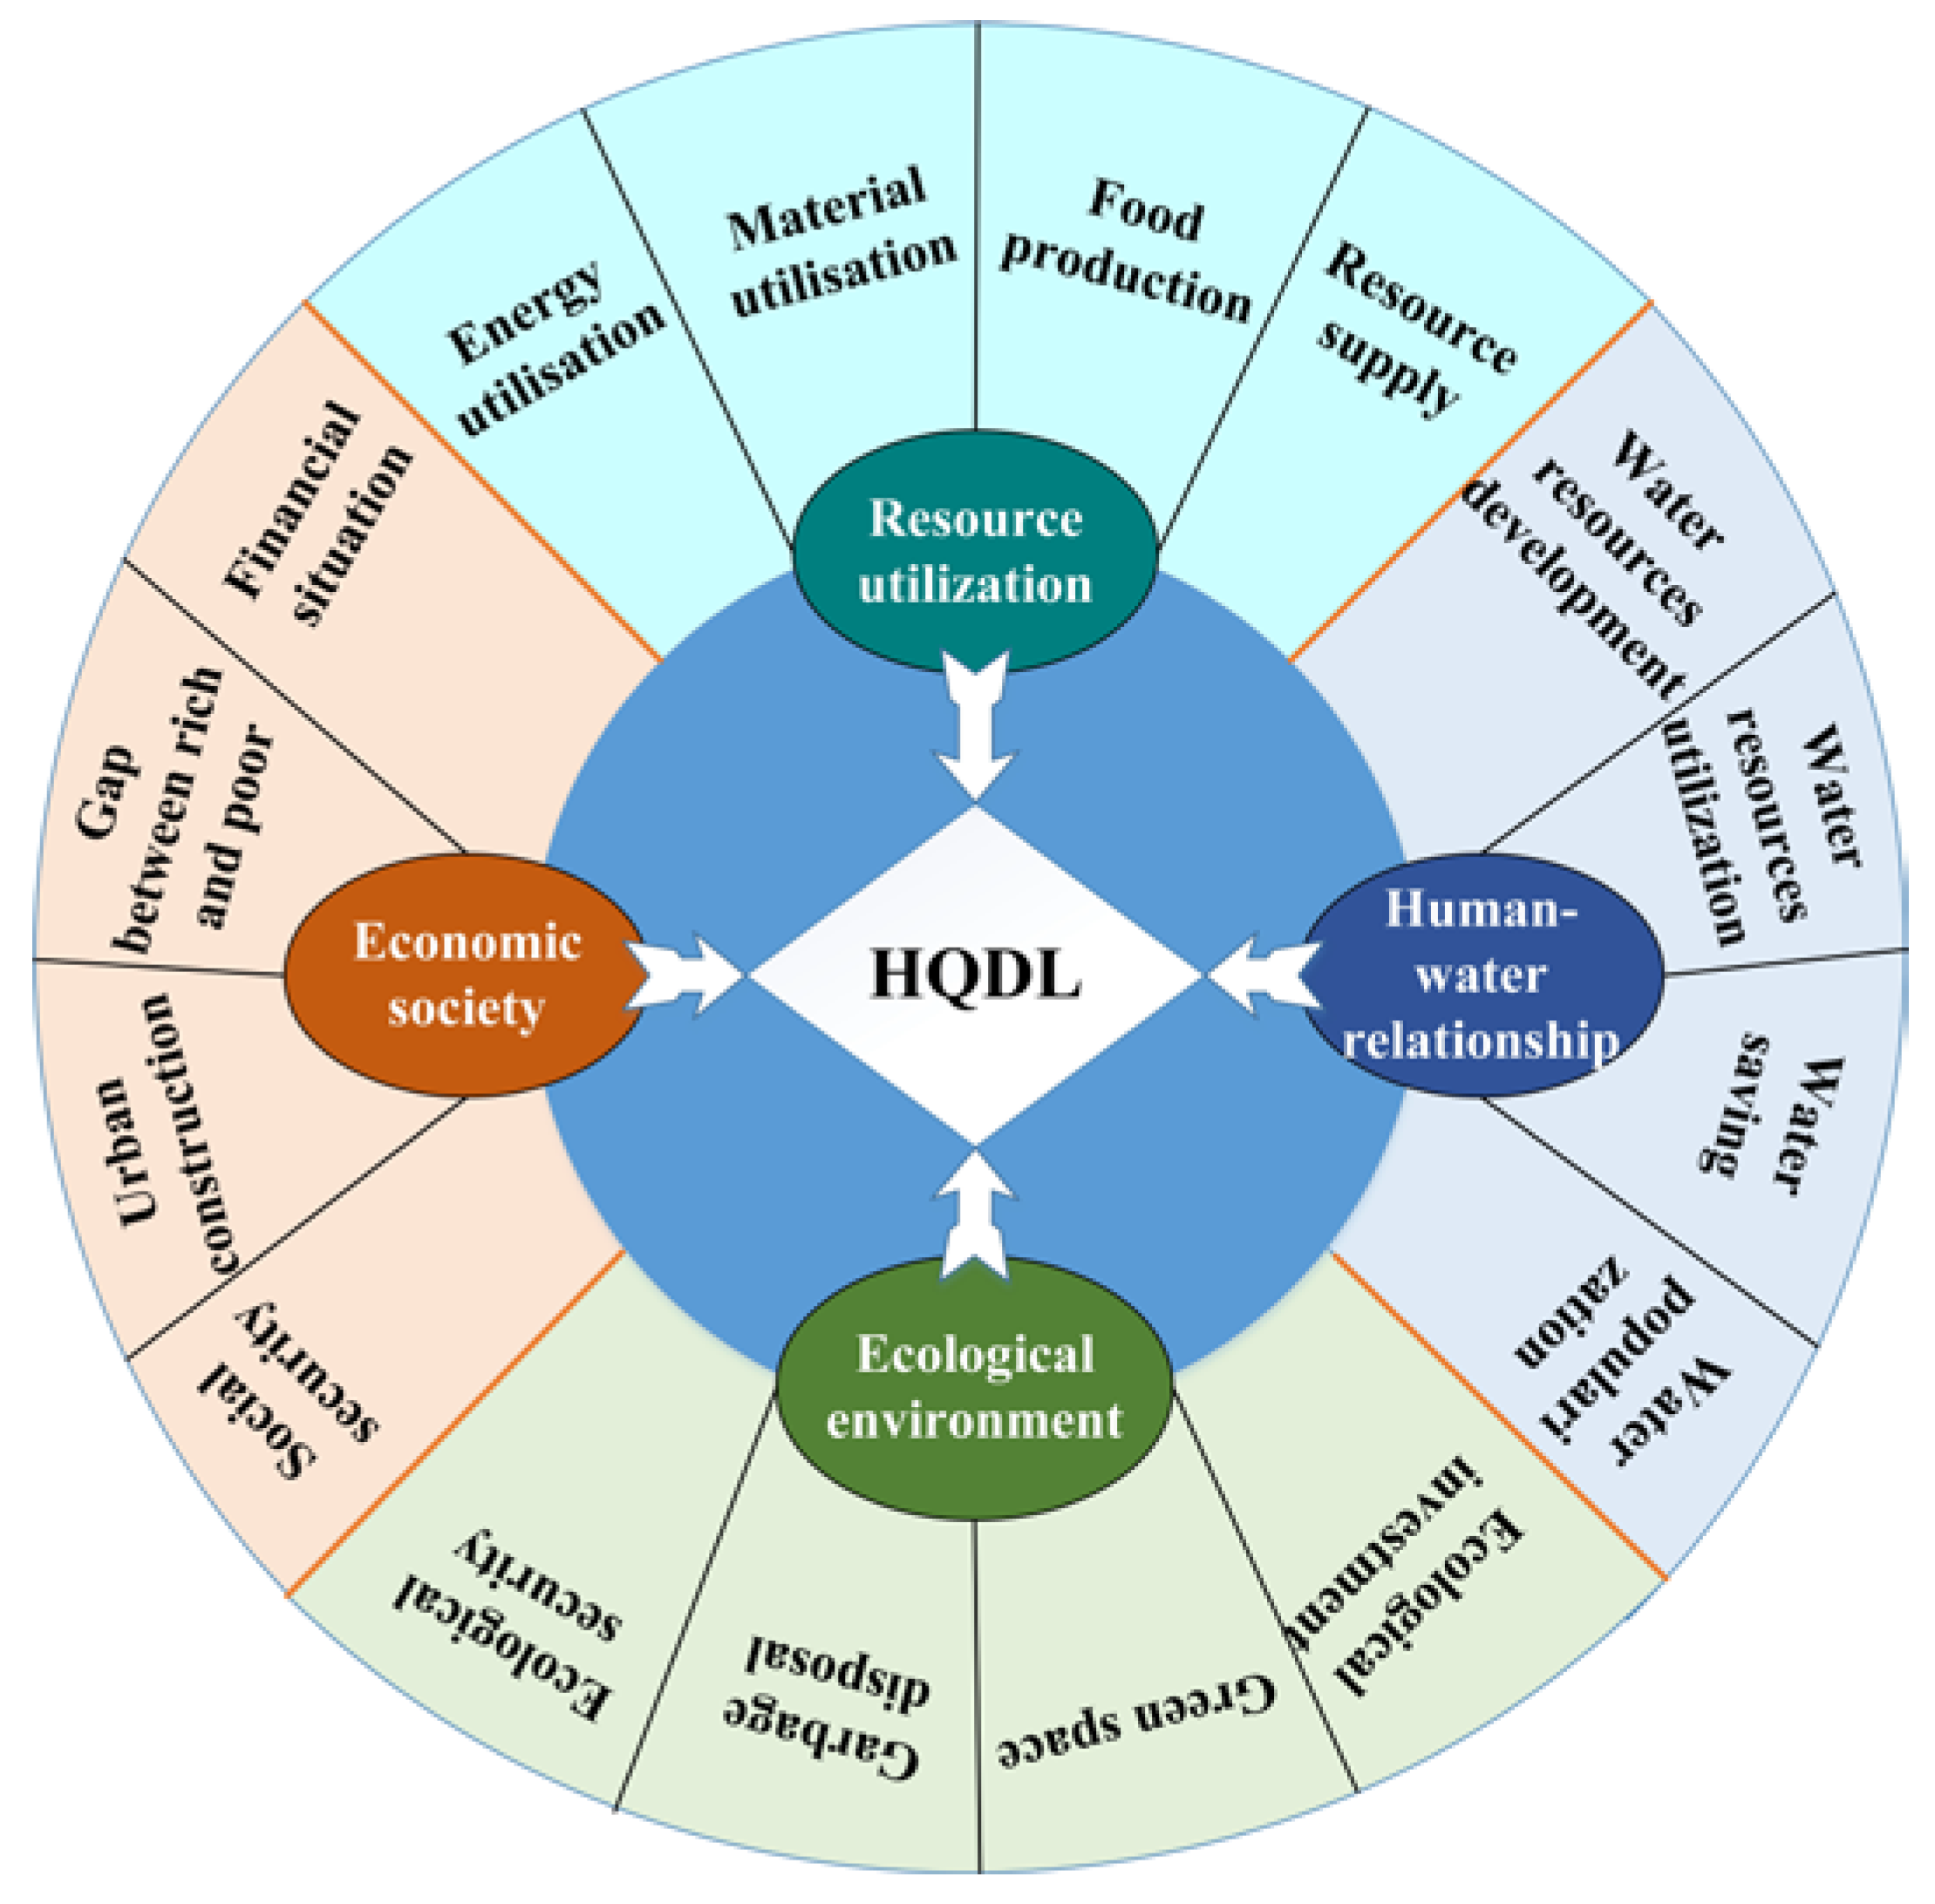
2.1. Evaluation Index System of HQDL
2.2. Quantitative Method of HQDL
- (1)
- Single index quantization: Calculating the membership degree of each index (denoted as “H”, “H ∈ [0, 1]”). Indicators can be quantified by piecewise linear membership function, and mapped to the range of “[0, 1]”. The calculation formulas for membership degree of positive and negative indicators are as follows:
- (2)
- Multiple index synthesis: by weighting the membership degree of multiple indices, the HQDD of each criterion layer can be calculated. The formula is as follow:
- (3)
- Poly-criteria integration: the HQDD of each criterion layer can be obtained through the above calculation, then the HQDL is calculated by the weighted average method:
2.3. Calculation Method of SED
- (1)
- Calculate the spatial equilibrium coefficient of index of region :
- (2)
- Calculate the of indicators:
- (3)
- Calculate the SED of HQD:
3. Case Study
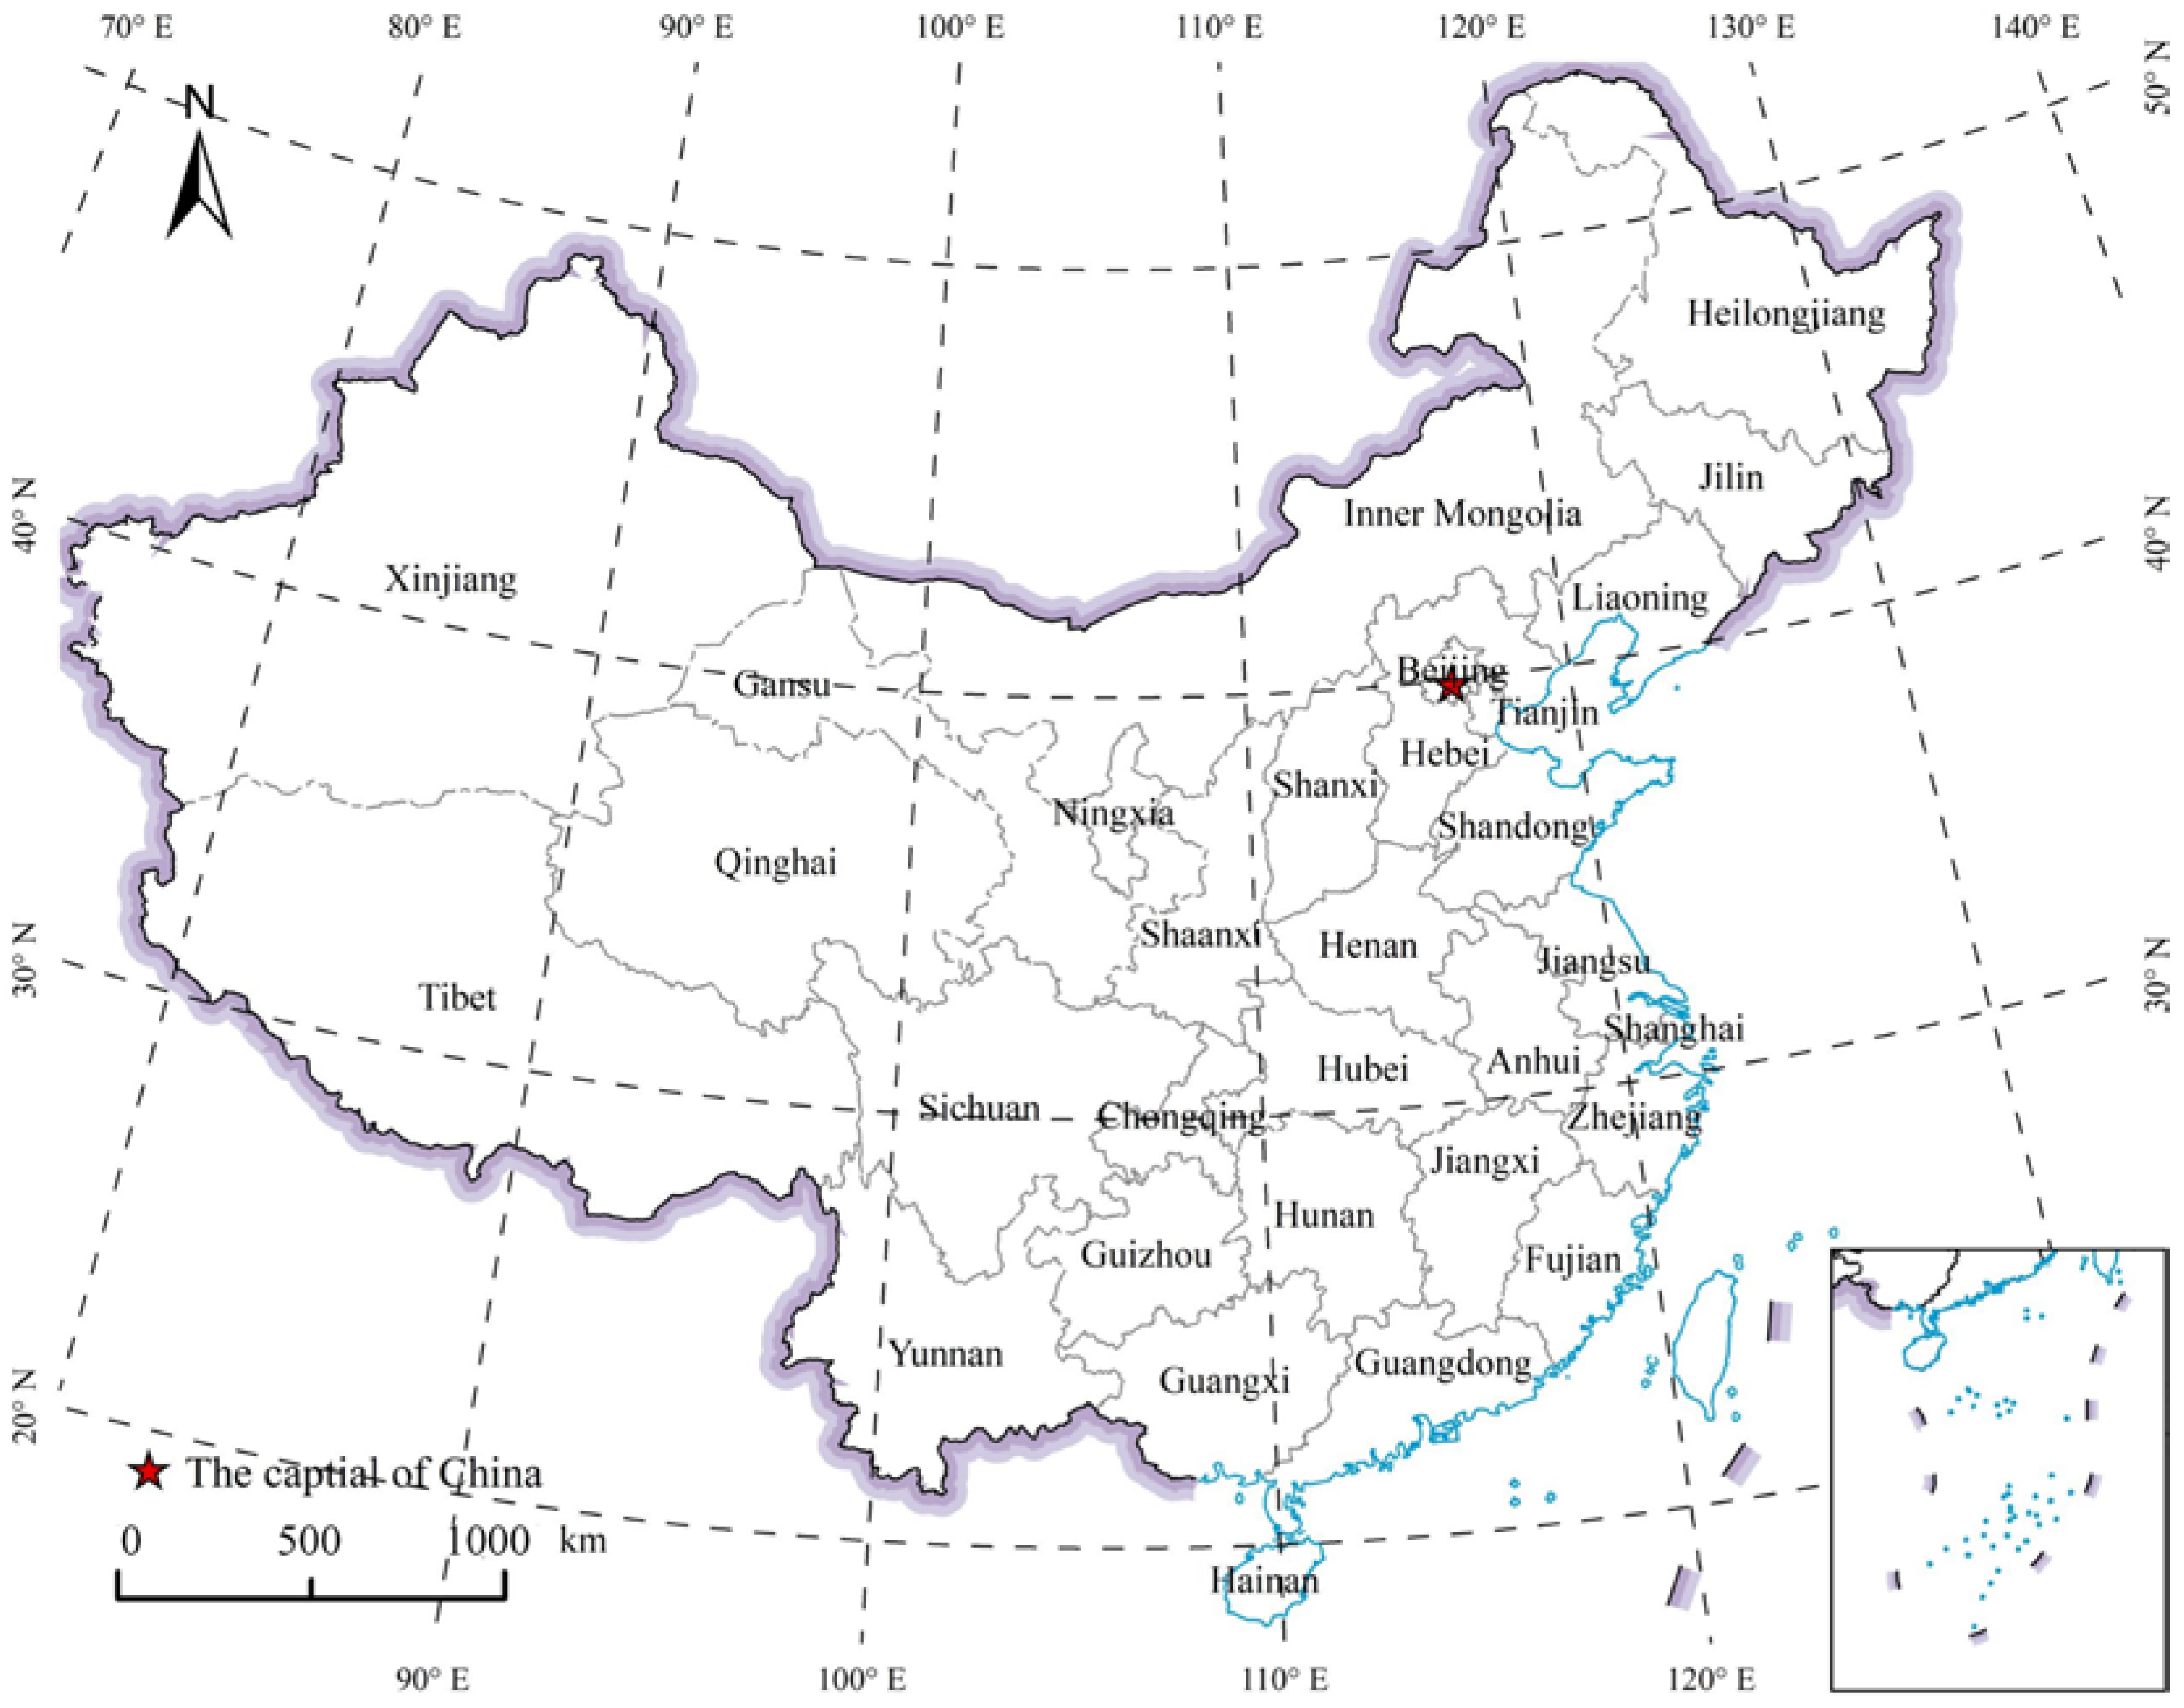
3.1. Overview of the Study Area
3.2. Data Sources
4. Results
4.1. Evolution of Subsystems’ HQDD
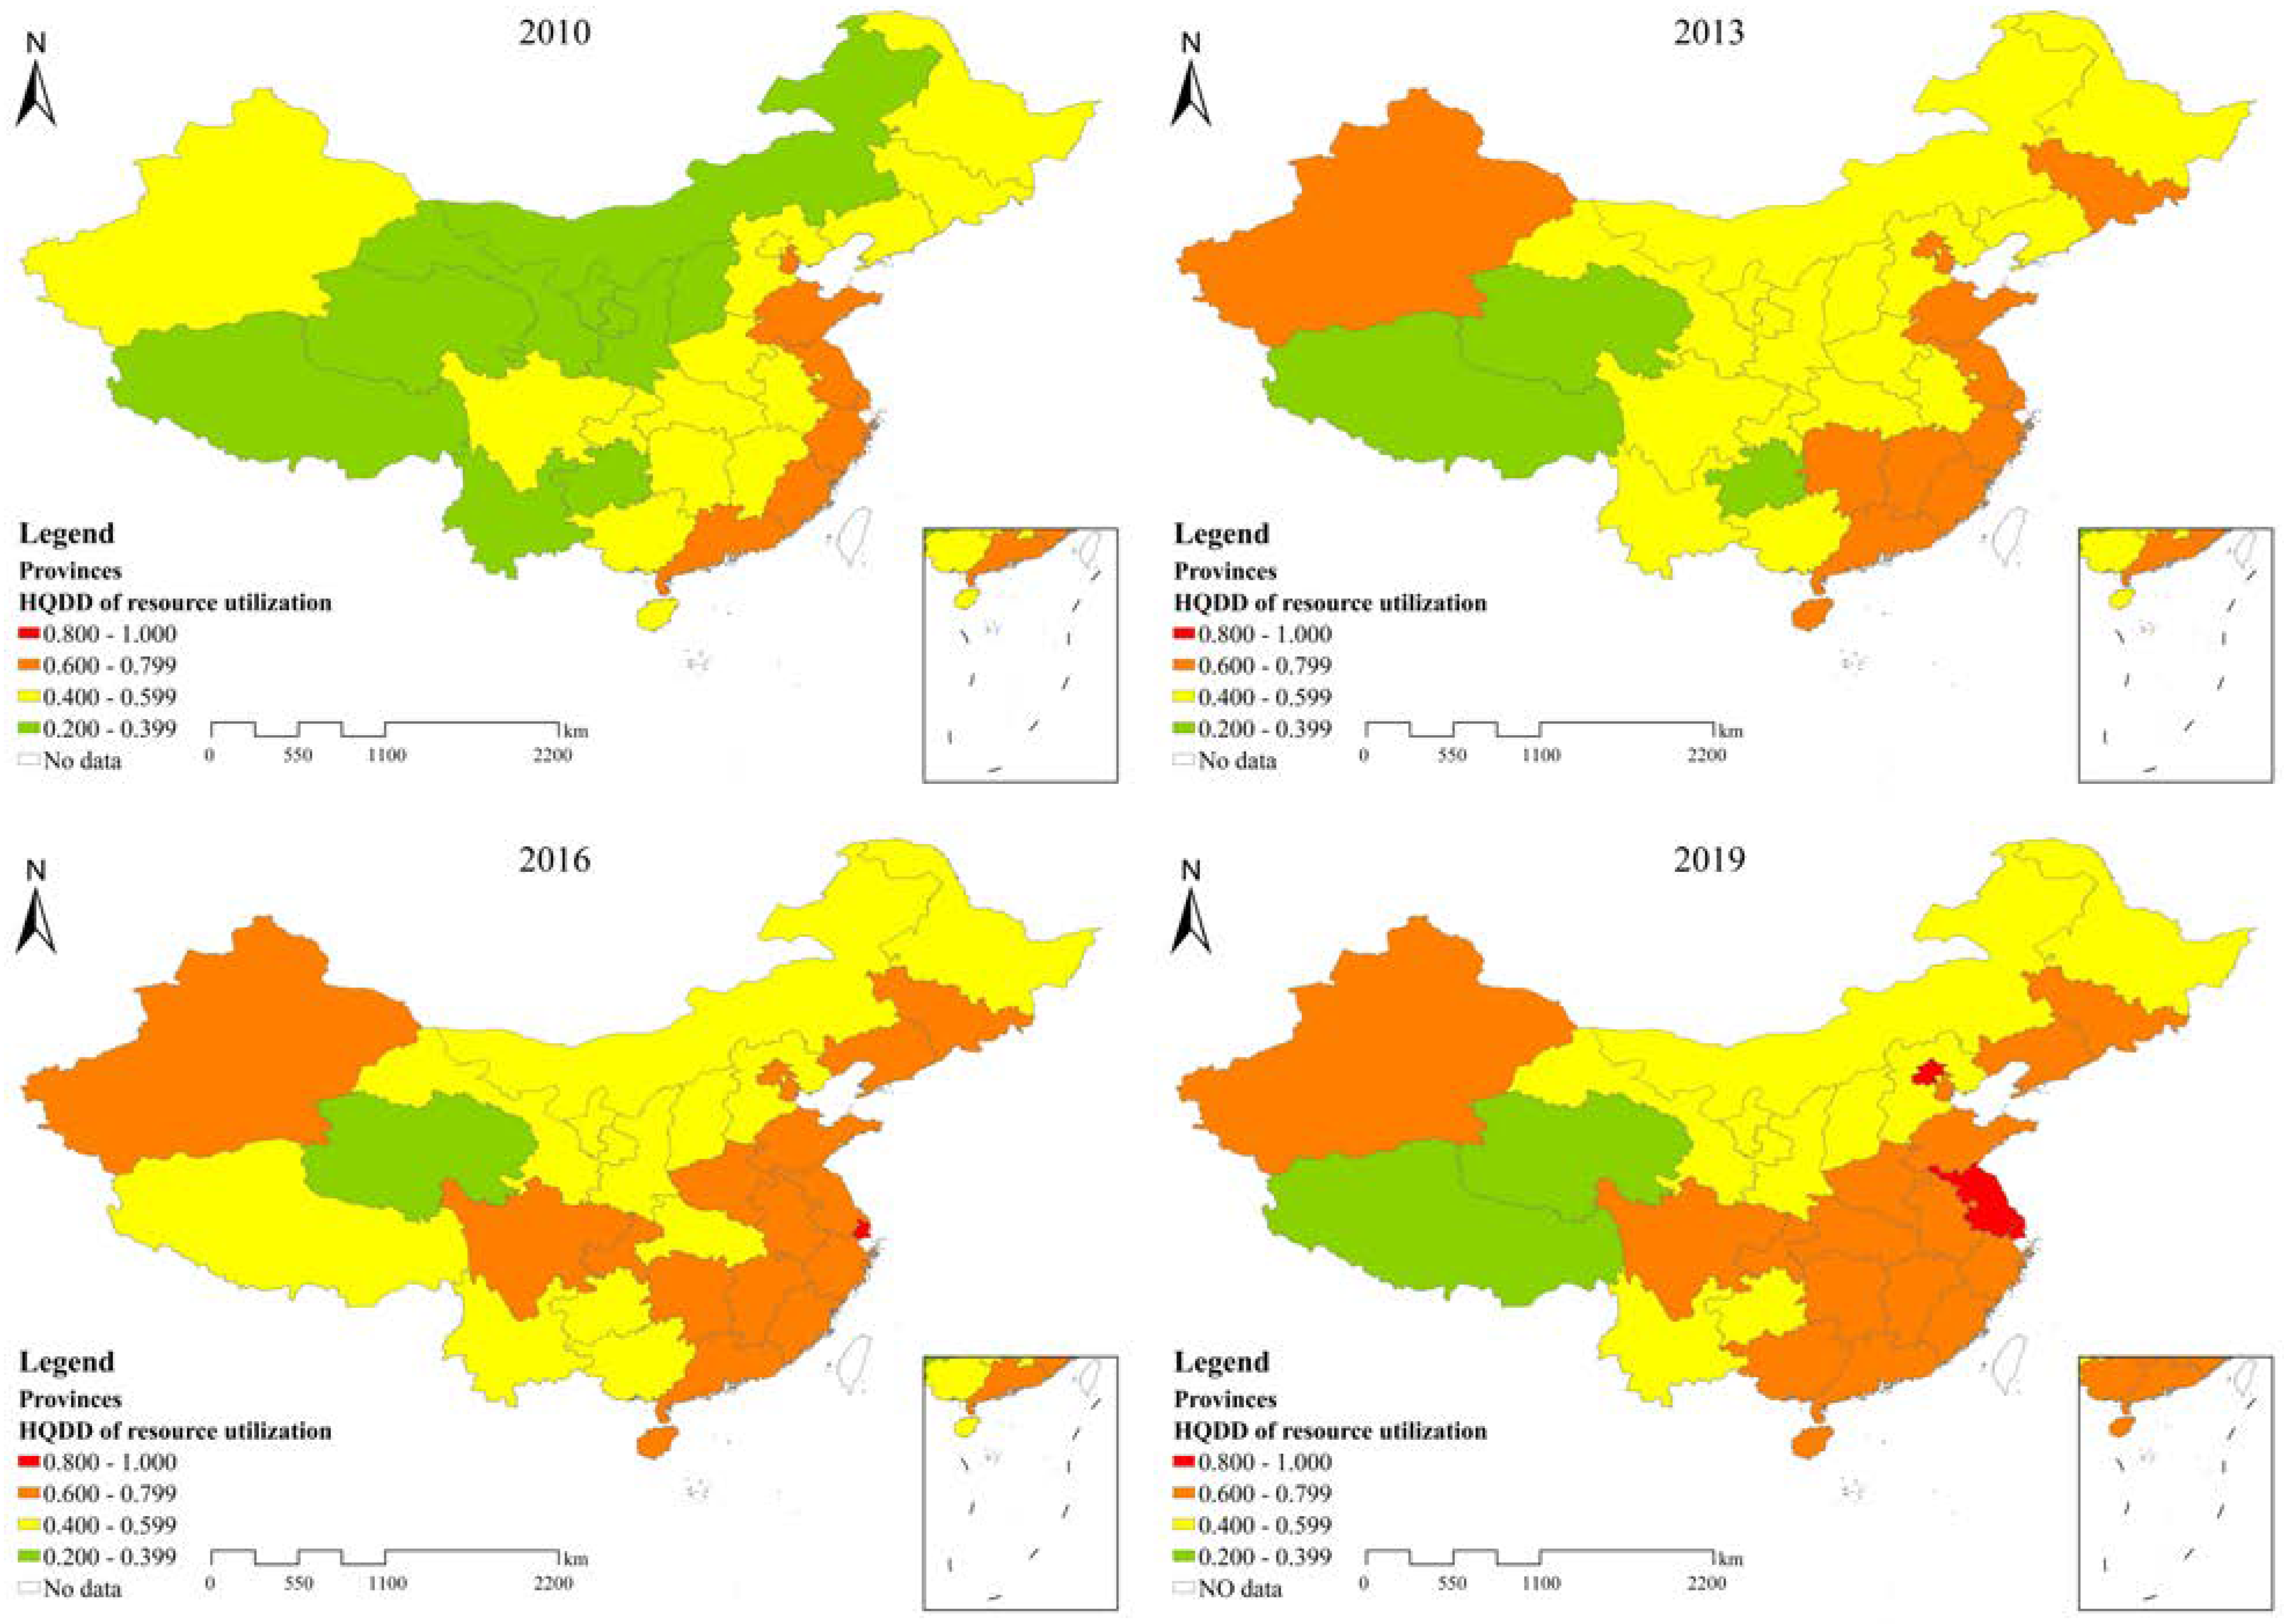
4.1.1. Evolution of Resource Utilization Subsystem’s HQDD
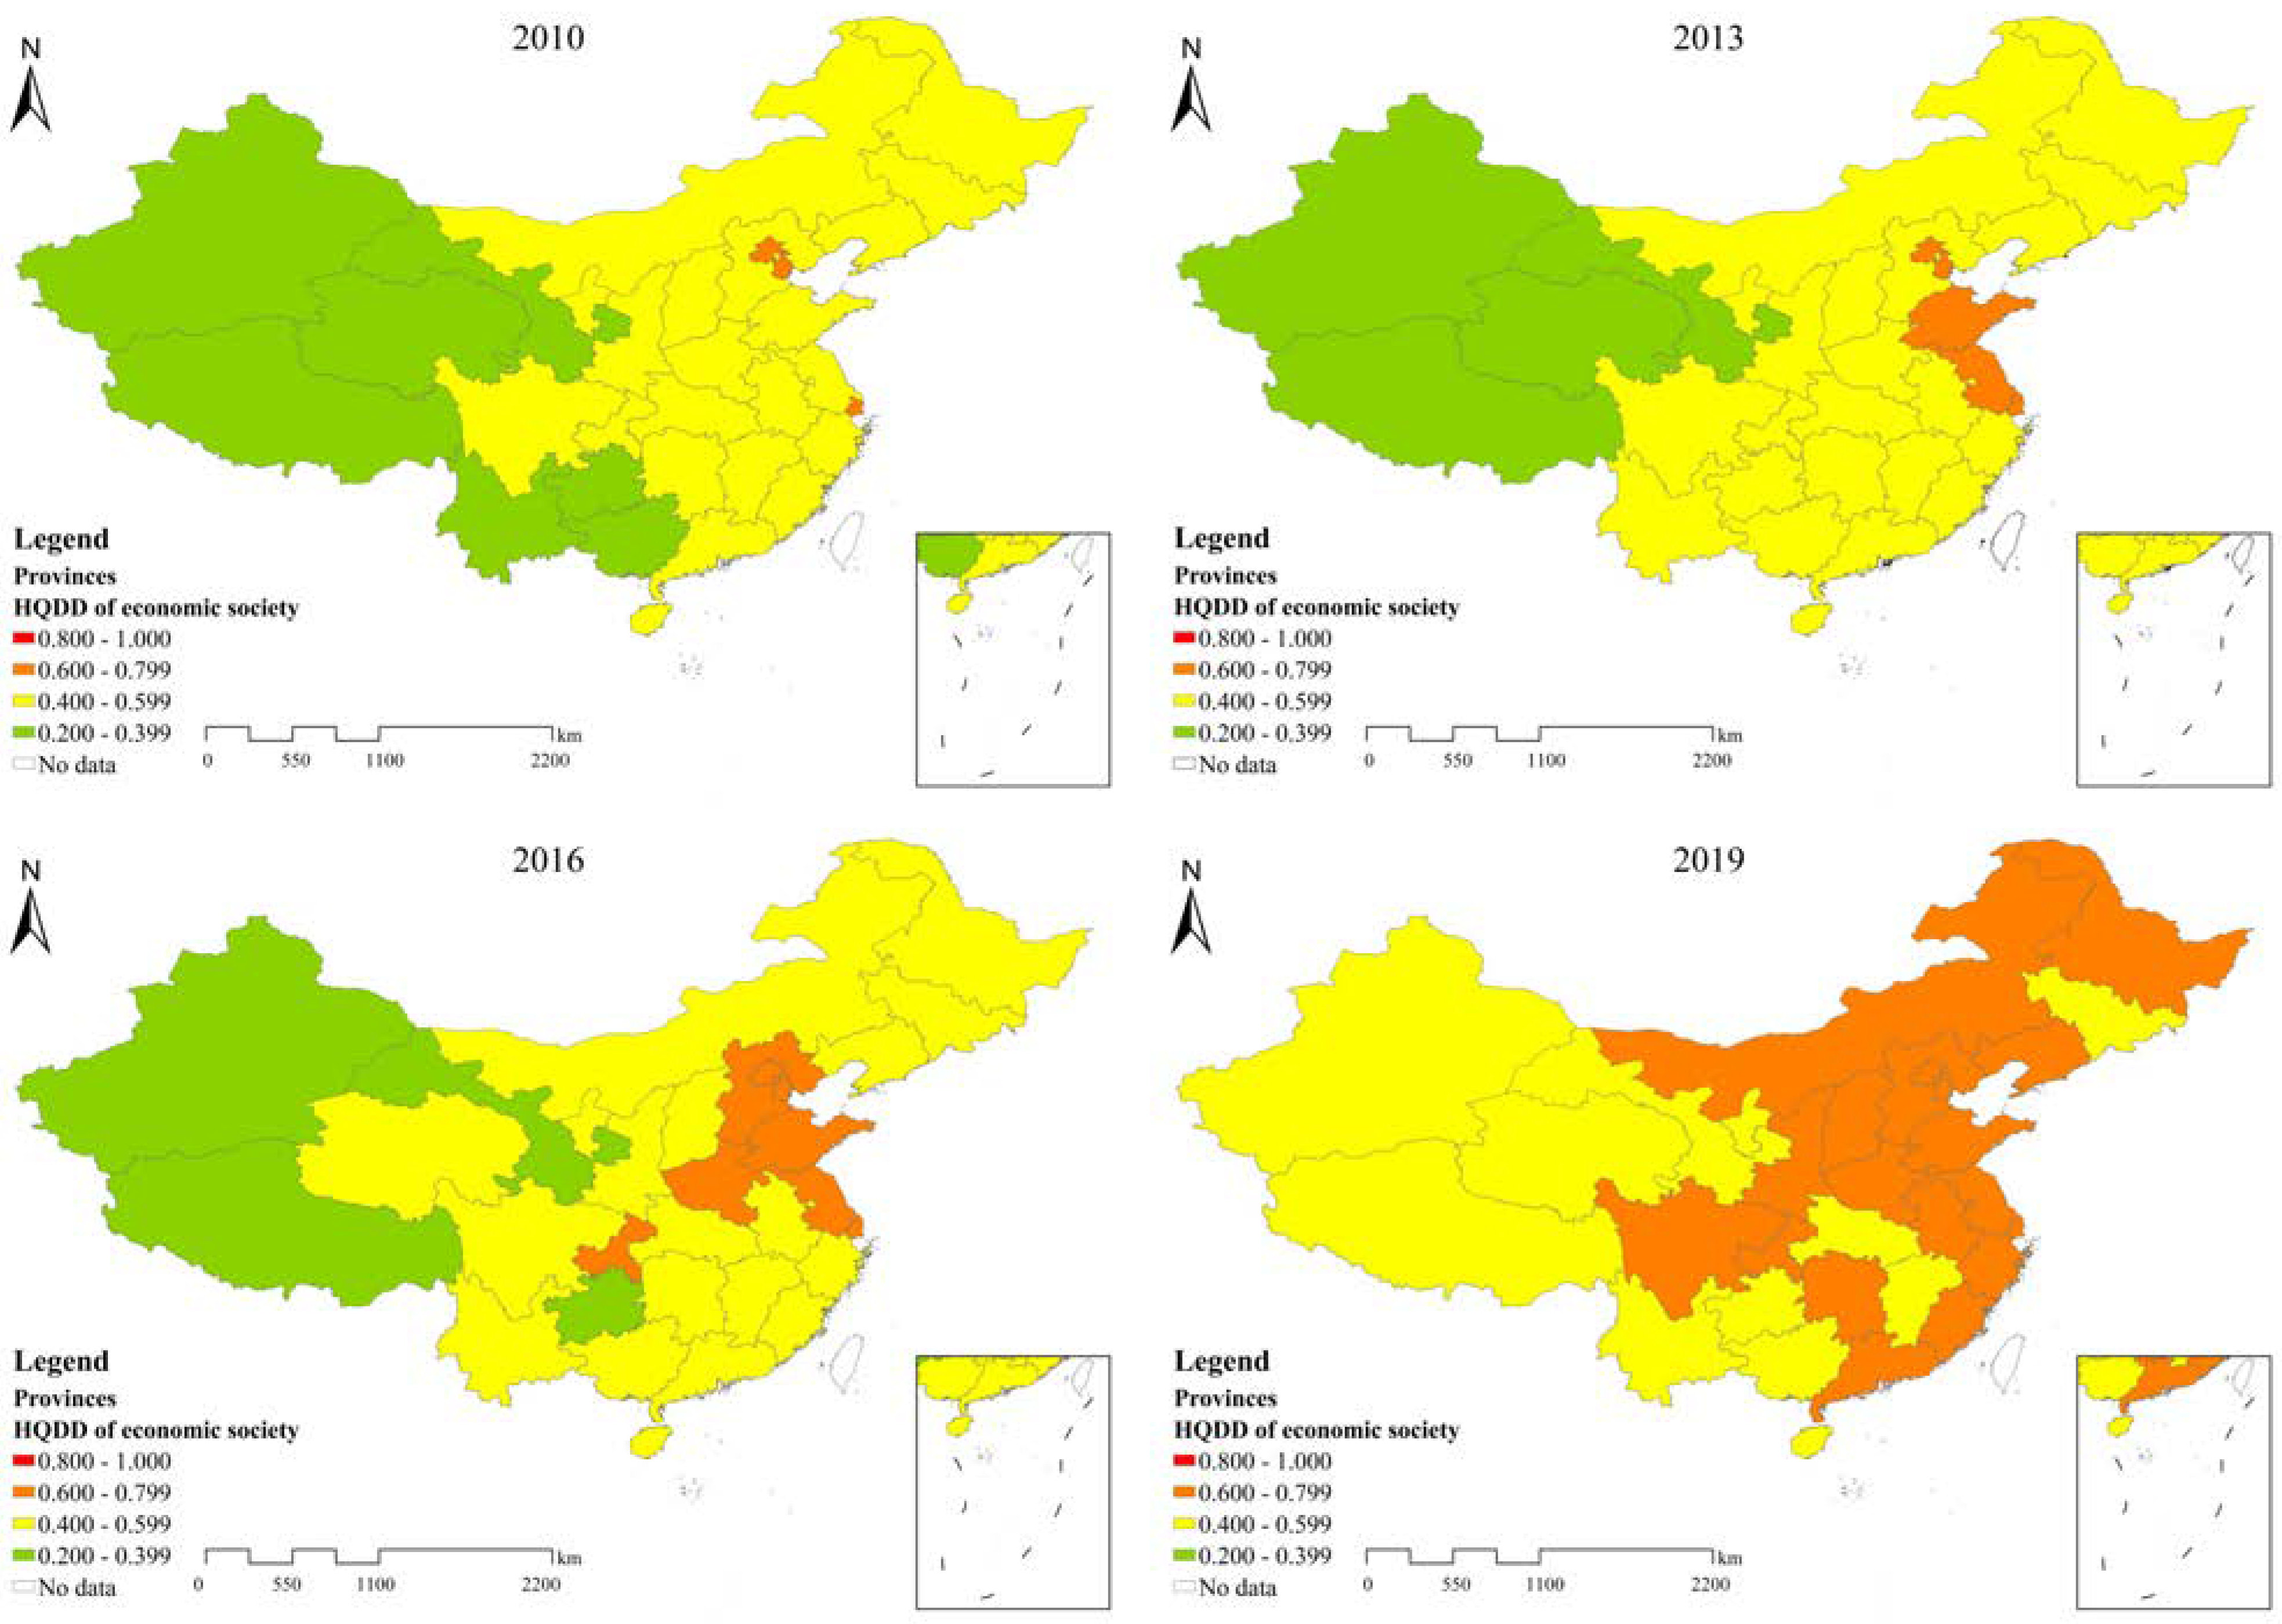
4.1.2. Evolution of Economic Society Subsystem’s HQDD
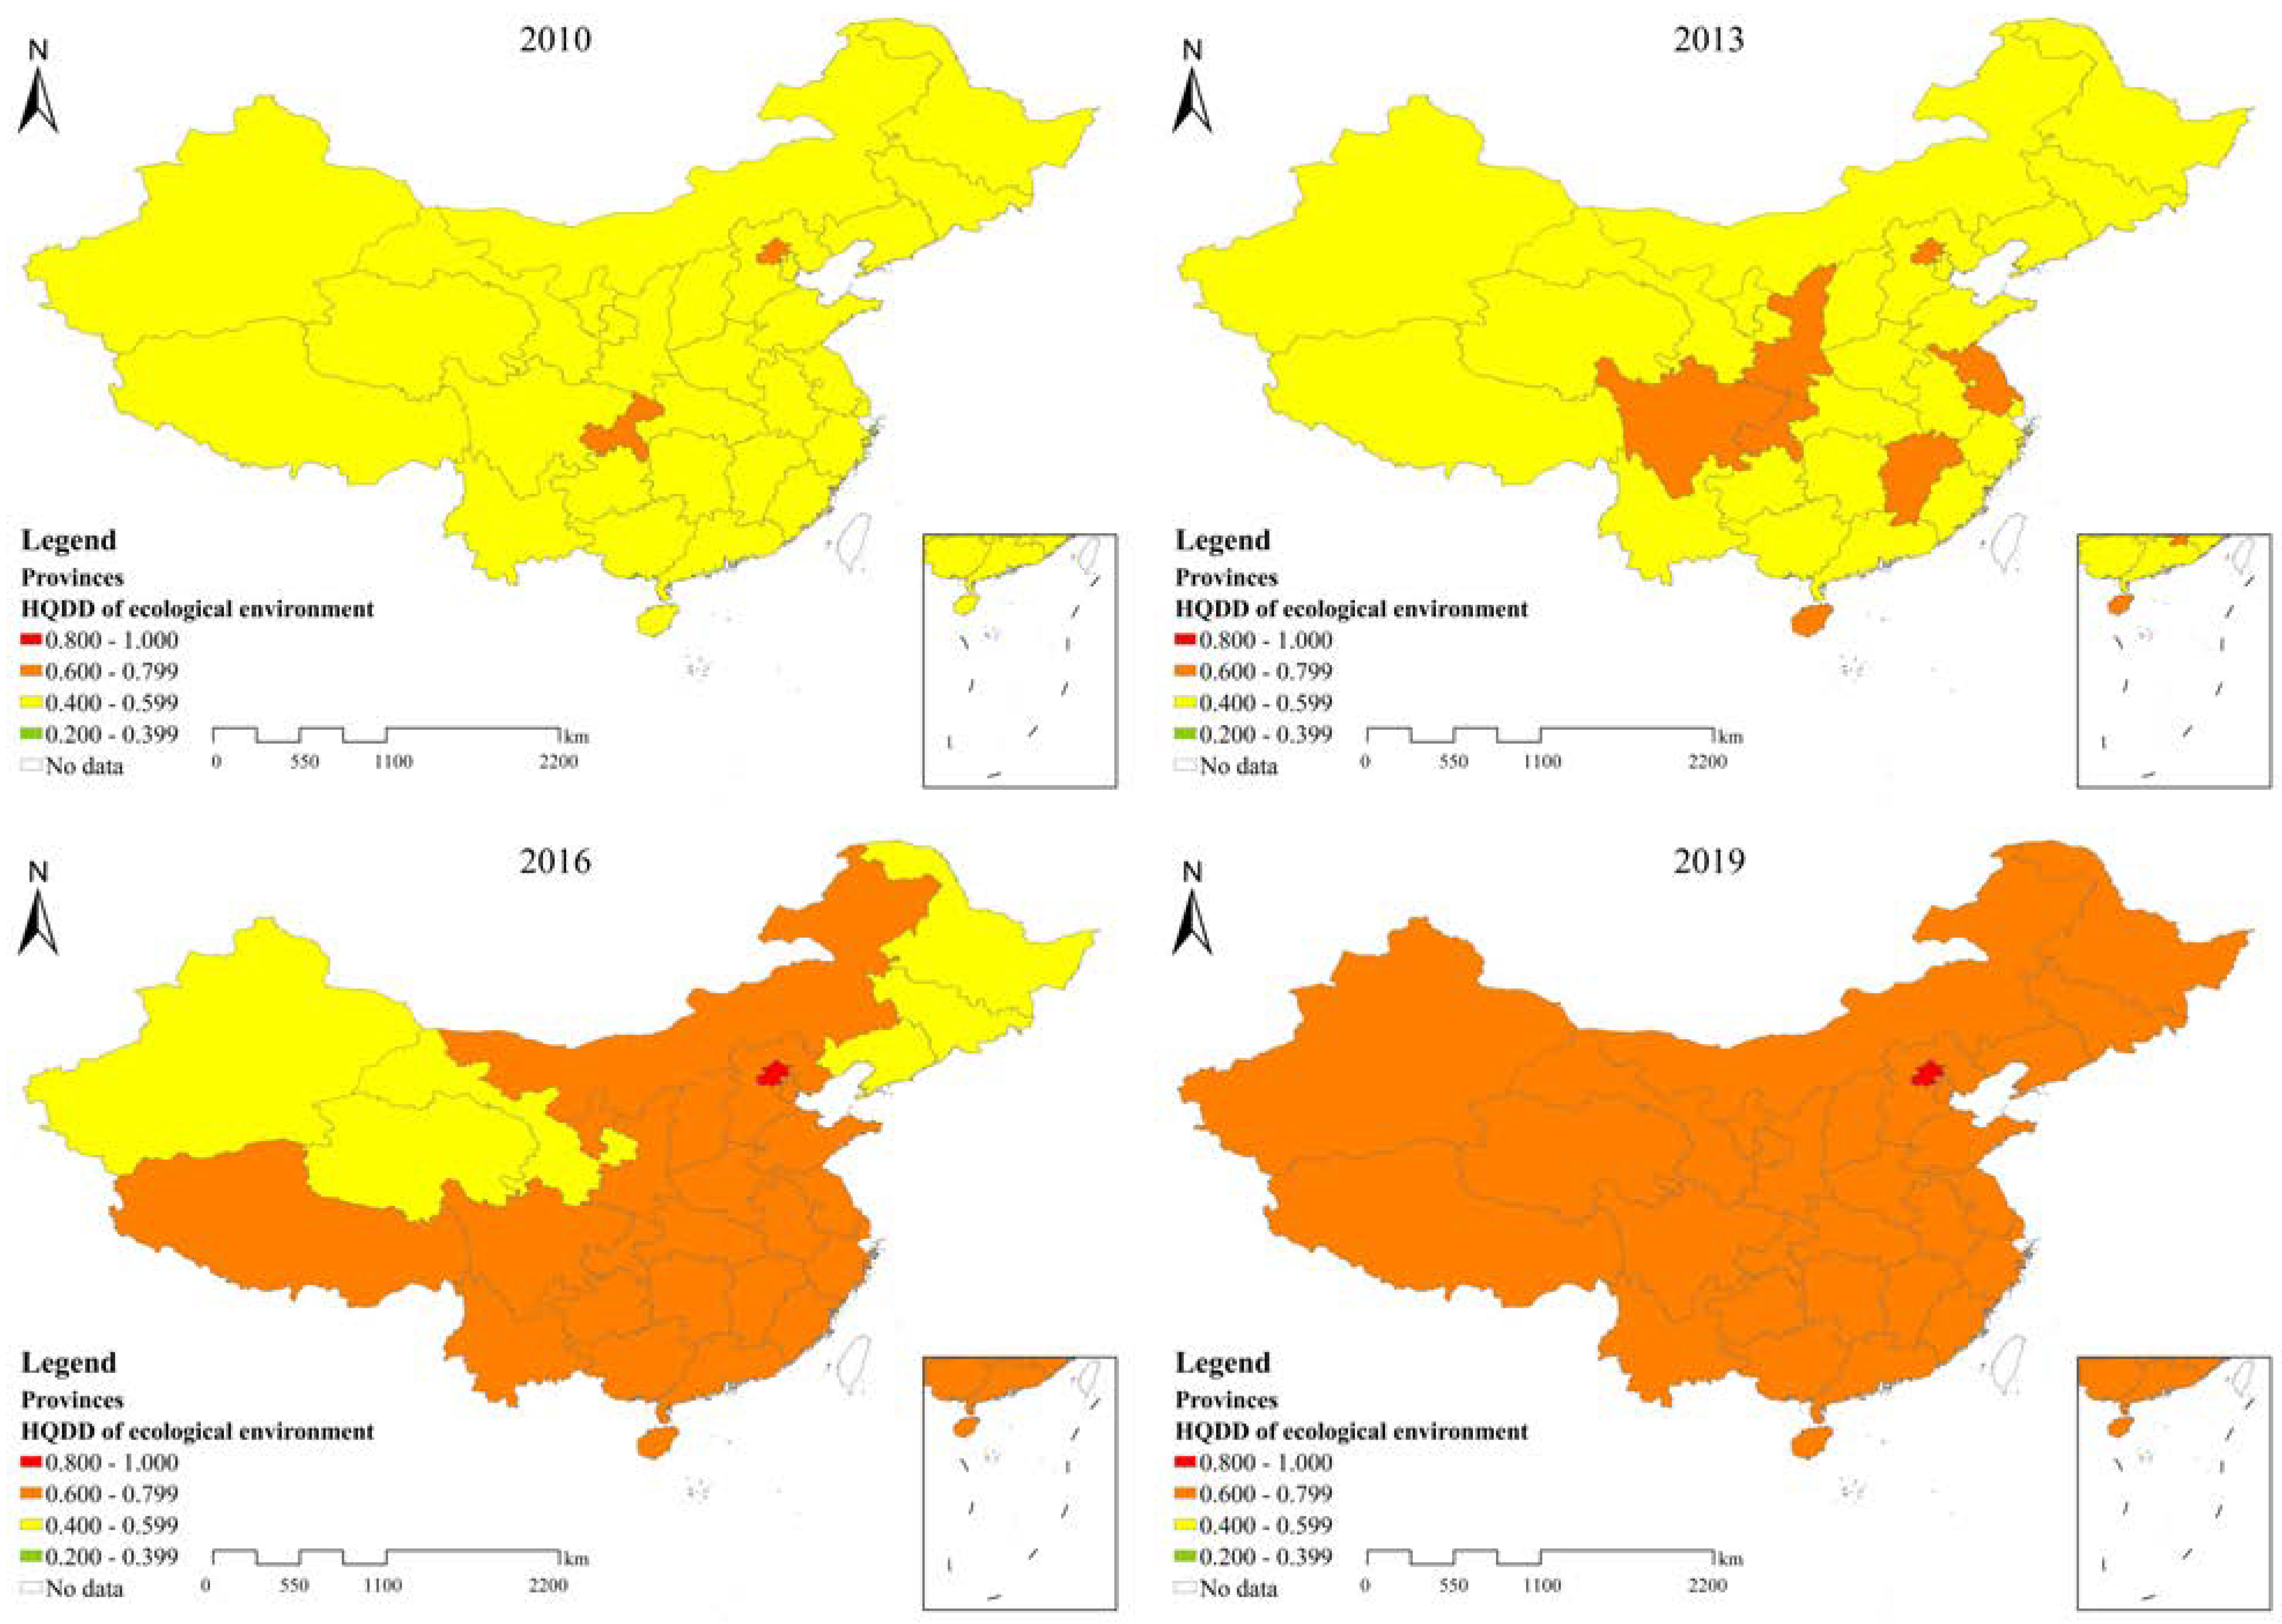
4.1.3. Evolution of Ecological Environment Subsystem’s HQDD
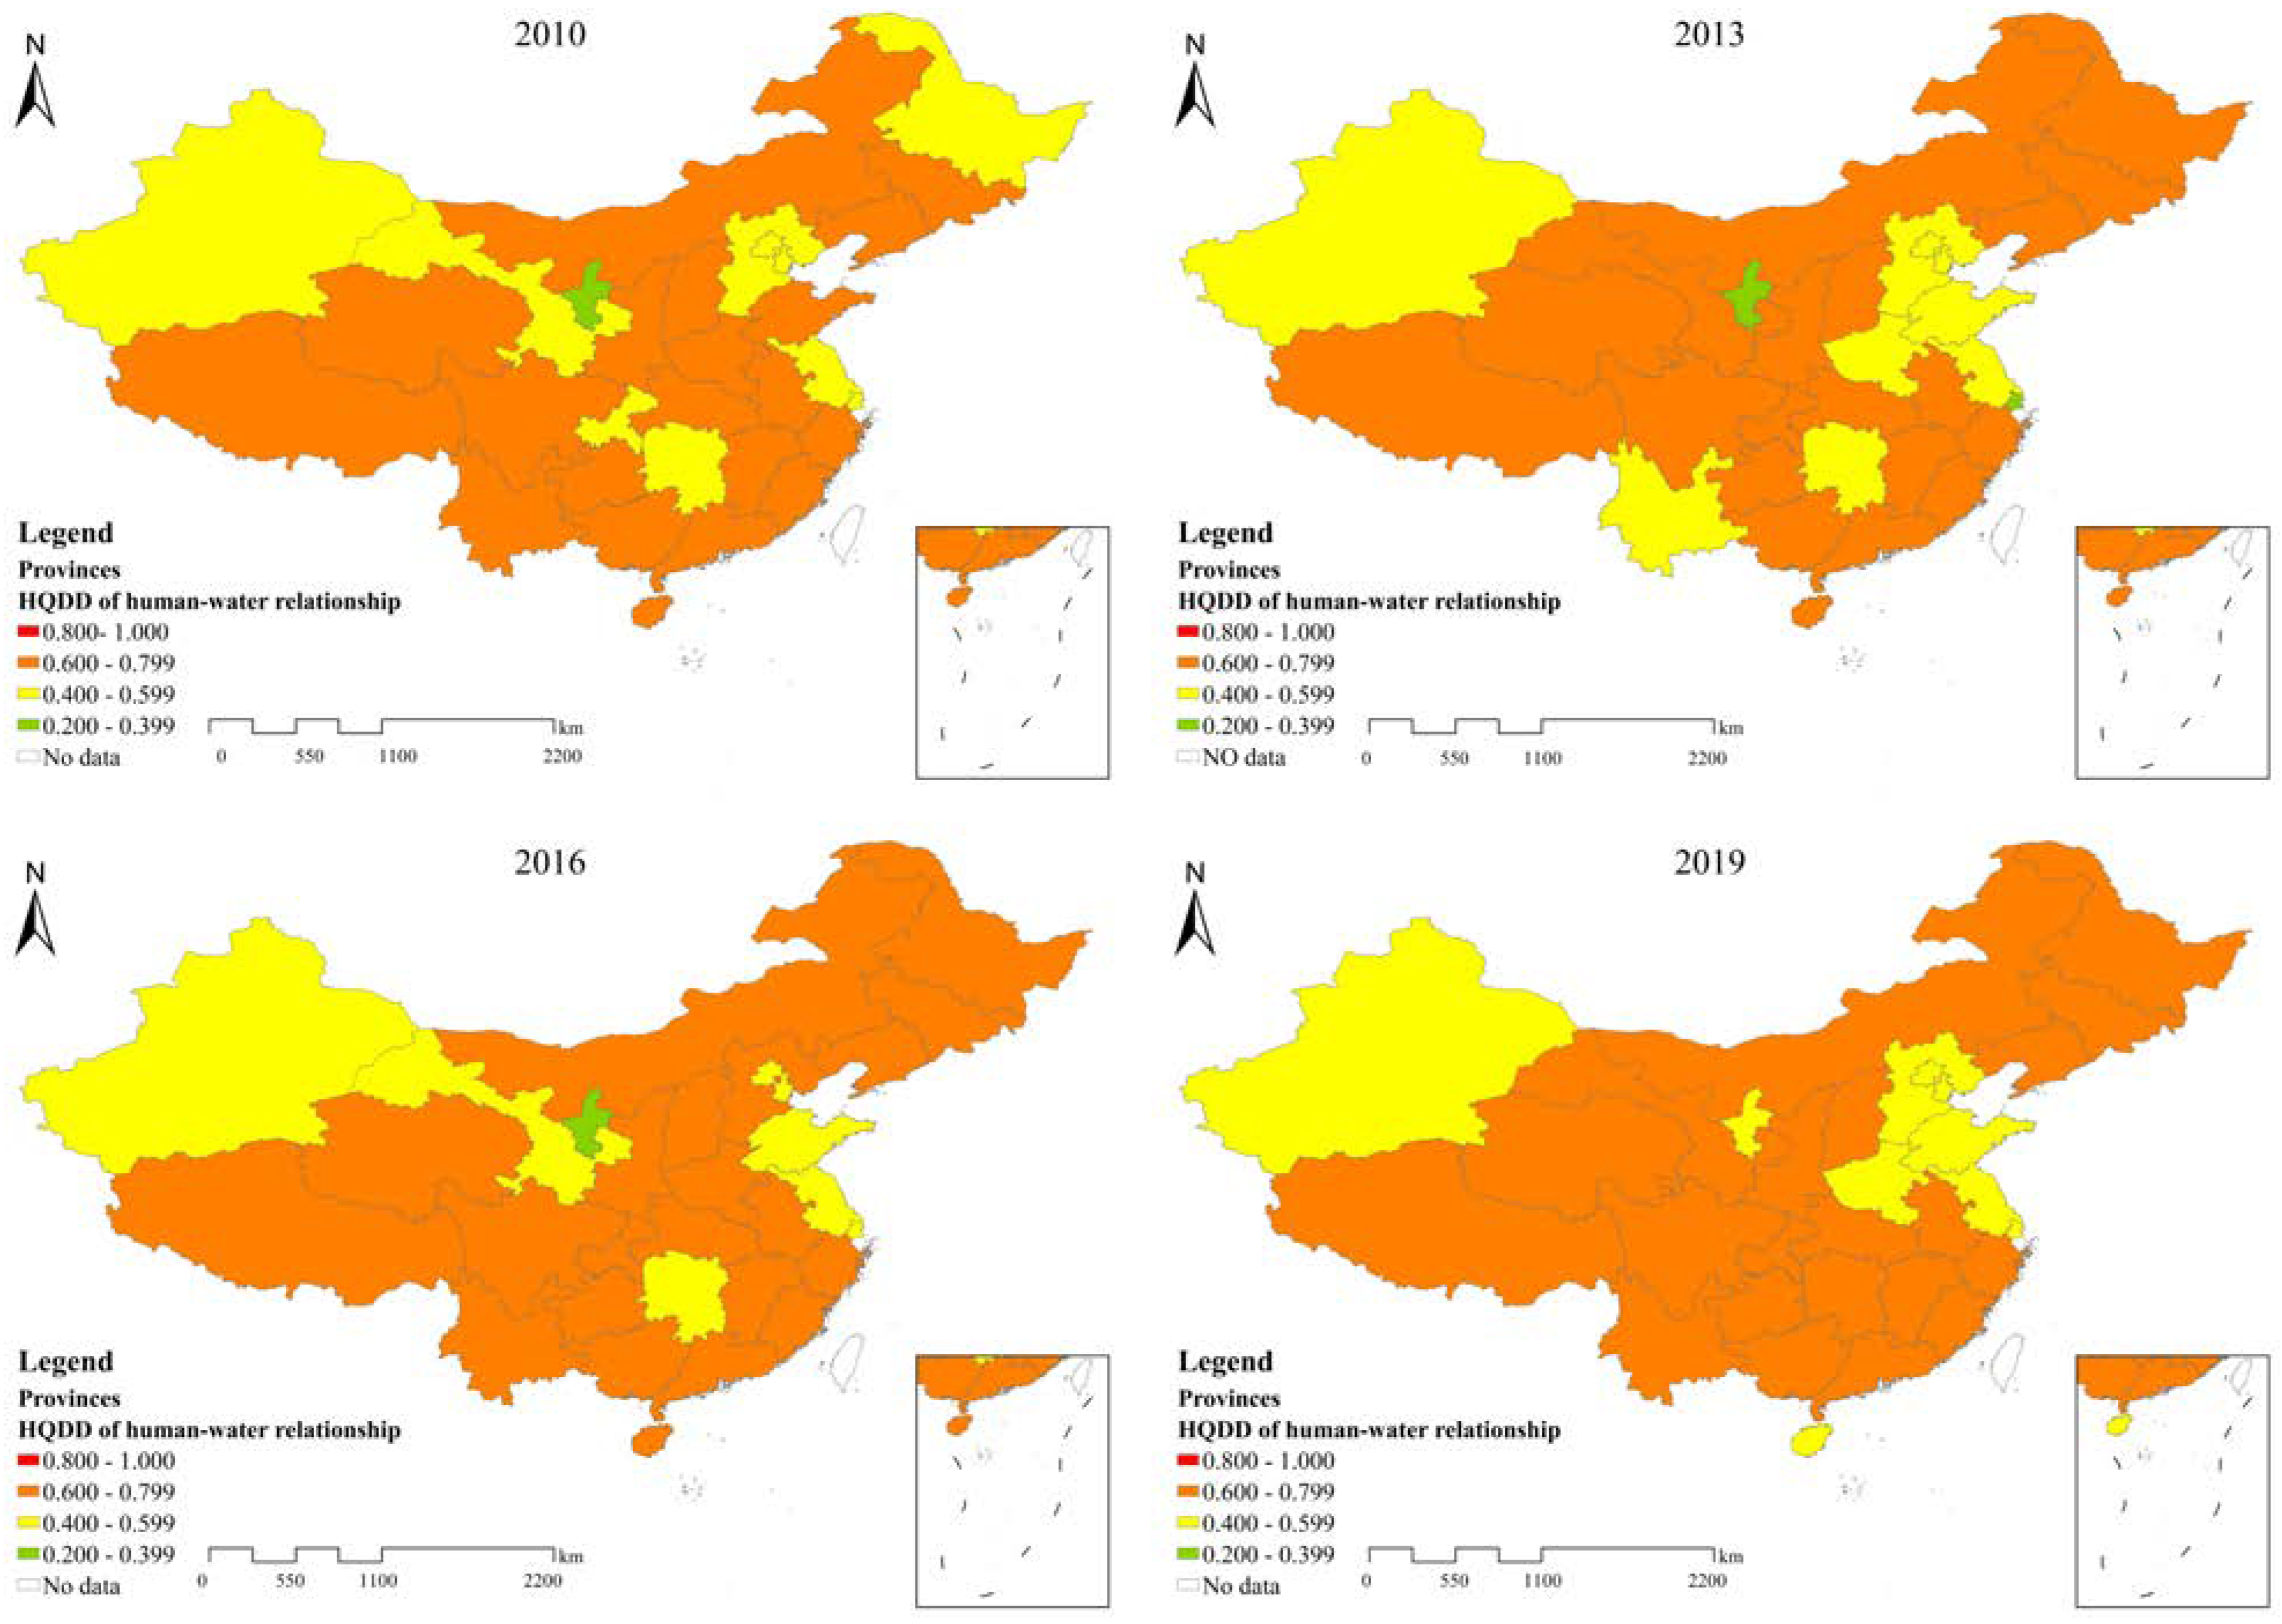
4.1.4. Evolution of Human-Water Relationship Subsystem’s HQDD
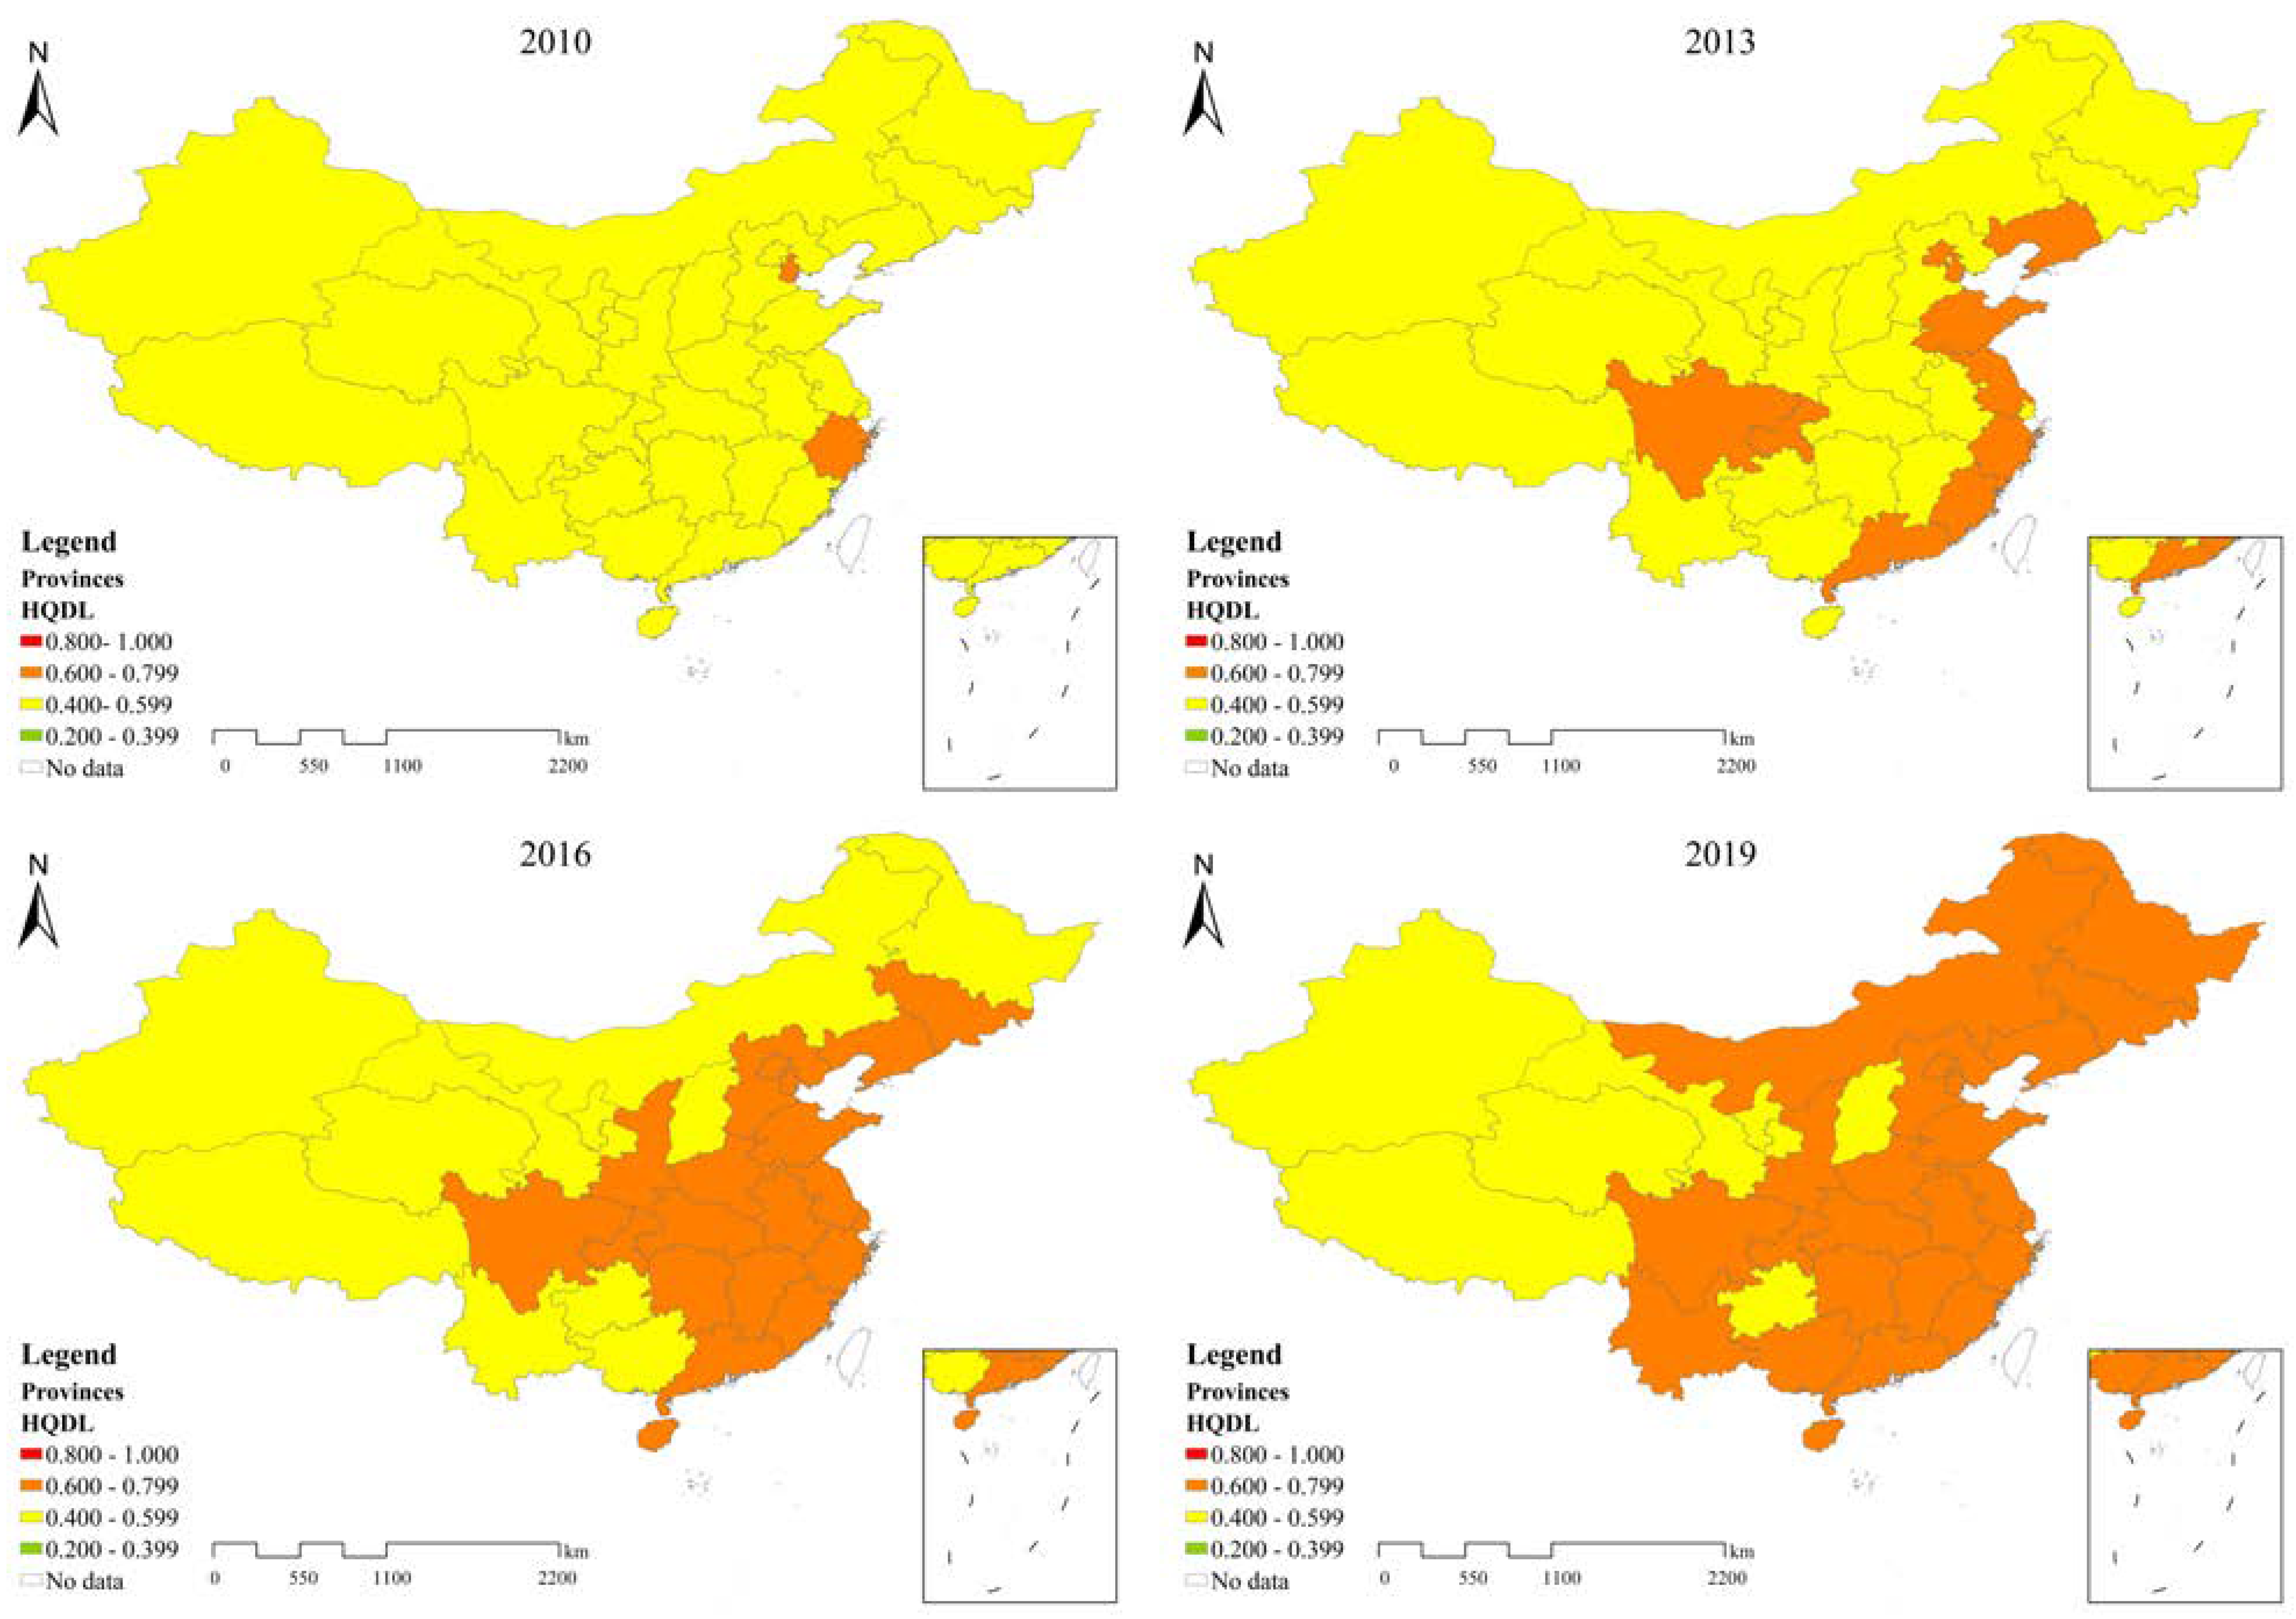
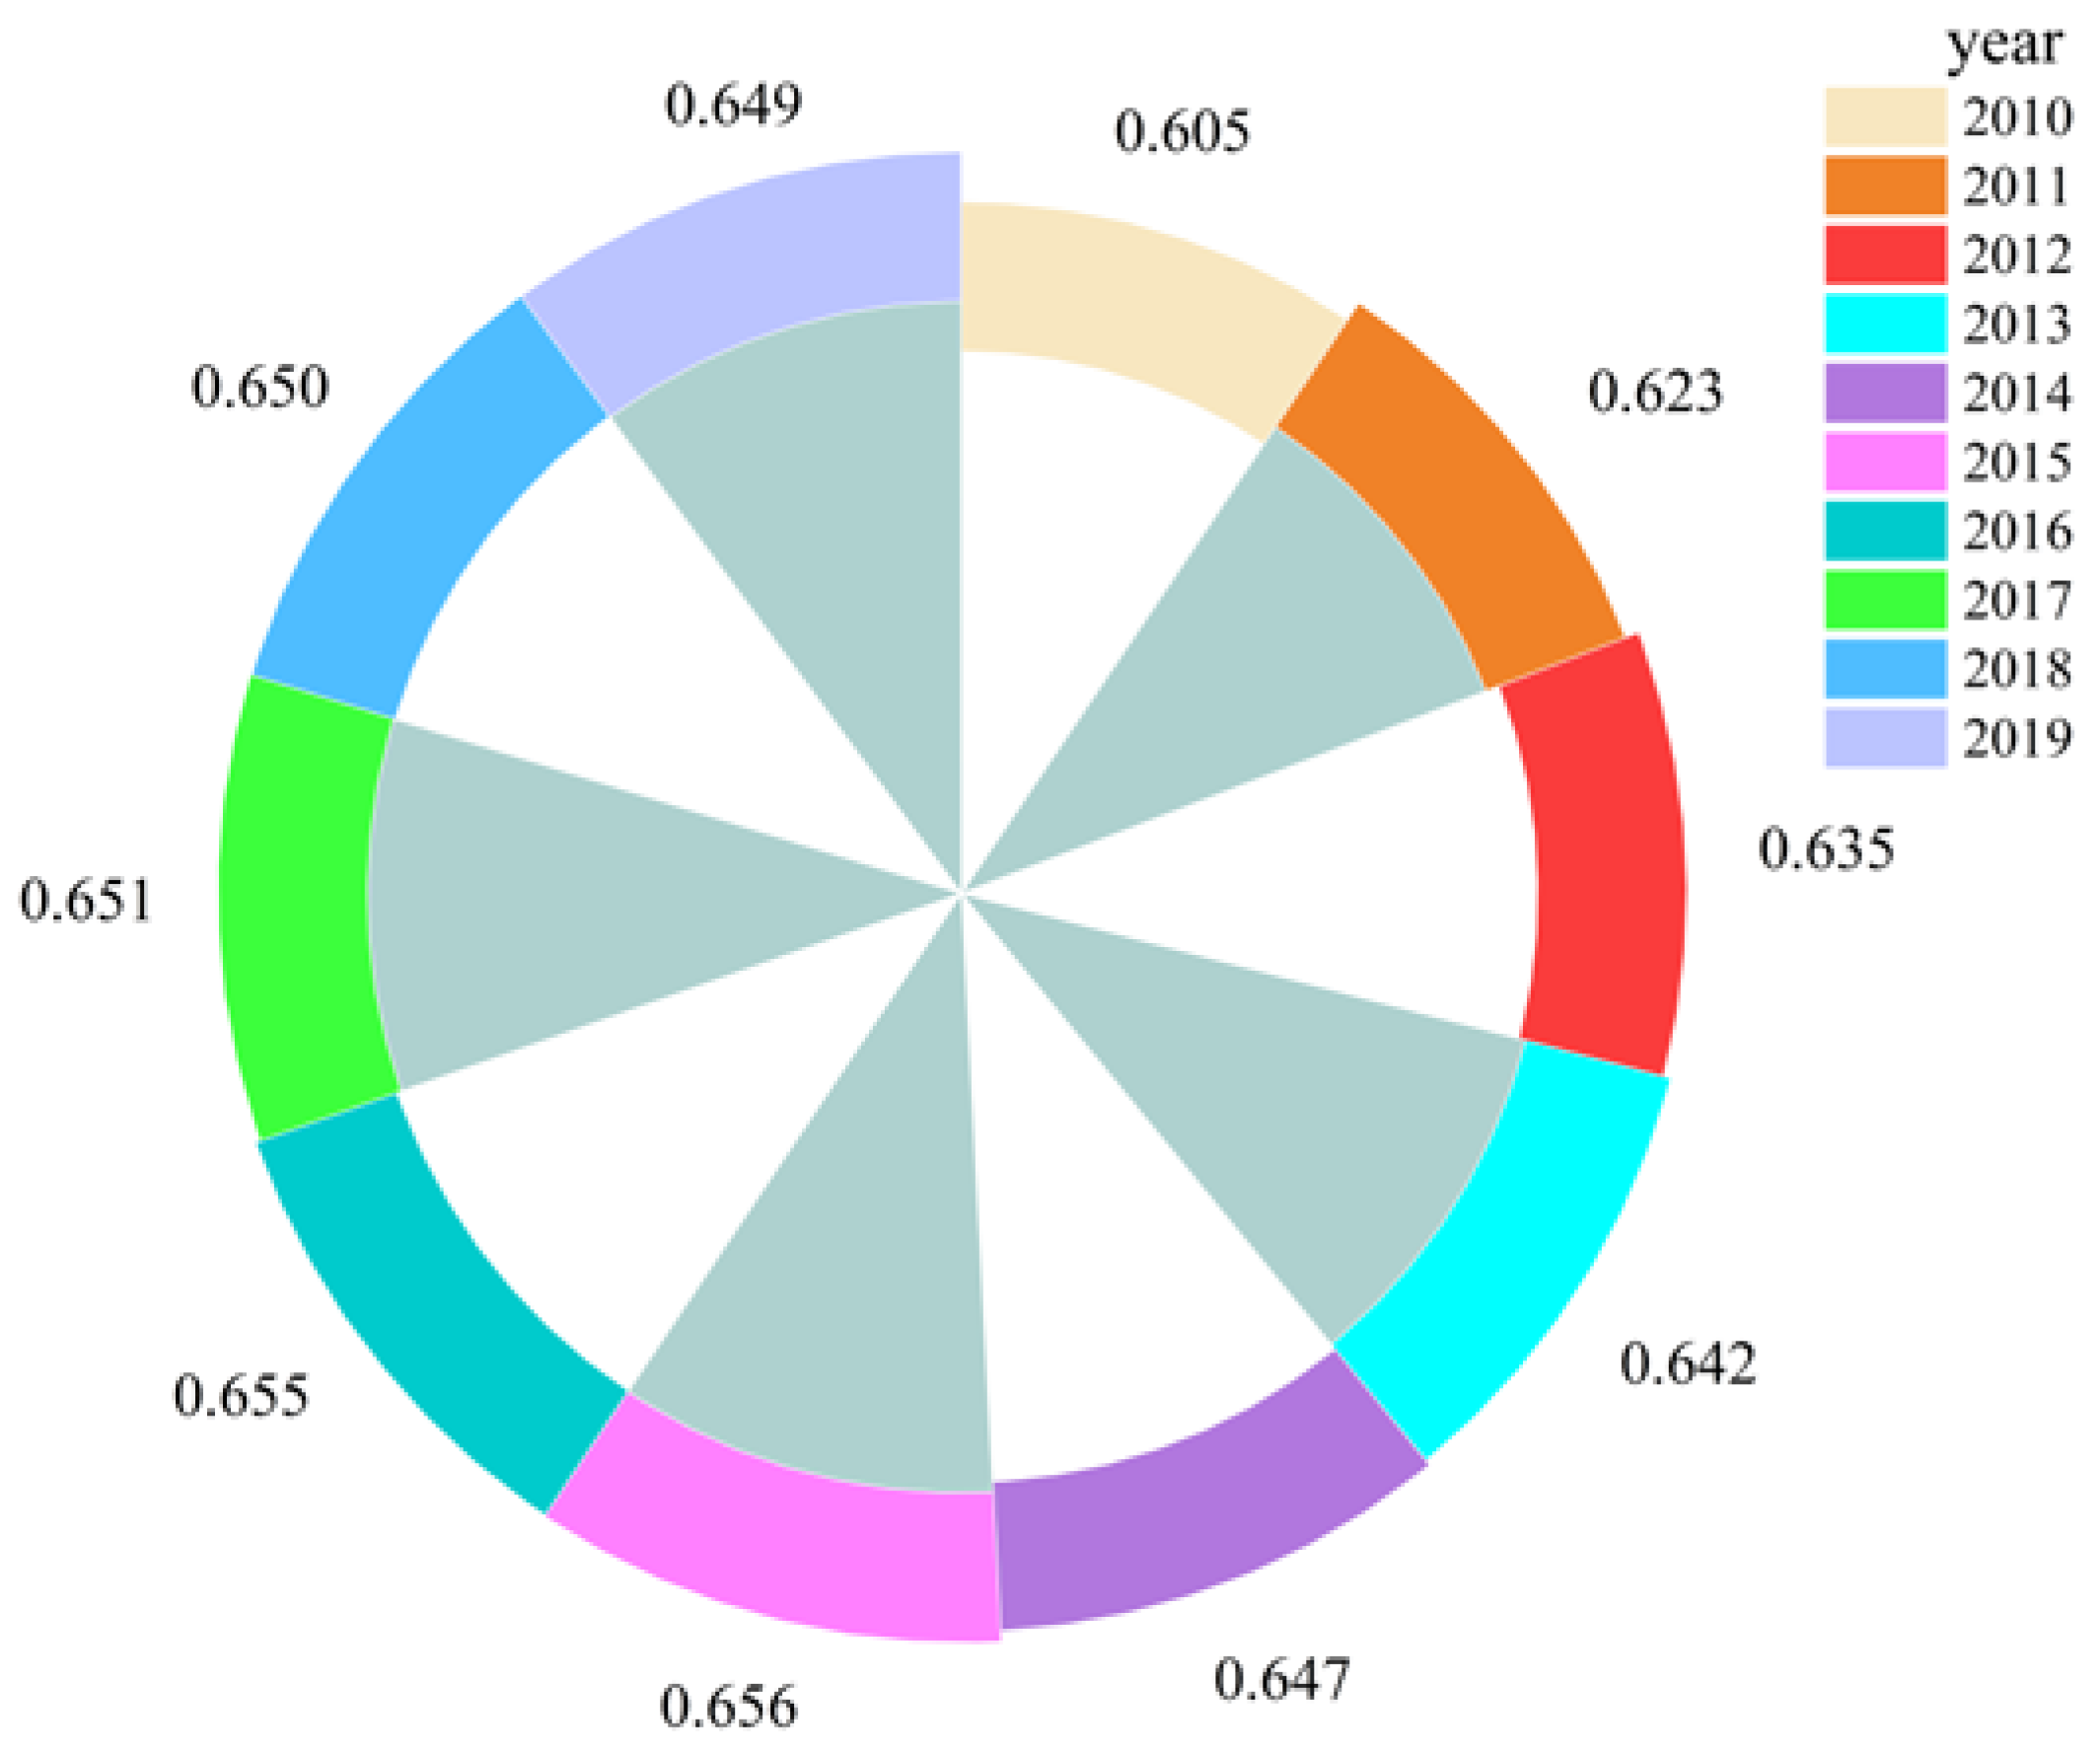
4.2. Evolution of HQDL in China
4.3. Evolution of SED
4.3.1. Evolution of SED of Each Indicator
4.3.2. Analysis of the Relative Level of Economic-Social Development
5. Discussion
5.1. Spatiotemporal Variation of HQDL
5.2. Discussion on SED of HQD and Indicators
5.3. Constraint Effects of Water Resources on Regional HQD
6. Conclusions and Policy Implication
6.1. Conclusions
6.2. Policy Implication
Author Contributions
Funding
Institutional Review Board Statement
Informed Consent Statement
Data Availability Statement
Acknowledgments
Conflicts of Interest
References
- Jiang, L.; Zuo, Q.T.; Ma, J.X.; Zhang, Z.Z. Evaluation and prediction of the level of high-quality development: A case study of the Yellow River Basin, China. Ecol. Indic. 2021, 129, 107994. [Google Scholar] [CrossRef]
- Simona, T. Emerging Biophilic Urbanism: The Value of the Human–Nature Relationship in the Urban Space. Sustainability 2020, 12, 5487. [Google Scholar] [CrossRef]
- Kroll, C.; Warchold, A.; Pradhan, P. Sustainable Development Goals (SDGs): Are we successful in turning trade-offs into synergies? Palgrave Commun. 2019, 5, 140–150. [Google Scholar] [CrossRef] [Green Version]
- Tian, W.; Li, W.H.; Song, H.F.; Yue, H.D. Analysis on the difference of regional high-quality development in Beijing-Tianjin-Hebei city cluster. Procedia Comput. Sci. 2022, 199, 1184–1191. [Google Scholar] [CrossRef]
- China Center for International Economic Exchanges; Columbia University’s Earth Institute; The Ali Institute. Evaluation Report on the Sustainable Development of China; Social Sciences Academic Press: Beijing, China, 2020. [Google Scholar]
- Cao, J.L.; Ge, C.R. Research on the Impact of Technology Innovation on Quantity and Quality of Economic Growth in the Yangtze River Delta of China: A Comparative Study. Int. J. Sustain. Dev. Plan. 2021, 16, 1455–1464. [Google Scholar] [CrossRef]
- Mlachila, M.; Tapsoba, R.; Tapsoba, S. A Quality of Growth Index for Developing Countries: A Proposal; IMF Working Papers; International Monetary Fund: Washington, DC, USA, 2014; Volume 2014, p. 1. [Google Scholar] [CrossRef] [Green Version]
- Pan, W.; Wang, J.; Lu, Z.; Liu, Y.S.; Li, Y.R. High-quality development in China: Measurement system, spatial pattern, and improvement paths. Habitat Int. 2021, 118, 102458. [Google Scholar] [CrossRef]
- Aslam, S.; Aftab, H.; Martins, J.M.; Mata, M.N.; Qureshi, H.A.; Adriano, A.M.; Mata, P.N. Sustainable Model: Recommendations for Water Conservation Strategies in a Developing Country Through a Psychosocial Wellness Program. Water 2021, 13, 1984. [Google Scholar] [CrossRef]
- Grimaldi, M.; Pellecchia, V.; Fasolino, I.; Martellozzo, F.; Murgante, B. Urban Plan and Water Infrastructures Planning: A Methodology Based on Spatial ANP. Sustainability 2017, 9, 771. [Google Scholar] [CrossRef] [Green Version]
- Luo, J. Research on the Correlation between Water Resources Utilization and Economic Growth- Based on VAR Model. World Sci. Res. J. 2021, 7, 32–44. [Google Scholar] [CrossRef]
- Wang, W.; Tang, D.; Pilgrim, M.; Liu, J. Water resources compound systems: A macro approach to analysing water resource issues under changing situations. Water 2016, 8, 2. [Google Scholar] [CrossRef] [Green Version]
- Hatamkhani, A.; Shourian, M.; Moridi, A. Optimal Design and Operation of a Hydropower Reservoir Plant Using a WEAP-Based Simulation–Optimization Approach. Water Resour. Manag. 2021, 35, 1637–1652. [Google Scholar] [CrossRef]
- Nava, L.F.; Brown, C.; Demeter, K.; Lasserre, F.; Milanés-Murcia, M.; Mumme, S.; Sandoval-Solis, S. Existing opportunities to adapt the Rio Grande/bravo basin water resources allocation framework. Water 2016, 8, 291. [Google Scholar] [CrossRef] [Green Version]
- Hatamkhani, A.; Moridi, A.; Yazdi, J. A simulation—Optimization models for multi-reservoir hydropower systems design at watershed scale. Renew. Energ. 2020, 149, 253–263. [Google Scholar] [CrossRef]
- Guan, H.P.; Chen, L.H.; Huang, S.P.; Yan, C.; Wang, Y. Multi-objective optimal allocation of water resources based on ‘three red lines’ in Qinzhou, China. Water Policy 2020, 22, 541–560. [Google Scholar] [CrossRef]
- Avarideh, F.; Attari, J.; Moridi, A. Modelling Equitable and Reasonable Water Sharing in Transboundary Rivers: The Case of Sirwan-Diyala River. Water Resour. Manag. 2017, 31, 1191–1207. [Google Scholar] [CrossRef]
- Moridi, A.; Yazdi, J. Optimal Allocation of Flood Control Capacity for Multi-Reservoir Systems Using Multi-Objective Optimization Approach. Water Resour. Manag. 2017, 31, 4521–4538. [Google Scholar] [CrossRef]
- Yazdi, J.; Moridi, A. Multi-Objective Differential Evolution for Design of Cascade Hydropower Reservoir Systems. Water Resour. Manag. 2018, 32, 4779–4791. [Google Scholar] [CrossRef]
- Jing, Z.R.; Wang, J.M. Sustainable development evaluation of the society–economy–environment in a resource-based city of China:A complex network approach. J. Clean. Prod. 2020, 263, 121510. [Google Scholar] [CrossRef]
- Dang, V.T.; Wang, J.M.; Dang, W.V. An Integrated Fuzzy AHP and Fuzzy TOPSIS Approach to Assess Sustainable Urban Development in an Emerging Economy. Int. J. Environ. Res. Public Health 2019, 16, 2902. [Google Scholar] [CrossRef] [Green Version]
- Sun, Z.; Ma, H. Assessment of the sustainable development of the Beijing-Tianjin-Hebei urban agglomeration based on a back propagation neural network. Acta Ecol. Sin. 2018, 38, 4434–4444. [Google Scholar] [CrossRef]
- Hai, Y.S. Urban Sustainable Development Evaluation Based on System Dynamic Model. Adv. Mater. Res. 2012, 1793, 518–523. [Google Scholar] [CrossRef]
- Bian, D.H.; Yang, X.H.; Wu, F.F.; Babuna, P.; Luo, Y.K.; Wang, B.; Chen, Y.J. A three-stage hybrid model investigating regional evaluation, pattern analysis and obstruction factor analysis for water resource spatial equilibrium in China. J. Clean. Prod. 2022, 331, 129940. [Google Scholar] [CrossRef]
- Chen, W.; Sun, W.; Zhao, H.X. The spatial imbalanced pattern and state assessment of regional development. Acta Geogr. Sin. 2010, 65, 1209–1217. (In Chinese) [Google Scholar]
- Lu, D.D. The development of economic geography and its function on strategy consultation. Econ. Geogr. 2011, 31, 529–535. (In Chinese) [Google Scholar] [CrossRef]
- Zuo, Q.T.; Han, C.H.; Ma, J.X.; Wang, X. Theoretical Method and Applied Research Framework of Water Resources Spatial Equilibrium. Yellow River 2019, 41, 113–118. (In Chinese) [Google Scholar] [CrossRef]
- Chen, M.; Lu, D.; Tang, Z.P.; Lu, D.D.; Liu, H.; Ma, L. The provincial pattern of the relationship between urbanization and economic development in China. J. Geogr. Sci. 2014, 24, 33–45. [Google Scholar] [CrossRef]
- Chen, Y.P.; Fu, B.J.; Zhao, Y.; Wang, K.B.; Zhao, M.M.; Ma, J.F.; Wu, J.H.; Xu, C.; Liu, W.G.; Wang, H. Sustainable development in the Yellow River Basin: Issues and strategies. J. Clean. Prod. 2020, 263, 121223. [Google Scholar] [CrossRef]
- Xu, Z.; Chau, S.N.; Chen, X.Z.; Zhang, J.; Li, Y.J.; Thomas, D.; Wang, J.Y.; Winkler, J.A.; Fan, F.; Huang, B.R.; et al. Assessing progress towards sustainable development over space and time. Nature 2020, 577, 74–78. [Google Scholar] [CrossRef]
- Huang, T.H.; Zhao, X.Y.; Ai, C.H.; Chen, S.F.; Wang, Y.; Hu, X.Y. Evaluation of the sustainable development level of countries along the Belt and Road and its impact factors: Empirical analysis based on the Super-efficiency slacks-based measure and Tobit measure models. Chin. J. Popul. Resour. 2021, 19, 162–170. [Google Scholar] [CrossRef]
- Xu, G.H.; Ge, Q.S.; Gong, P.; Fang, X.Q.; Cheng, B.B.; He, B.; Luo, Y.; Xu, B. Societal response to challenges of global change and human sustainable development. Chin. Sci. Bull. 2013, 58, 3161–3168. [Google Scholar] [CrossRef] [Green Version]
- Liao, H.X.; Ji, Y.L.; Peng, S.L. Resource and environment carrying capacity and sustainable development. Ecol. Environ. Sci. 2016, 25, 1253–1258. [Google Scholar]
- Halleröd, B.; Seldén, D. The Multi-dimensional Characteristics of Wellbeing: How Different Aspects of Wellbeing Interact and Do Not Interact with Each Other. Soc. Indic. Res. 2013, 113, 807–825. [Google Scholar] [CrossRef]
- Zuo, Q.T.; Chen, H.; Dou, M.; Zhang, Y.Y.; Li, D.F. Experimental analysis of the impact of sluice regulation on water quality in the highly polluted Huai River Basin, China. Environ. Monit. Assess. 2015, 187, 1–15. [Google Scholar] [CrossRef] [PubMed] [Green Version]
- Luo, Z.L.; Zuo, Q.T. Evaluating the coordinated development of social economy, water, and ecology in a heavily disturbed basin based on the distributed hydrology model and the harmony theory. J. Hydrol. 2019, 574, 226–241. [Google Scholar] [CrossRef]
- Yang, J.Y.; Zhang, L.L. Fuzzy Comprehensive Evaluation Method on Water Environmental Quality Based on Entropy Weight with Consideration of Toxicology of Evaluation Factors. Adv. Mater. Res. 2011, 356–360, 2383–2388. [Google Scholar] [CrossRef]
- Qiu, M.; Yang, Z.L.; Zuo, Q.T.; Wu, Q.S.; Jiang, L.; Zhang, Z.Z.; Zhang, J.W. Evaluation on the relevance of regional urbanization and ecological security in the nine provinces along the Yellow River, China. Ecol. Indic. 2021, 132, 108346. [Google Scholar] [CrossRef]
- Zuo, Q.T.; Han, C.H.; Ma, J.X. Application rules and quantification methods of water resources spatial equilibrium theory. Hydro-Sci. Eng. 2019, 6, 50–58. (In Chinese) [Google Scholar] [CrossRef]
- National Bureau of Statistics of the People’s Republic of China. China Statistical Yearbook on Environment; China Statistics Publishing House: Beijing, China, 2021.
- Wei, X.X.; Shen, L.Y.; Liu, Z.; Luo, L.Y.; Wang, J.H.; Chen, Y. Comparative analysis on the evolution of ecological carrying capacity between provinces during urbanization process in China. Ecol. Indic. 2020, 112, 106179. [Google Scholar] [CrossRef]
- Zhang, F.; Xing, Z.S.; Zhao, C.Y.; Deng, J.L.; Yang, B.; Tian, Q.; Rees, W.H.; Badreldin, N. Characterizing long-term soil and water erosion and their interactions with various conservation practices in the semi-arid Zulihe basin, Dingxi, Gansu, China. Ecol. Eng. 2017, 106, 458–470. [Google Scholar] [CrossRef]
- Xiang, X.; Kong, L.; Sun, H.; Lei, X.; Liang, J.; Li, Y. Recent Developments in the Application of Water Resource Dispatching Systems in China. Water 2021, 13, 26. [Google Scholar] [CrossRef]
- Wang, Z.; Xu, Y.; Zhang, Z.; Zhang, Y. Review: Acid Mine Drainage (AMD) in Abandoned Coal Mines of Shanxi, China. Water 2021, 13, 8. [Google Scholar] [CrossRef]
- Jia, J.X.; Ma, G.R.; Qin, C.; Wang, L.Y. Place-based policies, state-led industrialisation, and regional development: Evidence from China’s Great Weste Development Programme. Eur. Econ. Rev. 2020, 123, 103398. [Google Scholar] [CrossRef]
- Liu, S.Y.; Zhang, F.Z.; Wu, F.L. Contrasting migrants’ sense of belonging to the city in selected peri-urban neighbourhoods in Beijing. Cities 2022, 120, 103499. [Google Scholar] [CrossRef]
- Eheliyagoda, D.; Li, J.H.; Geng, Y.; Zeng, X.L. The role of China’s aluminum recycling on sustainable resource and emission pathways. Resour. Policy 2022, 76, 102552. [Google Scholar] [CrossRef]
- Zhang, M.; Wang, L.J.; Ma, P.P.; Wang, W.W. Urban-rural income gap and air pollution: A stumbling block or stepping stone. Environ. Impact Asses. 2022, 94, 106758. [Google Scholar] [CrossRef]
- Kuang, Y.M.; Lin, B.Q. Public participation and city sustainability: Evidence from Urban Garbage Classification in China. Sustain. Cities Soc. 2021, 67, 102741. [Google Scholar] [CrossRef]
- Zhang, J.X.; Zhang, N.; Bai, S.X. Assessing the carbon emission changing for sustainability and high-quality economic development. Environ. Technol. Innov. 2021, 22, 101464. [Google Scholar] [CrossRef]
- KhazaiPoul, A.; Moridi, A.; Yazdi, J. Multi-Objective Optimization for Interactive Reservoir-Irrigation Planning Considering Environmental Issues by Using Parallel Processes Technique. Water Resour. Manag. 2019, 33, 5137–5151. [Google Scholar] [CrossRef]
- Moridi, A.; Yazdi, J. Sediment Flushing of Reservoirs under Environmental Considerations. Water Resour. Manag. 2017, 31, 1899–1914. [Google Scholar] [CrossRef]
- Zhu, D.M.; Chang, Y.J. Urban water security assessment in the context of sustainability and urban water management transitions: An empirical study in Shanghai. J. Clean. Prod. 2020, 75, 122968. [Google Scholar] [CrossRef]
- Meng, X.M.; Tu, L.P.; Yan, C.; Wu, L.F. Forecast of annual water consumption in 31 regions of China considering GDP and population. Sustain. Prod. Consump. 2021, 27, 713–736. [Google Scholar] [CrossRef]
- He, Y.H.; Lin, K.R.; Zhang, F.; Wang, Y.L.; Chen, X.H. Coordination degree of the exploitation of water resources and its spatial differences in China. Sci. Total Environ. 2018, 644, 1117–1127. [Google Scholar] [CrossRef] [PubMed]
- Li, D.L.; Zuo, Q.T.; Zhang, Z.Z. A new assessment method of sustainable water resources utilization considering fairness-efficiency-security: A case study of 31 provinces and cities in China. Sustain. Cities Soc. 2022, 81, 103839. [Google Scholar] [CrossRef]


| Target Layer | Subsystem Layer | Indicator Layer | Serial Number | Indicator Attributes |
|---|---|---|---|---|
| HQDL | Resource utilization | Energy consumption per 10,000 yuan GDP (tons of standard coal) | A1 | − |
| Comprehensive utilization rate of industrial solid waste (%) | A2 | + | ||
| Grain production per unit area (kg/hectare) | A3 | + | ||
| Resource supply penetration rate (%) | A4 | + | ||
| Economic society | Engel coefficient | B1 | − | |
| Social security and stability index | B2 | + | ||
| GDP per capita (yuan) | B3 | + | ||
| Urbanization rate (%) | B4 | + | ||
| Per capita income ratio of urban and rural residents | B5 | − | ||
| Ecological environment | Total wastewater discharged per 10,000 yuan GDP (ton) | C1 | − | |
| Carbon dioxide emissions per 10,000 yuan GDP (ton) | C2 | − | ||
| Harmless treatment rate of garbage (%) | C3 | + | ||
| Coverage rate of green space in the completed area (%) | C4 | + | ||
| The proportion of total investment in the treatment of the environment in GDP (%) | C5 | + | ||
| Human-water relationship | per capita water resources (m3) | D1 | + | |
| per capita water consumption (m3) | D2 | + | ||
| Water resource reuse rate (%) | D3 | + | ||
| Water penetration rate (%) | D4 | + | ||
| Utilization ratio of water resources (%) | D5 | − |
| Evaluation Index | The Characteristic Value | ||||
|---|---|---|---|---|---|
| a | b | c | d | e | |
| A1 | 3.6 | 2.2 | 0.8 | 0.5 | 0.2 |
| A2 | 1.6 | 41.0 | 80.3 | 95.0 | 109.8 |
| A3 | 2741.2 | 4258.4 | 5775.7 | 7381.3 | 8987.0 |
| A4 | 47.3 | 72.4 | 97.5 | 103.7 | 100.0 |
| B1 | 12,185.8 | 6310.5 | 435.1 | 290.1 | 145.1 |
| B2 | 11,593.8 | 35,753.0 | 59,912.2 | 120,465.8 | 181,019.3 |
| B3 | 0.1 | 0.4 | 0.7 | 0.9 | 1.0 |
| B4 | 20.4 | 41.9 | 63.5 | 81.0 | 98.6 |
| B5 | 4.5 | 3.5 | 2.4 | 2.1 | 1.7 |
| C1 | 40.2 | 25.3 | 10.4 | 7.1 | 3.7 |
| C2 | 4.4 | 2.3 | 0.2 | 0.1 | 0.0 |
| C3 | 0.2 | 0.4 | 0.7 | 3.3 | 6.0 |
| C4 | 16.3 | 28.3 | 40.4 | 47.2 | 54.0 |
| C5 | 34.2 | 62.6 | 91.0 | 100.5 | 100.0 |
| D1 | 46.7 | 666.8 | 1287.0 | 85,168.5 | 169,050.1 |
| D2 | 2.4 | 37.5 | 72.7 | 89.1 | 105.6 |
| D3 | 12,185.8 | 6310.5 | 435.1 | 290.1 | 145.1 |
| D4 | 920.0 | 504.0 | 88.0 | 44.3 | 0.6 |
| D5 | 60.8 | 79.6 | 98.5 | 104.2 | 100.0 |
| Lever | No Lever | Very Poor | Poor | Medium | Good | Excellent | Ideal |
|---|---|---|---|---|---|---|---|
| HQDL | 0 | (0, 0.2) | [0.2, 0.4) | [0.4, 0.6) | [0.6, 0.8) | [0.8, 1) | 1 |
| Indicators | SED | |||||||||
|---|---|---|---|---|---|---|---|---|---|---|
| 2010 | 2011 | 2012 | 2013 | 2014 | 2015 | 2016 | 2017 | 2018 | 2019 | |
| A1 | 0.403 | 0.505 | 0.541 | 0.538 | 0.556 | 0.576 | 0.596 | 0.589 | 0.577 | 0.579 |
| A2 | 0.643 | 0.684 | 0.732 | 0.758 | 0.721 | 0.779 | 0.772 | 0.705 | 0.716 | 0.725 |
| A3 | 0.823 | 0.820 | 0.827 | 0.824 | 0.834 | 0.822 | 0.863 | 0.853 | 0.861 | 0.854 |
| A4 | 0.942 | 0.946 | 0.901 | 0.931 | 0.945 | 0.958 | 0.926 | 0.946 | 0.943 | 0.949 |
| B1 | 0.479 | 0.479 | 0.494 | 0.491 | 0.486 | 0.492 | 0.489 | 0.490 | 0.487 | 0.494 |
| B2 | 0.763 | 0.750 | 0.751 | 0.700 | 0.680 | 0.685 | 0.685 | 0.718 | 0.713 | 0.721 |
| B3 | 0.495 | 0.579 | 0.636 | 0.693 | 0.736 | 0.742 | 0.759 | 0.799 | 0.807 | 0.796 |
| B4 | 0.753 | 0.775 | 0.785 | 0.795 | 0.812 | 0.826 | 0.840 | 0.851 | 0.859 | 0.863 |
| B5 | 0.058 | 0.056 | 0.055 | 0.052 | 0.051 | 0.051 | 0.051 | 0.051 | 0.050 | 0.049 |
| C1 | 0.631 | 0.733 | 0.759 | 0.817 | 0.844 | 0.848 | 0.816 | 0.764 | 0.713 | 0.666 |
| C2 | 0.573 | 0.568 | 0.534 | 0.521 | 0.519 | 0.511 | 0.489 | 0.477 | 0.468 | 0.488 |
| C3 | 0.824 | 0.871 | 0.884 | 0.889 | 0.916 | 0.925 | 0.926 | 0.930 | 0.929 | 0.916 |
| C4 | 0.862 | 0.873 | 0.909 | 0.861 | 0.923 | 0.929 | 0.924 | 0.934 | 0.945 | 0.948 |
| C5 | 0.537 | 0.521 | 0.556 | 0.581 | 0.561 | 0.528 | 0.549 | 0.505 | 0.553 | 0.561 |
| D1 | 0.334 | 0.263 | 0.309 | 0.365 | 0.276 | 0.332 | 0.352 | 0.288 | 0.280 | 0.290 |
| D2 | 0.479 | 0.479 | 0.494 | 0.491 | 0.486 | 0.492 | 0.489 | 0.490 | 0.487 | 0.494 |
| D3 | 0.581 | 0.543 | 0.555 | 0.557 | 0.573 | 0.588 | 0.578 | 0.595 | 0.591 | 0.592 |
| D4 | 0.964 | 0.964 | 0.948 | 0.984 | 0.974 | 0.974 | 0.945 | 0.980 | 0.973 | 0.983 |
| D5 | 0.352 | 0.429 | 0.402 | 0.346 | 0.396 | 0.405 | 0.395 | 0.405 | 0.393 | 0.363 |
Publisher’s Note: MDPI stays neutral with regard to jurisdictional claims in published maps and institutional affiliations. |
© 2022 by the authors. Licensee MDPI, Basel, Switzerland. This article is an open access article distributed under the terms and conditions of the Creative Commons Attribution (CC BY) license (https://creativecommons.org/licenses/by/4.0/).
Share and Cite
Wang, J.; Zuo, Q.; Wu, Q.; Jiang, L.; Han, C.; Zhang, W. Evaluation and Spatial Equilibrium Analysis of High-Quality Development Level in Mainland China Considering Water Constraints. Water 2022, 14, 2364. https://doi.org/10.3390/w14152364
Wang J, Zuo Q, Wu Q, Jiang L, Han C, Zhang W. Evaluation and Spatial Equilibrium Analysis of High-Quality Development Level in Mainland China Considering Water Constraints. Water. 2022; 14(15):2364. https://doi.org/10.3390/w14152364
Chicago/Turabian StyleWang, Jiaoyang, Qiting Zuo, Qingsong Wu, Long Jiang, Chunhui Han, and Weiqiang Zhang. 2022. "Evaluation and Spatial Equilibrium Analysis of High-Quality Development Level in Mainland China Considering Water Constraints" Water 14, no. 15: 2364. https://doi.org/10.3390/w14152364