
Alpine Wetland Evolution and Their Response to Climate Change in the Yellow-River-Source National Park from 2000 to 2020
by
 ,
,
Tao Ma
1 ,
,
Yandi She
1,
Li Zhao
2,*,
Bixia Hu
1,
Xueke Feng
1,
Jing Zhao
3 and
Zhizhong Zhao
1,4,* 1
College of Agriculture and Animal Husbandry, Qinghai University, Xining 810016, China
2
College of Natural Resources and Environment, South China Agricultural University, Guangzhou 510642, China
3
Qinghai Youyuan Space Information Technology Co., Ltd., Xining 810000, China
4
College of Ecological Environment and Resources, Qinghai Minzu University, Xining 810016, China
*
Authors to whom correspondence should be addressed.
Water 2022, 14(15), 2351; https://doi.org/10.3390/w14152351
Submission received: 17 June 2022
/
Revised: 24 July 2022
/
Accepted: 27 July 2022
/
Published: 29 July 2022
(This article belongs to the Section Water and Climate Change)
Abstract
:Clarifying the response of wetland changes to climate change can improve the scientific conservation and utilization capabilities of wetland ecosystems, which is vital for their sustainable development. In this study, the spatial distribution and area changes of the different types of wetlands in the Yellow-River-Source National Park (YRSNP) were obtained using the object-based classification method for the years 2000, 2010, and 2020. The relationship between wetland change and climate factors was investigated by combining grey relation analysis and correlation analysis. The response of wetland change to different climatic factors was consequently clarified. The results showed that the river wetlands and lake wetlands increased significantly from the year 2000 to 2010 (4.04% and 4.21%, respectively). However, the total wetland area demonstrated a decreasing trend (7.08%), primarily due to the significant decrease in the marsh wetlands (6.81%). The total wetland area demonstrated a slightly increasing trend from the year 2010 to 2020 (0.14%), in which river wetlands and lake wetlands increased by 3.25% and 2.09%, respectively, while the marsh wetlands demonstrated a tendency to be stable. From the year 2000 to 2010, 75.53% of precipitation and 27.68% of temperature demonstrated a significant increase and an obvious warm–humid climate trend. However, from the year 2010 to 2020, the trend of increasing precipitation weakened, the temperature decreased slightly, and the warm–humid climate trend was not significant. From the year 2000 to 2020, the YRSNP river wetlands and lake wetlands were significantly and positively correlated with temperature and precipitation, while the marsh wetlands were most affected by climate warming, especially the warm-season temperatures. The spatial–temporal difference was not obvious in the correlation coefficient between marsh wetlands area change and the precipitation and temperature. The results of the study can provide a theoretical basis and technical support for the conservation of wetland ecosystems in the Three-River-Source National Park.
1. Introduction
The alpine wetland ecosystem is an integral part of the ecosystem of the Yellow-River-Source National Park, having ecological functions such as water conservation, biodiversity maintenance, climate regulation, carbon storage, and carbon sequestration [1,2,3]. It is the most important water conservation and recharge area in the upper reaches of the Yellow River [4,5]. Moreover, alpine wetlands play an important role in the transformation of water and energy between the soil and the atmosphere, having a significant impact on climate change [6]. However, in recent years, the vegetation cover of alpine wetlands and primary productivity have decreased due to climate change and intensified anthropogenic activities, leading to reduced flow and seasonal droughts in the Yellow River, thereby seriously threatening the sustainable development of the regional ecosystem [7,8]. Therefore, research on the evolution of alpine wetlands and their response to climate change in the YRSNP is vital for maintaining the sustainability of the alpine wetland ecosystem and the high-quality development of the Yellow River Basin.
At present, the research methods of alpine wetland evolution can be divided into two categories: traditional field investigation and remote sensing monitoring. The traditional field investigation primarily investigates the wetland area, location, and surrounding environment manually [9], which has the disadvantages of having a long cycle and high cost. The development of remote sensing technology has gradually led to it becoming the primary method of studying the evolution of alpine wetlands due to its multi-temporal, high precision, and low cost. However, remote sensing monitoring of alpine wetlands usually uses pixel-based, supervised, and unsupervised classification algorithms, with no consideration of the relationship between terrain features, structure, texture, and adjacent pixels in existing studies [10,11,12]. The object-based classification methods group objects with similar characteristics, such as similar pixel shape, color, texture, or terrain features, and classify them according to their characteristics, which can effectively reduce the “salt and pepper” effects and significantly improve classification accuracy [13,14,15]. For example, Mahdianpari et al. [16] compared the accuracy of pixel-based and object-based classifications of the Newfoundland wetlands using the Google Earth Engine (GEE) and found that the accuracy of the object-based classification was higher than the pixel-based classification method. Object-based decision rules as pre-constraints have, therefore, become an effective means for conducting wetland classification and evolution research. In addition, considering alpine wetlands are primarily located in the Tibetan Plateau, climate change in this region is more intense than in the other regions, thereby making this ecosystem more sensitive to climate change. At the same time, the harshness of the living environment in the region leads to a relatively low intensity of human activities. A large number of studies have, therefore, shown that the evolution of alpine wetlands is more closely related to climate change [17,18,19], which primarily affects alpine wetland ecosystems through changes in temperature and precipitation [20]. For example, Lang et al. [21] found that alpine wetlands in the Tibetan Plateau continued to increase from 2008 to 2016; the temperature increase was often positively correlated with changes in lakes, rivers, and flooded wetlands, and negatively correlated with changes in marsh wetlands. Zhang et al. [22] used grey relation analysis to determine that the river and lake wetlands of the Pumqu River Basin were primarily influenced by warm-season mean temperature in the southwestern Tibetan Plateau from 2000 to 2018, while the marsh wetlands were primarily correlated with the annual precipitation and warm-season mean temperature. It can be seen that the evolution of different alpine wetland types in different regions varies greatly in response to climate change. There are very few studies on the evolution of alpine wetlands in YRSNP. It is, therefore, urgent to study the evolution of the alpine wetlands and their response to climate change in the YRSNP to promote the ecological protection and construction of the Yellow-River-Source area.
Therefore, the objective of this study was to reveal the evolution of different alpine wetland types in the YRSNP and their response to climate change. The specific research goals were as follows: (1) the object-based classification model was used to realize wetland classification and extraction in the YRSNP from 2000 to 2020, compared the spatial–temporal distribution of different alpine wetland types; (2) combined with changes in temperature and precipitation from 2000 to 2020, the grey relation analysis and correlation analysis were adopted for revealing the response of changes in the alpine wetlands of the YRSNP to climate change, and discussed the relationship between alpine wetlands and climate change. We hope that our research can provide a scientific basis for the subsequent protection and restoration of the wetland ecosystem in YRSNP.
2. Materials and Methods
2.1. Study Area
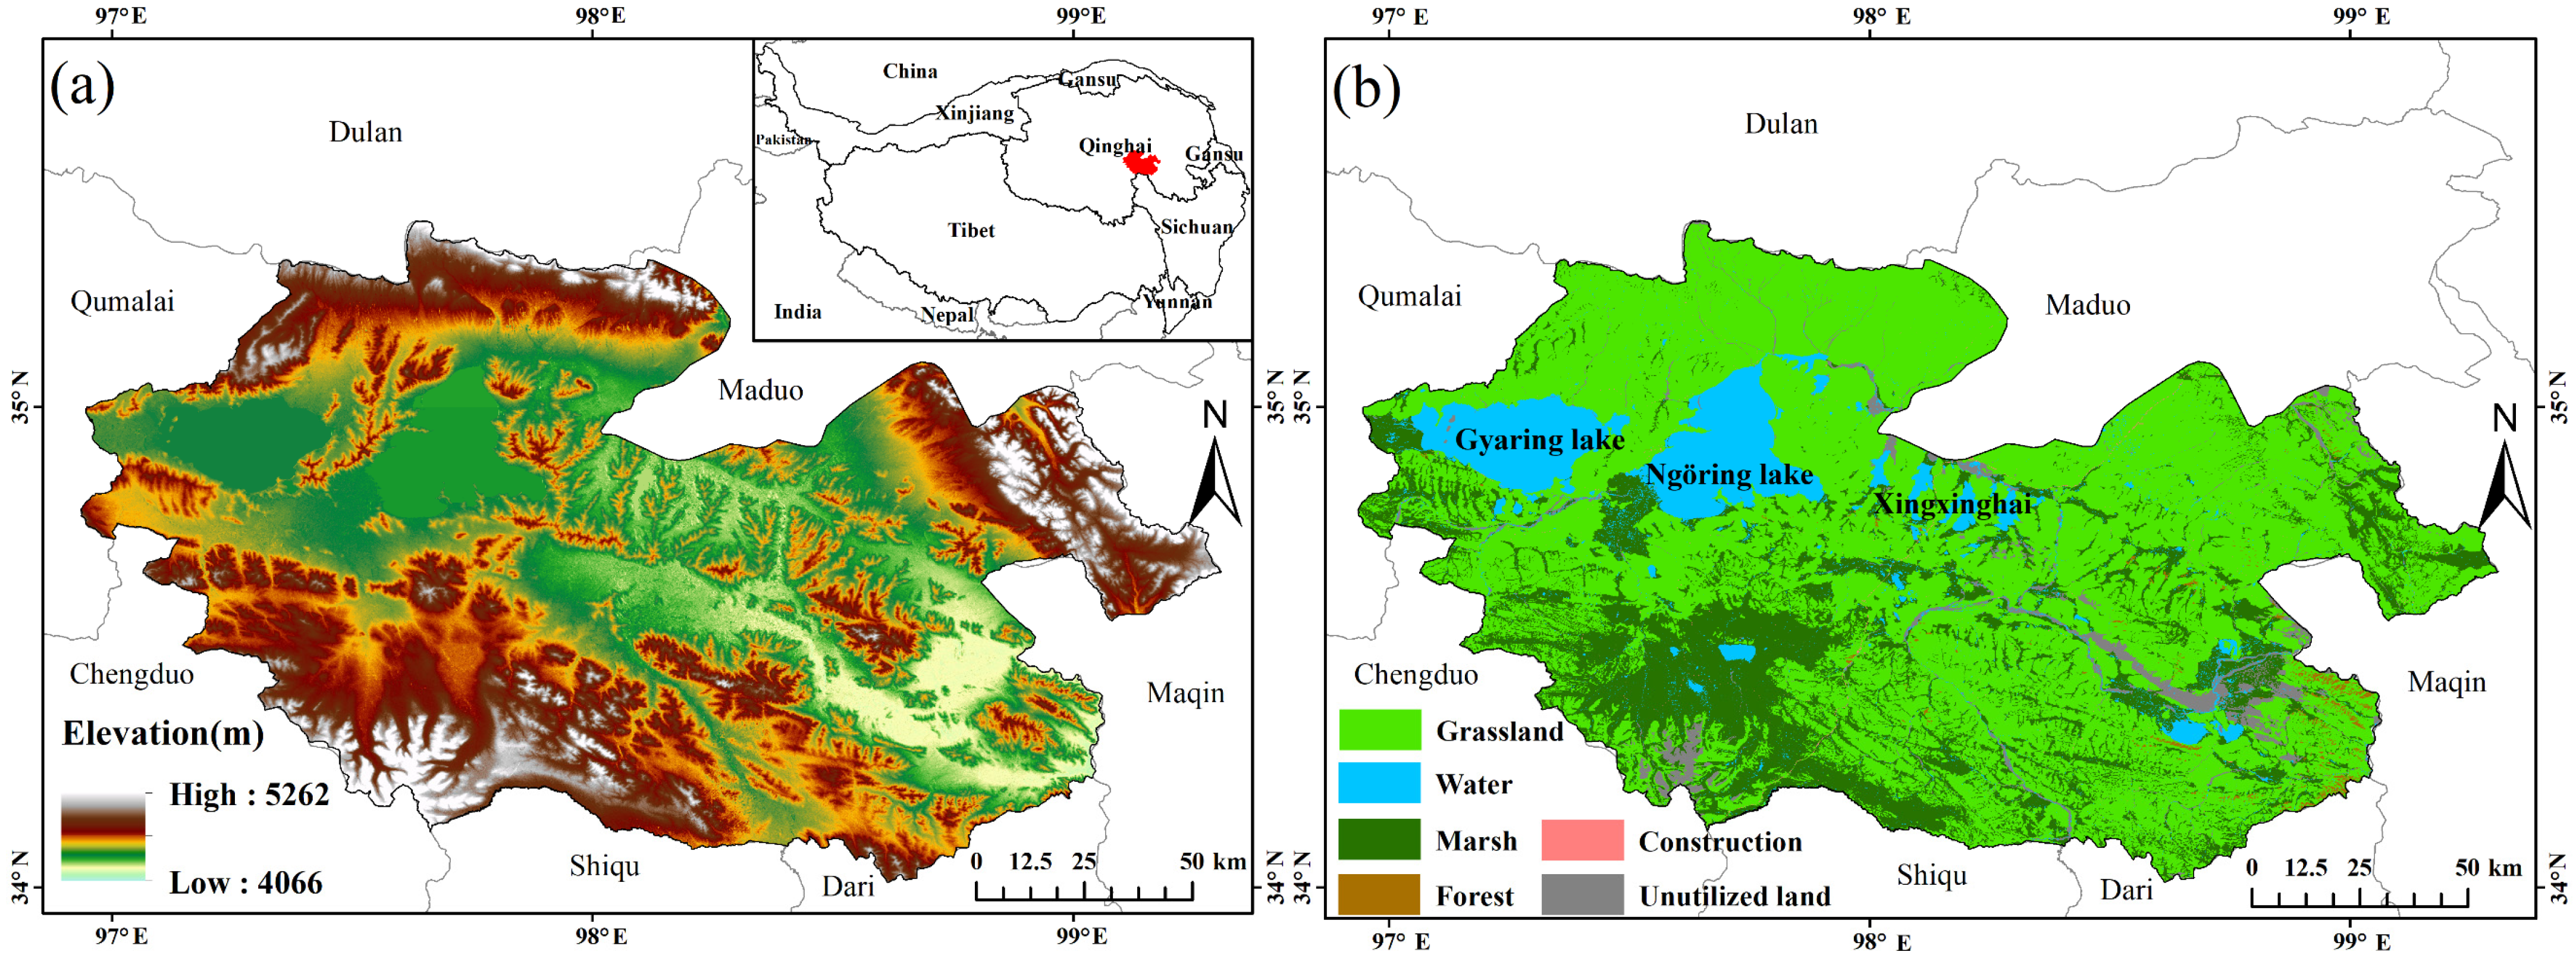
YRSNP is located in the eastern region of the Qinghai–Tibet Plateau, the core area of the Three-River Source (Figure 1), with a geographical range of 34°0′~35°23′ N and 96°56′~99°18′ E, including the counties of Maduo and Qumalai. The area is rich in wetland resources, including the source of the Yellow River, Gyaring lake, Ngöring lake, and Xingxinghai. YRSNP covers an area of 19,023 , accounting for approximately 6.29% of the total area of the Three-River Source, and an average elevation of 4404 m, demonstrating a trend of lower center and higher surroundings [23]. The YRSNP belongs to tundra climate in the Köppen climate classification, which has the characteristics of low temperature, low precipitation, high evaporation, and strong solar radiation. Precipitation is unevenly distributed throughout the year, mostly from May to September, and the temperature decreases with the increase in latitude [24].
2.2. Wetland Classification System
The Ramsar Convention on Wetlands defines wetlands as “areas of marsh, fen, peatland or water, whether natural or artificial, permanent or temporary, with water that is static or flowing, fresh, brackish or salt, including areas of marine water the depth of which at low tide does not exceed 6 m” [25,26]. In this study, the YRSNP wetland classification system includes river wetlands, lake wetlands, and marsh wetlands, which is determined by combining the existing studies on the wetland classification system in the Tibetan Plateau and the Second National Wetland Resources Survey (Table 1).
2.3. Data and Processing
The Landsat remote sensing images from 2000, 2010, and 2020 used in this study were obtained from the United States Geological Survey (https://earthexplorer.usgs.gov/, accessed on 24 December 2021) and covered the period of water abundance (July–October) in 2000, 2010, and 2020 [21], with a spatial resolution of 30 m. The remote sensing images downloaded were then mosaicked and extracted using the ENVI 5.3 software (developed by Exelis Visual Information Solutions, Inc., Boulder, CO, USA) to obtain multi-temporal images based on Landsat 5 TM (2000), Landsat 7 ETM+ (2010), and Landsat 8 OLI (2020), including Blue, Green, Red, NIR, SWIR1, and SWIR2 bands. The meteorological data (temperature, precipitation, and potential evapotranspiration) were acquired from the National Earth System Science Data Center, National Science and Technology Infrastructure of China (http://www.geodata.cn, accessed on 4 March 2022). The projection coordinate system used was GCS_WGS_1984, with a spatial resolution of 1 km [27]. The potential evapotranspiration (PET) data set was obtained by the Hargreaves potential evapotranspiration calculation formula [28]. The calculation formula was as follows [29]:
where PET is the potential evapotranspiration, the unit is mm/month. MaxT, MinT, and MeanT are the highest temperature, lowest temperature, and average temperature in a month, respectively. S0 is the extraterrestrial solar radiation (mm/month) at the top of the Earth’s atmosphere on a horizontal surface.
Additionally, the auxiliary data included the boundary data of the study area, the 2012 National Wetland Resource Survey and the Third National Land Survey data in Qinghai Province, topographic data, and spectral index data. The boundary data of the study area, in addition to the data from the 2012 National Wetland Resource Survey and the third National Land Survey in Qinghai Province, were obtained from the Department of Natural Resources of Qinghai Province (https://zrzyt.qinghai.gov.cn/, accessed on 16 July 2021); the data obtained was in the shapefile format (.shp). The topographic data (including DEM and slope) were obtained from SRTM V3 of the GEE platform, with a spatial resolution of 30 m. The spectral index data were obtained from the GEE, and the annual maximum NDVI and MNDWI based on the Landsat satellite in the corresponding year were obtained by using the img. normalized difference function, with a spatial resolution of 30 m. To facilitate unified data processing, the ArcMap 10.8 software (developed by Environmental Systems Research Institute, Inc., Redlands, CA, USA) was used to reproject the imagery and meteorological and auxiliary data to the China Geodetic Coordinate System 2000, where the spatial resolution was resampled to 30 m.
2.4. Object-Based Wetland Classification Method
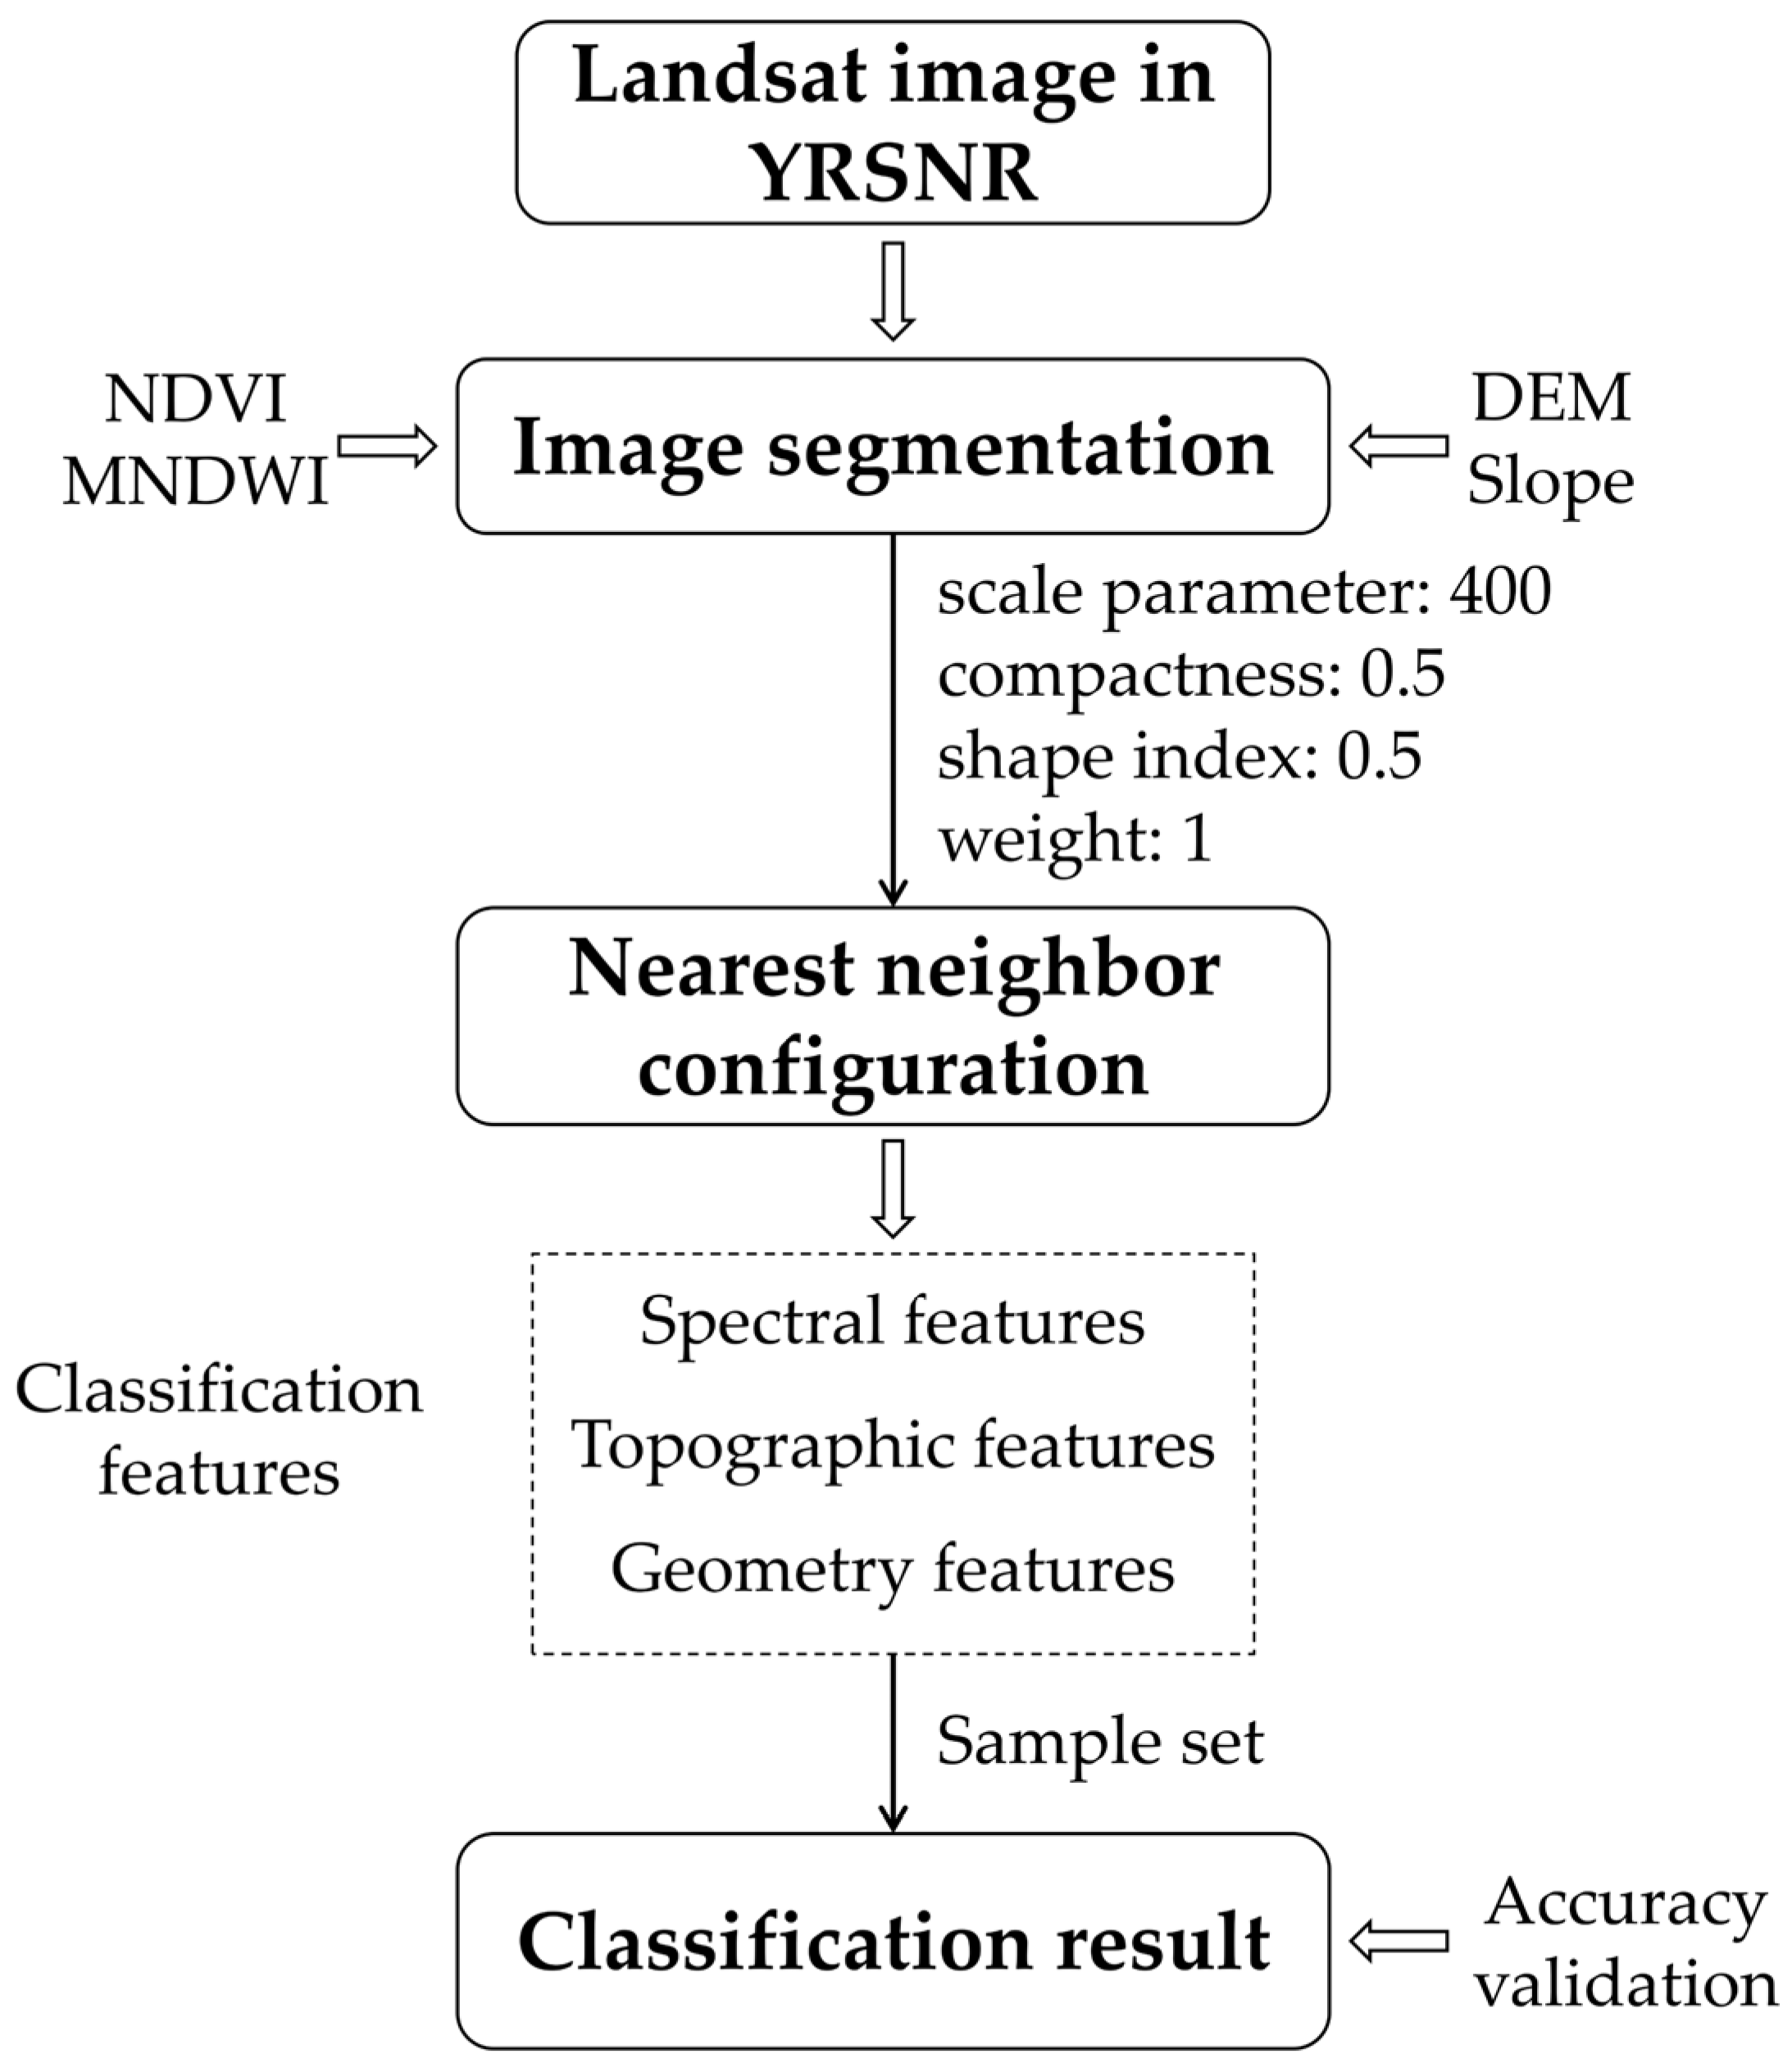
The object-based classification method is a comprehensive analysis of images combining a variety of image features (spectrum, geometry, texture, and context features), which has the characteristics of strong pertinence, high accuracy, and high efficiency. The classification results avoid “salt and pepper” effects and have good integrity [30,31]. Object-based classification primarily includes scale segmentation and classification rule set setting, both of which are carried out using the eCognition 9.1 software (developed by Trimble Navigation, Ltd., Sunnyvale, CA, USA). Detailed steps are as follows: (1) image segmentation: in this study, multiresolution segmentation in eCognition 9.1 is used for image segmentation. Multiresolution segmentation is divided according to the division index weight, scale parameter, and composition of homogeneity criteria (compactness and smoothness). As shown in Table 2, the division indexes include Blue, Green, Red, NIR, SWIR1, SWIR2, annual NDVImax, annual MNDWImax, DEM, and Slope, and the weights are all 1. After extensive experiments, it was found that the scale parameter, compactness, and shape index were set to 400, 0.5, and 0.5, respectively. (2) Nearest neighbor configuration: nearest neighbor configuration is used to give different wetland types the same set of classification features, as shown in Table 2. The classification features include the mean and StdDev values of Blue, Green, Red, NIR, SWIR1, SWIR2, annual NDVImax, annual MNDWImax, DEM, and Slope. In addition, Brightness, Shape Index, Length, Length/Width, and Density are also included. (3) Sample set: representative wetland patches of different types were selected as the sample set for classification. (4) Accuracy validation: to verify the accuracy of the wetland classification results, the data from the 2012 Second National Wetland Resources Survey and the Third National Land Survey of Qinghai Province were used to validate the wetland classification results and obtain the accuracy evaluation confusion matrix.
The confusion matrix was calculated using the following [31]:
where OA refers to the overall accuracy, Kappa refers to the Kappa coefficient, Xij is the wetland category in row i and column j, Xi+ is the sum of rows, X+i is the sum of columns, and N is the sum of all wetland categories. The comparison results of Kappa coefficient and classification accuracy are shown in Table 3 [32].
2.5. Grey Relation Analysis Method
The Grey Relation Analysis (GRA) is a quantitative description and comparison method for the development and change of a system. By comparing the geometric similarity of several data sequences, it can reflect whether the relationship is close, i.e., the degree of correlation. The advantage of this method is that there is no requirement for the amount and regularity of data, and it is suitable for analyzing the relationship between small samples and multiple factors [33,34]. The calculation formula was as follows:
where γ(xo(k),xi(k)) is the relation coefficient between wetland area and climate factors (a value closer to 1 means higher degree of relation), x0 is the wetland area data, xi is the climate factor data, x0(k) and xi(k) are the kth data of the 0th and ith attributes, respectively, is the discrimination coefficient (the value interval of is (0,1); when ≤ 0.5463 the best discrimination power, we usually take = 0.5), ωk is the weight of the kth data. Referring to Li and Zhang’s method [22,35], in the level of the objects, the averages of the meteorological data from 1997, 1998, and 1999 were selected as the climatic factors to assess the change in wetland area in 2000, and those from 2007, 2008, and 2009 were selected as the climatic factors to assess the change in wetland area in 2010. Similarly, the averages of the meteorological data in 2017, 2018, and 2019 were selected as the climatic factors to assess the change in wetland area in 2020 for GRA calculation. GRA calculation was based on MATLAB r2016b (developed by Mathworks, Inc., Natick, MA, USA). The flow chart of this study is shown in Figure 2.
3. Results
3.1. The Classification Rule Set of Wetlands in the YRSNP
The scale segmentation primarily includes three parameters: scale parameter, shape index, and compactness. After extensive experiments, it was found that the scale parameter, compactness, and shape index were set to 400, 0.5, and 0.5, respectively, which could reflect the difference in the image of different wetland types in different years. The wetland classification rules of the YRSNP were obtained by extracting the classification rule sets of the samples, as presented in Table 4.
3.2. Spatiotemporal Evolution Pattern of Wetlands in the Three-River-Source Region from 2000 to 2020
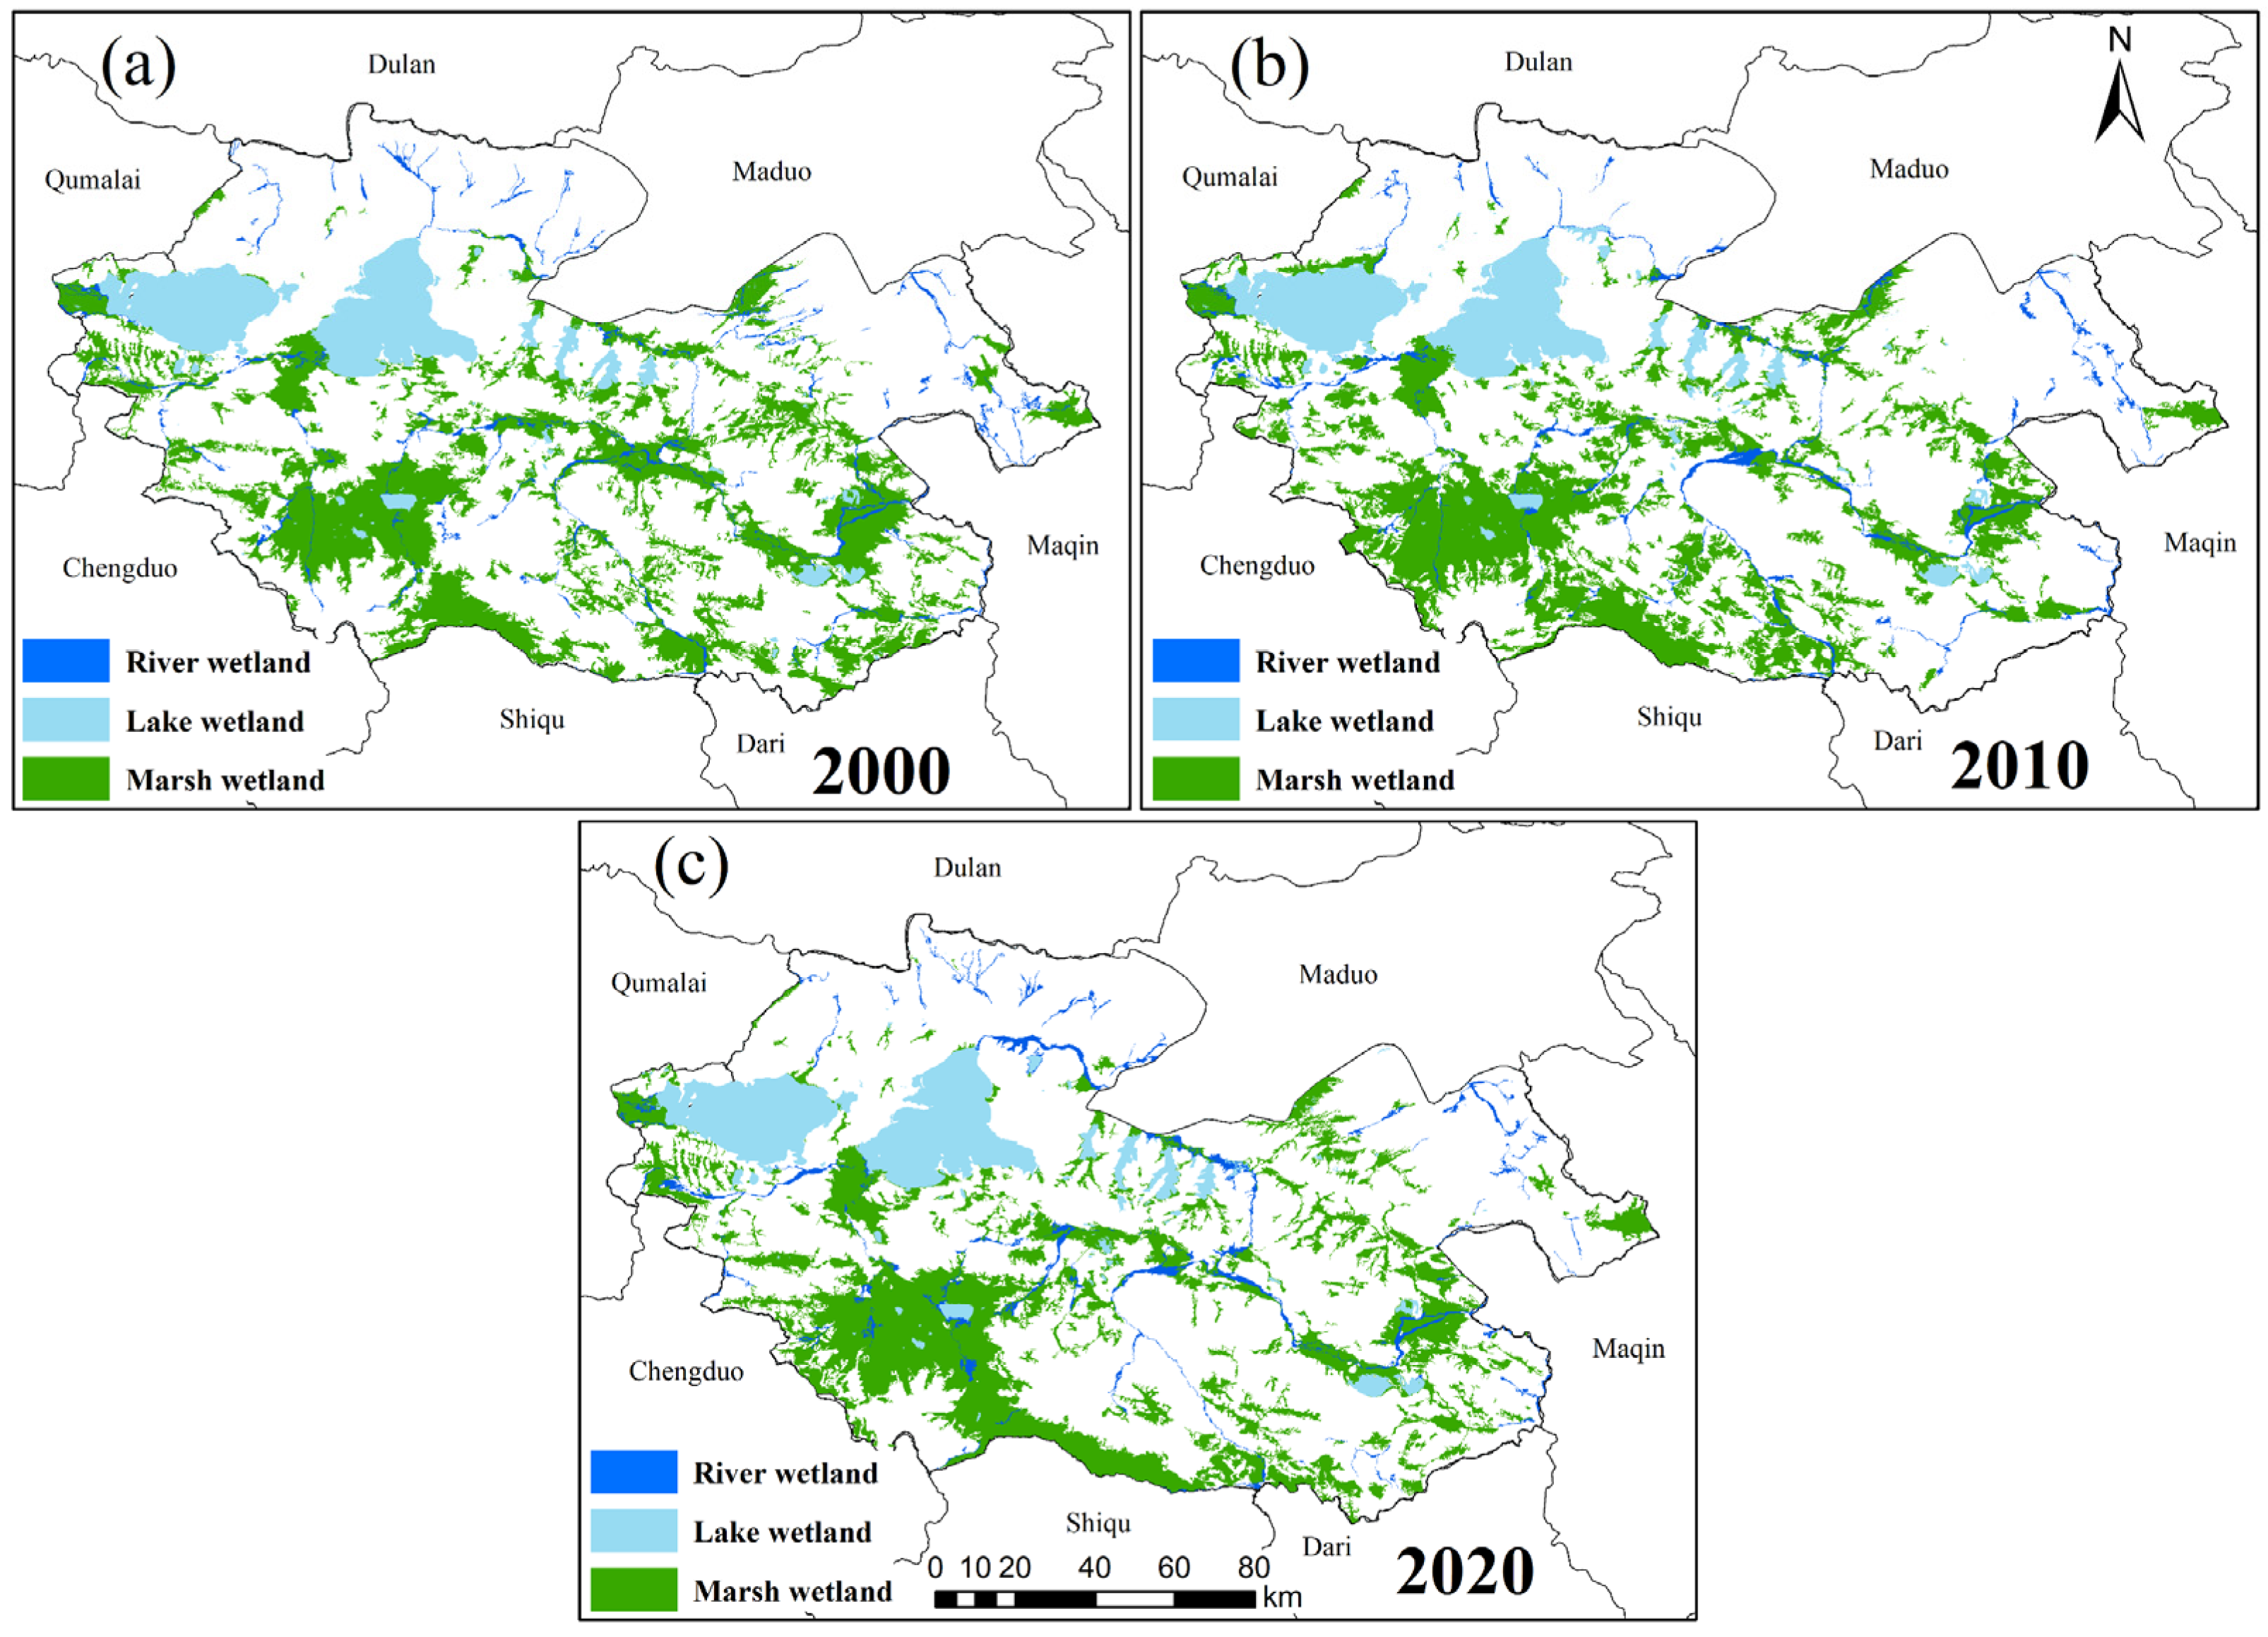
Through the object-oriented classification of the remote sensing images, the spatial distribution maps of the YRSNP wetlands were obtained for 2000, 2010, and 2020 (Figure 3), the YRSNP river wetland is dominated by the Yellow River, which flows out to the central Star Sea area along the western Gyaring Lake and the Ngöring Lake, and then flows out eastward. The lake wetlands are dominated by Zaling Lake and Eling Lake in the east and the central Xingxinghai, whereas the marsh wetlands are concentrated in the south. The accuracy evaluation results demonstrated that the Kappa coefficients of the YRSNP wetland classification in 2000, 2010, and 2020 were 0.59, 0.67, and 0.70, respectively (Table 5). The overall accuracy (OA) of the YRSNP wetland classification in 2000, 2010, and 2020 was 0.73, 0.77, and 0.82, respectively. As shown in Table 5, the classification accuracy of the lake wetlands was the highest (2000: Kappa = 0.81, OA = 0.94; 2010: Kappa = 0.85, OA = 0.95; 2020: Kappa = 0.85, OA = 0.95), followed by the marsh wetlands, and river wetlands had the lowest classification accuracy. The reason was that lake wetlands and marsh wetlands had regular shapes and were easy to distinguish. In addition, because of the mixed pixels, the boundaries of river wetlands differed greatly from the actual situation in the identification process, which made the classification accuracy of river wetlands the lowest. Overall, the Kappa coefficient of total wetland classification results was substantial, and the classification accuracy met the research needs.
The area of each type of YRSNP wetland in 2000, 2010, and 2020 is presented in Table 6. The total area of the YRSNP wetlands in 2000, 2010, and 2020 was 6254.56 , 5811.70 , and 5819.79 , respectively, accounting for 32.89%, 30.56%, and 30.60% of the total area of YRSNP. In 2000, the areas of the marsh wetlands, lake wetlands, and river wetlands were 4196.10 , 1426.24 , and 399.05 , respectively, accounting for 69.69%, 23.69%, and 6.63% of the total wetland area. In 2010, the areas of the marsh wetlands, lake wetlands, and river wetlands were 3910.21 , 1486.33 , and 415.16 , respectively, accounting for 67.28%, 25.57%, and 7.14% of the total wetland area. Similarly, in 2020, the areas of marsh wetlands, lake wetlands, and river wetlands were 3843.67 , 1517.43 , and 458.69 , respectively, accounting for 66.04%, 26.07%, and 7.88% of the total wetland area. From 2000 to 2020, the total wetland area of YRSNP decreased by 434.77 , with an annual decrease of 39.52 . The degraded area of the marsh wetland was the largest, with 352.43 , and the areas of river wetland and lake wetland increased by 59.64 and 91.19 , respectively. The increase of river wetlands and lake wetlands from 2000 to 2010 was greater than that in 2010 to 2020. The degradation of marsh wetlands from 2000 to 2010 was the most obvious, with a decrease of 285.89 . However, the marsh wetlands demonstrated a tendency to be stable from 2010 to 2020. A significant difference may be observed in the trend of wetland change in the YRSNP in the two time periods of 2000–2010 and 2010–2020.
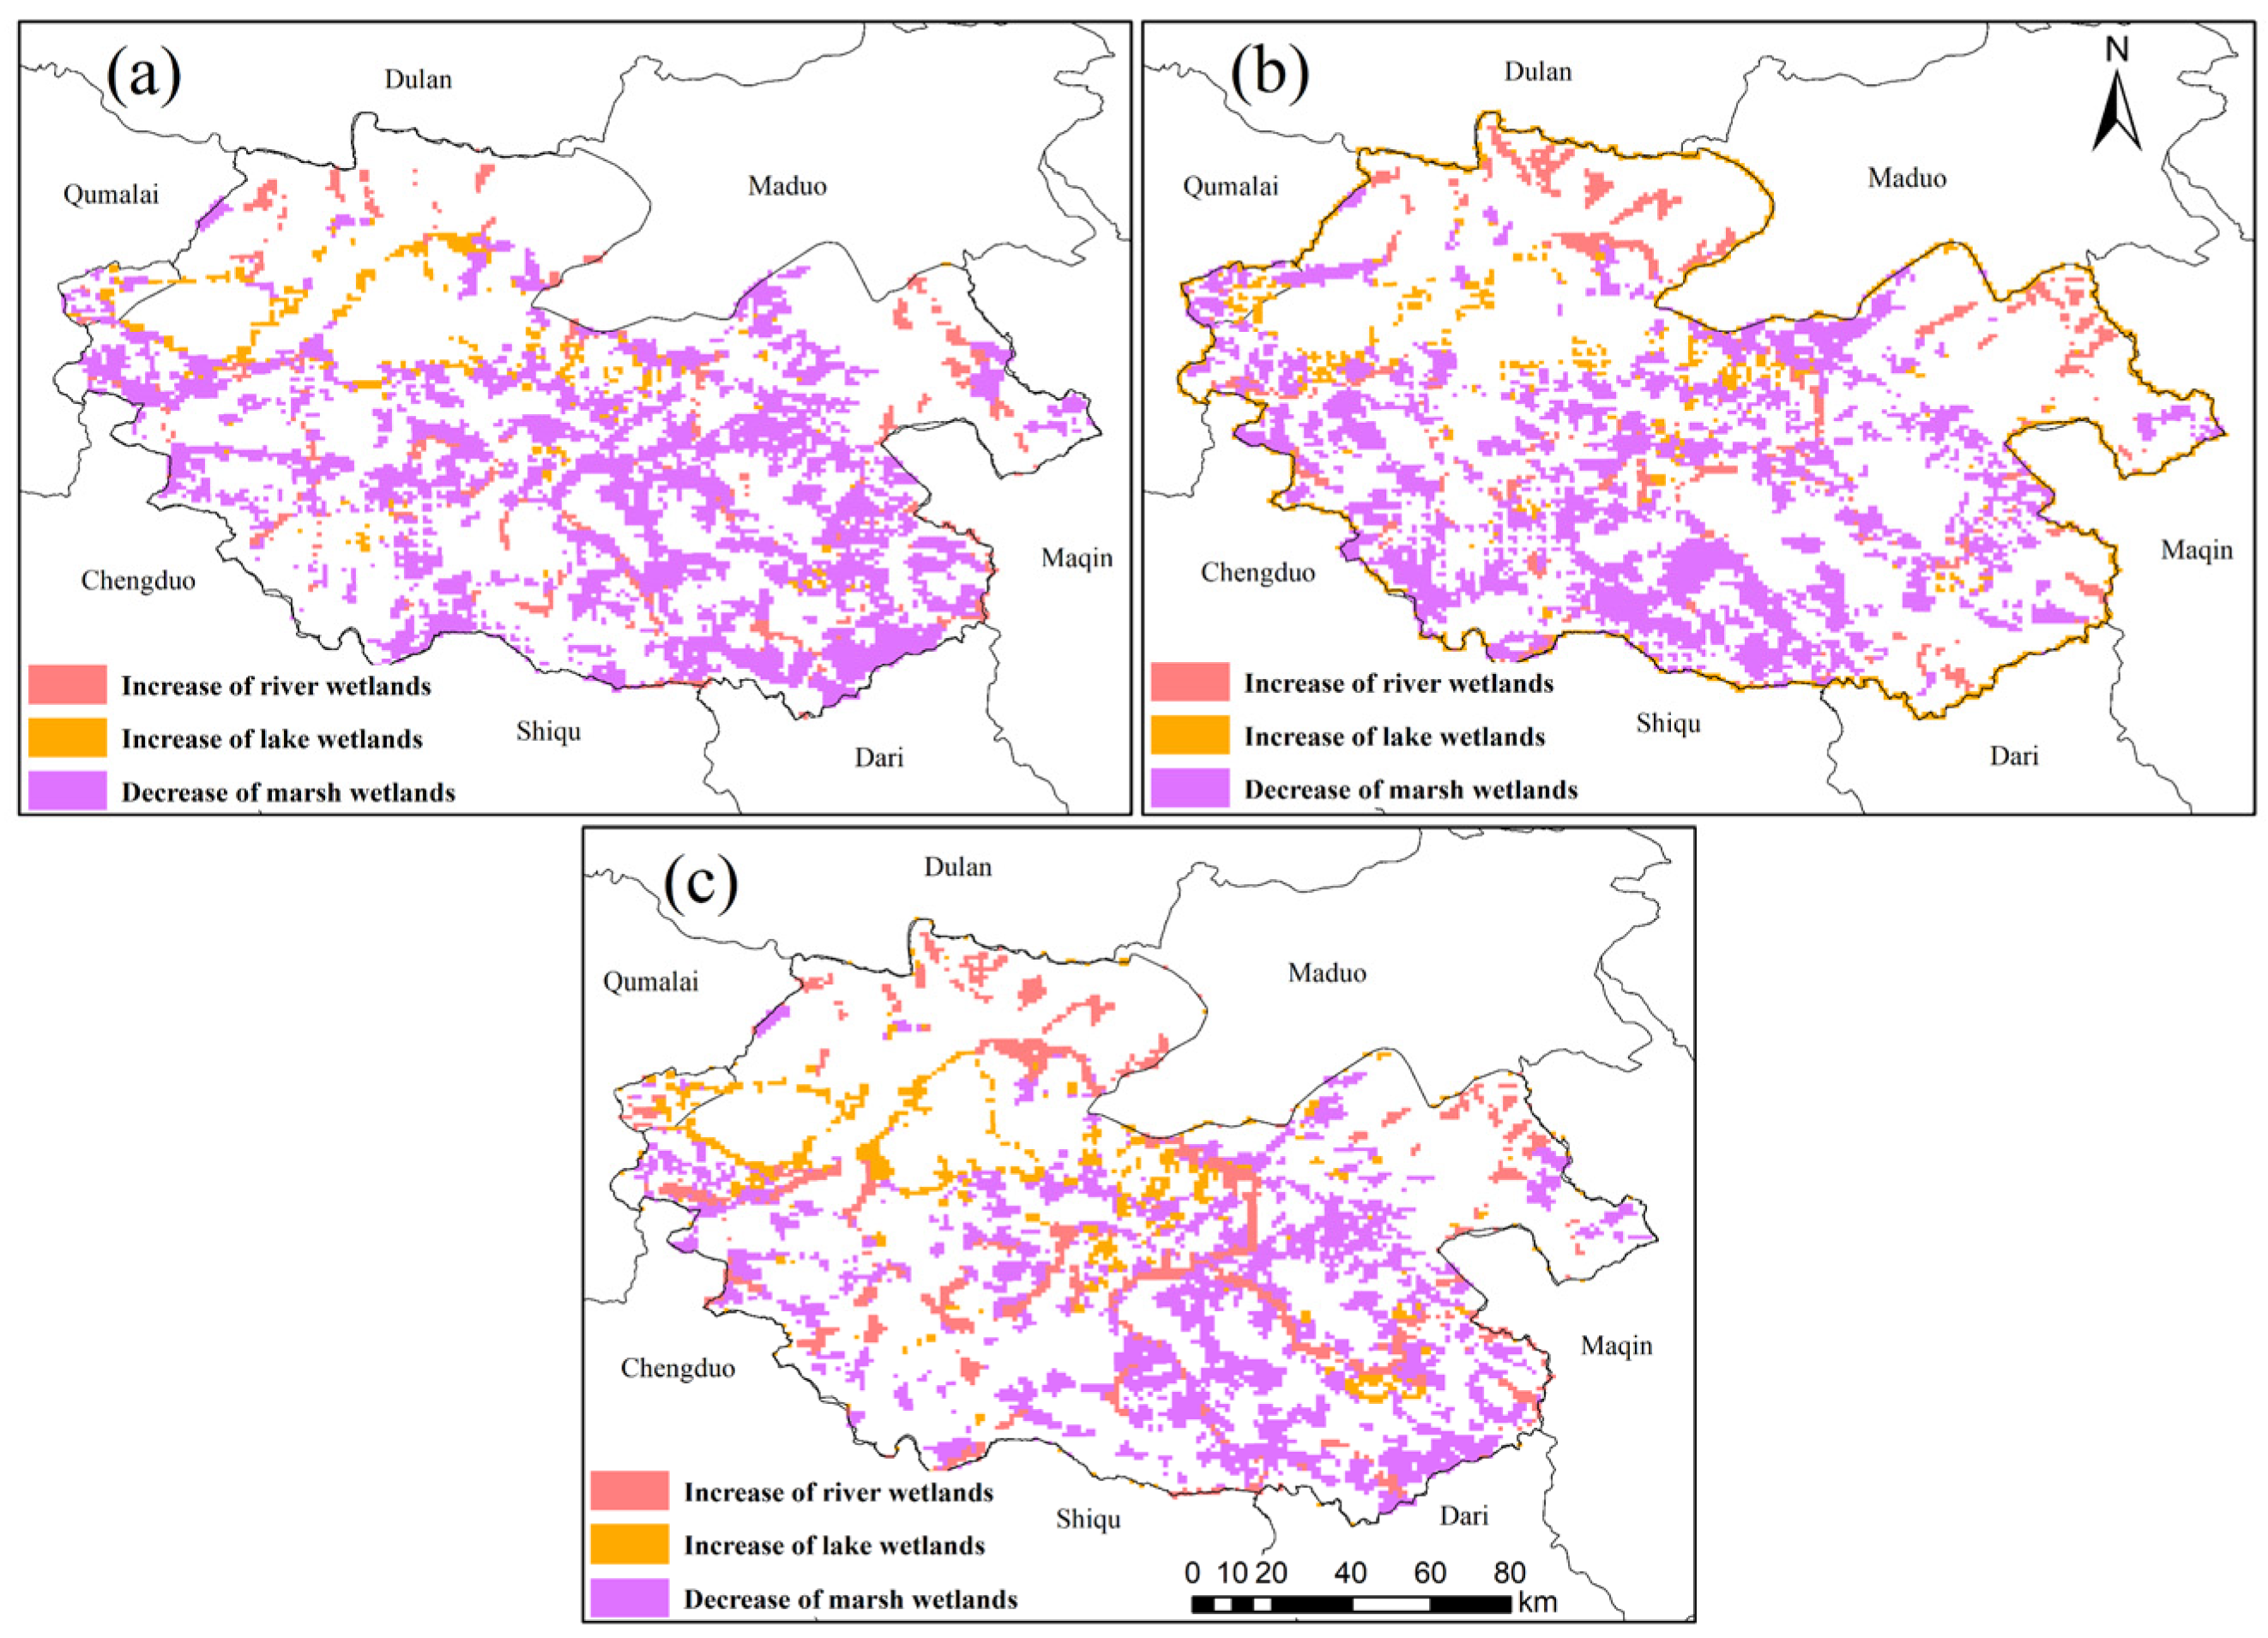
The wetland types and areas in the corresponding grid were obtained by setting a 1 km × 1 km fishing net. Through superposition analysis, it was then found that the areas of spatial change of the various wetland types in the YRSNP were the same from 2000 to 2010, 2010 to 2020, and 2000 to 2020 (Figure 4). The increase of river wetlands was primarily observed in the Yellow River Basin, whereas the increase of lake wetlands was concentrated in several lake areas (Gyaring Lake, Ngöring Lake, and Xingxinghai), while the degradation of marsh wetlands mainly occurs in the eastern and southern regions.
3.3. Spatiotemporal Patterns of Precipitation and Temperature in the YRSNP from 2000 to 2020
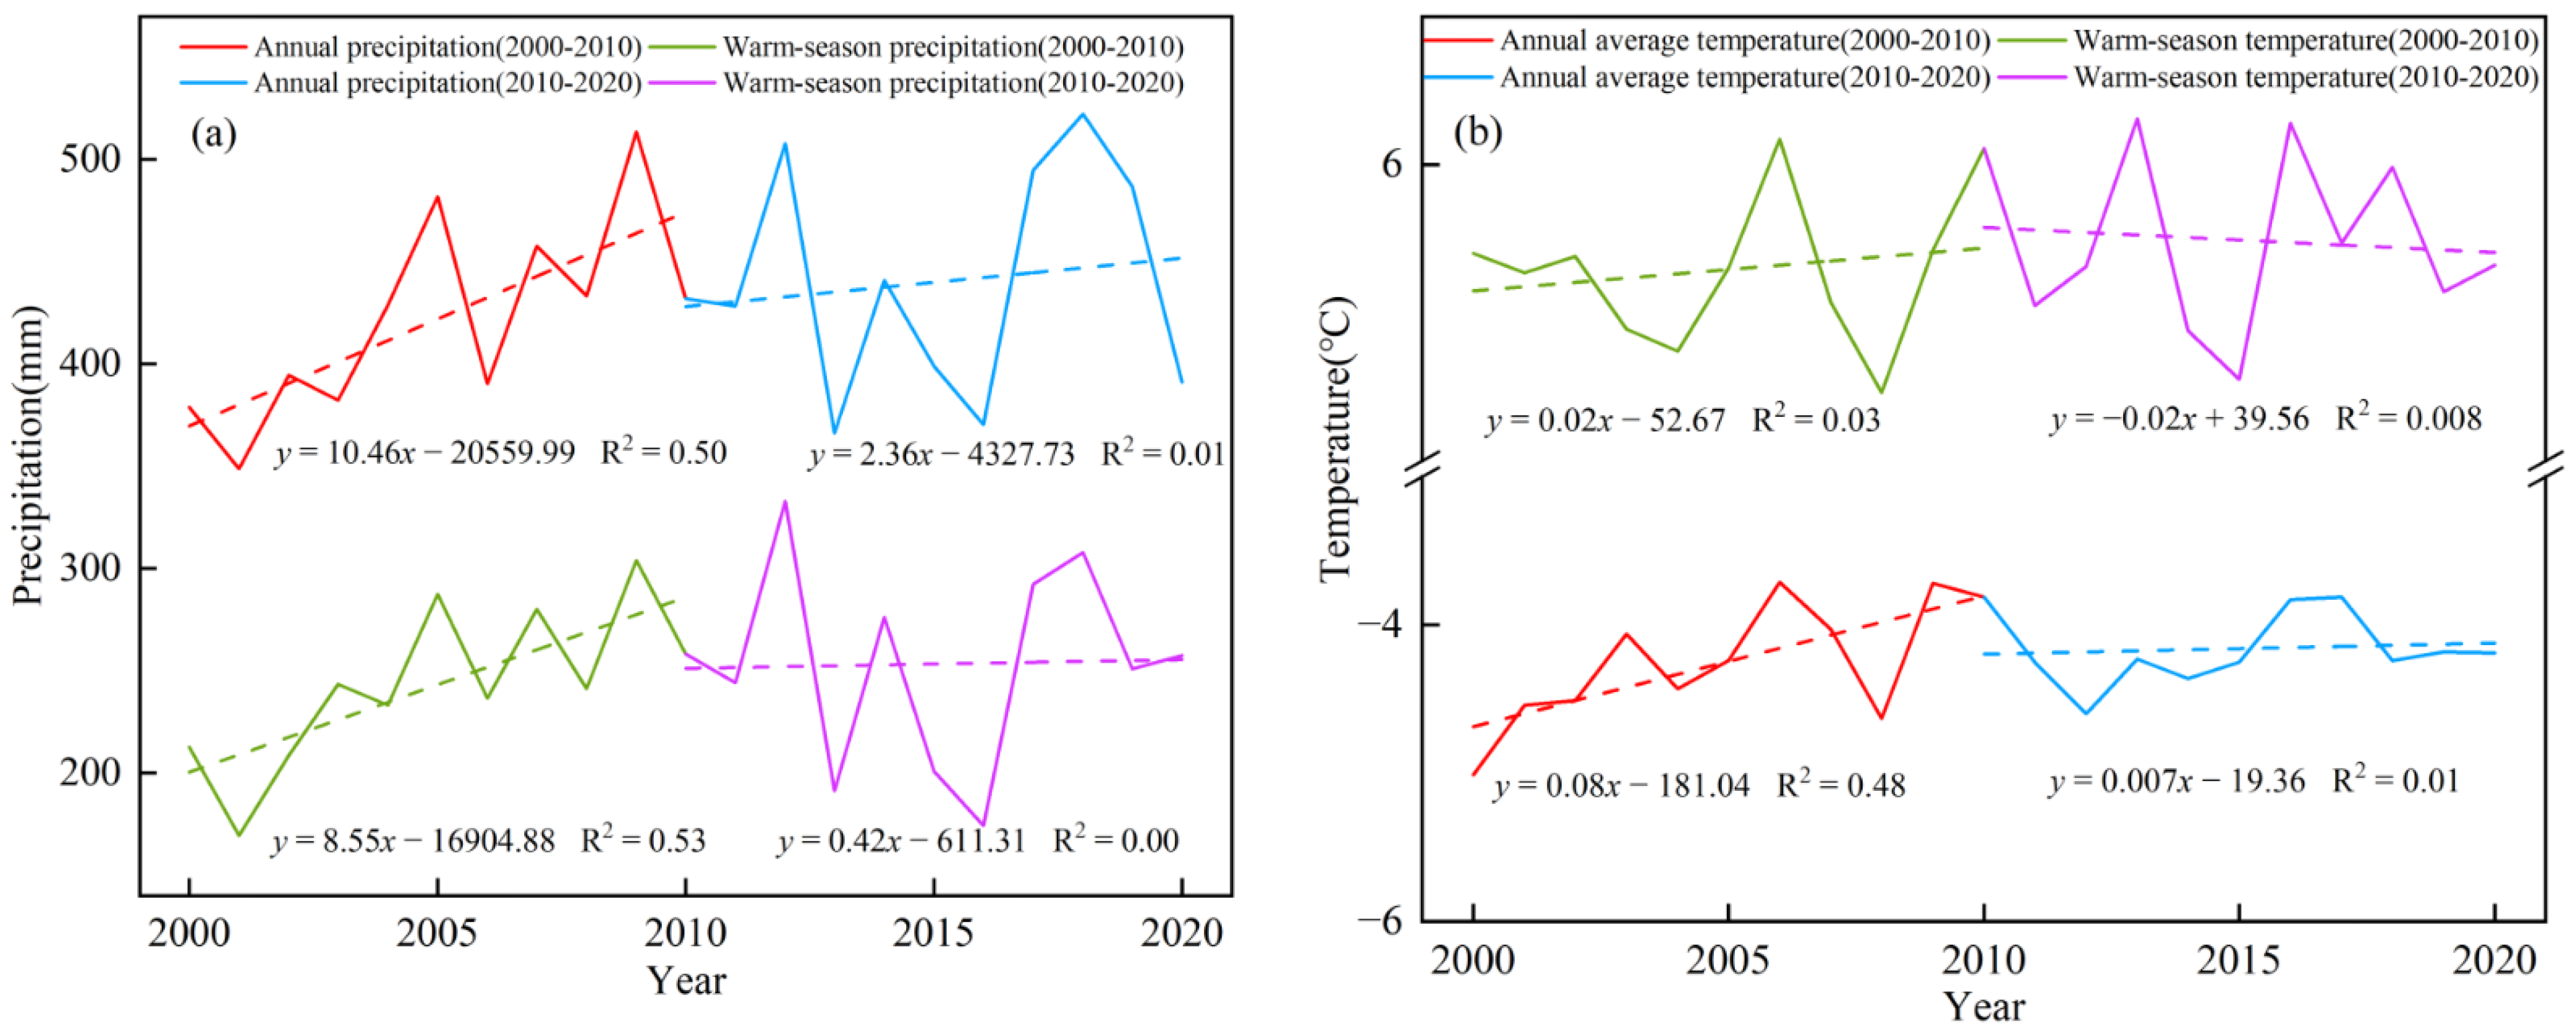
Combined with the changing trend of the YRSNP wetlands, the climate change in the YRSNP was analyzed from two time periods—2000–2010 and 2010–2020 (Figure 5). The annual precipitation and warm-season precipitation in the YRSNP increased linearly from 2000 to 2010, with annual growth rates of 10.46 mm/a and 8.55 mm/a, respectively. The warm-season precipitation was 243.15 mm, which is about 57.62% of the annual precipitation (421.97 mm), indicating that warm-season precipitation was an important precipitation period in the YRSNP from 2000 to 2010. However, the annual precipitation and warm-season precipitation of the YRSNP demonstrated no significant warm–humid climate trend from 2010 to 2020, and the growth rates were reduced to 2.36 mm/a and 0.42 mm/a, respectively. The annual average temperature of YRSNP was –4.24 °C and the warm-season temperature was 5.29 °C from 2000 to 2010. The annual average temperature and the warm-season temperature increased by 0.02 °C/a and 0.08 °C/a, respectively. The annual average temperature of the YRSNP demonstrated a slight change from that of the warm season. However, when the annual average temperature dropped slightly, the warm-season temperature was relatively stable from 2010 to 2020.
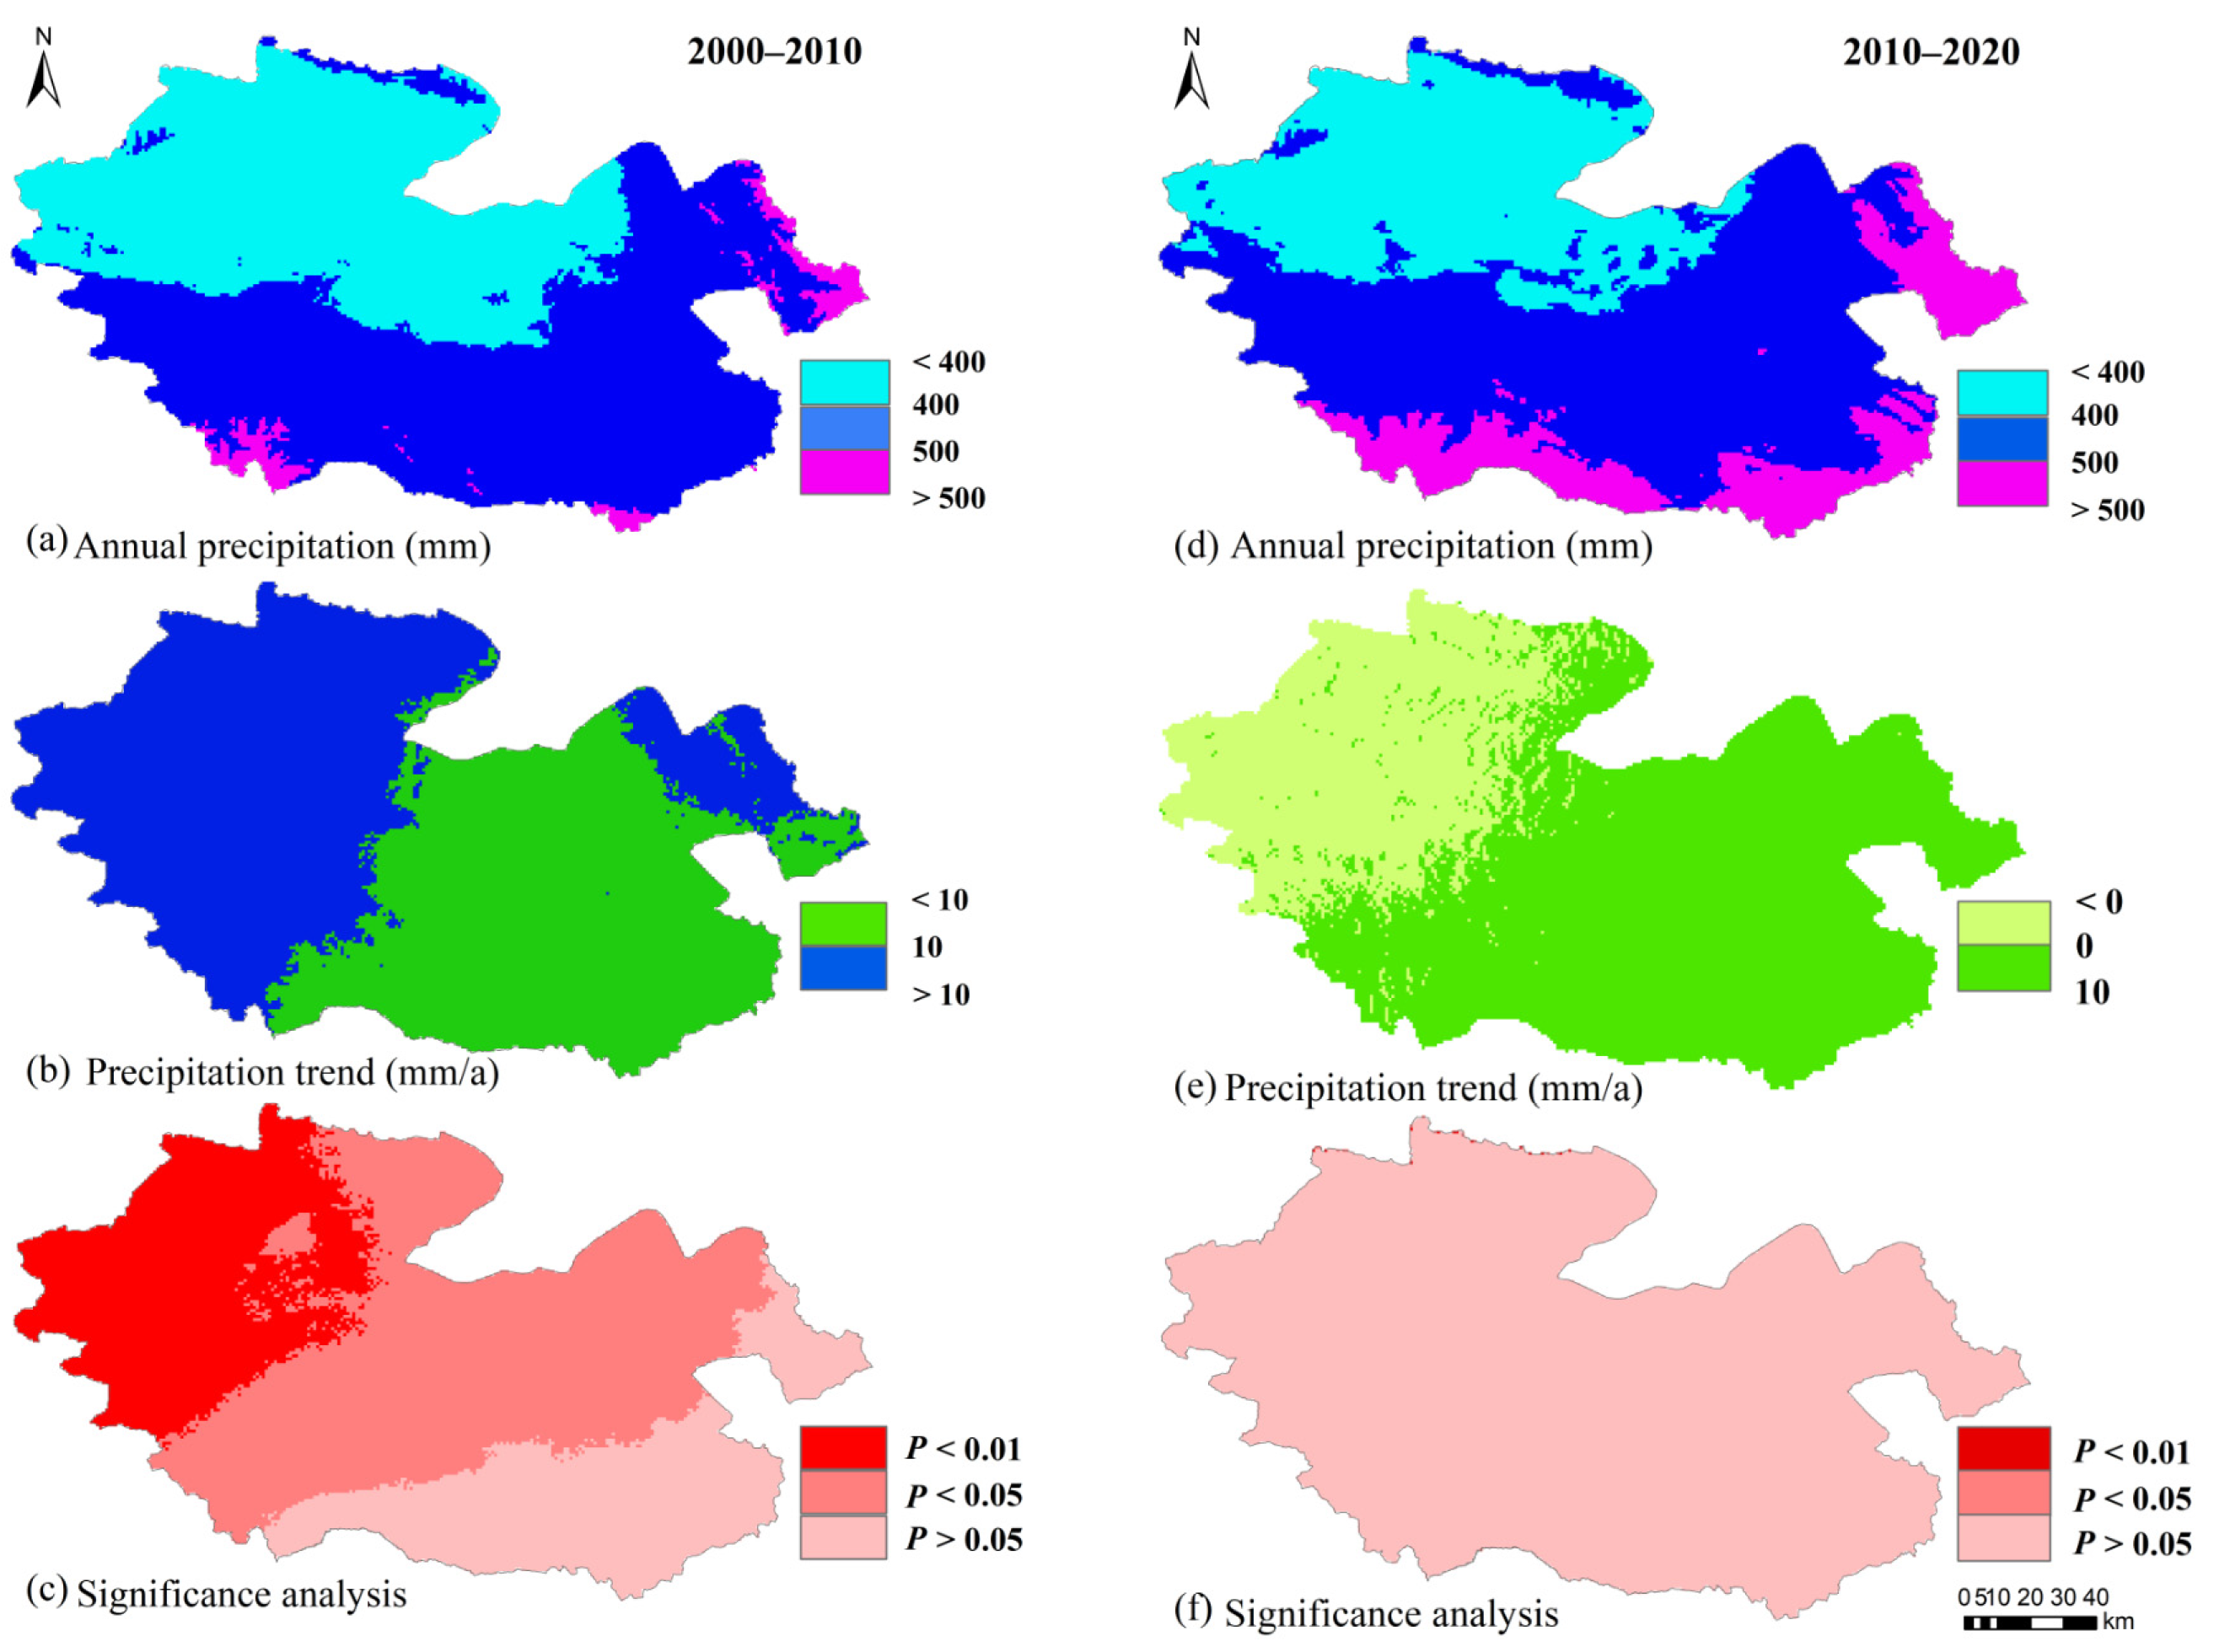
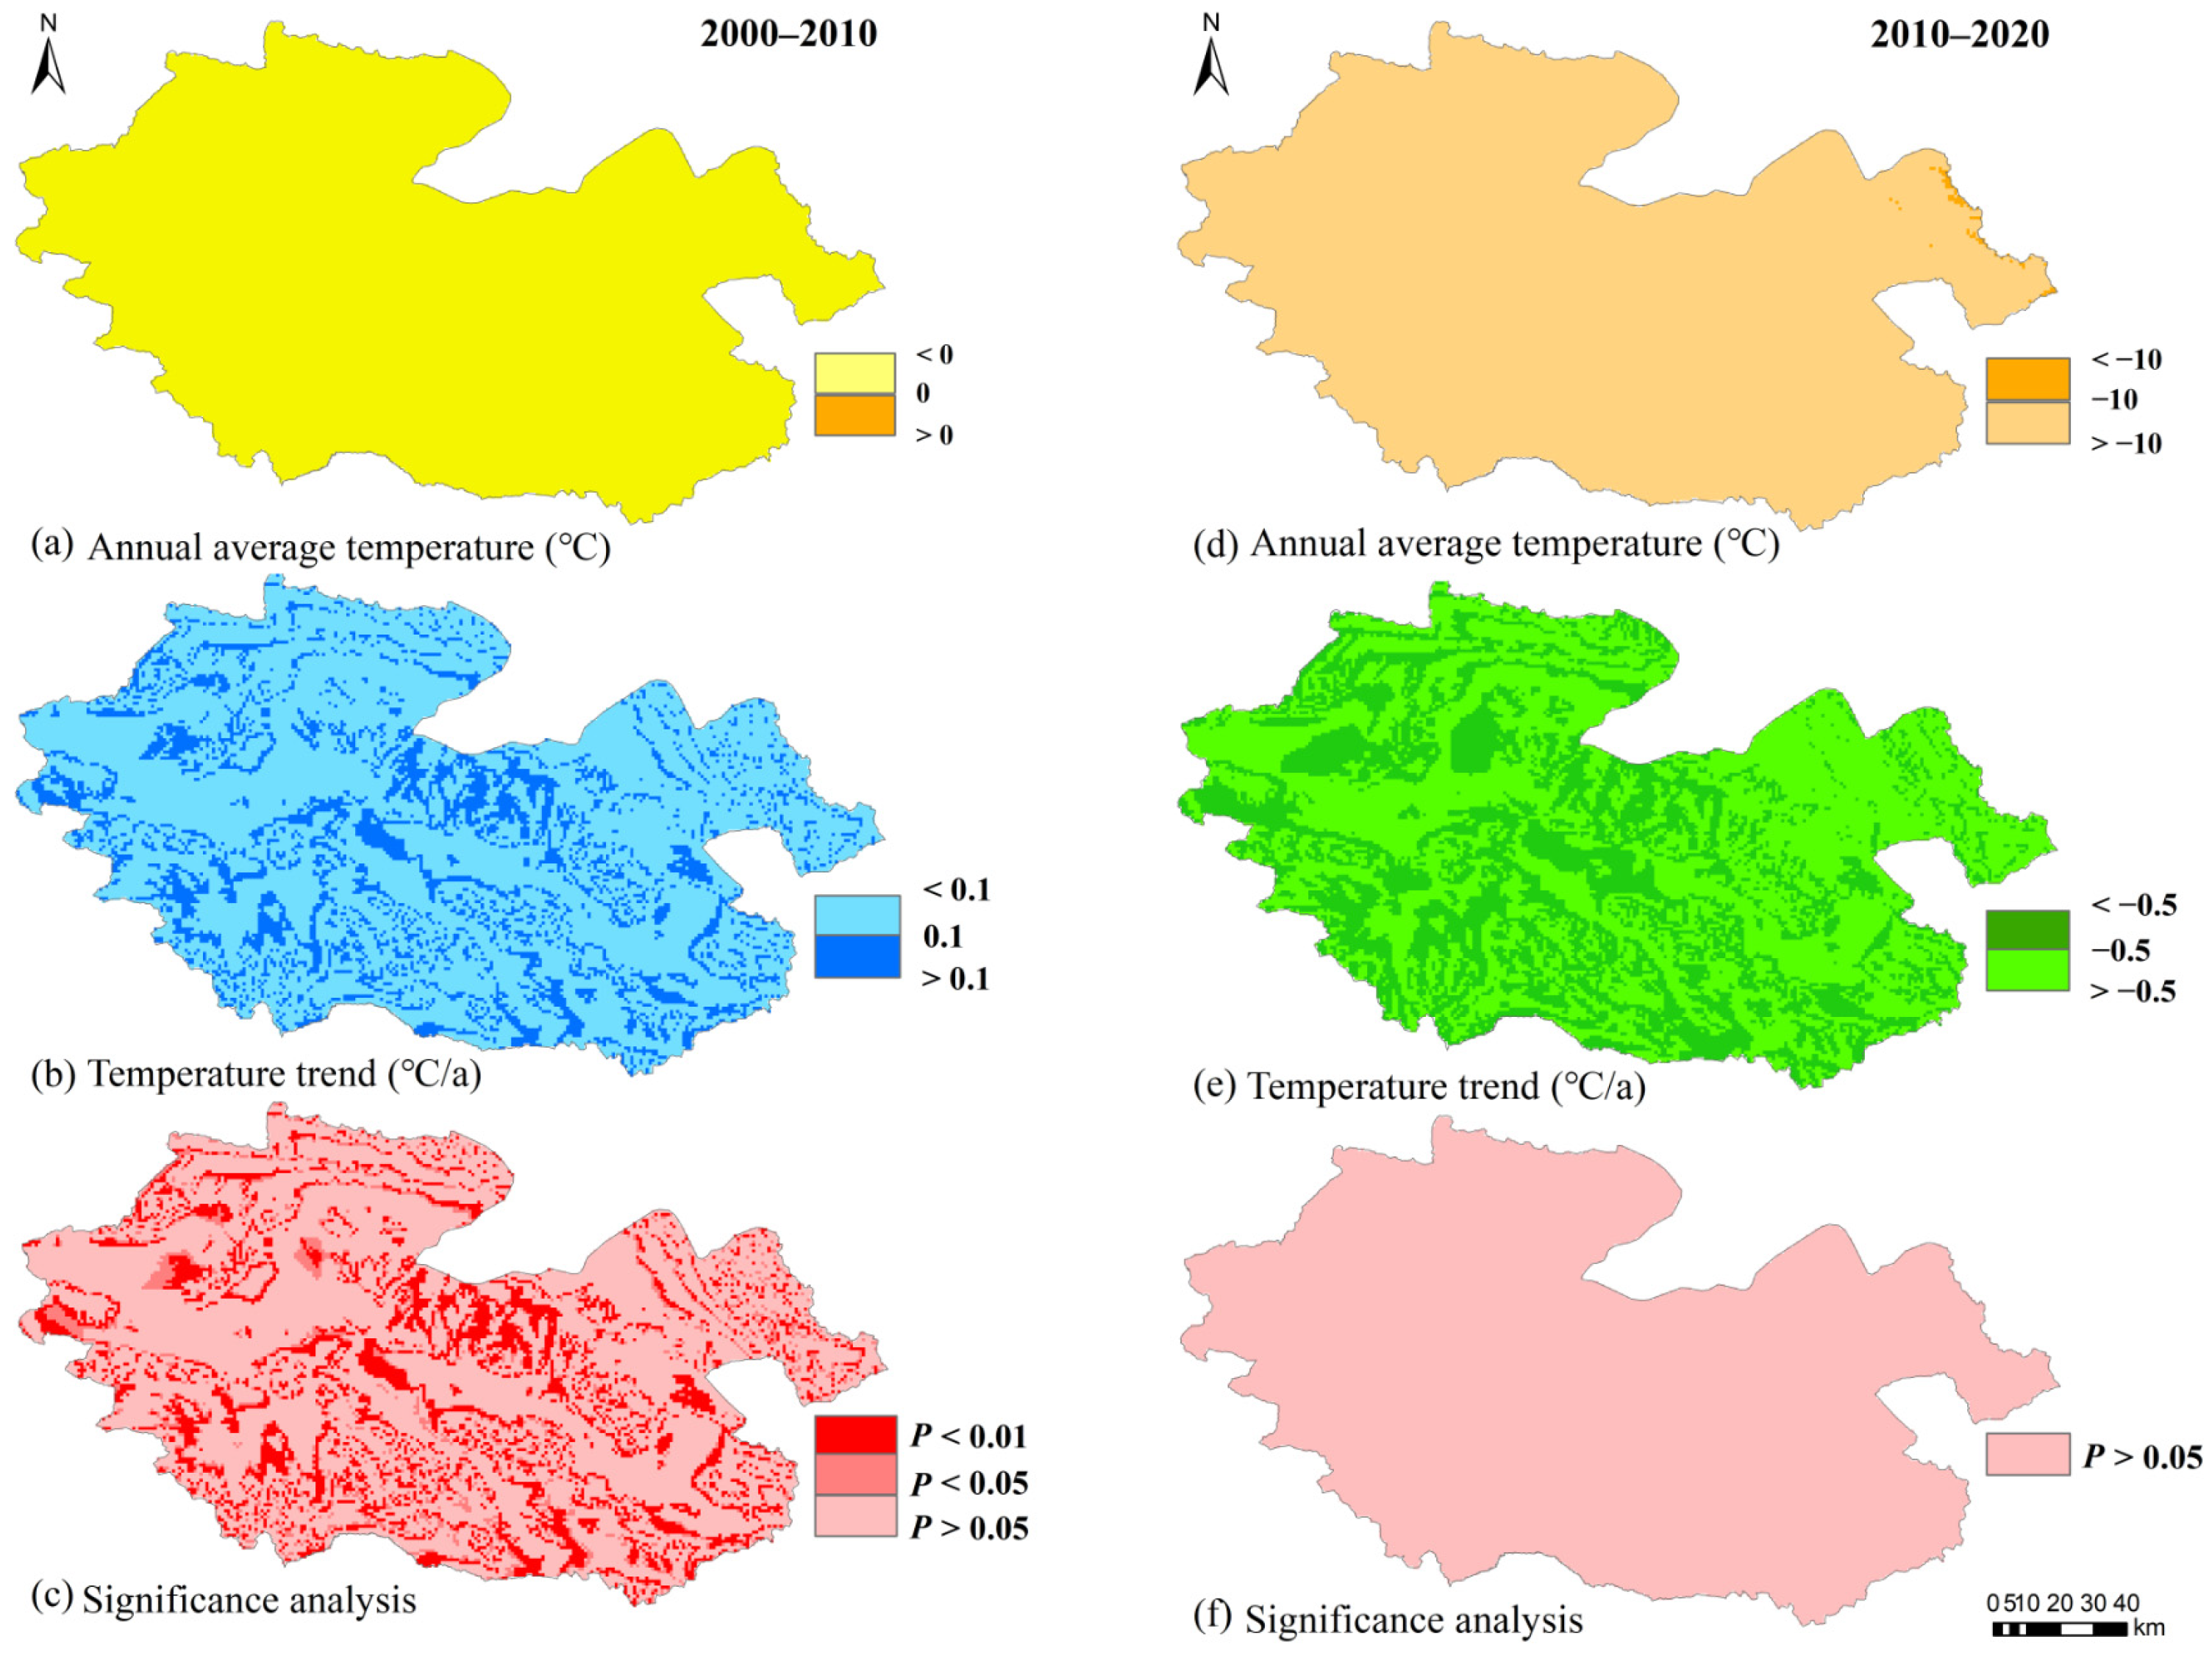
In addition, Figure 6a,d show that there is large spatial heterogeneity in the annual precipitation of the YRSNP from 2000 to 2010 and 2010 to 2020, both showing a decreasing trend from southeast to northwest. The increase in precipitation in the YRSNP from 2000 to 2010 is, however, greater than that from 2010 to 2020 (Figure 6b,e). At the 0.01 and 0.05 significance levels, 75.53% of regional precipitation in the YRSNP increased significantly from 2000 to 2010, while it did not significantly increase from 2010 to 2020 (Figure 6c,f). A total of 75.53% of the YRSNP demonstrated a significant increase in regional precipitation from 2000 to 2010, while it was largely non-significant in 2010–2020 (Figure 6c,f). The spatial heterogeneity of the annual average temperature is not obvious, demonstrating high spatial characteristics in the middle and low spatial characteristics in the surroundings (Figure 7a,d), which is due to the low overall topographic characteristics in the middle and high overall topographic characteristics in the surroundings of the YRSNP. The YRSNP demonstrated a warming trend in 2000–2010 but a cooling trend in 2010–2020 (Figure 7b,e). At the 0.01 and 0.05 significance levels, 27.68% of the region showed a significant increase in temperature from 2000 to 2010 but a non-significant decrease from 2010 to 2020 (Figure 7c,f).
3.4. Relationship between Wetland Changes and Climate Change
The impact of climate change on wetland areas was elucidated by GRA (Table 7), which demonstrated that the relation between the total area of the YRSNP wetlands and both temperature and precipitation was above 0.5. The relation between the river wetland area and annual precipitation and warm-season temperature is greater than that of the annual average temperature, indicating that the hydrological recharge of the river wetlands is mostly from precipitation and melting of glacial snow in the upper reaches during the warm season. The relation between the lake wetland area and river wetland area and climate factors is higher than that of the river wetlands, indicating that the lake wetlands are more strongly influenced by climate. The highest relation between marsh wetlands and the mean annual temperature is because the increase in temperature increases the evaporation from the marsh wetlands, resulting in a continuous loss of water. The increase in temperature results in considerable heat, thereby promoting the growth of vegetation in the marsh wetlands. The highest relation between the total area of the YRSNP wetlands and warm-season temperatures is due to the increase in precipitation, leading to an increase in the total area of the wetlands. However, the increase in temperature results in increased evapotranspiration which has a more pronounced effect on the area of the YRSNP wetlands.
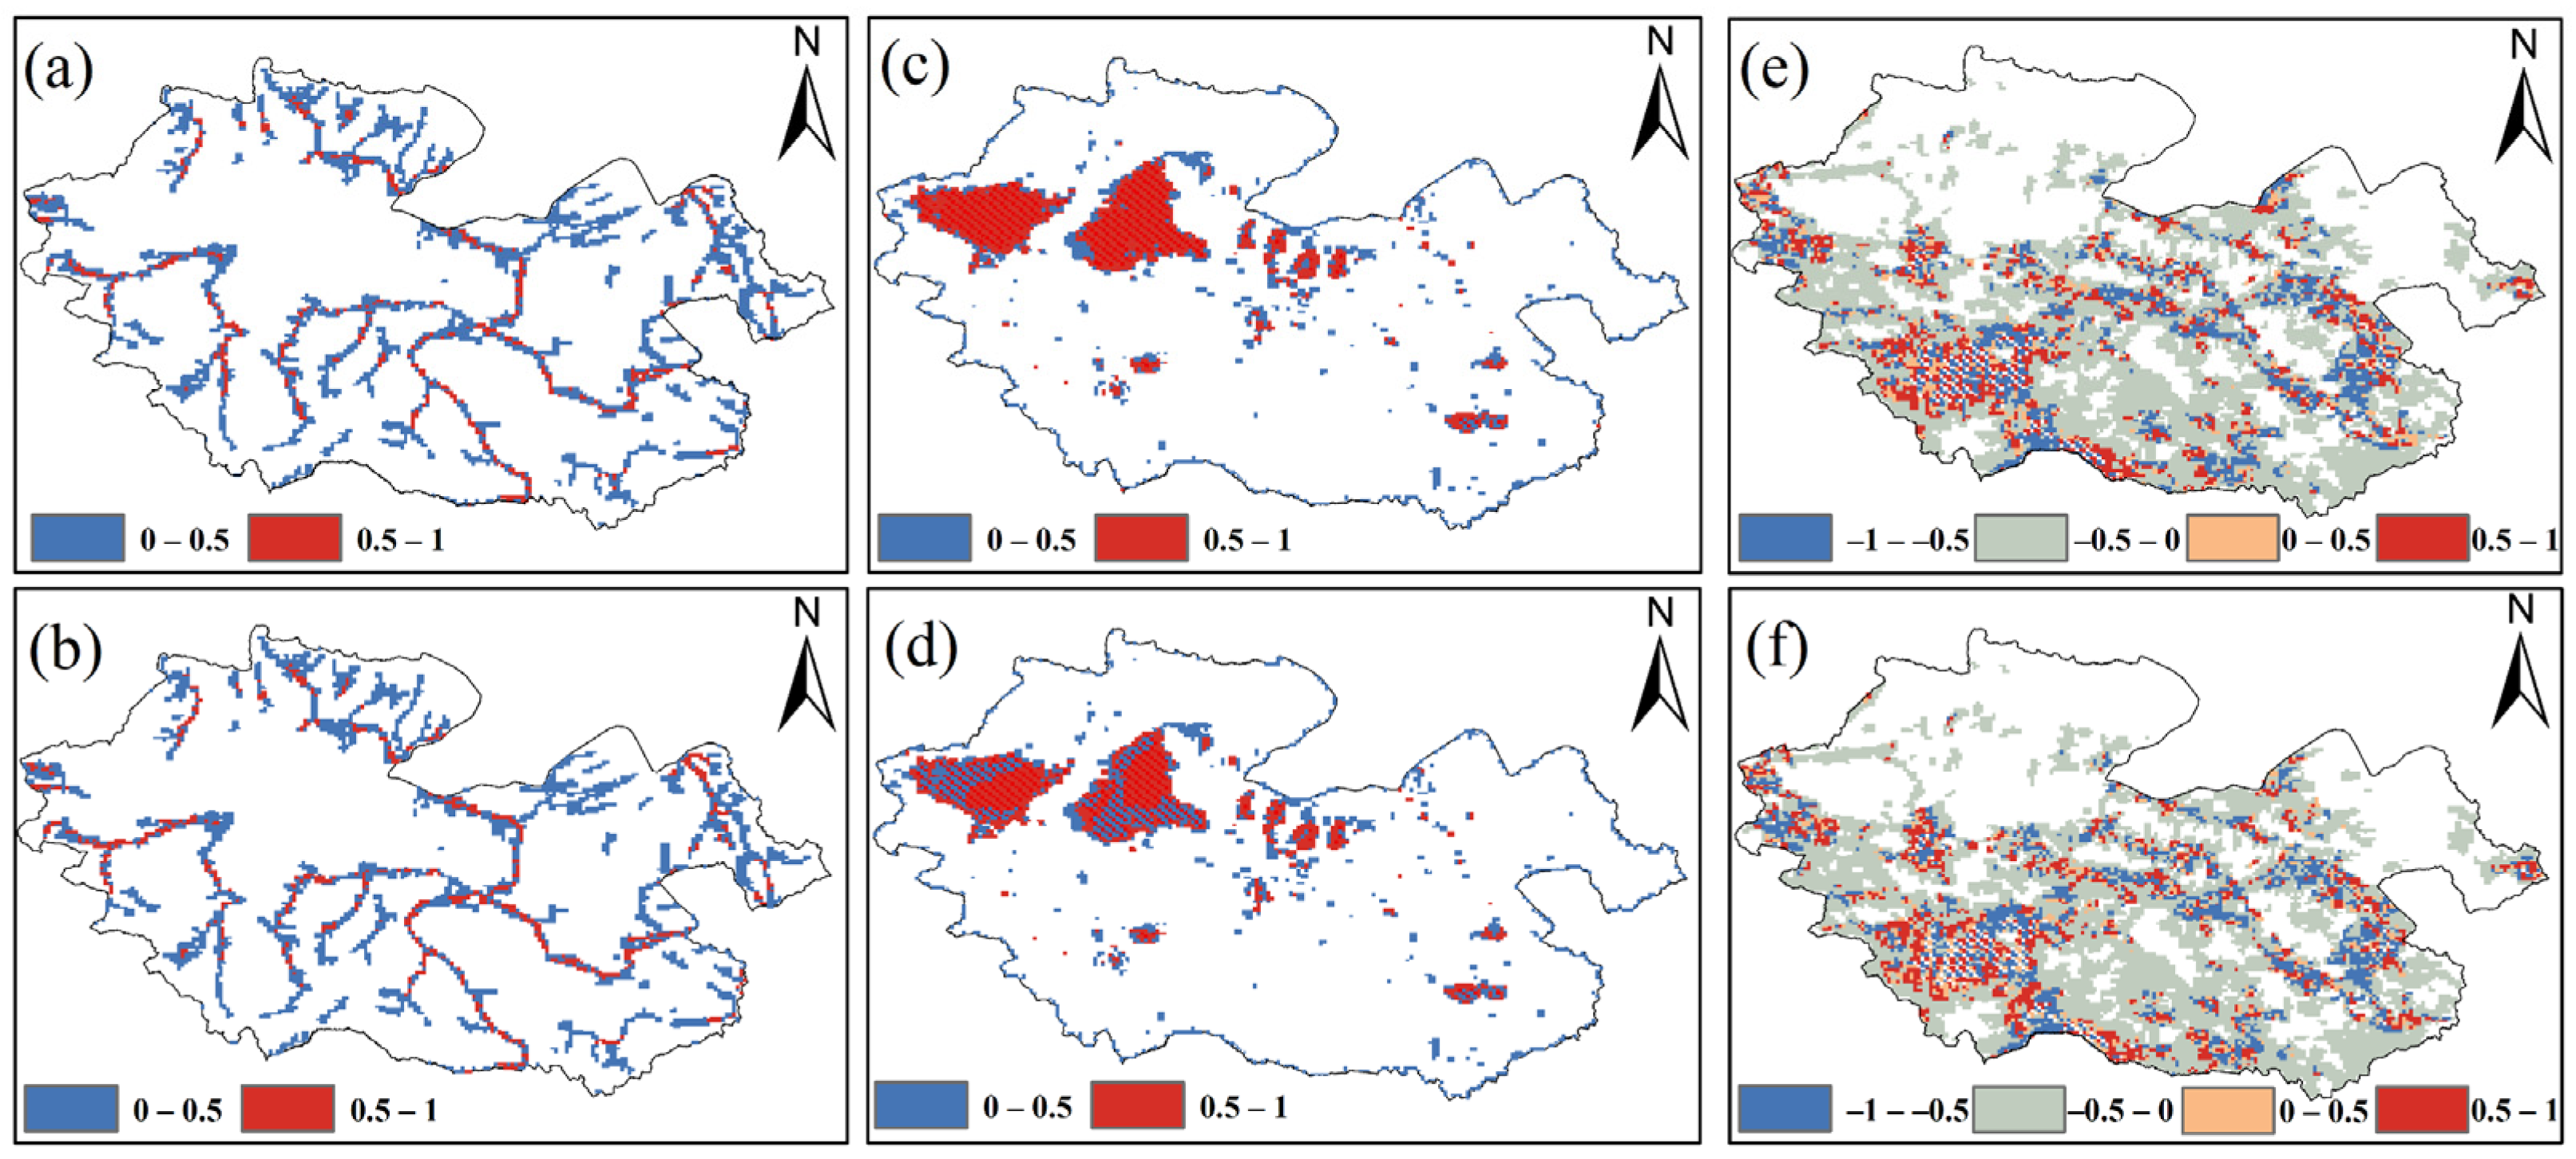
GRA only shows that there is a numerical relation among variables, but it can’t further show the spatial correlation degree, so the correlation coefficient is used to explain the correlation among variables. By superimposing the results of the spatial change in the YRSNP wetlands and the changes in the climatic factor trend from 2000 to 2020 (Figure 8), it was found that the average correlation coefficients of river wetlands with precipitation and temperature were 0.16 and 0.19, respectively, and were positively correlated with precipitation and temperature in general. The average correlation coefficients of the lake wetlands with precipitation and temperature were 0.46 and 0.41, respectively, with the major lakes (Gyaring Lake, Ngöring Lake, and Xingxinghai) showing a high correlation with precipitation and temperature. The average correlation coefficients of marsh wetlands with precipitation and temperature were −0.03 and −0.02, respectively, which did not show a high correlation, but a positive and negative correlation of approximately 50%, respectively. The grey relation analysis and correlation analysis showed that the correlation coefficients of river wetlands and lake wetlands with precipitation and air temperature were positive, while the correlation coefficients of marsh wetlands with precipitation and air temperature did not show significant spatial and temporal differences from 2000 to 2020.
4. Discussion
Climate change is considered to be an important factor influencing changes in wetland ecosystems. It is important to investigate the impact of climate factors on wetland changes to protect wetlands rationally and scientifically. This study uses Landsat imagery as the data source and adopts an object-oriented approach to extract and analyze wetlands in the YRSNP for the years 2000, 2010, and 2020. Based on this analysis, the influence of climatic factors on the change in wetlands in the YRSNP was investigated by combining grey correlation analysis and correlation analysis. This study found that the wetlands in the YRSNP decreased by 442.86 between 2000 and 2010 and increased by 8.09 between 2010 and 2020, while the river and lake wetlands increased by 59.64 and 91.19 , respectively. These results are consistent with previous studies [36,37,38,39]. In addition, the grey relation analysis and correlation analysis revealed that annual precipitation and warm-season air temperature had a greater effect on the river and lake wetlands, while the mean annual air temperature and warm-season air temperature had a greater effect on marsh wetlands, a result that is similar to previous studies [36,40].
The climate change analysis of the YRSNP shows that precipitation and temperature changed at a rate of 31.16 mm/10a and 0.19 °C/10a, respectively, precipitation increased by 173.44 mm, and temperature increased by 1.30 °C, demonstrating the warm–humid climate trend from 2000 to 2020, but a less pronounced trend from 2010 to 2020. This is similar to the climate change reported previously on the Tibetan Plateau and the Three-River Source [41,42,43]. The total area of the YRSNP wetland decreased from 2000 to 2020 but increased slightly from 2010 to 2020. Both the river and lake wetlands increased from 2000 to 2020, while the marsh wetlands decreased by 7.47%, consistent with previous studies [44,45,46]. In other climatic regions, wetland changes show different trends. Amani et al. found that, in the continental climate region of Alberta, Canada, the Shallow Water and Marsh categories showed decreasing and increasing trends from 1984 to 2020, respectively, while the Bog, Fen, and Swamp categories were relatively stable [47]. However, the wetland area of northern Xinjiang within a dry climate region increased by 2.31% [48]. The wetland area of Tibet within a tundra climate region also showed an increasing trend from 1990s–2010s, with the largest increase in lake wetland area [49]. It can be seen from this that wetlands in different climatic regions show different trends under the influence of climatic factors. Therefore, proving the response of wetland area changes to climatic factors is an important prerequisite for understanding wetland area changes.
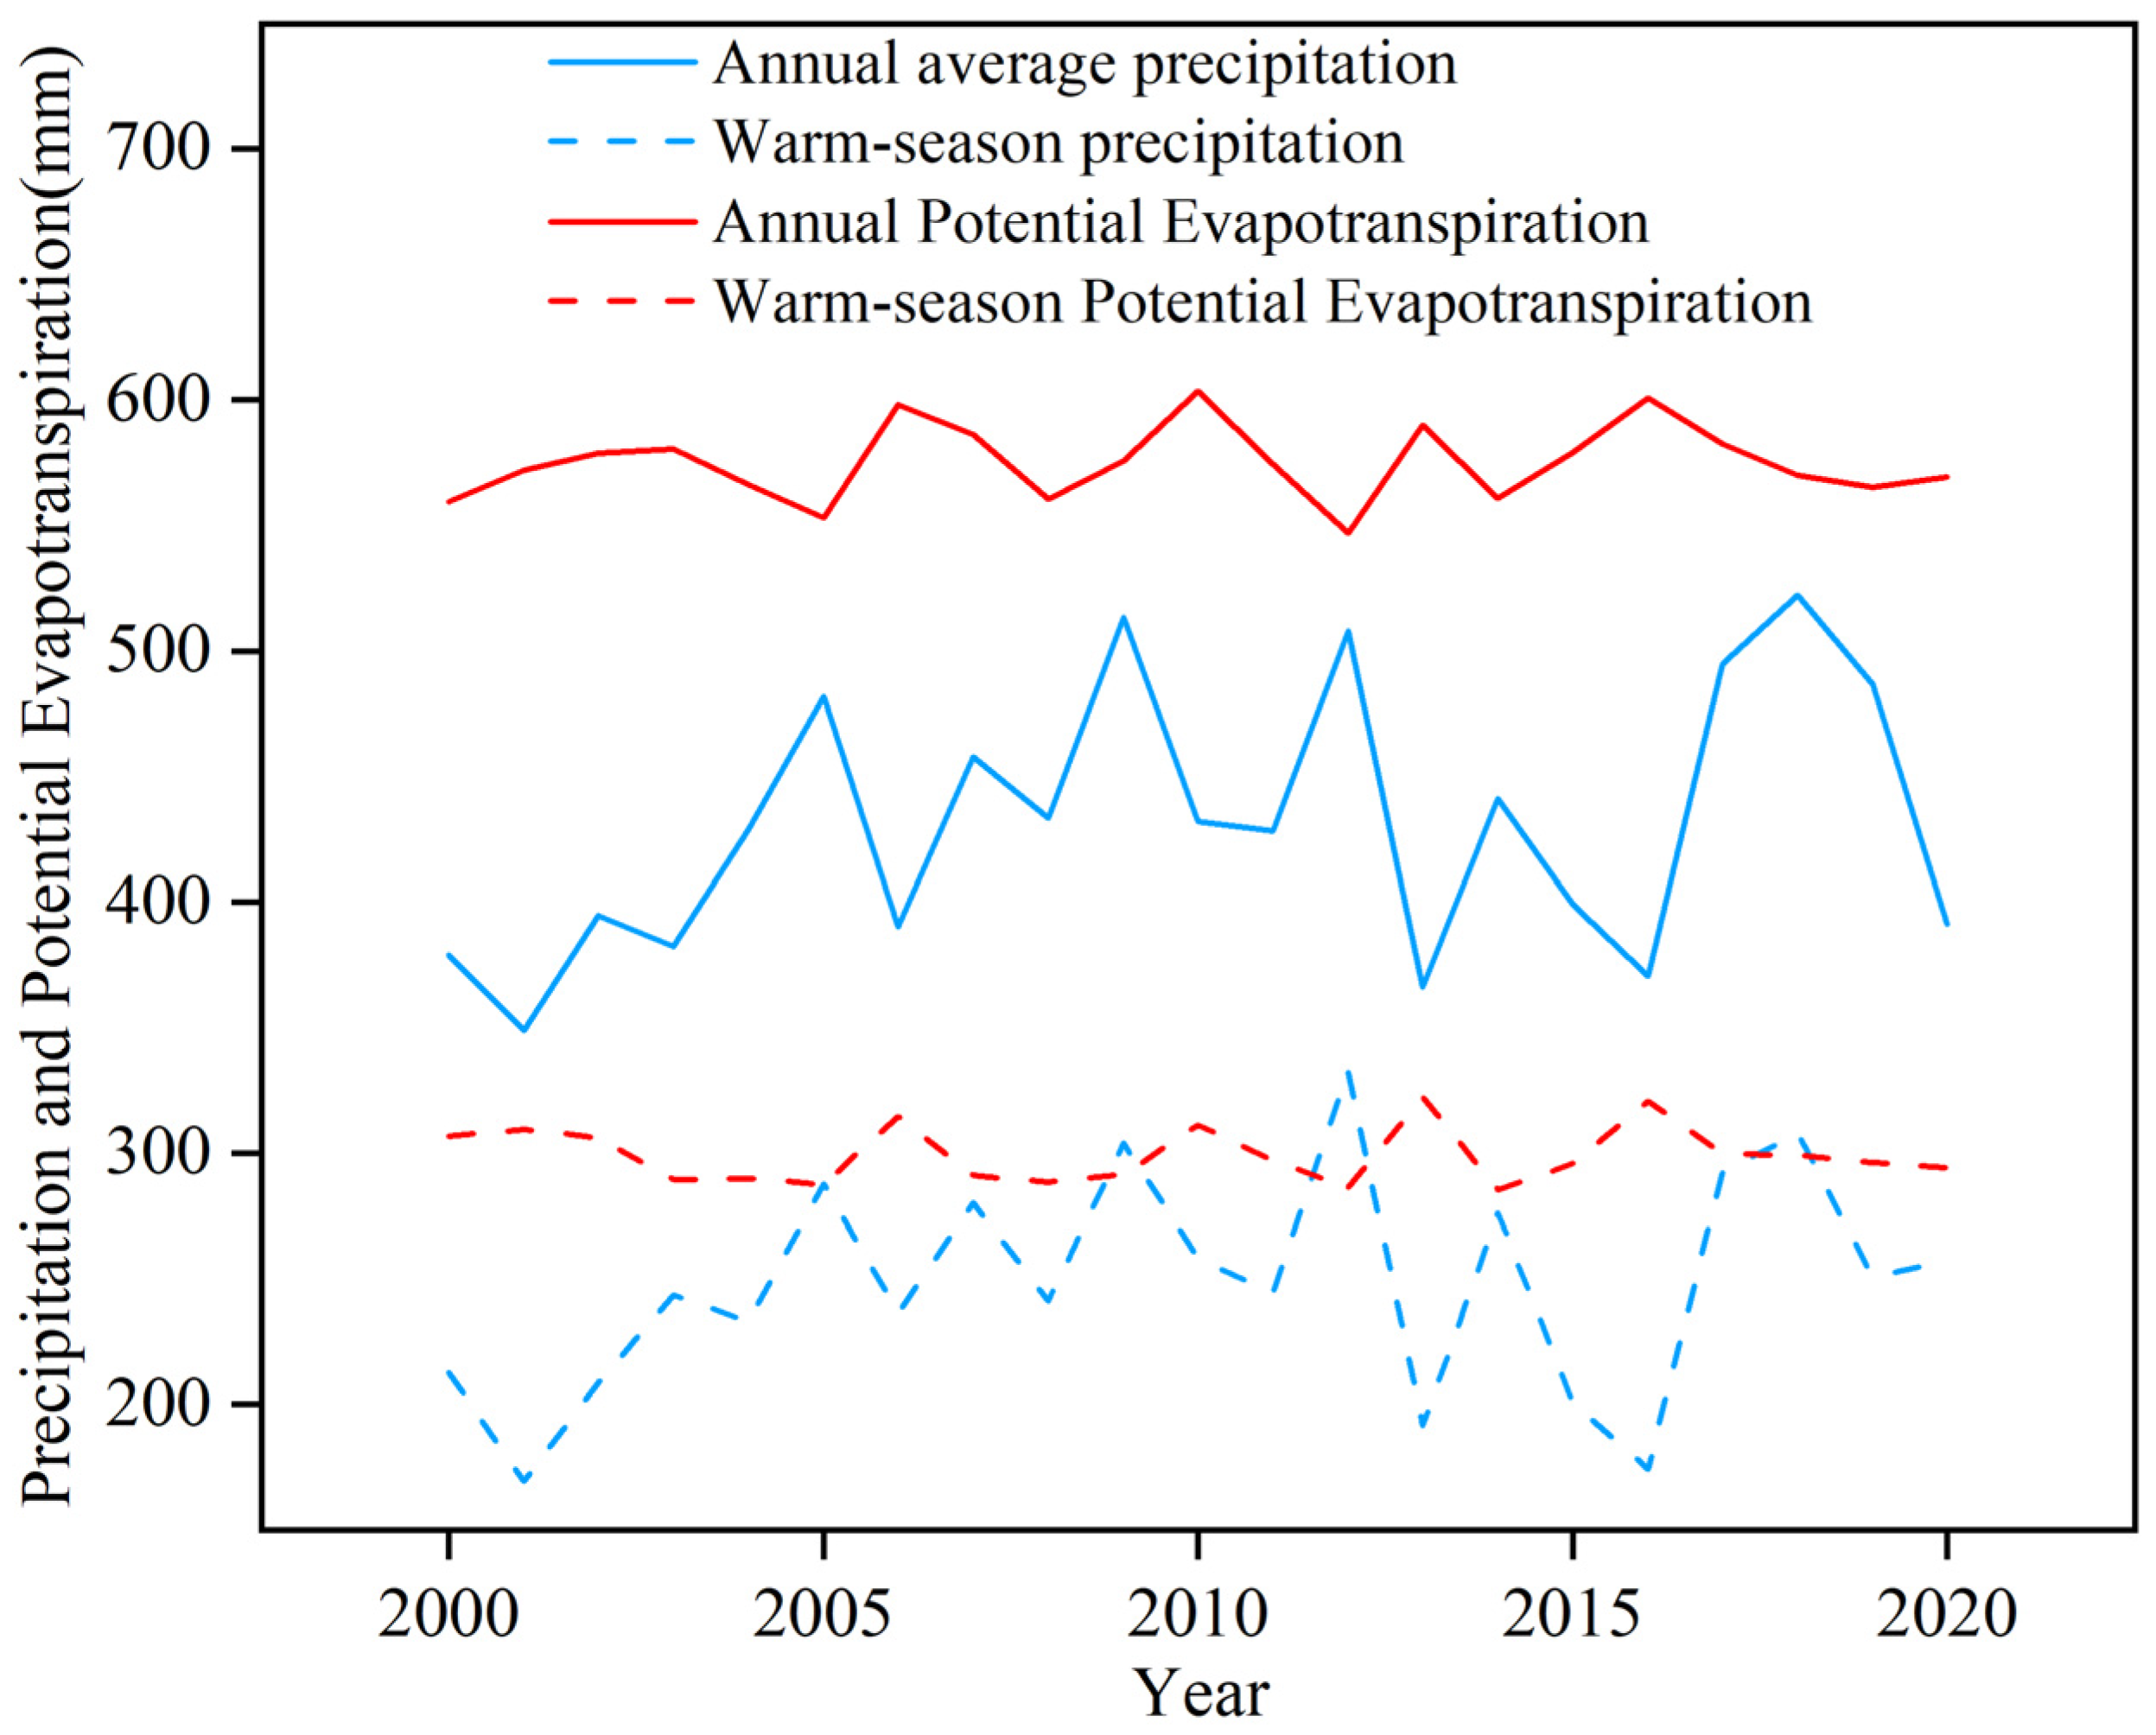
It is shown that warm-season temperature and annual average precipitation have the greatest influence on the wetland change of the YRSNP. The increase in river and lake wetlands is mainly affected by the annual precipitation and warm-season temperature. This may be because the hydrological recharge brought by the increase in precipitation and warm-season temperature leads to the melting of glaciers in the upstream region. In contrast, the reduction in the area of the marsh wetlands is mainly influenced by the average annual temperature due to the increase in active layer thickness and evapotranspiration from increasing temperatures, thus reducing the annual runoff from the YRSNP. While the melting of perennial permafrost further reduces surface runoff, and as this continues, the state of the water balance of the YRSNP will have negative feedback on warming, leading to shrinkage and degradation of marsh wetlands [21]. Figure 9 presents the comparative changes in the potential evapotranspiration (PET) in the YRSNP and precipitation from 2000 to 2020. The average annual PET (574.73 mm) in the YRSNP from 2000 to 2020 is approximately 1.33 times the annual precipitation, and the average PET in the warm season is 1.20 times the warm-season precipitation. This indicates that the rainfall in the YRSNP is mostly evaporated and not fully replenished to the wetlands even when rainfall is abundant, which is an important climatic cause of the degradation of the YRSNP marsh wetlands. In future work, we will consider and add more alternative methods that go beyond the analysis of correlations, such as structural equation models to understand fully the causal relationships.
As the YRSNP is located in a pastoralist area, the vast majority of the economic income comes from livestock farming, where the expansion of livestock numbers is the primary means of economic growth. Overgrazing has, therefore, destroyed the surface vegetation of the wetlands [40]. The dry climate of the region has additionally led to the degradation of wetlands to some extent [37]. In order to strengthen wetland protection, maintain wetland ecological functions and biodiversity, safeguard ecological security, promote ecological civilization, and achieve harmonious coexistence between humans and nature, the local government has adopted several wetland sealing projects, such as Phase I and Phase II of the Ecological Protection and Construction Projects in the Three-River-Source District, implemented in 2005, and the Ecological Environmental Protection Project for the Yellow-River-Source area lake cluster, implemented in 2015, which has enabled the YRSNP wetland area to be effectively protected and has promoted the balanced development of grass and livestock. Compared with the impact of climate change, the impact of anthropogenic activities on wetland ecosystems cannot be ignored [50]. From 2020 to 2035, the YRSNP will carry out the implementation of the China Water Tower Protection Project, the third phase of the Ecological Protection and Construction Project of the Three-River Source, and the Thousand Mile Protection Belt Project in the upper reaches of the Yellow River. It is expected that the wetland area of YRSNP will be further increased, so as to realize the sustainable development and utilization of the wetland ecosystem.
5. Conclusions
As an important part of the Three-River-Source National Park, the YRSNP is the source area of the Yellow River, with its wetland ecosystem being of great significance to the Yellow River Basin. This study assessed the distribution, the changes, and the causes of the YRSNP wetland by interpreting Landsat images for three years (2000, 2010, and 2020). The following conclusions were obtained: (1) The total area of the YRSNP wetland decreased from 6254.56 to 5819.79 , the river wetlands increased by 7.42%, lake wetlands increased by 6.01%, and marsh wetlands decreased by 9.17% from 2000 to 2020; (2) A warming and humidification of the climate were observed in the YRSNP from 2000–2010, with a 1.3 °C increase in temperature and a 173.44 mm increase in precipitation. However, a weakening of the warm–humid climate trend was observed in the climate from 2010 to 2020, in addition to the weakening of the increasing trend in temperature and precipitation; (3) The changes in the YRSNP wetland area correlated more with temperature than with precipitation, with the river wetland area and lake wetlands correlating most with the annual precipitation and positively with precipitation and temperature. The marsh wetlands correlated most with the mean annual temperature, and the spatial–temporal difference of the correlation coefficient with precipitation and temperature was not significant. This study achieves an integrated assessment of the distribution, changes, and causes of the wetlands in the YRSNP, which will contribute to the sustainable management of the wetland ecosystems of the region and the understanding of global wetland dynamics in response to climate change.
Author Contributions
Conceptualization, T.M. and L.Z.; methodology, T.M. and L.Z.; software, T.M.; validation, Y.S., B.H. and X.F.; investigation, X.F.; resources, X.F.; data curation, J.Z.; writing—original draft preparation, T.M.; writing—review and editing, T.M.; funding acquisition, L.Z. and Z.Z. All authors have read and agreed to the published version of the manuscript.
Funding
This research was funded by The National Key Research and Development Program of China (No. 2016YFC0501903).
Institutional Review Board Statement
Not applicable.
Informed Consent Statement
Not applicable.
Data Availability Statement
Not applicable.
Acknowledgments
We are appreciative for the paper writing assistance of Feng Zhang.
Conflicts of Interest
The authors declare no conflict of interest.
References
- Fickas, K.C.; Cohen, W.B.; Yang, Z. Landsat-based monitoring of annual wetland change in the Willamette Valley of Oregon, USA from 1972 to 2012. Wetl. Ecol. Manag. 2016, 24, 73–92. [Google Scholar] [CrossRef]
- Ghimire, U.; Nandimandalam, H.; Martinez-Guerra, E.; Gude, V.G. Wetlands for wastewater treatment. Water Environ. Res. 2019, 91, 1378–1389. [Google Scholar] [CrossRef] [PubMed] [Green Version]
- Colvin, S.A.; Sullivan, S.M.P.; Shirey, P.D.; Colvin, R.W.; Winemiller, K.O.; Hughes, R.M.; Fausch, K.D.; Infante, D.M.; Olden, J.D.; Bestgen, K.R. Headwater streams and wetlands are critical for sustaining fish, fisheries, and ecosystem services. Fisheries 2019, 44, 73–91. [Google Scholar] [CrossRef]
- Li, W.; Xue, P.; Liu, C.; Yan, H.; Zhu, G.; Cao, Y. Monitoring and landscape dynamic analysis of alpine wetland area based on multiple algorithms: A case study of Zoige plateau. Sensors 2020, 20, 7315. [Google Scholar] [CrossRef] [PubMed]
- Yu, H.; Liu, B.-T.; Wang, G.-X.; Zhang, T.-Z.; Yang, Y.; Lu, Y.-Q.; Xu, Y.-X.; Huang, M.; Yang, Y.; Zhang, L. Grass-livestock balance based grassland ecological carrying capability and sustainable strategy in the Yellow River Source National Park, Tibet Plateau, China. J. Mt. Sci. 2021, 18, 2201–2211. [Google Scholar] [CrossRef]
- Liu, Z.; Li, S.; Wei, W.; Song, X. Research progress on alpine wetland changes and driving forces in Qinghai-Tibet Plateau during the last three decades. Chin. J. Ecol. 2019, 38, 856–862. [Google Scholar]
- Liu, L.; Cao, W.; Shao, Q.; Huang, L.; He, T. Characteristics of Land Use/Cover and Macroscopic Ecological Changes in the Headwaters of the Yangtze River and of the Yellow River over the Past 30 Years. Sustainability 2016, 8, 237. [Google Scholar] [CrossRef] [Green Version]
- Wang, X.; Chen, R.; Yang, Y. Effects of permafrost degradation on the hydrological regime in the source regions of the Yangtze and Yellow Rivers, China. Water 2017, 9, 897. [Google Scholar] [CrossRef] [Green Version]
- Liu, P.; Guan, L.; Lu, C.; Zhang, M.X.; Lei, G.C. Technical Characteristics and Application Prospects of Achievements of the Second National Wetland Investigation. Wetl. Sci. 2011, 9, 284–289. (In Chinese) [Google Scholar]
- DeLancey, E.R.; Simms, J.F.; Mahdianpari, M.; Brisco, B.; Mahoney, C.; Kariyeva, J. Comparing deep learning and shallow learning for large-scale wetland classification in Alberta, Canada. Remote Sens. 2019, 12, 2. [Google Scholar] [CrossRef] [Green Version]
- Simioni, J.P.; Guasselli, L.A.; de Oliveira, G.G.; Ruiz, L.F.; de Oliveira, G. A comparison of data mining techniques and multi-sensor analysis for inland marshes delineation. Wetl. Ecol. Manag. 2020, 28, 577–594. [Google Scholar] [CrossRef]
- Soltani, K.; Amiri, A.; Zeynoddin, M.; Ebtehaj, I.; Gharabaghi, B.; Bonakdari, H. Forecasting monthly fluctuations of lake surface areas using remote sensing techniques and novel machine learning methods. Theor. Appl. Climatol. 2021, 143, 713–735. [Google Scholar] [CrossRef]
- Russi, D.; ten Brink, P.; Farmer, A.; Badura, T.; Coates, D.; Förster, J.; Kumar, R.; Davidson, N. The Economics of Ecosystems and Biodiversity (TEEB) for Water and Wetlands; IEEP: London, UK, 2013. [Google Scholar]
- Wang, J.; Zhu, Q.; Yang, Y.; Zhang, X.; Zhang, J.; Yuan, M.; Chen, H.; Peng, C. High uncertainties detected in the wetlands distribution of the Qinghai–Tibet Plateau based on multisource data. Landsc. Ecol. Eng. 2020, 16, 47–61. [Google Scholar] [CrossRef]
- Weise, K.; Höfer, R.; Franke, J.; Guelmami, A.; Simonson, W.; Muro, J.; O’Connor, B.; Strauch, A.; Flink, S.; Eberle, J. Wetland extent tools for SDG 6.6. 1 reporting from the Satellite-based Wetland Observation Service (SWOS). Remote Sens. Environ. 2020, 247, 111892. [Google Scholar] [CrossRef]
- Mahdianpari, M.; Salehi, B.; Mohammadimanesh, F.; Homayouni, S.; Gill, E. The first wetland inventory map of newfoundland at a spatial resolution of 10 m using sentinel-1 and sentinel-2 data on the google earth engine cloud computing platform. Remote Sens. 2018, 11, 43. [Google Scholar] [CrossRef] [Green Version]
- Yao, T. TPE international program: A program for coping with major future environmental challenges of The Third Pole region. Prog. Geogr. 2014, 33, 884–892. [Google Scholar]
- Zhao, Z.; Liu, L.; Wang, Z.; Zhang, Y.; Li, L.; Liu, F. Dynamic Changes of Plateau Wetlands in the Damqu River Basin, Yangtze River Source Region, China, 1988–2015. Wetlands 2020, 40, 1409–1424. [Google Scholar] [CrossRef]
- Ma, C.; He, Y. Spatiotemporal Trends and Ecological Determinants in Population by Elevation in China Since 1990. Chin. Geogr. Sci. 2021, 31, 248–260. [Google Scholar] [CrossRef]
- Wang, R.; He, M.; Niu, Z. Responses of alpine wetlands to climate changes on the Qinghai-Tibetan Plateau based on remote sensing. Chin. Geogr. Sci. 2020, 30, 189–201. [Google Scholar] [CrossRef]
- Lang, Q.; Niu, Z.; Hong, X.; Yang, X. Remote Sensing Monitoring and Change Analysis of Wetlands in the Tibetan Plateau. Geomat. Inf. Sci. Wuhan Univ. 2021, 46, 230–237. [Google Scholar]
- Zhang, Y.; Yan, J.; Cheng, X.; He, X. Wetland Changes and Their Relation to Climate Change in the Pumqu Basin, Tibetan Plateau. Int. J. Environ. Res. Public Health 2021, 18, 2682. [Google Scholar] [CrossRef] [PubMed]
- Cao, W.; Liu, L.; Wu, D.; Huang, L. Spatial and temporal variations and the importance of hierarchy of ecosystem functions in the Three-river-source National Park. Acta Ecol. Sin. 2019, 39, 1361–1374. [Google Scholar]
- Hu, G.; Jin, H.; Dong, Z.; Lu, J.; Yan, C. Driving forces of aeolian desertification in the source region of the Yellow River: 1975–2005. Environ. Earth Sci. 2013, 70, 3245–3254. [Google Scholar] [CrossRef]
- Bai, J.; Ouyang, H.; Xu, H.; Zhou, C.; Gao, J. Advances in studies of wetlands in Qinghai-Tibet Plateau. Prog. Geogr. 2004, 23, 1–9. [Google Scholar]
- Gong, P.; Niu, Z.; Cheng, X.; Zhao, K.; Zhou, D.; Guo, J.; Liang, L.; Wang, X.; Li, D.; Huang, H. China’s wetland change (1990–2000) determined by remote sensing. Sci. China Earth Sci. 2010, 53, 1036–1042. [Google Scholar] [CrossRef]
- Peng, S.; Ding, Y.; Liu, W.; Li, Z. 1 km monthly temperature and precipitation dataset for China from 1901 to 2017. Earth Syst. Sci. Data 2019, 11, 1931–1946. [Google Scholar] [CrossRef] [Green Version]
- Peng, S.; Ding, Y.; Wen, Z.; Chen, Y.; Cao, Y.; Ren, J. Spatiotemporal change and trend analysis of potential evapotranspiration over the Loess Plateau of China during 2011–2100. Agric. For. Meteorol. 2017, 233, 183–194. [Google Scholar] [CrossRef] [Green Version]
- Allen, R.G.; Pereira, L.S.; Raes, D.; Smith, M. Crop evapotranspiration-Guidelines for computing crop water requirements-FAO Irrigation and drainage paper 56. Fao Rome 1998, 300, D05109. [Google Scholar]
- Ma, L.; Li, M.; Ma, X.; Cheng, L.; Du, P.; Liu, Y. A review of supervised object-based land-cover image classification. ISPRS J. Photogramm. Remote Sens. 2017, 130, 277–293. [Google Scholar] [CrossRef]
- Zhang, C.H.; Li, X.N.; Wu, M.Q.; Qin, W.S.; Zhang, J. Object-oriented Classification of Land Cover Based on Landsat 8 OLI Image Data in the Kunyu Mountain. Sci. Geogr. Sin. 2018, 38, 1904–1913. (In Chinese) [Google Scholar]
- Landis, J.R.; Koch, G.G. The measurement of observer agreement for categorical data. Biometrics 1977, 33, 159–174. [Google Scholar] [CrossRef] [PubMed] [Green Version]
- Fang, L.; Dong, B.; Wang, C.; Yang, F.; Cui, Y.; Xu, W.; Peng, L.; Wang, Y.; Li, H. Research on the influence of land use change to habitat of cranes in Shengjin Lake wetland. Environ. Sci. Pollut. Res. 2020, 27, 7515–7525. [Google Scholar] [CrossRef]
- Shen, G.; Yang, X.; Jin, Y.; Xu, B.; Zhou, Q. Remote sensing and evaluation of the wetland ecological degradation process of the Zoige Plateau Wetland in China. Ecol. Indic. 2019, 104, 48–58. [Google Scholar] [CrossRef]
- Li, F.; Chang, G.; Xiao, J.; Zhou, B.-R.; Fu, Y. Relationship between wetlands changes and climate change in the Yellow River source region. J. Nat. Resour. 2009, 24, 683–690. [Google Scholar]
- Brierley, G.J.; Li, X.; Cullum, C.; Gao, J. Landscape and Ecosystem Diversity, Dynamics and Management in the Yellow River Source Zone; Springer: Cham, Switzerland, 2016. [Google Scholar]
- Song, X.; Yang, G.; Yan, C.; Duan, H.; Liu, G.; Zhu, Y. Driving forces behind land use and cover change in the Qinghai-Tibetan Plateau: A case study of the source region of the Yellow River, Qinghai Province, China. Environ. Earth Sci. 2009, 59, 793–801. [Google Scholar] [CrossRef]
- Luo, C.; Hao, M.; Li, Y.; Tong, L. Monitoring the changes of wetlands in the Source Region of Three Rivers with remote sensing data from 1976 to 2013. In Proceedings of the 2016 4th International Workshop on Earth Observation and Remote Sensing Applications (EORSA), Guangzhou, China, 4–6 July 2016; pp. 198–201. [Google Scholar]
- Ablat, X.; Wang, Q.; Arkin, N.; Guoping, T.; Sawut, R. Spatiotemporal variations and underlying mechanism of the floodplain wetlands in the meandering Yellow River in arid and semi-arid regions. Ecol. Indic. 2022, 136, 108709. [Google Scholar] [CrossRef]
- Li, X.; Xue, Z.; Gao, J. Dynamic changes of plateau wetlands in Madou County, the Yellow River source zone of China: 1990–2013. Wetlands 2016, 36, 299–310. [Google Scholar] [CrossRef]
- Yang, K.; Ye, B.; Zhou, D.; Wu, B.; Foken, T.; Qin, J.; Zhou, Z. Response of hydrological cycle to recent climate changes in the Tibetan Plateau. Clim. Chang. 2011, 109, 517–534. [Google Scholar] [CrossRef]
- Xi, Y.; Miao, C.; Wu, J.; Duan, Q.; Lei, X.; Li, H. Spatiotemporal Changes in Extreme Temperature and Precipitation Events in the Three-Rivers Headwater Region, China. J. Geophys. Res. Atmos. 2018, 123, 5827–5844. [Google Scholar] [CrossRef]
- Meng, F.; Su, F.; Yang, D.; Tong, K.; Hao, Z. Impacts of recent climate change on the hydrology in the source region of the Yellow River basin. J. Hydrol. Reg. Stud. 2016, 6, 66–81. [Google Scholar] [CrossRef] [Green Version]
- Xue, Z.; Lyu, X.; Chen, Z.; Zhang, Z.; Jiang, M.; Zhang, K.; Lyu, Y. Spatial and temporal changes of wetlands on the Qinghai-Tibetan Plateau from the 1970s to 2010s. Chin. Geogr. Sci. 2018, 28, 935–945. [Google Scholar] [CrossRef] [Green Version]
- Du, J.; Wang, G.; Yang, Y.; Zhang, T.; Mao, T. Temporal and spatial variation of the distributive patterns and driving force analysis in the Yangtze River and Yellow River source regions wetland. Acta Ecol. Sin. 2015, 35, 6173–6182. [Google Scholar]
- Jin, X.; Jin, H.; Luo, D.; Sheng, Y.; Wu, Q.; Wu, J.; Wang, W.; Huang, S.; Li, X.; Liang, S. Impacts of Permafrost Degradation on Hydrology and Vegetation in the Source Area of the Yellow River on Northeastern Qinghai-Tibet Plateau, Southwest China. Front. Earth Sci. 2022, 10, 845824. [Google Scholar] [CrossRef]
- Amani, M.; Mahdavi, S.; Kakooei, M.; Ghorbanian, A.; Brisco, B.; DeLancey, E.R.; Toure, S.; Reyes, E.L. Wetland Change Analysis in Alberta, Canada using Four Decades of Landsat Imagery. IEEE J. Sel. Top. Appl. Earth Obs. Remote Sens. 2021, 14, 10314–10335. [Google Scholar] [CrossRef]
- Luo, N.; Yu, R.; Mao, D.; Wen, B.; Liu, X. Spatiotemporal variations of wetlands in the northern Xinjiang with relationship to climate change. Wetl. Ecol. Manag. 2021, 29, 617–631. [Google Scholar] [CrossRef]
- Dong, L.; Xu, M. Dynamic Changes of the Alpine Wetlands in Tibet, China. In Proceedings of the IGARSS 2018–2018 IEEE International Geoscience and Remote Sensing Symposium, Valencia, Spain, 22–27 July 2018; pp. 9229–9232. [Google Scholar]
- Shao, Q.; Cao, W.; Fan, J.; Huang, L.; Xu, X. Effects of an ecological conservation and restoration project in the Three-River Source Region, China. J. Geogr. Sci. 2017, 27, 183–204. [Google Scholar] [CrossRef]
Figure 1.
Study area: (a) geographical location and altitude above sea level; (b) classification of the third national land survey.
Figure 1.
Study area: (a) geographical location and altitude above sea level; (b) classification of the third national land survey.

Figure 2.
A flow chart of object-oriented wetland classification.

Figure 3.
Spatial distribution of the wetlands in the YRSNP from 2000 to 2020.

Figure 4.
The evolution trend of wetlands in the YRSNP from 2000 to 2020. (a) Trends of wetland spatial evolution from 2000 to 2010; (b) trends of wetland spatial evolution from 2010 to 2020; (c) trends of wetland spatial evolution from 2000 to 2020.
Figure 4.
The evolution trend of wetlands in the YRSNP from 2000 to 2020. (a) Trends of wetland spatial evolution from 2000 to 2010; (b) trends of wetland spatial evolution from 2010 to 2020; (c) trends of wetland spatial evolution from 2000 to 2020.

Figure 5.
Variations of climate factors in the YRSNP from 2000 to 2020. (a) The interannual variation of annual precipitation; (b) the interannual variation of annual average temperature.
Figure 5.
Variations of climate factors in the YRSNP from 2000 to 2020. (a) The interannual variation of annual precipitation; (b) the interannual variation of annual average temperature.

Figure 6.
The spatial distribution of the annual precipitation change trend in the YRSNP from 2000 to 2020. (a) The spatial distribution of the annual precipitation trend from 2000 to 2010; (b) the spatial distribution of the annual precipitation change trend from 2000 to 2010; (c) the significance analysis of the precipitation change trend from 2000 to 2010; (d) the spatial distribution of the annual precipitation trend from 2010 to 2020; (e) the spatial distribution of the annual precipitation change trend from 2010 to 2020; (f) the significance analysis of the precipitation change trend from 2010 to 2020.

Figure 7.
The spatial distribution of the annual average temperature change trend in the YRSNP from 2000 to 2020. (a) The spatial distribution of the annual average temperature from 2000 to 2010; (b) the spatial distribution of the annual average temperature change trend from 2000 to 2010; (c) the significance analysis of the temperature change trend from 2000 to 2010; (d) the spatial distribution of the annual average temperature from 2010 to 2020; (e) the spatial distribution of the annual average temperature change trend from 2010 to 2020; (f) the significance analysis of the temperature change trend from 2010 to 2020.

Figure 8.
Analysis of the correlation between wetland change and climatic factors in the YRSNP from 2000 to 2020. (a) Correlation coefficient between river wetlands and precipitation; (b) correlation coefficient between river wetlands and temperature; (c) correlation coefficient between lake wetlands and precipitation; (d) correlation coefficient between lake wetlands and temperature; (e) correlation coefficient between marsh wetlands and precipitation; (f) correlation coefficient between marsh wetlands and temperature.

Figure 9.
Variations of potential evapotranspiration in the YRSNP from 2000 to 2020.


Table 1.
Wetland classification system for remote sensing in the YRSNP.
| Category | Description | Remote Sensing Image | Field Image |
|---|---|---|---|
| River wetland | Natural linear waterbody with flowing water in the wetland area |  |  |
| Lake wetland | Natural polygon waterbody with standing water in the wetland area |  |  |
| Marsh wetland | Natural wetland with dominant woody vegetation and dominant herbaceous vegetation in the wetland area |  |  |
Table 2.
The image segmentation index and classification features used in object-based classification.
Table 2.
The image segmentation index and classification features used in object-based classification.
| Category | Feature | Description | Application |
|---|---|---|---|
| Spectral features | Blue | Different bands of Landsat image | Image segmentation |
| Green | |||
| Red | |||
| NIR | |||
| SWIR1 | |||
| SWIR2 | |||
| annual NDVImax | (NIR − Red)/(NIR + Red) Annual maximum NDVI | ||
| annual MNDWImax | (Green − SWIR)/(Green + SWIR) Annual maximum NDVI | ||
| Mean | Layer mean value calculated from the layer values of all pixels forming an image object. | Classification rules | |
| Brightness | Sum of the mean values of the layers containing spectral information divided by their quantity computed for an image object. | ||
| StdDev | Standard deviation calculated from the layer values of all n pixels forming an image object. | ||
| Topographic features | DEM (m) | DEM with a resolution 30 m. | Image segmentation |
| Slope (°) | Generated from DEM. | ||
| Geometry features | Length (m) | The length can be calculated using the length-to-width ratio derived from a bounding box approximation. | Classification rules |
| Length/Width | Length-to-width ratio of an image object. | ||
| Density | Describe the distribution of an image object in pixel space. | ||
| Shape index | The smoothness of an image object’s border. |
Note: The description of features in Table 2 were from eCognition reference book (https://vdocument.in/ecognition-reference-book.html?page=1, accessed on 21 July 2022).
Table 3.
Kappa coefficient and classification accuracy comparison table.
| Kappa Coefficient | Strength of Agreement |
|---|---|
| <0 | Poor |
| 0~0.2 | Slight |
| 0.2~0.4 | Fair |
| 0.4~0.6 | Moderate |
| 0.6~0.8 | Substantial |
| 0.8~1 | Almost perfect |
Table 4.
Classification rule set of wetlands in the YRSNP.
| Classification Rules | River Wetland | Lake Wetland | Marsh Wetland |
|---|---|---|---|
| Density | 0.29–1.58 | 0.89–2.37 | 0.98–2.26 |
| Length (m) | 190.51–831.93 | 109.22–552.41 | 116–560.62 |
| Length/Width | 2.09–10.95 | 1.02–3.31 | 1.01–5.71 |
| Shape index | 2.67–11.85 | 1.75–5.67 | 3.33–5.37 |
| NDVI | 0.033–0.38 | –0.073–0.055 | 0.31–0.73 |
| NDWI | 0.38–0.90 | 0.86–0.95 | 0.18–0.78 |
| DEM (m) | 4161.78–4328.23 | 4162.00–4421.41 | 4164.41–4277.41 |
| Slope (°) | 2.35–13.92 | 0–9.44 | 2.48–7.67 |
Table 5.
Classification accuracy of wetlands in the YRSNP.
| Wetland Categories | Kappa Coefficient | Overall Accuracy | ||||
|---|---|---|---|---|---|---|
| 2000 | 2010 | 2020 | 2000 | 2010 | 2020 | |
| River wetland | 0.55 | 0.58 | 0.68 | 0.60 | 0.62 | 0.69 |
| Lake wetland | 0.81 | 0.85 | 0.85 | 0.94 | 0.95 | 0.95 |
| Marsh wetland | 0.59 | 0.65 | 0.71 | 0.68 | 0.75 | 0.81 |
| Total wetland | 0.63 | 0.70 | 0.75 | 0.73 | 0.77 | 0.82 |
Table 6.
Wetland area change in the TRSNP from 2000 to 2020.
| Wetland Categories | 2000 | 2010 | 2020 | 2000–2010 | 2010–2020 | 2000–2020 | ||||||
|---|---|---|---|---|---|---|---|---|---|---|---|---|
| % | % | % | Change% | Change% | Change% | |||||||
| River wetland | 399.05 | 6.63 | 415.16 | 7.14 | 428.69 | 7.88 | 16.11 | 4.04 | 13.53 | 3.25 | 29.64 | 7.42 |
| Lake wetland | 1426.24 | 23.69 | 1486.33 | 25.57 | 1517.43 | 26.07 | 60.09 | 4.21 | 31.1 | 2.09 | 91.19 | 6.01 |
| Marsh wetland | 4196.10 | 69.69 | 3910.21 | 67.28 | 3843.67 | 66.04 | −285.89 | −6.81 | −66.54 | −1.70 | −352.43 | −9.17 |
| Total | 6254.56 | 100.00 | 5811.70 | 100.00 | 5819.79 | 100.00 | −442.86 | −7.08 | 8.09 | 0.14 | −434.77 | −7.47 |
Note: Change% is the percentage of the changing area divided by the initial area of this period.
Table 7.
The grey relation between the wetland area and climatic factors in the YRSNP from 2000 to 2020.
Table 7.
The grey relation between the wetland area and climatic factors in the YRSNP from 2000 to 2020.
| Climate Factors | River Wetland | Lake Wetland | Marsh Wetland | Total Wetland |
|---|---|---|---|---|
| Annual average precipitation | 0.7126 | 0.8005 | 0.6375 | 0.6629 |
| Warm-season precipitation | 0.6347 | 0.6600 | 0.5579 | 0.5570 |
| Annual average temperature | 0.5642 | 0.5713 | 0.8054 | 0.6869 |
| Warm-season temperature | 0.6742 | 0.7551 | 0.6679 | 0.7122 |
Publisher’s Note: MDPI stays neutral with regard to jurisdictional claims in published maps and institutional affiliations. |
© 2022 by the authors. Licensee MDPI, Basel, Switzerland. This article is an open access article distributed under the terms and conditions of the Creative Commons Attribution (CC BY) license (https://creativecommons.org/licenses/by/4.0/).
Share and Cite
MDPI and ACS Style
Ma, T.; She, Y.; Zhao, L.; Hu, B.; Feng, X.; Zhao, J.; Zhao, Z. Alpine Wetland Evolution and Their Response to Climate Change in the Yellow-River-Source National Park from 2000 to 2020. Water 2022, 14, 2351. https://doi.org/10.3390/w14152351
AMA Style
Ma T, She Y, Zhao L, Hu B, Feng X, Zhao J, Zhao Z. Alpine Wetland Evolution and Their Response to Climate Change in the Yellow-River-Source National Park from 2000 to 2020. Water. 2022; 14(15):2351. https://doi.org/10.3390/w14152351
Chicago/Turabian StyleMa, Tao, Yandi She, Li Zhao, Bixia Hu, Xueke Feng, Jing Zhao, and Zhizhong Zhao. 2022. "Alpine Wetland Evolution and Their Response to Climate Change in the Yellow-River-Source National Park from 2000 to 2020" Water 14, no. 15: 2351. https://doi.org/10.3390/w14152351
Note that from the first issue of 2016, this journal uses article numbers instead of page numbers. See further details here.