
Effects of Algae on the Formation of Black Blooms and Bacterial Community Structure Changes in Sediments and Black Floats

1
Department of Environmental Science and Engineering, Fudan University, Shanghai 200433, China
2
School of Environmental Science and Engineering, Tongji University, Shanghai 200092, China
*
Authors to whom correspondence should be addressed.
Water 2022, 14(15), 2348; https://doi.org/10.3390/w14152348
Submission received: 13 June 2022
/
Revised: 17 July 2022
/
Accepted: 27 July 2022
/
Published: 29 July 2022
(This article belongs to the Section Water Quality and Contamination)
Abstract
:Black bloom is a phenomenon of serious deterioration in shallow-water ecosystems worldwide. This study investigated the effects of algae on the formation of black blooms and the changes of the bacterial community using nearly in-situ cores for a 40-day indoor simulation. We designed experiments with different combinations of water (W), sediments-water (SW), and sediments-water-algae (SWA), and made a comparative analysis of bacterial communities in sediments and black floats. The results demonstrated that the severity of black blooms was considerably affected by the presence of cyanobacteria. The concentration of total nitrates (TN) and NH4+-N in the SWA group increased to 25.1 and 22.47 mg/L (4.05 and 5.5 times of their initial concentrations), respectively. The abundance of microorganisms in the sediments was significantly higher than that of the black floats. The dominant species in both sediments were Proteobacteria and Chloroflexi, whose total proportion exceeded 50%. The addition of algae did not change the dominant community of the sediments. In black floats, the dominant species of the SW group were Proteobacteria (39%) and Actinobacteria (16%), and these of the SWA group were Proteobacteria (38%) and Cyanobacteria (35%). The dominant species in black floats changed significantly. Cyanobacteria increased remarkably in black floats in the group of algae additions. The possible reason may be that the Actinobacteria were suppressed by Cyanobacteria. Therefore, the addition of algae has a significant promoting effect on black blooms and significantly affects the microbial community structure of black floats.
1. Introduction
Black blooms, better known as black water agglomerates, black spots, or black water, have become an issue that seriously deteriorates the ecosystem in waters and threatens the safety of drinking water. It usually occurs in summer and is characterized by a brown-black colored water, the release of a foul odor, a high concentration of nutrients (e.g., ammonia, nitrogen, and phosphate), and an extremely low dissolved oxygen [1]. Black blooms can quickly spread to a large hypoxic area within a few days, causing the death of fish and other aquatic organisms. In recent decades, black blooms have frequently appeared in the waters of different regions, such as in Lake Taihu (China) [2], Lake Kasumigaura (Japan) [3], Lower Mystic Lake (USA) [4], and Lake Garda (Italy) [5]. Some urban rivers have also experienced black blooms [6]. Black bloom has become a common problem worldwide. It not only severely damages water ecosystems but may also pose a huge threat to the safety of drinking water. Therefore, it is necessary to effectively prevent the occurrence of black blooms in rivers.
Many studies have focused on the origin of black blooms. Some reports have shown that black blooms are always accompanied by an extremely low level of dissolved oxygen; low redox potential; high concentrations of metal sulfides; and odorous volatile organic sulfur compounds, such as dimethyl sulfide and dimethyl disulfide [1,7,8]. Some reports have suggested that high concentrations of H2S and metal sulfides are the main reasons for this phenomenon [9,10]. With the development of molecular biology tools, more and more researchers have begun to pay attention to the role of microbial communities in black blooms. Zhou et al. [11] showed that sulfate-reducing bacteria (SRB) in sediments are the main biological contributors to black blooms through beaker experiments. The dynamic change of the sedimental microbial community was observed on the 3rd and 7th day during the black blooms, which showed that the microbes in Cyanobacteria, Verrucomicrobia, Planctomycetes, and Actinobacteria obviously increased, while microbes from the Chloroflexi and Acidobacteria decreased significantly [12]. It was also reported that the Proteobacteria, Firmicutes, Bacteroidetes, Actinobacteria, and Planctomycetes were dominant species that were related to the formation of black blooms [13]. However, these publications have studied the bacterial community in the sediments, but the bacterial community in black floats has not been well studied. The underlying relationship between black blooms and the microbial community, at the molecular level, is poorly understood. Furthermore, most studies used a Y-shaped device or beaker in their research [7,9], which changed the properties of the sediments, affecting the inference of the results. The intact sediments’ cores used in this study were collected using a coring device equipped with a core cylinder, a polyvinyl chloride pipe handle, and a one-way valve [14], which contained undisturbed overlying water and in-situ sediments (10–15 cm). The core retains the properties of the in-situ sediments; thus, it can better reflect the changes in its biological, physical, and chemical indicators.
At the same time, it was reported that algae play a vital role in the occurrence of black blooms. On the one hand, many studies have confirmed that the addition of algae accelerates the occurrence of black blooms. Wang et al. [15] found that a high density of algae and the anaerobic environment formed during algal decomposition provide the necessary conditions for black blooms. Yin et al. [16] reported that the decomposition of dead algae can produce high concentrations of methyl groups, which can react with H2S to form volatile organic sulfides in black blooms. On the other hand, as an important source of energy for benthic microorganisms, organic matter from the algal debris can accelerate the process of the microbial metabolism and cause changes in the composition of the nutrients as well as the microbial communities in the water and sediments. Feng et al. [17] found that decaying algae can provide SRB with organic sulfur and a large amount of carbon to promote the reproduction of SRB for black blooms, where the darkening of the black blooms increases with an increase in algal density. Louati et al. [18] observed dramatic changes in the bacterial richness and diversity index during black blooms of two species of cyanobacteria (Anabaena and Microcystis). However, information regarding the reason for the occurrence of black blooms is limited, as there are few studies on the relationship between algae and microorganisms in the sediments and black floats during black blooms. The present study used high-throughput sequencing technology to explore the synergistic effect of algae and microorganisms in the sediments and black floats, and to conduct deeper research on the mechanisms of black blooms.
The nearly in-situ cores were used to study the effects of the algae addition on the formation of black blooms and to compare the bacterial communities in sediments and black floats. This study aimed to explore (1) the effects of the algae addition on black blooms; (2) the changes of microbial communities after the algae addition in the sediments and black floats; and (3) the relationships and differences in the microbial community structure between the sediments and black floats during black blooms. This study gained insight into the eco-physiological roles that these organisms play in the formation of black blooms and could benefit greatly from a microbiological perspective.
2. Materials and Methods
2.1. Site Description and Sample Collection
The in-situ columnar sediments and water used in this study were collected from a river in the southwest of Shanghai (30°43′54″ N, 120°19′55″ E), China in June 2020. Intact sediments cores were collected using a coring device equipped with a core cylinder, a polyvinyl chloride pipe handle, and a one-way valve [14], which contained undisturbed overlying water and in-situ sediments (10–15 cm). Additional water samples (500 mL) were collected for a preliminary nutrient analysis. After collection, all samples were transported to the laboratory within 4 h in a cooler. The initial indicators during the sampling period were as follows: pH 7.47, dissolved oxygen (DO) 2.6 mg/L, total nitrogen (TN) 3.3 mg/L, and total phosphorus (TP) 0.54 mg/L.
2.2. Experimental Design
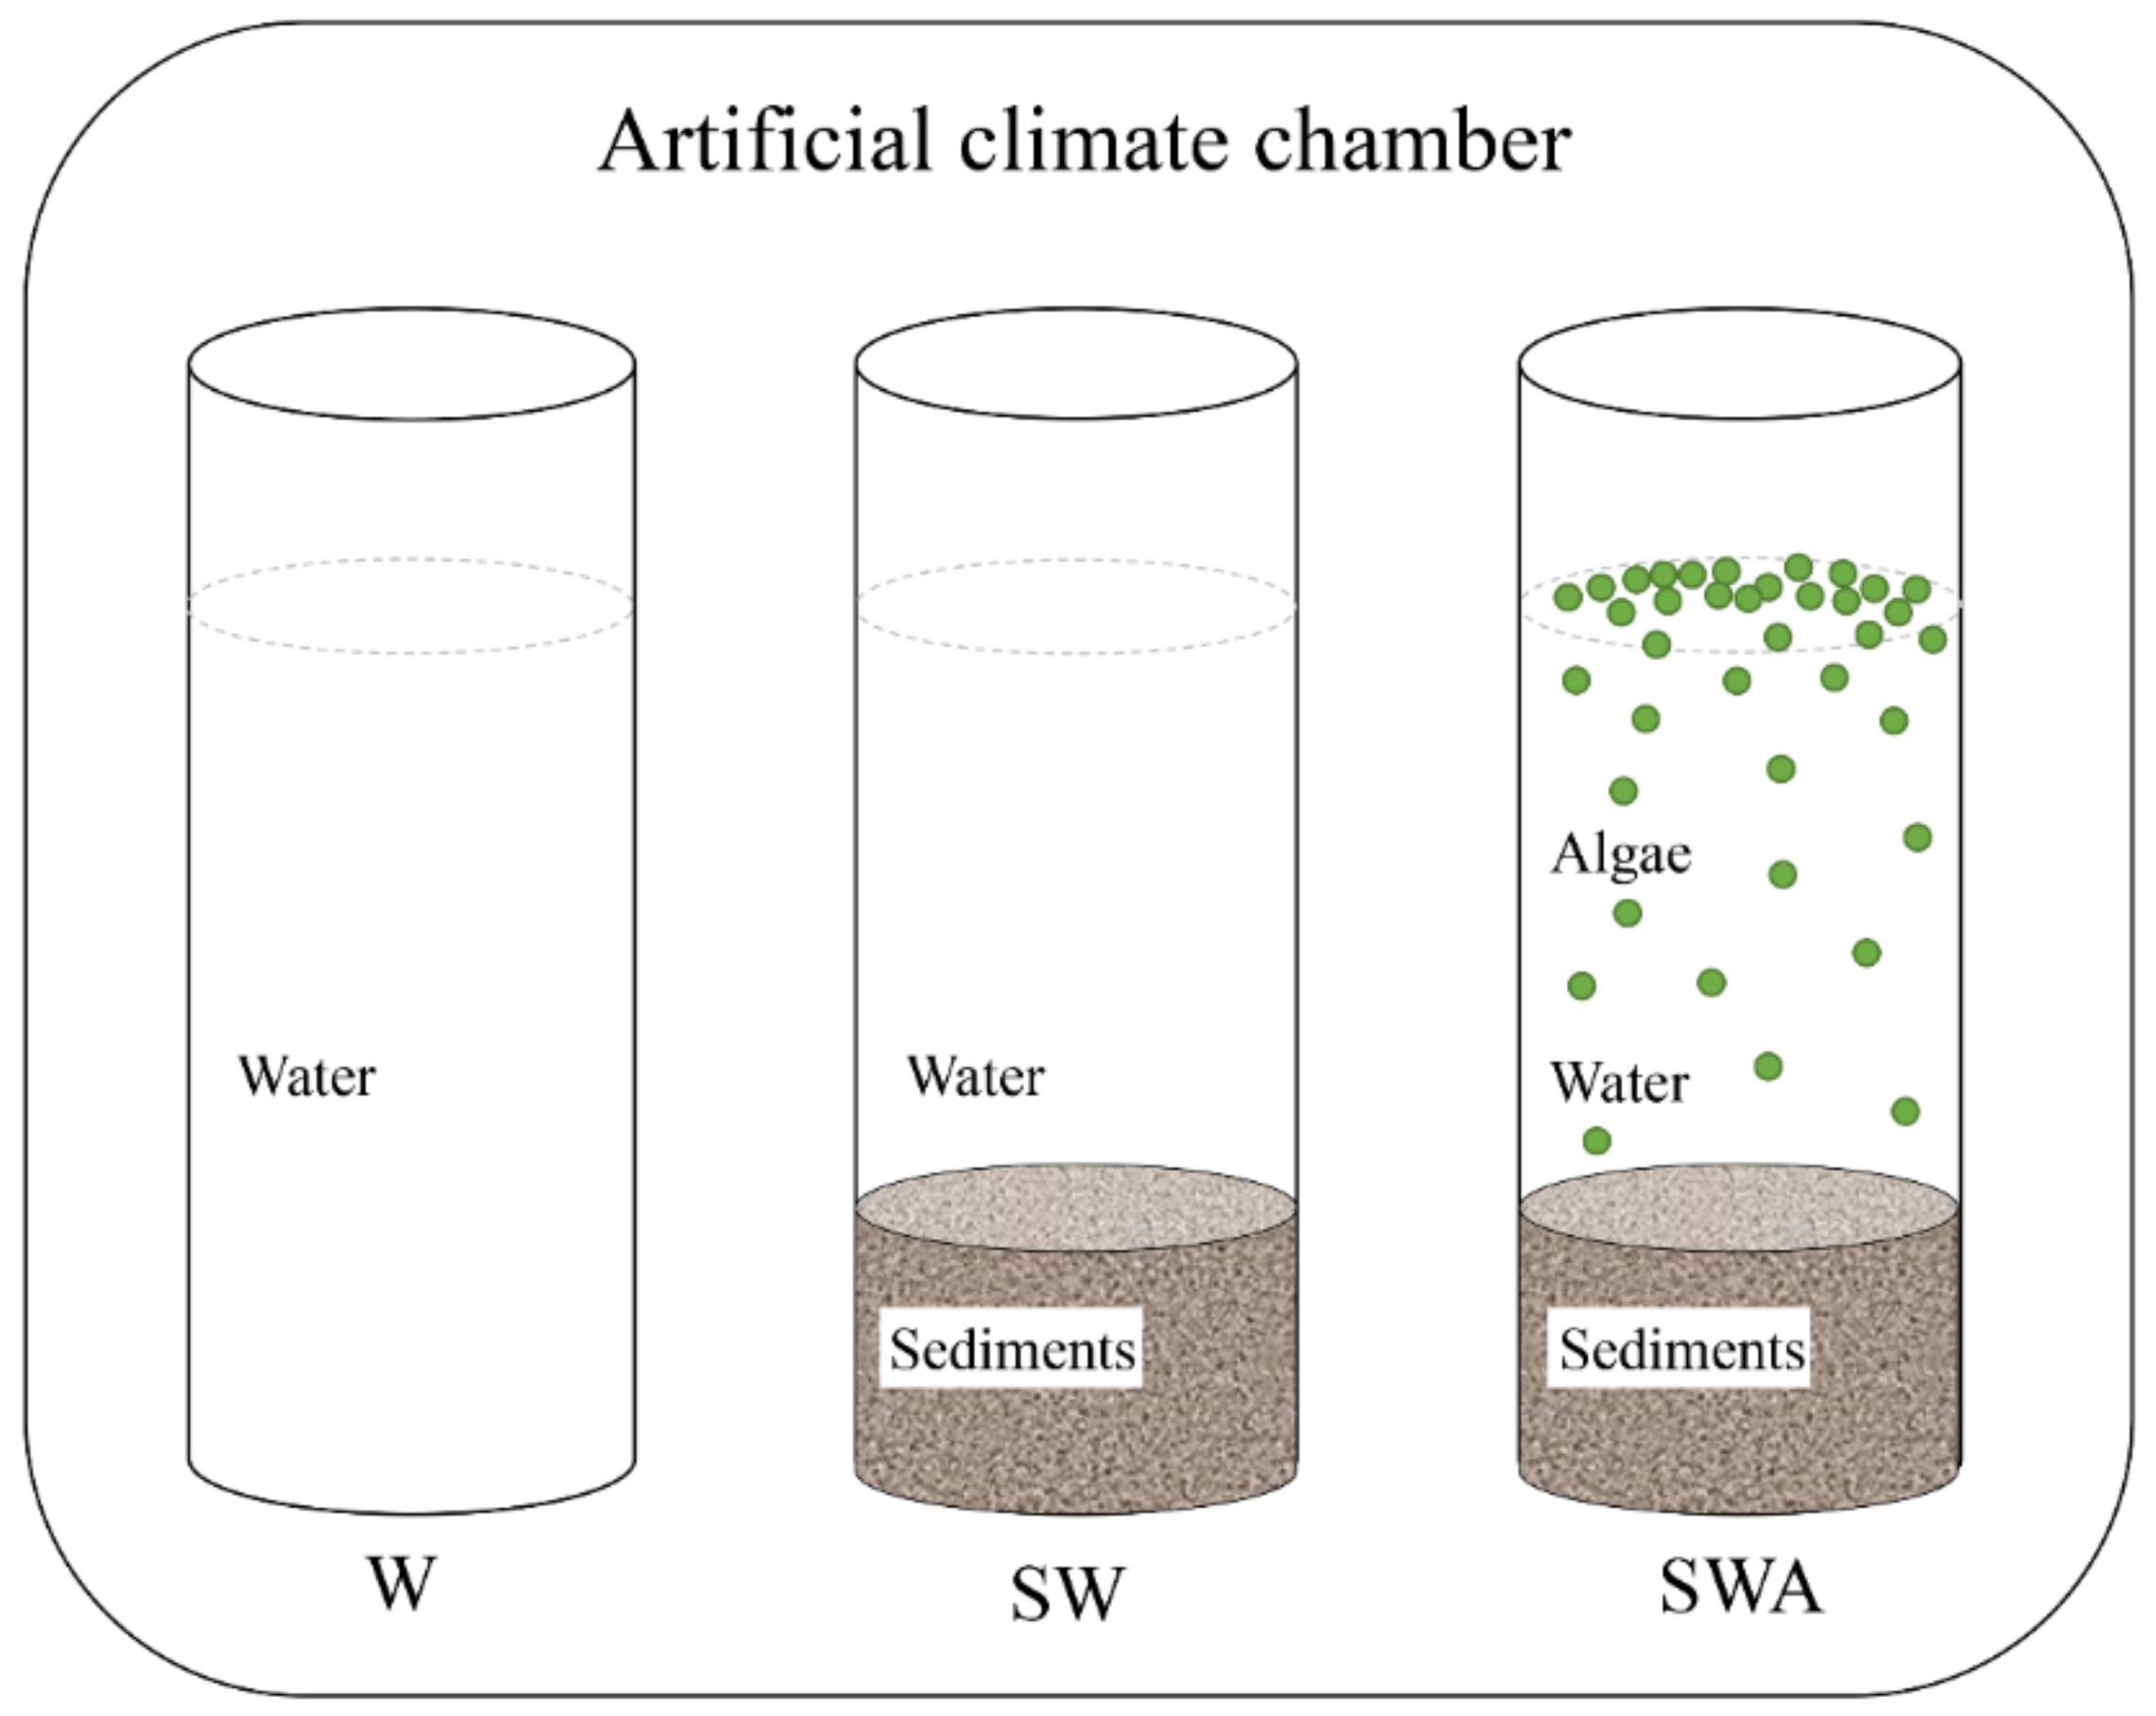
Six cores were wrapped with aluminum foil and placed in an artificial climate chamber (25–30 °C, day-night cycle of 16 h:8 h, sunlight intensity of 8000 lx) as shown in Figure 1. Two cores were only added water (W), two cores were sediments-water (SW), and the last two cores were sediments-water-algae (SWA 105 cells/mL). These columns were covered with aluminum foil except for the top 5 cm, in order to better simulate the ambient environment of the river. During the experiment, DO, pH, TN, TP, and other indicators in each core were measured on days 0, 1, 2, 3, 4, 6, 8, 10, 13, 16, 20, 25, 30, 35, and 40. The odor samples were collected on day 40. When the black blooms occurred, the sediments and black floats on the surface of the water were collected to analyze the structural characteristics of the microbial community present there.
The algal density of the SWA group was set to 105 cells/mL, which was in line with the content of algal cells in urban rivers [19]. Microcystis aeruginosa (FACHB-905) used in this experiment was purchased from the Institute of Hydrobiology, Chinese Academy of Sciences. The inoculated Microcystis aeruginosa was cultured in BG11 medium and in a light incubator under the following conditions: day and night alternating 12 h/12 h light culture. The daytime temperature was set to 29 °C, the light was 60%, and the light intensity was 40 μmol·m−2·s−1, and the night temperature was 25 °C without light. An appropriate amount of Microcystis aeruginosa was taken during the logarithmic growth period (7th day) and centrifuged at 3000× g for 15 min to collect the algal cells. The algal cells were washed three times with sterilized deionized water, and slowly added to the SWA cores to make the cell density 105 cells/mL based on the volume of water in the SWA cores.
2.3. Analysis Methods
Water subsamples were collected from the middle of the overlying water, filtered through 0.45-μm membrane filters, and immediately stored in a refrigerator at 4 °C for subsequent analysis. TN and TP were measured using the standard method of water and wastewater monitoring [20], and NH4+-N and PO43− levels were measured using an automatic discontinuous chemical analyzer (AQ-400, SEAL, Shanghai, China).
The pH value and DO were measured using a portable instrument (Multi 3630 IDS, WTW, Munich, Germany). The odor compounds 2-methylisoborneol (2-MIB) and geosmin (GSM) were concentrated and determined using headspace solid-phase microextraction-gas chromatography-mass spectrometry (SPME-GC/MS) (Agilent 7890a-7000, Agilent Technologies (Shanghai) Co., Shanghai, China).
2.4. 16S rRNA Gene Amplicon Sequencing
At the end of the experiment, the sediments and black floats on the surface in the SW and SWA groups were collected, placed in a sterilized centrifuge tube, and stored at −80 °C until DNA extraction. The procedures for 16S rRNA gene sequencing were performed by Shanghai Major Bioinformatics Co., Ltd. (Shanghai, China), and the genomic DNA of the samples was extracted using the FastDNA Spin Kit for DNA extraction kit. The V3-V4 variable region was amplified using 338F (5′-ACTCCTACGGGAGGCAGCAG-3′) and 806R (5′-GGACTACHVGGGTWTCTAAT-3′) primers and high-efficiency and high-fidelity polymerase chain reaction enzymes to ensure amplification efficiency and accuracy. A TruSeq™ DNA Sample PrepKit was used for library construction. The constructed library was quantified using QuantiFluor™-ST. After the library was quantified, the MiSeq PE300 platform was used for sequencing. The sequences of all samples with 97% similarity were clustered into operation taxonomic units (OTUs), and then SILVA’s SSUrRNA database was used to annotate the representative sequences of OTUs to determine the bacterial name corresponding to the 16S rRNA gene sequences obtained.
2.5. Sequencing Data Analysis
Valid sequences were merged and classified into operational units (OTUs) according to ≥97% sequence similarity, and the representative sequences of OTUs were compared with the Green-genes database. The abundance-based coverage estimator (ACE) and Chao (species richness index) were calculated according to the OTUs value. According to the obtained composition and abundance distribution table of each sample at the phylum level, Circos-0.67–7 software was used to plot the relationship between the samples and the dominant species at the phylum level.
3. Results and Discussion
3.1. Black Bloom Simulation Using In-Situ Cores
The distinctive features of black blooms are blackness and odorous compounds. The blackness classification method used in previous studies was adopted, which defines an artificial level of describing the color of water [21,22]. According to the colors observed in this experiment, five levels (0, 1, 2, 3, and 4) were created, corresponding to colorless, gray, light black, black, and dark black, respectively.
Table 1 shows the level of black color during the process of black blooms. The SWA group first appeared gray on the 10th day and continued to deepen until it became dark black. The development of black blooms in the SW group started notably later than the SWA group, and its color was lighter. The W group remained colorless or light gray throughout the experiment (40 d). Pictures of different cores on the 4th, 10th, 16th, and 30th days are also shown in Figure S1. It is clear that the level of black color became deeper with the processes of black blooms, especially the SWA group. Table 1 and Figure S1 show that the black blooms in the SWA group were more serious than the other groups, and the formation of black blooms was significantly affected by the presence of cyanobacteria. At present, there are three main views on the reasons for the change of water color. The first is that amorphous ferrous sulfide in the water is the main reason for the black color [10,23]. The other view is the high concentrations of colored soluble organic matter, such as humic acid and fulvic acid, are in the water [24]. The last one is that the black surface sediments formed in the anaerobic reducing environment enter the water under the disturbance of wind and waves, making the water appear black [9,25]. During this simulation study, the cores remained static without disturbance. Therefore, the third viewpoint would not happen in the cores. During the simulation experiments, it was excited that the water’s color changes were concentrated in the upper illumination area of the core. Few organic matter would depend on photosynthesis, and then the second point possibly would not happen. In a low oxygen environment, sulfate reducing bacteria reduce sulfur in algal cells and sediments to S2− and combine with Fe2+ in sediments to form black particles [17,26], which are adsorbed on some organisms that can perform photosynthesis. When these microorganisms float to the water surface, the color of the water becomes black. It is obvious that the first viewpoint is possible. Moreover, more details need further study in the near future.
Sediments, water, and algae are the main components of aquatic ecosystems, and most nutrient migration or transformation occurs in the SWA system. Similar results were also reported in recent studies that algae are important to the formation of black blooms. Lu and Ma [2] investigated black blooms in Lake Taihu and found that black blooms mainly occurred in areas with high sludge content and high levels of algae accumulation. A study reported that the black blooms of the high algae content group appeared on the 5th day [22], slightly earlier than what was observed in our study. Different temperatures and algal volumes may lead to this phenomenon. It was also speculated that the occurrence of black blooms was related to algae and was strongly influenced by algae [22]. As the biomass of cyanobacteria increases, the severity of black blooms may increase. However, comparing the SW and SWA groups, the results demonstrated that the sediments were essential for the formation of black blooms, and algae could accelerate their formation. In some simulation experiments, it was observed that black blooms did not form in the water column with algae added where there were no sediments, which suggested that the sediments are critical for the formation of black blooms [16,27,28]. Other publications also agreed that the presence of nutrient-rich sediments could promote the formation of black blooms [21,23].
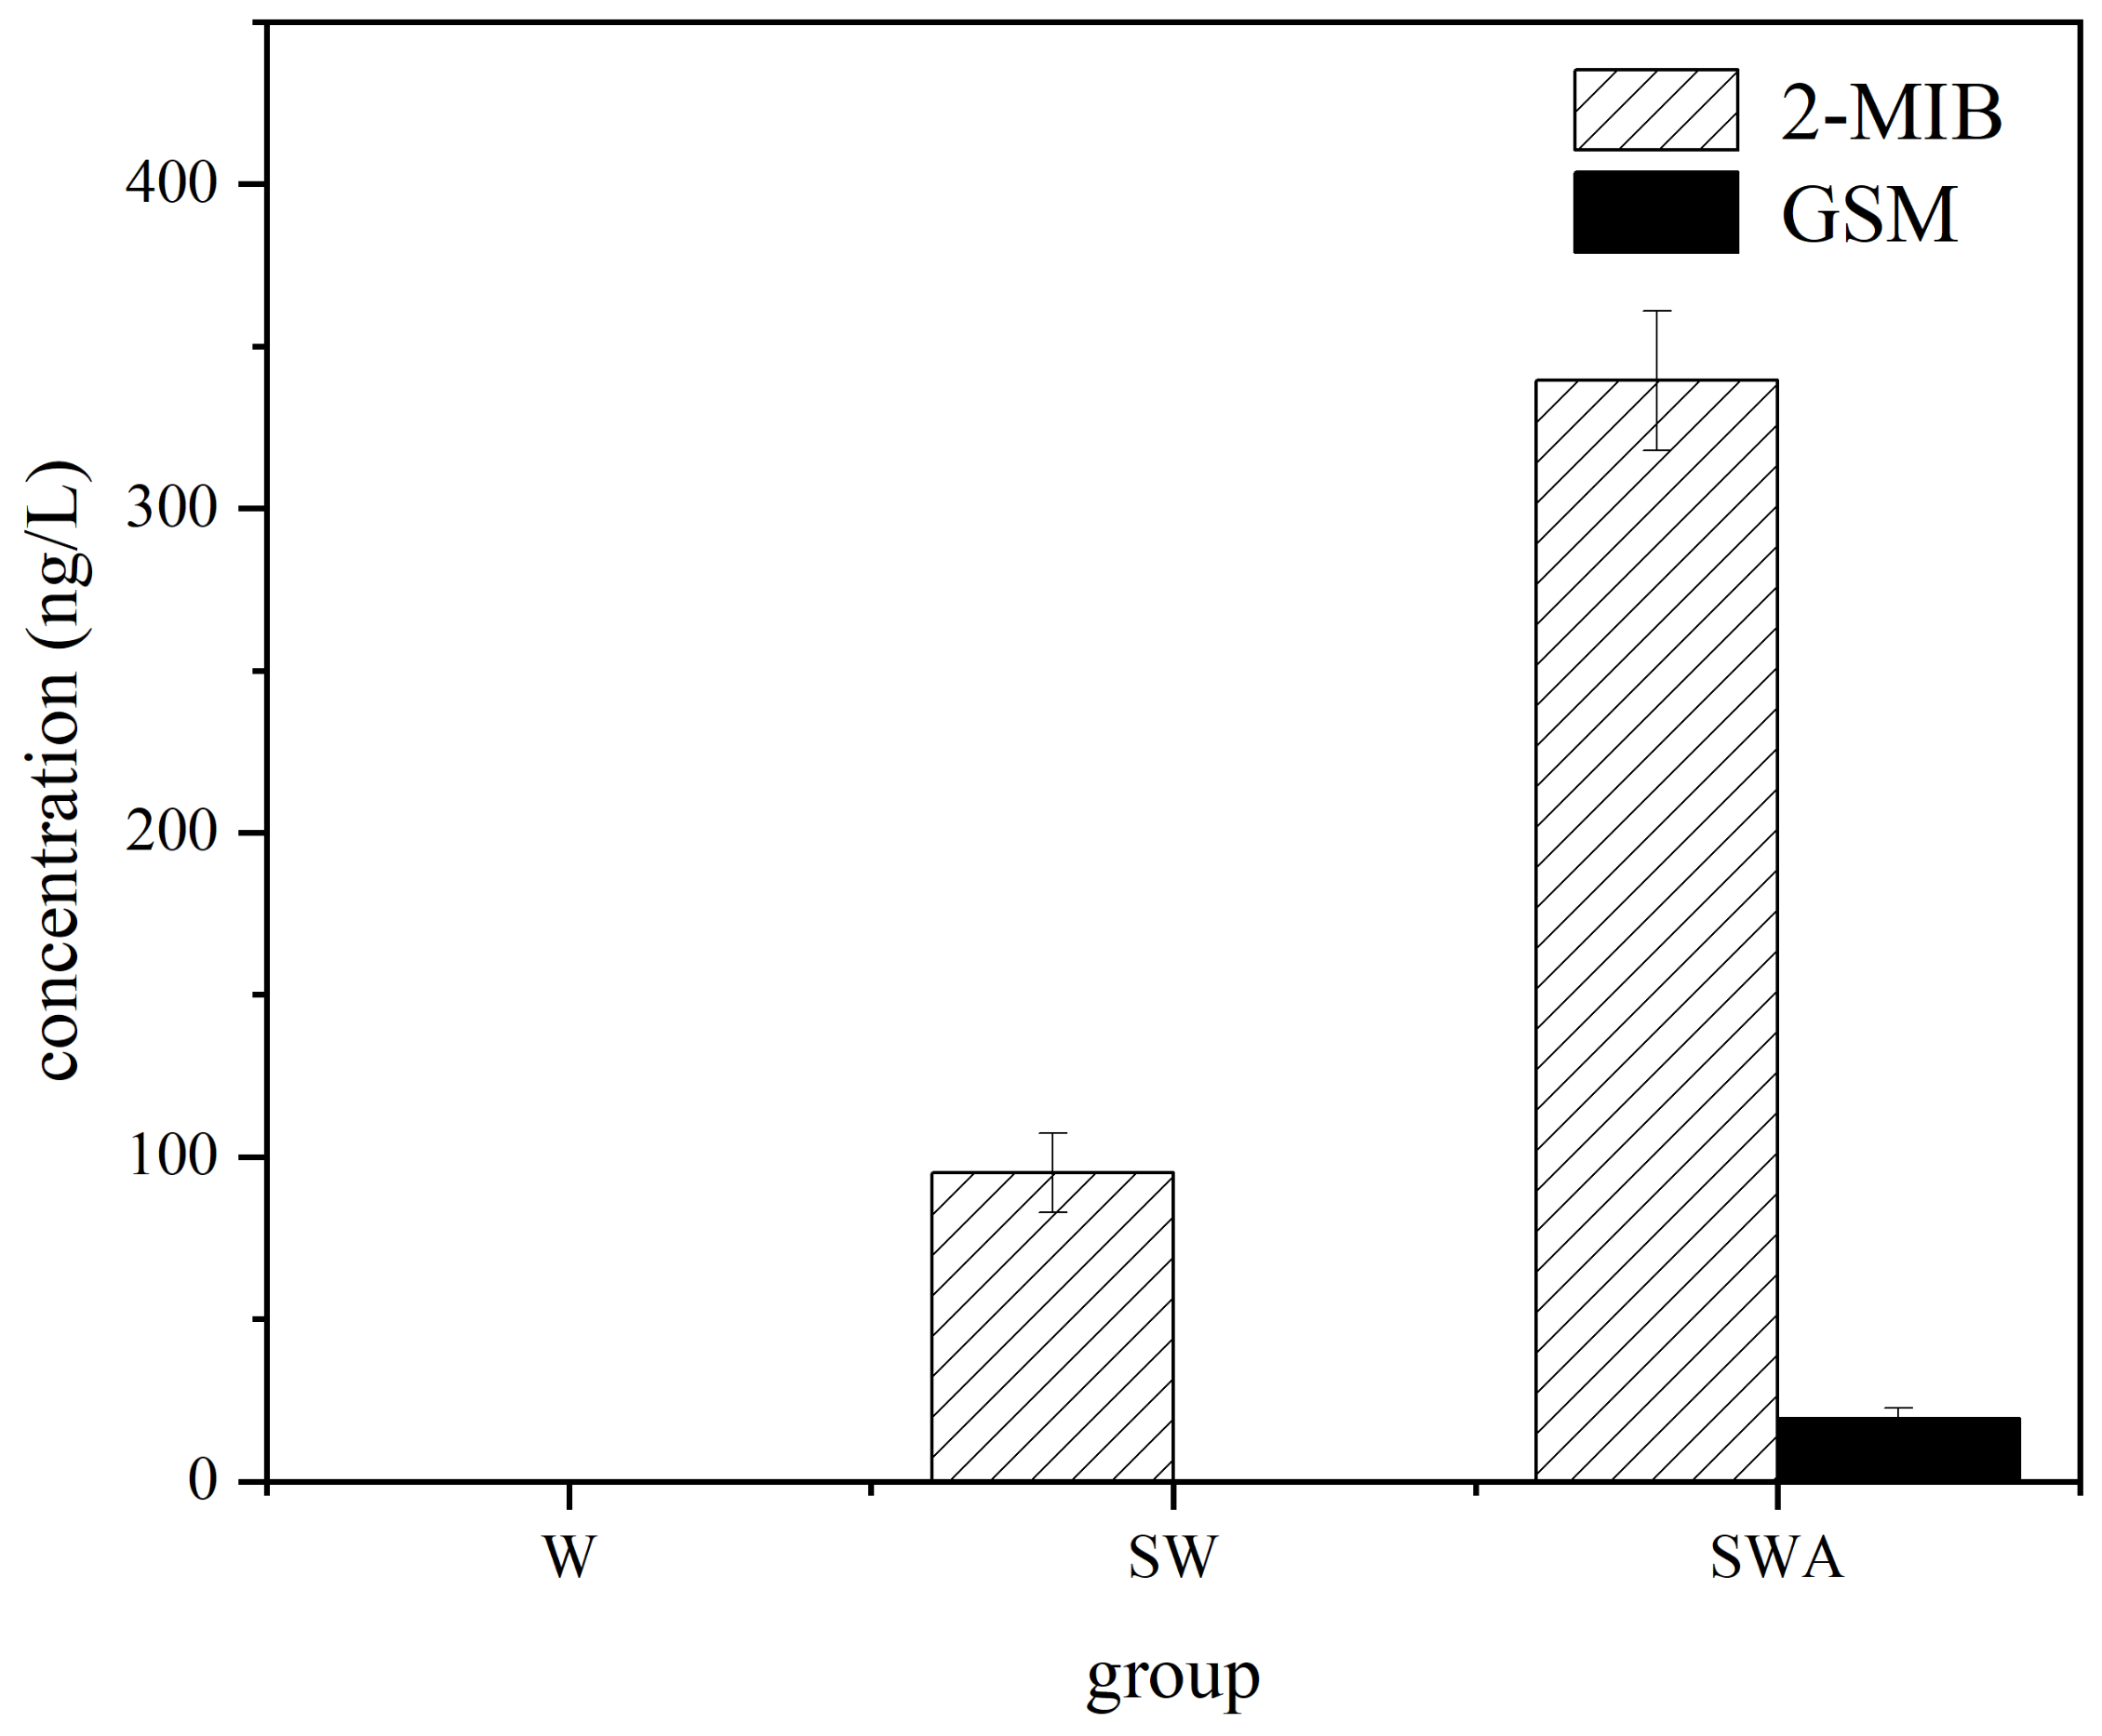
A strong smell is another distinct characteristic of black blooms [29]. Earthy mildew is the most common odor, including geosmin (GSM), and 2-methylisoborneol (2-MIB). MIB and GSM are the secondary metabolites produced by cyanobacteria, actinomycetes, fungi, and myxobacteria, which are the sources of most odors in water [30]. Algae in natural rivers also produce different products during their metabolism, not only odor compounds but also biological toxins, which affect the water quality of rivers [31]. In this study, the concentrations of GSM and 2-MIB under different conditions were monitored as shown in Figure 2. The levels of 2-MIB and GSM in the SWA group were significantly higher than that in the other groups (p < 0.01), reaching 339 and 19 ng/L, respectively. The concentration of 2-MIB in the SW group was only 95 ng/L and that of the W group was below the detection limit. Yu et al. [22] also found that the concentration of odorous compounds in all cyanobacteria groups exceeded that of the other groups, and the concentration of odorous compounds increased with increasing cyanobacterial content. In the study by Li et al. the levels of odor compounds in Taihu reached the highest in August with MIB reaching 146.6 ng/L and GSM reaching 9.7 ng/L [32]. Harris et al. found a negative correlation between odor compounds and DO, which is consistent with the low DO levels in our experiments [33].
3.2. Changes of the Chemical and Physical Parameters
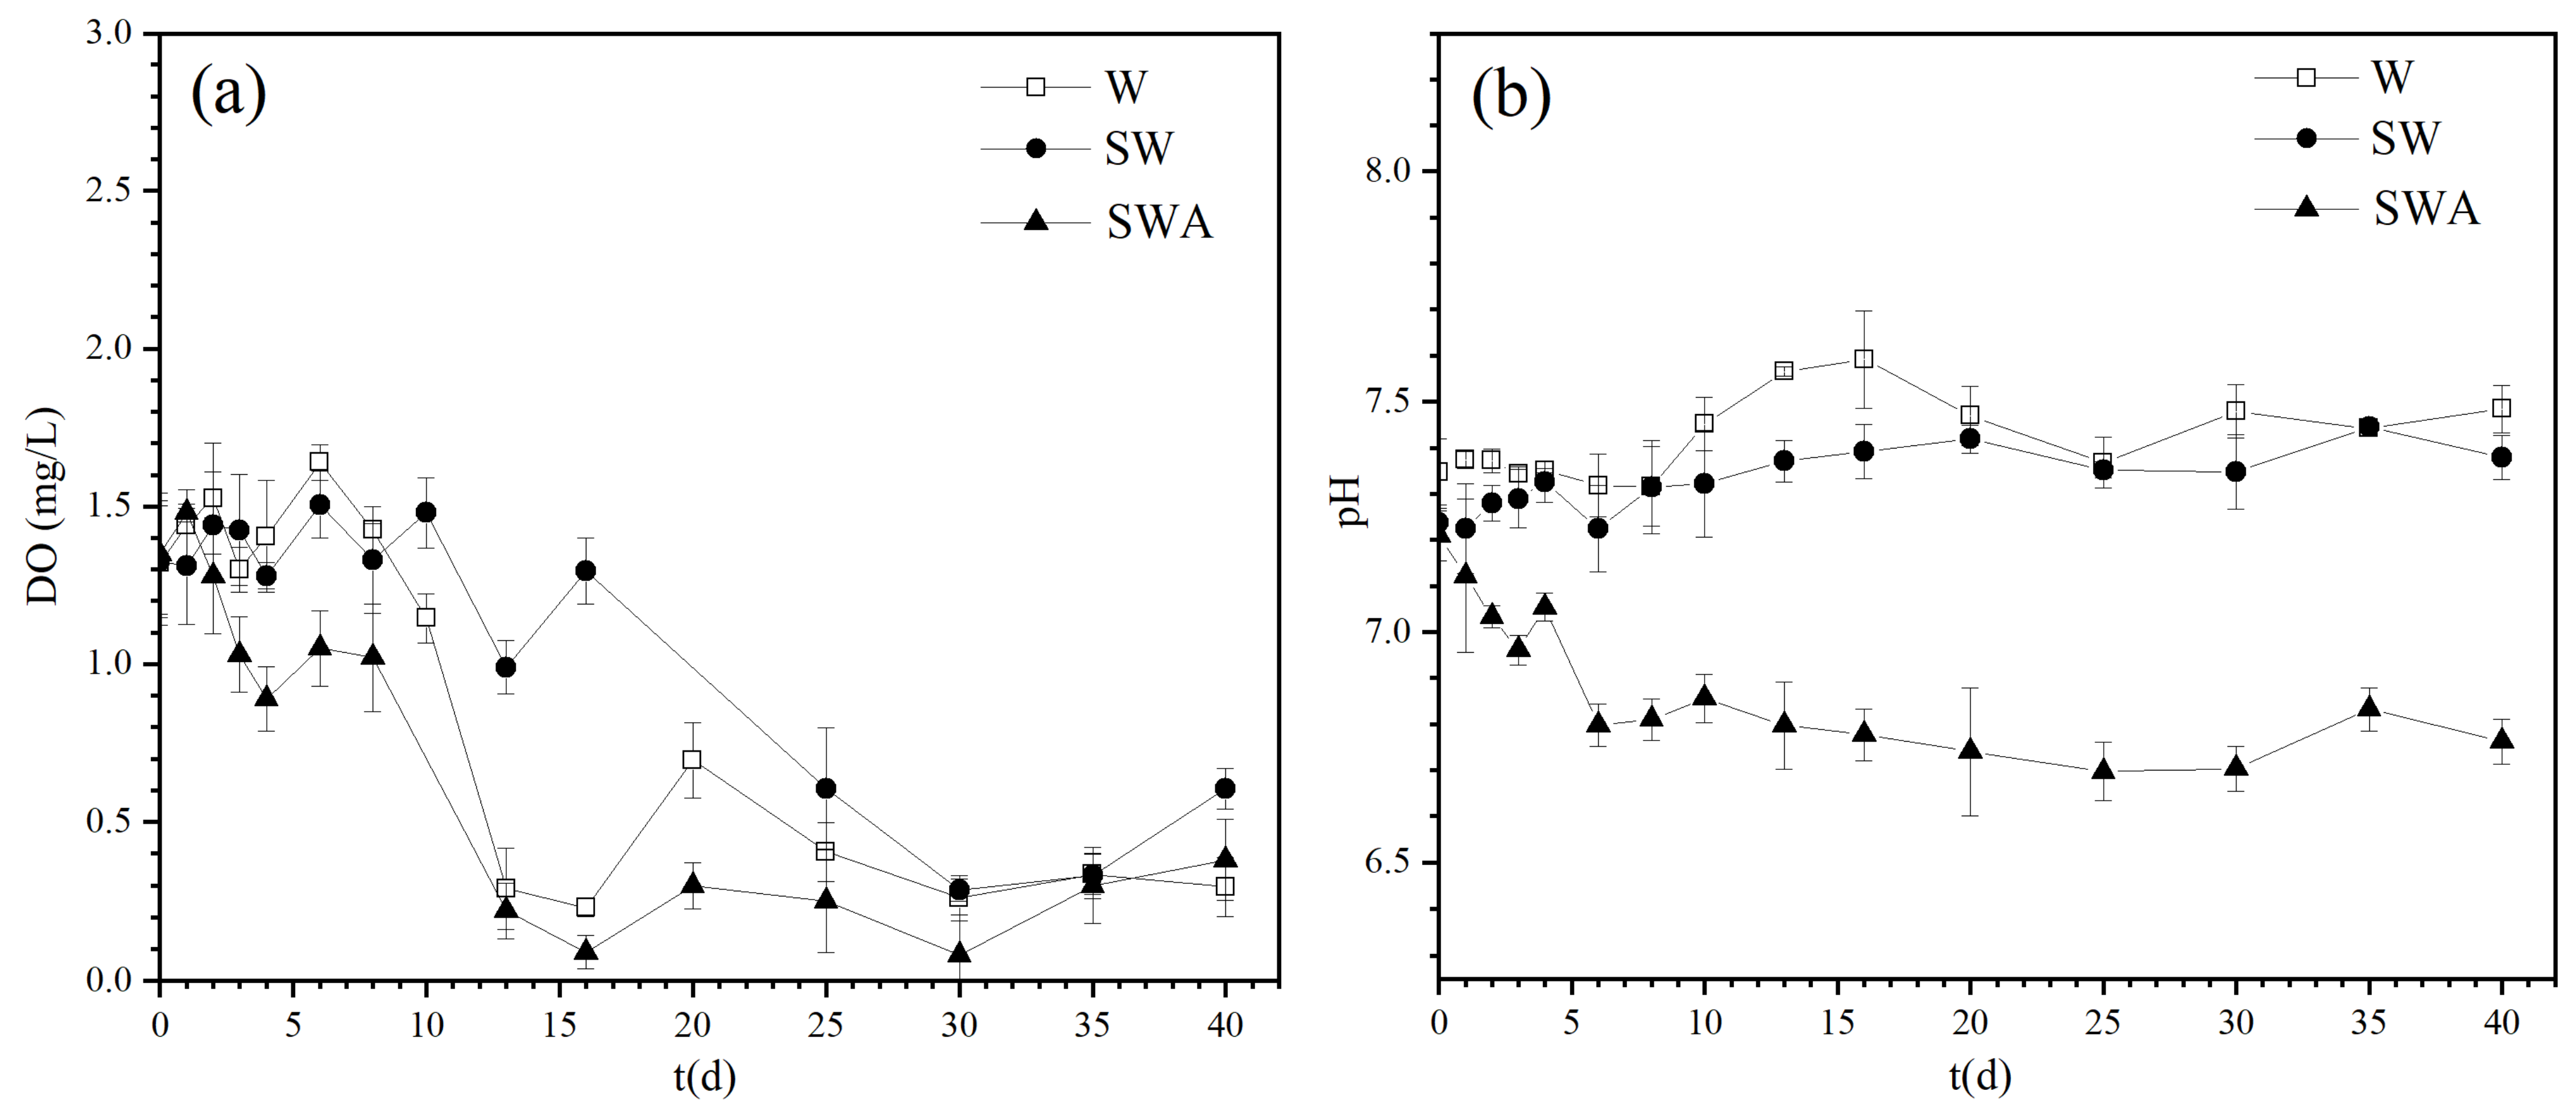
The changes of DO and pH values were monitored during the 40 days as shown in Figure 3. Figure 3a shows that the DO of the SWA group decreased greatly on the 8th day (p < 0.05) and reached below 0.5 mg/L after the 13th day. The DO value of the SW and W groups decreased and remained 0.5 ± 0.2 mg/L. It was hypoxic, but the overall DO content was slightly higher than that of the SWA group. This showed that the addition of Microcystis aeruginosa made the DO in the black blooms process extremely low and lasted for a long time. Cyanobacterial debris floats on the water surface, hindering the entry of oxygen in the air into the water body, while the degradation of organic matter in the water consumes a large amount of dissolved oxygen [34]. This low-oxygen or even anaerobic environment poses a serious threat to the growth of biological communities in waters and accelerates the death of aquatic organisms. After the dead organisms settle on the surface of the sediments, they increase the pollution of the sediments and water. This would promote the further development of black blooms and form a vicious cycle. It is also believed that waters have had low DO conditions for a long time and that the formation of anaerobic areas in adjacent waters is one of the important reasons for the occurrence of black blooms in lakes [35].
Figure 3b shows that the pH of the SWA group continued to decrease during the black blooms process and remained at approximately 6.7 from the 6th day until the end of the experiment. In contrast, the pH of the W and SW groups was maintained at 7.2–7.6. The results indicated that the addition of cyanobacteria reduced the pH values of the SWA group. Feng et al. observed that the pH value dropped from 7.28 to 6.83 in the black bloom group, while it increased to 7.5 in the control group over10 days [17]. Yu et al. [22] also found the pH value decreased to 6.3 with the addition of algae, but its pH value increased to about 7.7 on the 35th day. In contrast, the pH values in our study were constant and kept at about 6.7 during the 40-day experiment. A possible explanation may be that the in-situ cores were used in our experiment which can better simulate the process of black blooms without other disruption. A decrease in pH is only a characteristic of black blooms, not their root essence. The reason is possibly that the algal and other microbial metabolisms decompose the organic matter into pyruvate or lactate, lowering the pH of water [36].
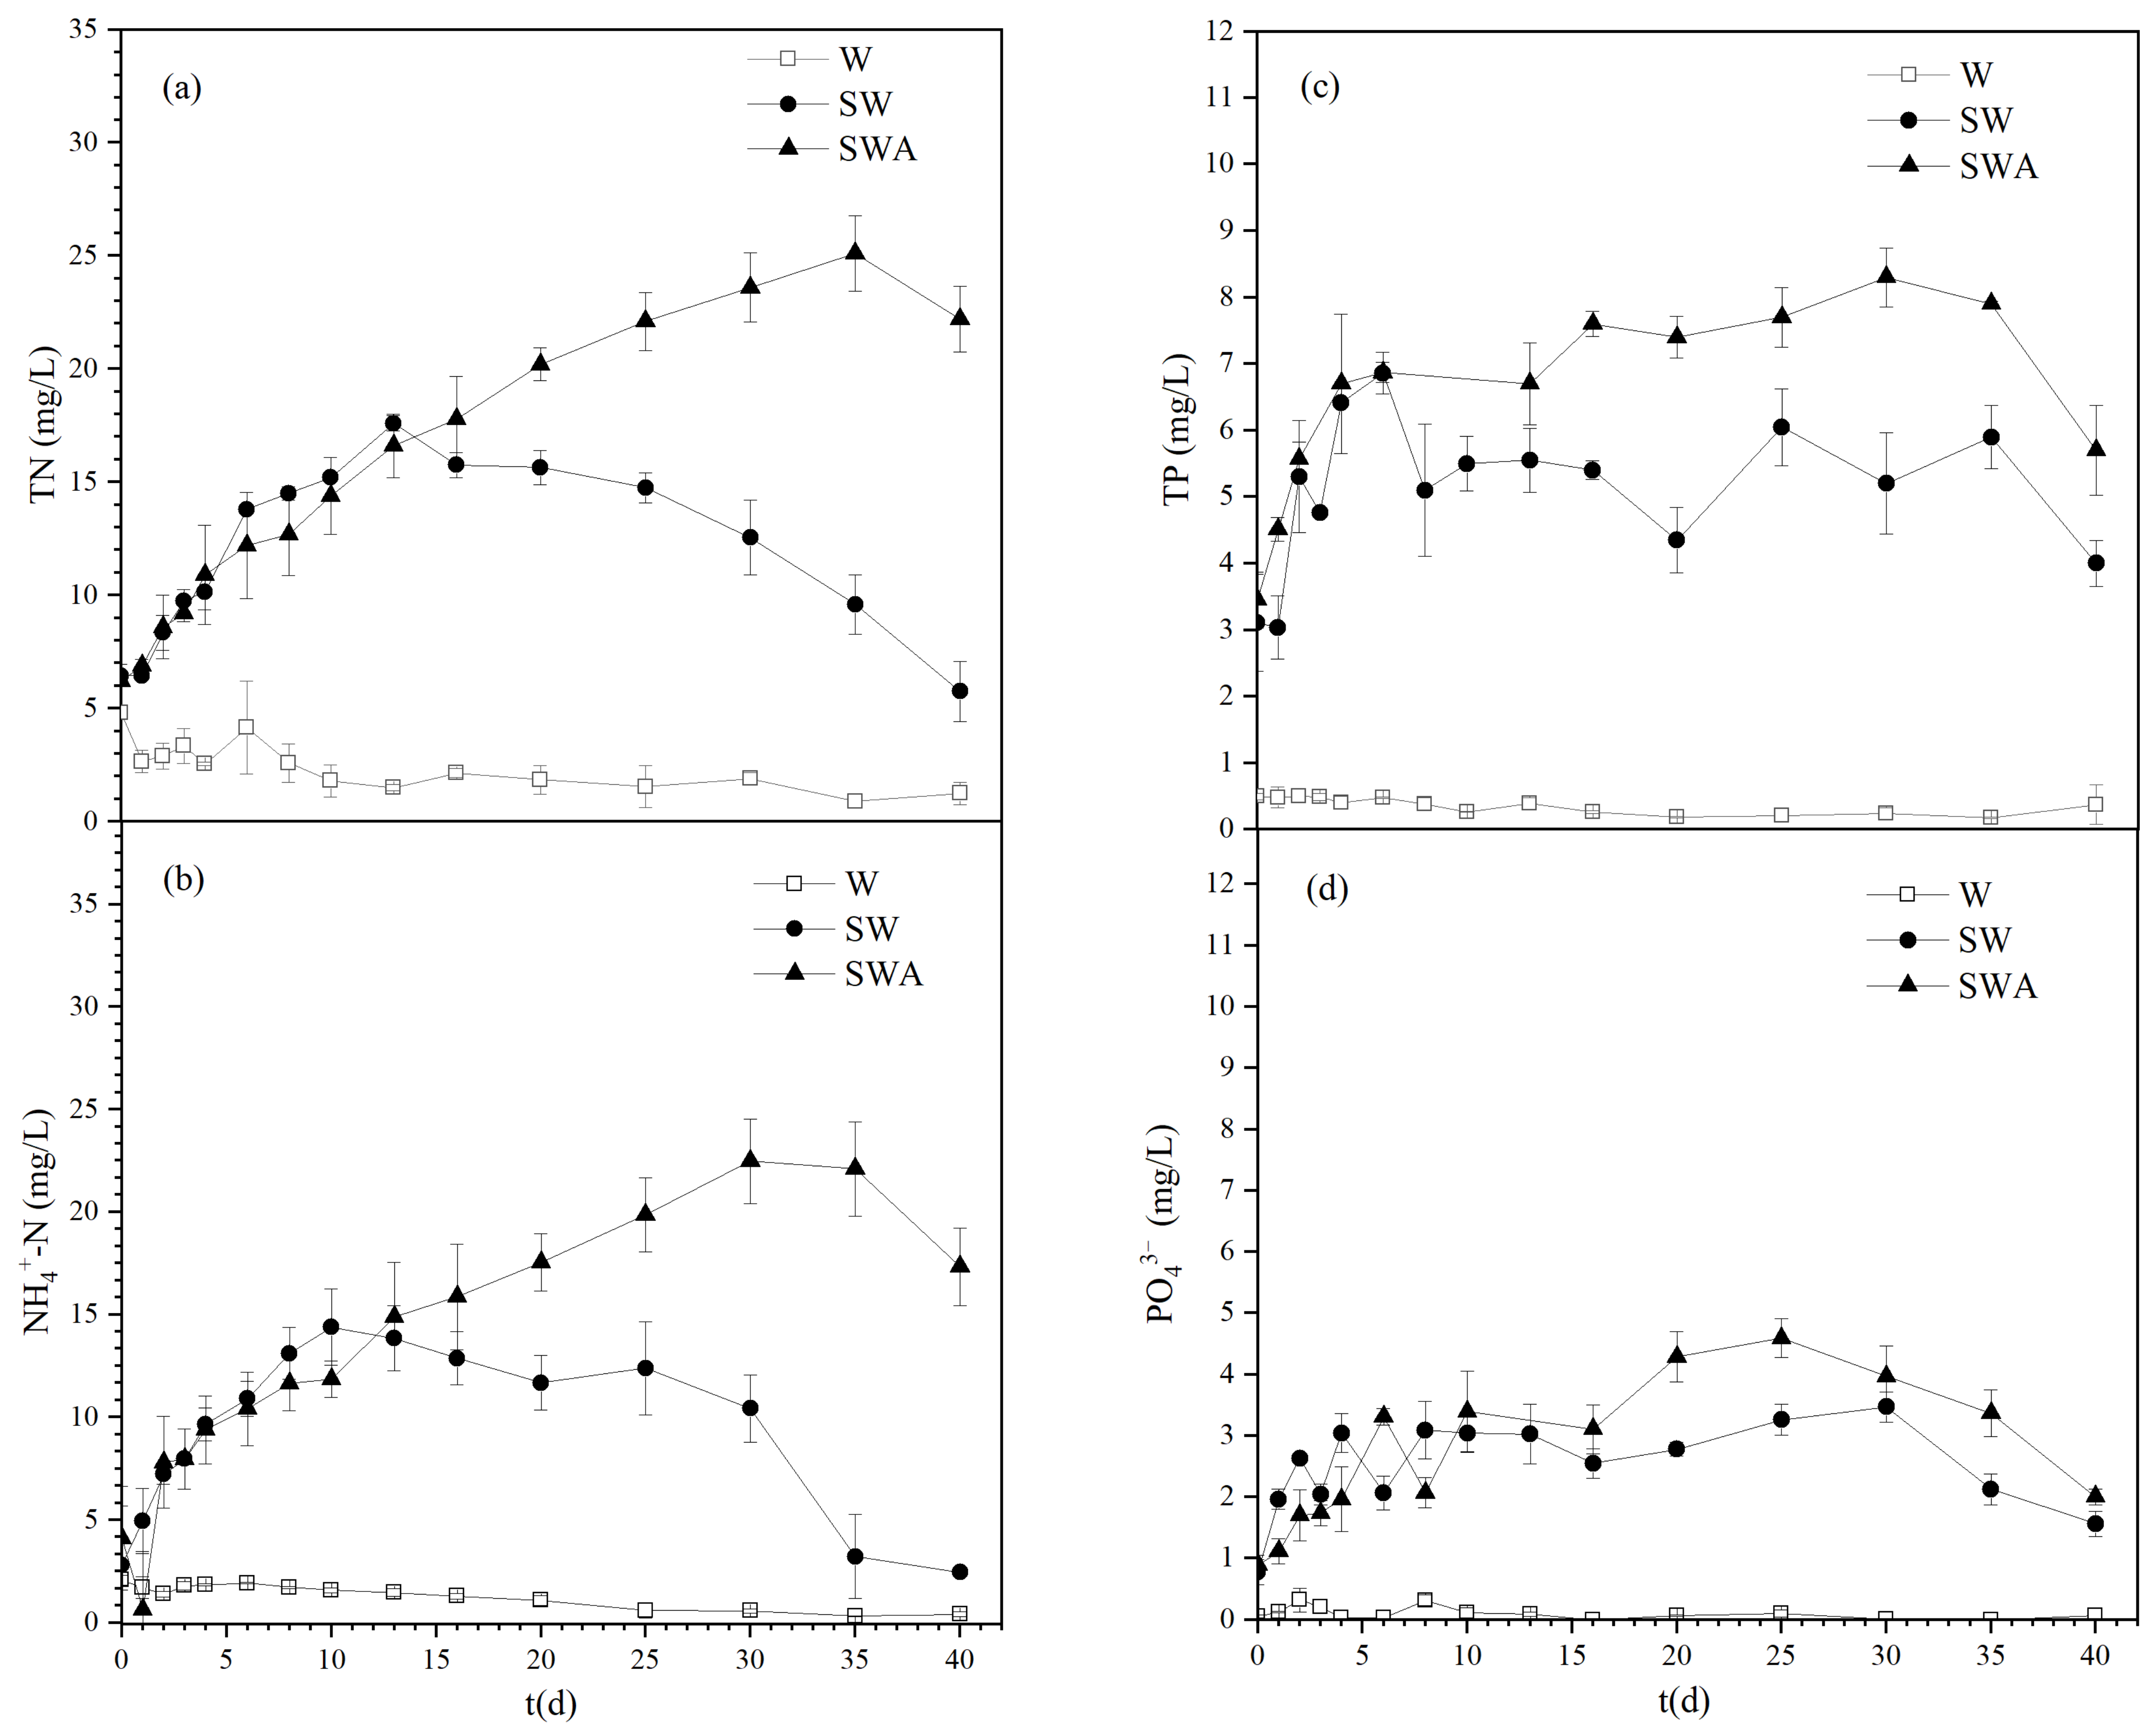
Figure 4 shows the changes of TN, NH4+-N, TP, and PO43− during the black blooms process. The changing trends in TN and NH4+-N concentrations in the different groups were similar, as shown in Figure 4a,b. The concentrations of TN and NH4+-N in the SWA group continued to increase, reaching a maximum of 25.1 and 22.47 mg/L, which was 4.05 and 5.5 times their initial concentration in the raw water, respectively, and then slightly decreased later. The concentrations of TN and NH4+-N in the SW group first increased and peaked on the 13th day and 10th day, respectively, then decreased quickly, which agreed with the discovery that the sediments were important for nutrient release [21]. However, their concentrations in the W group remained stable at a low level. These results suggest that the addition of algae promoted an increase in the concentrations of TN and NH4+-N in the water. Before the 13th day, the increasing concentrations of TN and NH4+-N in the SWA and SW group were possibly mainly due to the release of sediments’ nutrients, especially in the SW group, where it was obvious that the concentrations of both TN and NH4+-N decreased after the 13th day. Then, the decomposition of dead algae possibly released the nitrogen into water which made the nitrogen concentrations continue to increase in the SWA group. Meanwhile, the DO dropped rapidly (Figure 3), which led to an anoxic state in the water. The denitrification process must be carried out under this anoxic water [37]. Possibly, the decrease in nitrogen could be attributed to the denitrification at the end of the experiments.
It is interesting that nitrogen is an important key factor for the outbreak of black blooms. Figure 4a,b showed that the peak value of nitrogen occurred on 10th day and 13th day in the SWA and SW groups respectively, almost the same time as the appearance of black blooms in Table 1. It seems that the increasing nitrogen concentrations directly result in the outbreak of black blooms. It is suggested that a higher concentration of nitrogen is necessary for the microorganisms of black blooms. In the SW group, the nitrogen was assimilated by the microorganisms of the black blooms after the 13th day, which led to a decrease in nitrogen contents. However, in the SWA group, the nitrogen concentrations, possibly due to the decomposition of dead algae, kept increasing until the end of the black blooms. The higher concentration of nitrogen resulted in serious black blooms. Su et al. also found that total nitrogen was the second most important driver after water temperature during blooms in the Three Gorges Reservoir, including ammonia and other forms of nitrogen [38].
Figure 4c,d showed the changes of TP and PO43− in the different groups. The changing trends of TP and PO43− in water were also similar. The concentrations of TP and PO43− in the SWA group have been rising, reaching the highest levels at 8.3 mg/L and 4.6 mg/L, respectively. The TP and PO43− concentrations in the SW group first increased and then decreased, and then the PO43− concentration dropped to very low levels in the later stage. The concentrations of TP and PO43− in the W group remained pretty low during the experiment. These results agreed with those of many studies on the decay process of cyanobacteria [22,39]. Some studies reported that the rapid decay of dense cyanobacterial biomass can lead to the release of high levels of phosphorus [39]. Yu et al. [22] found that with an increase in cyanobacterial biomass, higher concentrations of nutrients were observed, and the severity of black blooms may increase.
The above studies all indicate that black blooms are always accompanied by low levels of DO, low pH, and high concentrations of nutrients (such as NH4+-N and TP). The dense cyanobacteria load is crucial for the occurrence of black blooms, but the time of the occurrence of black blooms may be related to unidentified factors such as bacterial community composition and abundance, which need further exploration [17,40].
3.3. Characteristics of the Microbial Communities in the Sediments and Black Floats
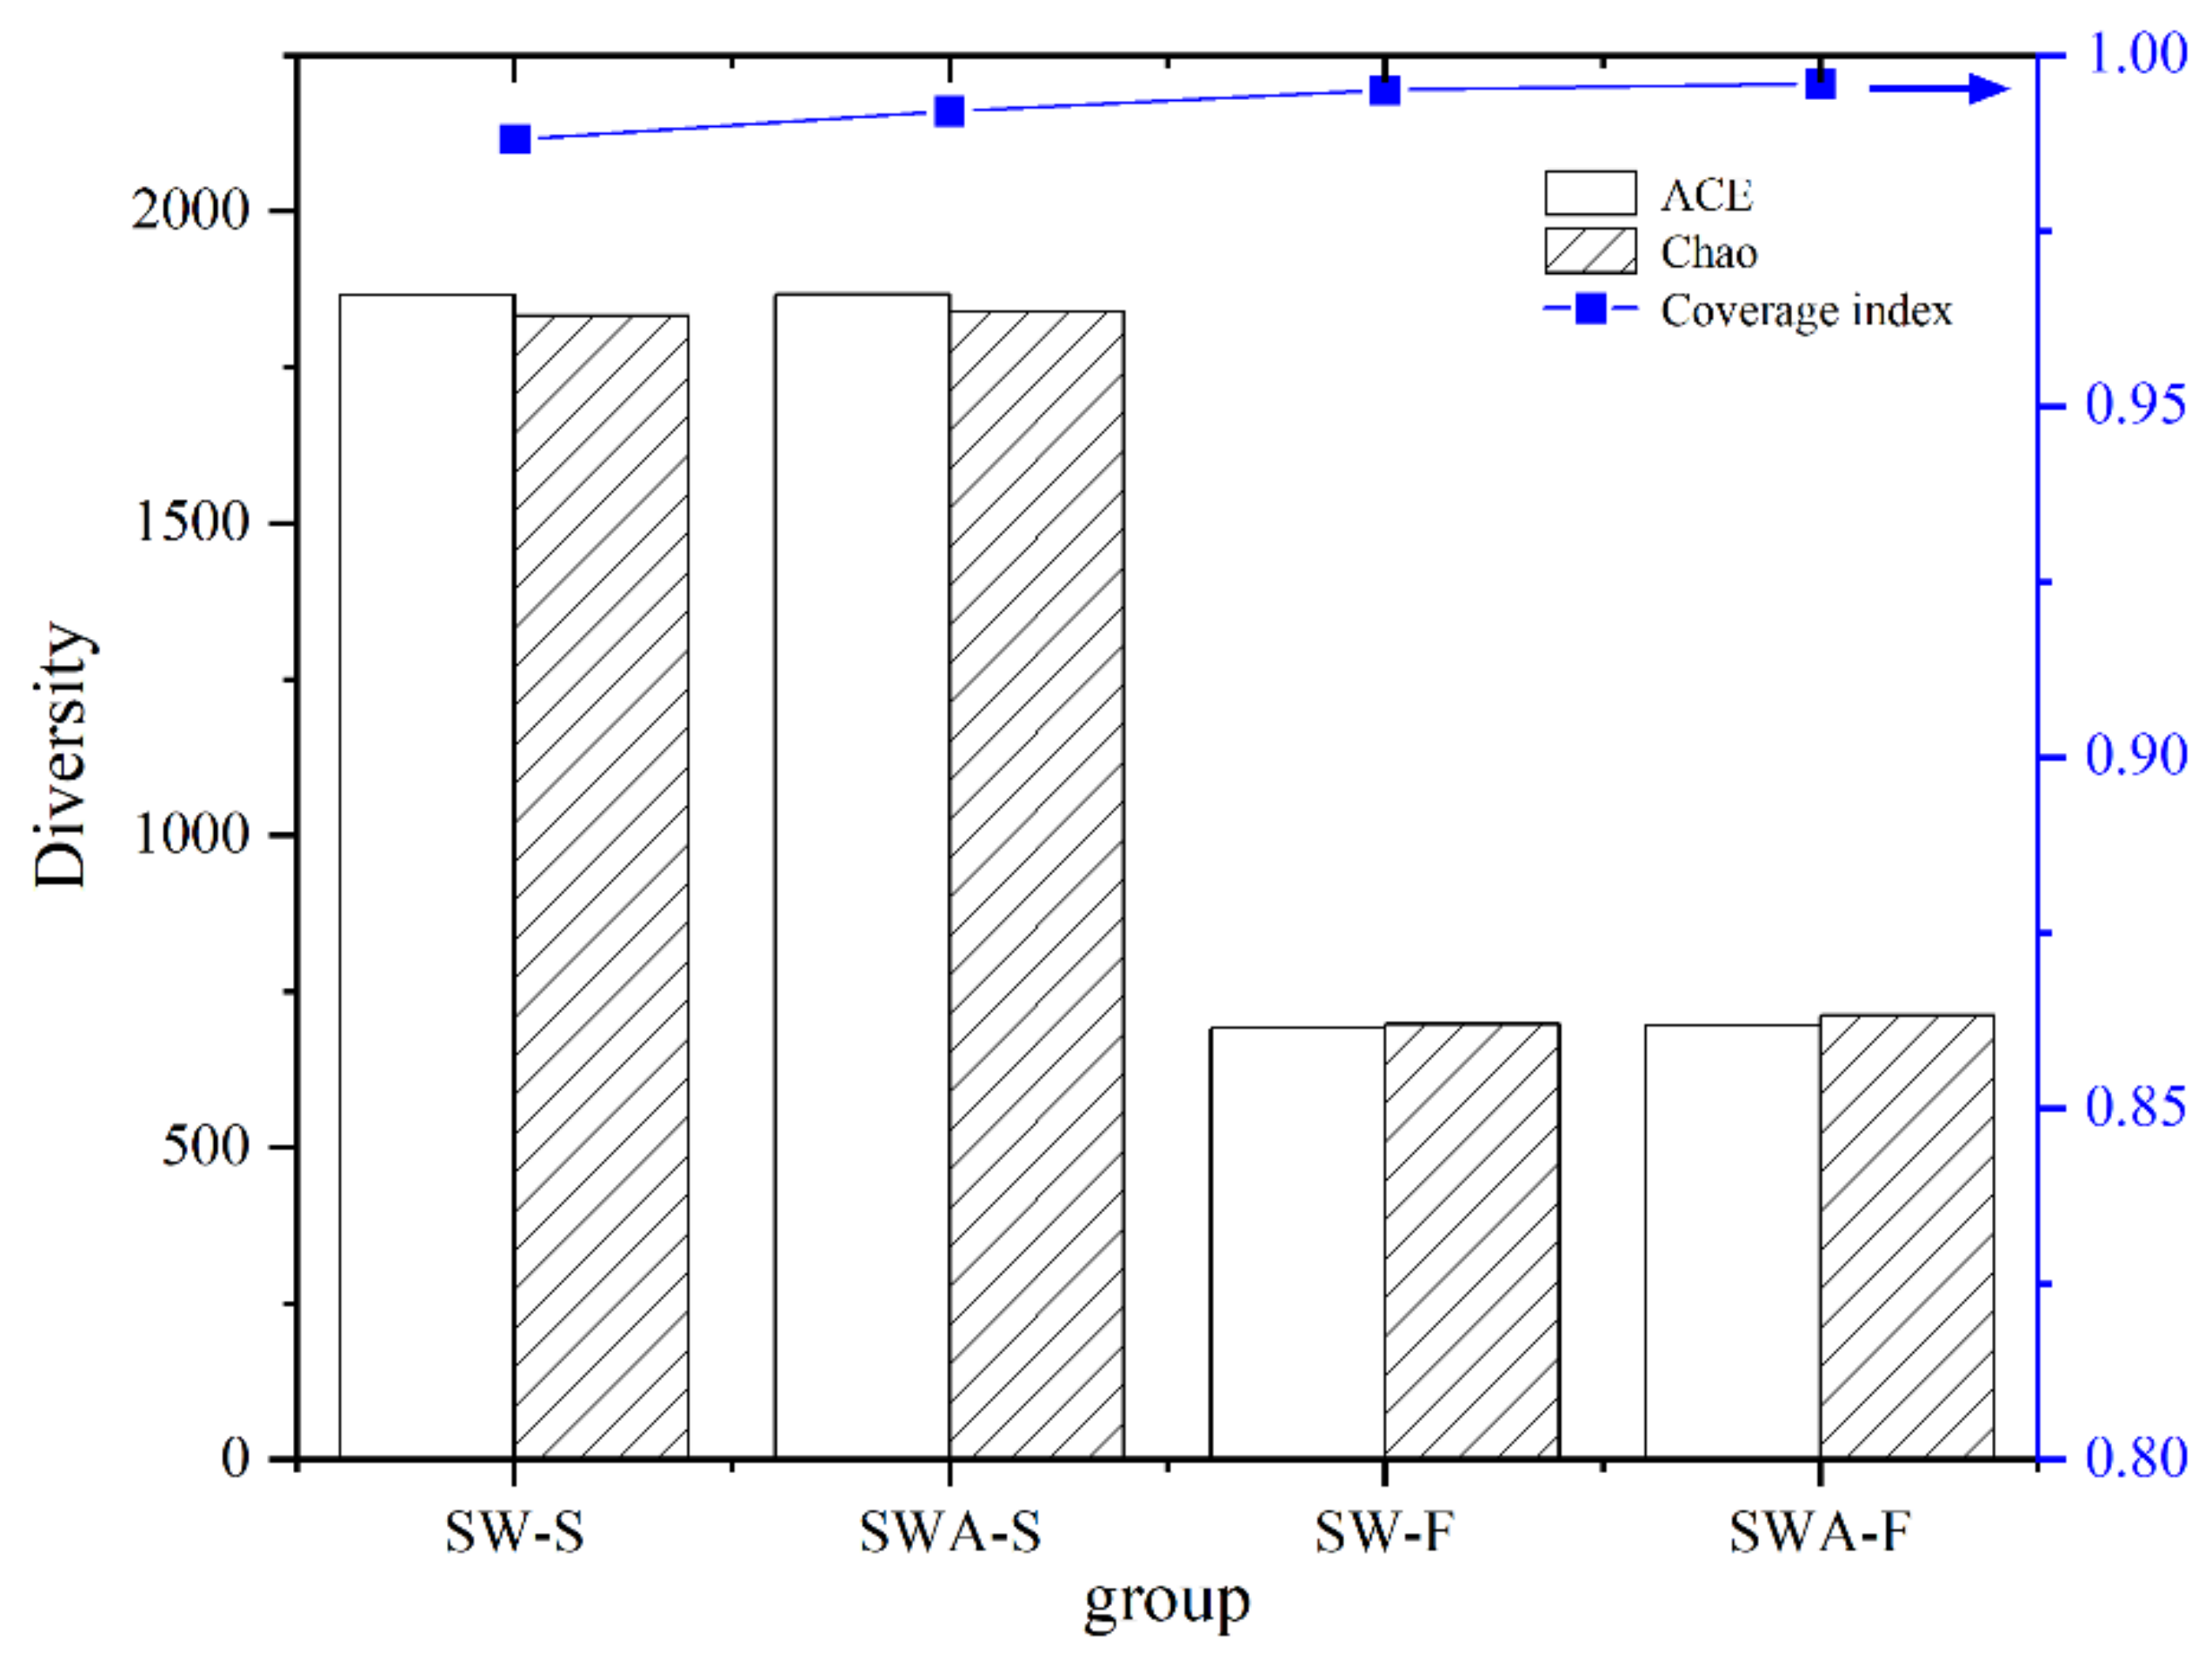
3.3.1. Analysis of Microbial Diversity in the Sediments and Black Floats
A high-throughput 16S rRNA gene sequencing technology was used to analyze the collected sediments and floats, where 285,315 valid sequences were obtained. The coverage index of the six samples was above 0.988 (Figure 5), indicating that the sequencing results are representative and can accurately reflect the conditions of organisms in the sediments and black floats. The ACE and Chao indices reflect the richness, which indicates the estimated number of actual species [41]. As shown in Figure 5, the ACE index of the sediments in the sediments-water-algae group (SWA-S) was not notably different from that of the sediments in the sediments-water group (SW-S), which demonstrated that the richness of the microbial communities in the sediments was similar. The ACE indices of the black floats were significantly lower than those of the sediments. Similar differences were observed in the Chao indices of different groups of microbial communities. The addition of Microcystis aeruginosa had little impact on the abundance and diversity of bacteria. The microbial abundance in the sediments was significantly higher than that of the black floats on the water surface, which indicated that the sediments harbor more microorganisms with high diversity.
3.3.2. Dominant Microbial Communities in the Sediments and Black Floats
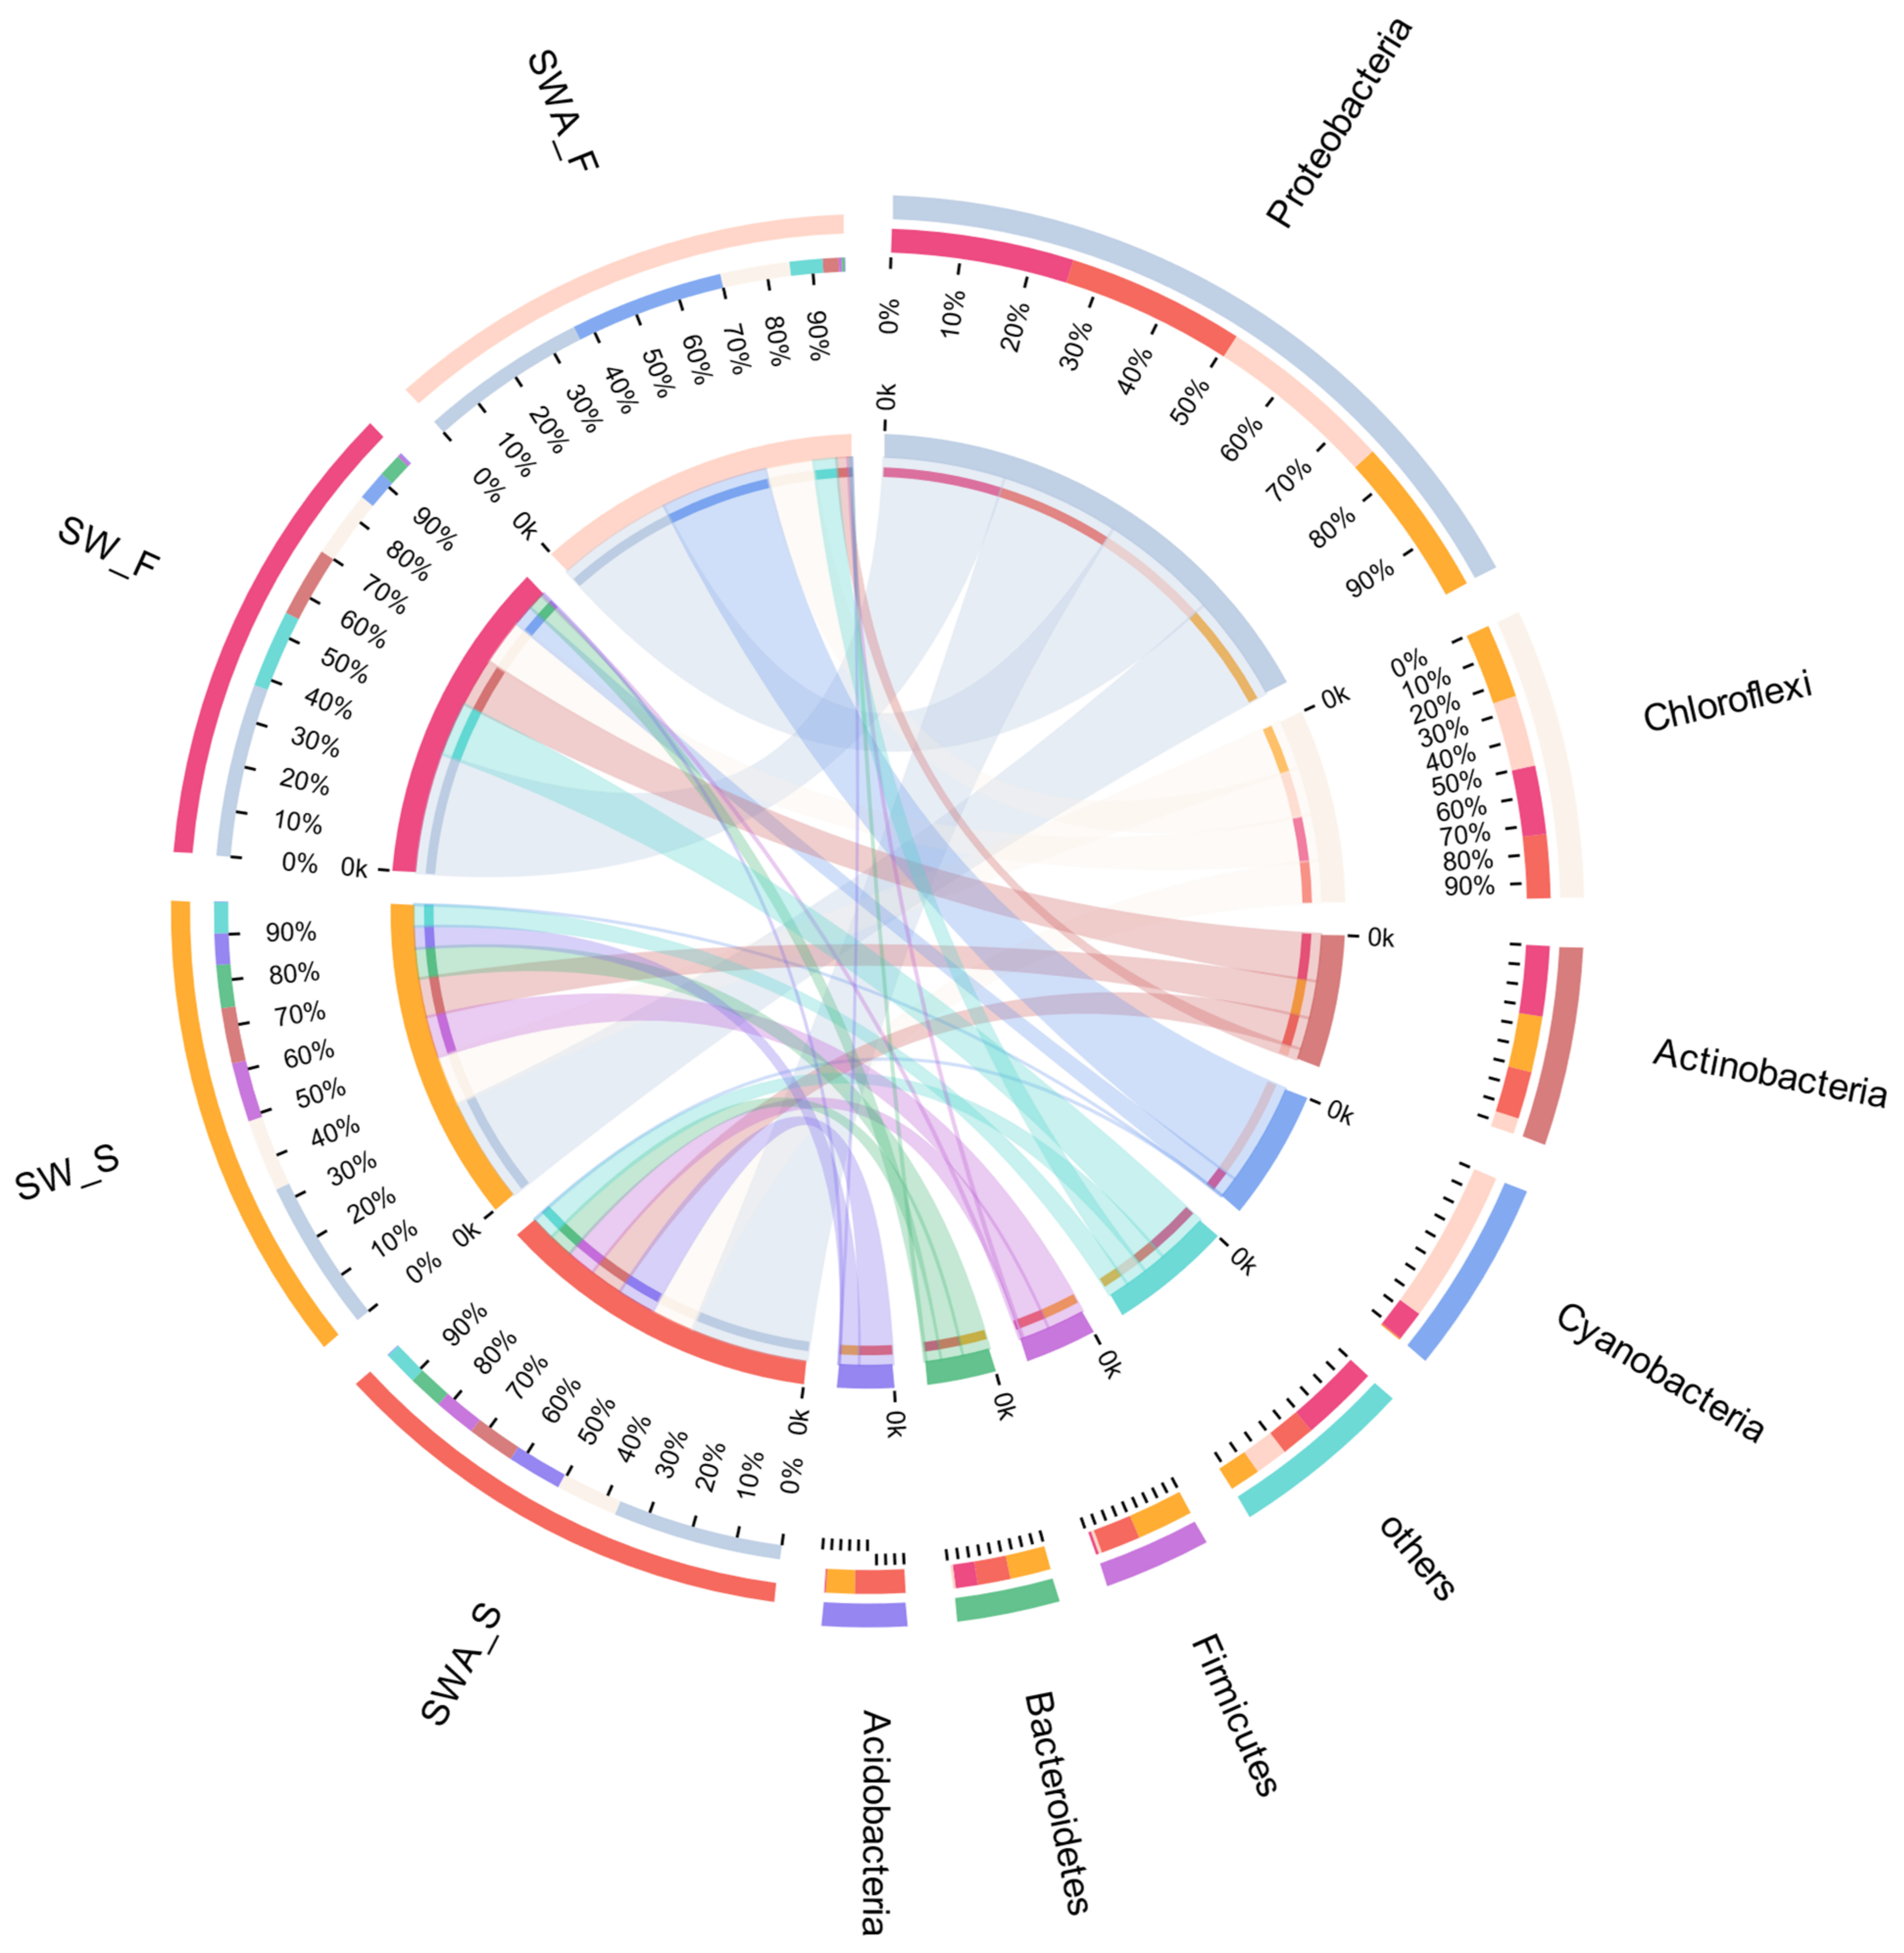
The sequences obtained were further analyzed for species annotation. Taxonomic information statistics at the phylum level and the community composition of each sample were obtained. Figure 6 shows the dominant microbial species in the sediments and black floats.
As shown in Figure 6, Proteobacteria accounted for a relatively large proportion (38%), followed by Chloroflexi (14%), and Acidobacteria (12%) in the SWA-S. In the SW-S, Proteobacteria accounted for 34%, Chloroflexi accounted for 16%, and Firmicutes accounted for 13%. These results demonstrated that the communities have little difference in the sediments between the two groups. The total proportion of Proteobacteria and Chloroflexi exceeded 50%. It is interesting that Acidobacteria was in the SWA-S, but not Firmicutes. It is also apparent that cyanobacteria were not the dominant species in the SWA-S, which indicated that the added Microcystis aeruginosa did not enter the sediments in large quantities.
The results showed that Proteobacteria and Chloroflexi were evenly distributed in the sediments. It has been reported that Proteobacteria are often the numerically dominant group in freshwater lakes and play an important role in the degradation and release of nutrients [42,43,44]. Proteobacteria were the most abundant in Lake Taihu from the sediments of in-situ enclosures, with relative abundances ranging from 32.21% to 47.21% [12], supported the content of Proteobacteria in SW-S and SWA-S. Xie et al. [13] also revealed that Proteobacteria were most abundant during the black blooms. These results suggested that Proteobacteria have absolute dominance in sediments, even during black blooms. Chloroflexi is mainly involved in biological nutrient removal processes [45]. However, Chloroflexi is a facultative anaerobic bacterium that cannot produce oxygen during photosynthesis [46]. Its appearance meant that at the end of the experiment, both the sediment and the black float were in an anoxic state, which was consistent with the previous trend in DO levels.
In lightly eutrophic lakes, Firmicutes dominate in certain sediment samples and can produce spores that resist dehydration and extreme environmental conditions [47]. Li et al. [48] found that Clostridium (Firmicutes) is the main dominant population in hypoxic areas in Lake Taihu caused by Microcystis blooms [40]. Firmicutes were the main bacterial species involved in Fe (III) reduction [49,50]. This indicates that the iron reduction reaction mainly occurs in the sediments. Acidobacteria are ubiquitous and abundant members of the bacterial communities in freshwater lake sediments. It has been shown that the abundance of Acidobacteria is significantly correlated with pH. Acidobacteria are more dominant in low pH environments, and there is a significant decrease in Acidobacteria at pH higher than 5.5 [51]. This is consistent with the low pH values in the SWA group (Figure 3). It was found that the pH of the SWA group continued to decrease during the black blooms process, and was about 6.7 on the 40th d. However, the pH of the SW group did not change greatly, and was maintained at 7.3–7.6. Therefore, Acidobacteria accounted for a bit more in the SWA group.
As shown in Figure 6, for the black floats in the sediments-water-algae group (SWA-F), Proteobacteria accounted for 38%, followed by Cyanobacteria (35%), and Chloroflexi (16%). For the black floats in the sediments-water group (SW-F), Proteobacteria accounted for a relatively large proportion (39%), followed by Actinobacteria (16%), and Chloroflexi (15%). The dominant species in the SWA-F (with Microcystis aeruginosa) were significantly different. The added Microcystis aeruginosa entered the black floats, the proportion of which was significantly larger than that of the SW-F group, but not in the sediments, indicating that the added Microcystis aeruginosa did not enter the sediments, but were present in the black floats. Wang et al. [52] found that gas vesicles full of gas provide buoyancy for cyanobacteria, allowing the cyanobacteria to stay on the water surface to obtain sufficient light. At the same time, buoyancy also provides ecological advantages for cyanobacteria, making them stand out from the competition with other phytoplankton [53]. This study considered the lighting conditions in the experiment, which may be the reason that cyanobacteria mainly exist in black floats.
Compared with SW-F, the abundance of Actinobacteria was dramatically greater than that of the SWA-F. It was speculated that the addition of algae may affect the status of Actinobacteria. Actinobacteria have been found in various aquatic habitats and are considered ubiquitous members of freshwater ecosystems, especially in the lake epilimnion [54,55]. Actinobacteria are more competitive when using carbon sources, especially dissolved organic carbon, which is secreted by the phytoplankton. Studies have reported that Actinobacteria are involved in the degradation of complex organic matter [56]. Feng et al. [57] found that the Actinobacteria were significantly reduced in the black blooming area, which was reduced by nearly 20 times compared with the area where there was no black bloom. They believed that the possible reason was that most Actinobacteria were aerobic and the optimal growth pH of Actinobacteria is generally slightly alkaline [57]. With the increase of black blooms, the DO in the water was extremely low and the pH value was also decreasing, which may be the reason for the decrease in Actinobacteria in the SWA group. Notably, the cyanobacteria added affected the abundance of Actinobacteria. There is a remarkable negative correlation between the Actinobacteria and the cyanobacteria population [58]. In a study by Parulekar et al. [59], the abundance of Actinobacteria decreased significantly from June to July, while the abundance of cyanobacteria increased. At the same time, Actinobacteria in black floats may be suppressed to sediments (SWA-S containing 11% Actinobacteria), which led to the fact that the abundance of Actinobacteria was less in the black floats of the SWA group.
It is interesting that Proteobacteria were dominant species in both sediments and black floats. Some studies reported that β-Proteobacteria are mostly facultative heterotrophic bacteria that play a vital role in nitrate reduction [60,61]. In addition, other studies have also found that bacteria in the denitrification system are mostly related to β-Proteobacteria [62]. Li et al. [40] found that there is a large amount of Rhizobiales (α-Proteobacteria) during the decomposition of Microcystis blooms. The Proteobacteria are dominant species, which indicates that nitrogen transformation is the main process in both sediments and black floats.
4. Conclusions
Through the 40-day black bloom simulation of nearly in-situ cores, the effects of algae on the formation of black blooms and changes in the bacterial community were investigated. The results showed that the severity of black blooms was significantly affected by the addition of cyanobacteria, but the sediments were essential for the formation of black blooms. The biological abundances of sediments and black floats were different, and the bacterial abundances in sediments were significantly higher than those of black floats. The addition of algae did not change the dominant community in the sediments, and the dominant species in both sediments were Proteobacteria and Chloroflexi. However, the abundance of Cyanobacteria in the black floats was significantly increased after adding Microcystis aeruginosa, while Actinobacteria was inhibited. These findings may help us further understand the population compositions and ecological roles of bacterial communities in the process of black blooms.
Supplementary Materials
The following supporting information can be downloaded at: https://www.mdpi.com/article/10.3390/w14152348/s1, Figure S1: Variation in blackness of the different columns during black blooms simulation. (Left to right: W, water; SW, sediments-water; SWA, sediments-water-algae).
Author Contributions
T.T.: investigation, data curation, formal analysis, visualization, writing—original draft, project administration, writing—review and editing. Y.M.: investigation, formal analysis. W.S.: investigation. Z.L.: investigation. R.D.: funding acquisition, writing—review and editing, conceptualization. J.Y.: methodology, supervision, resources. All authors have read and agreed to the published version of the manuscript.
Funding
This research was supported by the National Natural Science Foundation of China (No. 51678159).
Institutional Review Board Statement
Not applicable.
Informed Consent Statement
Not applicable.
Data Availability Statement
Not applicable.
Acknowledgments
The authors are very grateful for the guidance of the teachers and the help of the students in the research group.
Conflicts of Interest
The authors declare no conflict of interest.
References
- Yang, M.; Yu, J.; Li, Z.; Guo, Z.; Lin, T.F. Taihu Lake Not to Blame for Wuxi’s Woes. Science 2008, 319, 158. [Google Scholar] [CrossRef] [PubMed]
- Lu, G.; Ma, Q. Monitoring and analysis on “Black Water Aggregation” in Lake Taihu, 2009. J. Lake Sci. 2010, 22, 481–487. [Google Scholar] [CrossRef]
- Sugiura, N.; Nakano, K. Causative microorganisms for musty odor occurrence in the eutrophic Lake Kasumigaura. Hydrobiologia 2000, 434, 145–150. [Google Scholar] [CrossRef]
- Duval, B.; Ludlam, S.D. The Black Water Chemocline of Meromictic Lower Mystic Lake, Massachusetts, U.S.A. Int. Rev. Hydrobiol. 2001, 86, 165–181. [Google Scholar] [CrossRef]
- Pucciarelli, S.; Buonanno, F.; Pellegrini, G.; Pozzi, S.; Ballarini, P.; Miceli, C. Biomonitoring of Lake Garda: Identification of ciliate species and symbiotic algae responsible for the “black-spot” bloom during the summer of 2004. Environ. Res. 2008, 107, 194–200. [Google Scholar] [CrossRef] [PubMed]
- Zhang, D.; Yang, H.; Lan, S.; Wang, C.; Xie, Y. Evolution of urban black and odorous water: The characteristics of microbial community and driving-factors. J. Environ. Sci. 2022, 112, 94–105. [Google Scholar] [CrossRef]
- Shen, Q.; Liu, C.; Zhou, Q.; Shang, J.; Zhang, L.; Fan, C. Effects of physical and chemical characteristics of surface sediments in the formation of shallow lake algae-induced black bloom. J. Environ. Sci. 2013, 25, 2353–2360. [Google Scholar] [CrossRef]
- Lu, G.; Ma, Q. Analysis on the causes of forming black water cluster in Taihu Lake. Adv. Water Sci. 2009, 20, 438–442. [Google Scholar]
- Liu, C.; Shen, Q.; Zhou, Q.; Fan, C.; Shao, S. Precontrol of algae-induced black blooms through sediment dredging at appropriate depth in a typical eutrophic shallow lake. Ecol. Eng. 2015, 77, 139–145. [Google Scholar] [CrossRef]
- Shen, Q.; Fan, C.; Liu, C.; Chen, C. The Limiting Factor to the Outbreak of Lake Black Bloom: Roles of Ferrous Iron and Sulfide Ions. Clean-Soil Air Water 2018, 46, 1800305. [Google Scholar] [CrossRef]
- Zhou, C.; Miao, T.; Jiang, L.; Zhang, H.; Zhang, X. Conditions that promote the formation of black bloom in aquatic microcosms and its effects on sediment bacteria related to iron and sulfur cycling. Sci. Total Environ. 2020, 751, 141869. [Google Scholar] [CrossRef] [PubMed]
- Chen, J.; Xie, P.; Yu, D.; Xie, L. Dynamic Change of Sedimental Microbial Community During Black Bloom-an In Situ Enclosure Simulation Study. Microb. Ecol. 2021, 81, 304–313. [Google Scholar] [CrossRef] [PubMed]
- Xie, L.; Yu, D.; Zeng, C.; Shen, H. The response of bacterial community composition to the decomposition of Microcystis blooms. Lake Sci. 2016, 28, 22–30. [Google Scholar] [CrossRef] [Green Version]
- Gardner, W.S.; Mccarthy, M.J.; Carini, S.A.; Souza, A.C.; Hou, L.; Mcneal, K.S.; Puckett, M.K.; Pennington, J. Collection of intact sediment cores with overlying water to study nitrogen- and oxygen-dynamics in regions with seasonal hypoxia. Cont. Shelf Res. 2009, 29, 2207–2213. [Google Scholar] [CrossRef]
- Wang, G.; Li, X.; Fang, Y.; Huang, R. Analysis on the formation condition of the algae-induced odorous black water agglomerate. Saudi J. Biol. Sci. 2014, 21, 597–604. [Google Scholar] [CrossRef] [PubMed] [Green Version]
- Yin, H.; Wu, Y. Factors Affecting the Production of Volatile Organic Sulfur Compounds (VOSCs) from Algal-Induced Black Water Blooms in Eutrophic Freshwater Lakes. Water Air Soil Pollut. 2016, 227, 1–11. [Google Scholar] [CrossRef]
- Feng, Z.; Fan, C.; Huang, W.; Ding, S. Microorganisms and typical organic matter responsible for lacustrine “black bloom”. Sci. Total Environ. 2014, 470, 1–8. [Google Scholar] [CrossRef]
- Louati, I.; Pascault, N.; Debroas, D.; Bernard, C.; Humbert, J.F.; Leloup, J. Structural Diversity of Bacterial Communities Associated with Bloom-Forming Freshwater Cyanobacteria Differs According to the Cyanobacterial Genus. PLoS ONE 2015, 10, e0140614. [Google Scholar] [CrossRef] [Green Version]
- Chen, S.; He, H.; Zong, R.; Liu, K.; Miao, Y. Geographical Patterns of Algal Communities Associated with Different Urban Lakes in China. Int. J. Environ. Res. Public Health 2020, 17, 1009. [Google Scholar] [CrossRef] [Green Version]
- Wang, X.; Yin, G.; Liu, Q. The Monitoring and Analysis Methods of Water and Wastewater, 4th ed.; China Environmental Protection Agency: Beijing, China, 2002. [Google Scholar]
- He, W.; Shang, J.; Lu, X.; Fan, C. Effects of sludge dredging on the prevention and control of algae-caused black bloom in Taihu Lake, China. J. Environ. Sci. 2013, 25, 430–440. [Google Scholar] [CrossRef]
- Yu, D.; Xie, P.; Zeng, C.; Xie, L.; Chen, J. In situ enclosure experiments on the occurrence, development and decline of black bloom and the dynamics of its associated taste and odor compounds. Ecol. Eng. 2016, 87, 246–253. [Google Scholar] [CrossRef]
- Shen, Q.; Zhou, Q.; Shang, J.; Shao, S.; Lei, Z.; Fan, C. Beyond hypoxia: Occurrence and characteristics of black blooms due to the decomposition of the submerged plant Potamogeton crispus in a shallow lake. J. Environ. Sci. 2014, 26, 281–288. [Google Scholar] [CrossRef]
- He, Y.; Song, N.; Jiang, H.L. Effects of dissolved organic matter leaching from macrophyte litter on black water events in shallow lakes. Environ. Sci. Pollut. Res. 2018, 25, 9928–9939. [Google Scholar] [CrossRef] [PubMed]
- Li, B.; Feng, M.; Chen, X.; Wang, Y.; Wu, Q.L. Abundant sediment organic matter potentially facilitates chemical iron reduction and surface water blackness in a Chinese deep lake. Environ. Pollut. 2021, 272, 116002. [Google Scholar] [CrossRef]
- Chen, M.; Zhang, Y.; Krumholz, L.R.; Zhao, L.; Yan, Z.; Yang, Y.; Li, Z.; Hayat, F.; Chen, H.; Huang, R. Black blooms-induced adaptive responses of sulfate reduction bacteria in a shallow freshwater lake. Environ. Res. 2022, 209, 112732. [Google Scholar] [CrossRef]
- Cai, P.; Wu, Y.; Liu, X.; Yin, H. The contribution of sediment and algal to the formation of black bloom and their potential to supply the black substance in waters in Lake Taihu. J. Lake Sci. 2015, 27, 575–582. [Google Scholar] [CrossRef] [Green Version]
- Sheng, D.; Xu, Z.; Gao, Y. Cause and impact analysis of black water cluster in Taihu Lake. Water Resour. Prot. 2010, 26, 41–44. [Google Scholar] [CrossRef]
- Zhou, Y.; Jiang, H.; Cai, H. To prevent the occurrence of black water agglomerate through delaying decomposition of cyanobacterial bloom biomass by sediment microbial fuel cell. J. Hazard. Mater. 2015, 287, 7–15. [Google Scholar] [CrossRef]
- Deng, X.; Liang, G.; Chen, J.; Qi, M.; Xie, P. Simultaneous determination of eight common odors in natural water body using automatic purge and trap coupled to gas chromatography with mass spectrometry. J. Chromatogr. A 2011, 1218, 3791–3798. [Google Scholar] [CrossRef]
- Chen, J.; Xie, P.; Ma, Z.; Niu, Y.; Tao, M.; Deng, X.; Wang, Q. A systematic study on spatial and seasonal patterns of eight taste and odor compounds with relation to various biotic and abiotic parameters in Gonghu Bay of Lake Taihu, China. Sci. Total Environ. 2010, 409, 314–325. [Google Scholar] [CrossRef]
- Li, H.; Gu, X.; Chen, H. Co-occurrence of multiple cyanotoxins and taste-and-odor compounds in the large eutrophic Lake Taihu, China: Dynamics, driving factors, and challenges for risk assessment. Environ. Pollut. 2022, 294, 118594. [Google Scholar] [CrossRef] [PubMed]
- Harris, J.M.; Vinobaba, P.; Kularatne, R.K.A. Spatial and temporal distribution of cyanobacteria in Batticaloa Lagoon. J. Environ. Sci. 2016, 47, 211–218. [Google Scholar] [CrossRef] [PubMed] [Green Version]
- Shi, L.; Huang, Y.; Zhang, M.; Yu, Y.; Lu, Y.; Kong, F. Bacterial community dynamics and functional variation during the long-term decomposition of cyanobacterial blooms in-vitro. Sci. Total Environ. 2017, 598, 77–86. [Google Scholar] [CrossRef]
- Shen, Q.; Shao, S.; Wang, Z.; Zhang, L.; Hu, H.; Fan, C. Fade and recovery process of algae-induced black bloom in Lake Taihu under different wind conditions. Chin. Sci. Bull. 2012, 57, 1060–1066. [Google Scholar] [CrossRef]
- Wood, E. Biochemistry (3rd ed.). Biochem. Mol. Biol. Educ. 2004, 32, 421–423. [Google Scholar] [CrossRef]
- Wu, J.; Hong, Y.; Ye, J. Diversity of anammox bacteria and contribution to the nitrogen loss in surface sediment. Int. Biodeterior. Biodegrad. 2019, 142, 227–234. [Google Scholar] [CrossRef]
- Su, Y.; Hu, M.; Wang, Y. Identifying key drivers of harmful algal blooms in a tributary of the Three Gorges Reservoir between different seasons: Causality based on data-driven methods. Environ. Pollut. 2022, 297, 118759. [Google Scholar] [CrossRef]
- Chen, M.; Ding, S.; Chen, X.; Sun, Q.; Fan, X.; Lin, J.; Ren, M.; Yang, L.; Zhang, C. Mechanisms driving phosphorus release during algal blooms based on hourly changes in iron and phosphorus concentrations in sediments. Water Res. 2018, 133, 153–164. [Google Scholar] [CrossRef]
- Li, H.; Xing, P.; Chen, M. Short-term bacterial community composition dynamics in response to accumulation and breakdown of Microcystis blooms. Water Res. 2011, 45, 1702–1710. [Google Scholar] [CrossRef]
- Qian, H.; Zhu, Y.; Chen, S.; Jin, Y.; Lavoie, M.; Ke, M.; Fu, Z. Interacting effect of diclofop-methyl on the rice rhizosphere microbiome and denitrification. Pestic. Biochem. Physiol. 2018, 146, 90–96. [Google Scholar] [CrossRef]
- Bouzat, J.L.; Hoostal, M.J.; Looft, T. Spatial patterns of bacterial community composition within Lake Erie sediments. J. Great Lakes Res. 2013, 39, 344–351. [Google Scholar] [CrossRef]
- Sinkko, H.; Lukkari, K.; Sihvonen, L.M.; Sivonen, K.; Leivuori, M.; Rantanen, M.; Paulin, L.; Lyra, C. Bacteria contribute to sediment nutrient release and reflect progressed eutrophication-driven hypoxia in an organic-rich continental sea. PLoS ONE 2013, 8, e67061. [Google Scholar] [CrossRef] [Green Version]
- Zhu, J.; Zhang, J.; Li, Q.; Han, T.; Xie, J.; Hu, Y.; Chai, L. Phylogenetic analysis of bacterial community composition in sediment contaminated with multiple heavy metals from the Xiangjiang River in China. Mar. Pollut. Bull. 2013, 70, 134–139. [Google Scholar] [CrossRef]
- Speirs, L.; Rice, D.T.; Petrovski, S.; Seviour, R.J. The phylogeny, biodiversity, and ecology of the Chloroflexi in activated sludge. Front. Microbiol. 2019, 10, 2015. [Google Scholar] [CrossRef] [PubMed] [Green Version]
- Goffredi, S.K.; Orphan, V.J. Bacterial community shifts in taxa and diversity in response to localized organic loading in the deep sea. Environ. Microbiol. 2010, 12, 344–363. [Google Scholar] [CrossRef] [PubMed]
- Huan, W.; Jiang, X. Profiling of Sediment Microbial Community in Dongting Lake before and after Impoundment of the Three Gorges Dam. Int. J. Environ. Res. Public Health 2016, 13, 617. [Google Scholar] [CrossRef]
- Li, H.; Peng, X.; Wu, Q.L. Characterization of the bacterial community composition in a hypoxic zone induced by Microcystis blooms in Lake Taihu, China. FEMS Microbiol. Ecol. 2011, 79, 773–784. [Google Scholar] [CrossRef]
- Zhang, H.; Liu, F.; Zheng, S. The differentiation of iron-reducing bacterial community and iron-reduction activity between riverine and marine sediments in the Yellow River estuary. Mar. Life Sci. Technol. 2020, 2, 87–96. [Google Scholar] [CrossRef] [Green Version]
- Li, X.; Zeng, X.; Zhang, Z.; Shao, Z. Characteristics of different iron oxides reduction by a thermophilic dissimilatory iron reducing bacterium Caloranaerobacter ferrireducens DY22619T from deep sea. Haiyang Xuebao 2016, 38, 83–92. [Google Scholar] [CrossRef]
- Kielak, A.M.; Barreto, C.C.; Kowalchuk, G.A.; Van Veen, J.A.; Kuramae, E.E. The ecology of Acidobacteria: Moving beyond genes and genomes. Front. Microbiol. 2016, 7, 744. [Google Scholar] [CrossRef] [PubMed] [Green Version]
- Wang, Z.; Akbar, S.; Sun, Y.; Gu, L.; Zhang, L.; Lyu, K.; Huang, Y.; Yang, Z. Cyanobacterial dominance and succession: Factors, mechanisms, predictions, and managements. J. Environ. Manag. 2021, 297, 113281. [Google Scholar] [CrossRef] [PubMed]
- Lürling, M.; Eshetu, F.; Faassen, E.J.; Kosten, S.; Huszar, V.L. Comparison of cyanobacterial and green algal growth rates at different temperatures. Freshw. Biol. 2013, 58, 552–559. [Google Scholar] [CrossRef]
- Salcher, M.M.; Pernthaler, J.; Posch, T. Spatiotemporal distribution and activity patterns of bacteria from three phylogenetic groups in an oligomesotrophic lake. Limnol. Oceanogr. 2010, 55, 846–856. [Google Scholar] [CrossRef]
- Newton, R.J.; Jones, S.E.; Eiler, A.; Mcmahon, K.D.; Bertilsson, S. A guide to the natural history of freshwater lake bacteria. Microbiol. Mol. Rev. 2011, 75, 14–49. [Google Scholar] [CrossRef] [PubMed] [Green Version]
- Allen, J.P.; Atekwana, E.A.; Atekwana, E.A.; Duris, J.W.; Werkema, D.D.; Rossbach, S. The Microbial Community Structure in Petroleum-Contaminated Sediments Corresponds to Geophysical Signatures. Appl. Environ. Microbiol. 2007, 73, 2860–2870. [Google Scholar] [CrossRef] [Green Version]
- Feng, S.; Yuan, B.; Wang, B. Changes in physical and chemical properties of water and bacterial community when black bloom occurs. Ecol. Sci. 2017, 36, 25–34. [Google Scholar] [CrossRef]
- Ghai, R.; Mizuno, C.M.; Picazo, A.; Camacho, A.; Rodriguezvalera, F. Key roles for freshwater Actinobacteria revealed by deep metagenomic sequencing. Mol. Ecol. 2015, 23, 6073–6090. [Google Scholar] [CrossRef]
- Parulekar, N.N.; Kolekar, P.; Jenkins, A.; Kleiven, S.; Utkilen, H.; Johansen, A.; Sawant, S.; Kulkarni-Kale, U.; Kale, M.; Sæbø, M. Characterization of bacterial community associated with phytoplankton bloom in a eutrophic lake in South Norway using 16S rRNA gene amplicon sequence analysis. PLoS ONE 2017, 12, e0173408. [Google Scholar] [CrossRef]
- Wang, M.; Shang, H.; Hao, C. Diversity and bacteria community structure of activated carbon used in advanced drinking water treatment. Environ. Sci. 2011, 32, 1497–1504. [Google Scholar] [CrossRef]
- Wang, F.; Xu, C.; Liu, Y. Effect of Start-up Conditions on Proteobacteria Community Structure. J. Tongji Univ. 2007, 35, 949–953. [Google Scholar] [CrossRef]
- Etchebehere, C.; Errazquin, M.I.; Dabert, P.; Muxí, L. Community analysis of a denitrifying reactor treating landfill leachate. FEMS Microbiol. Ecol. 2002, 40, 97–106. [Google Scholar] [CrossRef] [PubMed]
Figure 1.
Schematic diagram of the indoor simulated black blooms setup. (artificial climate chamber: temperature of 25–30 °C, day-night cycle of 16 h:8 h, sunshine intensity of 8000 lx. W: water, SW: sediments-water, SWA: sediments-water-algae).
Figure 1.
Schematic diagram of the indoor simulated black blooms setup. (artificial climate chamber: temperature of 25–30 °C, day-night cycle of 16 h:8 h, sunshine intensity of 8000 lx. W: water, SW: sediments-water, SWA: sediments-water-algae).

Figure 2.
Changes in the levels of odor compounds during black blooms. (W: water, SW: sediments-water, SWA: sediments-water-algae, GSM: geosmin, 2-MIB: 2-methylisoborneol).
Figure 2.
Changes in the levels of odor compounds during black blooms. (W: water, SW: sediments-water, SWA: sediments-water-algae, GSM: geosmin, 2-MIB: 2-methylisoborneol).

Figure 3.
Changes in DO and pH during the black blooms process: (a) DO; (b) pH. (W: water; SW: sediments-water; SWA: sediments-water-algae).
Figure 3.
Changes in DO and pH during the black blooms process: (a) DO; (b) pH. (W: water; SW: sediments-water; SWA: sediments-water-algae).

Figure 4.
Variations in nitrogen and phosphorus levels during black blooms. (a) TN; (b) NH4+-N; (c) TP; (d) PO43−. (W: water; SW: sediments-water; SWA: sediments-water-algae; TN: total nitrogen; TP: total phosphorus).
Figure 4.
Variations in nitrogen and phosphorus levels during black blooms. (a) TN; (b) NH4+-N; (c) TP; (d) PO43−. (W: water; SW: sediments-water; SWA: sediments-water-algae; TN: total nitrogen; TP: total phosphorus).

Figure 5.
Diversity indices of microbial communities in the black floats and sediments. (SWA-F: black floats in the sediments-water-algae group; SWA-S: sediments in the sediments-water-algae group; SW-S: sediments in the sediments-water group; SW-F: black floats in the sediments-water group).
Figure 5.
Diversity indices of microbial communities in the black floats and sediments. (SWA-F: black floats in the sediments-water-algae group; SWA-S: sediments in the sediments-water-algae group; SW-S: sediments in the sediments-water group; SW-F: black floats in the sediments-water group).

Figure 6.
Microbial community composition and dominant species distribution map of black floats and sediments at the phylum level. (SWA-F: black floats in the sediments-water-algae group; SWA-S: sediments in the sediments-water-algae group; SW-S: sediments in the sediments-water group; SW-F: black floats in the sediments-water group. The left side represents the distribution of bacterial communities in the SWA-F, SW-F, SWA-S, and SW-S samples; the right side represents the proportion of each bacterial community in the SWA-F, SW-F, SWA-S, and SW-S samples; and the left and right colors correspond to each other).


Table 1.
The changes of blackness during black blooms.
| Day | 0 | 1 | 2 | 3 | 4 | 6 | 8 | 10 | 13 | 16 | 20 | 25 | 30 | 35 | 40 | |
|---|---|---|---|---|---|---|---|---|---|---|---|---|---|---|---|---|
| Samples | ||||||||||||||||
| W | 0 | 0 | 0 | 0 | 0 | 0 | 0 | 0 | 0 | 0 | 0 | 0 | 1 | 1 | 1 | |
| SW | 0 | 0 | 0 | 0 | 0 | 0 | 0 | 0 | 1 | 2 | 2 | 3 | 3 | 3 | 4 | |
| SWA | 0 | 0 | 0 | 0 | 0 | 0 | 0 | 1 | 2 | 3 | 3 | 3 | 4 | 4 | 4 | |
Note: Numbers 0, 1, 2, 3, and 4 represent the water’s color and correspond to a classification of colorless, gray, light black, black, and dark black, respectively. W: water, SW: sediments-water, SWA: sediments-water-algae.
Publisher’s Note: MDPI stays neutral with regard to jurisdictional claims in published maps and institutional affiliations. |
© 2022 by the authors. Licensee MDPI, Basel, Switzerland. This article is an open access article distributed under the terms and conditions of the Creative Commons Attribution (CC BY) license (https://creativecommons.org/licenses/by/4.0/).
Share and Cite
MDPI and ACS Style
Tang, T.; Ma, Y.; Shen, W.; Li, Z.; Dai, R.; Ye, J. Effects of Algae on the Formation of Black Blooms and Bacterial Community Structure Changes in Sediments and Black Floats. Water 2022, 14, 2348. https://doi.org/10.3390/w14152348
AMA Style
Tang T, Ma Y, Shen W, Li Z, Dai R, Ye J. Effects of Algae on the Formation of Black Blooms and Bacterial Community Structure Changes in Sediments and Black Floats. Water. 2022; 14(15):2348. https://doi.org/10.3390/w14152348
Chicago/Turabian StyleTang, Tingting, Yingxiao Ma, Wendi Shen, Zihao Li, Ruihua Dai, and Jianfeng Ye. 2022. "Effects of Algae on the Formation of Black Blooms and Bacterial Community Structure Changes in Sediments and Black Floats" Water 14, no. 15: 2348. https://doi.org/10.3390/w14152348
Note that from the first issue of 2016, this journal uses article numbers instead of page numbers. See further details here.