
Wildfire-Induced Changes in Flood Risk in Recreational Canyoning Areas: Lessons from the 2017 Jerte Canyons Disaster


1
Department of Geology and Geochemistry, Science Faculty, Universidad Autónoma de Madrid, 28049 Madrid, Spain
2
Department of Geodynamics, Stratigraphy and Paleontology, Geology Faculty, Complutense University of Madrid, 28040 Madrid, Spain
3
Amara S.A.U., 28042 Madrid, Spain
*
Authors to whom correspondence should be addressed.
Water 2022, 14(15), 2345; https://doi.org/10.3390/w14152345
Submission received: 13 July 2022
/
Revised: 26 July 2022
/
Accepted: 27 July 2022
/
Published: 29 July 2022
(This article belongs to the Special Issue Recent Advances in Flood Hazard and Risk Science)
Abstract
:Few studies identify potential hazards affecting canyoning. This activity has an increasing number of practitioners, and hence, a greater number of people are affected by potential natural hazards. Mountain rivers are located in places subject to several hydrological hazards; the risks are mostly connected with floods produced by intense storms or dam operation, but changes in hydrological factors may alter the usual basin behavior given even moderate or less severe storms. Data about flood events and the peak discharge of the 2017 flood in the two studied canyons were collected by means of a quick field survey of water levels after the flood, hydrological modeling, and soil analysis. The present research shows the dramatic consequences of a two-year return period storm affecting a guided group of canyoneers. A previous wildfire changed the soil, leading to hydrophobic conditions and increasing the flood effects. Peak discharge increased from 2 m3 s−1 in normal conditions to 12 m3 s−1 under a hydrophobic regime related to wildfire occurrence; moreover, a reduction in the time of concentration also occurred, pointing to a more powerful and dangerous flood event. In this paper, some hydrological recommendations are highlighted that will be helpful in recreational canyoning management, leading to safer practice.
1. Introduction
Recreational canyoning is an in-demand activity under the umbrella of so-called outdoor sports, mountain adventure sports, or nature and adventure sports [1,2]. Adventure companies used to offer “easy canyons” to less experienced tourists. This activity is relatively safe in low-difficulty canyons under medium to low discharge conditions and stable weather during the late spring and summer. In order to ensure safety, companies offer short-duration activities and promote well-protected canyons, with strong anchors for rappelling, chains that favor beginners’ safe access to delicate areas, and sometimes double anchors that allow two groups to go down at the same time. This “over security” fits with the idea that “the most successful adventure tourism operators are those that minimize the opportunity for loss to as low a level as possible” [3]. In fact, unexperienced customers of adventure companies look for the expertise and experience of well-trained guides [4].
However, despite those security measures, accidents happen, mostly due to the wild nature of the environment [3,5,6], human error in managing gear [7], and poor decisions about environmental conditions (e.g.,: “The company running the trip was severely criticized for ignoring storm warnings on the day of the trip” [4]). Ströhle et al. [8] note that about 78.8% of accidents in Austria in 2005–2018 happened under good weather conditions. Brandao et al. [2] suggest that 80% of accident risk is due to human factors and only 20% to environmental factors. This imbalance towards the human side has traditionally led to companies and guided trainers putting more effort into technical aspects, while ignoring environmental problems. The most well-known factors in this group come from extreme rainfall episodes that trigger flash floods, rockfalls, debris flows, landslides, and human-derived hazards such as dam breaks, dam release of high flows, and fires.
Typical hydrological studies relate the incidence of wildfires to watershed hydrological characteristics: an increase in streambed erosion, debris flow triggering, favoring natural dams, and changes in soil properties such as an increase in hydrophobicity. Most of these well-known factors change the runoff coefficient or the curve number (CN, the proportion of rainfall that promotes runoff). To the best of our knowledge, these important factors have never been taken into account in risk perception analysis related to canyoning.
In this paper, one of the unexpected problems related to a flash flood triggered by previous wildfires is presented. Flash floods can appear even in a well-protected and safe canyon used by companies for beginner activities, as with the flash flood in Los Hoyos canyon (Jerte, Spain).
The Jerte area has a good range of easy canyons to suit tourists. The mountains are less steep and favor open canyons better than other prime zones of canyoning in Spain, such as the Pyrenees, Guara, or Picos de Europa. The granitic nature of bedrock, combined with an old mountain range and forested watersheds, leads to safe canyons where the possibility of “escape” under high water or flood conditions is higher than in other typical canyon areas in Europe. In 2017, a small storm was recorded in the surrounding stations; however, a flash flood killed four people from the same family while they were undertaking a beginner activity with a company. Only two people were rescued safely, the guide and a young boy. At the same time, another group of canyoneers undertaking a guided activity was reached by a flash flood in neighboring Papúos canyon, whose situation has also been studied to complement the information on the event.
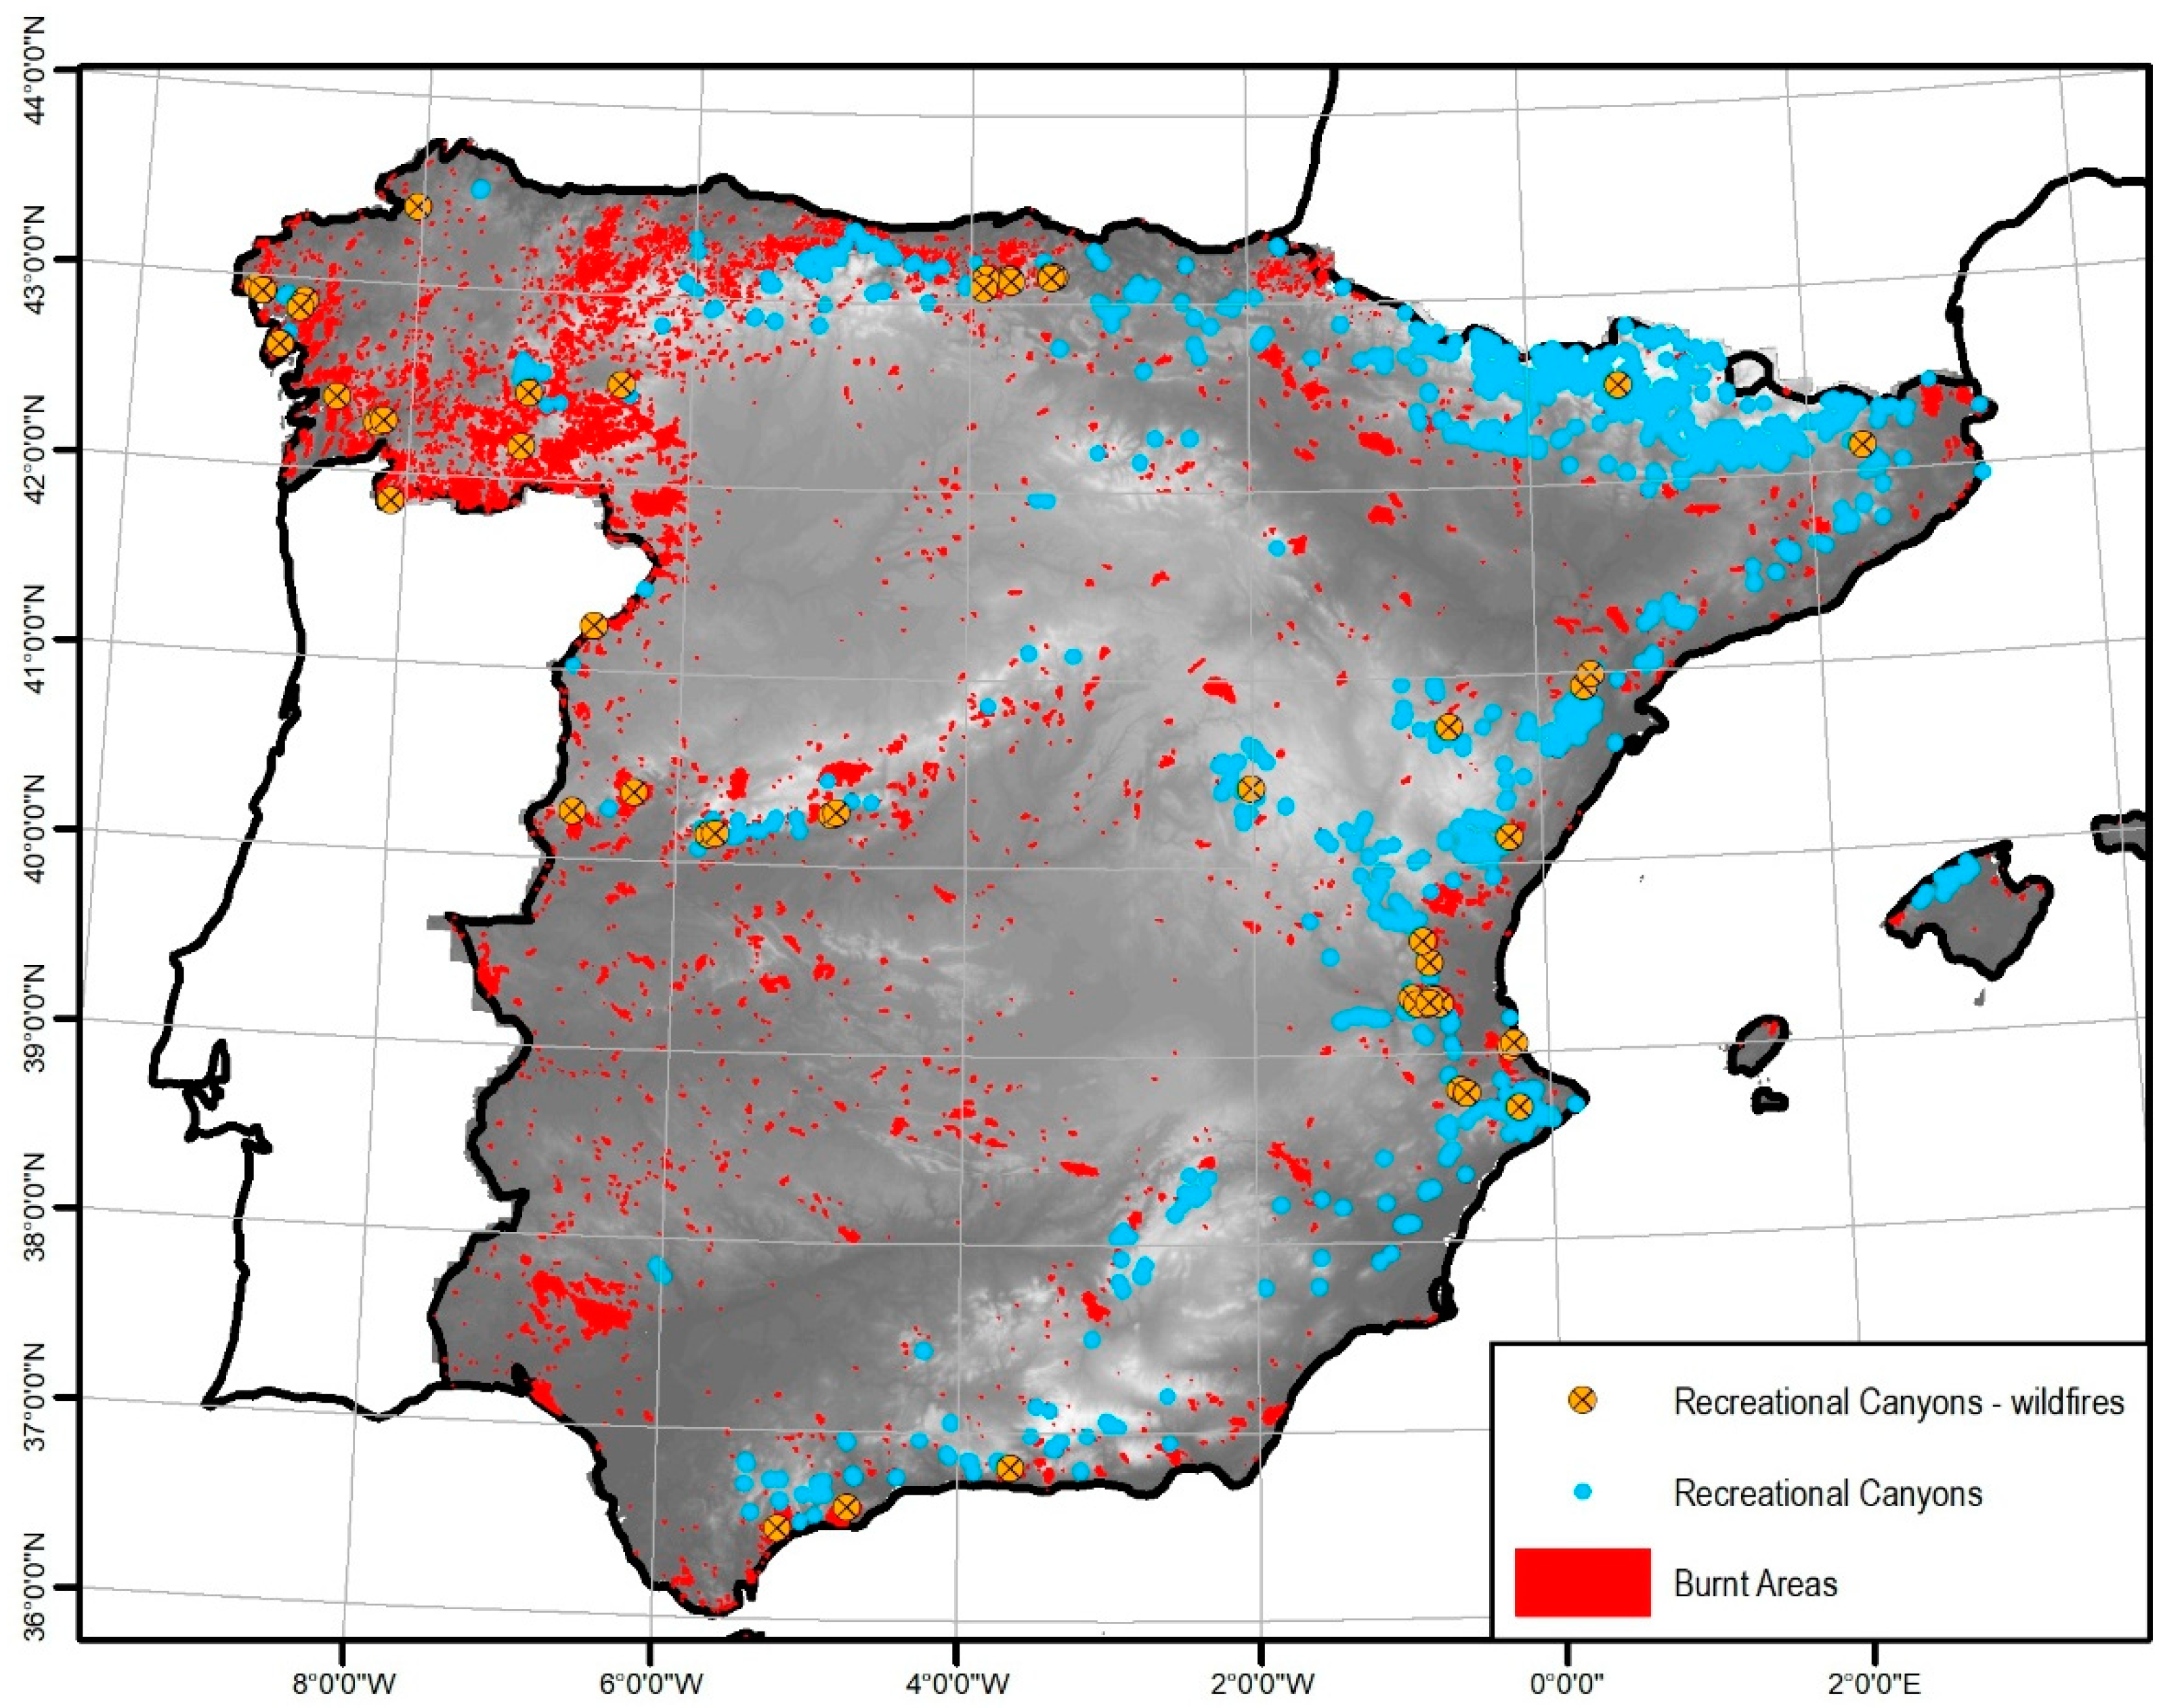
The goal of this study is to fill a research gap, because there is no publication that relates the risk of floods and canyoning to the hydrological changes caused by wildfires in a river area. The case study is the first of its kind documented that includes this problem in the context of canyoning. Canyoning is a nature sport practiced by around 400,000 people/year in Spain, both nationals and foreigners. Wildfires are increasing in mountainous areas of the whole Iberian Peninsula and, hence, the risk involved with canyoning is increasing, with several canyons (up to 57 in 2020; see Figure 1) affected in recent times.
In addition, this study reflects, for the first time, the fact that an accident caused by a flood event is associated with a low return period.
The main objectives of this work are to determine the main reasons for this flash flood accident, to establish its relationship with the previous wildfire, and to determine hidden factors that might have accounted for this extreme sensitivity to environmental changes. Our hypotheses are: (i) the real rainfall was underestimated by rainfall stations due to the mountainous nature of the area, (ii) a previous wildfire provided enough trees to create log dams that failed and broke under small storms, and/or (iii) wildfires have changed the infiltration pattern of the soil, and thus, the runoff exceeded the normal rate for a small storm.
2. Study Area
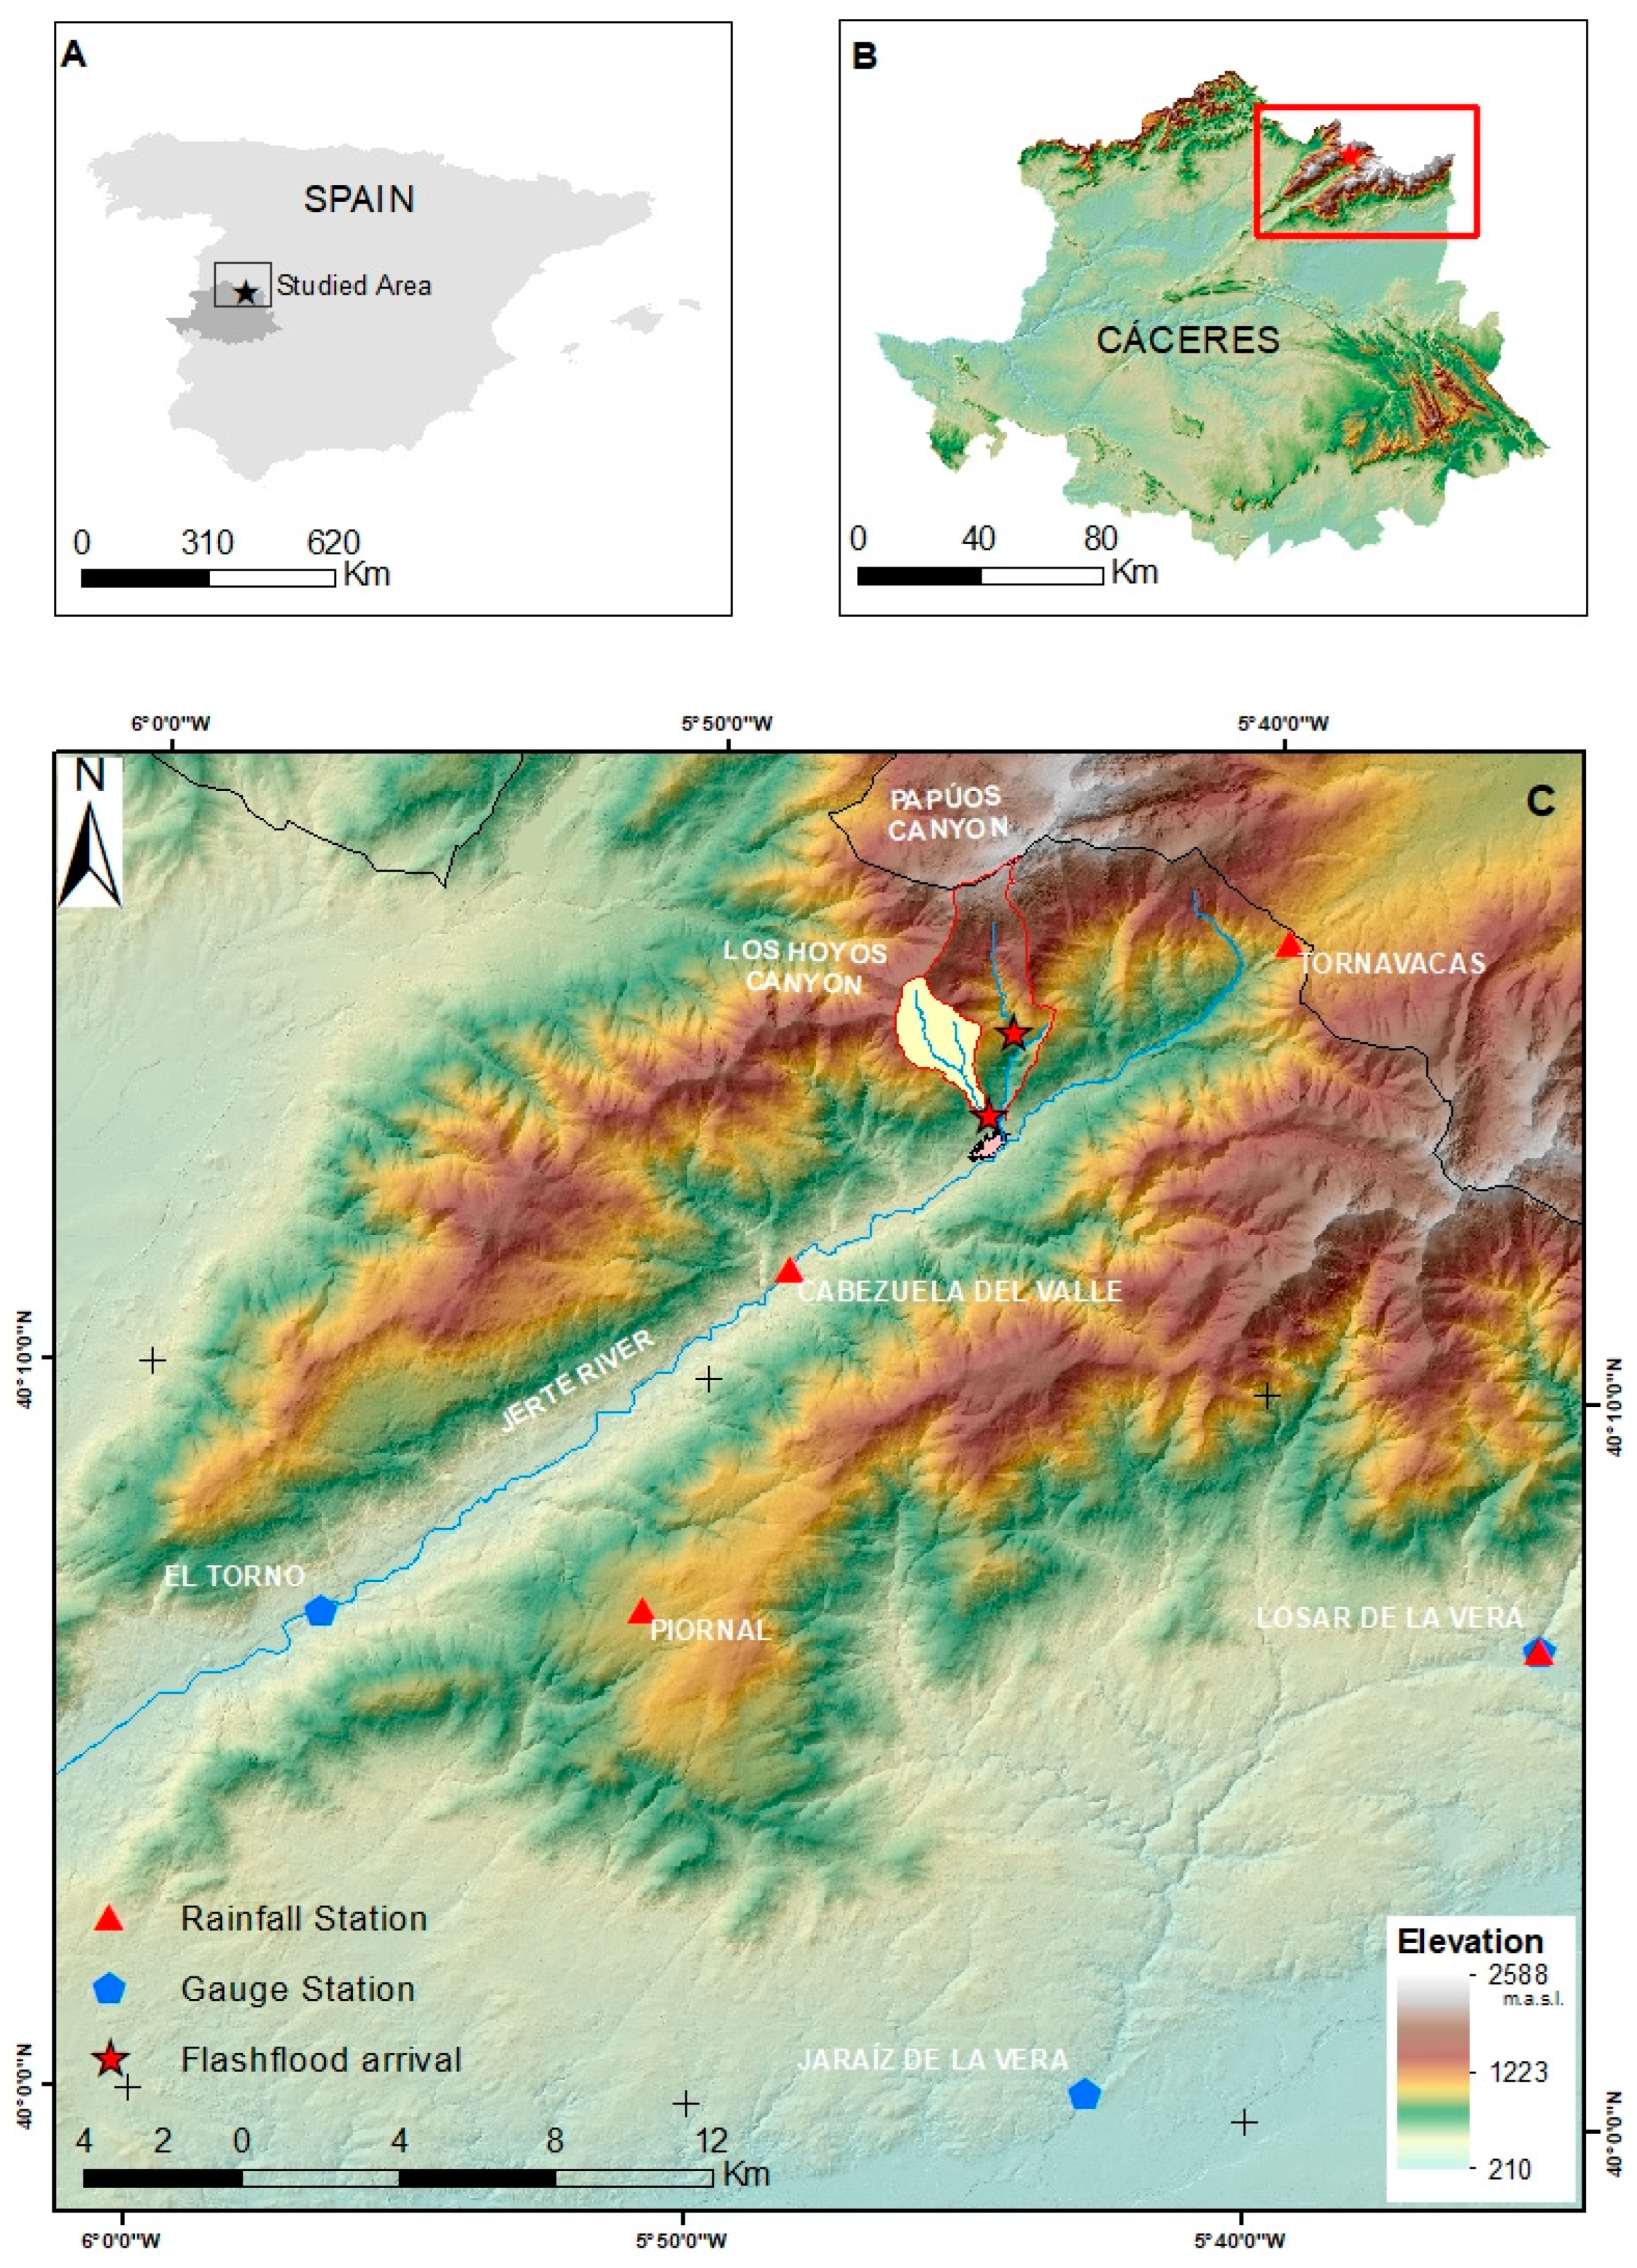
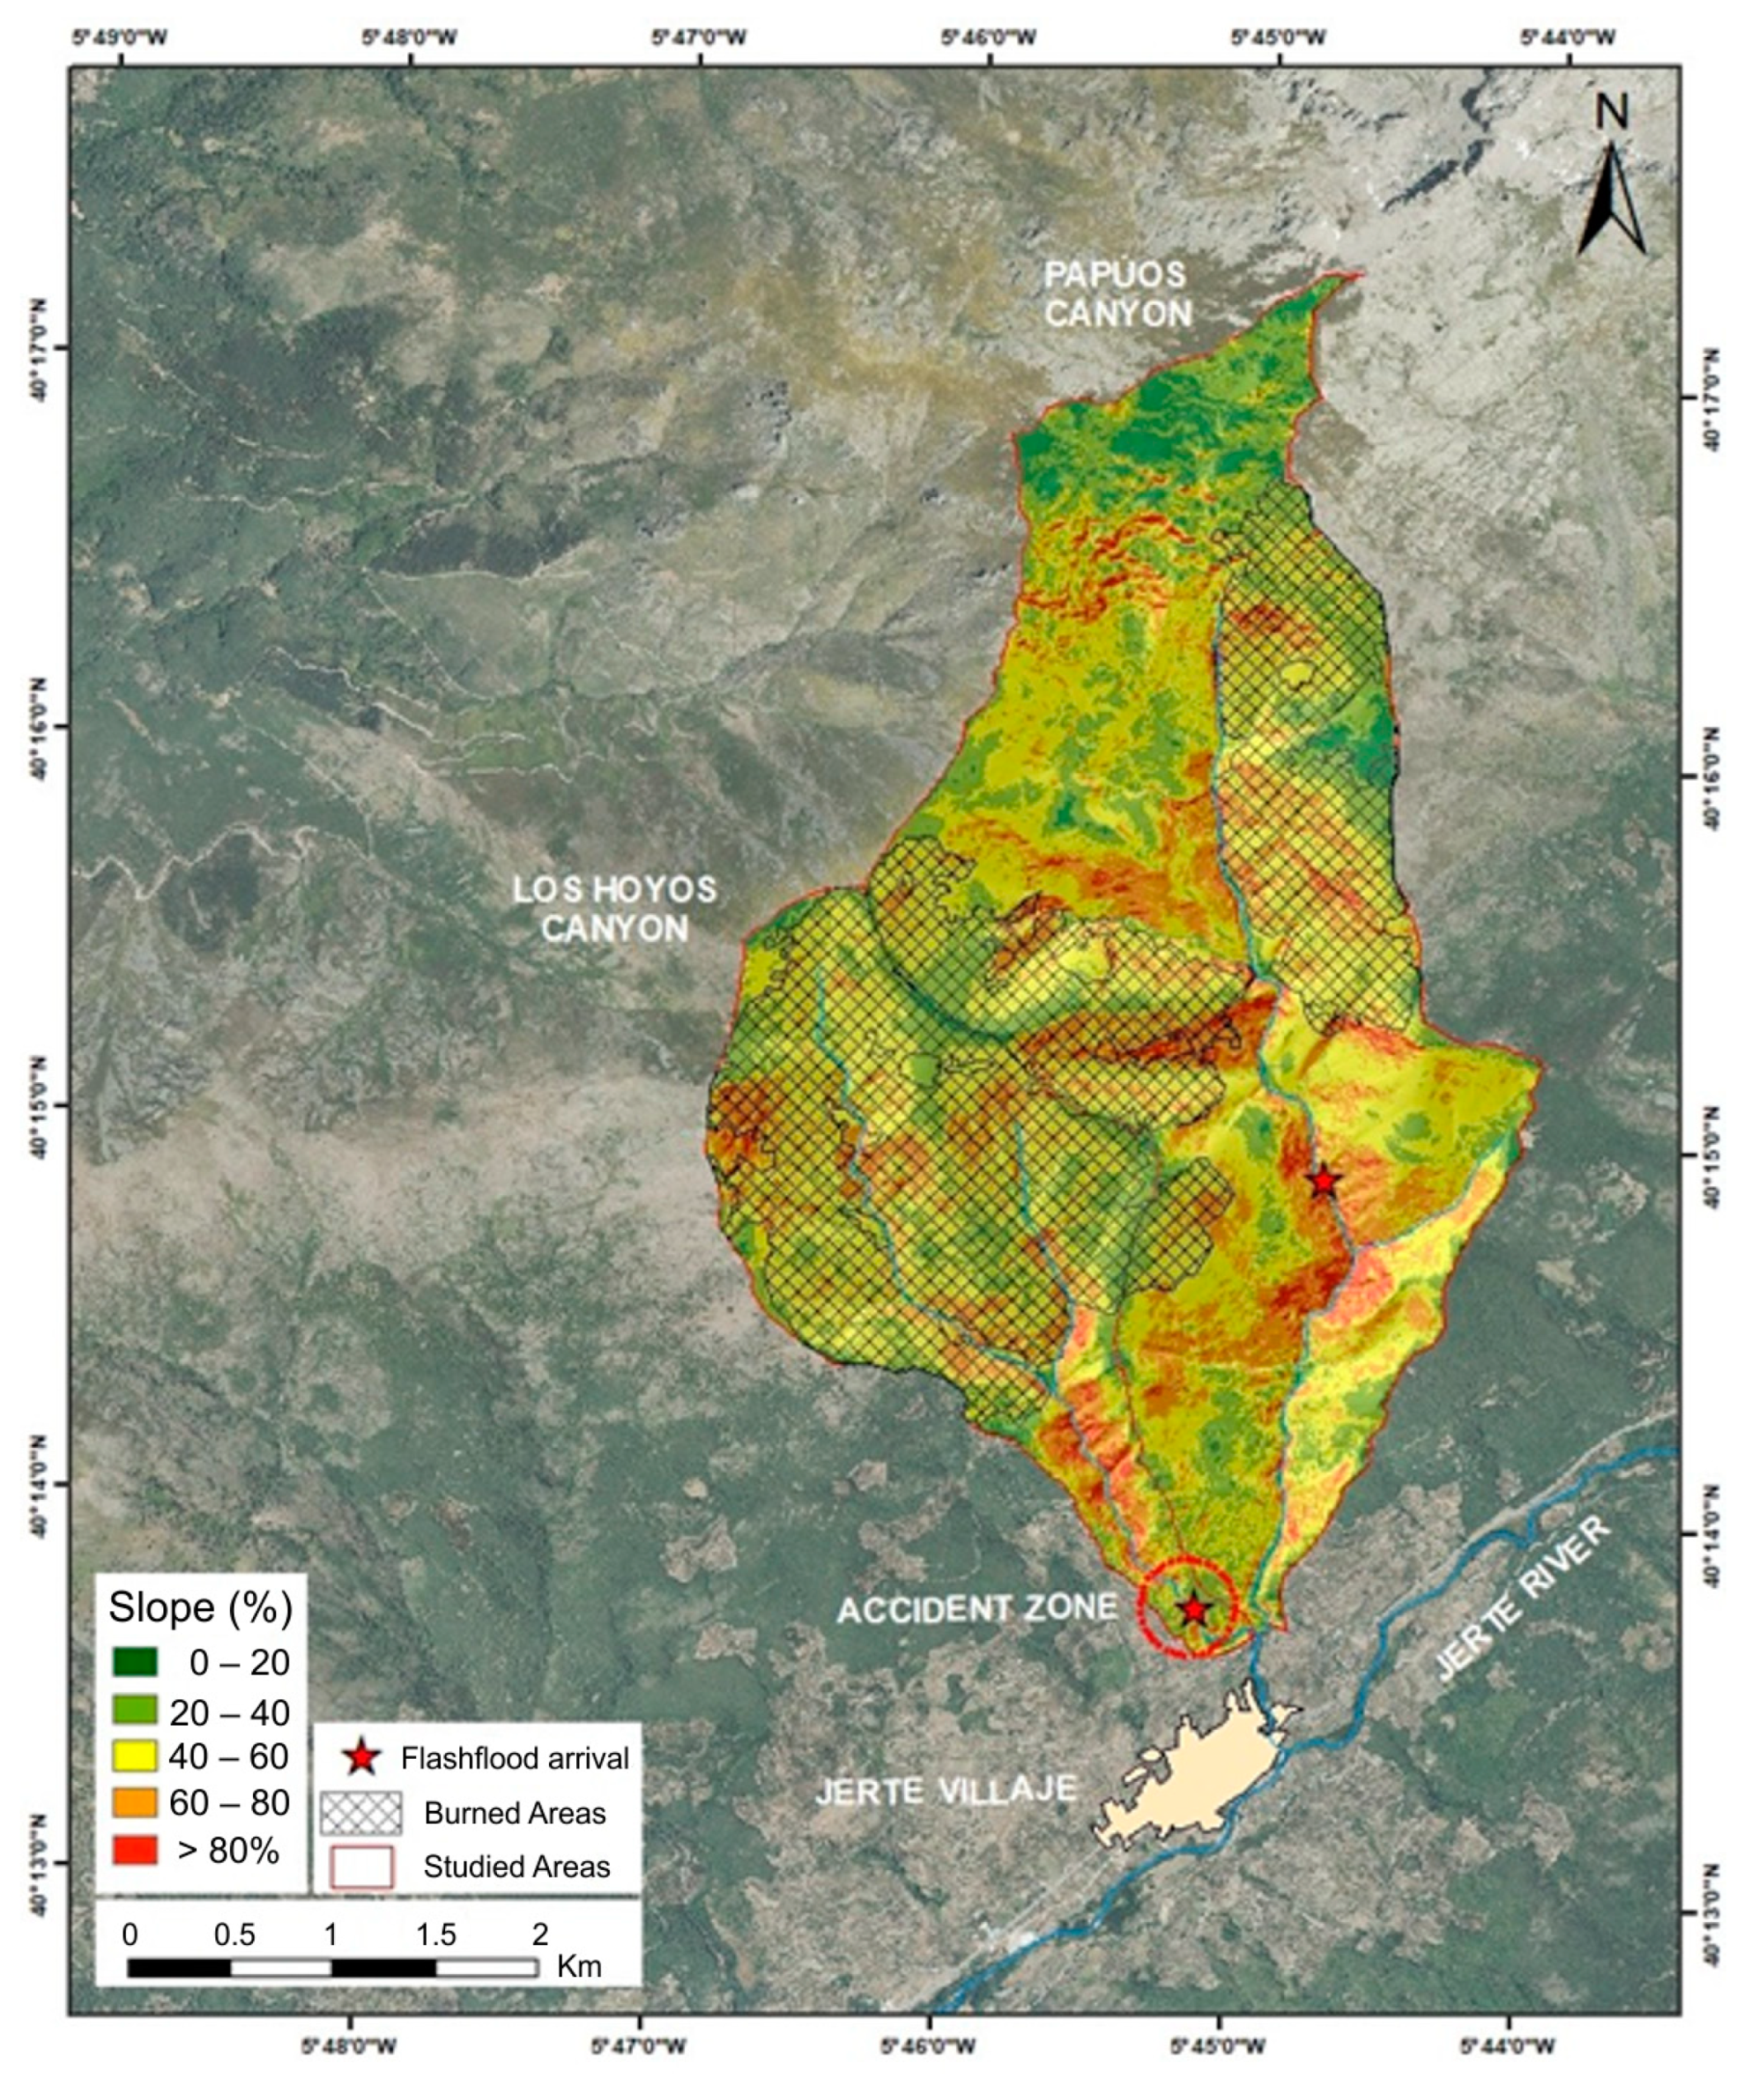
The Jerte valley, located in the Sistema Central, is one of the main recreational destinations in southwest Spain and hosts outdoor activities such as hiking, mountain biking, canyoning, and kayaking. Los Hoyos canyon is a tributary of Papúos canyon (Figure 2), located in Jerte village (southwest Spain). It is a mountain river with a mixed substrate composed of bedrock and large sediments (mainly boulders), with steep slopes in its basin (Figure 3) that reach 0.18 m m−1 in Los Hoyos canyon and 0.20 m m−1 in Papúos canyon (see Table 1). The geological substrate is mainly made up of granite-type materials, underlying shallow soils that may be grouped as Entisols [9], with little evidence of the development of pedogenic horizons. Elevations from the upper watershed to the lower valley are from 1900 to 600 m.
The mean annual precipitation is 1225 mm year−1, as is typical for mountain areas, and occurs mostly during the winter months, making July (the month of the fatal event) a typical low-precipitation month. Maximum daily rainfall (Table 1) is 69 mm (2-year return period) and 214 mm (500-year return period) in Los Hoyos Canyon, with similar numbers for Papúos canyon. Stream flow is dominated by winter runoff events that produce an annual peak in the winter months. The Q2/Q500 ratio (which measures the degree of variability) is 10/57 (Hoyos) and 14/79 (Papúos). Land cover is similar in both canyons: mostly pastures in the upper basin, pine and oak forest in the medium basin, and cherry orchards in the lower basin. There are patches of old wildfires in Papúos. The total area of the watershed affected by the 2017 wildfire is 74% in Hoyos and 42% in Papúos.
3. Methods
The Los Hoyos and Papúos streams were inspected along their whole length using proper canyoneering techniques during the several days after the flash flood. An immediate field survey was made after the fatal event to collect information about high water marks (HWM, i.e., flotsam; the floating elements left by the flash flood) and other flood markers such as vegetation bent by the river flow. During the inspection of both rivers, the presence of favorable sites for calculating the flow more accurately were identified, searching for evidence of the type of flooding: ordinary flood, hyperconcentrated, or debris flow, and specific problems such as a log dam.
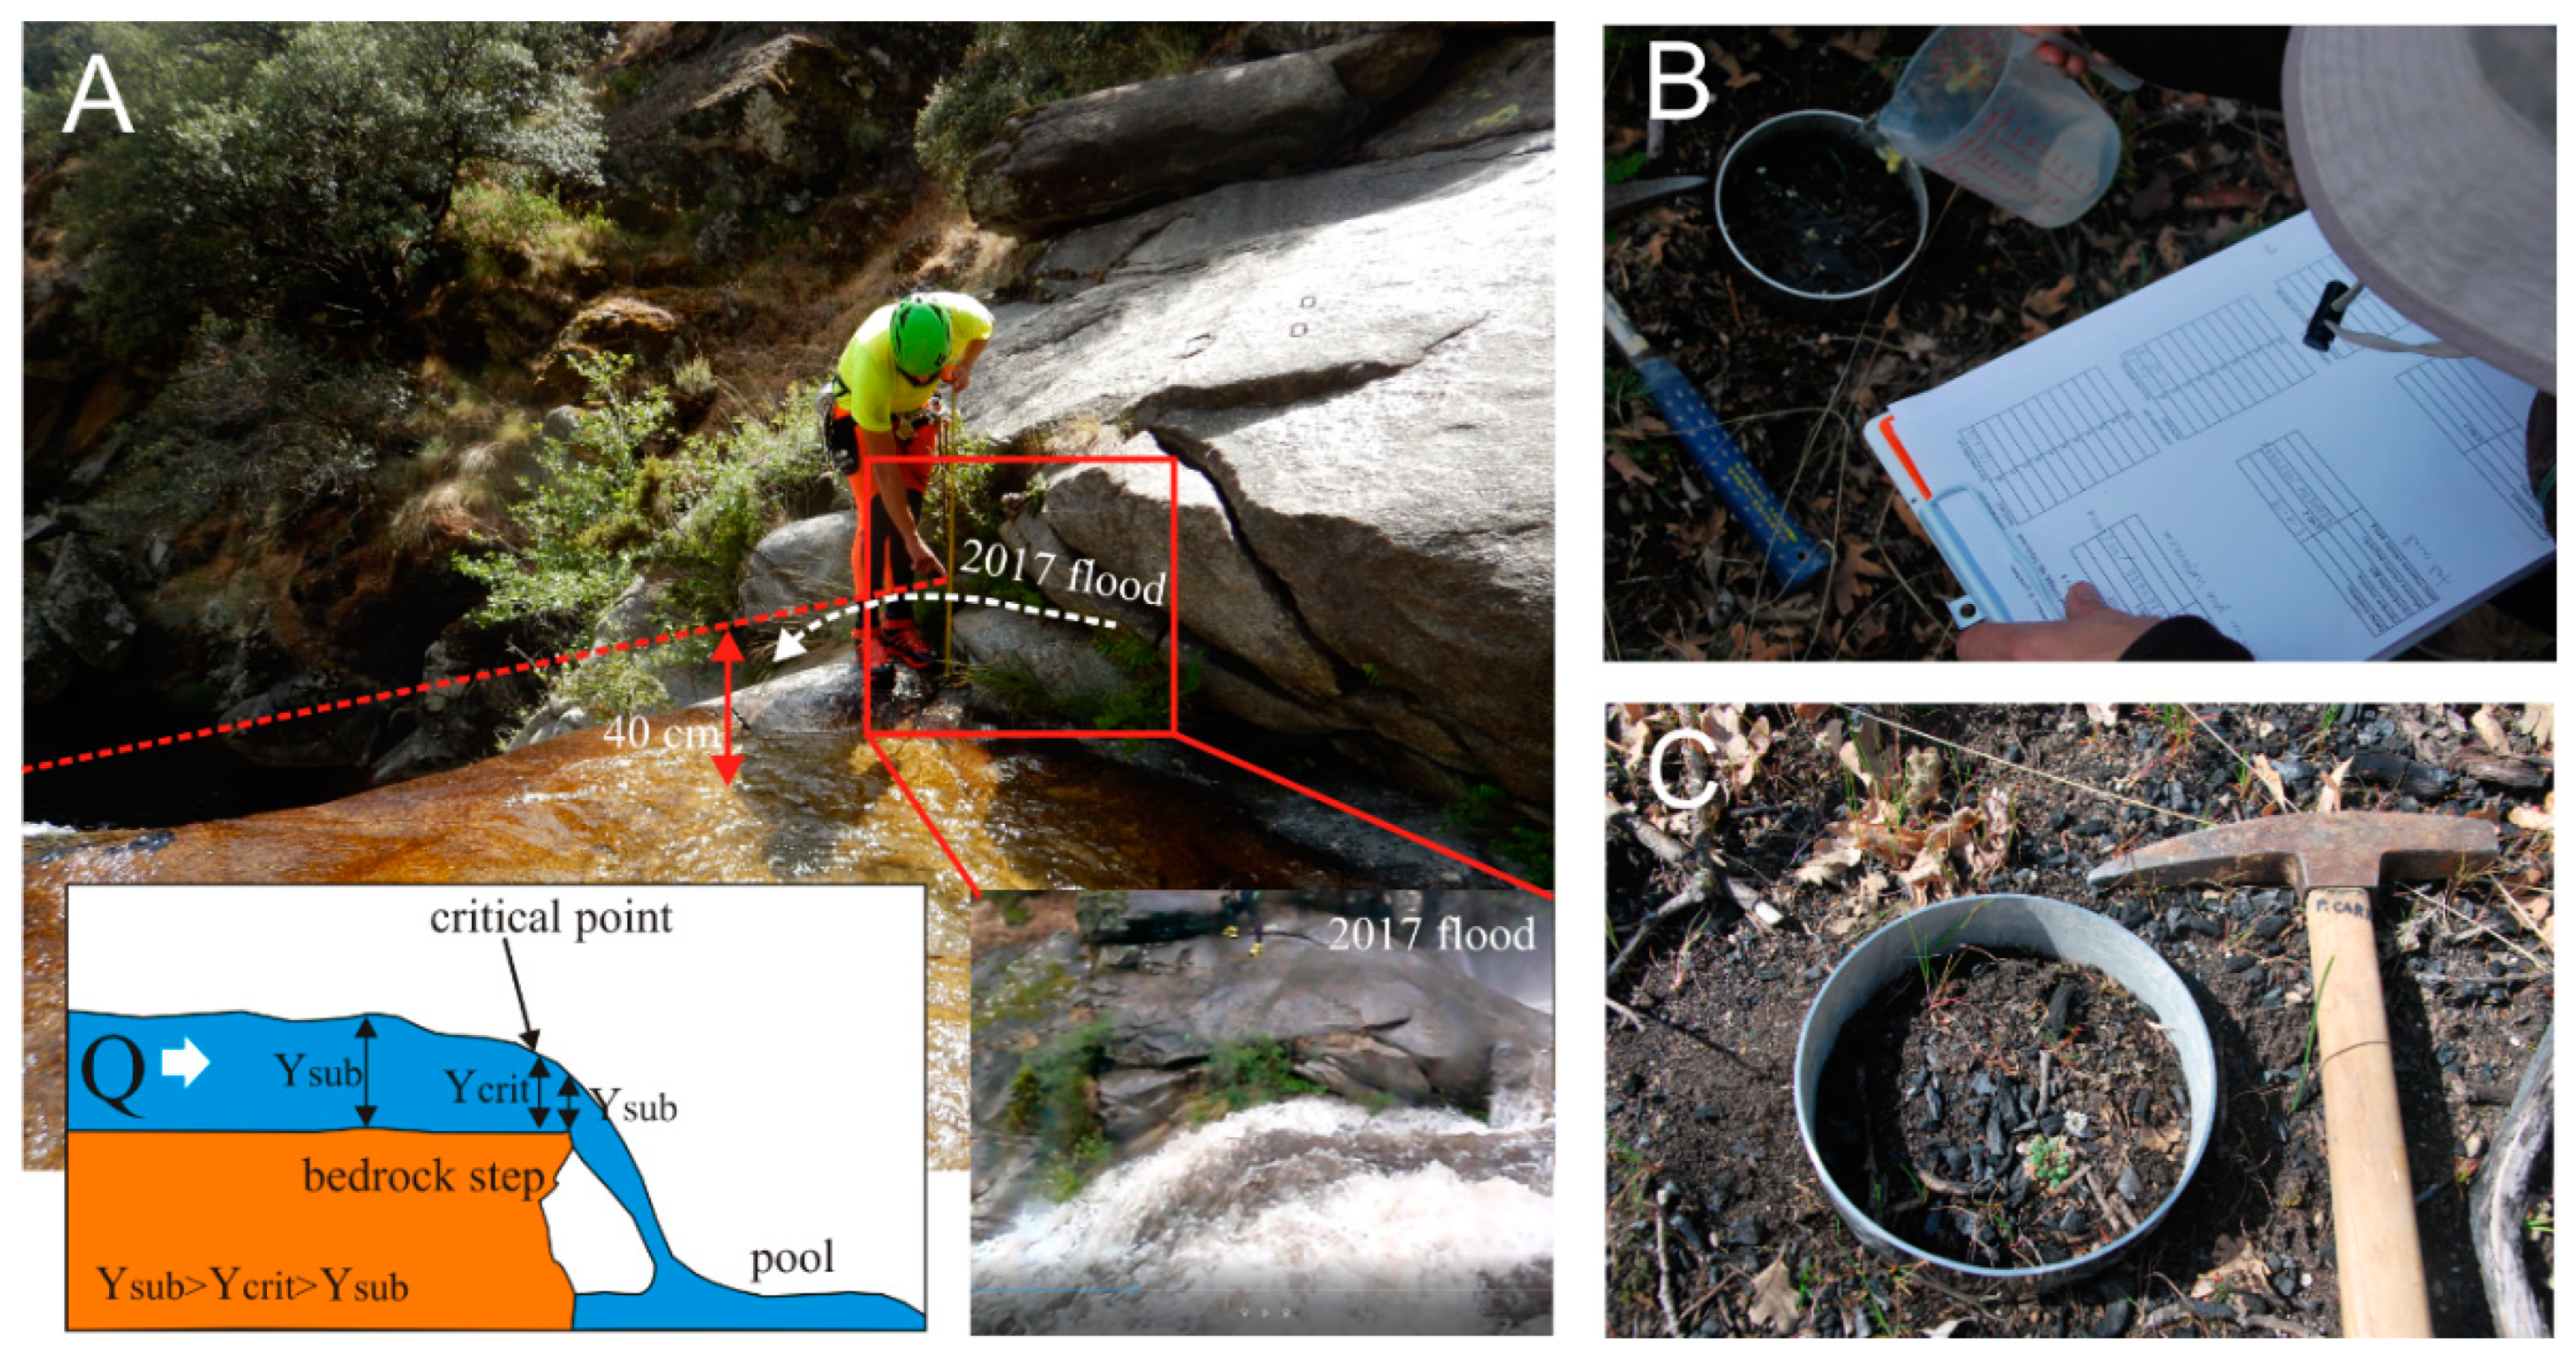
Precipitation data were obtained from the Spanish weather forecasting agency (AEMET). Spatial information (slope map, distances, concentration times, land cover) was calculated using ArcGIS (ESRI: Redlands, CA, USA) software. A first simple hydrological approach (rational method) was used to calculate the discharge related to return period intervals. Furthermore, a full hydrological model simulation was created in order to calculate the maximum discharge of the 2017 event by means of HEC-HMS (CEIWR-HEC: Davis, CA, USA) software. Comparative floodwater height evidence along the Los Hoyos and Papúos streams was collected, using the method of critical point calculation discharge (Figure 4A). The maximum water height was used in hydraulic calculations to obtain the approximate discharge.
The basin model used in the HEC-HMS software was derived from a 5 m Digital Elevation Model (DEM). Disaggregation was based on the spatial distribution of the physiographic factors that determine a homogenous hydrologic response (i.e., lithology, soils, cover type, hydrologic conditions, and slope), which divide the Hoyos and Papúos basins into 3 and 11 sub-basins, respectively. The use of simulation methods for the various processes involved was based on the information available for the basin (no flow data are available for the Hoyos and Papúos basins). The use of the SCS-CN loss method, which is well developed and widely accepted in the USA and other countries [10,11,12], was based on the availability of data sources for each necessary parameter (surface slope, soil hydrological conditions, and land use); and also on the possibility for conducting fieldwork to test and adjust the values that were previously obtained by photointerpretation.
The absence of rainfall and flow data associated with the same event reduces the availability of transformation methods in the HEC-HMS environment to only two options, so the runoff hydrograph was obtained using the Clark unit hydrograph [13] with estimated concentration time (Tc) and storage coefficients. The time of concentration was derived using the Témez formula, which depends on the length of the main channel for each sub-basin and its slope [14]. The storage coefficient was calculated, assuming that it represents 0.6 Tc. The Muskingum–Cunge method was implemented for flood wave routing [15], due to the absence of observed flow data for the rainfall event. The Muskingum–Cunge parameters were calculated based on the flow and channel characteristics. The eight-point method was selected to define the stream cross-section, and the surface roughness (Manning’s n value) was defined for each channel and banks. Rainfall intensity data for flash flood events were derived from radar images provided by AEMET, so the closest precipitation gauges did not record precipitation prior to the flash flood. The absence of a precipitation record was due to the existence of a rainfall–elevation gradient in the basin, so the rainfall at lower elevations (where gage stations are located) at the time of the event, but not in upper parts of the basin, was negligible.
Wildfire information (fire extent, characteristics) was obtained from the Forest Service of Environmental Agency of Junta de Extremadura (Spain).
Soil sampling was performed following a randomized systematic design in two different areas: burned and undamaged areas. Nine infiltration tests were done per area using the single ring method (Figure 4B, ref. [16]). The texture and moisture content of the soil affect the rate of infiltration; therefore, nine composite topsoil samples (0 to 10 cm depth) were collected using a spade after removing the surface debris from each area in order to study the soil texture. The particle size was determined by the hydrometer method [17], considering sand (0.5–2 mm), silt (0.002–0.5 mm), and clay (<0.002 mm). Additionally, nine 100-cm3 cylinders per area were used to remove undisturbed soil core samples. Samples were dried (150 °C until constant weight) in an oven and weighed [18] to obtain the bulk density and soil moisture at the moment of sampling.
4. Outdoor Activities in the Jerte Valley: Canyoning and the 2017 Flash Flood
4.1. Canyoning in the Jerte Valley
The Jerte valley has several easy to moderate canyons in granitic open terrains. The nature of the bedrock controls the canyon “shaping”, and therefore, there is an absence of narrow areas or large pool sections such as can be found in most limestone canyons. Most of the streams show a continuous succession of step-pool sequences, where waterfalls occur. Thus, the valley is suitable for outdoor activities such as walking and hiking along straight reaches; there are also waterfalls where other techniques are required, such as abseiling (rappelling), jumping, or sliding.
The two canyons studied (Table 2) are considered easy (Hoyos) to moderate (Papúos) according to the local guidebook [19], using the French scale of difficulty, where V refers to the vertical rating (from 1 to 7), A means the aquatic character (from 1 to 7) and a Roman numeral indicates the canyon degree of commitment (from I to VI). The estimated number of visitors/year that hire the services of a company is approximately 4000 in Hoyos and 2000 in Papúos. This number reinforces the character of Hoyos canyon as being suitable for beginners. In addition to this number of clients, there are many particular athletes who visit them annually by themselves. The best seasons to practice canyoning in the Jerte valley are spring and the beginning of summer and autumn.
4.2. The 2017 Flash Flood in Jerte Valley
The 2017 event was a flash flood that led to four deaths in the same family under the guidance of an adventure company. The deceased were doing canyoning for the first time. The canyon, as already mentioned, was considered suitable for beginners. Only the guide and one of the clients survived the flood. The accident happened at the H-4 site (see Figure 5C,D), where there is a waterfall 15 m in height. Only 30 min later, another flash flood arrived at Papúos canyon at site P-3 (a 30-m waterfall; see Figure 5E,F), with another group of canyoneers under the guidance of a company. In this case, all the canyoneers were unharmed. The timing of the 2017 event is shown in Table 3.
A series of pictures of the flash flood were taken by one of the guides in Papúos (Figure 5). Note the dark gray waters due to the high concentration of ash in the floodwater. The water’s arrival was sudden; a comparison of pictures (Figure 5C,D) shows that it took just a few minutes for the canyon environment to change dramatically (water depth, viscosity, turbulence, presence of vorticity, etc.). The storm traveled from W to E, and the peak flow reached Los Hoyos canyon (12 a.m.) before Papúos (12:34 a.m., Figure 5F). No one reported signs of anticipated flood arrival, and luckily for the Papúos group, the flood arrived late enough that the one member still to rappel had sufficient time to escape the course of the water.
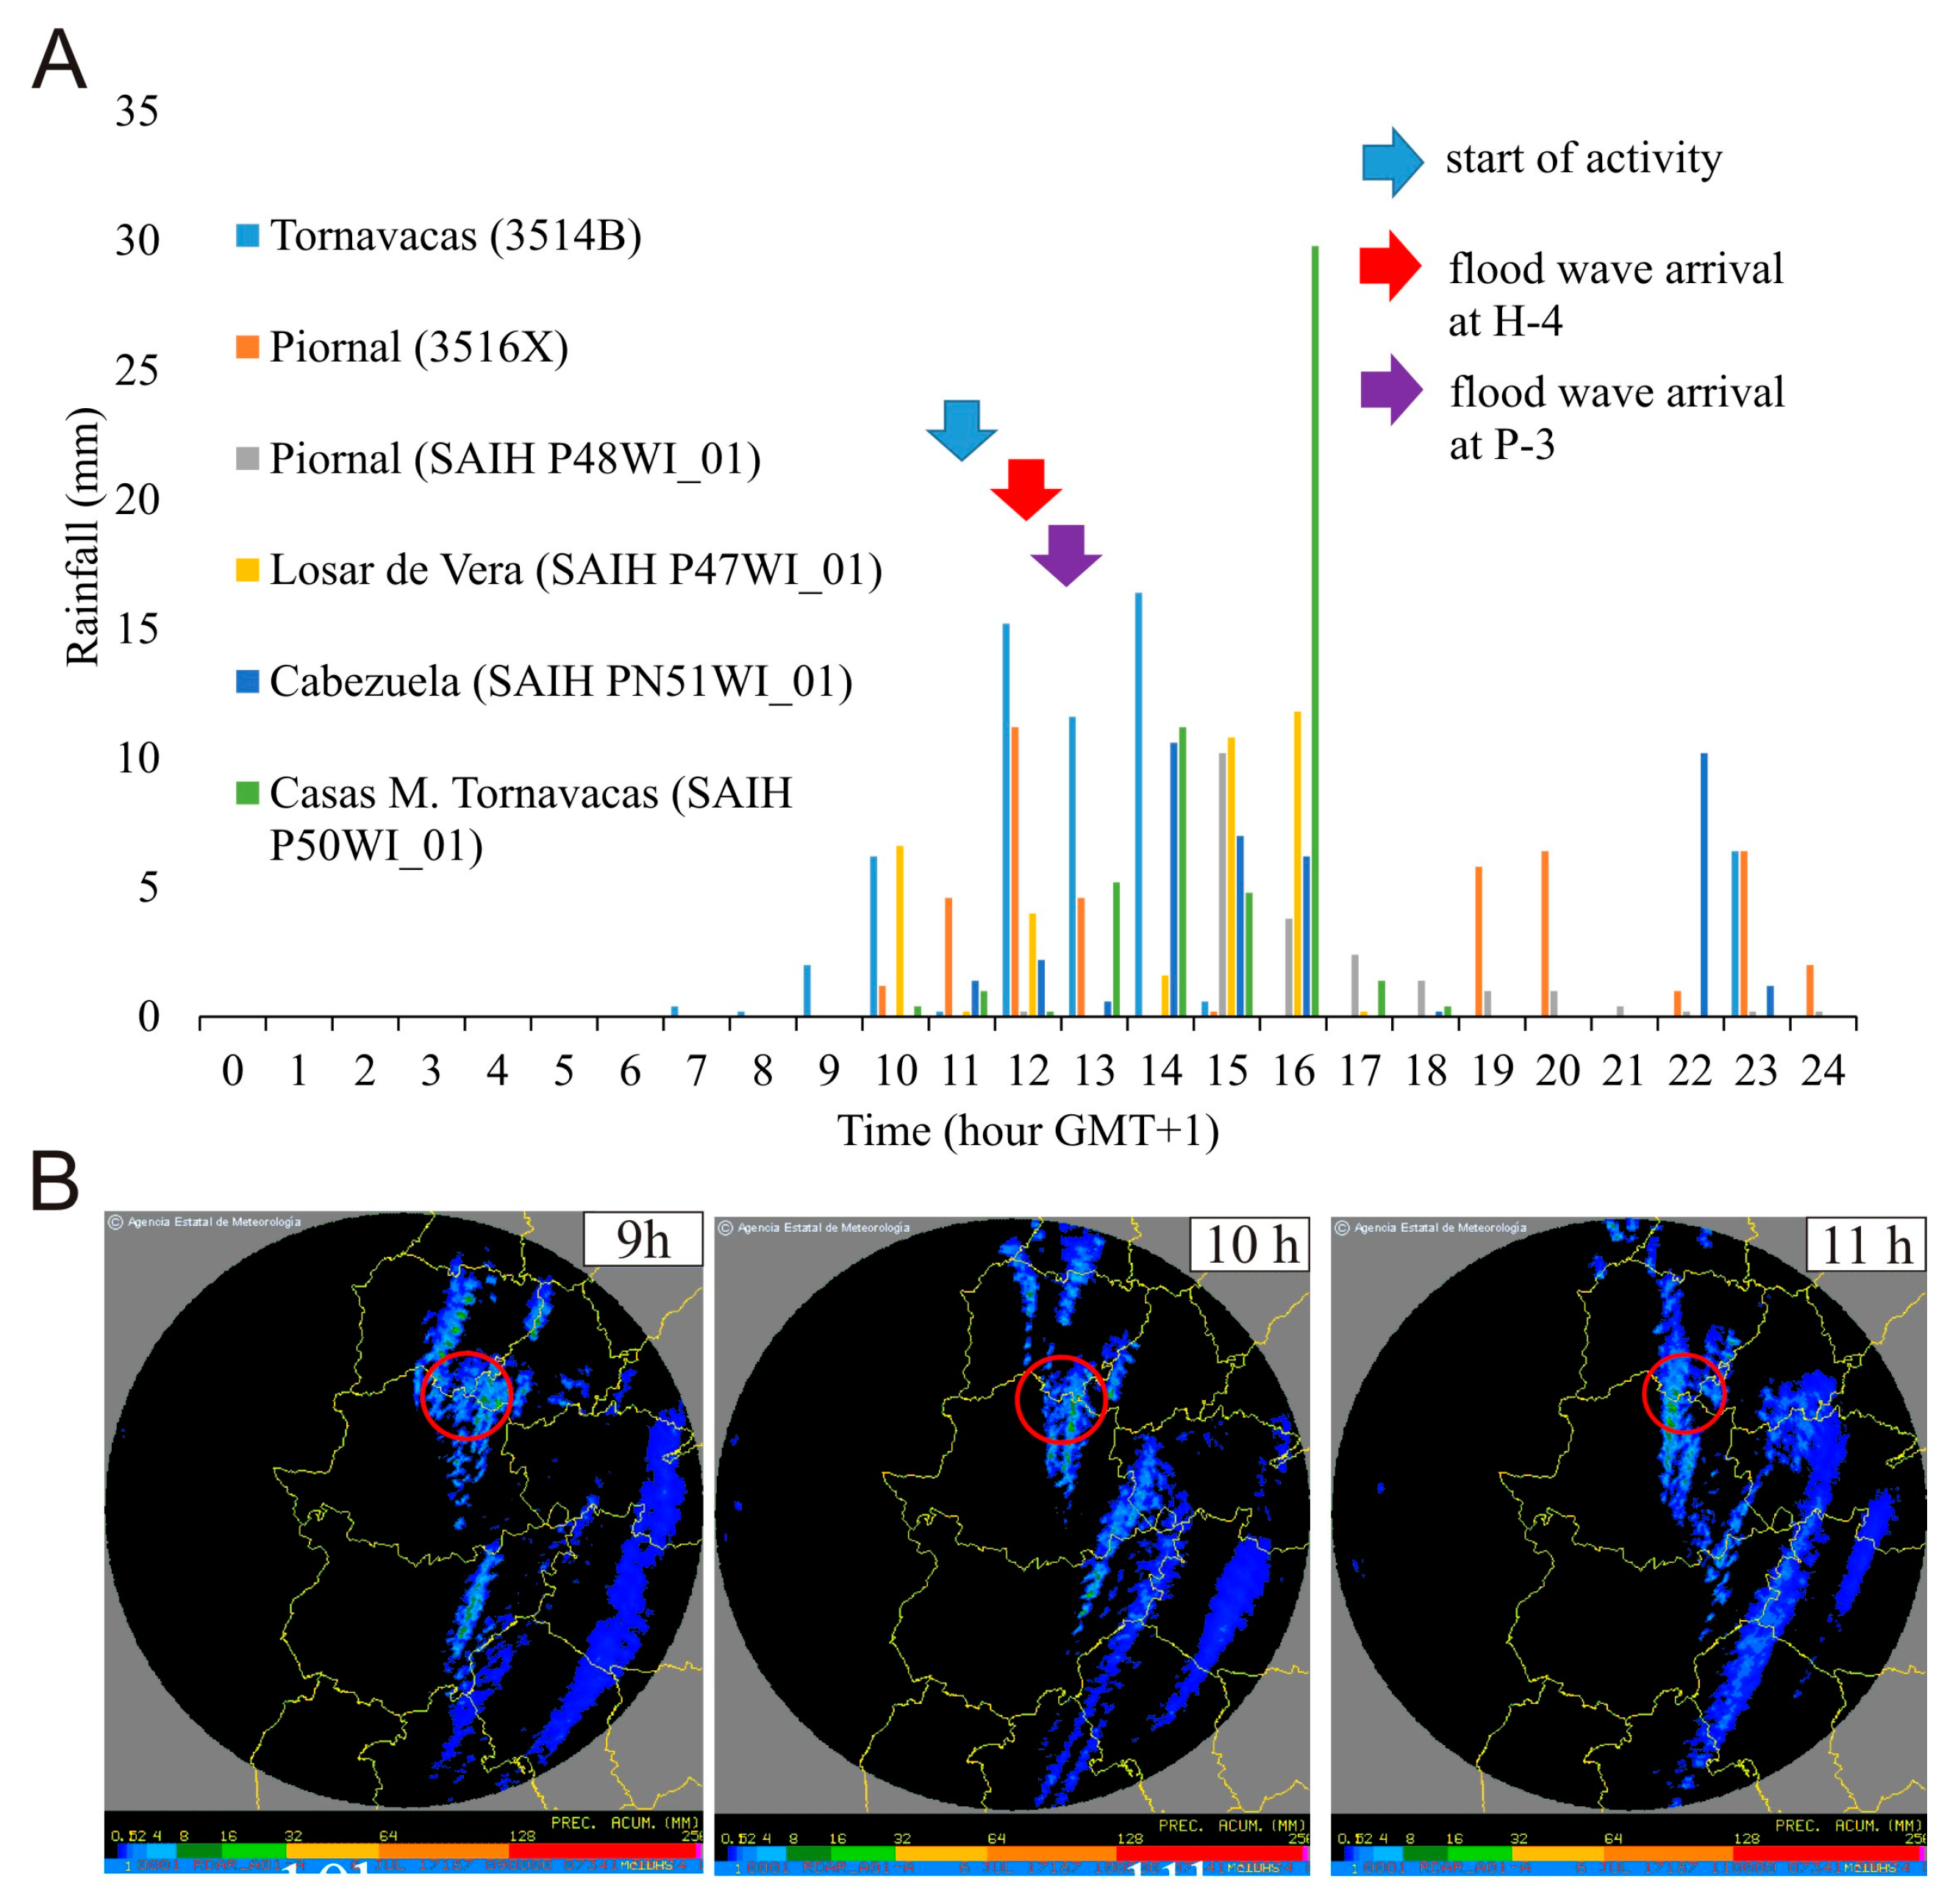
The forecast made by the Spanish Weather Agency (AEMET) predicted rains of 15 mm h−1, first, and 40 mm in 24 h, later, for the day of the event (a yellow warning), but the rainfall considerably exceeded this amount, reaching 81 mm in 24 h in Jerte, and surpassing 40 mm within the 24-h threshold at all surrounding rainfall stations (see Figure 6A). Despite the high precipitation values, most of the rainfall occurred hours after the flash flood’s arrival; thus, surprisingly, only a small amount of rain was responsible for the disaster. A question arises about the location of the rainfall station. Is it possible that the amount recorded was a fraction of the actual value? Most of the rainfall stations are located in foothills, and storms usually leave more rain over high mountains.
To address this important question, the available radar data were used. The radar data (Figure 6B) confirmed the presence of moderate storm activity (maximum reflectivity of 49 dB) over the headwaters of the basin at 11 a.m. The data indicate rainfall amounts of ~30 mm for the previous three hours (9–11 a.m. GMT + 1).
The total amount of rainfall during this event slightly exceeded the two-year return period, estimated at 69 mm in 24 h in Hoyos, and 66 mm in 24 h in Papúos, but only the first three hours of the event produced the flood that reached both canyons and killed the canyoneers. Thus, this rainfall event cannot be considered exceptional, even in the higher parts of the basin, as the radar data confirm. Therefore, our first hypothesis about rainfall underestimation is not supported by the data, and thus, other hydrological reasons must be found.
5. Hydrology of the Hoyos and Papúos Rivers
Low to moderate rain drives a similar return period in discharge unless changes in basin characteristics disturb ordinary behavior. The peak flow values for different return periods were estimated for Q2, Q25, Q100, and Q500 years, which are the typical intervals used in water resources planning and civil protection planning in Spain. The results of the rational method show theoretical discharges of Q2 of 10 and 14 m3 s−1 for Hoyos and Papúos, respectively. The peak flows derived from the rational method come from the application CauMAX [20], where a runoff coefficient for unburned conditions were used; the runoff coefficient value for Hoyos and Papuos was 0.28. Furthermore, the initial abstraction values were 27.24 and 24.93 mm for Hoyos and Papuos, respectively. No infiltration is considered via the CauMAX application. This theoretical value should correspond to the real value if there is a correspondence between rainfall and flow.
Two hydrological analyses were conducted in order to obtain the real discharge of the 2017 flash flood and test it against the theoretical discharge of Q2. The first was performed using the HEC-HMS program (where the pre- and post-fire situations were assessed for CN value change), and the second involved an estimation of discharge by means of HWM—mainly flotsam associated with hydraulic drops. The results of both analyses and a comparison with the theoretical data are given in Table 4.
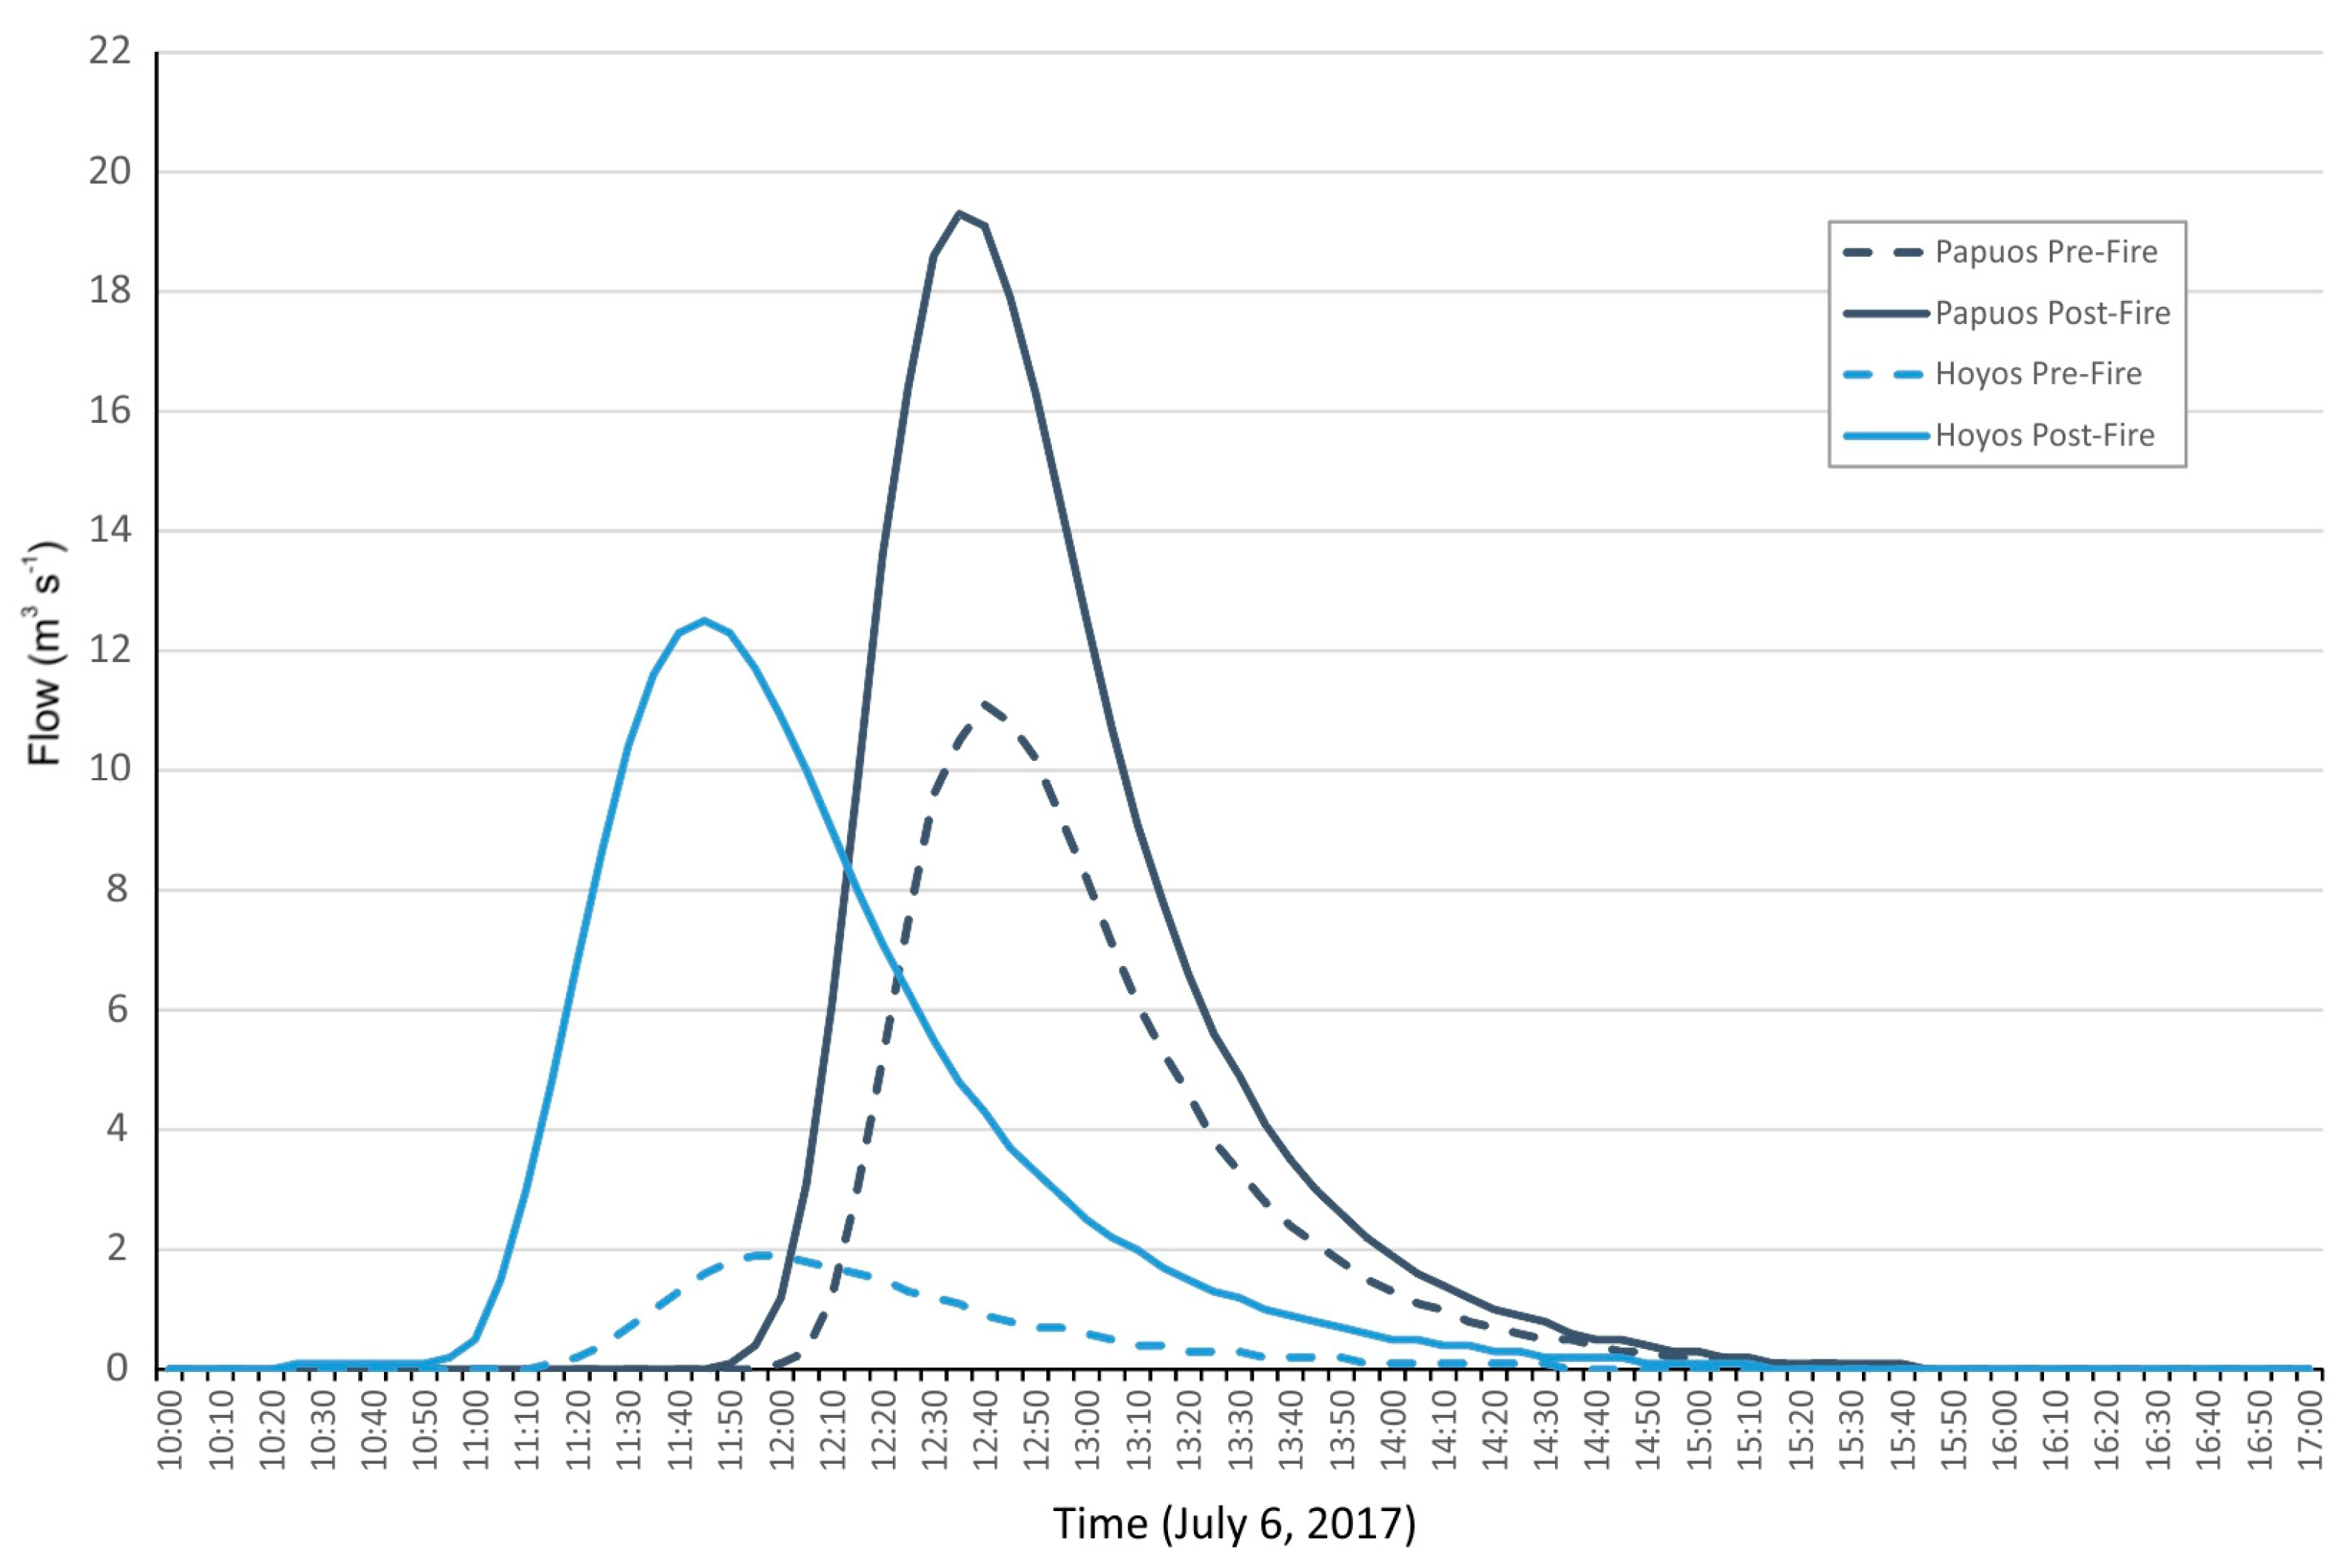
The HEC-HMS model for the Hoyos basin divides it into three sub-basins, which were not affected to the same extent by burning. Estimated pre- and post-fired CN mean values for the basin increased from 65.36 to 82.56 (Table 4), respectively, although the changes due to fire were more intensive in the two upper sub-basins (with CN mean value changes from 62 to 84). The CN values for burned areas follow the proposed values of Yochum and Norman [21]. These changes in CN values give rise to changes in outflow rates, so the peak flow value in the pre-fire scenarios does not reach a value of 2 m3 s−1, while in the post-fire scenario this value increased to 12.5 m3 s−1 (an increase of 658%; see Figure 7). In the Papúos basin model, up to 11 sub-basins were defined, and the CN mean values for the whole basin changed from 71.18 to 78.08 when the post-fire conditions were considered. As for the Hoyos basin, there were major changes in some of the sub-basins in terms of the mean CN value (with some cases in which the CN value rose from 59 to 79). For the Papúos basin, the increase in the peak flow value was not as pronounced as in the Hoyos basin, with an outflow rate for the pre-fire scenario of 11.1 m3 s−1, while this value rose to 19.3 m3 s−1 for the post-fire scenario (an increase of 174%; see Figure 7). The results obtained with the HEC-HMS model showed that the effects of the fire not only caused an increase in the peak flow value associated with the 2017 rainfall event, but there was also an increase in flow velocity, directly associated with the increase in peak flow. Thus, the maximum flow velocities estimated for the study area in the Hoyos basin increased from 1.9 m s−1 to 3.75 m s−1—they practically doubled. In the case of the Papúos basin, the variations were not so important, and in both cases, the flow velocities reached were significant. In this case, the pre-fire situation showed maximum flow velocity values of 5 m s−1; in the case of the post-fire situation, this value increased to over 6 m s−1.
6. Infiltration Changes after Fires
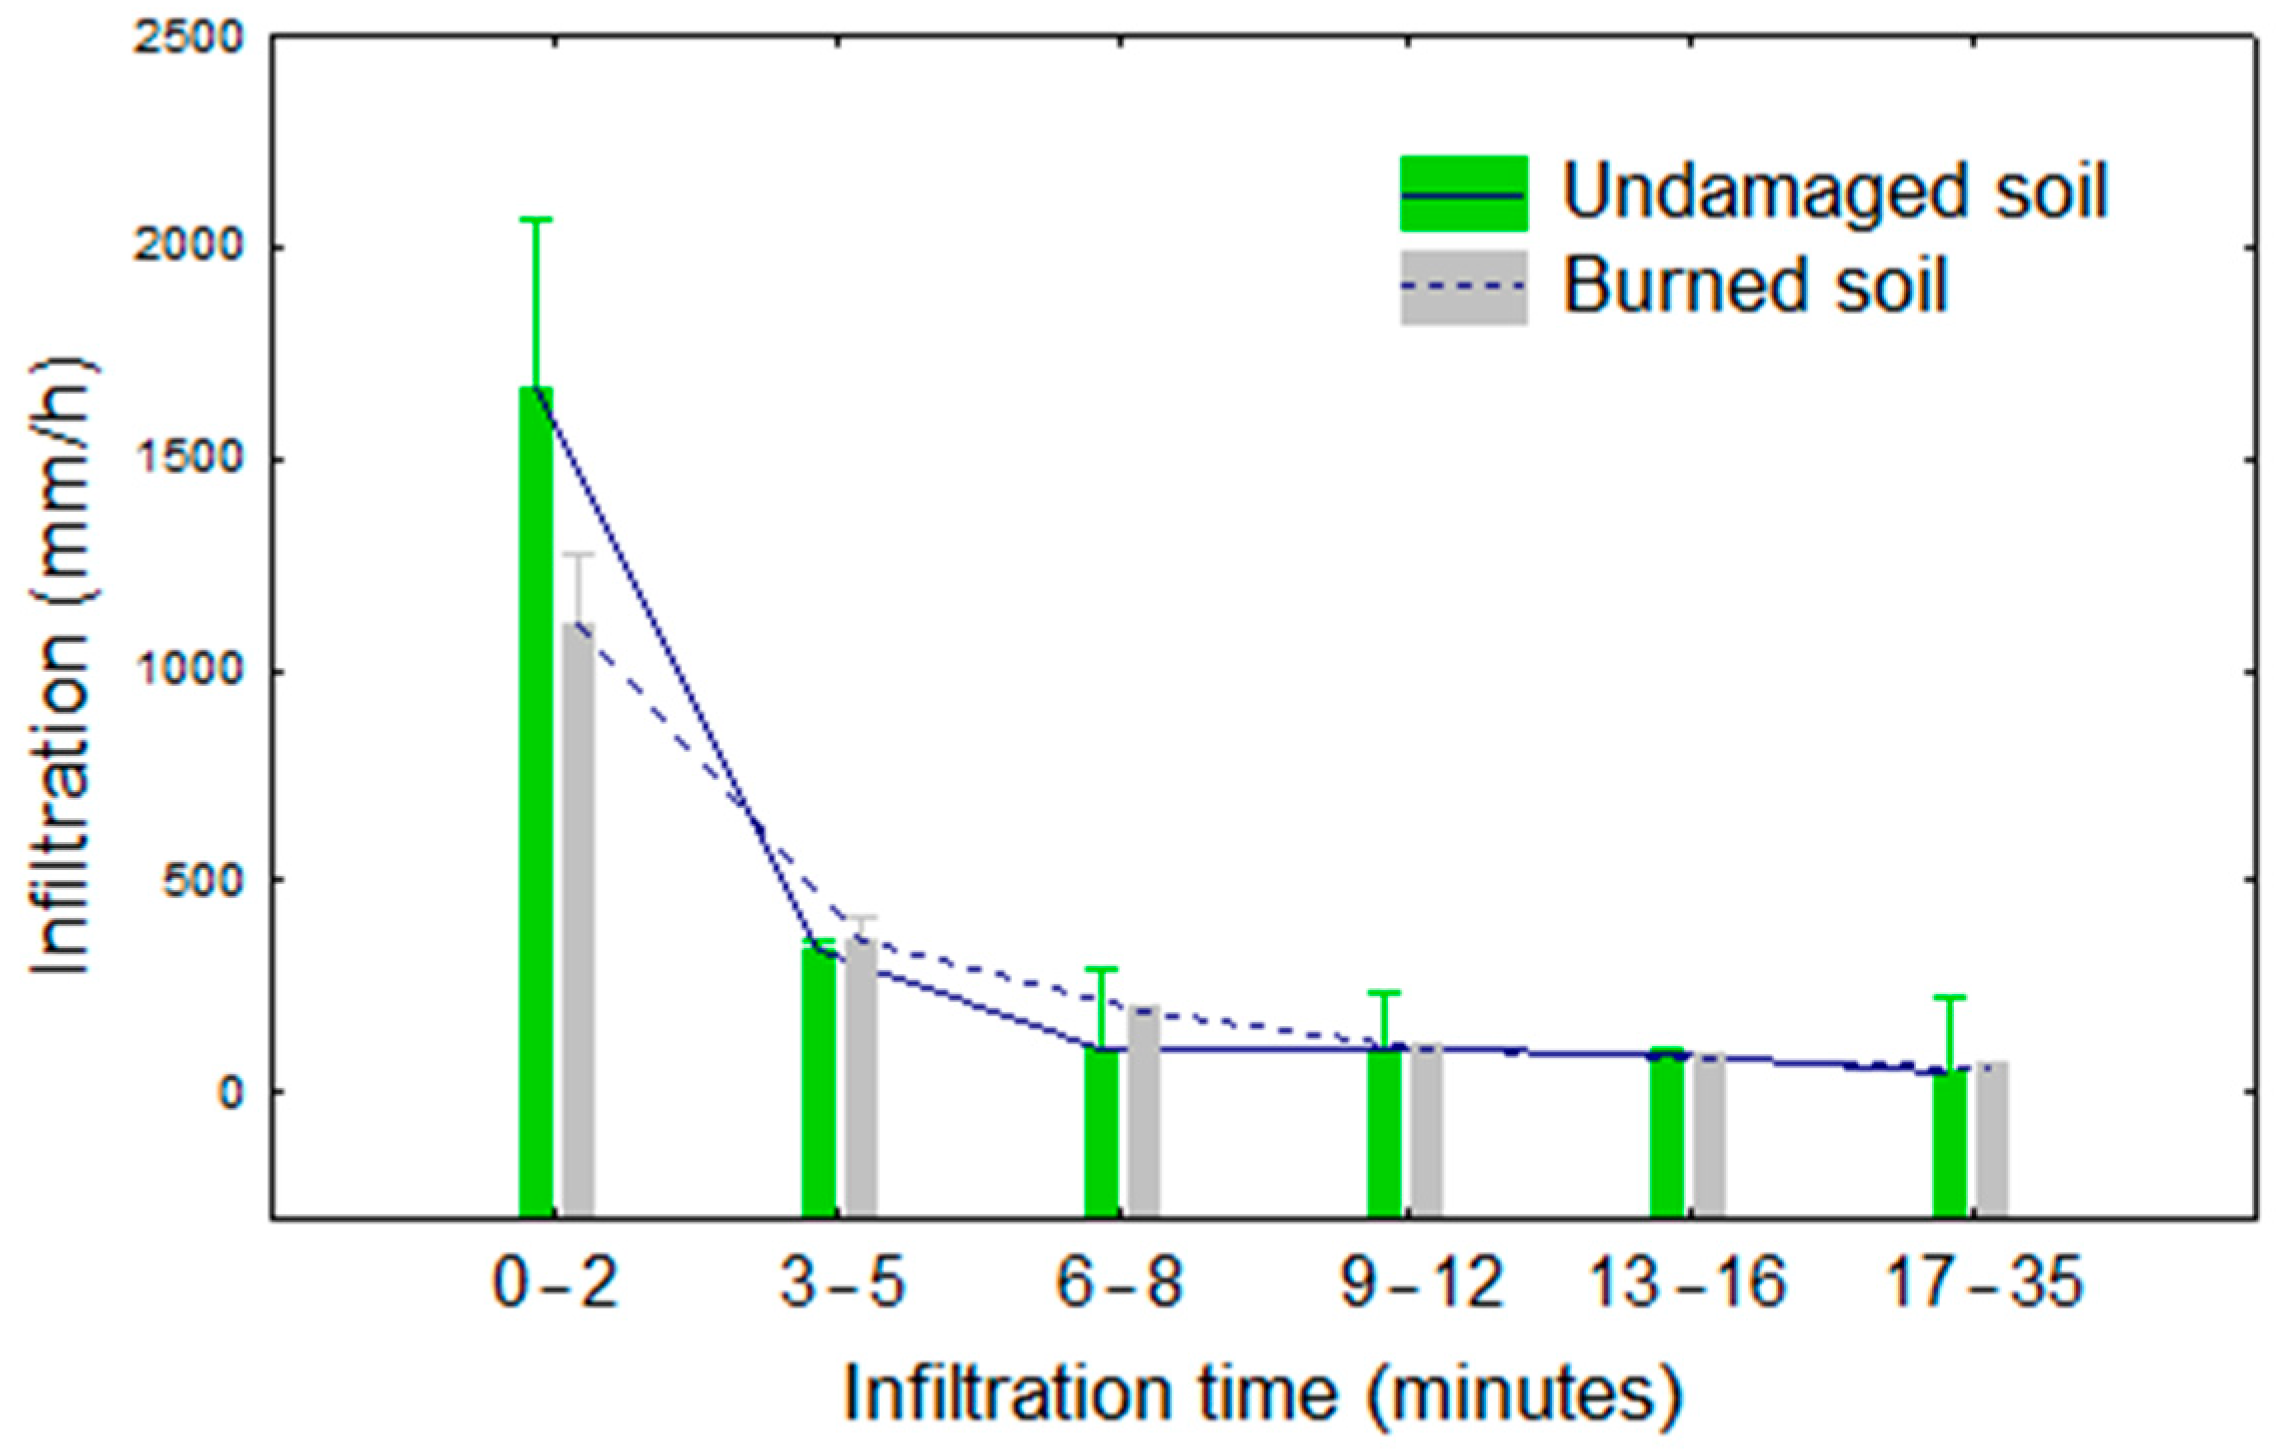
Table 5 shows similar values of soil bulk density, around 0.74 to 0.80 g cm−3 in the area, with no significant differences between burned or undamaged areas. Similarly, soil moisture at the time of sampling was 11–14% in these areas. The soil texture corresponded to the loamy sand group, and no significant differences were found between burned and undamaged areas.
In spite of the similar texture and soil moisture conditions, the results for soil infiltration were significantly lower in the burned areas (Figure 8), although only for the first 2–3 min of the experiment. The infiltration rate became similar between burned and undamaged areas after 3 min. The steady state infiltration was around 58 ± 13 mm h−1 at the end of the experiment.
7. Discussion: Lessons for the Safe Practice of Recreational Canyoning
Considering that the soil type, altitude, aspect, texture, and moisture were similar between burned and undamaged soils, differences in soil infiltration may be attributed to the effects of fire, which were maintained over time [22], as this experiment was conducted two years after the wildfire.
It is well known that, after wildfires, the ability of soils to facilitate water infiltration is affected at the catchment scale due to the dramatic change in vegetation cover [23] and soil sealing, which is exacerbated by soil compaction due to water impact, and pore occlusion due to significant amounts of ash covering the soil surface [24,25]. In addition, the soil wettability is reduced [26] and high temperatures produce water-repellent organic compounds [27]. All these processes lead to the development of water repellency after wildfires, especially if soils were previously hydrophobic due to remains from dominant vegetation with hydrophobic leaves [28,29], as was the case in the pine and oak forests of the study area.
The links between these processes and overland flows during rainstorm events have been frequently described in the literature. Some of the main conclusions have been in evidence in this event, such as the important role of ashes in post-fire sediment amplifying erosion, as pointed out by Gabet and Sternberg [30], mentioned in several reports (i.e., [31]), and clearly observed in pictures (Figure 5D). Previous rainfall may have played a key role in these hydrophobic conditions as, if the ash is wet, infiltration capacity is reduced [29]. The hydrophobicity may be diminished in the few months after the wildfire [32]. However, Dyrness [33] suggests that hydrophobic layers can persist for up to six years. Our soil analysis confirmed this, with clear differences seen in soil infiltration two years after the wildfire, which could be attributed to hydrophobicity. Furthermore, the fatal event occurred only a few months after the fire and in the absence of previous rainfall events, hence the strong hydrologic response. In our field research in 2019, the accumulation of runoff in the first 2–3 min of the storm could be explained by the strong hydrophobic response, and could have been greater during the event in 2017.
Looking at the hydrological results, the rainfall event does not exceed the two-year return period, and the expected discharge might be less than 10 m3 s−1 (Hoyos) and 14 m3 s−1 (Papúos). Considering “normal” soil conditions and land use in the basin, the rainfall–runoff transformation calculated with HEC-HMS revealed peak flow values of 1.9 m3 s−1 (Hoyos) and 11.1 m3 s−1 (Papúos). However, both methods uncovered higher discharges, of about 8–12 m3 s−1 (Hoyos) and 8–19 m3 s−1 (Papúos). The hydrological model takes into account changes in CN, as suggested by Yochum and Norman [21], and shows for the Jerte event a dramatic increase of ~660% in flow discharge in Hoyos and 175% in Papúos; this explains how a small storm could have drastic consequences for canyoning. These results are consistent with data recorded during fieldwork that show similar discharges obtained from floating elements and other HWM.
From a hydrological point of view, the methodologies and results presented here are in agreement with previous assessments. Changes in soil conditions due to fire cause an increase in CN values and, in direct relation to the above, result in an increase in peak flow values during flooding events. CN values for the post-fire situation trend upward along with the fire severity (e.g., [34,35,36]), or by substituting the pre-fire land cover with other types that are more likely to be representative of the post-fire conditions (e.g., [37,38]). Only in a few cases (e.g., [39]) is there sufficient information to fuel an analysis of hydrological changes in the rainfall–runoff process after the occurrence of wildfires. In our case, the definition of CN values after fire could be related to the approach linked to the substitution of pre-fire land cover, although the increase in CN values was compatible with the hypothesis that CN values increase with fire severity. Furthermore, the differences in CN mean values pre- and post-fire are coherent with the ranges of Soulis [39], and with the results of the infiltration field test.
All these changes in CN give rise to variations in the value of the peak flow, increasing its value significantly as well as slightly modifying the time at which the peak of the hydrograph occurs (acceleration of the flood wave). In his assessment in Attica (Greece), Soulis [39] noted an increase in peak flow by more than 11.8-fold, although this must be considered alongside the percentage of basin burned and the severity of the fire. Our results do not indicate changes of that magnitude, but the peak flow at the Hoyos basin increased by a factor of more than six (and two for the Papúos basin). These results are coherent with the extension of burnt soil into the two basins: higher for the Hoyos basin (78% of the basin fired) and lower for the Papúos basin (where only 38% of the basin was affected by fire). As wildfire changes the surface roughness as well (by removing vegetation), the Manning’s n-value used in the HEC-HMS model for channels and banks decreases, and, consequently, there is an acceleration of the flood wave due to the lower roughness of the terrain. The effect of this change was more evident in the Hoyos basin as well, where the peak flow for the post-fire situation was 15 min earlier, while in the Papúos basin, the peak flow pre- and post-fire fell within the same 5 min interval.
Finally, the effect of wildfire on the hydrological behavior of the Hoyos and Papúos basins was also observed in the form of an increase in flow velocity. The increase in flow velocity was especially significant in the Hoyos watershed, where the maximum flow velocity almost doubled when we consider the effects of the fire on the watershed. In this basin, flow velocities reached values that are clearly dangerous for human stability (even at low flow depths). In the case of the Papúos basin, even if the flow velocity value increased, the differences were not so great, and in both situations (pre- and post-fire), the velocity values were dangerous. It is true that the HEC-HMS model considers the Saint Venant equations for one-dimensional flows, which may reduce the reliability of the values obtained, but it is no less true that, in the type of channels studied (channels embedded in bedrock rivers), the water flow can be considered one-dimensional.
The increase in flow velocity was especially important in Hoyos canyon, where the fatal accident occurred, as opposed to Papúos, which is more conducive to accidents, as it is a larger waterfall with a wider, slippery rocky substrate. Another hydrological factor that influenced the fatal accident was the increase in the tractive and buoyant forces of the flow due to the ash concentration [30]; this might have been responsible for the water dragging the canyoneers along with a high velocity of flow.
8. Management Implications
Flash floods are well known for their dangerous nature within canyons. Several fatal events have been reported in recent times (ABC News: https://abcnews.go.com/International/wireStory/spaniards-dead-missing-swiss-canyoning-accident-72345296, accessed on 9 March 2021, BBC News: https://www.bbc.com/news/world-europe-45043778, accessed on 9 March 2021). Despite this, little is known about flash floods in the communities based in the areas studied. A lack of information about accidents in canyoning, together with an absence of central reporting and management by any official agency, obscure the magnitude of the situation [3,40,41]. Hydrological and meteorological information needs appropriate analysis. As Morgan [42] reports, “personnel in the industry are predominantly young with a desire for excitement and adventure, this severely affects safety judgements and assessments of client capability.” The guide during the Jerte event was young and had little experience, including with weather forecast interpretation.
Some interesting changes in management would be useful, such as: (1) understanding how a low-discharge event can be enough to kill canyoneers, (2) understanding that the potential damage capacity increases with the suddenness of an event, (3) having an exit route protocol in place prior to flash flood situations, (4) ensuring that not only is gear checked and weather forecasted, but knowledge of basin changes is considered as part of the safety procedures for typical guiding, and (5) understanding that all changes leading to increased flash flooding in a fluvial basin involve faster flows, increased peak discharge, increased sediment and flow viscosity, and reduced concentration time, and hence, reduced evacuation time.
9. Conclusions
Although the vast majority of accidents associated with the recreational use of river canyons are due to human factors (such as a lack of expertise or experience on the part of the guides), environmental factors (such as extreme weather events) cannot be underestimated in this type of situation. Thus, the present work shows a clear example of the above, in which the prior occurrence of a wildfire caused a series of modifications in the hydrological response of a river basin, which finally triggered the occurrence of an accident (due to a flash flood) with fatal consequences (four people died while practicing canyoning).
The present study analyzes the disturbances in hydrological behavior that occurred in the watersheds of the Hoyos and Papúos streams after a wildfire, and assesses how these alterations in hydrological characteristics (loss of infiltration capacity of the soils, increase in the production of solids, reduction in the surface roughness of the terrain due to the loss of vegetation, etc.) gave rise to a significant increase in the production of surface runoff associated with a moderate rainfall event.
The hydrological simulation of the rainfall event that occurred on 6 July 2017 verified that both the peak flow values of the generated hydrograph and the flow velocities increased due to the terrain alteration caused by the fire (whose first and most important alteration was manifested in a clear increase in the hydrophobicity of the soil, sharply decreasing its infiltration capacity; this natural process is usually incorporated into hydrological models as a clear increase in the CN value associated with the burned part of the basins). Thus, the peak flow values increased more than six-fold (650%) in the Hoyos basin, and two-fold (175%) in the Papúos basin.
Under these conditions, the accident that occurred on 6 July 2017 should be included among cases in which the accident is conditioned by environmental factors, and exceeds the experience and expertise of the canyoning guides. The results obtained in the present work highlight the need to analyze in detail the conditions of canyoning areas (with the aim of increasing safety) where fires have occurred in some part of the river basin. As shown in Figure 1, tens of canyons have been affected over the last two decades, and the potential for new wildfires to affect canyoneers is increasing as the popularity of this activity grows.
Author Contributions
Conceptualization, J.A.O.-B.; methodology, J.A.O.-B. and J.G.; software, J.G. and Á.V.; field analysis, J.A.O.-B., Á.V. and M.J.M.; formal analysis, J.A.O.-B. and J.G.; writing—original draft preparation, J.A.O.-B., J.G., Á.V. and M.J.M.; writing—review and editing, J.A.O.-B., J.G., Á.V. and M.J.M. All authors have read and agreed to the published version of the manuscript.
Funding
This work was supported by Top Heritage (P2018/NMT4372) program from the Regional Government of Madrid (Spain).
Institutional Review Board Statement
Not applicable.
Informed Consent Statement
Not applicable.
Data Availability Statement
Data available on request due to the size of the hydrologic model output.
Acknowledgments
The authors would like to thank Javier Gil for his pictures and field assistance, Jose Felix Sánchez for technical support and Hoyos field assistance, and Pedro Muñoz Barco (Dirección General de Medio Ambiente, Junta de Extremadura) and the environmental agents of Junta de Extremadura for field assistance. The AVR fieldwork was partially funded by UAM as a fieldwork grant for his Final Grade Work. We also acknowledge the useful comments of three anonymous reviewers.
Conflicts of Interest
The authors declare no conflict of interest.
References
- Hardiman, N.; Burgin, S. Canyoning adventure recreation in the Blue Mountains World Heritage Area (Australia): The canyoners and canyoning trends over the last decade. Tourism Manag. 2011, 32, 1324–1331. [Google Scholar] [CrossRef]
- Brandão, A.; Marques, A.; Pereira, J.; Coelho, E.; Quaresma, L. Development of a tool to analyze risk perception in Canyoning using a Delphi technique. J. Phys. Educ. Sport 2018, 18, 1028–1034. [Google Scholar] [CrossRef]
- Cater, C.I. Playing with risk? Participant perceptions of risk and management implications in adventure tourism. Tourism Manag. 2006, 27, 317–325. [Google Scholar] [CrossRef]
- The Guardian. Available online: https://www.theguardian.com/world/1999/jul/30/libbybrooks (accessed on 12 January 2022).
- Hilker, N.; Badoux, A.; Hegg, C. The Swiss flood and landslide damage database 1972–2007. Nat. Hazards Earth Syst. 2009, 9, 913–925. [Google Scholar] [CrossRef] [Green Version]
- Badoux, A.; Andres, N.; Techel, F.; Hegg, C. Natural hazard fatalities in Switzerland from 1946 to 2015. Nat. Hazards Earth Syst. 2016, 16, 2747–2768. [Google Scholar] [CrossRef] [Green Version]
- Ernstbrunner, L.; Imam, M.A.; Fröhlich, S. Canyoning. In Injury and Health Risk Management in Sports; Krutsch, W., Mayr, H., Musahl, V., Della Villa, F., Tscholl, P., Jones, H., Eds.; Springer: Berlin/Heidelberg, Germany, 2020. [Google Scholar] [CrossRef]
- Ströhle, M.; Beeretz, I.; Rugg, C.; Woyke, S.; Rauch, S.; Paal, P. Canyoning accidents in Austria from 2005 to 2018. Int. J. Environ. Res. Public Health 2020, 17, 102. [Google Scholar] [CrossRef] [Green Version]
- Soil Survey Staff. Keys to Soil Taxonomy, 12th ed.; USDA-Natural Resources Conservation Service: Washington, DC, USA, 2014. [Google Scholar]
- U.S. Department of Agriculture (USDA); Natural Resources Conservation Service. National Engineering Handbook Hydrology Chapters; Chapters 4–10. Available online: https://www.nrcs.usda.gov/wps/portal/nrcs/detailfull/national/water/manage/hydrology/?cid=stelprdb1043063 (accessed on 26 January 2021).
- Boughton, W.C. A review of the USDA SCS Curve Number method. Aust. J. Soil Res. 1989, 27, 511–523. [Google Scholar] [CrossRef]
- Ponce, V.M.; Hawkins, R.H. Runoff Curve Number: Has it reached maturity? J. Hydrol. Eng. 1996, 1, 11–19. [Google Scholar] [CrossRef]
- Adib, A.; Salarijazi, M.; Shooshtari, M.M.; Akhondali, A.M. Comparison between characteristics of geomorphoclimatic instantaneous unit hydrograph be produced by GcIUH based Clark model and Clark IUH model. J. Mar. Sci. Technol. 2011, 19, 201–209. [Google Scholar] [CrossRef]
- Temez, J.R. Generalización y mejora del método racional. Versión de la Dirección General de Carreteras de España. Ing. Civ. 1991, 82, 51–56. [Google Scholar]
- Ponce, V.M.; Yevjevich, V. Muskingum-Cunge method with variable parameters. J. Hydraul. Div. 1978, 104, 1663–1667. [Google Scholar] [CrossRef]
- USDA-ARS-NRCS. Soil Quality Test Kit Guide. Available online: http://www.nrcs.usda.gov/Internet/FSE_DOCUMENTS/stelprdb1044790.pdf (accessed on 3 January 2022).
- American Society for Testing Materials (Ed.). Standard Test Method for Particle-Size Analysis of Soils. In Annual Book of ASTM Standards 04.08; American Society for Testing Materials: Philadelphia, PA, USA, 1985. [Google Scholar]
- Soil Survey Staff. Soil Survey Laboratory Methods Manual; Natural Resources Conservation Service: Lincoln, NE, USA, 2014. [Google Scholar]
- Torija, L.; Gómez, F.; Gil, J. Sistema Central. Descenso de Barrancos; Desnivel: Madrid, Spain, 2016; 159p. [Google Scholar]
- Jiménez Álvarez, A.; García Montañés, C.; Mediero Orduña, L.; Incio Caballero, L.; Garrote Revilla, J. Bases Metodológicas Del Mapa de Caudales Máximos de Las Cuencas Intercomunitarias; CEDEX Servicio de Publicaciones: Madrid, Spain, 2013. [Google Scholar]
- Yochum, S.E.; Norman, J.B. Wildfire-induced flooding and erosion-potential modeling: Examples from Colorado, 2012 and 2013. In Proceedings of the 3rd Joint Federal Interagency Conference on Sedimentation and Hydrologic Modeling, Reno, NV, USA, 19–23 April 2015. [Google Scholar] [CrossRef]
- Mataix-Solera, J. Alteraciones Físicas, Químicas y Biológicas en Suelos Afectados por Incendios Forestales. Contribución a su Conservación y Regeneración. Ph.D. Thesis, Universidad de Alicante, Alicante, Spain, 1999. [Google Scholar]
- Ferreira, A.J.D.; Coelho, C.O.A.; Ritsema, C.J.; Boulet, A.K.; Keiser, J.J. Soil and water degradation processes in burned areas: Lessons learned from a nested approach. Catena 2008, 74, 273–285. [Google Scholar] [CrossRef]
- Cerdà, A. La Infiltración de los Suelos del País Valenciano: Factores y Variaciones Espacio-Temporales. Ph.D. Thesis, Universitat de València, Valencia, Spain, 1993. [Google Scholar]
- Cerdà, A.; Imeson, A.C.; Calvo, A. Fire and aspect induced differences on the erodibility and hydrology of soils at La Costera, Valencia, southeast Spain. Catena 1995, 24, 289–304. [Google Scholar] [CrossRef] [Green Version]
- Scott, D.F.; Van Wyk, D.B. The Effects of Wildfire on Soil Wettability and Hydrological Behaviour of an Afforested Catchment. J. Hydrol. 1990, 121, 239–256. [Google Scholar] [CrossRef]
- DeBano, L.F. The Role of Fire and Soil Heating on Water Repellency in Wildland Environments: A Review. J. Hydrol. 2000, 231–232, 195–206. [Google Scholar] [CrossRef]
- Arcenegui, V.; Mataix-Solera, J.; Gerrero, C.; Zornoza, R.; Mataix-Beneyto, J.; García-Orenes, F. Immediate effects of wildfires on water repellecy and aggregate stability in Mediterranean calcareous soils. Catena 2008, 74, 219–226. [Google Scholar] [CrossRef]
- Varela, M.E.; Benito, E.; de Blas, E. Impact of wildfires on surface water repellency in soils of NW Spain. Hydrol. Process. 2005, 19, 3649–3657. [Google Scholar] [CrossRef]
- Gabet, E.J.; Sternberg, P. The effects of vegetative ash on infiltration capacity, sediment transport, and the generation of progressively bulked debris flows. Geomorphology 2008, 101, 666–673. [Google Scholar] [CrossRef]
- Policía Judicial. Judicial Report. 2019.
- Huffman, E.L.; MacDonald, L.H.; Stednick, J.D. Strength and persistence of fire-induced soil hydrophobicity under ponderosa and lodgepole pine, Colorado Front Range. Hydrol. Process. 2001, 15, 2877–2892. [Google Scholar] [CrossRef]
- Dyrness, C.T. Effect of Wildfire on Soil Wettability in the High Cascades of Oregon; Pacific Northwest Forest and Range Experiment Station, Forest Service, US Department of Agriculture: Portland, OR, USA, 1976; 26p.
- Kinoshita, A.M.; Hogue, T.S.; Napper, C. A Guide for Pre- and Postfire Modeling and Application in the Western United States; US Department of Agriculture: Washington, DC, USA, 2013; 69p.
- Kinoshita, A.M.; Hogue, T.S.; Napper, C. Evaluating Pre- and Post-Fire Peak Discharge Predictions across Western U.S. Watersheds. J. Am. Water Resour. Assoc. 2014, 50, 1540–1557. [Google Scholar] [CrossRef]
- Papathanasiou, C.; Makropoulos, C.; Mimikou, M. Hydrological modelling for flood forecasting: Calibrating the post-fire initial conditions. J. Hydrol. 2015, 529, 1838–1850. [Google Scholar] [CrossRef]
- Batelis, S.; Nalbantis, I. Potential effects of forest fires on streamflow in the Enipeas river basin, Thessaly, Greece. Environ. Processes 2014, 1, 73–85. [Google Scholar] [CrossRef] [Green Version]
- Leopardi, M.; Scorzini, A.R. Effects of wildfires on peak discharges in watersheds. iForest 2015, 8, 302–307. [Google Scholar] [CrossRef] [Green Version]
- Soulis, K.X. Estimation of SCS Curve Number variation following forest fires. Hydrol. Sci. J. 2018, 63, 1332–1346. [Google Scholar] [CrossRef]
- Page, S. The Cost of Adventure Tourism Accidents for the New Zealand Tourism Industry; Ministry of Commerce: Wellington, New Zealand, 1997; 59p.
- Brown, M.N.R. On the Edge: A History of Adventure Sports and Adventure Tourism in Queenstown. Master’s Thesis, University of Otago, Dunedin, New Zealand, 1997. [Google Scholar]
- Morgan, D.J. The Adventure Tourism Experience on Water: Perceptions of Risk and Competence and the Role of the Operator. Master’s Thesis, Lincoln University, Lincoln, New Zealand, 1998. [Google Scholar]
Figure 1.
Documented wildfires (red areas) in the Iberian Peninsula (from EFFIS, Copernicus EC, https://effis.jrc.ec.europa.eu/; accessed on 26 June 2022) together with main recreational canyons in blue dots (Source: https://infobarrancos.es/; accessed on 26 June 2022). Yellow dots are canyons affected by recent wildfires.

Figure 2.
(A) Location map of the study area into the Spain country, and Caceres Province (B). (C) Map of the study area with location of the stations used in rainfall estimation (red triangles), gauge station at El Torno in Jerte river (blue) and the two canyons marked by red stars at the flash flood arrival point.

Figure 3.
Slope map of the basin and burned surfaces affected by the 2017 wildfire.

Figure 4.
(A) Fieldwork hydrological measurements in Papúos canyon, recording the critical flow depth along a step. The lower picture shows the same point during peak flow downstream at the P-3 point. (B) Infiltration test using the single ring method. (C) Sample of burned soil in the infiltration ring, with ashes still present two years after the wildfire.

Figure 5.
Pictures of the canyons studied. (A) A frequent open section in Hoyos canyon. (B) Site of accident in Hoyos canyon. (C,D) Papúos canyon before and after the flash flood. (E,F) The large waterfall where the flash flood arrived (10-min difference). Red stars point out the same positions.
Figure 5.
Pictures of the canyons studied. (A) A frequent open section in Hoyos canyon. (B) Site of accident in Hoyos canyon. (C,D) Papúos canyon before and after the flash flood. (E,F) The large waterfall where the flash flood arrived (10-min difference). Red stars point out the same positions.

Figure 6.
(A) Rainfall of the 2017 event at Jerte valley stations (Source: SAIH Tajo). (B) Radar rainfall data from 9:00 to 11:00 (GMT + 1) (source: AEMET). Colored arrows indicate the start of activity (blue) and the flood wave’s arrival at Hoyos and Papúos.
Figure 6.
(A) Rainfall of the 2017 event at Jerte valley stations (Source: SAIH Tajo). (B) Radar rainfall data from 9:00 to 11:00 (GMT + 1) (source: AEMET). Colored arrows indicate the start of activity (blue) and the flood wave’s arrival at Hoyos and Papúos.

Figure 7.
Pre- and post-fire outflow hydrographs for the Hoyos and Papúos basins from the HEC-HMS model.
Figure 7.
Pre- and post-fire outflow hydrographs for the Hoyos and Papúos basins from the HEC-HMS model.

Figure 8.
Infiltration in undamaged and burned areas. Plot of means and confidence intervals (95%) of nine trials using a single-ring infiltrometer.
Figure 8.
Infiltration in undamaged and burned areas. Plot of means and confidence intervals (95%) of nine trials using a single-ring infiltrometer.


Table 1.
General data for the two basins studied.
| Basin | Average Slope/Canyon Slope (m m−1) | Total Area (km2) | Area of Flash Flood Coverage (km2) 1 | P2/P500 (mm) 2 | Q2/Q500 (m3 s−1) 3 | Land Cover 4 | % of Total Area Burned |
|---|---|---|---|---|---|---|---|
| Hoyos R. | 0.26/0.18 | 4.2 | 4.1 | 69/214 | 10/57 | R, C, P | 74 |
| Papúos R. | 0.22/0.20 | 15.3 | 7.6 | 66/203 | 14/79 | R, C, P, F | 42 |
Notes: 1 Area with flash flood arrival point. 2 Estimated precipitation for the return periods of 2 and 500 years. 3 Estimated discharge for the return periods of 2 and 500 years. 4 R: Quercus robur and pine trees, C: cherry orchards, P: alpine pastures, F: old, fired lands.
Table 2.
Canyoning in the studied area. Rating of difficulty and main characteristics of recreational descent included estimated visitors in commercial uses.
Table 2.
Canyoning in the studied area. Rating of difficulty and main characteristics of recreational descent included estimated visitors in commercial uses.
| Canyon | Difficulty 1 | Length (m) | # of Rappels | Time of Activity 2 | Season 3 | Estimated Visitors/Year 4 |
|---|---|---|---|---|---|---|
| Hoyos R. | V2, A2, I | 350 | 5 | 15 min/1.5 h/5 min | Sp, S | 4000 |
| Papúos R. | V3, A3, III | 1100 | 9 | 90 min/3.5 h/45 min | Sp, S, Au | 2000 |
Note: 1 Source: Torija et al. [19]. 2 Time of activity, divided by approach, descent, and return. 3 Sp: spring, S: summer, Au: Autumn. 4 Estimated visitors only, based on commercial companies.
Table 3.
Timing of the flash flood development in both canyons.
| Time | Activity Development |
|---|---|
| 11:00 | Start of activity in Los Hoyos canyon (Source: Judicial report, unpublished) |
| 11:30 | Pictures taken by the guide during the activity show scarce discharge at the Los Hoyos canyon (Source: Judicial report) |
| 11:30 | Start of rain for 5–10 min (Source: Judicial report) |
| 11:43 | Rainfall starts at Papúos stream (Source: Expert Report, unpublished) |
| 11:50 | Increase in water in Papúos stream (Source: Canyoning Company Guia2 pers. com.) |
| 12:00 | Flash flood arrival at site H-4 in Los Hoyos canyon (Source: Judicial report) |
| 12:21 | Call to emergency services (112) placed by the guide (Source: Emergency Services of the Province) |
| 12:30 | Outdoor agency receives a call from the guide (Source: Outdoor Company Manager, pers. com) |
| 12:31 | Picture of Papúos site P-3 before flash flood (Source: Canyoning Company Guia2 pers. com), see Figure 5C,D |
| 12:35 | Flash flood arrival at site P-3 at Papúos stream (Source: Canyoning Company Guia2 pers. com), see Figure 5E,F |
Table 4.
General comparison of hydrological and hydraulic analysis using rational, HEC-HMS, and critical point methodology.
Table 4.
General comparison of hydrological and hydraulic analysis using rational, HEC-HMS, and critical point methodology.
| Canyon | CN/Mod. CN | Tc 1 | Slope (m m−1) | Discharge Estimation Method (m3 s−1) | ||
|---|---|---|---|---|---|---|
| Q2 (Rational Method, Theoretical) | Q Event (HEC-HMS, CN Normal/Modified) | Critical Points (Waterfalls) | ||||
| Hoyos R. | 65/82 | 1 h 34′ | 0.25 | 10 | 1.9/12.5 | 8–10 |
| Papúos R. | 71/78 | 1 h 39′ | 0.28 | 14 | 11.1/19.3 | 8–14 |
Note: 1 Concentration time at the flash flood arrival (sites H-4 and P-3).
Table 5.
Average and standard deviation of soil parameters measured in two different areas. K–W: Kruskal–Wallis test; significant differences at p < 0.05.
Table 5.
Average and standard deviation of soil parameters measured in two different areas. K–W: Kruskal–Wallis test; significant differences at p < 0.05.
| Variable | Undamaged Areas (n = 9) | Burned Areas (n = 9) | K–W H Test |
|---|---|---|---|
| bulk density (g cm−3) | 0.80 ± 0.21 | 0.74 ± 0.27 | 0.56; p = 0.45 |
| soil moisture (g g−1) | 0.14 ± 0.06 | 0.11 ± 0.07 | 1.42; p = 0.23 |
| % sand | 81.0 ± 3.3 | ± 3.1 | 2.12; p = 0.15 |
| % clay | 2.85 ± 1.17 | 3.12 ± 0.69 | 0.02; p = 0.89 |
| % silt | 16.2 ± 3.2 | 12.9 ± 2.9 | 2.27; p = 0.10 |
Publisher’s Note: MDPI stays neutral with regard to jurisdictional claims in published maps and institutional affiliations. |
© 2022 by the authors. Licensee MDPI, Basel, Switzerland. This article is an open access article distributed under the terms and conditions of the Creative Commons Attribution (CC BY) license (https://creativecommons.org/licenses/by/4.0/).
Share and Cite
MDPI and ACS Style
Ortega-Becerril, J.A.; Garrote, J.; Vicente, Á.; Marqués, M.J. Wildfire-Induced Changes in Flood Risk in Recreational Canyoning Areas: Lessons from the 2017 Jerte Canyons Disaster. Water 2022, 14, 2345. https://doi.org/10.3390/w14152345
AMA Style
Ortega-Becerril JA, Garrote J, Vicente Á, Marqués MJ. Wildfire-Induced Changes in Flood Risk in Recreational Canyoning Areas: Lessons from the 2017 Jerte Canyons Disaster. Water. 2022; 14(15):2345. https://doi.org/10.3390/w14152345
Chicago/Turabian StyleOrtega-Becerril, José A., Julio Garrote, Álvaro Vicente, and María José Marqués. 2022. "Wildfire-Induced Changes in Flood Risk in Recreational Canyoning Areas: Lessons from the 2017 Jerte Canyons Disaster" Water 14, no. 15: 2345. https://doi.org/10.3390/w14152345
Note that from the first issue of 2016, this journal uses article numbers instead of page numbers. See further details here.